Abstract
Some studies have shown that any part machined by an outsourcer usually has several basic quality characteristics. When the outsourcer’s process capabilities are insufficient, the defective rate of various quality characteristics of the product will increase, thereby raising the rework rate and scrap rate. As a result, maintenance costs will go up, economic value will decrease, and even carbon emissions can increase during the production process. In addition, the process capability index and the radar chart are widely used in engineering management and other fields. Since process indicators often contain unknown parameters, sample data are needed for evaluation. With the rapid development of the Internet of Things and big data analysis, many companies regard rapid response as a basic requirement for timeliness and cost consideration. Therefore, companies often have to evaluate the process quality of ten small samples and decide whether to make some improvements. In order to solve the above problems, this study proposed a fuzzy radar chart evaluation model for the process quality of multi-quality characteristic parts based on the process capability index. Using this model can help all parts manufacturers continue to improve the quality of their machined parts as well as reduce their rework and scrap rates. Meanwhile, carbon emissions can be lessened during the production process, and companies can fulfill their social responsibilities. This fuzzy radar chart evaluation model is based on confidence intervals. As the company’s past experience is incorporated, the evaluation accuracy can be maintained even with a smaller sample size. Furthermore, the fuzzy radar evaluation chart can simultaneously evaluate the process capabilities of all quality characteristics of the part. In addition to making it easier for manufacturers to master all quality characteristics, quality process capability can also help them seize improvement opportunities.
Keywords:
process capability index; upper confidence limit; minimum value; fuzzy membership function; radar chart MSC:
62C05; 62C86
1. Introduction
A machine tool known as the “Mother of Machines” is applied in precision manufacturing, aerospace, national defense, biomedicine, electronics, and other related industries [,]. Many studies have pointed out that a machine tool is composed of many components, and the final product yield is affected by the quality of the processing materials and components [,].
According to the research conducted by Prahalad and Hamel [], companies outsource non-core or auxiliary parts to professional manufacturers to improve the production efficiency and reduce operating costs, thereby enhancing their own value and competitiveness. Additionally, some studies have shown that any part machined by an outsourcer typically has several basic quality characteristics. When the outsourcer’s process capability is insufficient, the defective rate of various quality characteristics of the product will grow, thereby raising the rework rate and scrap rate as well as leading to an increase in maintenance costs, a decrease in economic value, and even a rise in carbon emissions during the production process [,,].
The process capability index is one of the tools commonly used in the industry to evaluate process quality. It is not only a quality problem analysis tool for internal process engineers, but also an external communication tool for the sales department [,,]. In particular, the process capability index proposed by Kane [] is the most widely used process quality evaluation tool in the industry and has an unequal relationship with process yield. In addition, according to some related studies, the radar chart is a visual evaluation tool widely used in engineering, management, education, and other fields [,,]. Since process indices often contain unknown parameters, sample data are needed for evaluation. With the rapid development of the Internet of Things and big data analysis, many companies regard rapid response as a basic requirement for timeliness and cost consideration. Therefore, companies often have to evaluate the process quality of ten small samples and decide whether to make some improvements.
In order to solve the above problems, this study proposes a fuzzy radar chart evaluation model for the process quality of multi-quality characteristic parts based on the process capability index. Using this model can help all parts manufacturers continue to improve the quality of their machined parts and reduce the rework and scrap rates of parts. In the meantime, carbon emissions can be eased during the production process, and companies can fulfill their social responsibilities as well. This fuzzy radar chart evaluation model is built on the basis of confidence intervals. Since the company’s past experience is integrated, the accuracy of evaluation can still be retained, even with a small sample size [,,]. Additionally, the fuzzy radar evaluation chart can simultaneously evaluate the process capabilities of all quality characteristics of the part. In addition to making it easier for manufacturers to master all quality characteristics, quality process capabilities can also help them seize improvement opportunities. This study uses the machine tool industry chain in the central region as the background to discuss the process quality of the parts processed by a machining company to illustrate the application of the fuzzy radar evaluation chart proposed in this paper.
The rest of this study is arranged in the following sections. In Section 2, we use the mathematical programming method (MP) to derive the upper confidence limits of the process capability index. Next, in Section 3, we build a fuzzy hypothesis testing model, using the index estimators and fuzzy critical values to establish fuzzy testing rules for evaluating process capabilities. Section 4 takes an impact wrench as an example to explain the application of the fuzzy radar evaluation chart proposed in this paper. Section 5 presents the conclusions.
2. Upper Confidence Limits of the Process Capability Index
As mentioned above, the process capability index proposed by Kane [] is the most widely used process quality evaluation tool in the industry, as follows:
where is the process target value; is the half length of the specification interval; is the process mean; is the process standard deviation; is the upper specification limit; and is the lower specification limit.
According to Boyles [], index has an unequal relationship with the process yield (Yield%), shown as follows:
As mentioned above, when the index value is large enough, it can be guaranteed that the process yield is high enough. For example, when , it can be guaranteed that the process yield is ; when , it can be guaranteed that the process yield . In fact, as the index value is larger, the process yield also rises gradually. In addition, a product usually has multiple quality characteristics, and its tolerances are inconsistent. Therefore, in order to facilitate the evaluation of process capability, this paper, based on the research of Pearn and Chen [], uses the transformation of variables to let
Then, the original specification tolerance is converted to . Also, we assume , and then , where is the accuracy index and is the precision index, expressed as follows:
and
Then, the process capability index can be rewritten as follows:
Since the accuracy index and the precision index are unknown parameters, they must be estimated using samples. This paper assumes that is a set of random samples of ; then, the estimator of the accuracy index and the precision index can be expressed as follows:
In this paper, we let and . Under the assumption of the normal process, the random variable obeys the standard normal distribution, denoted as ; the random variable obeys the chi-square distribution, where the degree of freedom is , denoted as . The random variables and are mutually independent. Let ; then,
and
where is the upper quantile of and is the lower quantile of . Since the random variables and are mutually independent, this paper lets event A and event B be as follows:
The random variables and are mutually independent, and so are event A and event B. Thus,
According to the above description, the joint confidence region (CR) of is expressed as follows:
It can be seen from the above that is the function of . Next, this paper uses Mathematical Programming (MP) to solve the upper confidence limit of index . Also, is the objective function, and the CR is regarded as a feasible solution region. Then, the MP model is expressed as follows:
Obviously, it can be known that the confidence region is a convex set that is wide at the top and narrow at the bottom and resembles a rectangle. This paper assumes that the two points where the horizontal line intersects the confidence region are and from the left to the right, and we also assume that the two points where the horizontal line intersects the confidence region are and from left to the right, where
It can be learned from the above equation that if and , then . Therefore, the MP model can be rewritten as:
Next, this paper will discuss three scenarios—Case 1: , Case 2: , and Case 3 , which can be solved for as follows:
Case 1:
In this case, if , then . Obviously, it can be inferred from that and . can be expressed as follows:
Case 2:
In this case, it can be inferred that and . If , then . Thus, we can learn , as follows:
where .
Case 3:
In this case, it can be inferred that and . If , then . Thus, we can learn , as follows:
where . Based on the above three cases, the upper confidence limit of and can be obtained. Thus, can be rewritten as:
where
3. Constructing a Fuzzy Hypothesis Testing Model
Wu et al. [] pointed out that a product usually has multiple quality characteristics. In order not to lose generality, this paper assumes that there are q quality characteristics. If the process capability of the product is required to be , , then the process capability index of the individual quality characteristic h, must be greater than , so as to ensure that the process capability index of the product is . When all individual quality characteristics (q) meet the requirement, , and then it can be claimed as a qualified product or component.
According to some related research, fuzzy hypothesis testing can judge whether the process yield is an acceptable process evaluation method, and process index can effectively reflect the characteristics of the yield [,,]. Consequently, in order to quickly judge the quality of the process, the industry uses as an evaluation method, and its judgment groups are divided as follows:
- (1)
- If , then the process capability level is insufficient.
- (2)
- If , then the process capability level is sufficient.
- (3)
- If , then the process capability level is good.
According to Hsu et al. [], to estimate the process capability index of the hth random sample, event represents that its quality characteristic index value is greater than , , and we let . Based on the concept of Wu et al. [], this study used Boole’s inequality and De Morgan’s theorem to rewrite the bilateral specification index, as follows:
Besides, according to the relationship between the index value and the yield rate, , the above-stated bilateral specification index can be re-expressed as
Thus,
Assume that a product or a component contains a total of q corresponding bilateral specification evaluation indicators. If the process capability index of the product is required to be at least , ( and ), then the corresponding q bilateral specification evaluation indicators must be at least . The corresponding values for various quality levels are shown in Table 1.

Table 1.
Corresponding values for various quality levels.
This study developed a fuzzy membership function of process capability index for a product according to the fuzzy testing model proposed by Buckley []. If the process capability index of the product is required to be , then the process capability index of the quality characteristic h is , whose null hypothesis and alternative hypothesis are expressed as follows:
This study also took the upper confidence limit of process capability index as a statistic. Obviously, when , then , and the index estimate is used to make statistics, where the required minimum value (MV) is expressed as follows:
Then,
According to the above, the statistical testing rules are illustrated as follows:
- (1)
- If , then do not reject .
- (2)
- If , then reject .
In fact, MV is a function of . When is larger, the value of is also larger. When , then , as shown in Figure 1. When , then , so do not reject However, when , then , so reject .

Figure 1.
Schematic diagram of MV values.
Therefore, when the sample size is different, the decision-making of the statistical test is also different. Therefore, according to the aforementioned statistical testing rules and the fuzzy hypothesis test proposed by Chen et al. [], we assume and , respectively. The values are displayed in Figure 2.
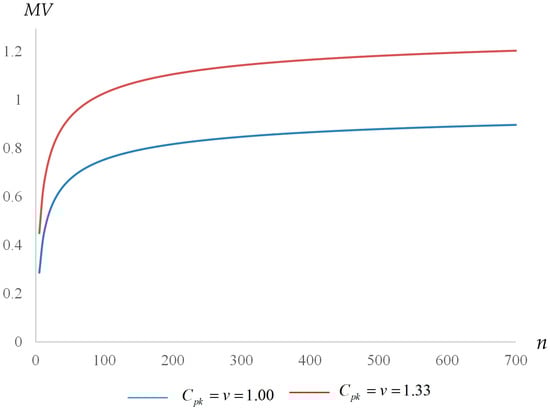
Figure 2.
Required minimum values (MV) corresponding to various values of n.
Based on the abovementioned results, it can be found that the number of samples, , will affect the final statistical inference. Also, let be the observation value of ; the observation values of accuracy index and precision index are expressed as follows:
Therefore, the observation value of can be expressed as:
where
According to the upper confidence limit of and Buckley’s approach [], the fuzzy membership function, , which resembles a semi-triangular shape formed by , can be expressed as:
where
Obviously, . Let
Thus,
Clearly, , and a new fuzzy membership function, , similar to a semi-triangular shape formed by , can be expressed as:
where
Therefore, the fuzzy number of this semi-triangular-like fuzzy membership function is , where and , so the fuzzy membership function can be expressed as follows:
where is observed from , illustrated as follows:
According to Buckley [] and , the fuzzy number of , similar to the semi-triangular shape formed by , is as follows:
where
Obviously, it can be observed that , and the semi-triangular-like fuzzy number of is , where
The membership function of a fuzzy number similar to a triangle is:
where is observed from , expressed as follows:
Figure 3 is a schematic diagram of the fuzzy membership function and .
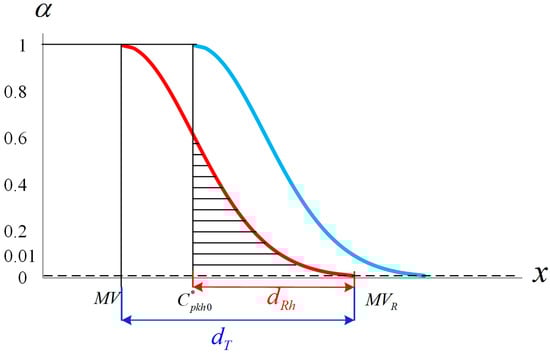
Figure 3.
Schematic diagram of the fuzzy membership function and .
According to Chen et al. [], let be the area between the fuzzy membership function of quality characteristic h and the x-axis, as follows:
Similarly, let be the area between the vertical line , the fuzzy membership function of quality characteristic h, and the x-axis, as follows:
According to the notation of Figure 3, this paper let and . Then, we have
Following Chen et al. [], we let , and the decision value () of the quality characteristic h can satisfy the following equation.
Thus, the decision value can be expressed as follows:
According to Chen et al. [] and Yu et al. [], the fuzzy testing rules are illustrated as follows:
- (1)
- If , which means , then do not reject and conclude .
- (2)
- If , which means , then reject and conclude .
As mentioned above, the radar chart is a visual evaluation tool and is widely used in various fields. Therefore, this paper drew the fuzzy radar evaluation chart for the process capability based on the above two fuzzy testing rules. Not only can this chart simultaneously evaluate all of the quality characteristics of the product, but it also can help process engineers to judge the quality characteristics of components that need to be improved in a timely manner. Consequently, this paper used the radar chart to evaluate the process capability. For example, if a product contains five quality characteristics, there will be five radar lines on the fuzzy radar evaluation chart for the process capability; a regular pentagon with an included angle of 72 degrees will be formed; then, the endpoint value on each radar line with the distance from the center point will be connected to form a regular pentagon control block. Finally, the index observation value will be marked on each radar line, as shown in Figure 4.
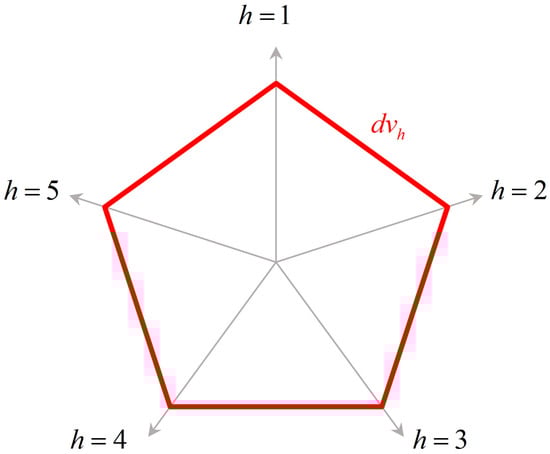
Figure 4.
Fuzzy radar evaluation chart.
Through this fuzzy radar evaluation chart, whether various indicators are located in the control block can be immediately spotted. When the index observation value falls within the block, which means , then the quality characteristic needs to make some improvements on its process. When the index observation value falls outside the block or the value of is on the line, which means , then the process capability meets the required quality level. According to the above, this study established evaluation rules for the fuzzy radar chart, as follows:
- (1)
- When , it means that this quality characteristic has not reached the required level, so that process improvement needs to be caried out.
- (2)
- When , it means that this quality characteristic has reached the required quality level.
4. A Practical Application
In order to help engineers and practitioners understand this evaluation model, this section will explain its application with data through a case study. As mentioned earlier, Taiwan has been dedicated to developing the machine tool industry in recent years, and its export values have been ranked among the best. In particular, the central region is a major industrial cluster. In practice, the impact cylinder, a component of the impact wrench, was taken as an example, and it was discovered that the problem of poor quality is usually caused by differences in size or tolerance, or a processing concentricity error. Therefore, this paper took the impact wrench manufactured by a company located in the central region as an example. In order to ensure the quality of subsequent processing and assembly, the impact cylinder, a component of the impact wrench, was explored through the bilateral specification index , and its specification indicators, including inside diameter , length , thickness , and axis distance , were analyzed as well. In an attempt to facilitate the management of quality engineers, this study listed five quality characteristics and their tolerances (Table 2).
Table 2.
Five quality characteristics and their tolerances.
This study analyzed five quality specifications of the impact cylinder produced by an impact wrench factory in central Taiwan. Therefore, there were five groups of sample data , and each randomly selected 36 processed components. Based on these five groups of sample data and the aforementioned evaluation model, we conducted tests and established evaluation steps, as follows:
Step 1: To facilitate the management of quality engineers, we applied the sample data and calculated the accuracy index , precision index (), five observation values of , and five upper limit observation values of based on Equations (32)–(35), as shown in Table 3.
Table 3.
Observation values of , , , and .
Step 2: According to Equation (28), , and the process capability index value required for the impact cylinder, the MV was calculated using the evaluation index value (), Equation (31), , and corresponding to the five bilateral specifications, expressed as follows:
Step 3: According to Equation (55), , , and the MV, we calculated the decision value for the bilateral specification evaluation index of the random sample, as follows:
Step 4: We drew five axes with an included angle of 72 degrees, marked the value () on the axis of the fuzzy radar chart, and connected the critical points to form a critical area in the shape of a regular pentagon. Next, we marked the index observation values of in Table 3 on the axes, as shown in Figure 5.
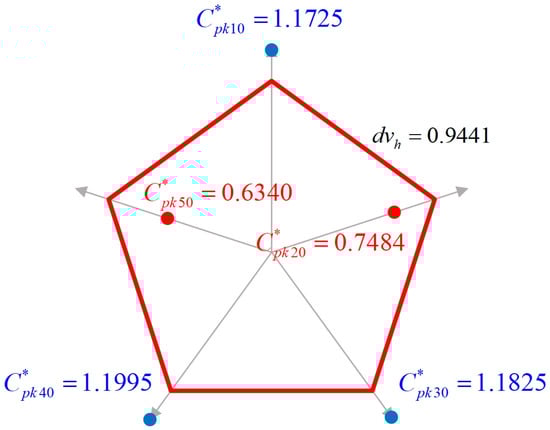
Figure 5.
Fuzzy radar evaluation chart of the impact cylinder.
Step 5: The evaluation rules, case study results, and discussions of the impact cylinder fuzzy radar chart are displayed as follows:
- (1)
- When , then it can be concluded that , so do not reject .
- (2)
- When , then it can be concluded that , so reject .
According to the above testing rules, the results and discussions of the case study are stated as follows:
- (1)
- The quality evaluation observation values , , and all fall outside the improvement block, so it means that , and have all reached the required quality level.
- (2)
- The quality evaluation observation values and both fall within the improvement block, so must be rejected according to the evaluation rules of the fuzzy radar chart. Therefore, these two quality characteristics both require process improvement.
- (3)
- Since of quality characteristic 2 (inside diameter) is greater than , cannot be rejected according to the statistical testing rules. Based on the fuzzy testing rules, since is smaller than , must be rejected. In fact, the value of is only 0.7484, which is much smaller than 1.1534. Obviously, the fuzzy testing model provided by this paper is more reasonable than the statistical testing model, and it can grasp the opportunity for improvement at the same time.
5. Conclusions
A machine tool is composed of many components. After the components are processed, they usually have multiple important quality characteristics. When the process quality of all quality characteristics meets the required quality level, the process quality of the components can be guaranteed to meet customer demand. Based on process capability index , this paper proposed a fuzzy radar evaluation chart to evaluate the process capabilities for all quality characteristics of components. In addition, not only can this chart make it easier for manufacturers to master the quality process capabilities for all quality characteristics, but it also can help them grasp the opportunity for improvement. First, the upper confidence limit of the index was deduced according to the MP method, and the MV for each quality characteristic was deduced by . Next, the fuzzy hypothesis testing model was established based on the MV. Finally, a visual fuzzy radar evaluation chart was developed. The advantages of this evaluation model are described as follows:
- (1)
- is not only the most widely used process quality evaluation tool in the industry, but also has an unequal relationship with the process yield. When the index value is large enough, the process yield is also high enough.
- (2)
- The fuzzy evaluation model proposed in this paper is built on the basis of confidence interval. Since the accumulated data or expert experience in the past can be incorporated, the accuracy and precision of the evaluation can still be maintained in the case of small samples.
- (3)
- Without losing generality, this paper assumes that when all individual quality characteristics (q) of a product can meet the requirements , then the product can be claimed as being a qualified product.
- (4)
- The MV is an index derived from the upper confidence limit , so it can reduce the risk of misjudgment caused by sampling error.
- (5)
- The estimated value of the index can be directly compared with the MV, which can ensure whether the process capability reaches the required level and conforms to the application in practice.
- (6)
- The approach can directly compare the observation value of the index with the value of , which is not only convenient, but also quickly judges whether the process needs to be improved.
- (7)
- The fuzzy radar evaluation chart shows the complete quality characteristics at the same time, and it can be seen at a glance whether each observation value falls within the evaluation chart. This chart not only facilitates the quality control process, but also greatly improves the management and control efficiency.
Furthermore, the fuzzy radar evaluation chart can construct important quality characteristics related to the whole picture of the product to ensure that each index value meets the requirements. In practical application, not only does it help the industry chain improve the process yield and reduce the occurrence of rework and scrap, but it also contributes to industry management and establishing long-term cooperation models and partnerships with suppliers in the era of rapid technological development.
The abovementioned points are the advantages of this paper. However, since the fuzzy evaluation model proposed in this study must incorporate sufficient experts, data, and experience and will vary from industry to industry, it needs to take a longer time and accumulate more data to make more accurate inferences. Consequently, the future research can focus on how to integrate the accumulated data and experience into decision-making rules.
Author Contributions
Conceptualization, K.-S.C. and C.-M.Y.; methodology, K.-S.C., C.-M.Y. and J.-S.L.; software, Y.-S.Z.; validation, Y.-S.Z. and T.-H.H.; formal analysis, K.-S.C., C.-M.Y. and J.-S.L.; resources, J.-S.L.; data curation, T.-H.H.; writing—original draft preparation, K.-S.C., C.-M.Y., J.-S.L., T.-H.H. and Y.-S.Z.; writing—review and editing, K.-S.C., C.-M.Y. and J.-S.L.; visualization, C.-M.Y.; supervision, K.-S.C.; project administration, J.-S.L. All authors have read and agreed to the published version of the manuscript.
Funding
This research received no external funding.
Data Availability Statement
The data that support the findings of this study are available from the corresponding author upon reasonable request.
Conflicts of Interest
The authors declare no conflicts of interest.
Nomenclature
| MP | mathematical programming |
| process capability index | |
| process target value | |
| d | half length of the specification interval |
| process mean | |
| process standard deviation | |
| upper specification limit | |
| lower specification limit | |
| Yield% | process yield |
| X | random sample |
| N | normal distribution |
| variance | |
| accuracy index | |
| precision index | |
| set of random samples of | |
| estimator of the accuracy index | |
| estimator of the precision index | |
| sample size | |
| Z | standard normal distribution |
| W | chi-square distribution with degree of freedom |
| P | probability |
| of fuzzy numbers | |
| upper quantile of | |
| lower quantile of | |
| A, B | event |
| CR | confidence region |
| upper confidence limit of index | |
| objective function | |
| left point of the horizontal line intersects the confidence region | |
| right point of the horizontal line intersects the confidence region | |
| left point of the horizontal line intersects the confidence region | |
| right point of the horizontal line intersects the confidence region | |
| value of the process capability of the product | |
| value of the process capability index of the individual quality characteristic | |
| q | individual quality characteristics |
| event | represents that its quality characteristic index value is greater than |
| upper confidence limit of process capability index | |
| MV | required minimum value |
| null hypothesis | |
| alternative hypothesis | |
| observation value of | |
| observation value of | |
| observation values of accuracy index | |
| observation values of precision index | |
| observation value of | |
| of | |
| of | |
| semi-triangular-like fuzzy number | |
| , | fuzzy membership function |
| of | |
| semi-triangular-like fuzzy number of | |
| range of the fuzzy membership function | |
| range between the fuzzy membership function and of quality characteristic h | |
| dv | decision value |
| decision-making value |
References
- Chien, C.F.; Hong, T.Y.; Guo, H.Z. An empirical study for smart production for TFT-LCD to empower Industry 3.5. J. Chin. Inst. Eng. 2017, 40, 552–561. [Google Scholar] [CrossRef]
- Liao, M.Y.; Pearn, W.L. Modified weighted standard deviation index for adequately interpreting a supplier’s lognormal process capability. P. I. Mech. Eng. B-J. Eng. 2019, 233, 999–1008. [Google Scholar] [CrossRef]
- Wu, M.F.; Chen, H.Y.; Chang, T.C.; Wu, C.F. Quality evaluation of internal cylindrical grinding process with multiple quality characteristics for gear products. Int. J. Prod. Res. 2019, 57, 6687–6701. [Google Scholar] [CrossRef]
- Pearn, W.L.; Cheng, Y.C. Measuring production yield for processes with multiple characteristics. Int. J. Prod. Res. 2010, 48, 4519–4536. [Google Scholar] [CrossRef]
- Prahalad, C.K.; Hamel, G. The Core Competence of the Corporation. Harv. Bus. Rev. 1990, 68, 79–91. [Google Scholar]
- Wu, C.W.; Pearn, W.L. A variables sampling plan based on Cpmk for product acceptance determination. Eur. J. Oper. Res. 2008, 184, 549–560. [Google Scholar] [CrossRef]
- Wu, C.W.; Liao, M.Y.; Yang, T.T. Efficient methods for comparing two process yields—Strategies on supplier selection. Int. J. Prod. Res. 2013, 51, 1587–1602. [Google Scholar] [CrossRef]
- Wu, C.W.; Liao, M.Y.; Lin, C.W.; Lin, T.L. Testing and ranking multiple wafer manufacturing processes with fuzzy quality data. J. Test. Eval. 2016, 44, 1970–1977. [Google Scholar] [CrossRef]
- Wang, S.; Chiang, J.Y.; Tsai, T.R.; Qin, Y. Robust process capability indices and statistical inference based on model selection. Comput. Ind. Eng. 2021, 156, 107265. [Google Scholar] [CrossRef]
- Li, W.; Liu, G. Dynamic failure mode analysis approach based on an improved Taguchi process capability index. Reliab. Eng. Syst. Saf. 2022, 218, 108152. [Google Scholar] [CrossRef]
- Shu, M.H.; Wang, T.C.; Hsu, B.M. Generalized quick-switch sampling systems indexed by Taguchi capability with record traceability. Comput. Ind. Eng. 2022, 172, 108577. [Google Scholar] [CrossRef]
- Kane, V.E. Process capability indices. J. Qual. Technol. 1986, 18, 41–52. [Google Scholar] [CrossRef]
- Claessen, J.H.T.; Van Wijk, J.J. Flexible linked axes for multivariate data visualization. IEEE Trans. Vis. Comput. Graph. 2011, 17, 2310–2316. [Google Scholar] [CrossRef] [PubMed]
- Wan, Y.; Cheng, K.; Liu, Z.; Ye, H. An investigation on machinability assessment of difficult-to-cut materials based on radar charts. P. I. Mech. Eng. B-J. Eng. 2013, 227, 1916–1920. [Google Scholar] [CrossRef]
- Zhang, H.; Hou, Y.; Zhang, J.; Qi, X.; Wang, F. A new method for nondestructive quality evaluation of the resistance spot welding based on the radar chart method and the decision tree classifier. Int. J. Adv. Manuf. Technol. 2015, 78, 841–851. [Google Scholar] [CrossRef]
- Chen, H.Y.; Lin, K.P. Fuzzy supplier selection model based on lifetime performance index. Expert Syst. Appl. 2022, 208, 118135. [Google Scholar] [CrossRef]
- Huang, C.C.; Chang, T.C.; Chen, B.L. Fuzzy assessment model to judge quality level of machining processes involving bilateral tolerance using crisp data. J. Chin. Inst. Eng. 2021, 44, 1–10. [Google Scholar] [CrossRef]
- Lo, W.; Yang, C.M.; Lai, K.K.; Li, S.Y.; Chen, C.H. Developing a novel fuzzy evaluation model by one-sided specification capability indices. Mathematics 2021, 9, 1076. [Google Scholar] [CrossRef]
- Boyles, R.A. Process capability with asymmetric tolerances. Commun. Stat.-Simul. Comput. 1994, 23, 615–635. [Google Scholar] [CrossRef]
- Pearn, W.L.; Chen, K.S. New generalization of the process capability index Cpk. J. Appl. Stat. 1998, 25, 801–810. [Google Scholar] [CrossRef]
- Hsu, C.H.; Chen, K.S.; Yang, C.M. Construction of closed interval for process capability indices Cpu, Cpl, and Spk based on Boole’s inequality and de Morgan’s laws. J. Stat. Comput. Simul. 2016, 86, 3701–3714. [Google Scholar] [CrossRef]
- Buckley, J.J. Fuzzy statistics: Hypothesis testing. Soft Comput. 2005, 9, 512–518. [Google Scholar] [CrossRef]
- Chen, K.S.; Wang, C.H.; Tan, K.H. Developing a fuzzy green supplier selection model using Six Sigma quality indices. Int. J. Prod. Econ. 2019, 212, 1–7. [Google Scholar] [CrossRef]
- Yu, C.M.; Chen, K.S.; Lai, K.K.; Hsu, C.H. Fuzzy supplier selection method based on smaller-the-better quality characteristic. Appl. Sci. 2020, 10, 3635. [Google Scholar] [CrossRef]
Disclaimer/Publisher’s Note: The statements, opinions and data contained in all publications are solely those of the individual author(s) and contributor(s) and not of MDPI and/or the editor(s). MDPI and/or the editor(s) disclaim responsibility for any injury to people or property resulting from any ideas, methods, instructions or products referred to in the content. |
© 2024 by the authors. Licensee MDPI, Basel, Switzerland. This article is an open access article distributed under the terms and conditions of the Creative Commons Attribution (CC BY) license (https://creativecommons.org/licenses/by/4.0/).