1. Introduction
Centrality measures in graph theory estimate the significance or impact of particular nodes in a given network. The concept of node centrality is not uniformly defined [
1]. Depending on the context, there are different definition criteria that provide different perspectives on the importance of nodes within a network. Centrality measures are a kind of selection tool or a suitable ranking mechanism to recognise which nodes are of particular importance in a variety of applications, such as identifying the most influential people in social networks, locating the key connecting nodes in transport networks, understanding the spread of diseases in populations, etc.
Among a variety of centrality measures, some of the most common are
centrality,
(also called
),
centrality,
centrality,
centrality,
, etc. [
1,
2,
3]. Several elements related to the structure of the network, such as its size, density, and connectivity, can influence which centrality measure is most expressive. For example, in a sparse network with few connections,
centrality may not adequately capture the importance of a node, while
centrality may be more informative. Furthermore, for specific applications with different circumstances or needs, different centrality measures will be most appropriate for the relevant network properties in a given context [
4,
5]. For instance, in traffic networks,
centrality [
6] may reveal important intersections, while in citation networks,
centrality [
7] can highlight the most influential articles.
Computationally, the relevance of a node in a network can be evaluated using a local, semi-local, or global methodology. Some of the best-known representatives of the local approach are measures such as
and
. Since such measures only consider local network properties, their main drawback is that they do not capture information about the entire network structure. Consequently, such centrality measures are not a good stand-alone tool to determine which nodes are the most central or play the most important role in the entire network. Conversely, global centrality measures such as
,
, or the
[
8] reflect the overall influence of a node in the network. Globally defined centrality measures also have certain limitations. The algorithms for such centrality measures, which require global information to calculate the importance of each node in a network, often have high computational complexity. Other drawbacks include sensitivity to the size and/or density of the network, inability to capture contextual information, etc. Clearly, to obtain a more comprehensive knowledge of the node importance within the network, local measures should be used in addition to the global centrality analysis. For these reasons, especially for complex networks with many nodes and an intricate structure, the semi-local approach to centrality assessment [
9,
10,
11,
12,
13,
14,
15], which focuses on smaller subnetworks can provide the best of both worlds.
The semi-local importance assignment still allows for the exploration of numerous approaches to node centrality, but is geared towards importance assessment in a clustered subnetwork. The various system attributes considered in the literature include efficiency, connectedness, shortest paths, influence, robustness, etc.; however, they do not primarily target a high degree of node integration and interconnectivity between nodes in the subnetwork.
To evaluate these particular properties, in this paper, we propose a semi-local centrality measure for directed and weighted graphs, the Directed Semi-Local Integration Measure (), which evaluates the property of integration of nodes in the clustered neighbourhood of directed complex networks through (directed) interconnectivity between clustered nodes. The parametric nature of the measure allows for finer tuning and a stronger focus on the role of a node’s inbound or outbound connectivity in the graph, a property that further improves its suitability for the application at hand.
In addition to the conceptual contribution, we have also written and published the Python function that implements the
measure and made it available in a GitHub repository [
16] (details can also be found in
Supplementary Materials).
The rest of the paper is organised as follows. We define the
centrality measure in
Section 2 and discuss its special cases and their properties with respect to other centralities in
Section 3. Related work is discussed in
Section 4. We conclude with
Section 5 with potential future research directions.
2. Semi-Local Integration Measure for Directed and Weighted Graphs
A directed graph, also called a digraph, is a type of graph in which the edges connecting the nodes have a specific direction. In other words, in a directed graph, each edge is represented by an ordered pair of nodes indicating a one-way interaction or connection between the nodes [
17]. A directed and weighted graph is a type of graph in which each edge is associated with a numerical value, the
of the edge, which represents a specific quantitative measure of the relation or interaction between the nodes connected by the edge.
Formally, a directed and weighted graph G is defined as a tuple , where V is a set of nodes (vertices) and E is a set of directed edges between pairs of nodes in the graph G in which each directed edge connects node u to node v. Furthermore, is a function that assigns a numerical value to each edge in the graph, a weight .
Directed and weighted graphs can represent a variety of real-world phenomena with directed relations, i.e., interactions. Typical applications of this kind include the flow of information in communication networks in which graphs model data transfer, bandwidth capacities, signal strengths, communication costs, latency, etc. [
18,
19,
20]. Similarly, dependency relationships in project management represent priorities in tasks that need to be completed before other tasks can begin; while in social networks, the frequency of interactions between people on social media platforms, etc., is typically modelled.
In this work, we deal with weighted simple directed graphs, i.e., graphs without edges from a node to itself (loops) and without multiple edges of the same direction between pairs of nodes. This simplifies the model and is very common in network analysis, especially in the real-world applications we want to represent, where such entities do not occur.
The proposed node centrality measure takes into account the direction of the edges containing the node, the edge weight, and the number of (directed) cycles that include a particular node. These elements serve as indicators of interconnectedness, interdependence, and/or integration. For example, nodes in cycles are part of a well-connected subnetwork and belong to a cohesive local community. The edge weight represents the quality of the connection, while the direction of the edge indicates the qualitative connection in terms of the influence of a node to and from another node. Therefore, nodes that are strongly connected within a cluster of nodes can be considered more significant in terms of high integration within the network cluster. The more cycles a node goes through, the higher the value of the node.
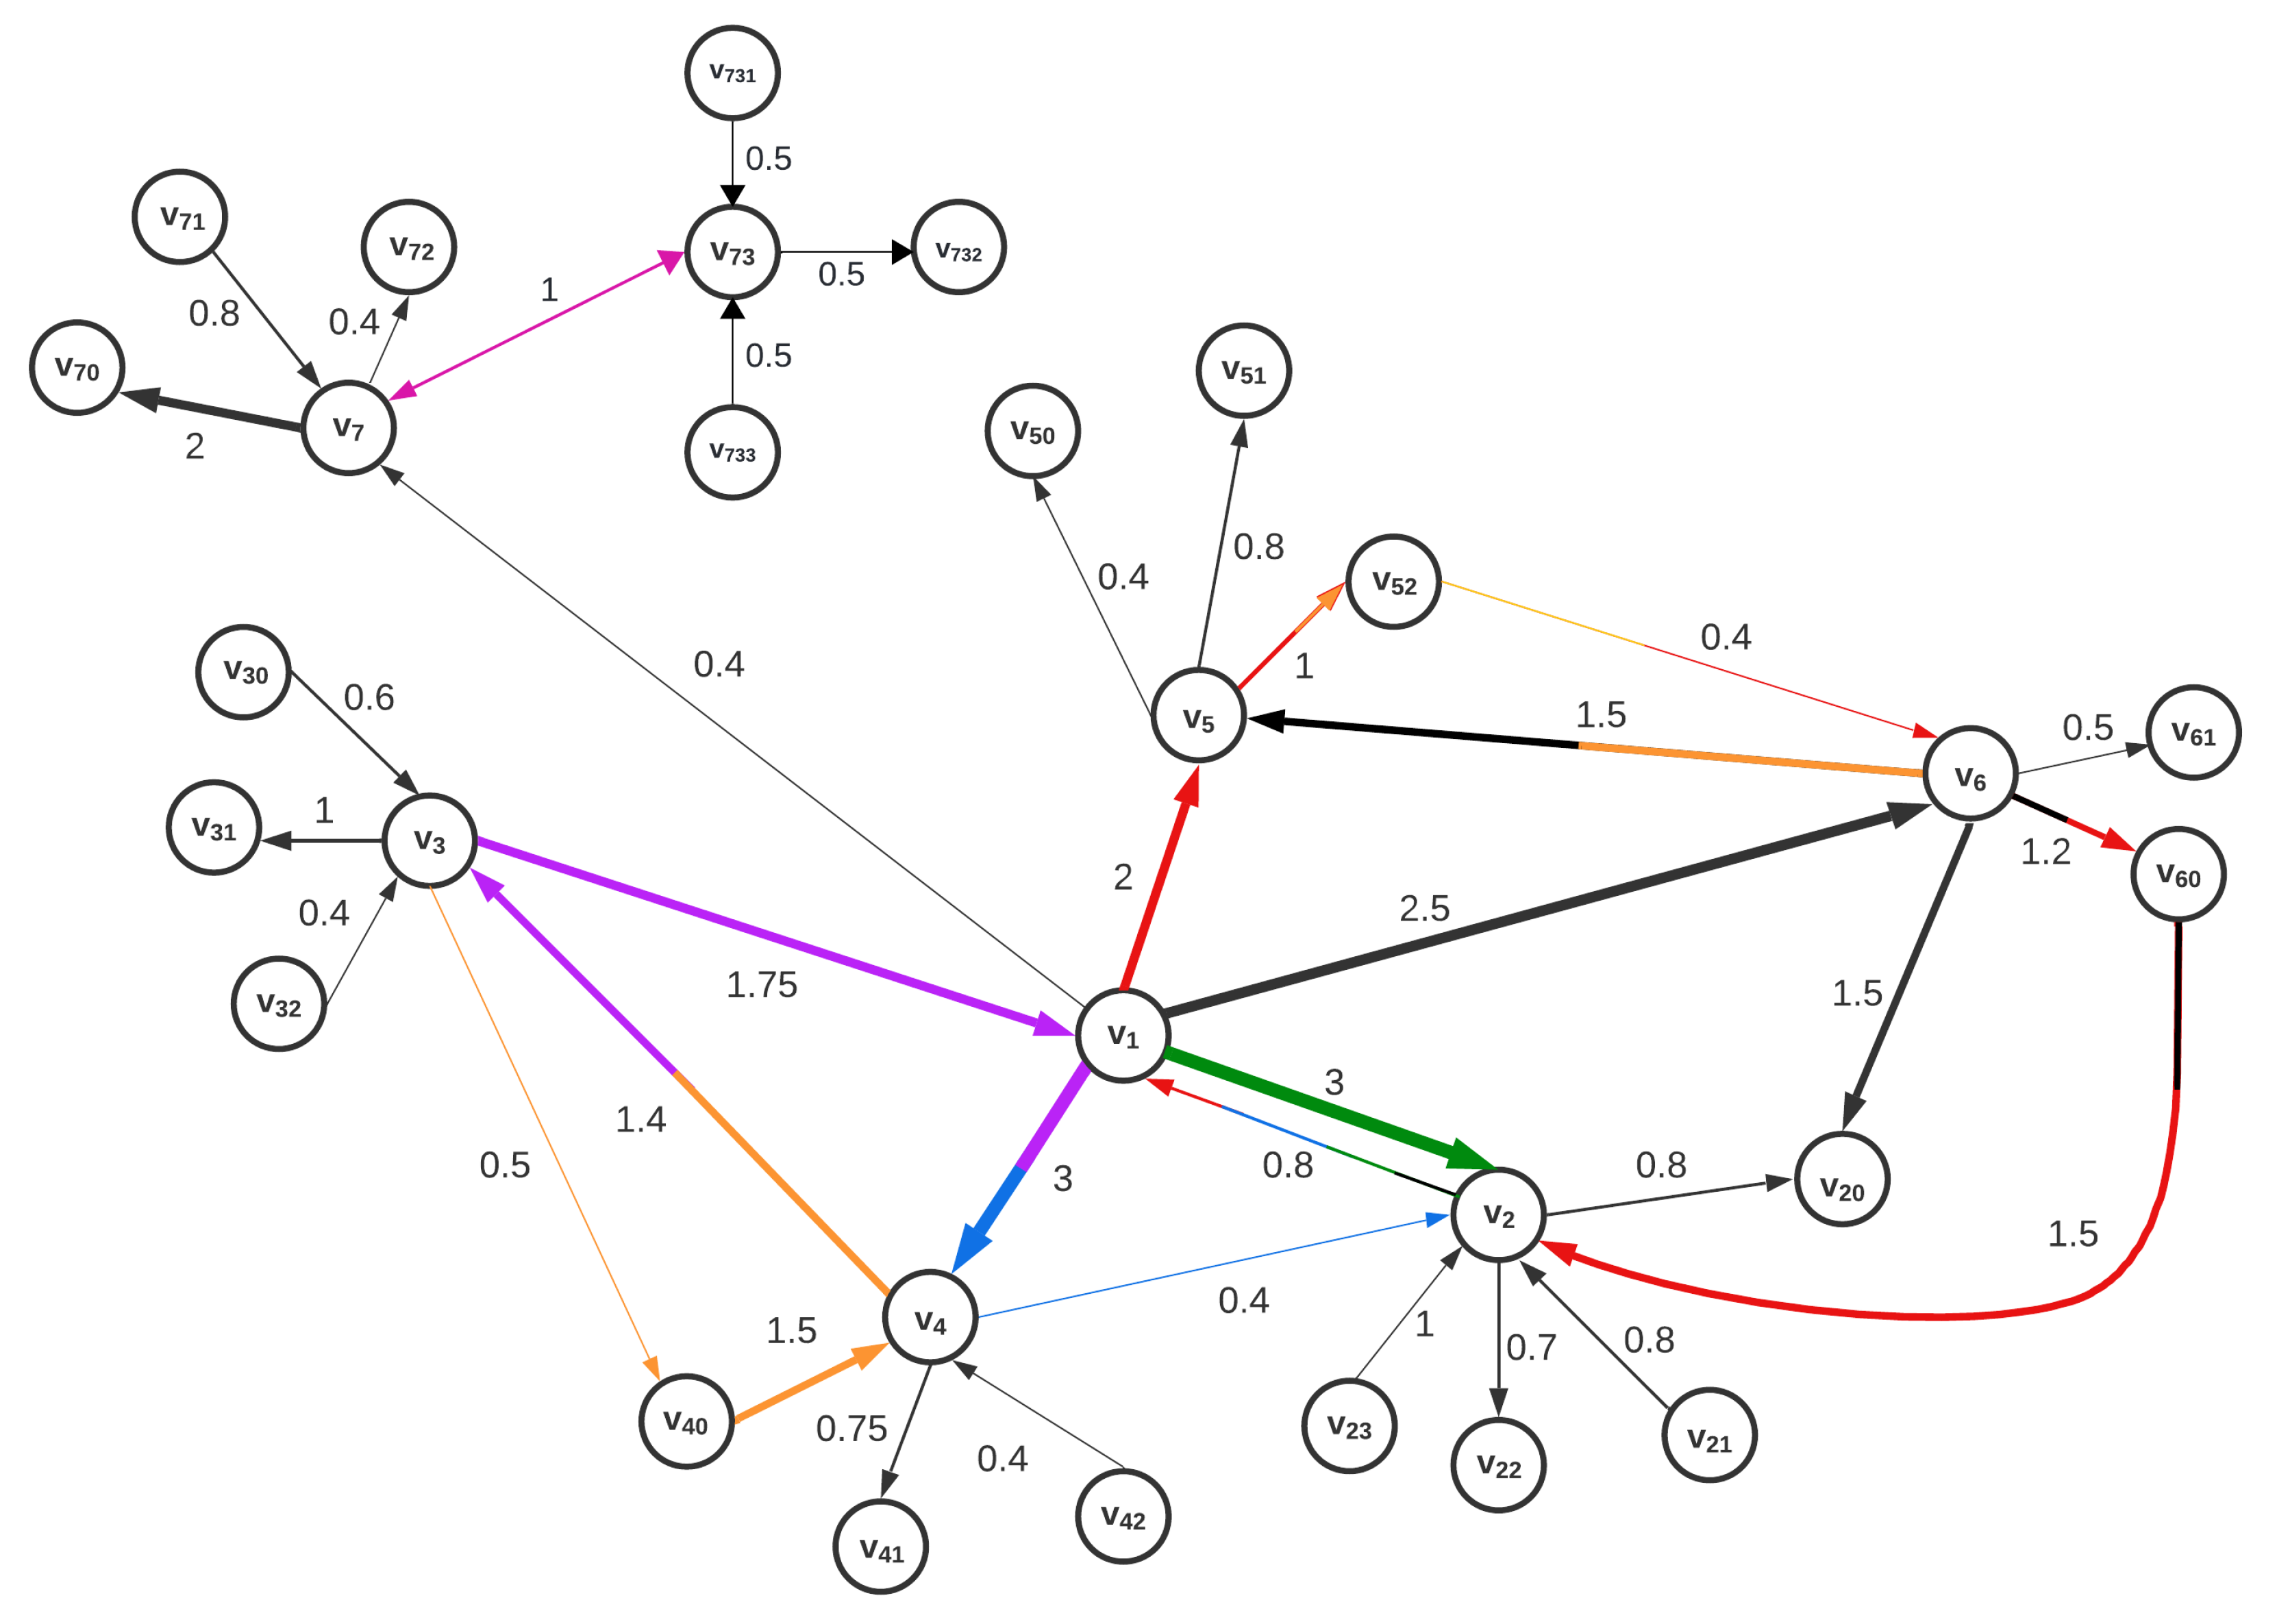
Figure 1 shows an example of a directed and weighted graph
G. It contains some important relations that may occur when simulating a real situation: some leaves are more strongly connected than others, with both directions occurring, to and from peripheral nodes; some edges do not participate in cycles, while others do; and some edges participate in multiple cycles (such edges are represented by multicoloured arrows, where the colours that appear in the arrow indicate to which cycle the respective edge belongs). For example, the edge
is part of two cycles, namely
and
. The following cycles occur in the directed graph
G:
When evaluating the quality or strength of the interconnection between the nodes, the edge weight indicates the relatedness of the endpoint nodes. For example, it can be considered that the node influences more strongly (the associated weight is 3), than vice versa (the edge from to has a of ). In the visualisation of this graph feature, the thickness of the arrows indicates the weight of the edges between the nodes, with thin arrows representing weak connections, while thick arrows indicate more extensive connections between the nodes.
Networks in the real world often have a considerate proportion of reciprocal edges, i.e., for a pair of nodes, there are edges in the graph in both directions. The example graph shown in
Figure 1 also contains various types of connections: some edges are reciprocal, i.e., represent connection with the same weight for both directions, e.g.,
and
both have weight 1; some nodes have a reciprocal connection but the weight of the connection is different for different directions, e.g., in the case of
and
with weights of 3 and 1, respectively; and many non-reciprocal connections between pairs of nodes appear in the graph, e.g.,
, but
, etc. With such an example, we want to cover various common scenarios in network architecture and provide a clear and understandable illustration of the measure based on the many provided features of the graph.
2.1. Definition of Directed Semi-Local Integration Measure ()
With centrality, we want to evaluate the degree of integration of a node in a cluster of a directed and weighted complex network, hence we want to measure how well a node is connected or central to its neighbourhood subnetwork structure. Before presenting a formal definition of the measure, we introduce the necessary notation relating to a directed and weighted graph , namely,
— of the node ;
— () of the node ;
— () of the node ;
—directed edge from the node a to the node b, ;
—set of all directed edges of E with an ending node a;
—set of all directed edges of E with a starting node a;
—weight of the edge ,
—number of local simple directed cycles that include the edge .
Several auxiliary terms used in the definition of the measure are additionally defined:
—edge cycle factor of the directed edge ;
—node importance of the node ;
—edge importance of the edge .
The auxiliary factor, edge cycle factor, evaluates the participation of an edge in simple directed cycles. The presence of (directed) cycles in a graph is an important indicator of its integration. Such features improve the connectivity of a graph by providing alternative paths between nodes. For example, cycles and redundant paths can increase resilience to failures and improve the overall robustness of the network. Therefore, the number of directed cycles in a graph containing a particular edge usually indicates the degree of integration of this node within the connected neighbourhood.
The edge cycle factor of a directed edge
,
, is defined as
where
is a number of directed simple cycles that include the edge
. A simple directed cycle is a closed path that starts and ends at the same node and in which the nodes occur only once, with the exception of the start and end nodes. Note that the edge cycle factor is greater than or equal to 1, and is only equal to 1 if the directed edge
does not participate in any directed cycle in the graph
G. Thus, since the concept of cycle reinforces the integration factor of the edge in the graph, this factor is used to emphasise the importance of the directed cycles containing a particular edge.
The direction of the edges indicates the flow or communication between the nodes, so we pay special attention to the
and the
of a node, noting that the following holds:
where the
,
, is the sum of weights of incoming edges incident to the node
a and
is its
, the sum of weights of outgoing edges incident to the node
a,
When evaluating integration centrality, both and can contribute to the overall connectivity and cohesion of the subnetwork. Nodes with a balanced and can facilitate bidirectional communication, collaboration and resource sharing, indicating stronger integration within the subnetwork. Nodes with a higher are crucial for the coordination and integration of the different aspects within the graph, as well as for its overall functionality and coherence. At the same time, a high in a directed graph also contributes to the integration of the graph by facilitating the dissemination of information, distributed control, etc. Since nodes with high values of these measures typically contribute to a denser and more interconnected network, we emphasise their importance for the integration properties of the network.
In the calculation, both the and the of a node and the weights of the incident edges are considered, but we tune the participation of each direction using two parameters, and , . With respect to these parameters, we consider three cases:
; evaluating both and importance;
; evaluating importance;
; evaluating importance.
For each node
, the
node importance of
a with respect to the parameters
,
, is calculated as:
where
is the
importance of the directed edge , defined as:
The factor
from (
3) reflects the contribution of the edge’s weight and the imbalance in the sum of the
and
of its endpoints to the integration measure. This factor depends on the direction of the respective edge. More precisely, if the edges between two nodes exist in both directions,
, with
and
, then the importance of these reciprocal edges may be different,
.
Note that for the node importance
, the
of the node is increased by the importance contribution of all its incident edges:
Similarly, for and , the and the are increased by the importance of the incoming and outgoing edges, respectively. The higher the (incoming/outgoing) degree of the node, the weights of incident edges, and the number of cycles through the node, the higher the node importance.
Finally, we normalise the importance of the node
to represent the percentage or share of importance of the node in the graph
G. More precisely,
Note that the proposed measure is zero only for unconnected nodes, i.e., nodes a with . Note also that we obtain three different centrality indicators for the three cases with respect to the parameters and :
—directed semi-local integration importance;
—incoming directed semi-local integration importance;
—outgoing directed semi-local integration importance.
2.2. Algorithm
In a computational framework, given a graph with the associated edge weights and the scores of its nodes, the computation of the measure is executed through the following procedure, which is presented below in a simplified and intuitive way:
The Python programme that implements the above procedure, i.e., the
measure algorithm, is available in a GitHub repository [
16].
To demonstrate the intended properties of
-centrality, we use this algorithm to compare the
value with some known centrality measures for the example graph
G shown in
Figure 1. The resulting values are listed in
Table 1. In the next section, we will also look at other versions of the measure that consider only one direction, namely, only the incoming or the outgoing case.
The node with the highest degree of integration is
, with
, which corresponds to almost 40% of the total node importance within the graph
G. This dominance is due to the significant connectivity of the node
, which is reflected in several edges of both directions going from (i.e., edges
) and to the node
(i.e., edges
). In addition, the
measure of the node is increased if it is part of directed cycles. The fact that edges that have
as a starting or an ending point participate in numerous cycles in the graph
G significantly increases the integration rank of the node
. For example, the edge
participates in four different directed cycles,
in two different directed cycles,
in one, etc. The fact that
is about 2.8 times more integrated than node
is also due to the fact that the edges incident to node
have a higher weight than the edges incident to node
. Although node
would have a high significance in other contexts, e.g., as an important bridge node, in the case of rating integration it only has a share of
% of the total node importance within the graph
G. The node
is only part of one directed cycle,
, and most edges in the neighbourhood do not have a high weight. Note that the nodes
and
are both leaves with the same value of
, and, therefore, have the same rank in the integration. Furthermore, none of the
values of the nodes in
G is zero, since each of the nodes has at least one incident edge either pointing to it or leading away from it. This general case of the
measure (
2) corresponds to the choice of the parameters
The obtained values clearly show that the importance distribution effectively indicates the importance of nodes by polarising their values more than other centralities. It is also easy to see that the order of importance varies greatly between the different centralities, which underlines the special properties of the centrality measure. For example, the most important node in terms of and , the node , is the second most important in the ranking according to the measure. Apart from isolated nodes with zero and , the value of the measure is never zero. This property is particularly valuable for comparing nodes with similar values and emphasises its usefulness in distinguishing the correlation between all nodes. For this particular graph, if a node u is not part of a directed cycle and , we conclude that u is most likely a leaf node whose degree of integration is low.
3. Versions of Directed Semi-Local Integration Measure
The and the are important integration measures, as they reflect different aspects of a node’s connectedness and influence in the network. Nodes with a higher are more integrated due to their centrality and receptivity to incoming connections, while nodes with a higher play an important role in disseminating information and promoting connectivity in the network, favouring integration at both local and global levels. Both measures affect the values of the general version of , , which considers both directions proportionally (and depending on the number of incoming and outgoing edges).
One of the valuable properties of the proposed
measure is that it can be relatively easily adapted to the context to be modelled, where it might be better to consider only one direction, the
or the
. Precisely for this reason, the proposed measure is parametric and allows the most appropriate choice of the parameters
in the formula of
(
2).
3.1. Incoming Directed Semi-Local Integration Importance—
In the integration analysis, nodes with a higher
receive more information, resources, or support from other nodes. These nodes serve as hubs or key points where many influences converge and help maintain the overall cohesion and interconnectedness of the network. In addition, nodes with a higher level of integration are more central and influential in the network, as other nodes often turn to them for interactions or transactions. If the context requires to evaluate and identify such highly integrated nodes in terms of incoming information, the
measure with the parameters
and
is the appropriate centrality. With these parameters, the ‘balanced’
measure (
2) is offset to emphasise the importance of the
measure (over the
measure). In this case, the Formula (
2) becomes:
The importance of the incoming nodes
is calculated using the same Formula (
4), but only takes into account the edges that lead to the respective node.
The
values for the example graph
G in
Figure 1, which are given in
Table 2, illustrate the significant difference in the estimated importance in relation to the considered choice of parameters, i.e., direction focus.
It is easy to see that the order of importance for the three versions differs significantly, both in the order of importance and in the distribution of importance among the nodes. The first five nodes are
, while the first five nodes according to the
measure are
. Note that the node
with the highest
value is only the fifth highest for the
value. The reason for this ranking is easy to recognise in
Figure 1. Nodes with a higher
ranking are characterised by high
values and are often elements of directed cycles within the graph.
Since the nodes have similar and are not involved in many directed cycles in the graph G, they also have similar values for . In cases where the value of the of a node is zero, the value of that node is also zero. However, it is valuable to point out that and measures are not linearly dependent on each other, as there are some cases where , but Furthermore, note that the values of do not match the order and distribution of importance compared to , one of the best- known centralities that emphasises the incoming direction.
High integration guarantees effective communication in systems where information dissemination is critical, such as social media platforms, telecommunication networks, and IoT (Internet of Things) networks. Nodes with a high serve as hubs for receiving and distributing information and enable fast and comprehensive network connectivity. Another crucial aspect in which the incoming direction is important is the organisation and optimisation of the data flow on the Internet. Nodes with a high are able to process a large amount of incoming data well and ensure a smooth flow of information without burdening individual nodes. There are other examples of complex networks where the incoming semi-local integration centrality can be crucial, especially for identifying and ranking important nodes.
3.2. Outgoing Directed Semi-Local Integration Importance—
For some applications, it is very useful to determine which nodes are strongly integrated in the graph based on the outgoing direction. In such network representations, nodes with a high are responsible for allocating tasks or resources to numerous recipients in systems where efficient task or resource allocation is required.
If the integration parameters are set as
and
, (
2) becomes
With this choice of parameters, it is easy to recognise that the
measure refers to the
importance.
The values of the
scores for the example graph
G shown in
Figure 1 are given in
Table 2. The biggest difference between the node rankings of the
versions is between the
node with the highest rank
and the second-highest node
. The reason for this lies in the fact that the node
with the highest rank has a very high
and is part of many directed cycles in the graph
G, which is not the case for the node
. As in the case of the
measure,
and the
-measure are not linearly dependent. The
importance ordering of the nodes also does not match the order according to the Katz–Bonacich measure, another semi-local centrality measure that is calculated based on the
along with the cumulative weight of the paths through the particular node in the graph. Although the most important node for these two measures is
, the second-most-important node for the Katz–Bonacich measure is
, while
has the same rank for the centrality measure
.
There are several reasons to identify high-level nodes by the . In transport networks, such as metro systems, large transport hubs with multiple outbound connections serve as highly integrated nodes. These hubs help passengers move more efficiently between locations, manage traffic flow and optimise travel routes. Highly influential users in a social network who have a large number of followers act as highly integrated nodes with a high . They disseminate information, opinions, or trends to their followers and thus influence discussions and activities throughout the network. In a Content Delivery Network infrastructure (CDN), edge servers with a high also serve as highly integrated nodes. These servers distribute material to numerous users, reduce latency and improve the speed of online applications or streaming services by delivering content from the closest server location. They are essential for the optimal use of resources and the timely completion of tasks as they optimise task assignment and resource allocation. In various domains, identifying the highly rated nodes in terms of can help in strategically positioning such valuable components to ensure smooth operations and integration.
3.3. Directed Semi-Local Integration Measure in Unweighted Graphs
Unweighted graphs are often used when the relationships or connections between the nodes are considered equally significant or important. They are suitable for scenarios where the presence or absence of a connection is the primary consideration, rather than the specific or of that connection. For example, in a transport network, the nodes can represent locations and the edges can represent roads or routes between these locations. An unweighted graph can be used when the main consideration is only whether there is a direct connection between two locations, regardless of the quality or distance of the road. Weighted graphs, on the other hand, are used when certain properties of the connections between nodes, such as cost, capacity, travel time, or distance, play an important role in network analysis or optimisation.
To illustrate the influence of edge weights on the
measure, we calculate the integration scores and compare the values obtained for the graph version with edge weights with those for the same graph without considering the edge weights, i.e., treating all edge weights as
. The obtained values of the general version of
, the
and
centrality measures for unweighted version of graph
G,
, and
, from
Figure 1 are presented in
Table 3.
The centrality measures and do not result in the same order and distribution of importance among the nodes. Although the two highest-ranking nodes are the same in both the weighted and unweighted versions of the graph, the relative difference in their importance is considerable: while node is almost three times as important as node in the weighted case, the values are almost the same in the unweighted case.
The main reason for this minimal difference between the values of the two highest ranked nodes lies in the fact that the sum of the
and the
is the same for each of these two nodes, as well as in the fact that all edges leading into and out of the nodes
are involved in approximately the same number of directed simple cycles. All values of the centrality measure
are non-zero, as all nodes have at least one incoming or outgoing incident edge. For the nodes that have only incoming edges,
is not equal to zero, while
is zero. The same applies to the other direction. This is similar to the
and
metrics for the weighted version (
Table 2), but the order of the important nodes is not kept when the edge weights are unified.
3.4. Discussion
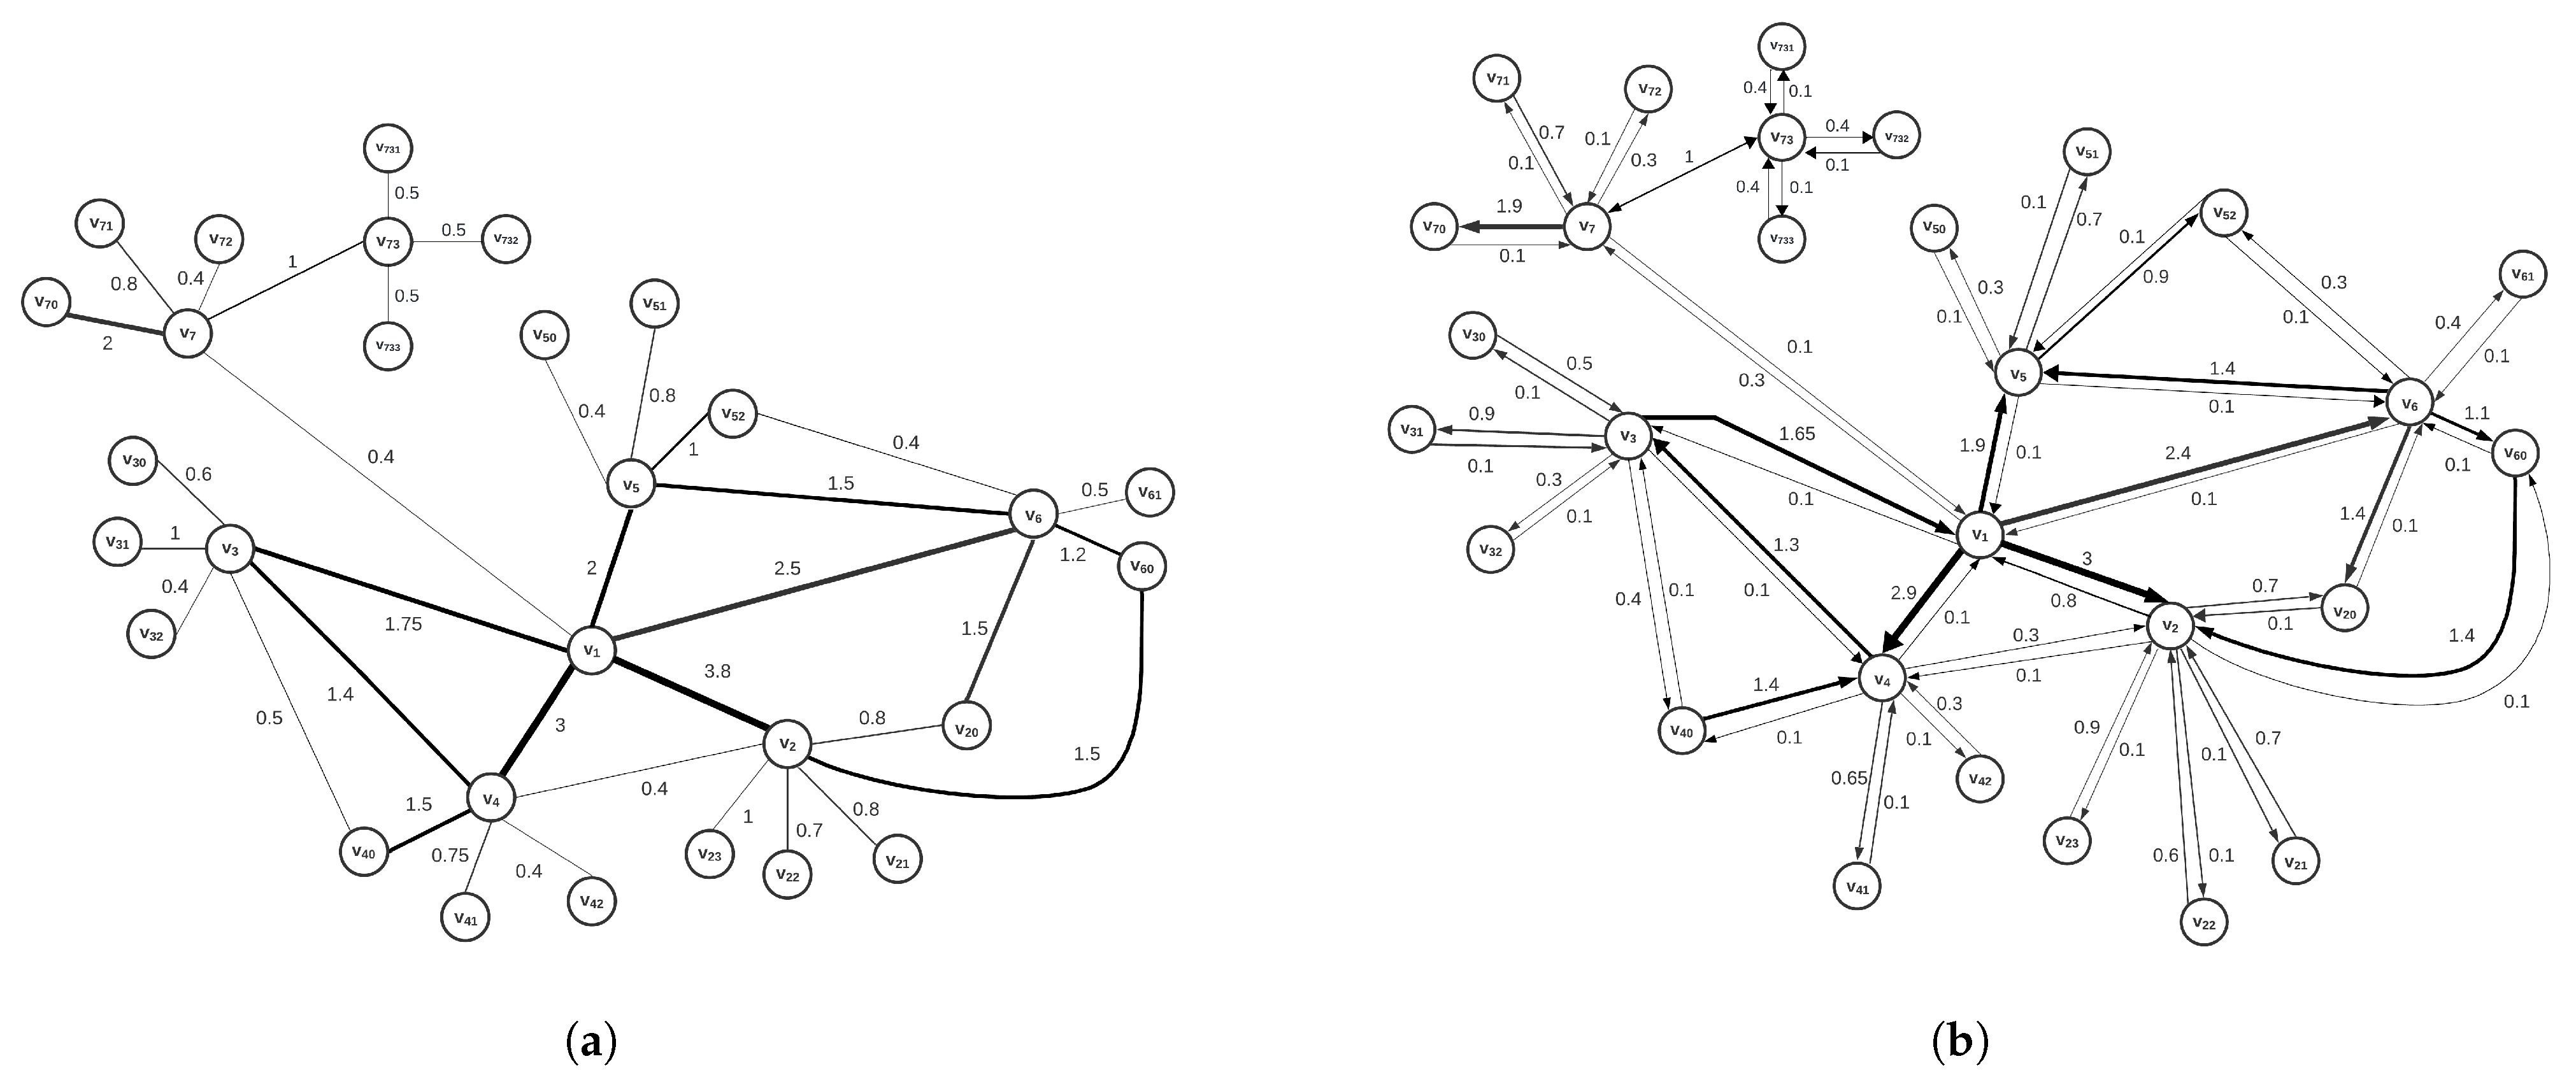
Direction plays a very important role in graph analysis, especially when it comes to representing relations between nodes or entities. For illustration, let us consider the undirected graph obtained from the directed graph shown in
Figure 1, where we intentionally disregard the edge orientation, see
Figure 2.
The resulting graph
shown in
Figure 2a, is an undirected graph in which all nodes have kept the same original
, as in
G. Consequently, many more (undirected) cycles are present in the undirected graph than in the original directed graph. We use the
centrality measure for undirected and weighted graphs introduced in [
21] to evaluate the integration score of each node in the graph
. The values are shown in
Table 4.
At the same time, we simulate this undirected graph,
, with the graph
shown in
Figure 2b by adding the missing edges so that each pair of nodes in
G (shown in
Figure 1) is connected by edges of both directions. We keep the node degree for all nodes of
G by taking the relatively low weight of 0.1 from the original direction. In this way, we obtain a directed graph
in which the edges between the nodes always occur in reciprocal pairs. Due to this construction, many more (directed) cycles appear compared to the original graph
G. We use the
centrality measure to calculate the integration scores from the graph
. The values obtained are shown in
Table 4. Both centralities identify the node
as the highest-ranked node, but they do not agree on the second-highest node. For the
method on the undirected graph,
the node
ranks in second place, while in the directed graph
,
ranks second. For the other nodes, which are categorised as less important, there are also differences in the order according to the
and the
measure. The five most important nodes according to the
measure are
, while according to the
measure the five most important nodes are
. It is of great significance to note that the rankings and the values of the
measure for the graph
and the
for the graphs
G and
do not match either in the order or in the relative differences of the node scores, despite an increased number of cycles in both graphs. The reason for the difference in these centralities originates in the information about the edge direction. Specifically, Formula (
3) for the edge importance takes into account which node is the initial node of this edge and its degree. This also shows that the respective weights of the reciprocal edges cannot be disregarded, even if their sum is fixed, e.g., the cumulative weight of 3, split into 1.5 and 1.5 in each direction, clearly does not have the same effect in the directed network as splitting the same weight into 0.1 and 2.9. This important characteristic of directed and weighted networks has been successfully incorporated into the definition of the
centrality.
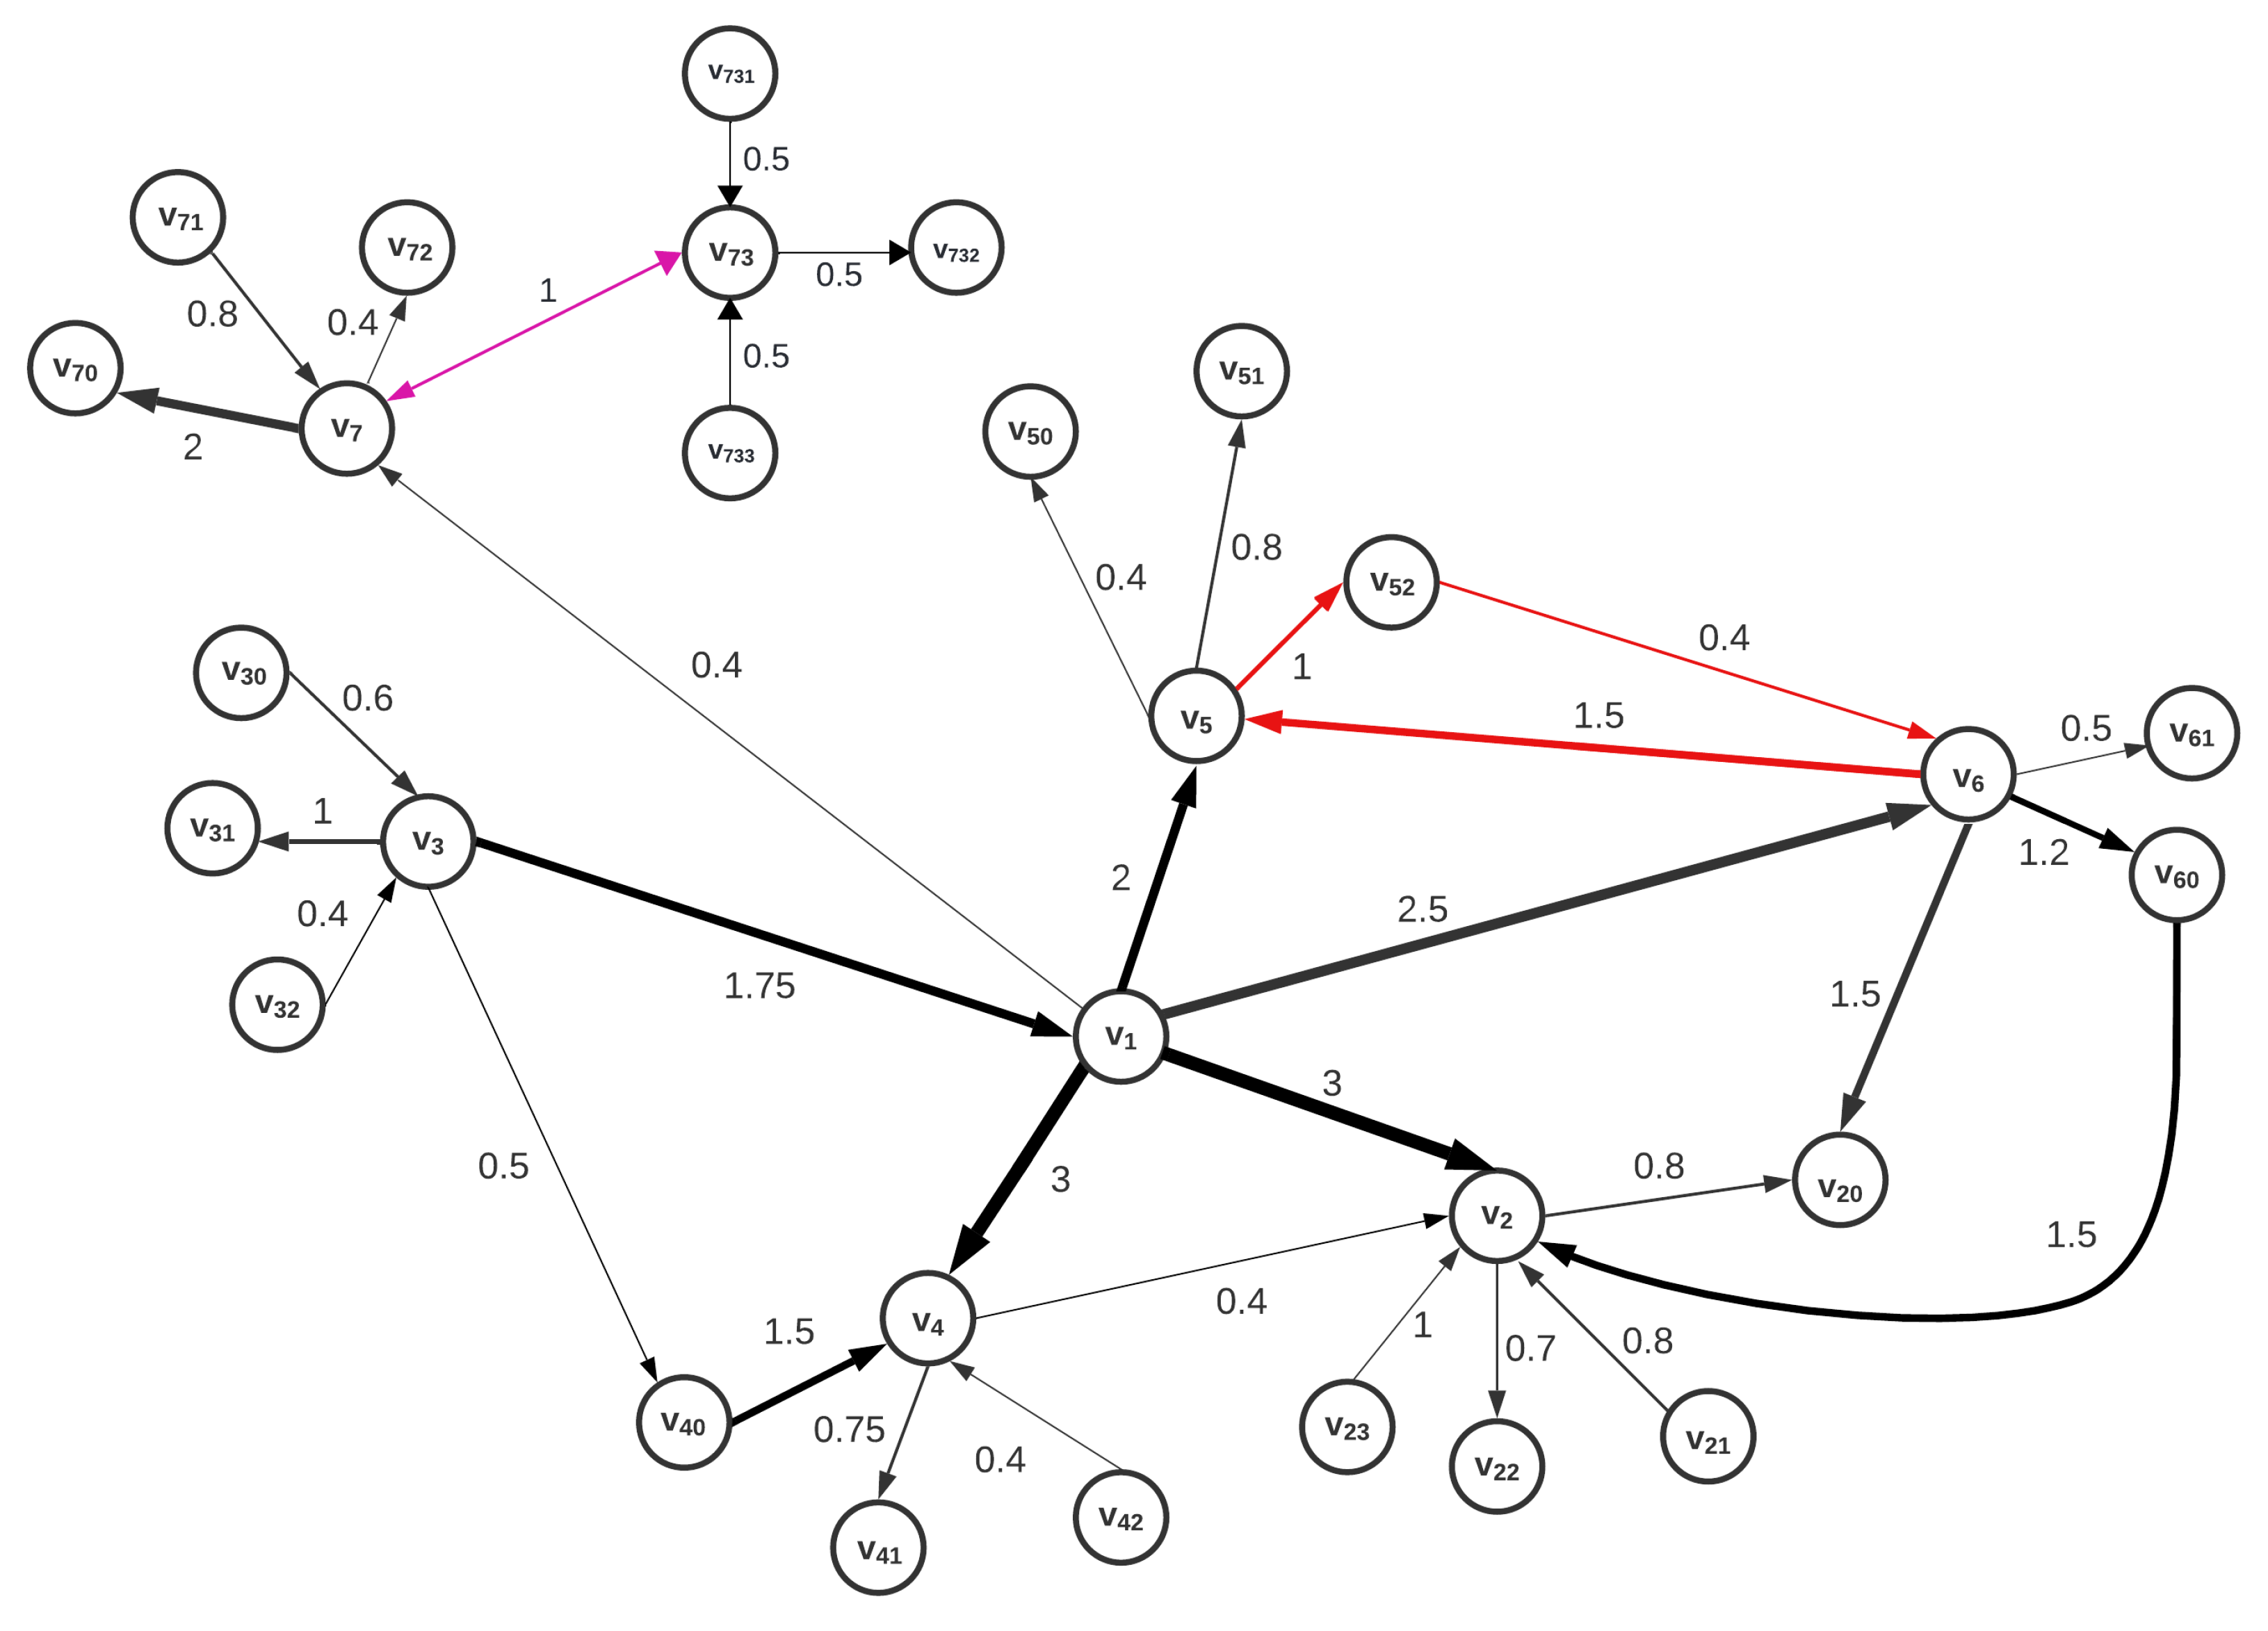
In the context of integration in a graph, cycles play a crucial role for several reasons. This means, for example, that information or resources can flow via multiple paths, which increases the system’s resilience to disruptions. In addition, the presence of many cycles, especially short cycles, is often a sign of high cohesion within a group of nodes, indicating strong local integration.
Figure 3 shows the graph
, which is a slightly modified version of the graph
G from
Figure 1.
We introduce , where , , and the weights of all remaining directed edges keep the same values as in the initial graph G, where . Although these two specified edges may seem relatively unimportant due to their lower weighting within the graph G, we will show that their removal leads to a significantly altered node integration ranking within the graph .
The first few nodes of the graph
with the highest
integration ranking are shown in
Table 5.
It is interesting to note that in contrast to the graph
G shown in
Table 1, the order of the highly integrated nodes has changed and the order of the most important nodes is different in all three versions of the
measure presented. The underlying cause of this scenario is attributed to the fact that the excluded edges, even if they did not have high weight values, contributed to numerous cycles within the graph
G; in particular, i.e.,
was part of four directed cycles and
was involved in two directed cycles. This emphasises the significant influence that directed cycles have on the integration of nodes within a graph.
4. Related Work
There are different approaches to evaluating the semi-local node importance within weighted networks, which have been discussed in several studies. It is important to note that most of these measures are primarily designed for undirected graphs. This leaves a significant gap in methods specifically tailored to directed graphs, in which the directionality of edges plays a crucial role in the inbound and outbound importance of their nodes. Consequently, the applicability of undirected measures to directed graphs is often limited, highlighting the need to develop new techniques or adapt existing techniques to better address the unique characteristics of directed networks.
Available semi-local centrality measures do not recognize inbound and outbound interconnectivity and integration, which is a property of great importance in numerous applications of complex networks. In our previous work [
21], we introduced the Semi-Local Integration (
) measure of node centrality for undirected and weighted graphs that takes into account the coherence of the locally connected subnetwork and evaluates the integration of nodes within their neighbourhood. We have illustrated
importance differentiation between nodes in lexical networks and demonstrated its usefulness in natural language processing (NLP) and its potential for use in various types of complex networks in different research domains. This served as an inspiration and motivation for this work, which extends the semi-local approach and evaluates the integration within a neighbourhood subnetwork, defining a similar semi-local measure,
, but for directed and weighted graphs.
is a comprehensive measure of the importance of a node within the network, parametric with respect to the and node influence. In addition to the and of a node, it takes into account the number of (directed) cycles of any length in which the node is involved, and the weights of the incident edges. Since the direction of the edges leads to different interpretations of centrality, this novel measure can be of great interest for many applications and various aspects of network analysis. For example, centrality indicates how central a node is with respect to the incoming edges, and provides information about the orientation of the other important nodes in the subnetwork towards the node. Within a complex network, the and centrality can vary significantly due to the diversity of connections between the nodes and the corresponding weights. For example, depending on its role in the network, a node can have a high but a low or vice versa.
Most centrality measures in the literature focus on undirected graphs. In addition to the well-known standard centrality measures, several novel perspectives have emerged for evaluating the importance of nodes in undirected graphs. For example, Opsahl et al., 2010 [
22] extend the concepts of degree centrality and shortest path analysis, by proposing that the node importance increases with the accumulation of network strength it possesses. Furthermore, Opsahl etl al., 2008 [
23] addresses the significance of nodes in terms of prominence and control across diverse domains such as transportation [
24], scientific collaboration, and online communication [
20]. This work highlights the tendency of influential nodes to connect to each other, creating ‘range-based clubs’, and formalises this tendency using the weights of edges that connect the ‘members’. However, despite these advances, these measures do not generalise to directed graphs. Moreover, directed graphs are often converted to undirected graphs by applying symmetry to each edge (after removing self-loops, if any) [
19], although directionality, i.e., orientation, is crucial in numerous applications in various domains.
The concept of centrality measures in directed graphs is quite challenging due to the complexity arising from directionality, while in undirected graphs, where the edges have no specified direction, definition of particular centrality is simplified by the symmetric relation of connectedness between the nodes, the directionality in directed graphs, affects the relations between the nodes, which is not necessarily reciprocal. Even if two nodes are connected in both directions, the weights of these edges can be different. This directional offset makes the interpretation of centrality measurements considerably more difficult.
is probably the best-known centrality measure for directed graphs, but it operates on the principle that the importance of a node (a webpage) can be determined by looking at the other nodes (web pages) that link to it. It is defined globally, not semi-locally. One of the semi-local centrality measures for directed networks, Katz–Bonacich centrality [
14], takes into account both the node’s direct connections (it focuses mainly on outcoming edges to evaluate the centrality of a particular node, with connections from other influential nodes leading to higher centrality values for that node) and its influence via paths of different lengths in the network (the measure assigns higher centrality values to nodes that are not only directly connected to other important nodes, but also to nodes that are connected to important nodes via longer paths). Katz–Bonacich reflects both the local importance of the node in its immediate vicinity and its global influence on the overall network structure.
These valuable approaches are suitable for many important properties, but do not provide a comprehensive understanding of the qualitative differences between nodes in terms of their local integration.
5. Conclusions
Choosing the right centrality measure is crucial for gaining useful insights from network analysis. To ensure that the chosen centrality measure effectively represents the intended attributes of node importance within the network, careful consideration must be given to the various aspects of the system’s operation and objectives, on the one hand, and the characteristics of the network and computational constraints, on the other. For many applications, semi-local centralities can reveal the most relevant information about the properties of closely connected network clusters in the challenging and sophisticated analysis of complex networks.
The available semi-local measures do not seem to assess the importance of integration and influence within network communities and are particularly scarce for the more intricate analysis. This is even more demanding for directed networks, which are the appropriate model for many real-world systems where collaboration, communication, and exchange of resources are represented by both one-way and bidirectional connections, such as on the Internet, in telecommunication networks, in IoT (Internet of Things) networks, or on social media platforms.
The centrality proposed in this paper aims to identify the most influential nodes in terms of integration within the subnetwork of such complex networks. Many strong links within the neighbourhood, including redundant routes, are an indicator of coherence and stronger integration within the subnetwork. They enable effective communication and dissemination of information, promote connectivity throughout the network and foster integration at both local and global levels.
Several extensions for research go beyond the scope of this work. As future work, we plan to look at applications involving loops in the graph and integration centrality beyond simple graphs. For certain network characteristics, we could also explore the potential for finer tuning of the in- and out- parameters, e.g., using parameters over the segment , , where .
Another direction of further research is the analysis of concrete applications of centrality in complex networks, e.g., linguistic networks in NLP, which are formed on the basis of many directed syntactic-semantic constructions. Various server–client and other Internet network relations are also of particular interest.


