Article

Hybrid Entropy-Based Metrics for k-Hop Environment Analysis in Complex Networks

1
Faculty of Informatics, Eszterházy Károly Catholic University, 3300 Eger, Hungary
2
Faculty of Informatics, Eötvös Loránd University, 1117 Budapest, Hungary
Mathematics 2025, 13(17), 2902; https://doi.org/10.3390/math13172902
Submission received: 9 August 2025 / Revised: 29 August 2025 / Accepted: 5 September 2025 / Published: 8 September 2025
(This article belongs to the Special Issue Graph Theory and Applications, 3rd Edition)

Abstract

Two hybrid, entropy-guided node metrics are proposed for the k-hop environment: Entropy-Weighted Redundancy (EWR) and Normalized Entropy Density (NED). The central idea is to couple local Shannon entropy with neighborhood density/redundancy so that structural heterogeneity around a vertex is captured even when classical indices (e.g., degree or clustering) are similar. The metrics are formally defined and shown to be bounded, isomorphism-invariant, and stable under small edge edits. Their behavior is assessed on representative topologies (Erdős–Rényi, Barabási–Albert, Watts–Strogatz, random geometric graphs, and the Zephyr quantum architecture). Across these settings, EWR and NED display predominantly negative correlation with degree and provide information largely orthogonal to standard centralities; vertices with identical degree can differ by factors of two to three in the proposed scores, revealing bridges and heterogeneous regions. These properties indicate utility for vulnerability assessment, topology-aware optimization, and layout heuristics in engineered and quantum networks.

1. Introduction

Understanding the local structural complexity of vertices in complex networks is fundamental to both theoretical graph science and engineering applications. Examples include robustness analysis, community bridge detection, and quantum hardware topology. Classical node metrics such as degree, clustering coefficient, betweenness, and eigenvector centrality capture important aspects of connectivity and flow. However, they often fail to distinguish between vertices that share similar connectivity while differing in their local structural organization.
To address this limitation, entropy-based approaches have been developed to quantify heterogeneity in networks from an information-theoretic perspective. Early work formalized entropy for graph ensembles and linked it to Gibbs and von Neumann entropies, laying the foundation for an information theory of complex topologies [1]. Structure entropy based on automorphism partitions was introduced to capture heterogeneity beyond degree distributions, effectively identifying symmetry-induced regularities [2]. Comprehensive surveys later established taxonomies of graph entropies and related complexity measures, clarifying deterministic versus probabilistic viewpoints and the role of information measures in network analysis [3].
Spectral characterizations also connect graph properties to information measures. Von Neumann graph entropy, derived from the Laplacian spectrum, has been studied as a graph complexity index and related to structural features and extremal classes [4,5]. Exact computation is costly for large graphs, so efficient and incremental algorithms were proposed to approximate or update von Neumann entropy, enabling applications in dynamic or large-scale settings [6,7].
Recent studies have refined the understanding of entropy in labeled and unlabeled ensembles and in dynamic networks governed by maximum entropy principles. These works highlight subtleties in how constraints shape information content [1,8]. The locality of measurement is equally important. Node importance and vulnerability often depends more on the structure within a limited k-hop neighborhood than on global summaries. Entropy-inspired node scores have therefore been proposed to identify influential vertices by combining local and mesoscopic information [9]. In parallel, research on meso-scale organization (e.g., community structure) emphasized the need for measures that can expose bridge vertices and structurally diverse regions overlooked by standard centralities [10]. Dedicated surveys have further documented a wide range of node- and subgraph-level entropy constructions and their application contexts [11].
In this work, two hybrid, entropy-guided metrics are introduced on the k-hop neighborhood of a vertex: Entropy-Weighted Redundancy (EWR) and Normalized Entropy Density (NED). EWR combines local entropy with clique-based redundancy to emphasize structurally diverse yet redundantly organized neighborhoods. NED normalizes local entropy by a density factor, highlighting informative structures in relatively sparse environments. Their mathematical properties are established, including boundedness, extremal values on specific graph classes, and invariance under isomorphism. Empirical analysis shows that EWR and NED provide insights largely orthogonal to classical centrality measures. Case studies on a 1000-vertex Erdős–Rényi graph and a bridge topology reveal that vertices with identical degrees may differ by factors of two to three in the proposed metrics. These differences pinpoint critical bridges and heterogeneous regions that classical indices overlook. The results indicate that hybrid entropy-based metrics enrich the mathematical toolkit for local graph analysis and offer practical value in engineered networks where fine-grained structural heterogeneity is consequential.
Entropy-based network analysis has also been applied beyond purely structural or theoretical contexts, extending to diverse applied domains. In economic settings, entropy and network analysis have been combined to assess competitive conditions in global value chains [12]. Socio-technical and socio-economic surveys likewise document how entropy metrics capture hidden heterogeneities across domains [11]. Temporal interaction systems have been investigated through entropy-based formulations to reveal dynamical constraints [8]. Propagation entropy has been used to identify influential nodes in spreading processes [9]. At the node level, additional approaches include entropy variation for removal-impact assessment [13], structure-entropy-based node ranking [14], and sub-graph entropy to characterize functional regions in brain networks [15]. Together, these studies indicate that entropy-guided methodologies are theoretically well grounded and broadly interdisciplinary, positioning the present contribution within a wider landscape of applications.

2. Previous and Related Work

Graph-theoretic metrics are fundamental tools for characterizing the structure and behavior of complex networks. From classical measures such as degree distribution and clustering coefficient to advanced indices rooted in spectral graph theory and information theory, these tools provide complementary perspectives on network topology. In particular, k-hop neighborhood analysis has emerged as a powerful method to capture localized structural features that global measures may overlook [16,17].
Entropy-based approaches have been widely applied to quantify structural heterogeneity in graphs [1,3]. Global measures, such as von Neumann graph entropy [4,5], rely on spectral properties of the Laplacian matrix, while local entropy metrics focus on diversity within a node’s k-hop neighborhood [9,11]. However, most of these measures either neglect redundancy and density aspects or apply them only at a global scale.
As surveyed comprehensively in [3], a wide range of entropy-based measures has been proposed for graphs, including both global and local formulations. The distinction between the proposed hybrid entropy-based metrics and previously established entropy measures therefore deserves explicit emphasis. Classical graph entropies, such as von Neumann entropy [4,5], automorphism-partition-based structure entropy [2], and node propagation entropy [9], quantify structural heterogeneity either at the global scale or at the immediate 1-hop neighborhood. These approaches capture diversity but do not modulate the entropy value by the extent of redundant interconnections or by neighborhood size.
In contrast, EWR combines local entropy with a density factor, highlighting structurally diverse neighborhoods that are also redundantly interlinked. NED additionally penalizes overly homogeneous large neighborhoods by scaling entropy with the neighborhood size, thereby preserving discriminative power in sparse environments. These constructions are not reducible to known entropy-based centralities except in trivial limiting cases: in a complete neighborhood, EWR collapses to the raw Shannon entropy H k ( v ) and NED reduces to H k ( v ) / | N k ( v ) | , while in star-like neighborhoods both vanish due to zero redundancy. Thus, EWR and NED extend entropy-based node characterizations by coupling information-theoretic diversity with explicit structural redundancy, offering complementary sensitivity to heterogeneity that classical entropy measures alone cannot capture.
Quantum computing hardware topologies introduce new challenges for graph analysis. Physical qubit connectivity in quantum annealers can be modeled as sparse, highly structured graphs—examples include the Chimera, Pegasus, and Zephyr architectures [18,19]. Understanding these structures is crucial for efficient minor embedding [20], identifying structural bottlenecks, and improving fault tolerance [21]. Entropy-based measures have also been explored in quantum information processing as tools for analyzing robustness and complexity [22].
The present research builds directly on earlier works of the author. In [23], k-hop-based graph metrics were introduced for node ranking in wireless sensor networks. In [24], D-Wave topologies were analyzed using classical graph metrics, and structural limitations in embedding capacity were identified. In [25], these methods were extended to k-hop entropy-based analysis for D-Wave quantum processors. Finally, in [26], an entropy-based k-hop metric was proposed for structural sensitivity analysis in complex graphs, laying the groundwork for the hybrid metrics presented in this paper.

3. Notation and Conventions

3.1. Basic Definitions

Throughout the paper, all graphs are assumed to be simple, undirected, and connected unless stated otherwise. For a graph G = ( V , E ) and vertex v V , the k-hop neighborhood N k ( v ) is defined as the set of vertices whose shortest-path distance from v is at most k, excluding v itself. The induced subgraph on N k ( v ) is denoted by G k ( v ) .
The global degree of a vertex u in G is denoted by deg G ( u ) , while deg G k ( v ) ( u ) refers to the degree of u restricted to the induced subgraph G k ( v ) .

3.2. Mixed Degree and Convex Parameter α

In some contexts, a convex combination of local and global degrees is employed as follows:
d ˜ u ( α ) ( v , k ) : = α deg G k ( v ) ( u ) + ( 1 α ) deg G ( u ) ,
with a default parameter α = 1 2 when not otherwise specified.
Entropy is computed using base-2 logarithms throughout, i.e., log ( · ) denotes log 2 ( · ) unless explicitly stated. The convention 0 log 0 : = 0 is applied.
For degenerate neighborhoods,
  • If | N k ( v ) | = 0 , both H k ( v ) and R k ( v ) are set to 0;
  • If | N k ( v ) | = 1 , then H k ( v ) = 0 and R k ( v ) = 0 by definition.
In density calculations, the binomial coefficient | N k ( v ) | 2 = | N k ( v ) | ( | N k ( v ) | 1 ) 2 represents the maximum possible number of edges in G k ( v ) . When the denominator equals zero (i.e., | N k ( v ) | < 2 ), the density is set to 0 by convention.
Unless otherwise specified, all summations over u N k ( v ) are taken with respect to the chosen degree function (local, global, or mixed), and all results are stated for general k 1 .
The convex parameter α in the mixed degree definition interpolates between purely local degrees ( α = 1 ) and purely global degrees ( α = 0 ). The default choice α = 1 2 serves as a balanced compromise, assigning equal weight to local and global perspectives without privileging either extreme. This midpoint is particularly convenient in comparative studies across diverse network models, as it avoids bias toward hub-dominated or purely neighborhood-driven characterizations. Nevertheless, alternative values of α may reveal different structural insights: for instance, α close to 1 emphasizes fine-grained local heterogeneity, whereas α close to 0 highlights the role of globally connected hubs. The flexibility of α thus allows application-specific tuning of the proposed metrics.

4. Formal Definitions and Properties

Definition 1
(Entropy in the k-hop environment). Given a choice of degree function d u ( k ) (local, global, or mixed), define the normalized degree distribution
p u ( k ) ( v ) : = d u ( k ) x N k ( v ) d x ( k ) , u N k ( v ) ,
with the convention 0 log 0 : = 0 . The k-hop entropy of v is
H k ( v ) : = u N k ( v ) p u ( k ) ( v ) log 2 p u ( k ) ( v ) .
Definition 2
(k-hop density). The density of G k ( v ) is
R k ( v ) : = | E ( G k ( v ) ) | | N k ( v ) | 2 , if | N k ( v ) | 2 , 0 , if | N k ( v ) | < 2 ,
where | N k ( v ) | 2 = | N k ( v ) | ( | N k ( v ) | 1 ) 2 is the maximum possible number of edges among | N k ( v ) | nodes.
Definition 3
(Entropy-Weighted Redundancy (EWR)). 
EWR k ( v ) : = H k ( v ) · R k ( v ) .
Definition 4
(Normalized Entropy Density (NED)). 
NED k ( v ) : = H k ( v ) | N k ( v ) | · R k ( v ) , | N k ( v ) | 1 , 0 , | N k ( v ) | = 0 .

Basic Properties

Theorem 1
(Range of EWR). For any v V ,
0 EWR k ( v ) log 2 | N k ( v ) | .
If the entropy uses local degrees deg G k ( v ) (or any degree notion constant on N k ( v ) when G k ( v ) is a clique), then the upper bound is attained if and only if G k ( v ) is a clique and the degree distribution p u ( k ) is uniform.
Proof. 
It holds that 0 H k ( v ) log 2 | N k ( v ) | and 0 R k ( v ) 1 , hence 0 EWR k ( v ) log 2 | N k ( v ) | . If G k ( v ) is a clique with equal local degrees, then the distribution p is uniform, H k ( v ) = log 2 | N k ( v ) | and R k ( v ) = 1 , achieving the bound. Conversely, if the bound is achieved, then R k = 1 implies that G k ( v ) is complete, and maximal H k implies that p is uniform, which for local degrees means that all degrees are equal.    □
Theorem 2
(Range and Upper Bound Monotonicity of NED). For any v V ,
0 NED k ( v ) log 2 | N k ( v ) | | N k ( v ) | .
If G is connected, then | N k ( v ) | is non-decreasing in k, and the upper bound log 2 | N k ( v ) | | N k ( v ) | is non-increasing for | N k ( v ) | 3 .
Proof. 
The bound follows from H k ( v ) log 2 | N k ( v ) | and R k ( v ) 1 . Monotonicity of the bound follows since the function x log 2 x x is decreasing for x 3 .    □
Lemma 1
(Isomorphism invariance).  Both EWR k and NED k are invariant under graph isomorphisms; in particular, they are invariant under automorphisms of G.
Proof. 
All quantities N k , G k , | E ( · ) | and degrees are preserved under isomorphisms, hence so are the derived metrics.    □
Remark 1
(Star graph). In the star S n with global-degree entropy, for the center v one has | N 1 ( v ) | = n 1 , the distribution p is uniform, H 1 ( v ) = log 2 ( n 1 ) , but R 1 ( v ) = 0 , hence EWR 1 ( v ) = 0 . For a leaf, the condition | N 1 ( v ) | = 1 implies that H 1 = 0 and R 1 = 0 , hence EWR 1 ( v ) = 0 .
Remark 2
(Non-monotonicity in k). The values of EWR k ( v ) and NED k ( v ) need not be monotone in k: adding a new k-hop layer can increase entropy H k but decrease density R k , leading to non-monotone products.

5. Proofs

5.1. Proof of Theorem (Range of EWR)

Proof. 
By definition, H k ( v ) = u N k ( v ) p u ( k ) ( v ) log 2 p u ( k ) ( v ) with a probability vector p ( k ) ( · ) on the finite set N k ( v ) . Hence, 0 H k ( v ) log 2 | N k ( v ) | , where the upper bound is attained iff p u ( k ) ( v ) = 1 / | N k ( v ) | for all u. Moreover, 0 R k ( v ) 1 by definition of density. Therefore 0 EWR k ( v ) = H k ( v ) R k ( v ) log 2 | N k ( v ) | . For the attainability, if the entropy is computed from local degrees deg G k ( v ) and G k ( v ) is a clique, then deg G k ( v ) ( u ) = | N k ( v ) | 1 for all u, whence p ( k ) is uniform and H k ( v ) = log 2 | N k ( v ) | , while R k ( v ) = 1 . Conversely, if EWR k ( v ) = log 2 | N k ( v ) | , then R k ( v ) = 1 (hence G k ( v ) is complete) and H k ( v ) is maximal, which forces p ( k ) to be uniform; for local degrees this implies equal induced degrees on N k ( v ) .    □

5.2. Proof of Theorem (Range and Upper Bound Monotonicity of NED)

Proof. 
From H k ( v ) log 2 | N k ( v ) | and R k ( v ) 1 I get NED k ( v ) log 2 | N k ( v ) | | N k ( v ) | . Nonnegativity is immediate. If G is connected, then N k ( v ) N k + 1 ( v ) , so | N k ( v ) | is nondecreasing in k. The function f ( x ) = log 2 x x is decreasing for x 3 (since f ( x ) = 1 ln x ( ln 2 ) x 2 < 0 for x > e ), hence the upper bound on NED k ( v ) is nonincreasing for | N k ( v ) | 3 .    □

5.3. Proof of Lemma (Isomorphism Invariance)

Proof. 
Let ϕ : G G be a graph isomorphism. Then dist G ( u , v ) = dist G ( ϕ ( u ) , ϕ ( v ) ) , so ϕ ( N k ( v ) ) = N k ( ϕ ( v ) ) and ϕ ( G k ( v ) ) G k ( ϕ ( v ) ) . Degrees (global or induced) are preserved by isomorphisms, thus the multiset { d u ( k ) : u N k ( v ) } is mapped bijectively to { d ϕ ( u ) ( k ) : ϕ ( u ) N k ( ϕ ( v ) ) } , implying that the probability vector p ( k ) (up to reindexing) and its entropy are preserved. Since | E ( G k ( v ) ) | and | N k ( v ) | are also invariant under isomorphism, both R k and the derived EWR k , NED k are invariant.    □

5.4. Auxiliary Facts on Extreme Cases

Theorem 3
(Cliques and stars). Let n 3 .
  • If G = K n and k = 1 , then for every v, N 1 ( v ) = V { v } is a clique. With local degrees, p ( 1 ) is uniform, hence H 1 ( v ) = log 2 ( n 1 ) and R 1 ( v ) = 1 , so EWR 1 ( v ) = log 2 ( n 1 ) and NED 1 ( v ) = log 2 ( n 1 ) n 1 .
  • If G = S n and k = 1 , then for the center v: R 1 ( v ) = 0 , while with global degrees p ( 1 ) is uniform so H 1 ( v ) = log 2 ( n 1 ) ; thus EWR 1 ( v ) = 0 and NED 1 ( v ) = 0 . For a leaf w: | N 1 ( w ) | = 1 H 1 ( w ) = 0 and R 1 ( w ) = 0 , hence both metrics are 0.
Proof. 
Both parts follow by direct evaluation of the definitions, using the degree patterns of cliques/stars and the induced subgraphs on N 1 ( · ) .    □

5.5. Stability Bounds Under Local Edits

Theorem 4
(Edit-stability of the density component). Let v V and suppose G k ( v ) changes to G ^ k ( v ) by at most Δ edge edits (additions or deletions) inside the vertex set N k ( v ) (so the neighborhood size stays fixed). Then
R k ( v ) R ^ k ( v ) Δ | N k ( v ) | 2 .
Proof. 
Since the denominator is the same in both densities and the numerator changes by at most Δ , the bound is immediate from the definition of R k .    □
Theorem 5
(Perturbation of the entropy component). Assume N k ( v ) is fixed and degrees change by a vector perturbation δ = ( δ u ) u N k ( v ) (induced or global), with u δ u = 0 and δ 1 2 Δ . Let S = x N k ( v ) d x ( k ) and suppose all probabilities are bounded away from 0 and 1, i.e., min u p u ( k ) ( v ) ϵ for some ϵ > 0 . Then there is a constant C ( ϵ ) > 0 such that
H k ( v ) H ^ k ( v ) C ( ϵ ) Δ S .
Proof. 
Write p u = d u ( k ) / S and p ^ u = ( d u ( k ) + δ u ) / ( S + δ ) = ( d u ( k ) + δ u ) / S . By a first-order Taylor expansion of the Shannon entropy around p,
H ( p ^ ) H ( p ) = u ( p ^ u p u ) log 2 p u + 1 ln 2 + O ( p ^ p 2 2 ) .
Using | p ^ u p u | | δ u | / S and u | δ u | 2 Δ , together with the boundedness of log p u when p u ϵ , the claimed bound follows.    □
Corollary 1
(Edit-stability of EWR and NED). Under the assumptions of the previous two theorems and with | N k ( v ) | 2 ,
EWR k ( v ) EWR ^ k ( v ) | H k H ^ k | R k + H ^ k | R k R ^ k | = O Δ S + O Δ | N k | 2 ,
and similarly for NED k with an extra factor 1 / | N k ( v ) | .

5.6. Non-Monotonicity Examples in k

Proposition 1.
There exist connected graphs G, vertices v, and integers k such that EWR k + 1 ( v ) < EWR k ( v ) and others with EWR k + 1 ( v ) > EWR k ( v ) . The same holds for NED k .
Proof. 
Attach to a dense core around v a sparse ring at distance k + 1 : moving from k to k + 1 increases entropy (new degree values) but can decrease density substantially, making the product smaller. Conversely, attach at distance k + 1 a dense cluster with near-uniform local degrees to increase both entropy and density, making the product larger.    □

6. Topology Analysis

In order to comprehensively evaluate the proposed hybrid entropy-based metrics, a diverse set of graph families encompassing both classical network models and specialized quantum processor connectivity architectures is considered. This dual selection enables the assessment of metric behavior in well-understood synthetic environments as well as in practically relevant engineered topologies.
Erdős–Rényi (ER) Graphs. The G ( n , p ) model introduced by Erdős and Rényi [27] generates graphs by connecting each pair of n nodes with probability p independently. These graphs serve as a baseline for random structures with binomial degree distribution and minimal clustering, allowing the observation of metric behavior in the absence of strong local patterns.
Barabási–Albert (BA) Graphs. The BA preferential attachment model [28] produces scale-free networks with a heavy-tailed degree distribution. Such networks exhibit hub nodes with a disproportionately high degree, making them suitable for testing whether EWR and NED can detect subtle differences among nodes with similar degree but different neighborhood diversity.
Watts–Strogatz (WS) Graphs. The WS small-world model [29] interpolates between regular lattices and random graphs by rewiring edges with probability β . It exhibits high clustering and short average path lengths, enabling the analysis of metric sensitivity to densely interconnected k-hop neighborhoods.
Random Geometric Graphs (RGG). In RGGs [30], nodes are distributed uniformly in a metric space and edges connect pairs within a fixed radius. This spatial constraint induces high local clustering and locality-based structural patterns, providing a natural testbed for metrics in physically embedded networks.
Zephyr. The Zephyr architecture [18,31] represents the latest generation of D-Wave connectivity, further increasing local density and neighborhood overlap. It is expected to amplify the discriminative capacity of EWR and NED, particularly for bridge qubits in critical zones.
By combining classical and quantum topologies, the evaluation covers a broad spectrum of degree distributions, clustering characteristics, and structural redundancies. This enables a more complete understanding of the strengths and limitations of hybrid entropy-based metrics.

6.1. Erdős–Rényi Random Graph Analysis

To evaluate the performance of the proposed metrics in a homogeneous and well-studied setting, an ER random graph G ( n , p ) with n = 1000 nodes and edge probability p = 0.01 was generated. This configuration yields a sparse network with expected average degree k 10 , well above the percolation threshold, ensuring the presence of a giant connected component (GCC). The ER model serves as a baseline due to its lack of structural bias, enabling a controlled comparison of metric sensitivity and discriminative power.
Figure 1 presents the distributions of EWR and NED for k = 2 . EWR values are spread over a wider range (≈ [ 0.12 , 0.3 ] ), providing higher discriminative power between nodes. NED values are heavily concentrated near zero, indicating limited differentiation in this homogeneous network.
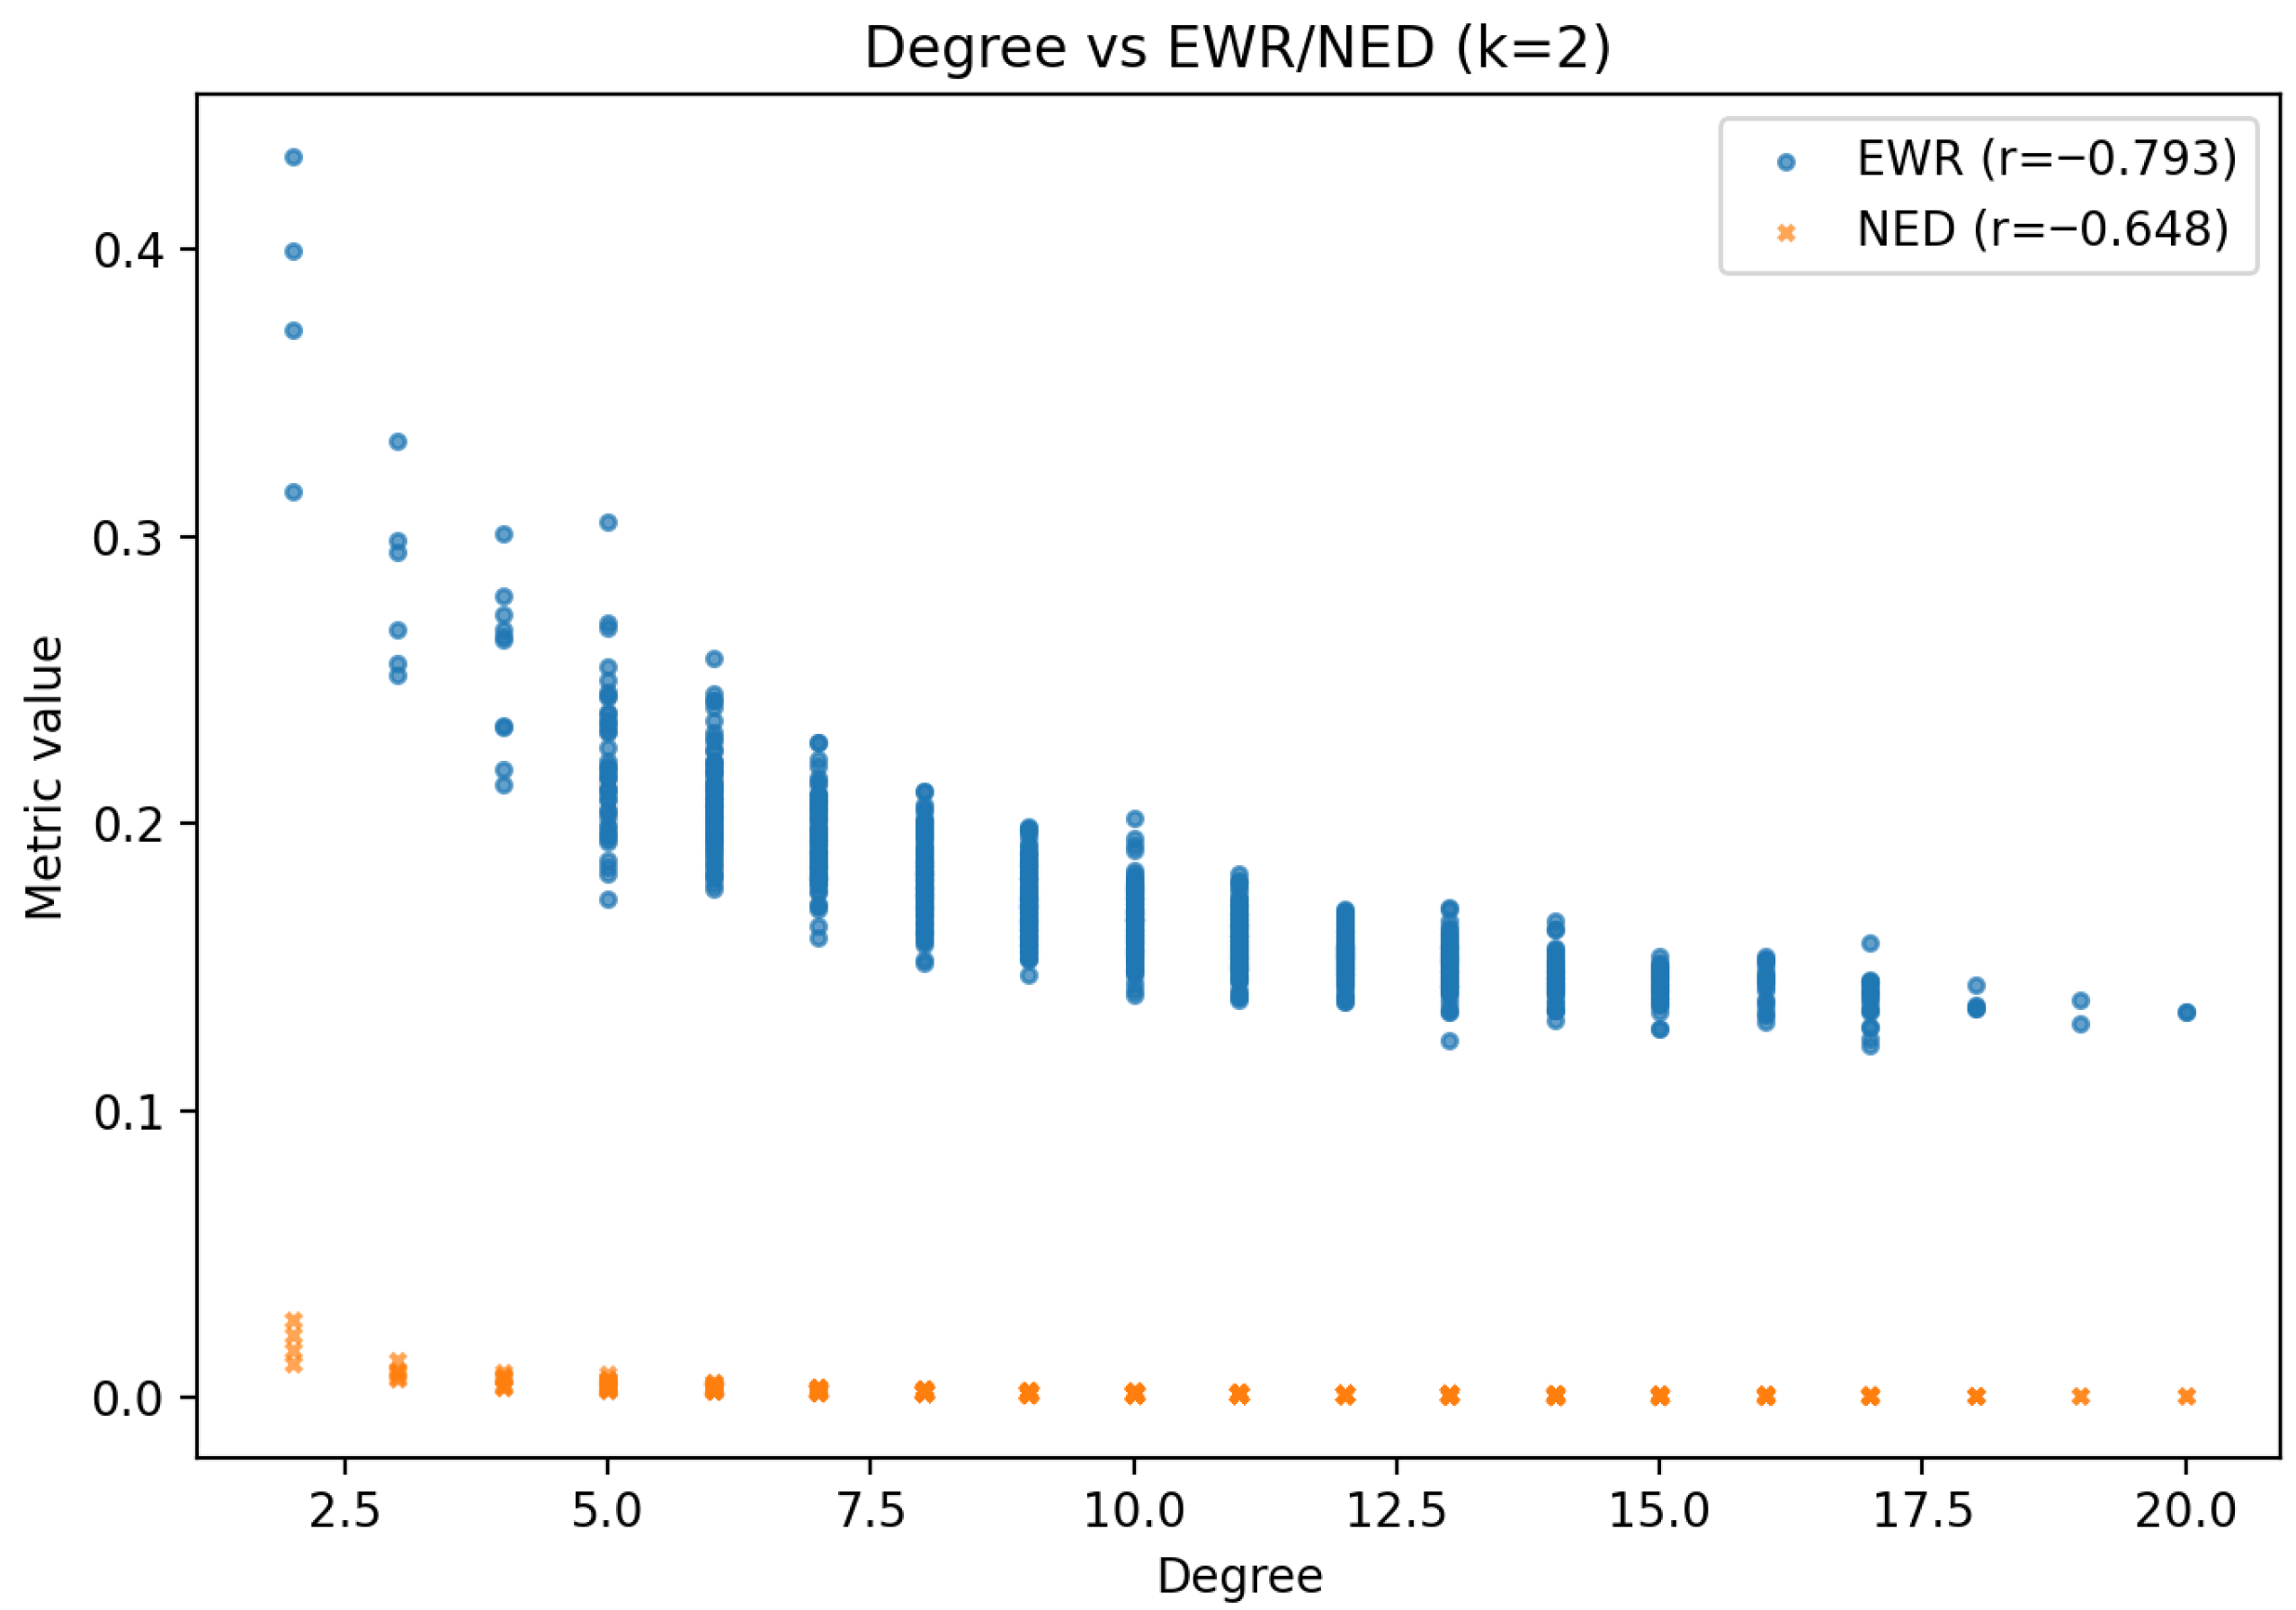
Figure 2 and Figure 3 show the relationship between the proposed metrics and classical centrality measures. Both EWR and NED are negatively correlated with node degree (EWR: r = 0.793 , NED: r = 0.648 ), highlighting a bias towards lower-degree nodes. Correlation with betweenness is moderate to strong negative (EWR: r = 0.602 , NED: r = 0.457 ), suggesting that the metrics capture complementary structural roles to those reflected by betweenness centrality.
To assess robustness, a 1% random edge perturbation was applied and the original and perturbed metric values were compared (Figure 4). The Pearson correlations were very high (EWR: r = 0.980 , NED: r = 0.961 ), confirming strong stability under small structural changes. EWR exhibited slightly higher robustness than NED.
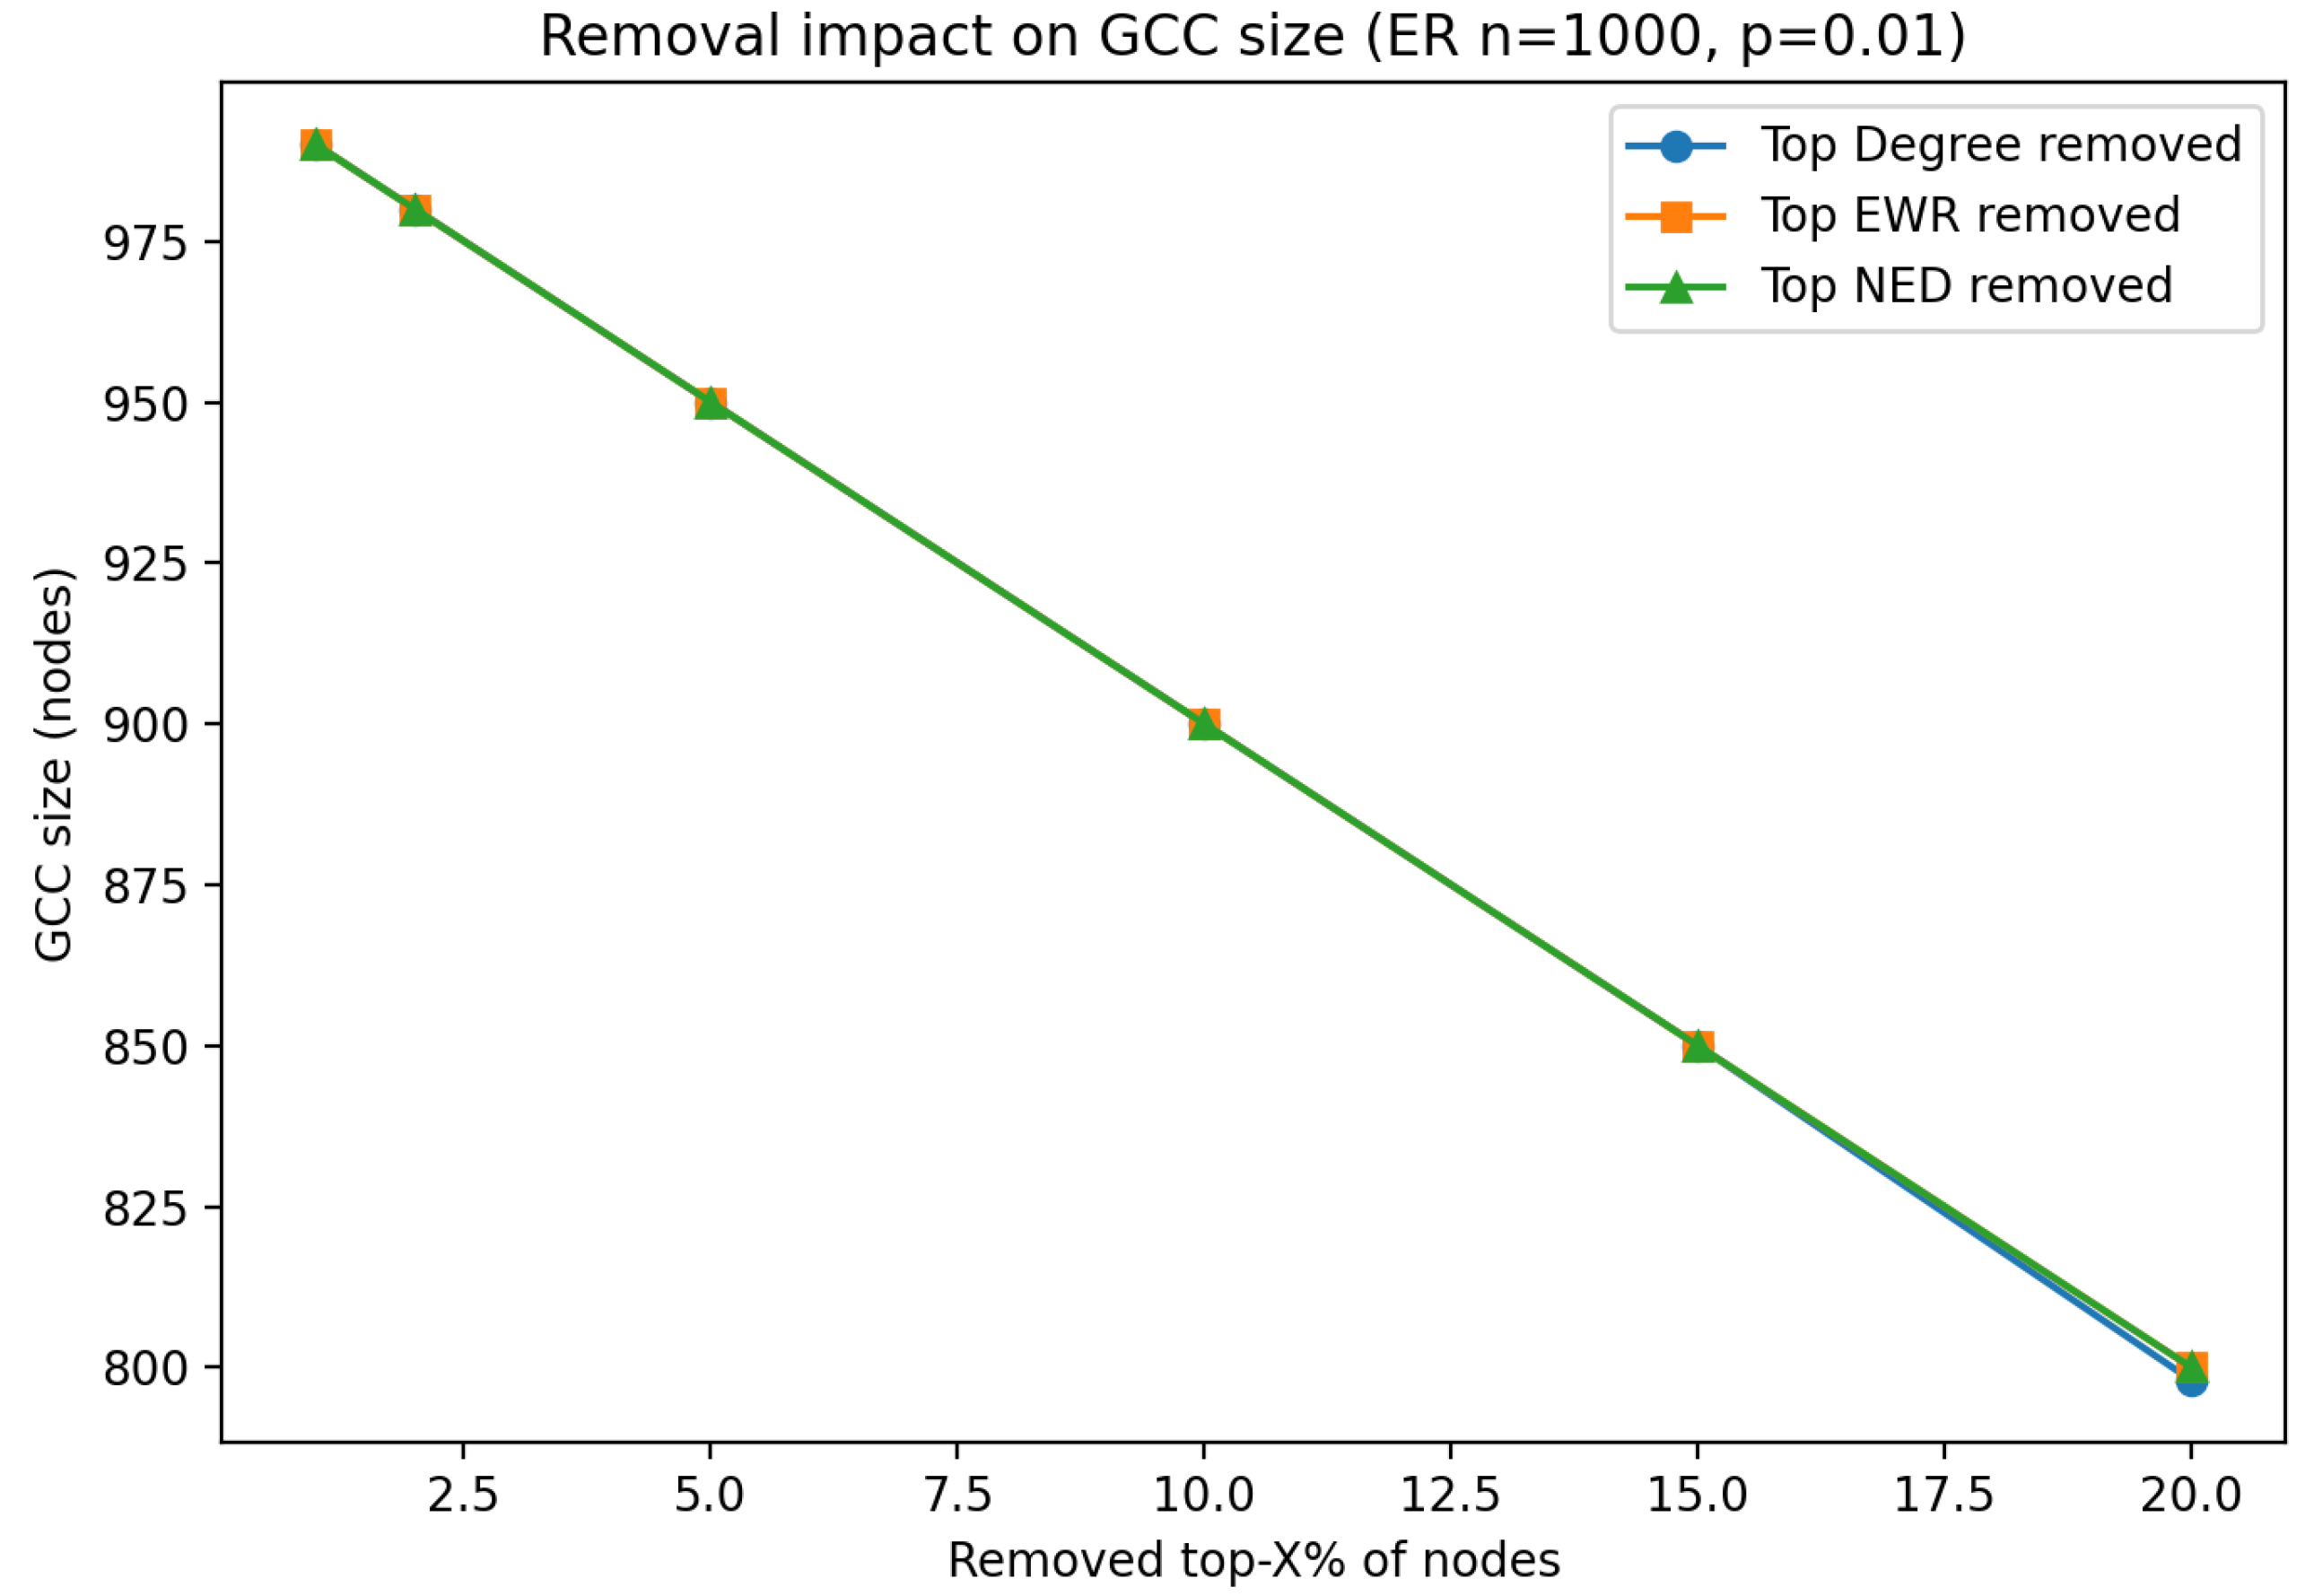
In a targeted attack scenario, nodes were removed in decreasing order of metric value (and degree for comparison), and the size of the GCC was measured (Figure 5). The removal curves for degree, EWR, and NED are nearly identical, indicating similar efficiency in fragmenting the network. This behavior is expected in ER networks due to their uniform degree distribution.
Overall, both EWR and NED demonstrate high stability and strong negative correlation with degree, favoring lower-degree nodes in this homogeneous setting. EWR offers a broader value range and slightly better correlation with classical centrality measures, suggesting higher discriminative capability. However, due to the ER model’s structural uniformity, both metrics show similar performance in node removal experiments, indicating that their differences may become more pronounced in heterogeneous networks.

6.2. Barabási–Albert Graph Analysis

The BA test network was generated with n = 1000 nodes, m = 3 edges attached by each new node, and random seed 42. This preferential-attachment mechanism produces a scale-free topology with a heavy-tailed degree distribution: a small number of hubs coexist with many low-degree peripheral nodes. The expected average degree is ≈6, and the network typically exhibits low clustering and slightly negative assortativity.
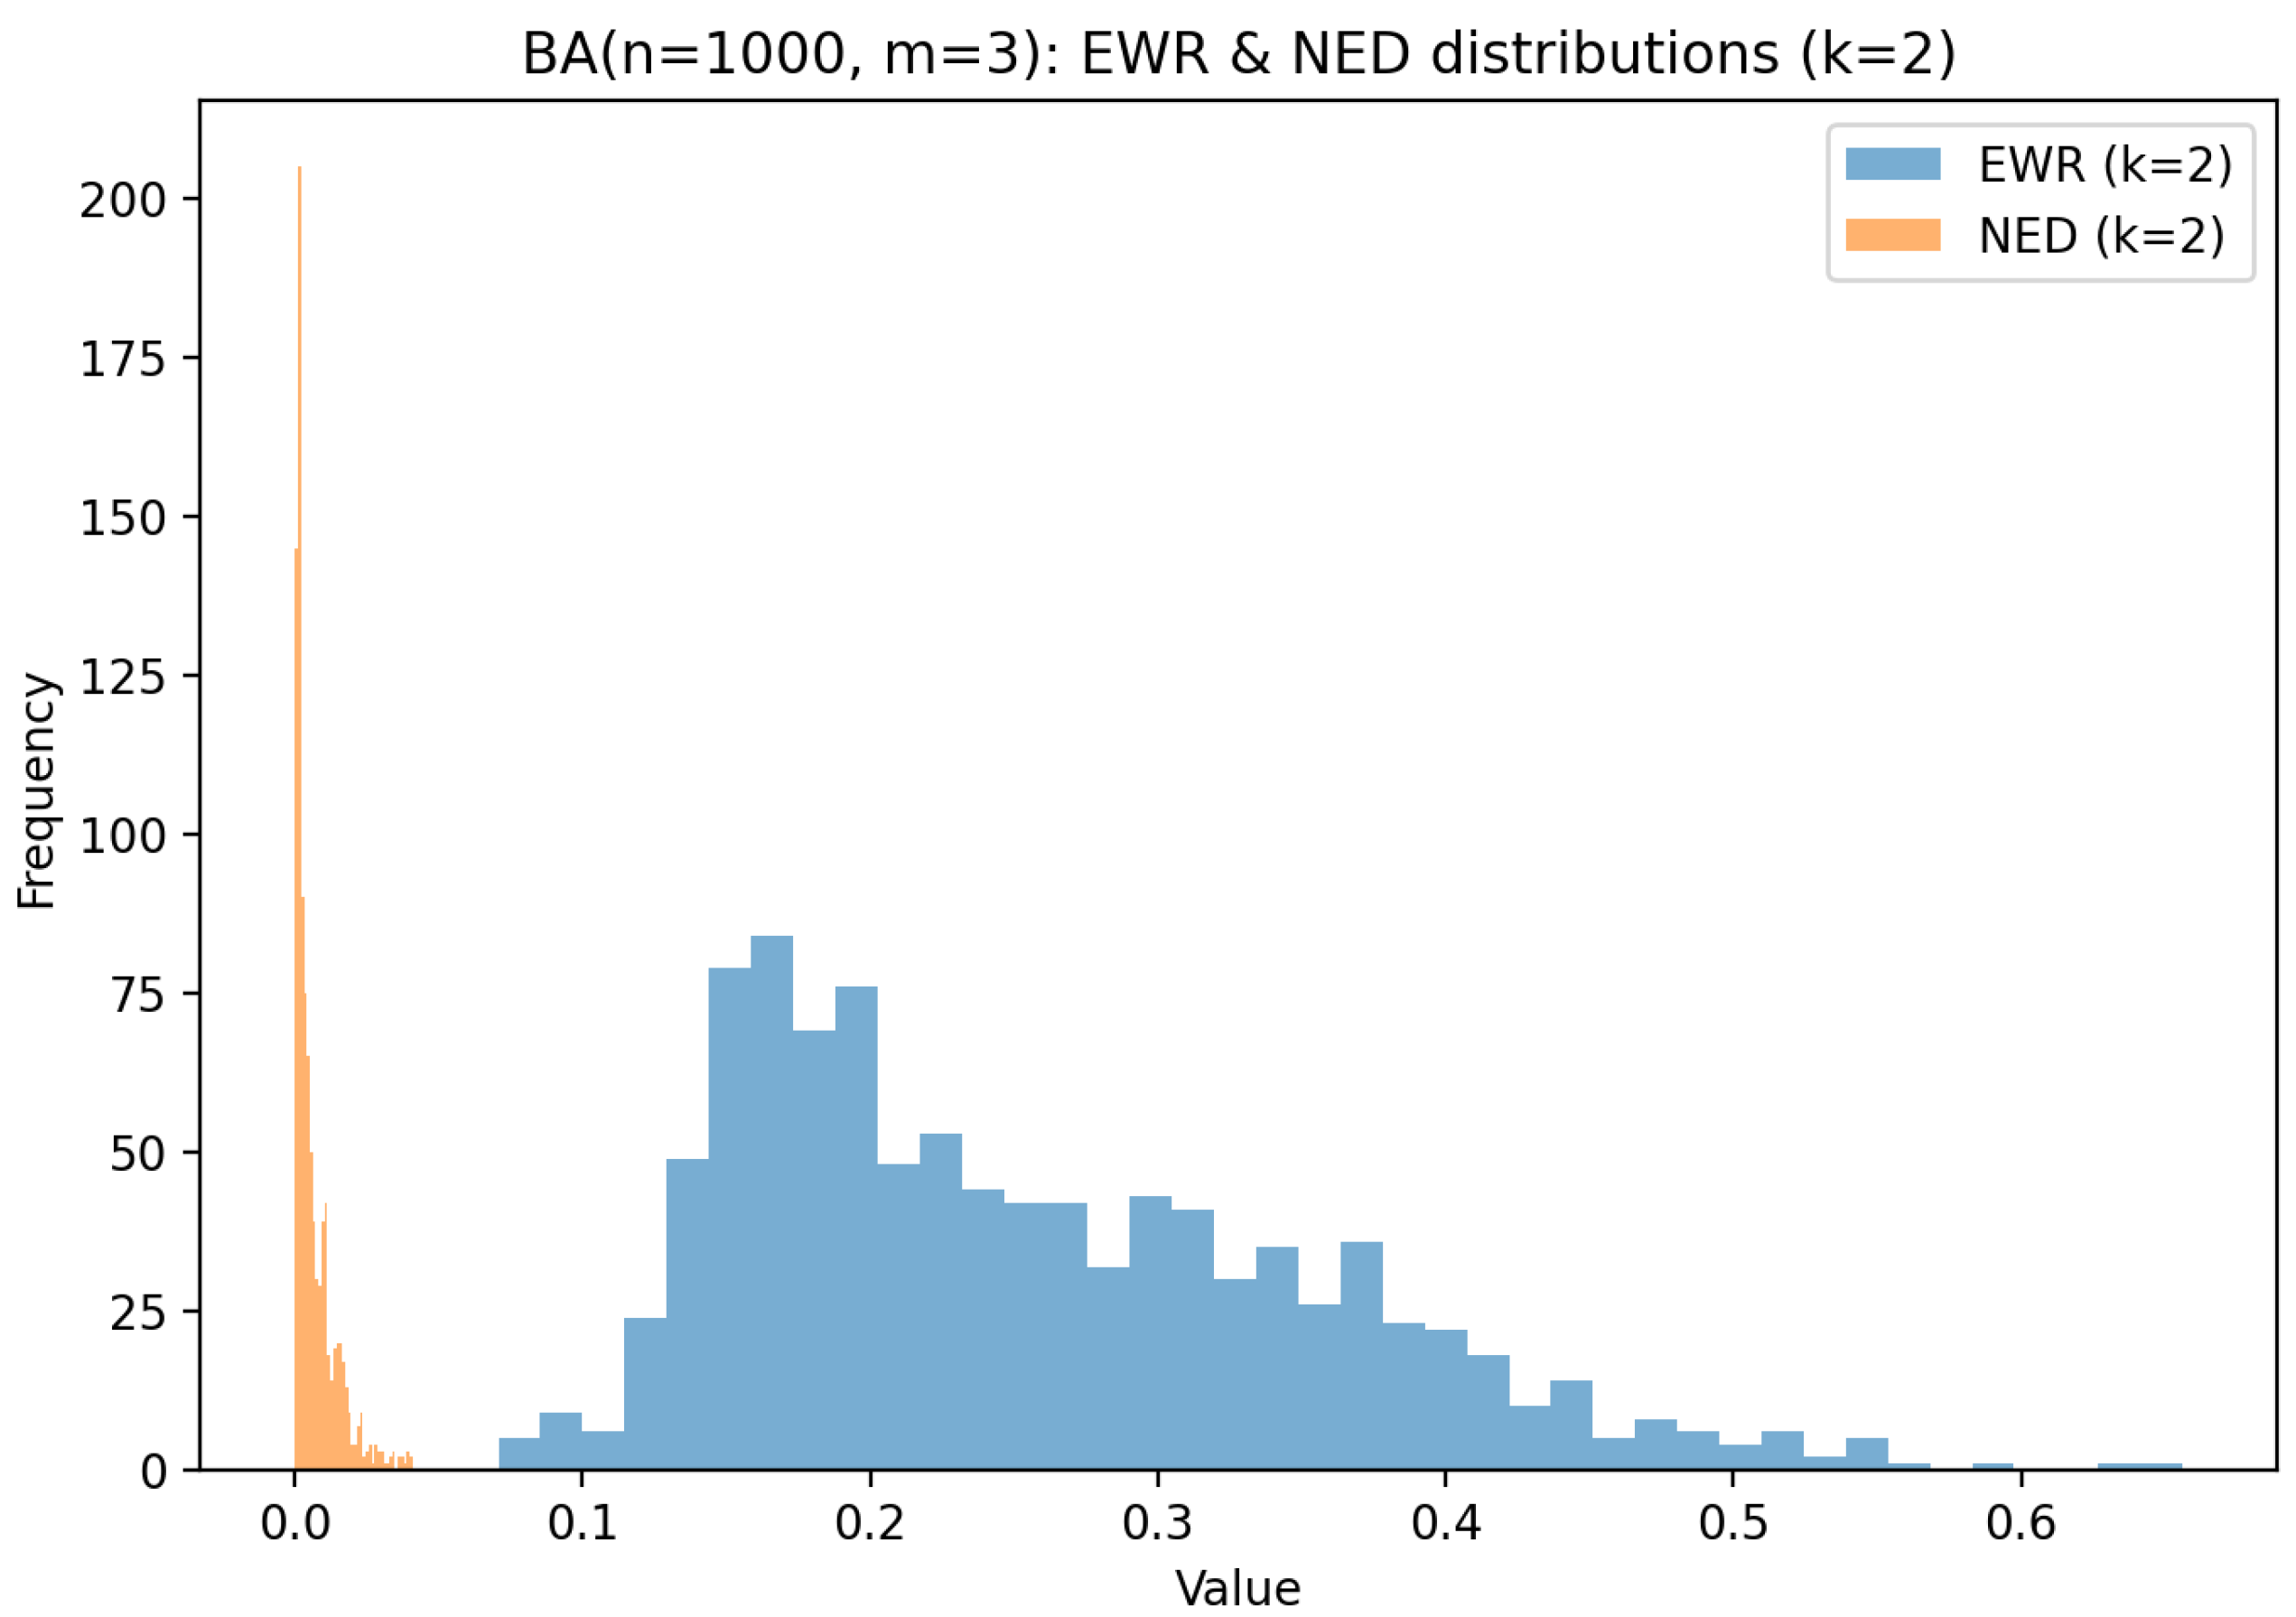
Figure 6 shows the distributions of the EWR and the NED metrics for k = 2 . The EWR values span a wide range (≈0.10–0.40) with a long right tail up to ≈0.65, reflecting heterogeneous k-hop neighborhoods. In contrast, NED values are concentrated in a very narrow range (0–0.03), indicating that many 2-hop neighborhoods are dominated by one degree class (e.g., a hub with many degree-1 leaves), yielding low local density entropy.
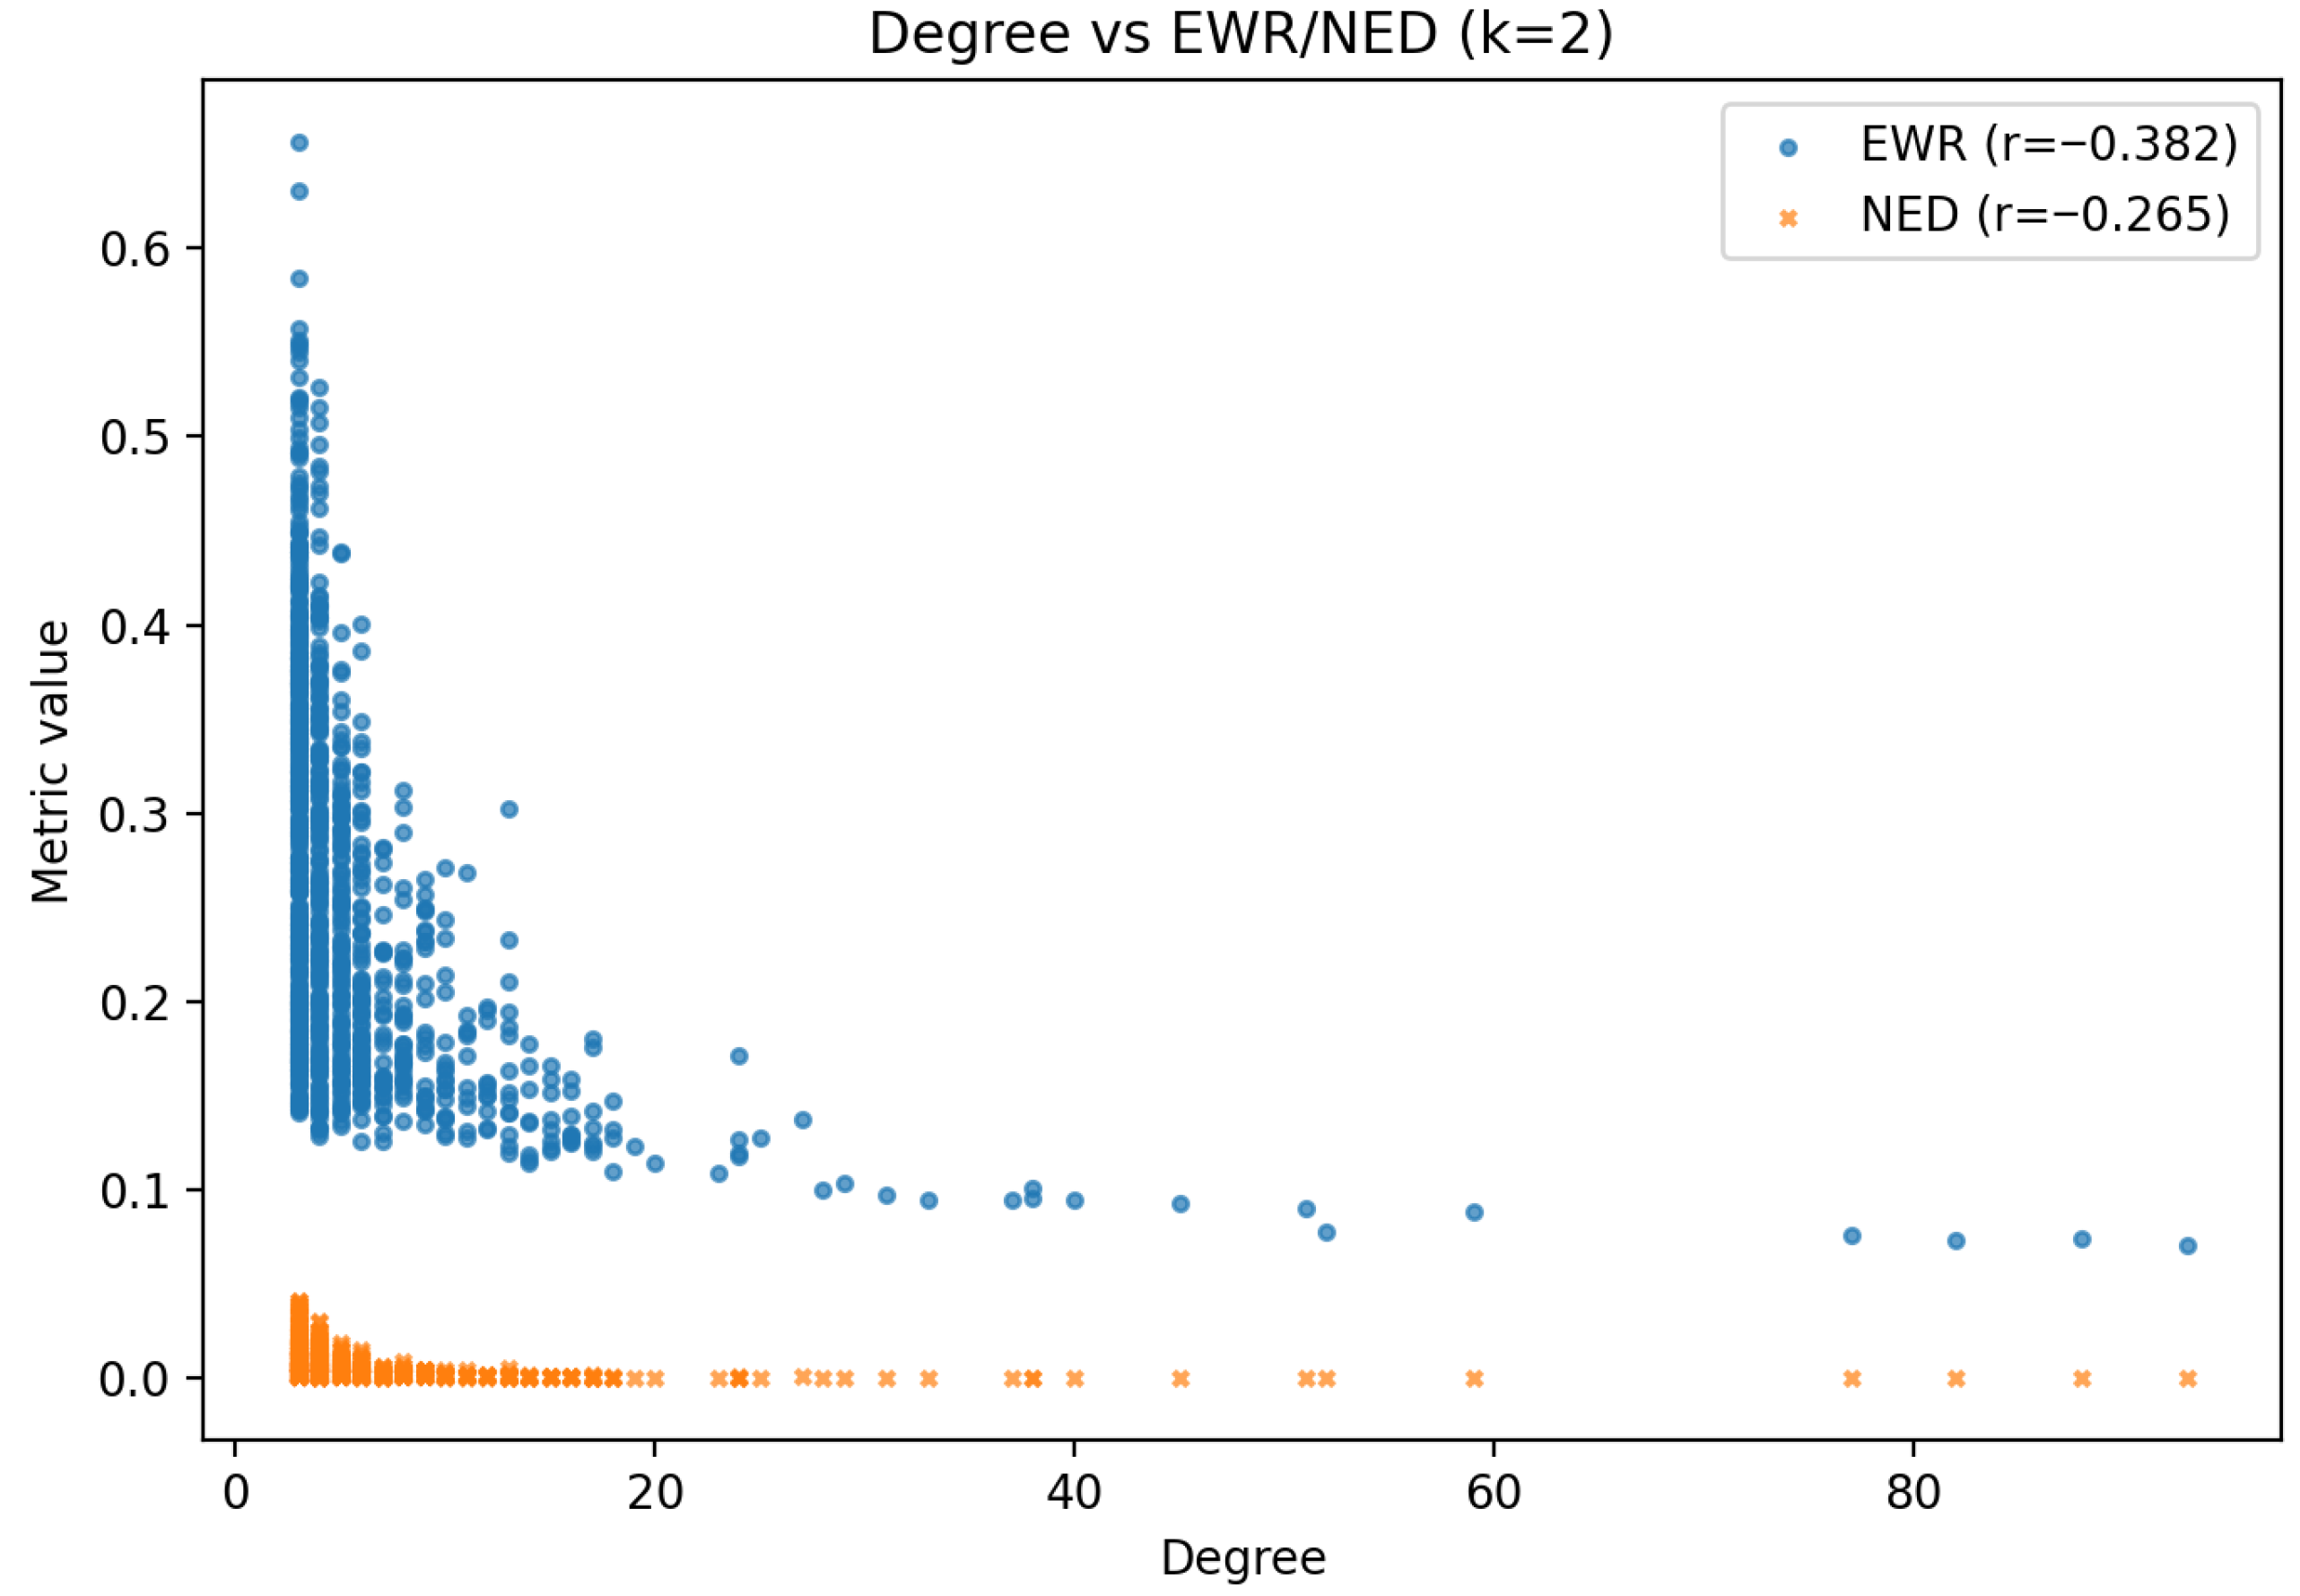
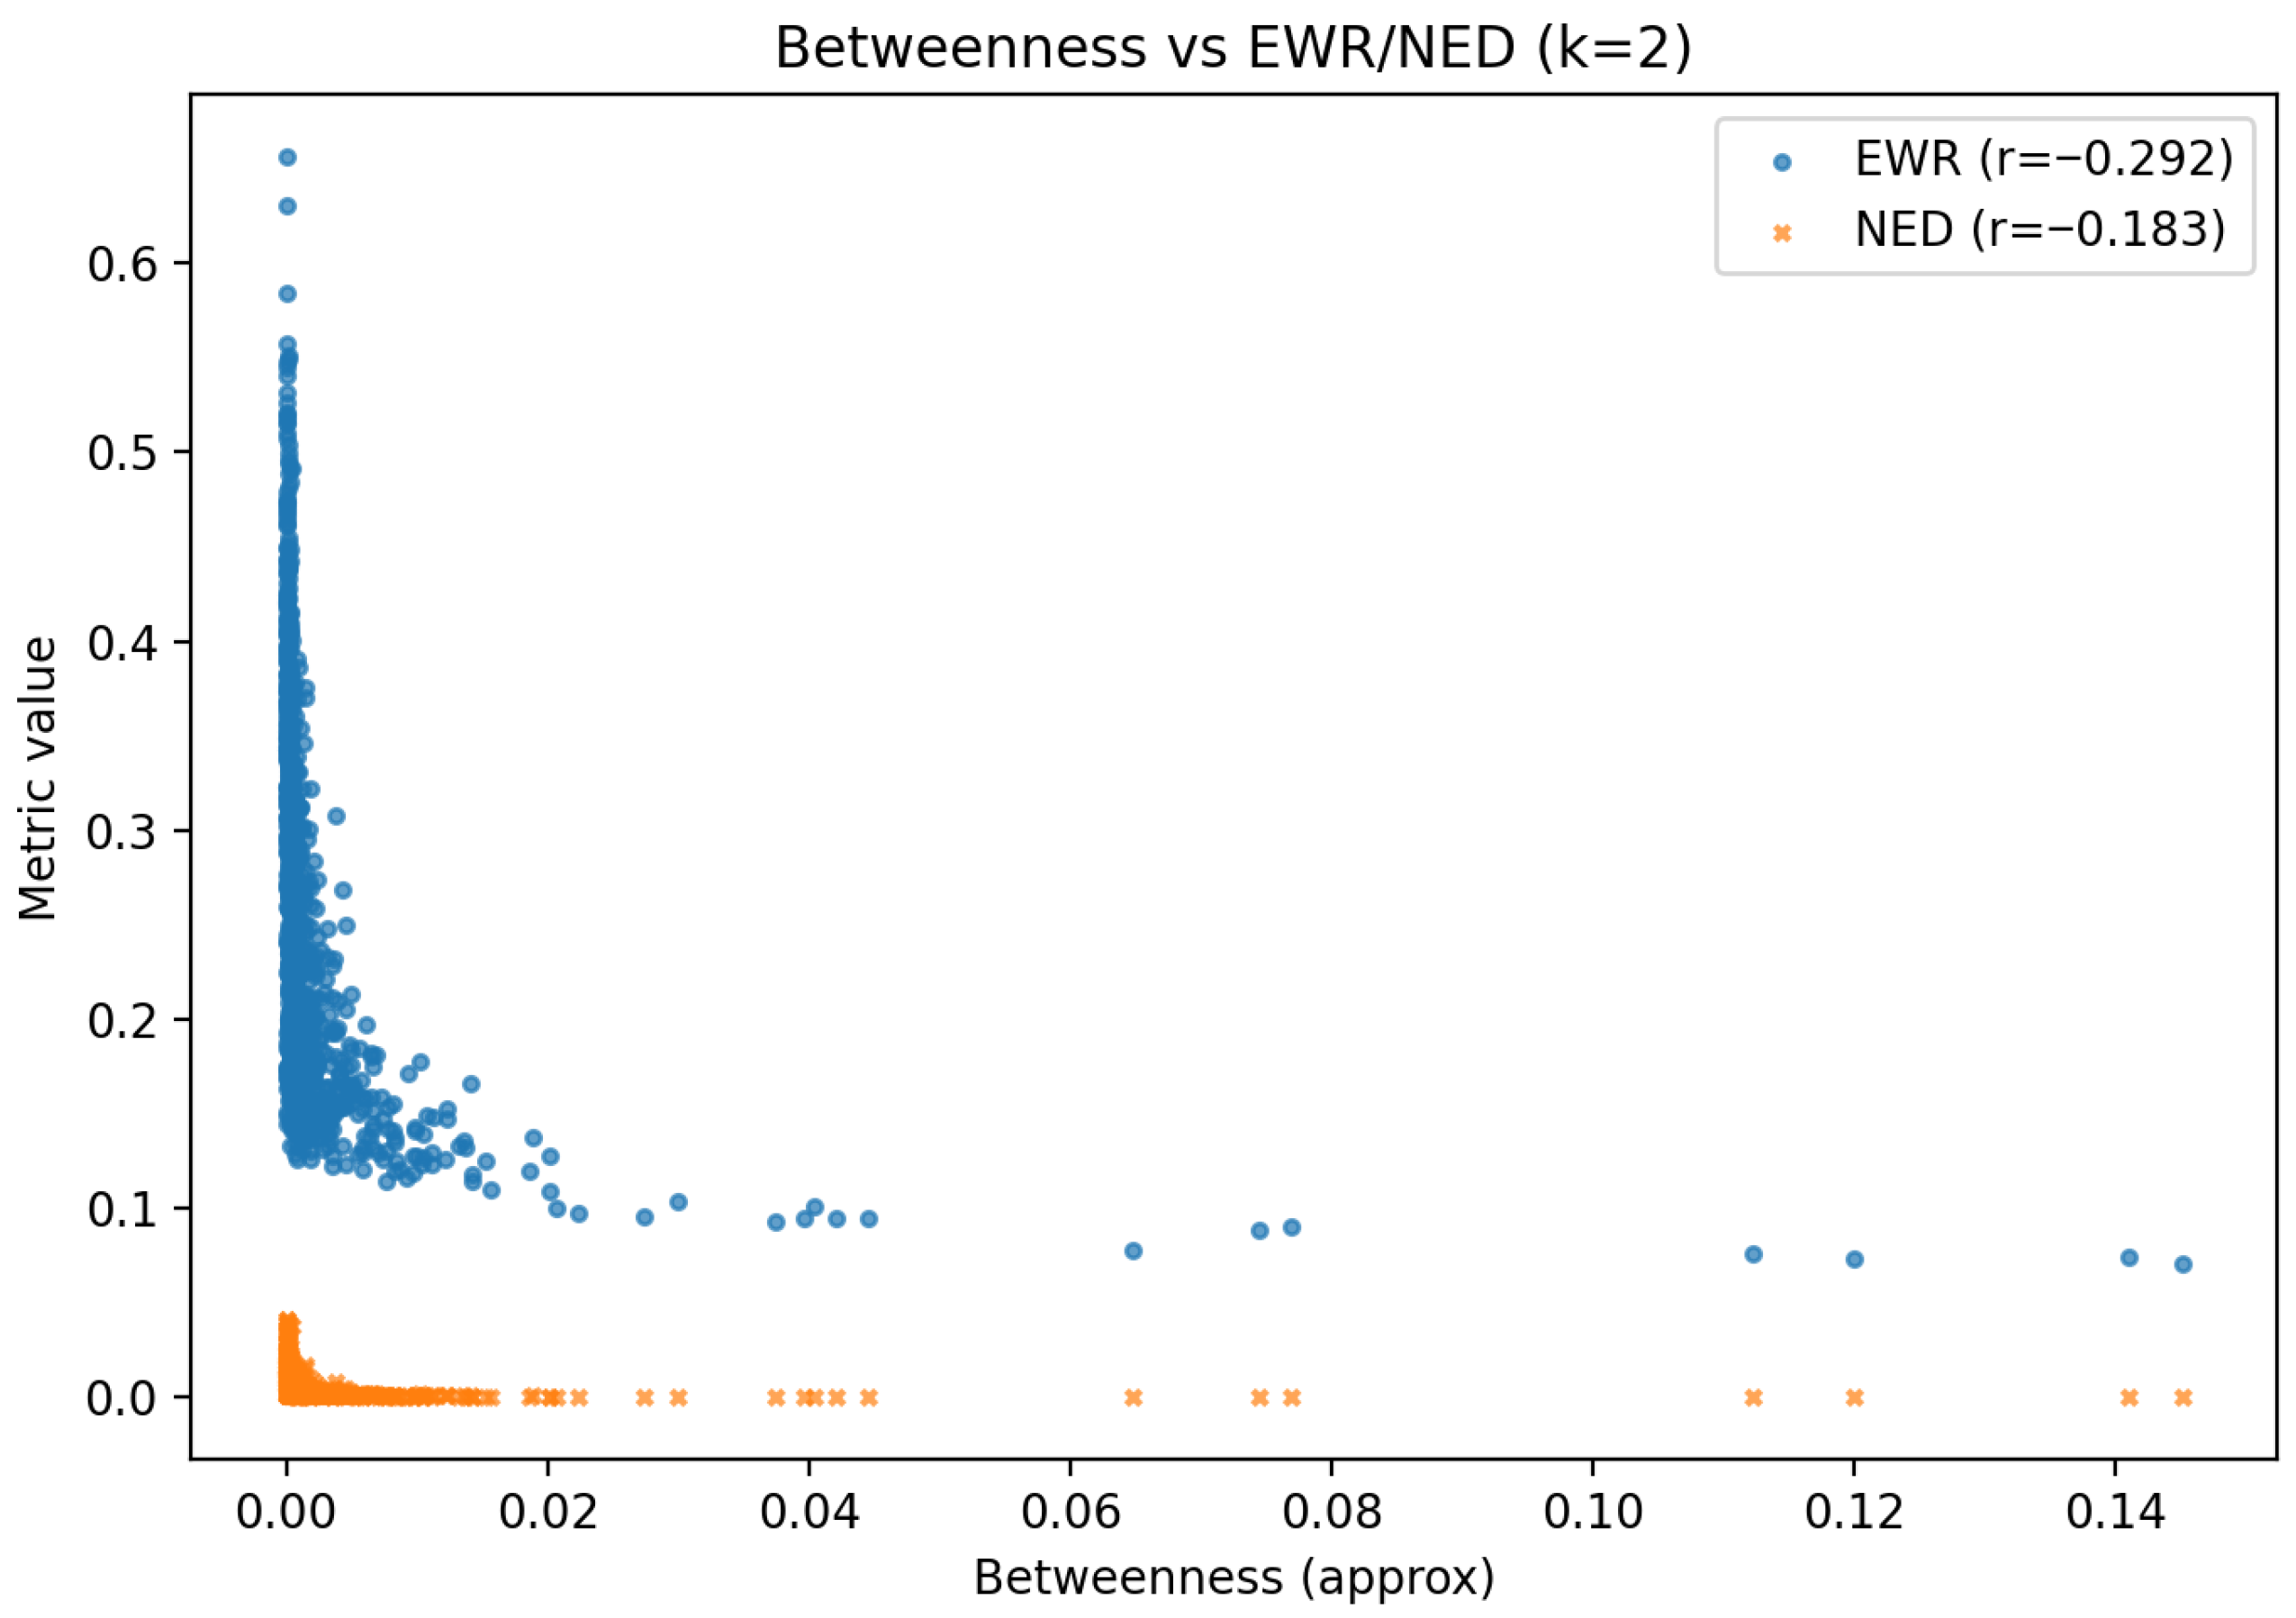
As shown in Figure 7, EWR exhibits a negative correlation with degree ( r = 0.382 ), and NED also correlates negatively ( r = 0.265 ). High-degree hubs tend to have low metric values due to their homogeneous local neighborhoods. Figure 8 shows a similar pattern for betweenness centrality, with correlations r = 0.292 (EWR) and r = 0.183 (NED). This suggests that the metrics are not hub detectors but instead capture local structural heterogeneity.
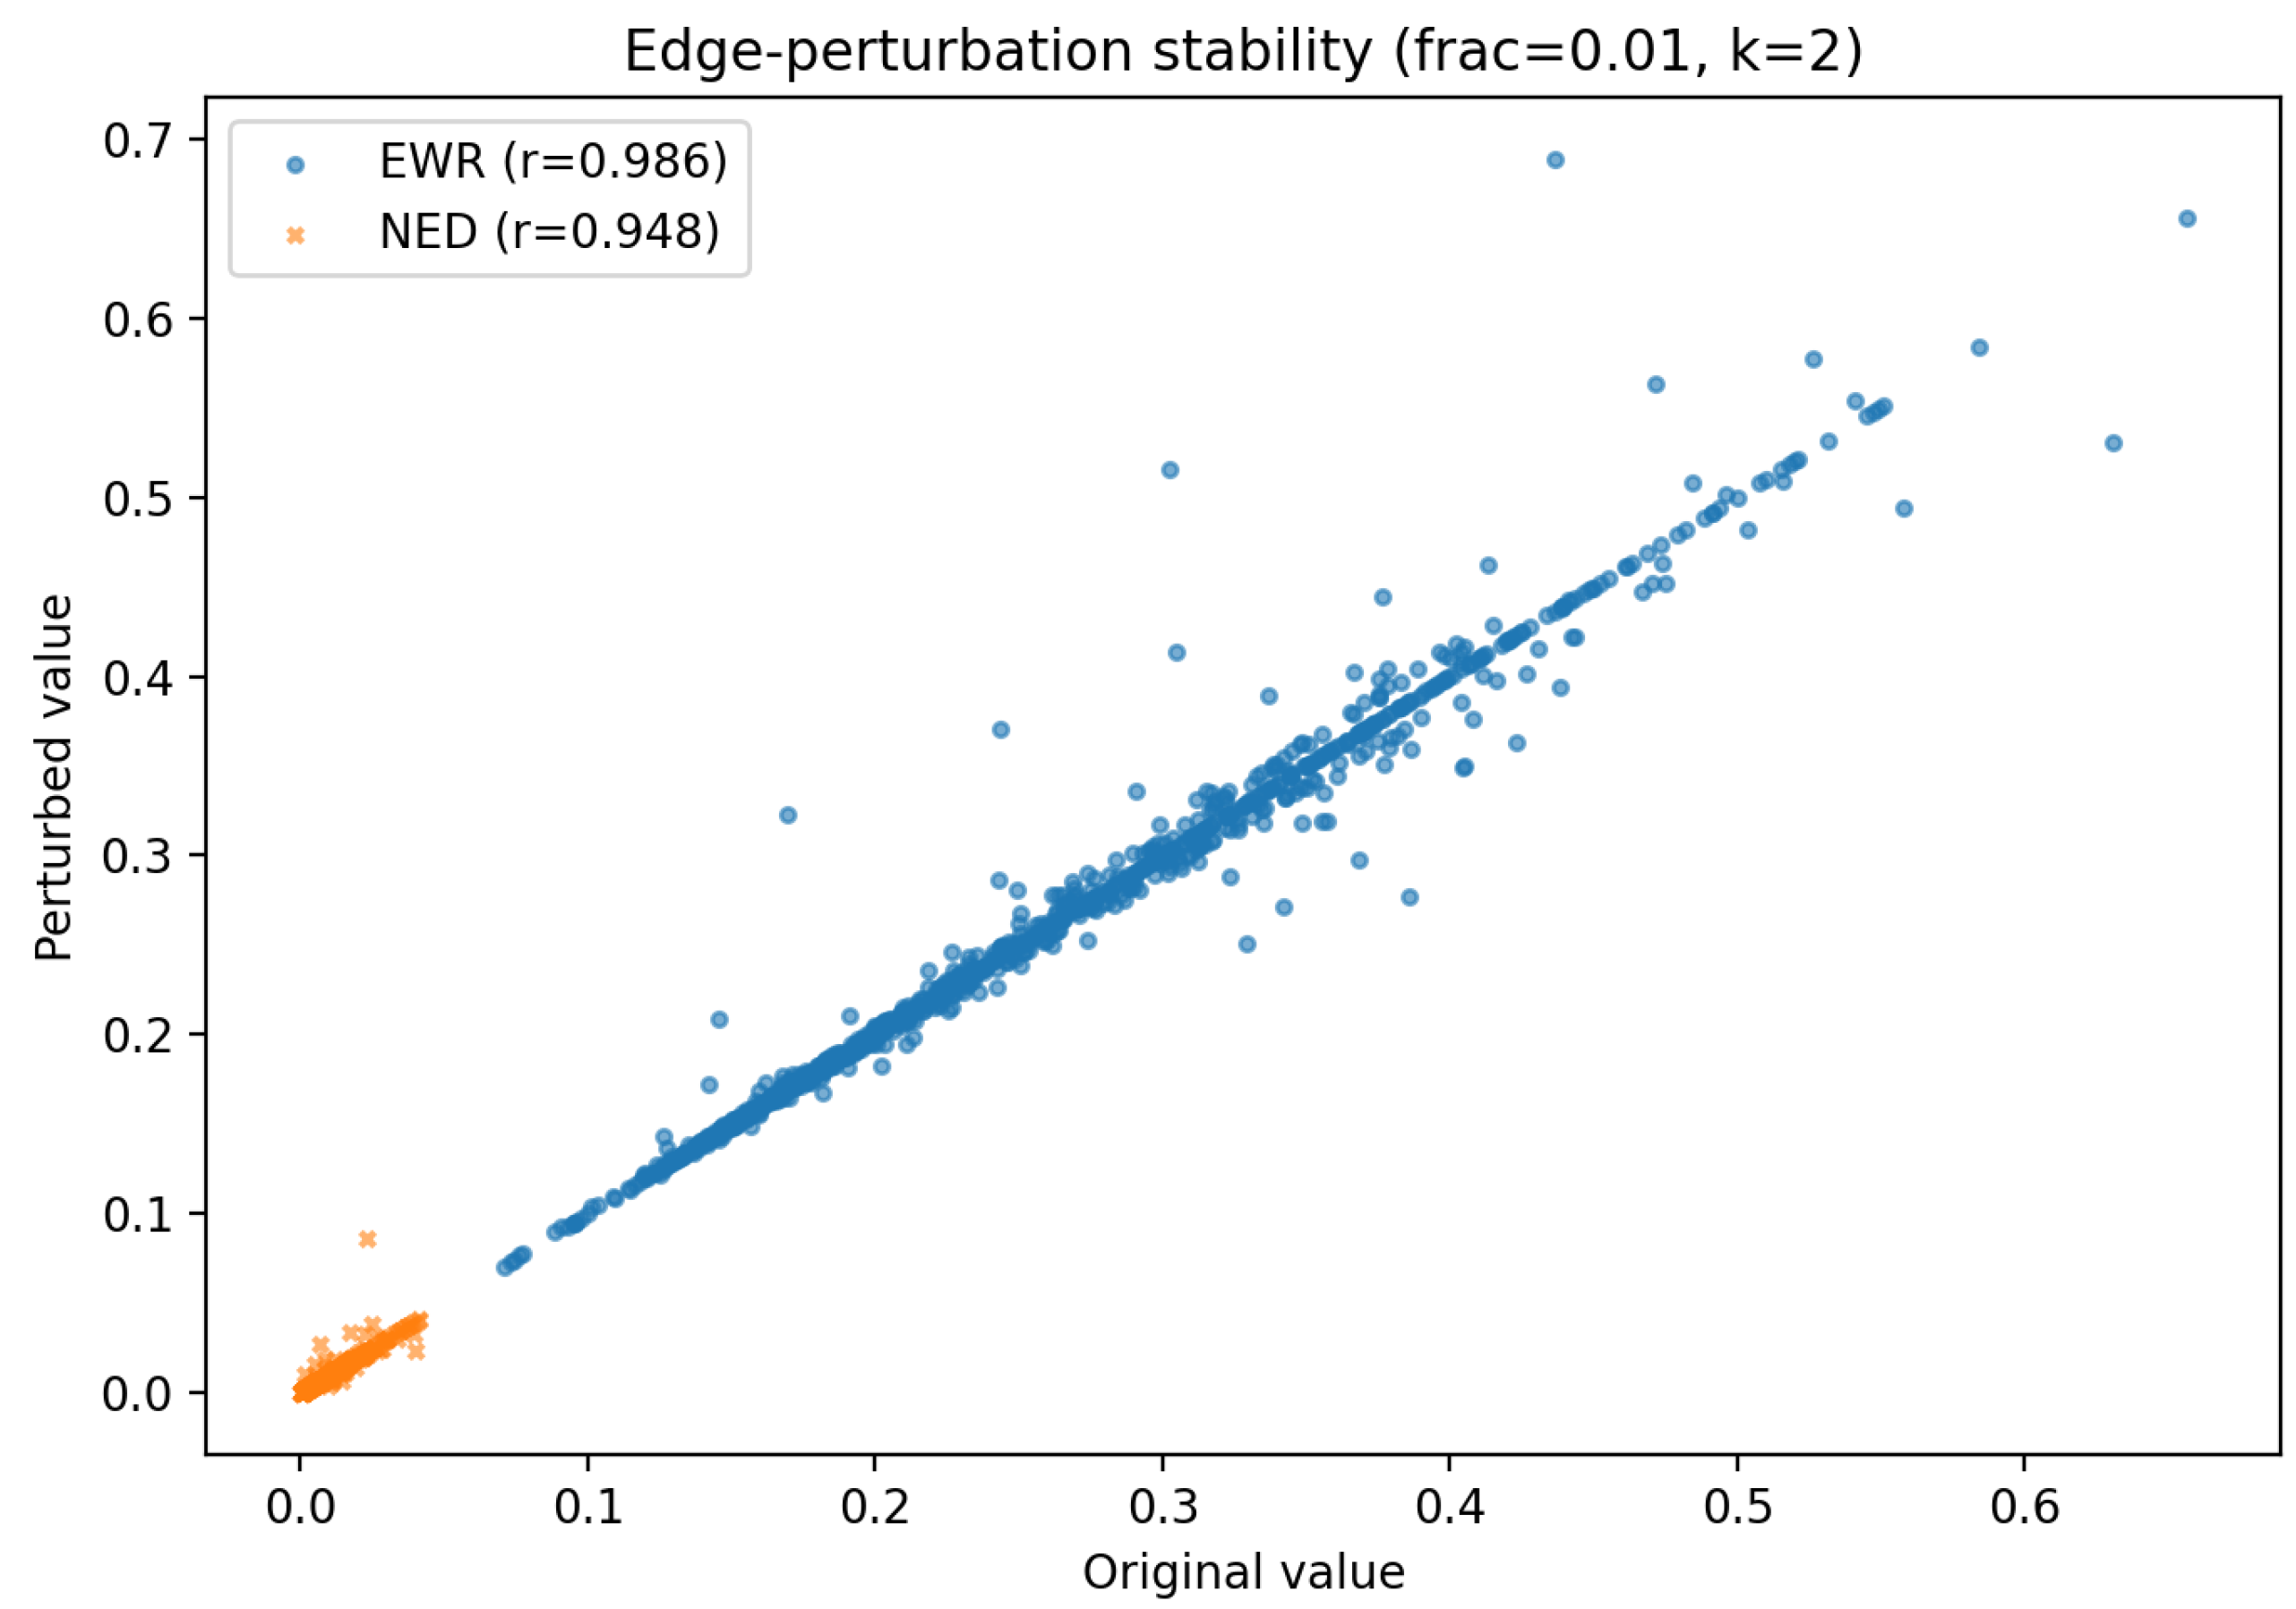
Figure 9 depicts the robustness of the metrics under small random perturbations, where 1 % of edges are randomly rewired. Both metrics remain highly stable, with Pearson correlations r = 0.986 (EWR) and r = 0.948 (NED) between the original and perturbed values, indicating strong resilience to minor topological noise.
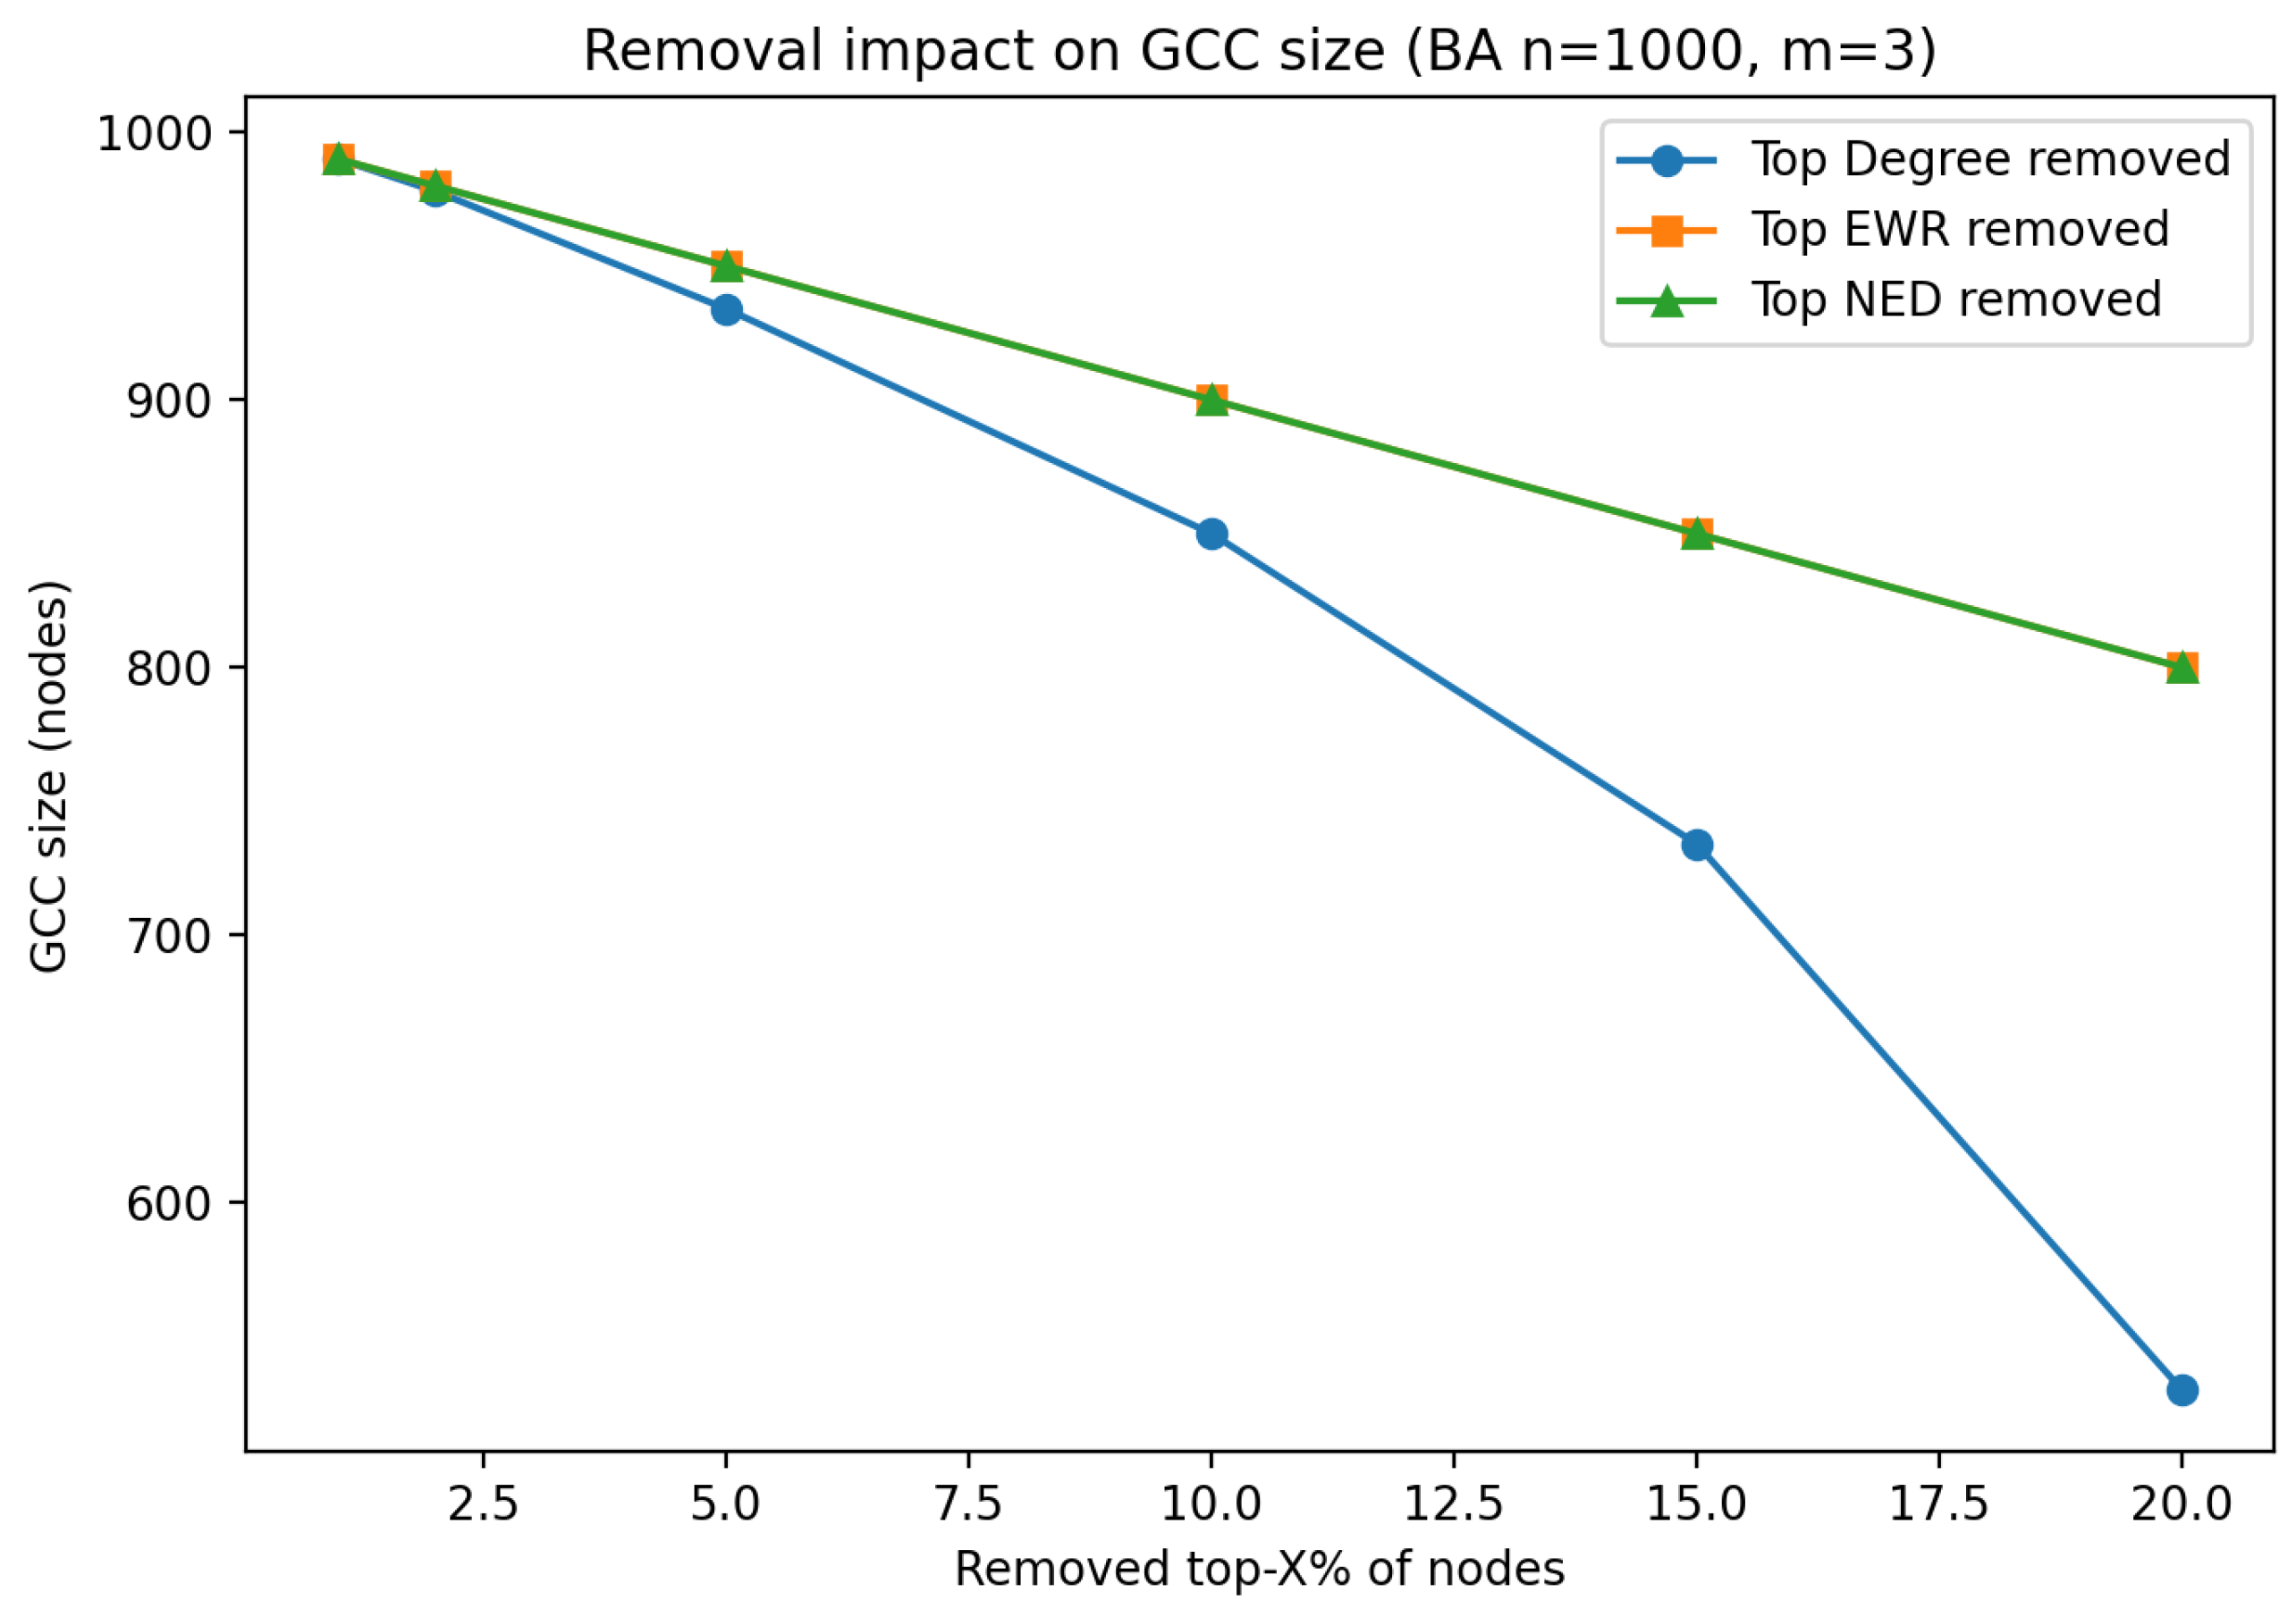
Figure 10 presents the effect of targeted removal of the top- X % of nodes ranked by degree, EWR, or NED, on the size of the largest connected component (GCC). Degree-based removal rapidly fragments the network, consistent with the hub-dominated nature of BA graphs. EWR- and NED-based removals produce nearly identical curves, with a much slower GCC reduction, suggesting that these metrics prioritize structurally diverse intermediate nodes rather than hubs.
The empirical evaluation highlights several distinctive properties of the proposed hybrid entropy-based metrics. The EWR measure exhibits pronounced sensitivity to local structural heterogeneity, enabling the discrimination between highly uniform hub-centered neighborhoods and more compositionally diverse intermediate regions. In contrast to classical centrality measures, elevated EWR and NED values are predominantly observed for vertices embedded in mixed-degree environments rather than high-degree hubs. Both metrics demonstrate substantial robustness under small-scale random perturbations, underscoring their stability in the presence of stochastic fluctuations or network noise. Furthermore, EWR- and NED-based rankings systematically identify alternative sets of structurally critical vertices compared to degree-oriented approaches, thereby offering complementary insights into network robustness and structural vulnerability.

6.3. Watts–Strogatz Small-World Graph Analysis

The proposed metrics are evaluated on a WS small-world network with parameters n = 1000 , k = 6 , and rewiring probability β = 0.1 . This topology is characterized by a high clustering coefficient and short average path lengths, making it a realistic model for many social, biological, and technological systems [29]. The combination of local regularity and a small number of long-range shortcuts offers a challenging environment for node-importance metrics, as structural redundancy can mask the influence of certain nodes.
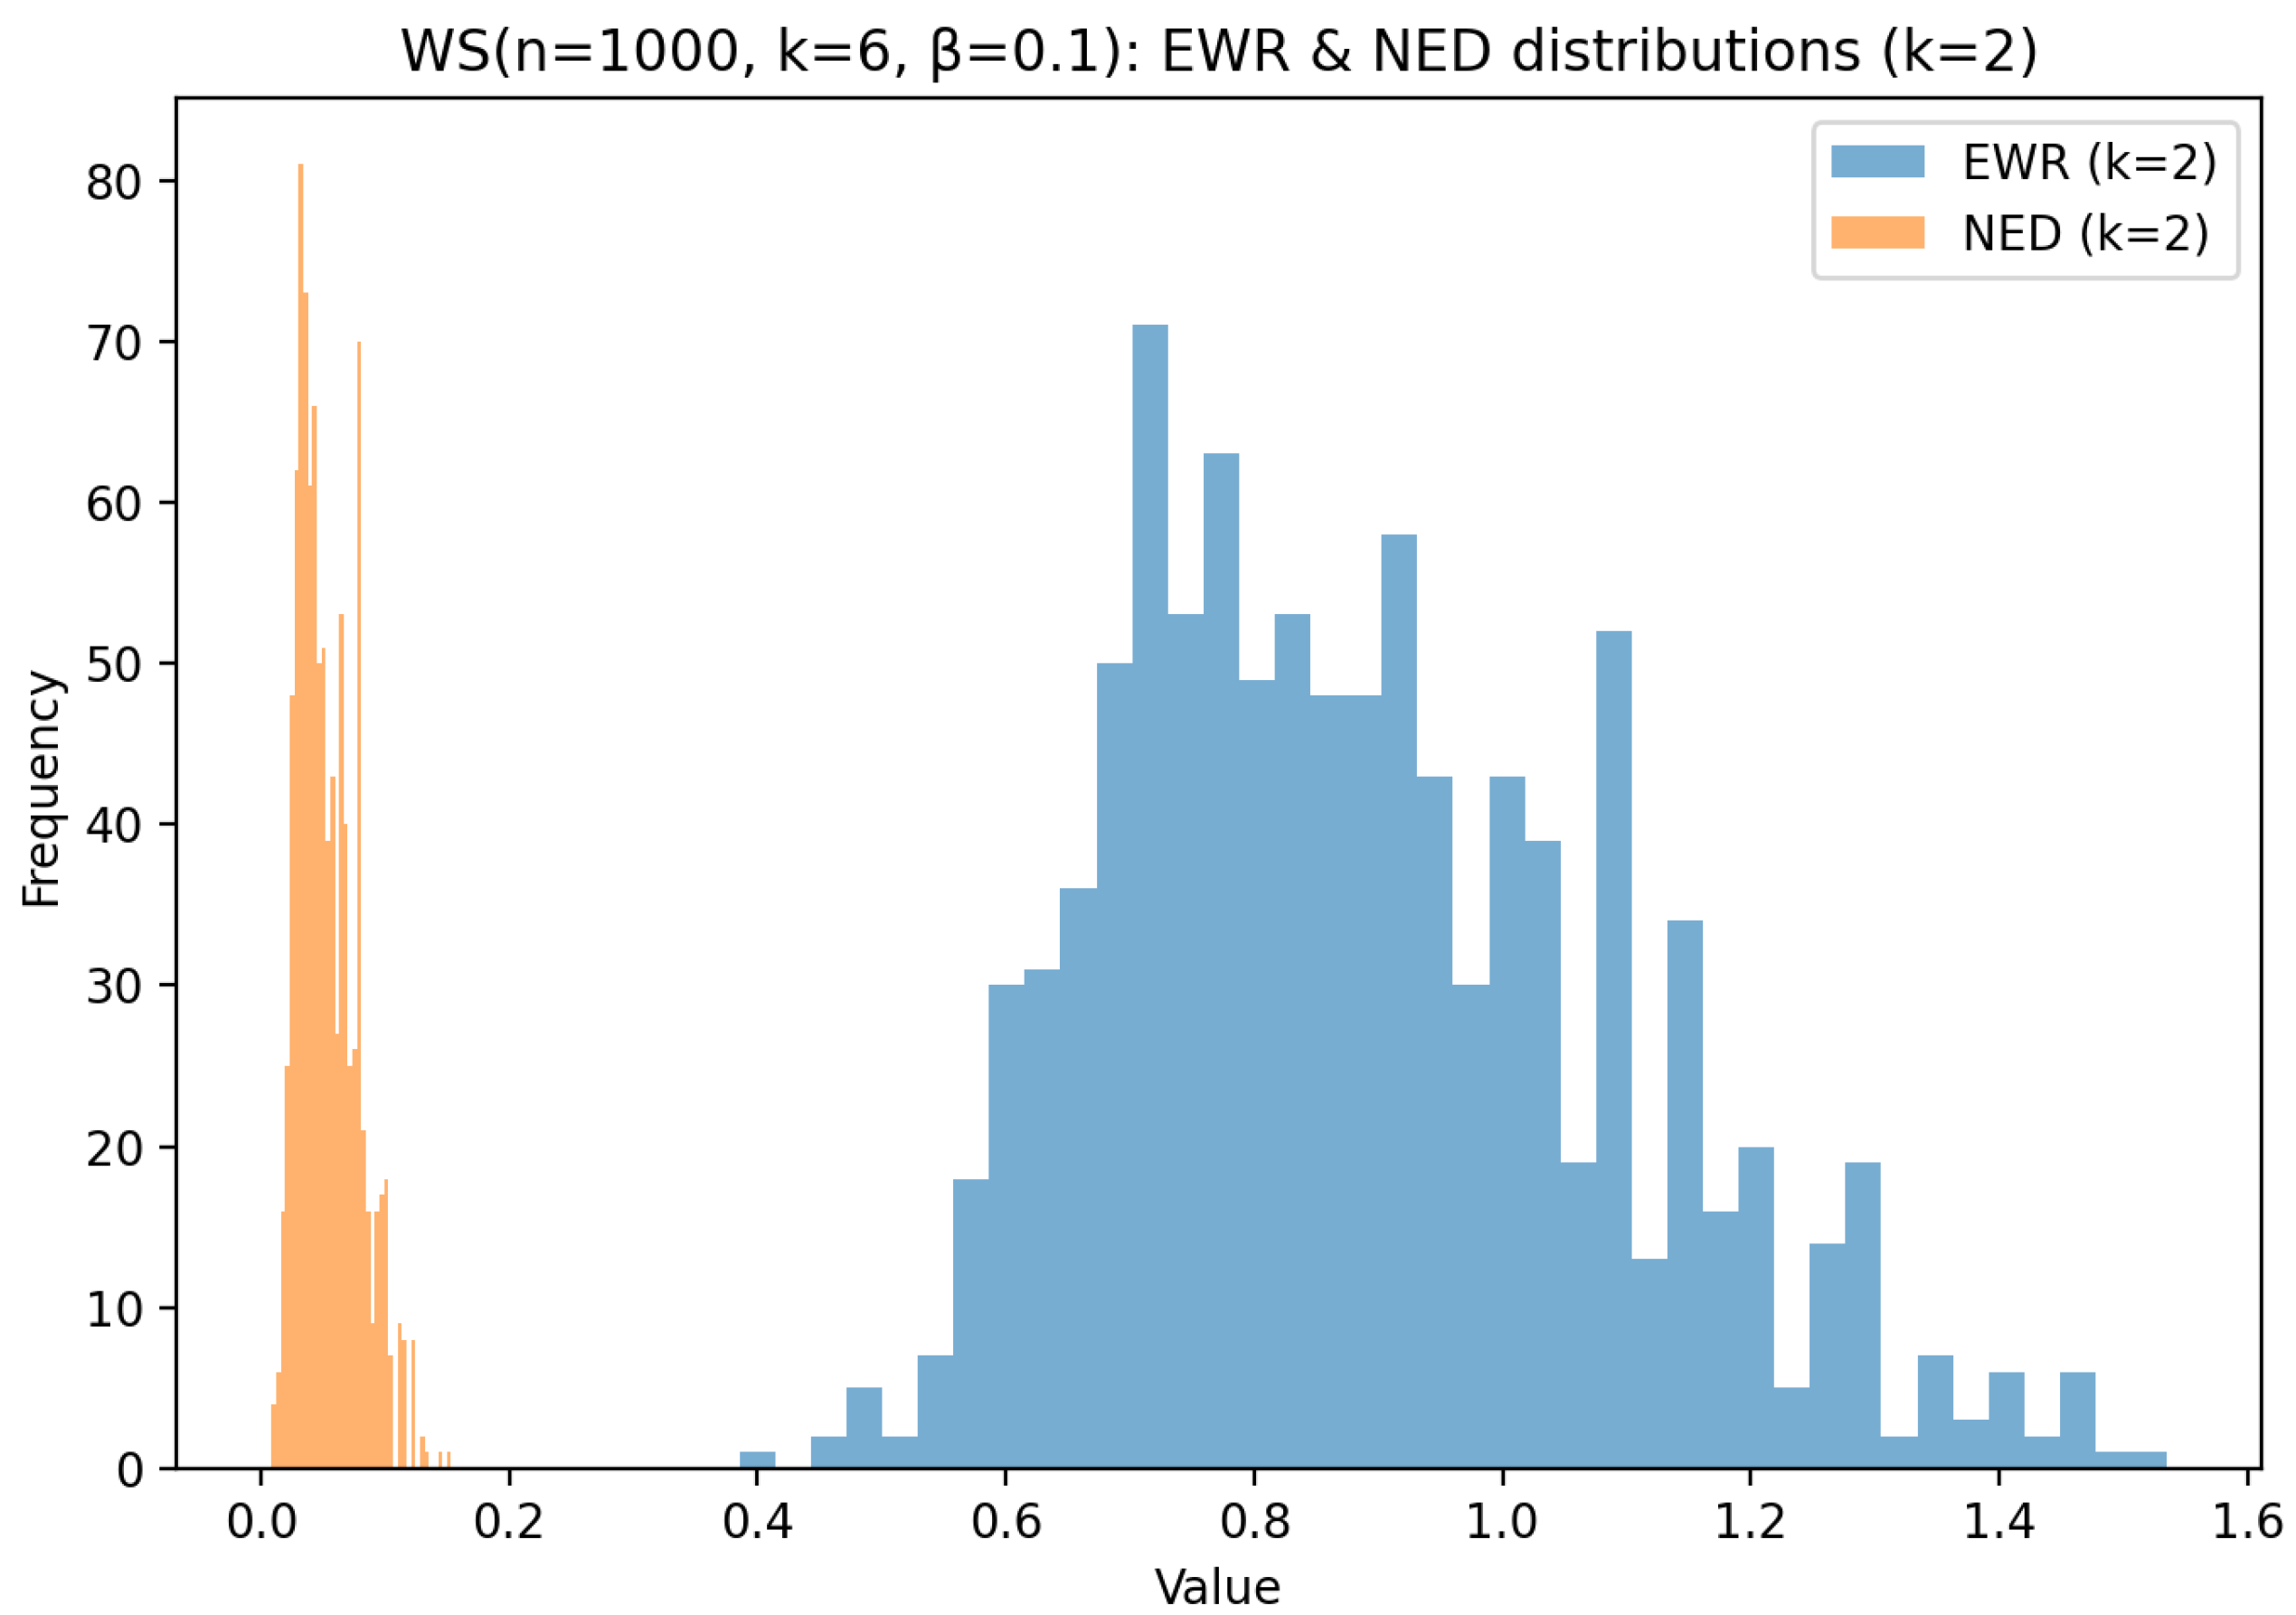
Figure 11 shows the distributions of the EWR and NED metrics for k = 2 . The EWR distribution is wider and shifted to higher values, indicating that the metric distinguishes between nodes more strongly. In contrast, NED values are concentrated in a narrow range near zero, reflecting its normalization approach and suggesting that it compresses the dynamic range in small-world topologies.
As shown in Figure 12, both EWR and NED exhibit a moderate negative correlation with node degree ( r = 0.421 and r = 0.458 , respectively). This suggests that in WS graphs, degree is not the primary driver of either metric, and local structural patterns within the k-hop neighborhood influence the scores more strongly.
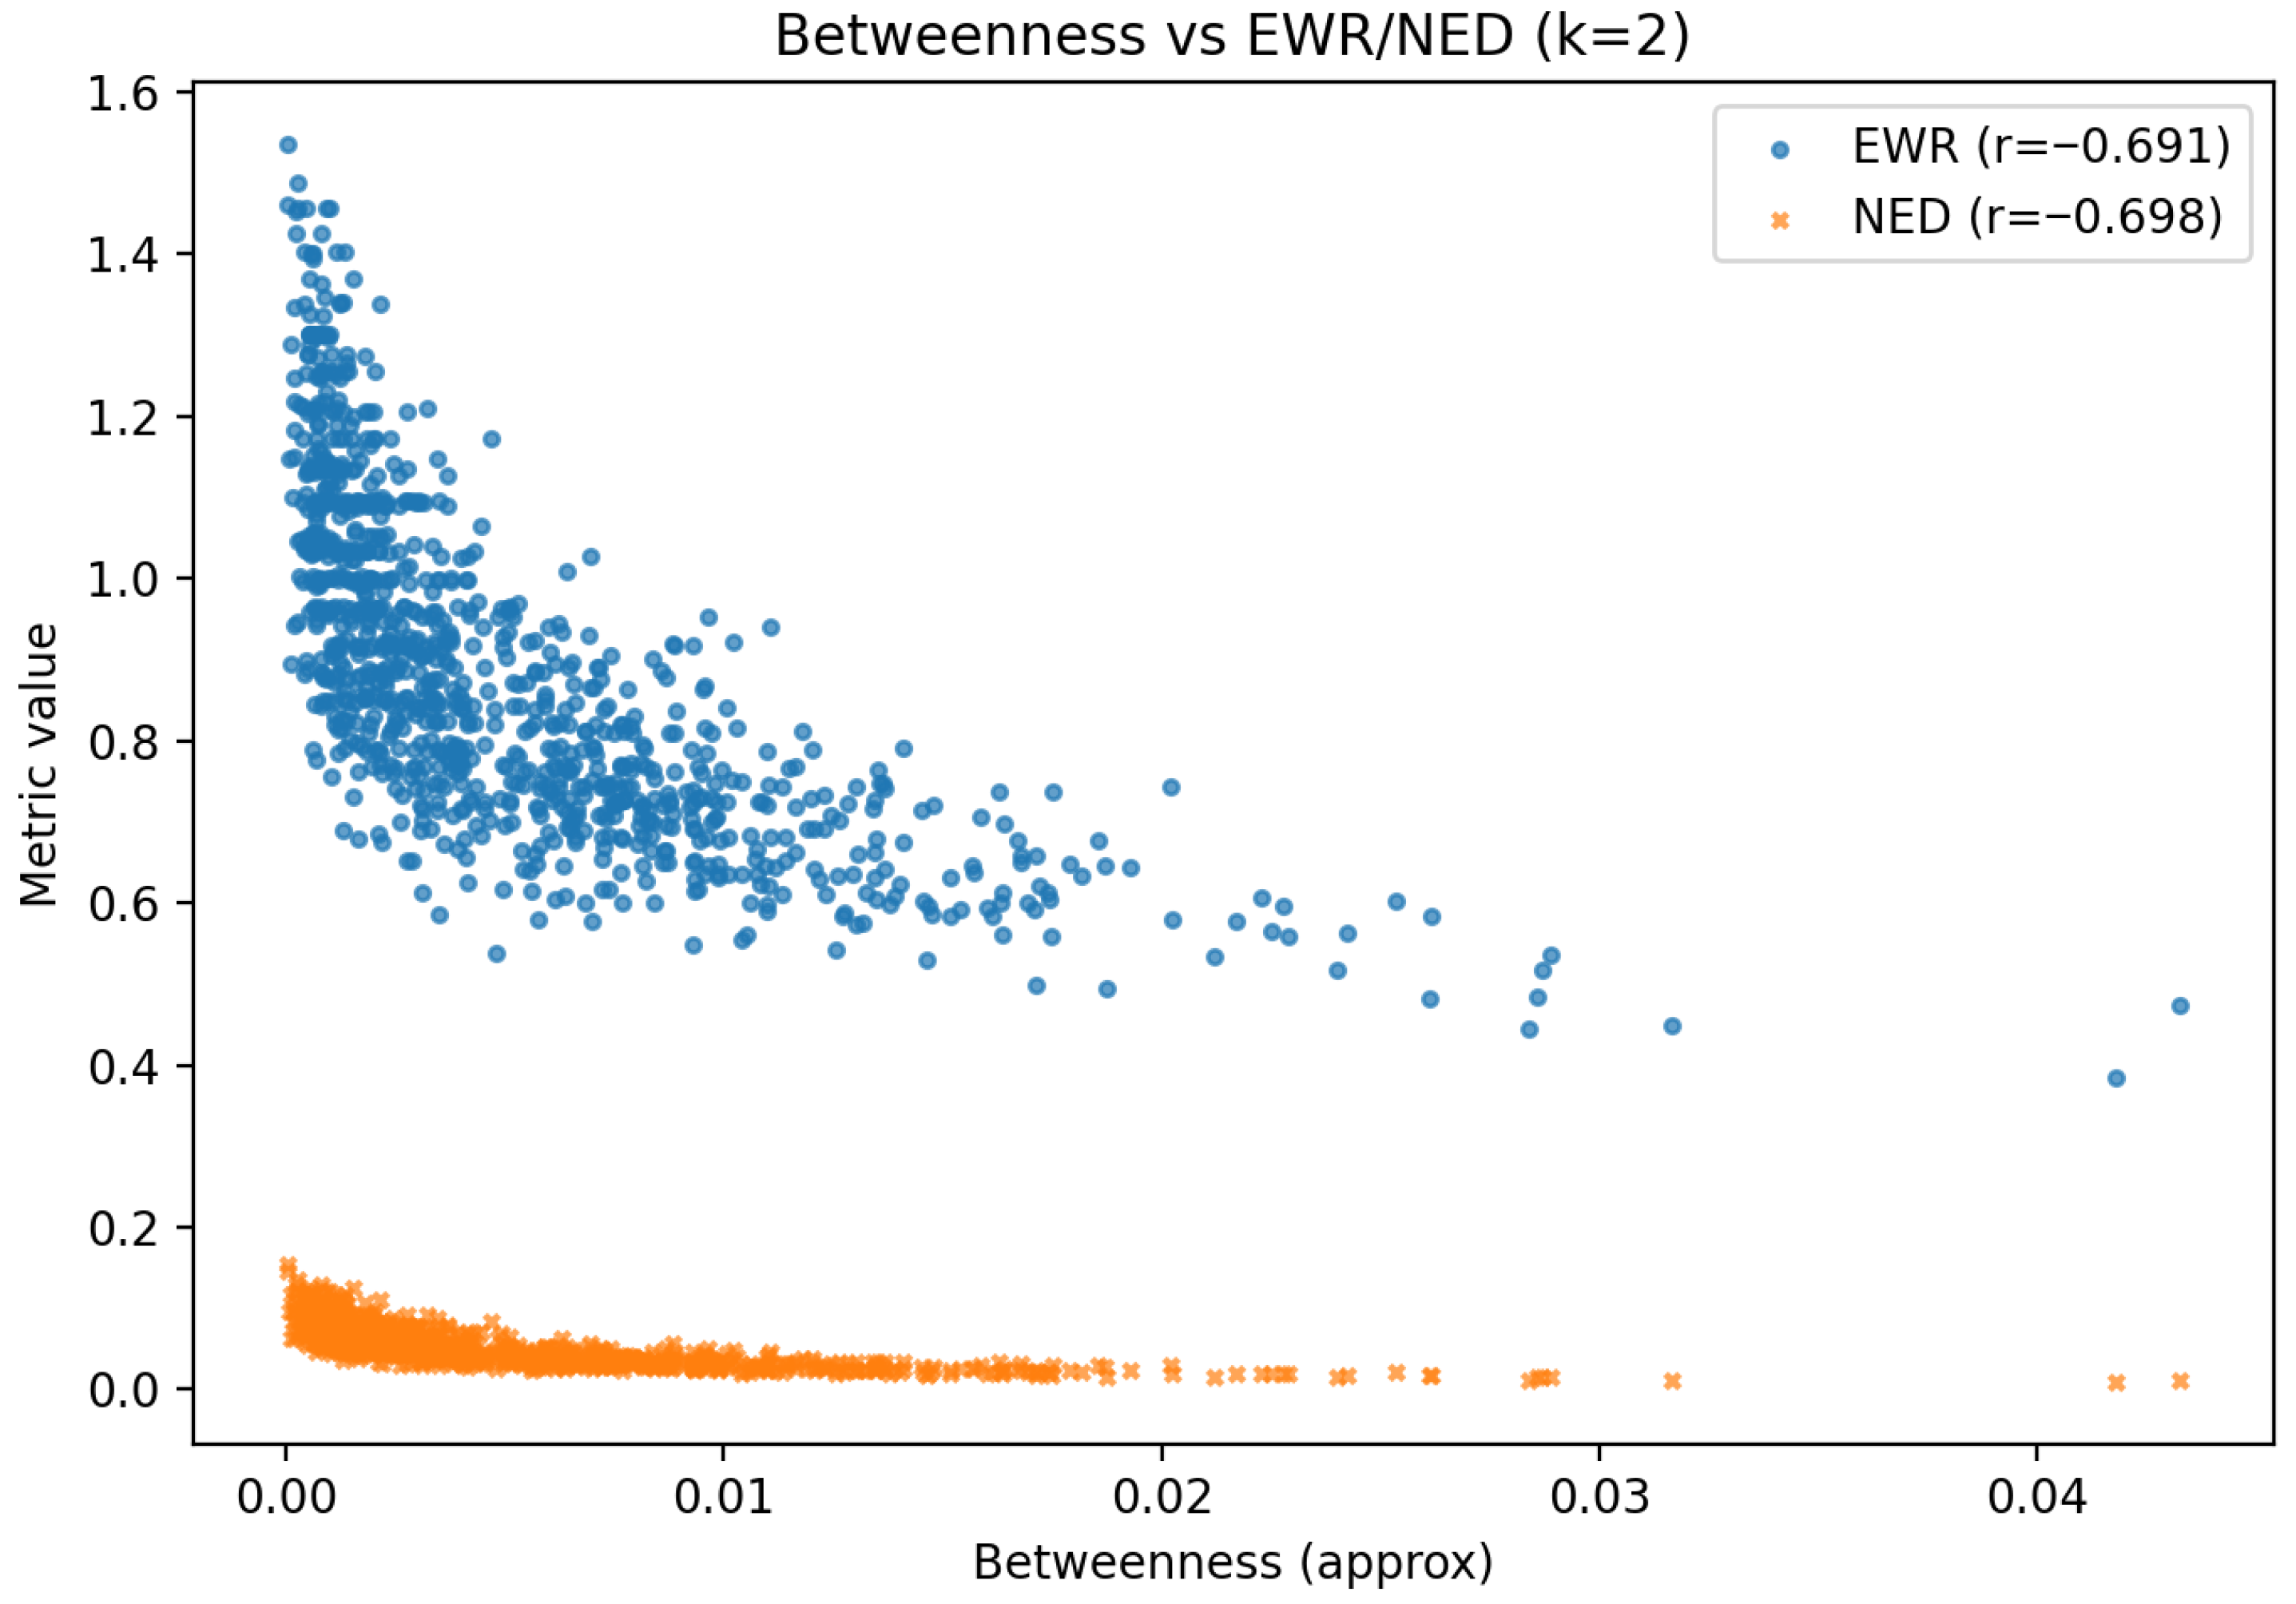
Figure 13 shows the relationship between the metrics and approximate betweenness centrality. Both EWR and NED display a strong negative correlation ( r 0.69 ), indicating that nodes acting as bridges between distant parts of the network tend to have lower entropy-based scores. This is consistent with the WS topology, where shortcuts reduce the relative uniqueness of intermediary nodes.
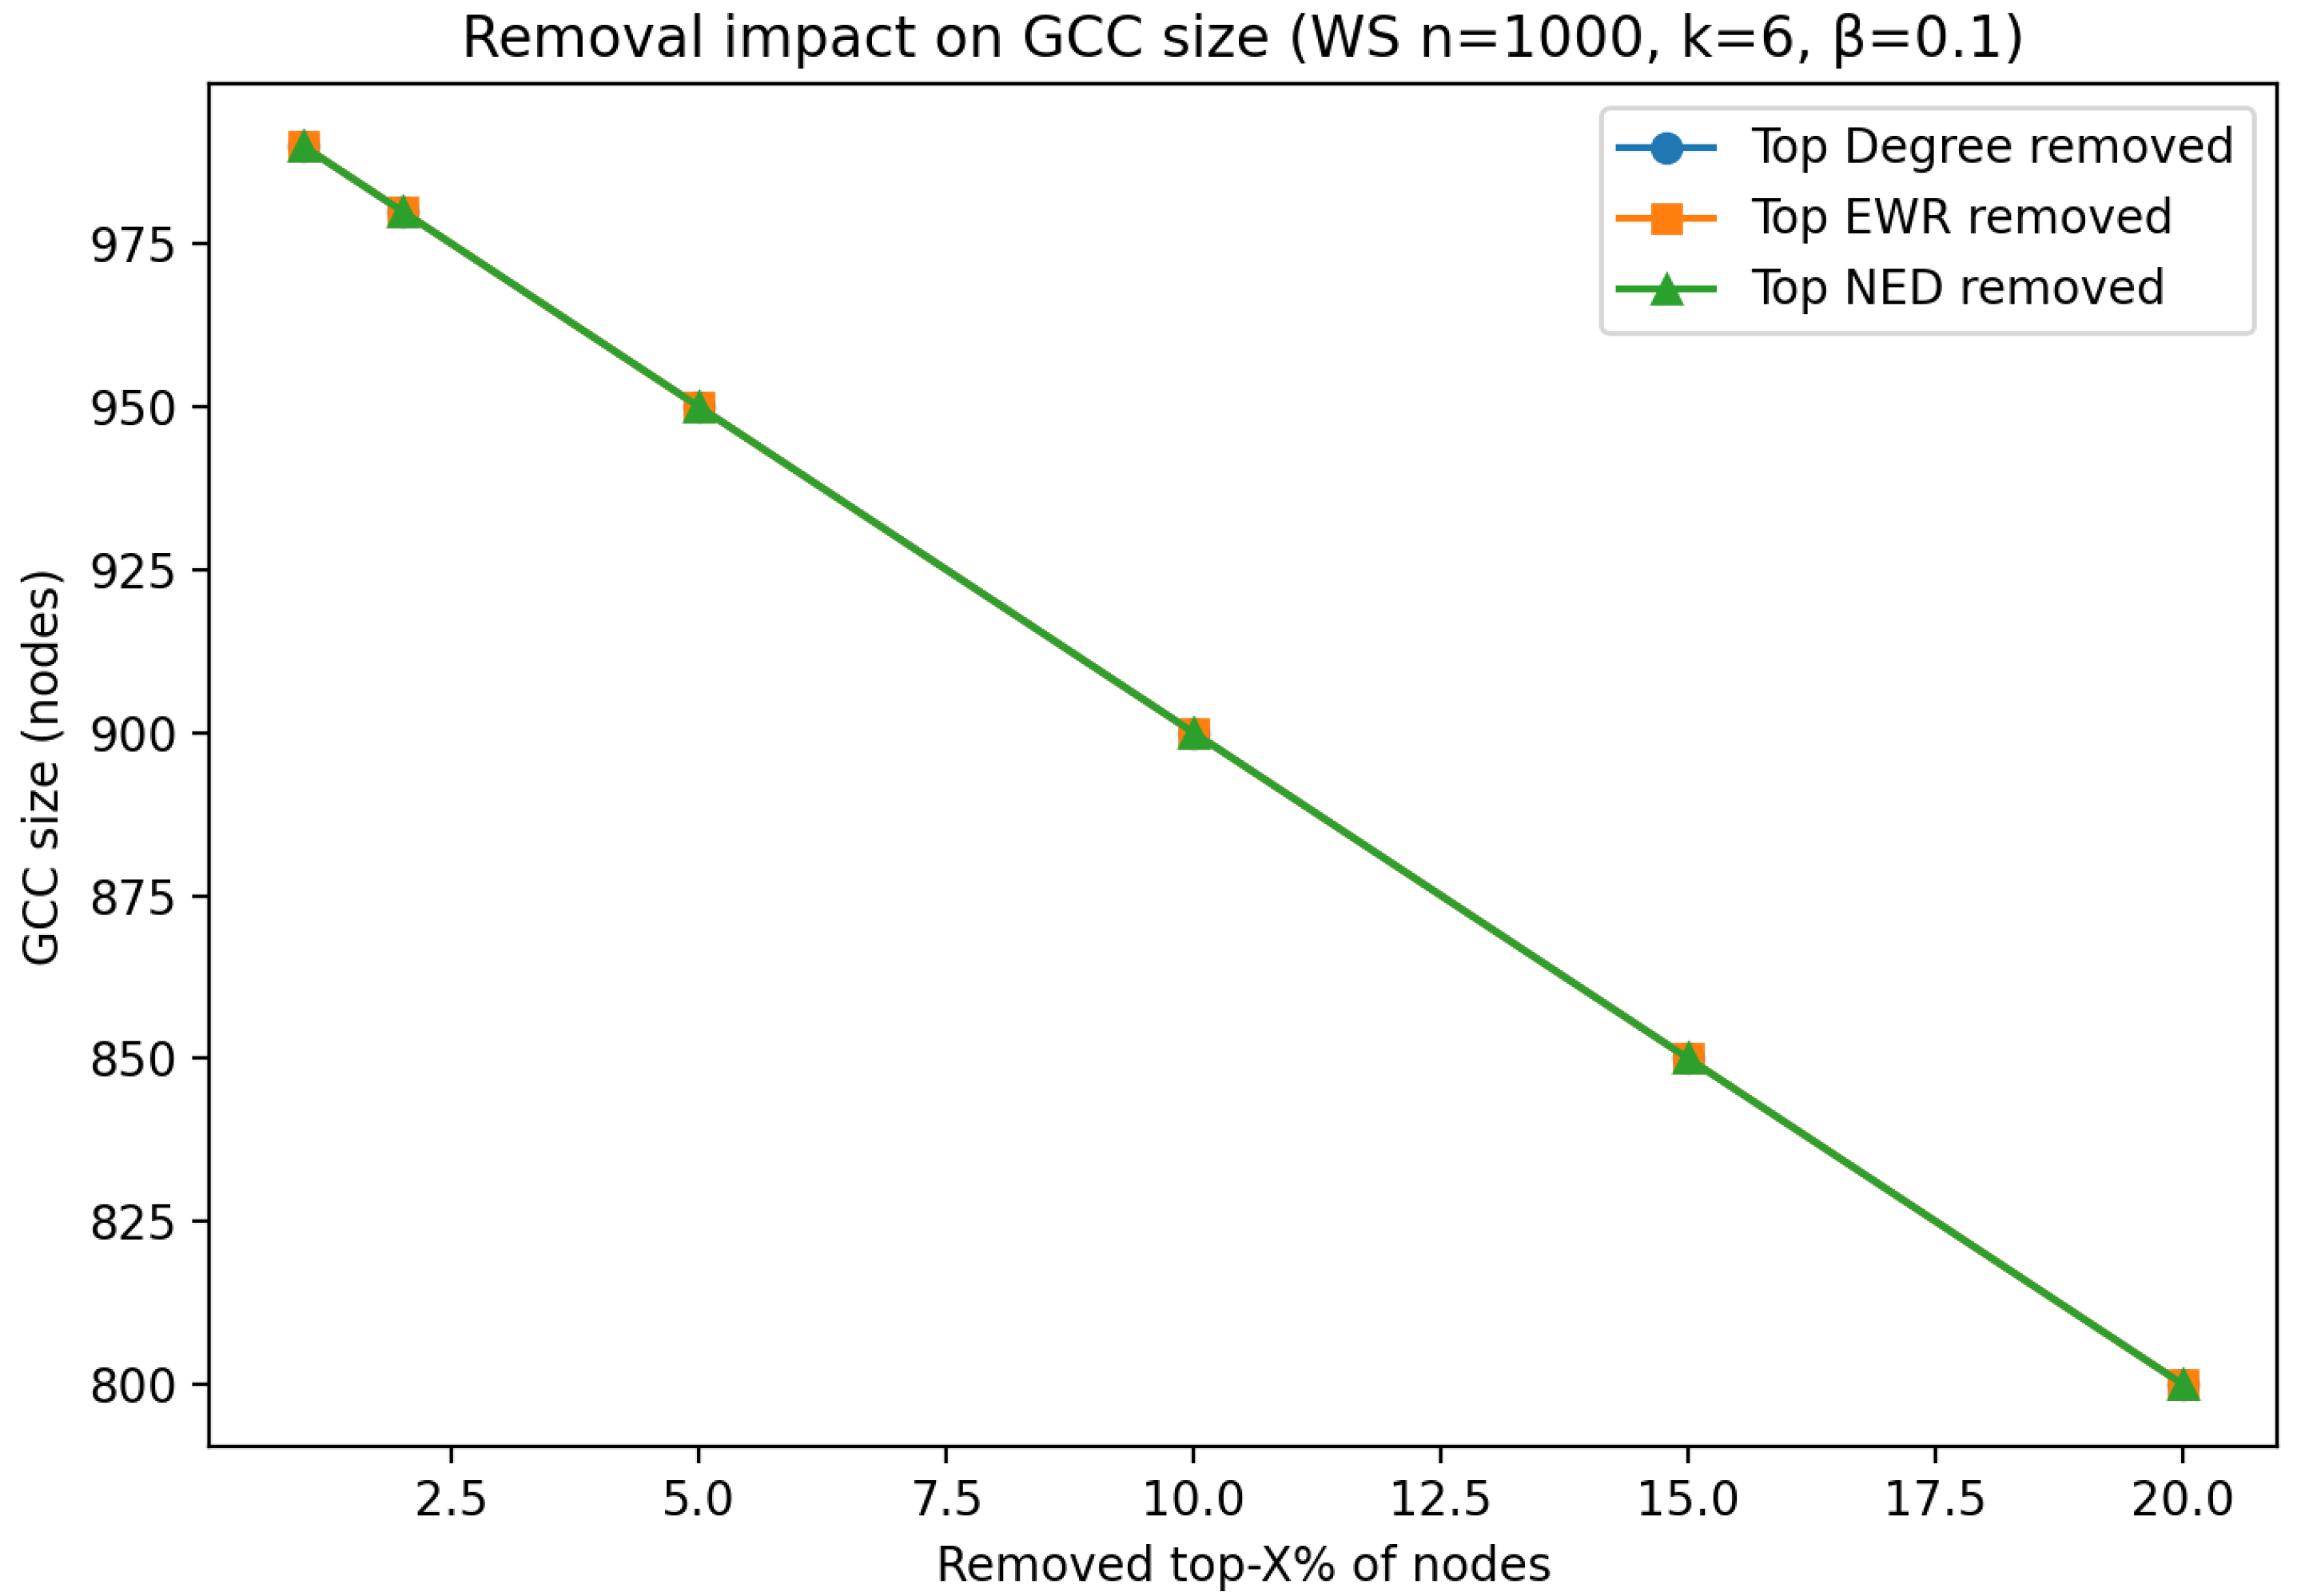
The targeted node removal experiment in Figure 14 measures the decrease in the size of the giant connected component (GCC) when nodes are removed based on top degree, EWR, or NED scores. The three curves are almost identical, indicating that in WS graphs, all three strategies are equally effective at fragmenting the network. This suggests that the WS structure’s high clustering makes targeted removal less sensitive to the choice of metric.
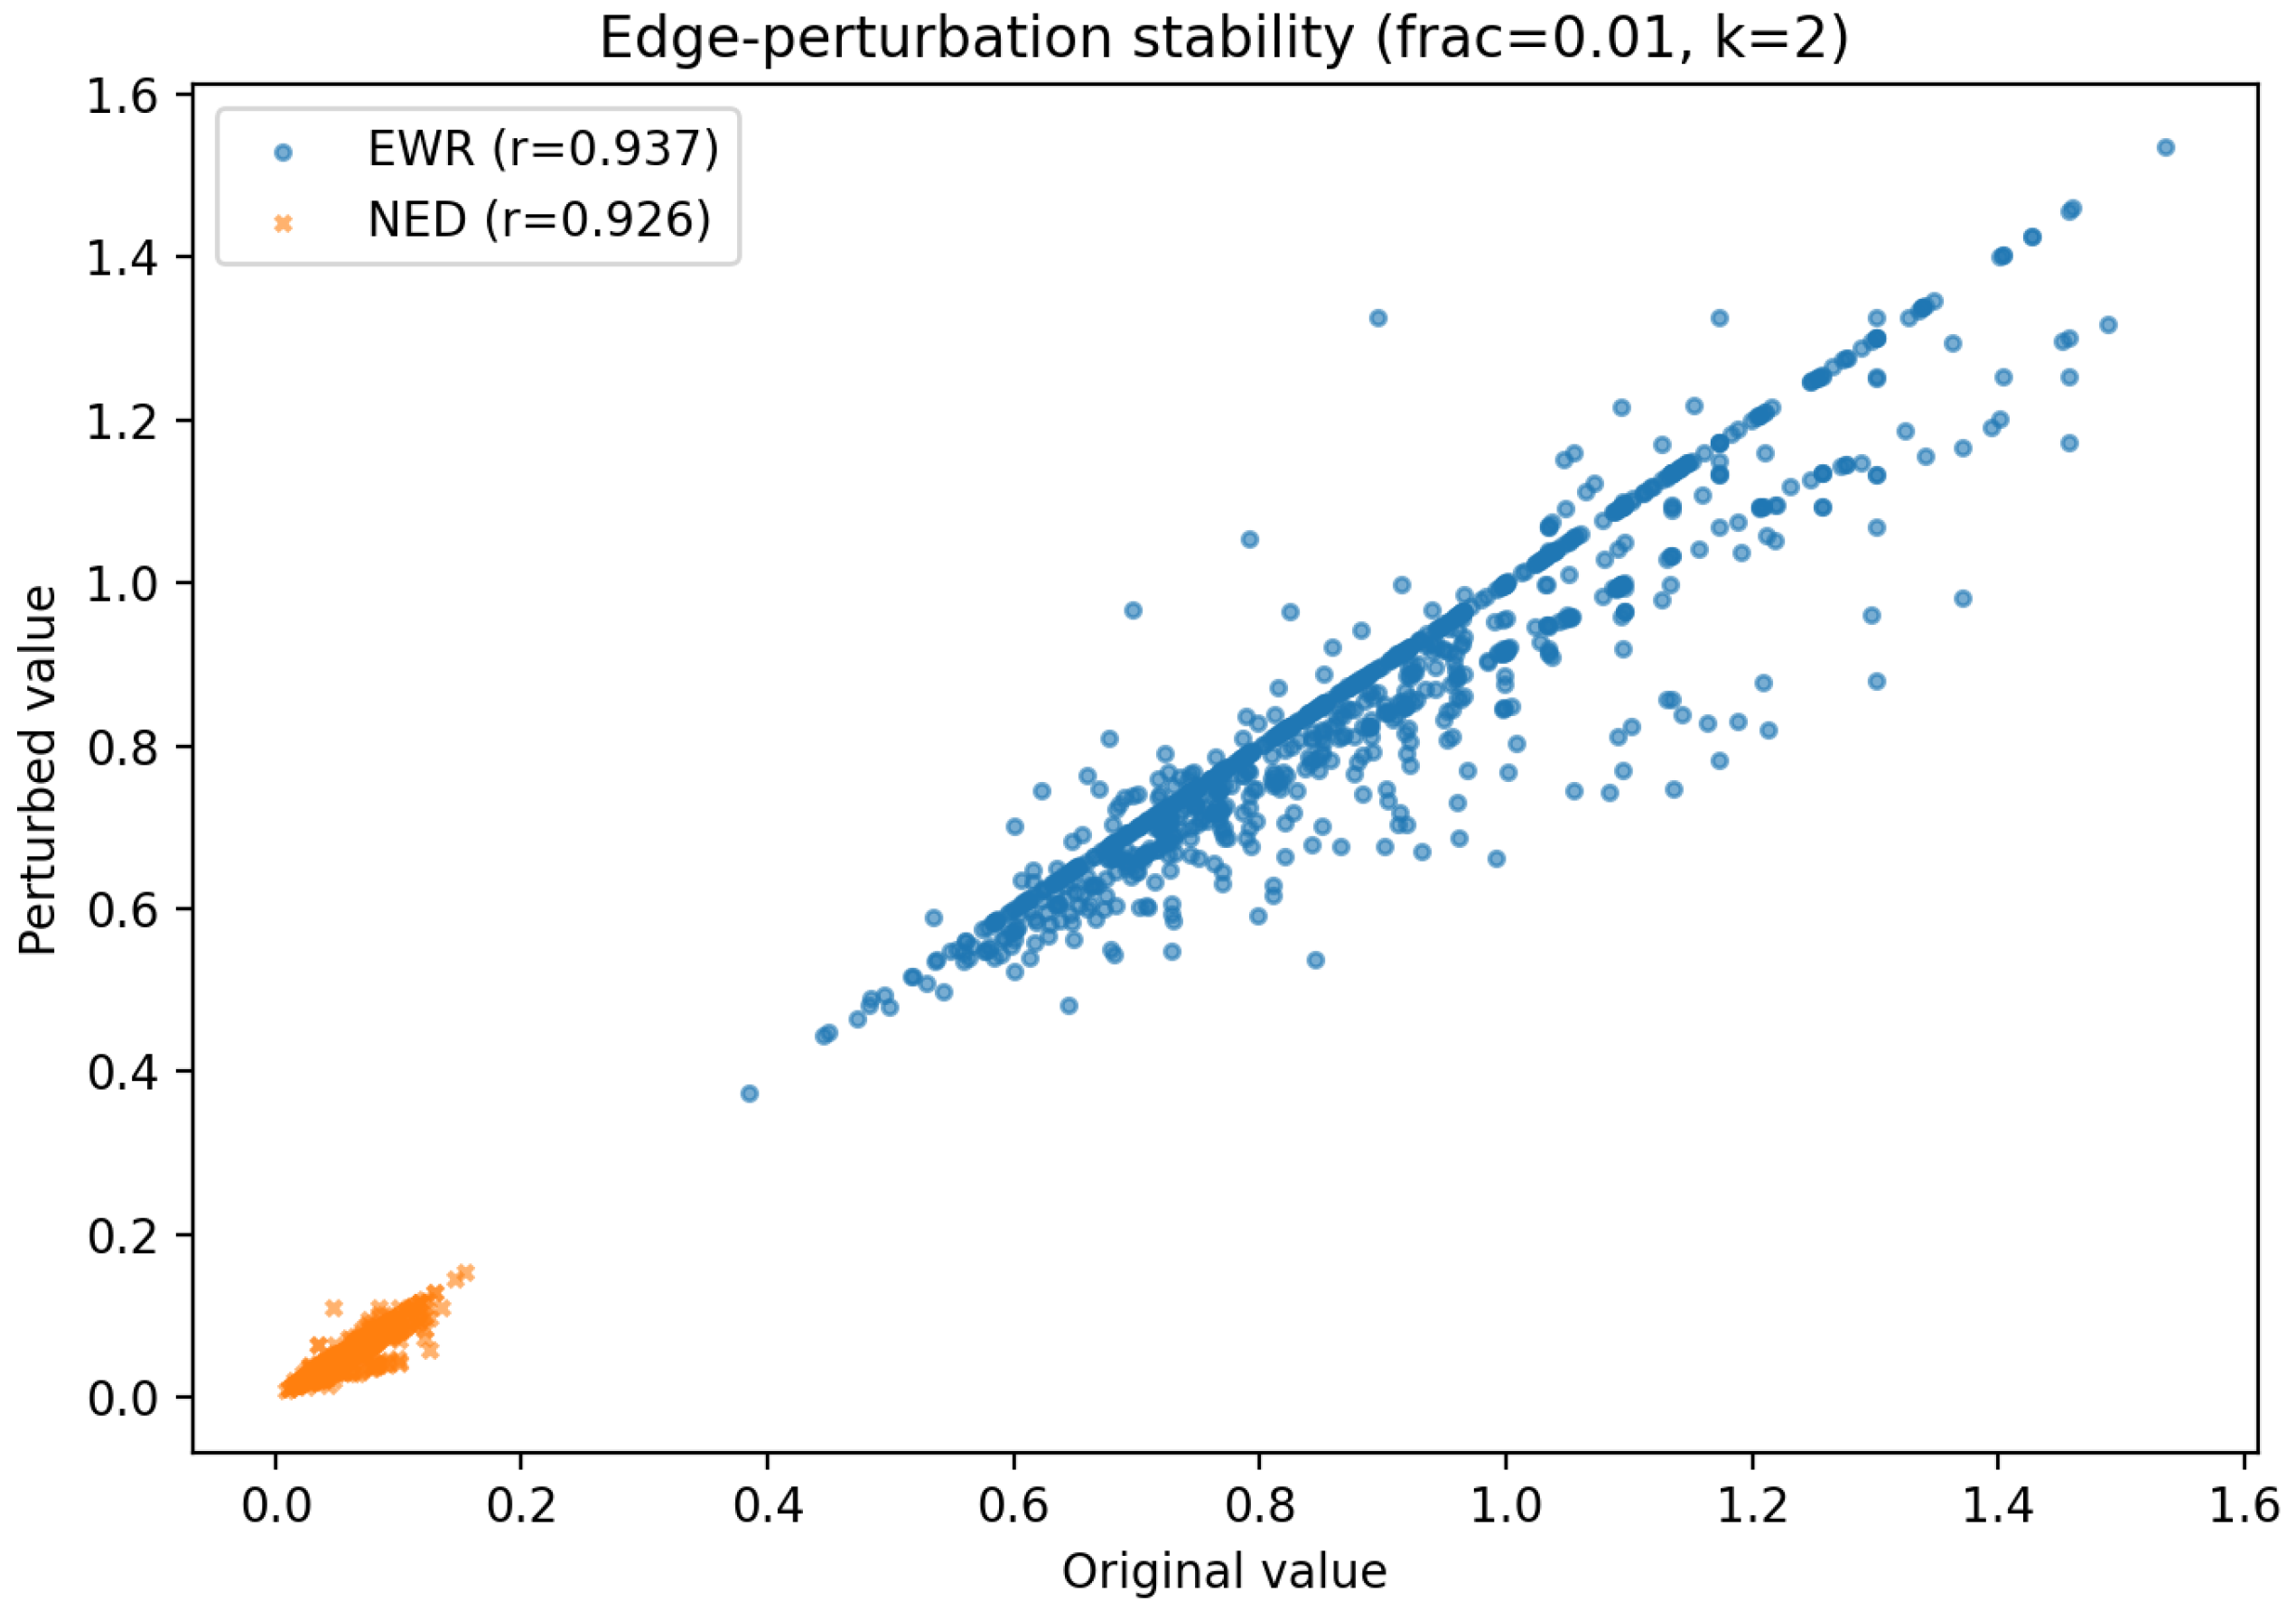
In the edge-perturbation stability test (Figure 15), 1% of the edges was randomly rewired and the perturbed and original metric values were compared. Both EWR and NED achieve high Pearson correlation coefficients ( r = 0.937 and r = 0.926 , respectively), indicating strong stability under small topological changes. This robustness is important for real-world applications where network data may be noisy or incomplete.
In the WS topology, both EWR and NED are robust to perturbations and correlate strongly (negatively) with betweenness centrality. However, the narrow value range of NED may limit its resolution for distinguishing node importance. EWR, with its broader distribution, appears more sensitive to local structural variations, which could be advantageous in applications where fine-grained ranking is required.

Random Geometric Graph Analysis

For the RGG configuration with n = 1000 nodes and a connection radius of 0.08 , the spatial embedding introduces locality constraints absent in ER, BA, or WS networks. This yields a relatively narrow degree distribution and high clustering, providing an interesting case for contrasting EWR and NED.
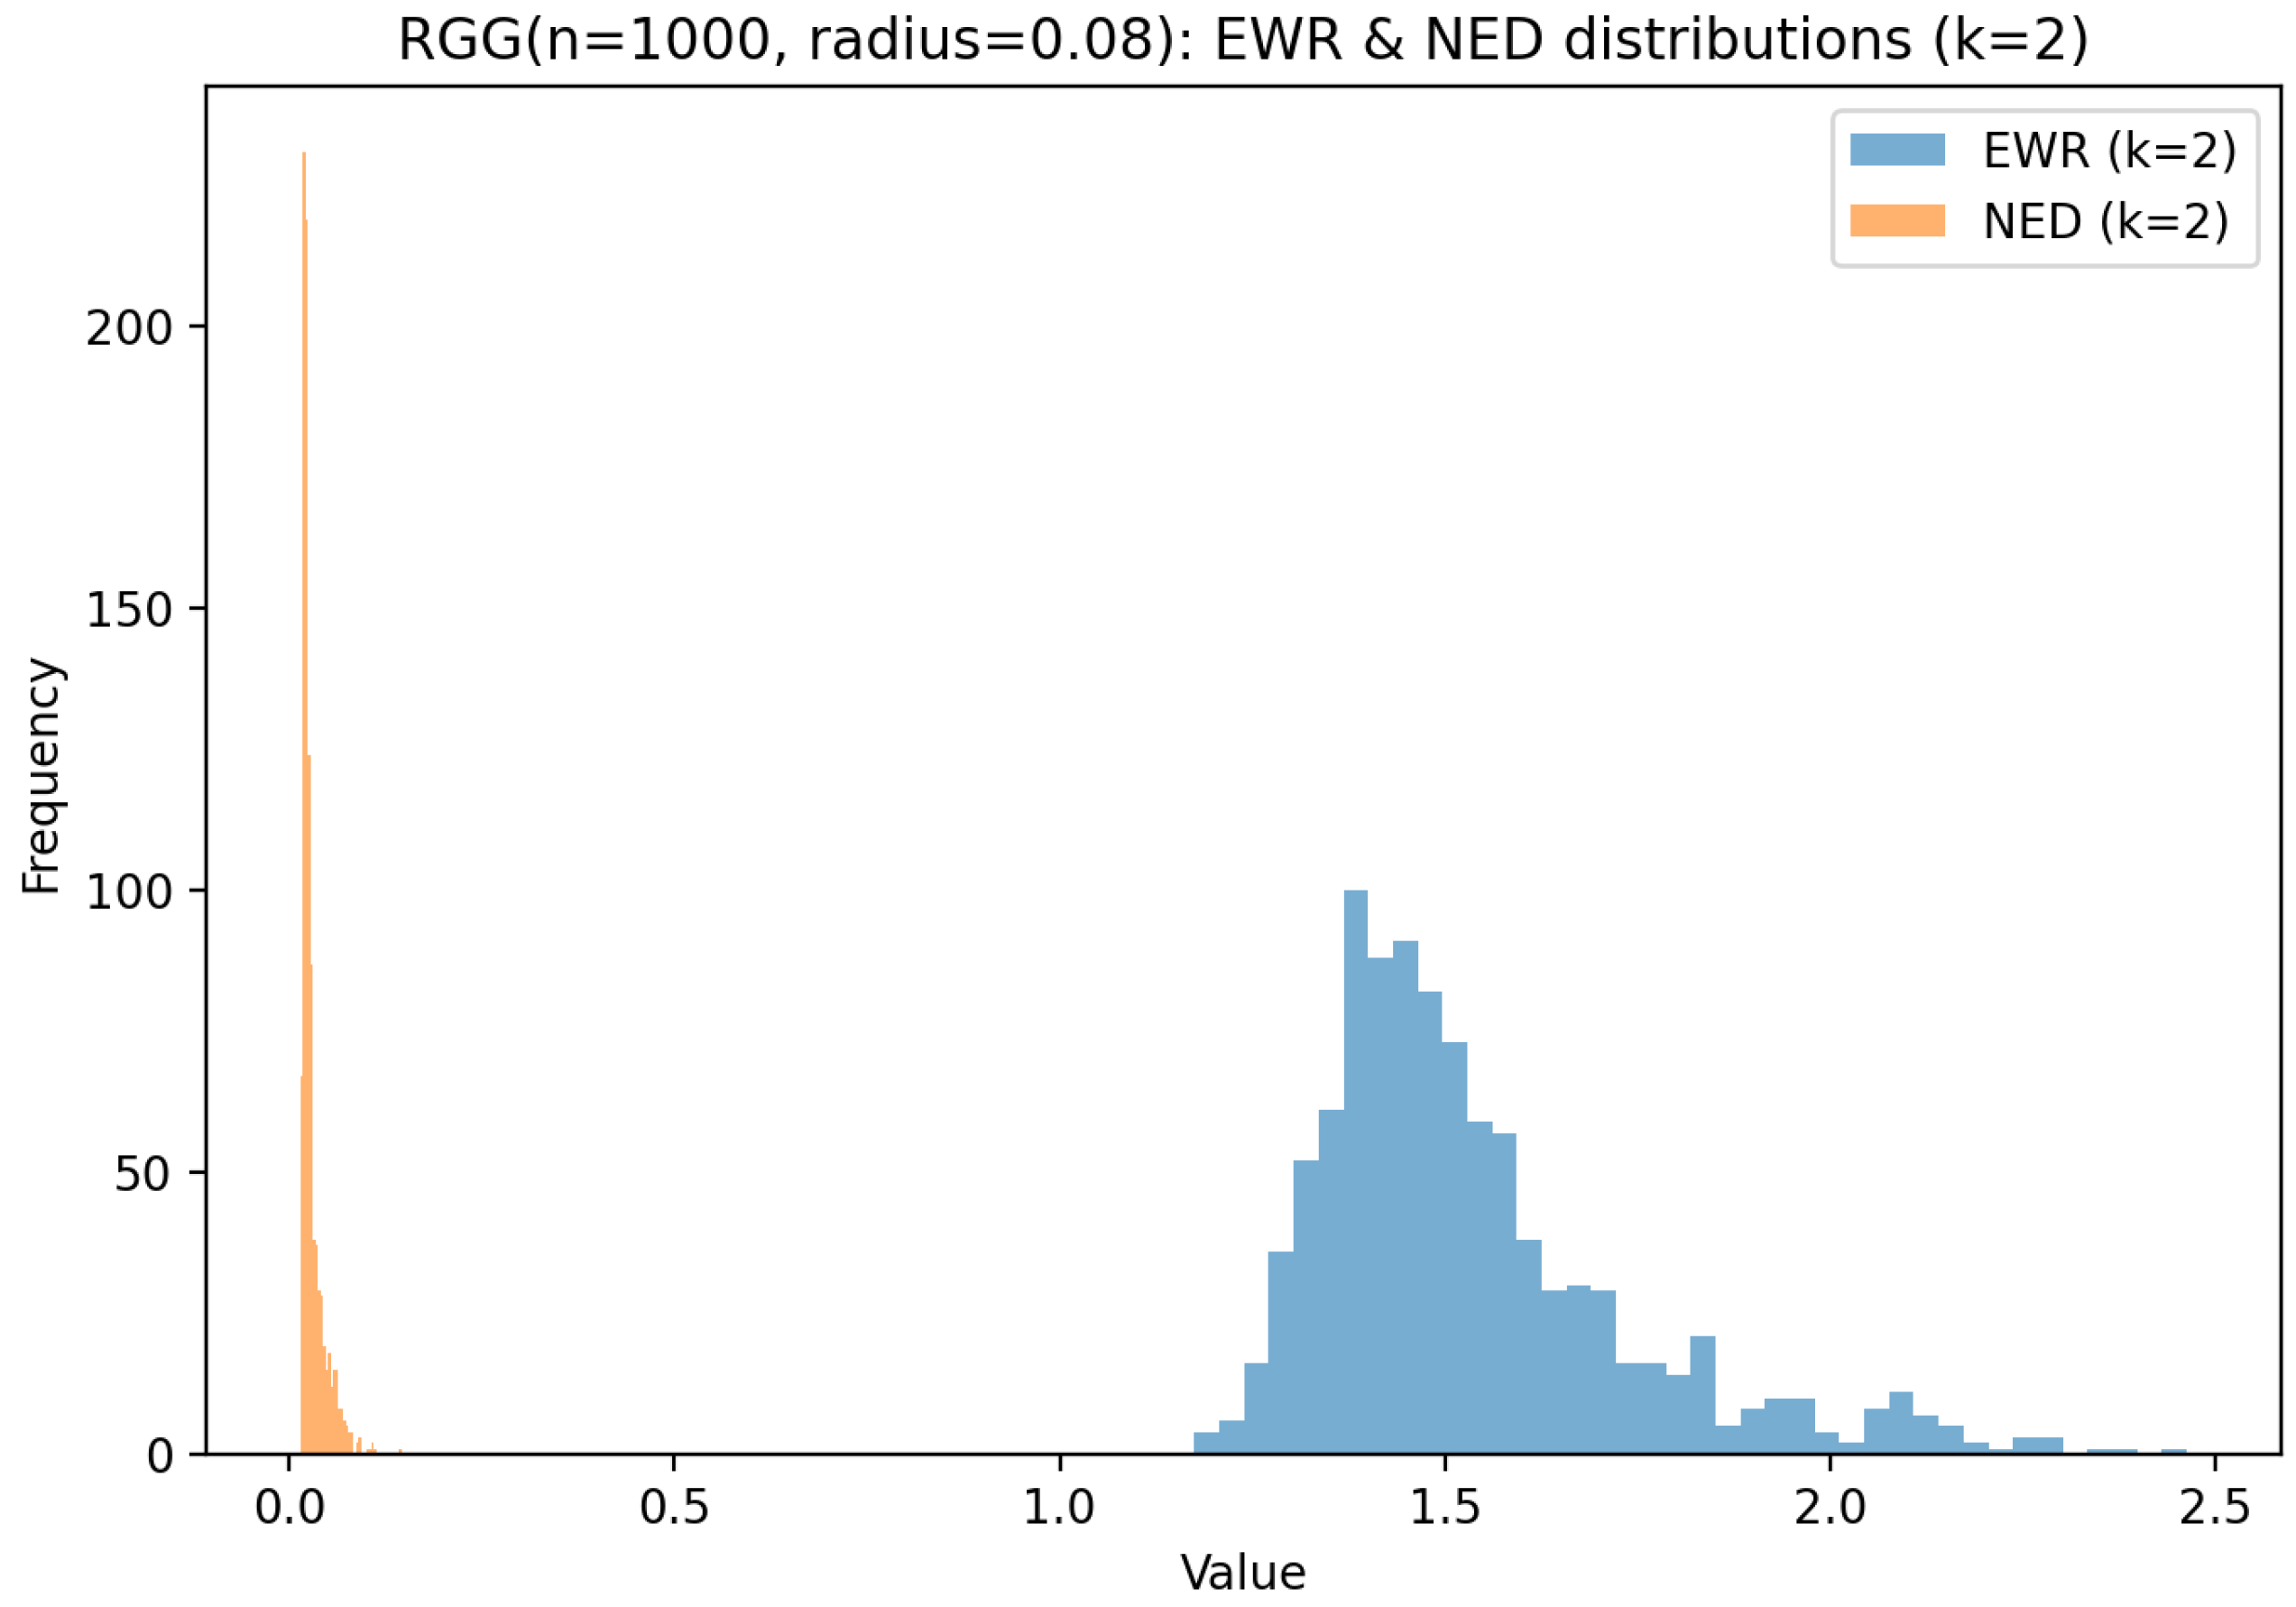
Figure 16 shows EWR values concentrated in a moderate range ( [ 1.2 , 2.5 ] ), reflecting structural homogeneity induced by spatial locality. NED values cluster strongly near zero, indicating limited entropy-based variability among nodes in this topology.
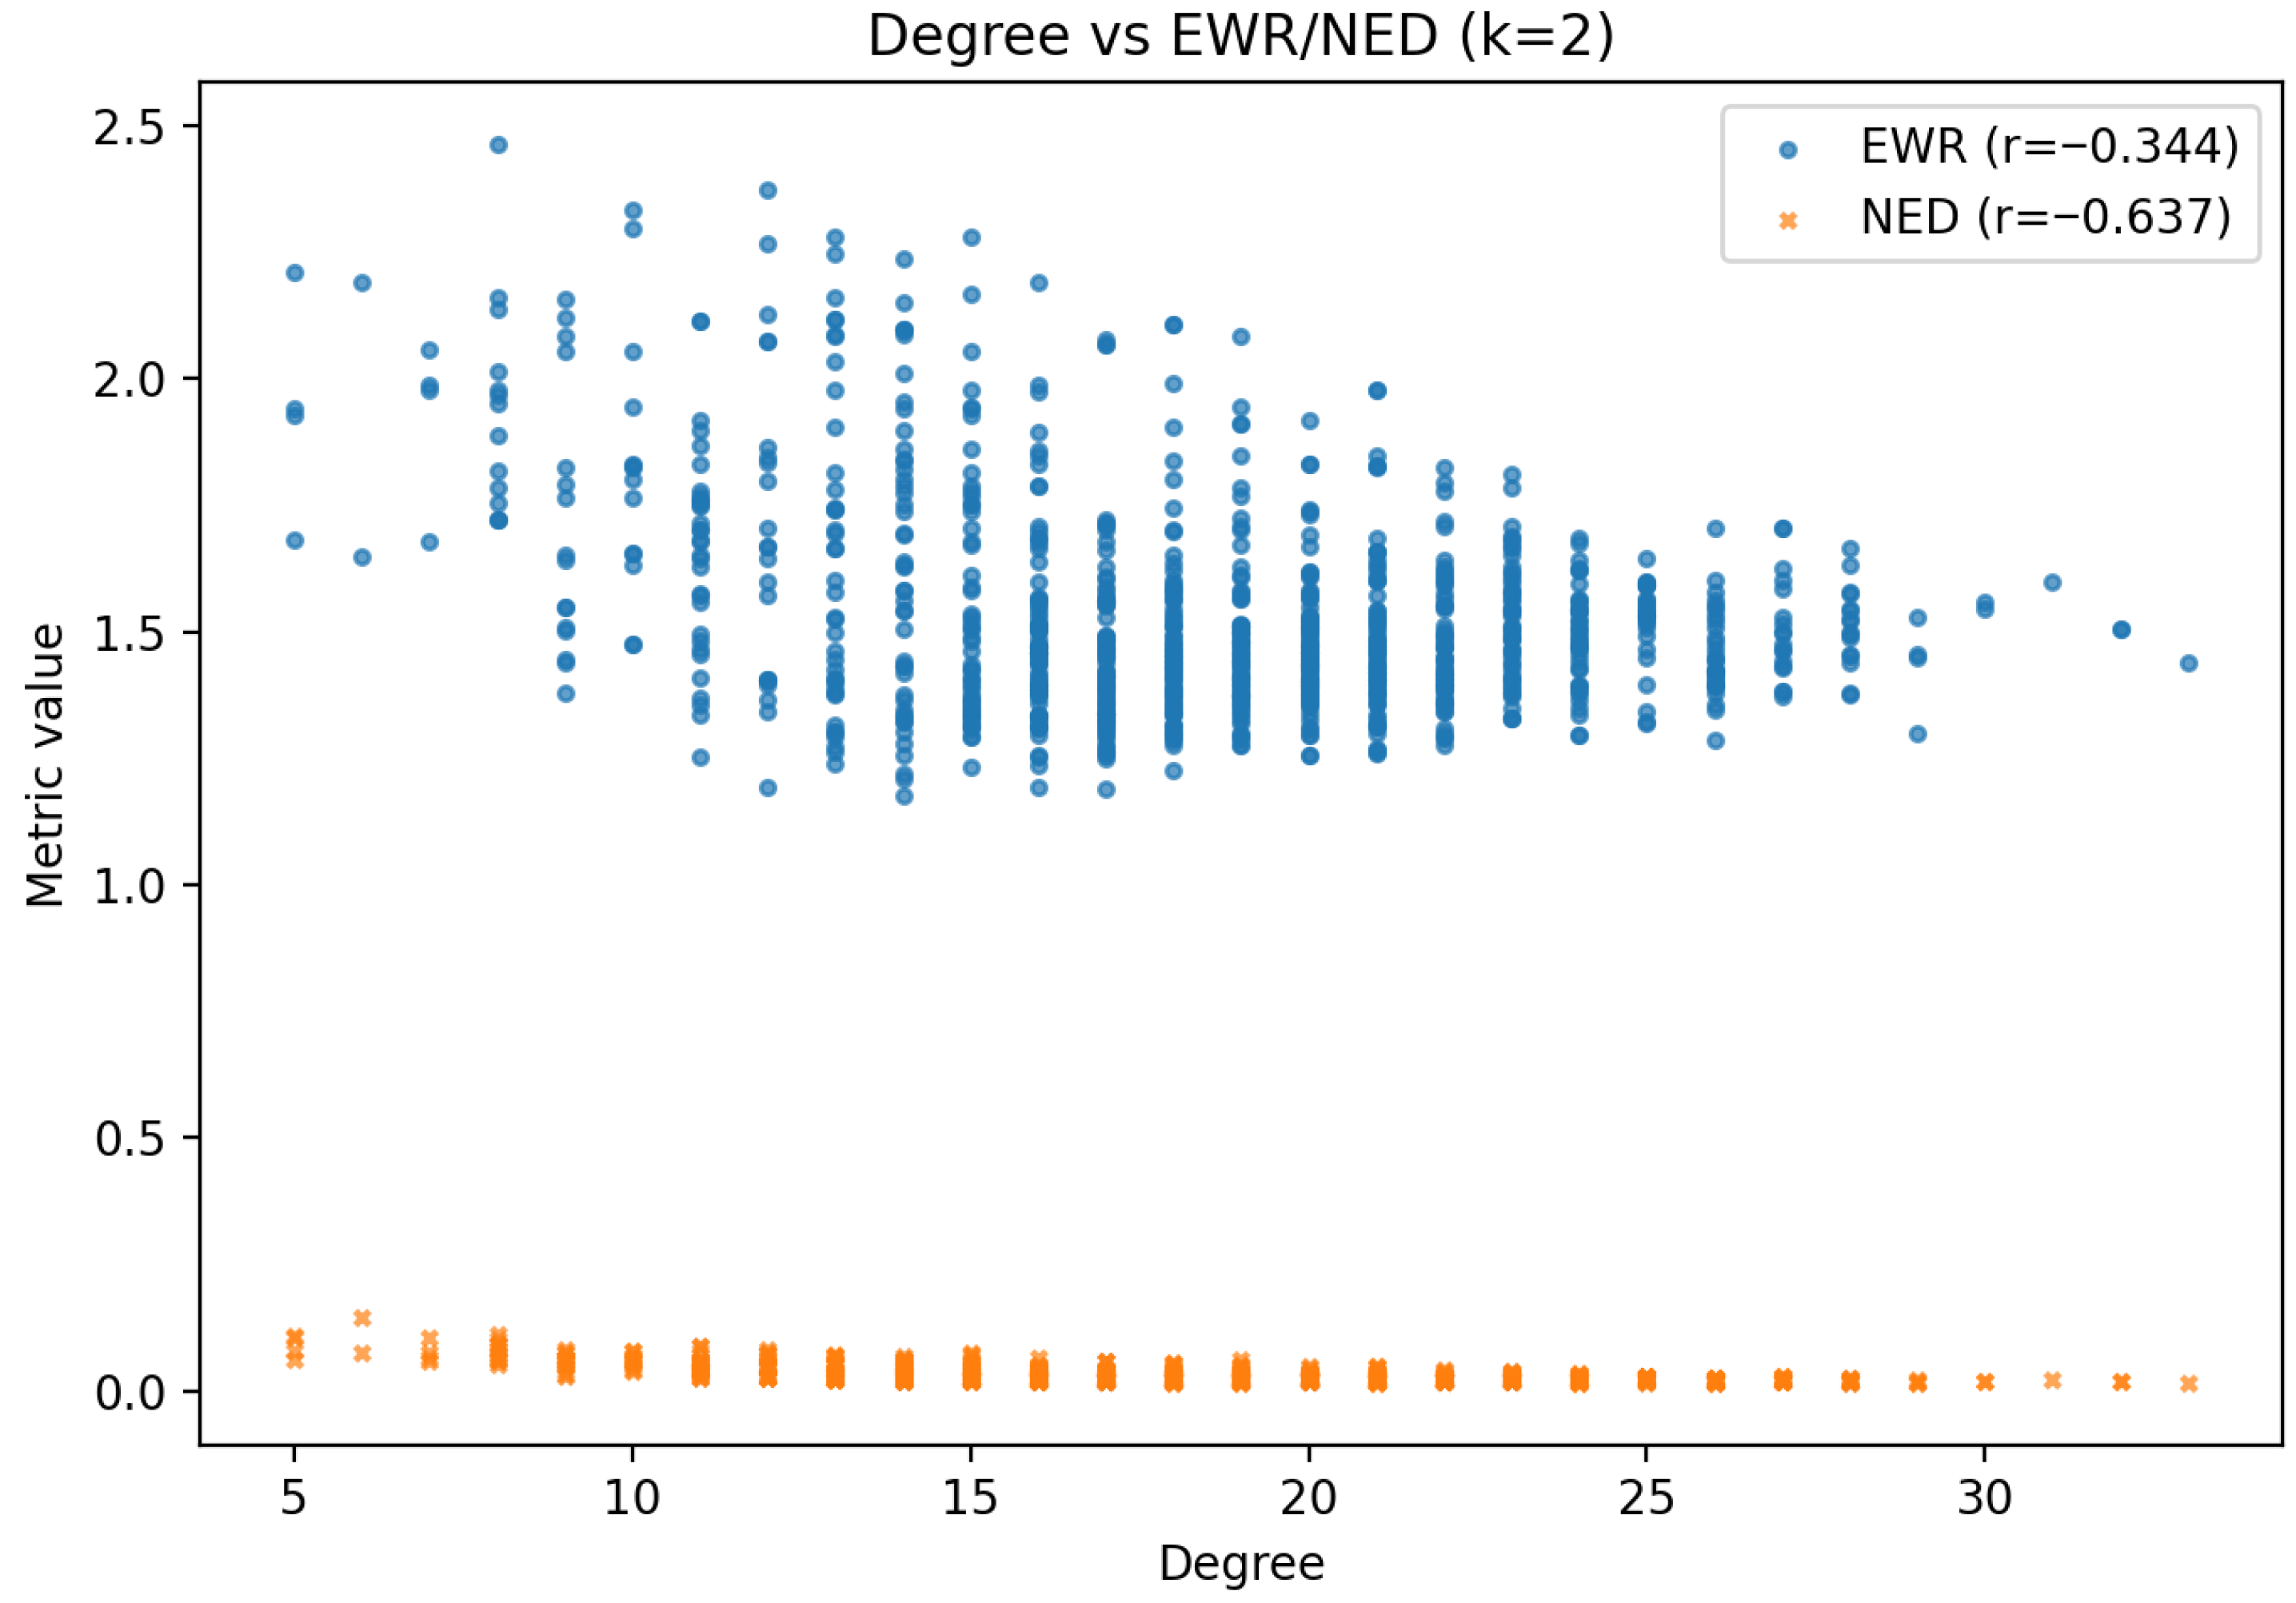
As shown in Figure 17, both EWR and NED correlate negatively with degree ( r = 0.344 and r = 0.637 , respectively). Higher-degree nodes in an RGG tend to sit in dense clusters with redundant links, reducing local entropy.
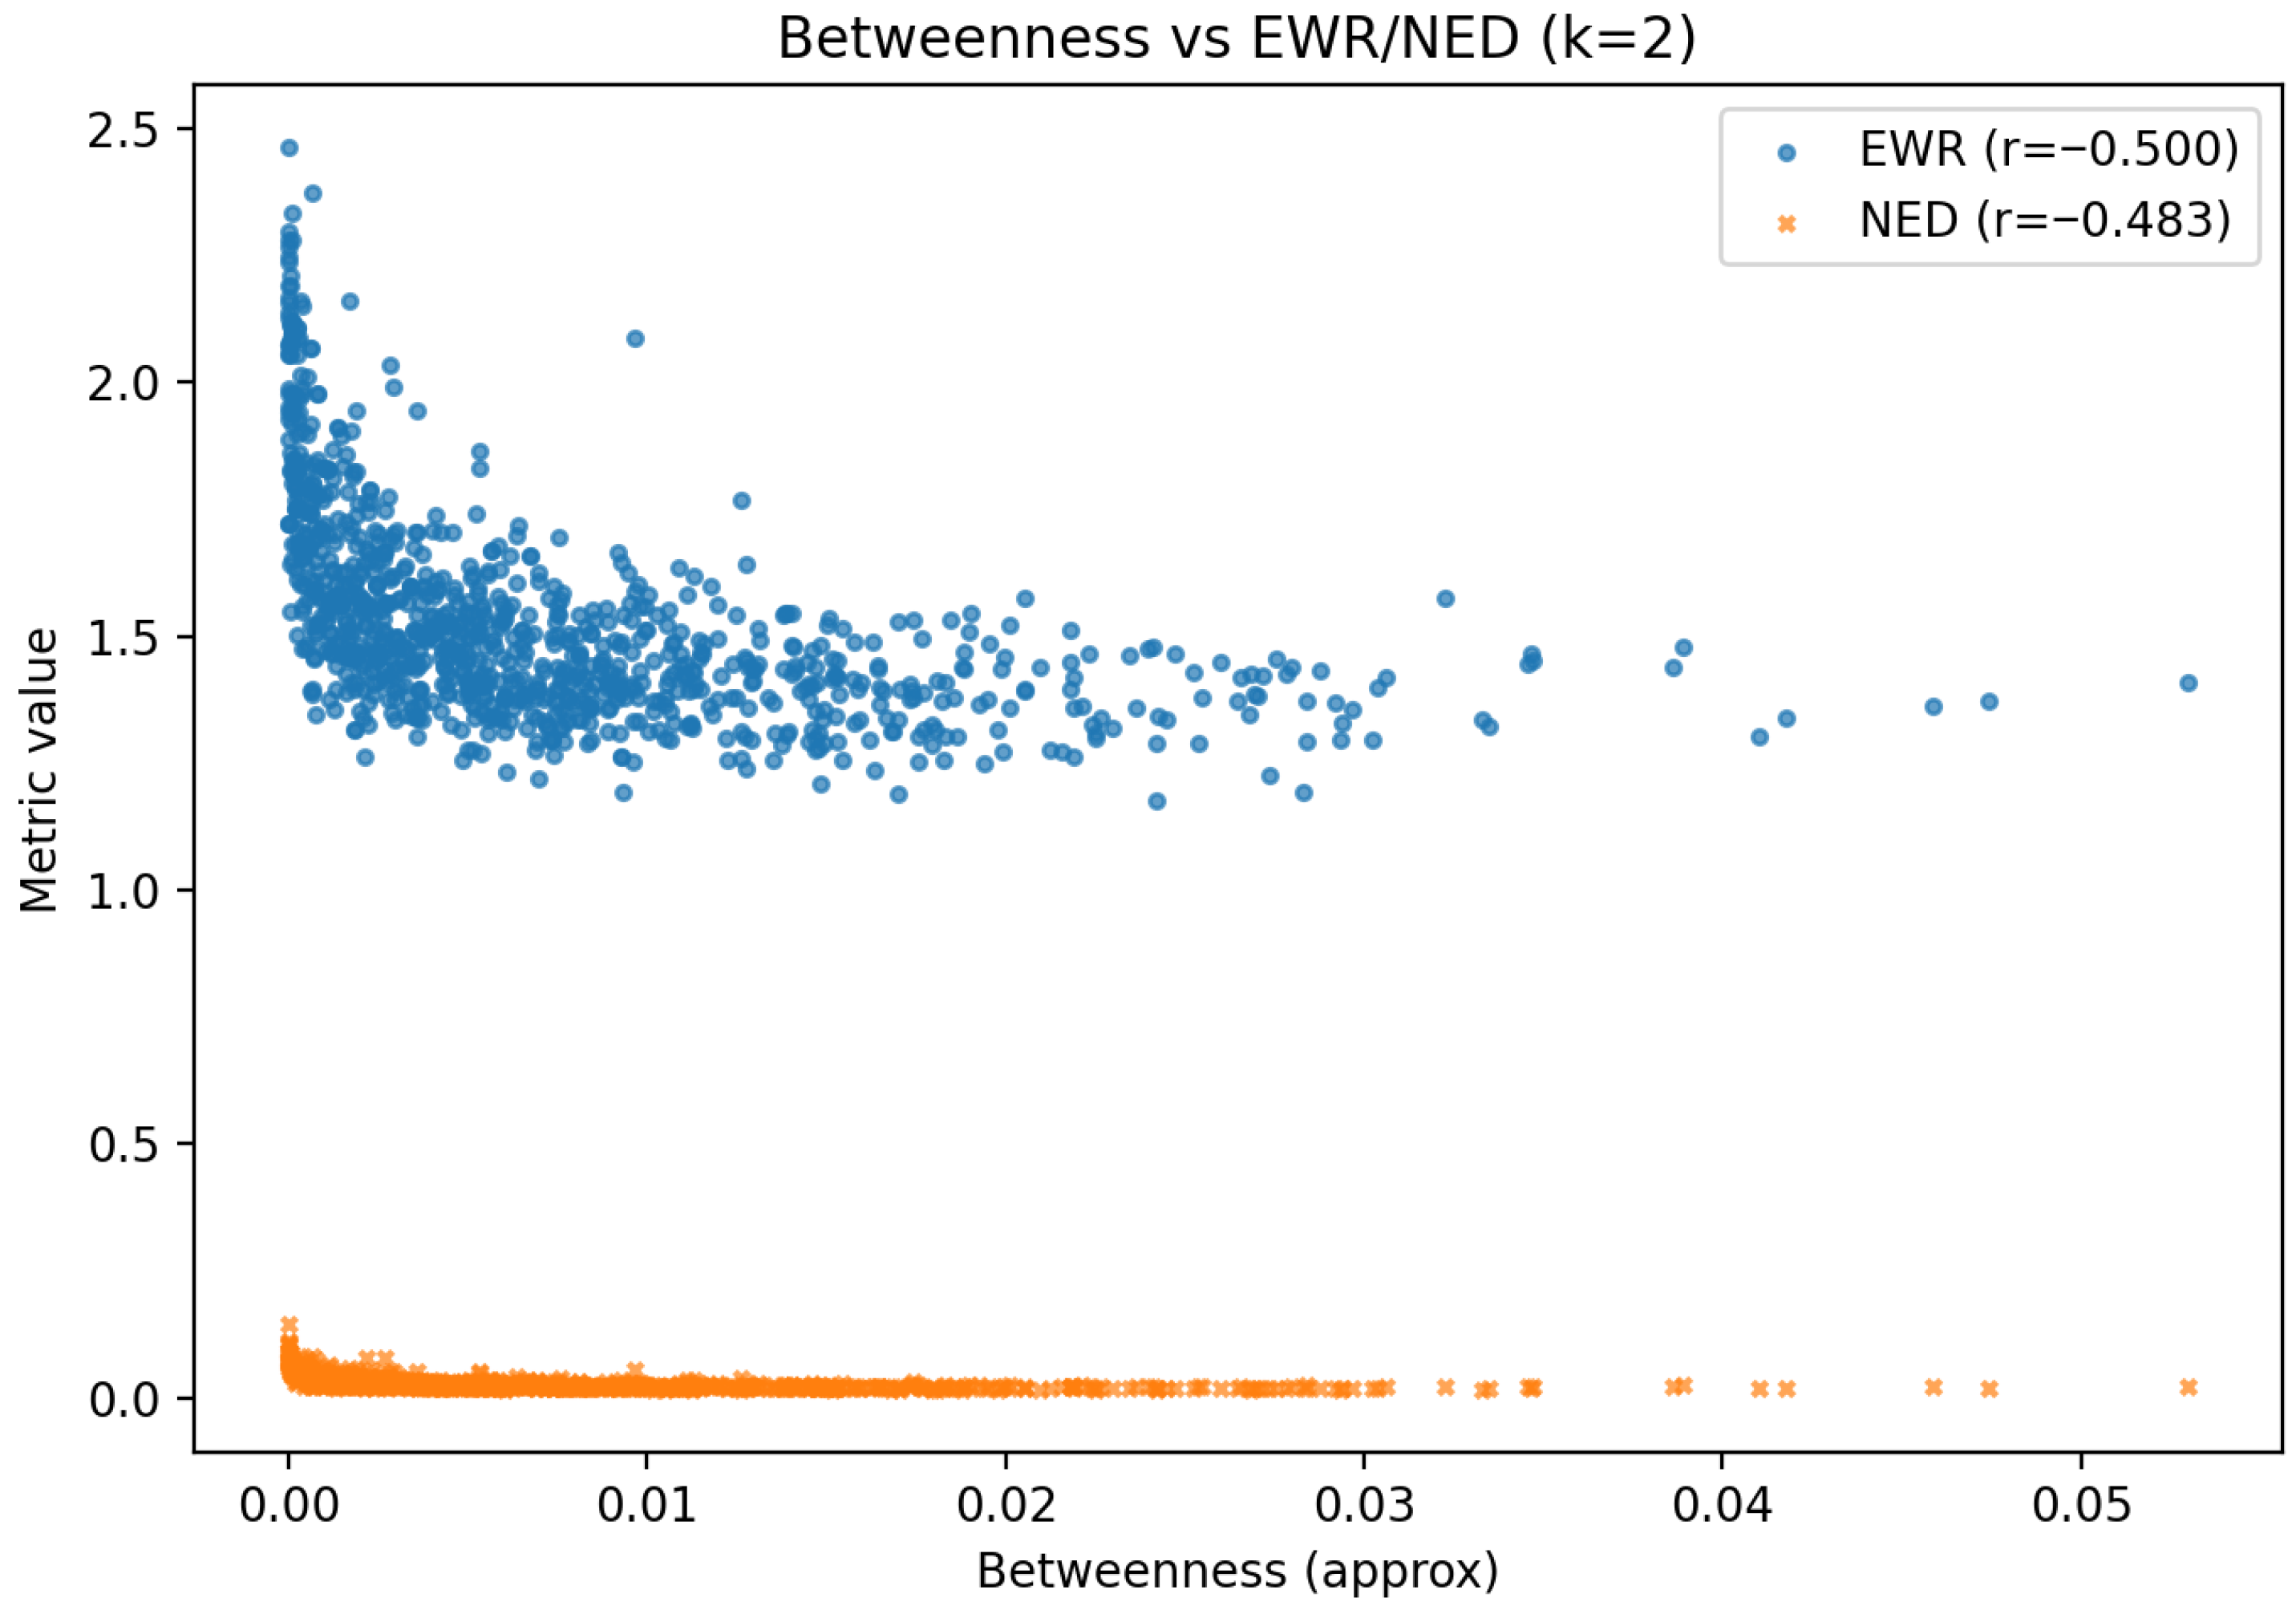
Figure 18 reports moderate negative correlations with betweenness ( r = 0.500 for EWR; r = 0.483 for NED). Spatial bridge nodes do not necessarily exhibit high local-entropy signatures, consistent with geometric clustering.
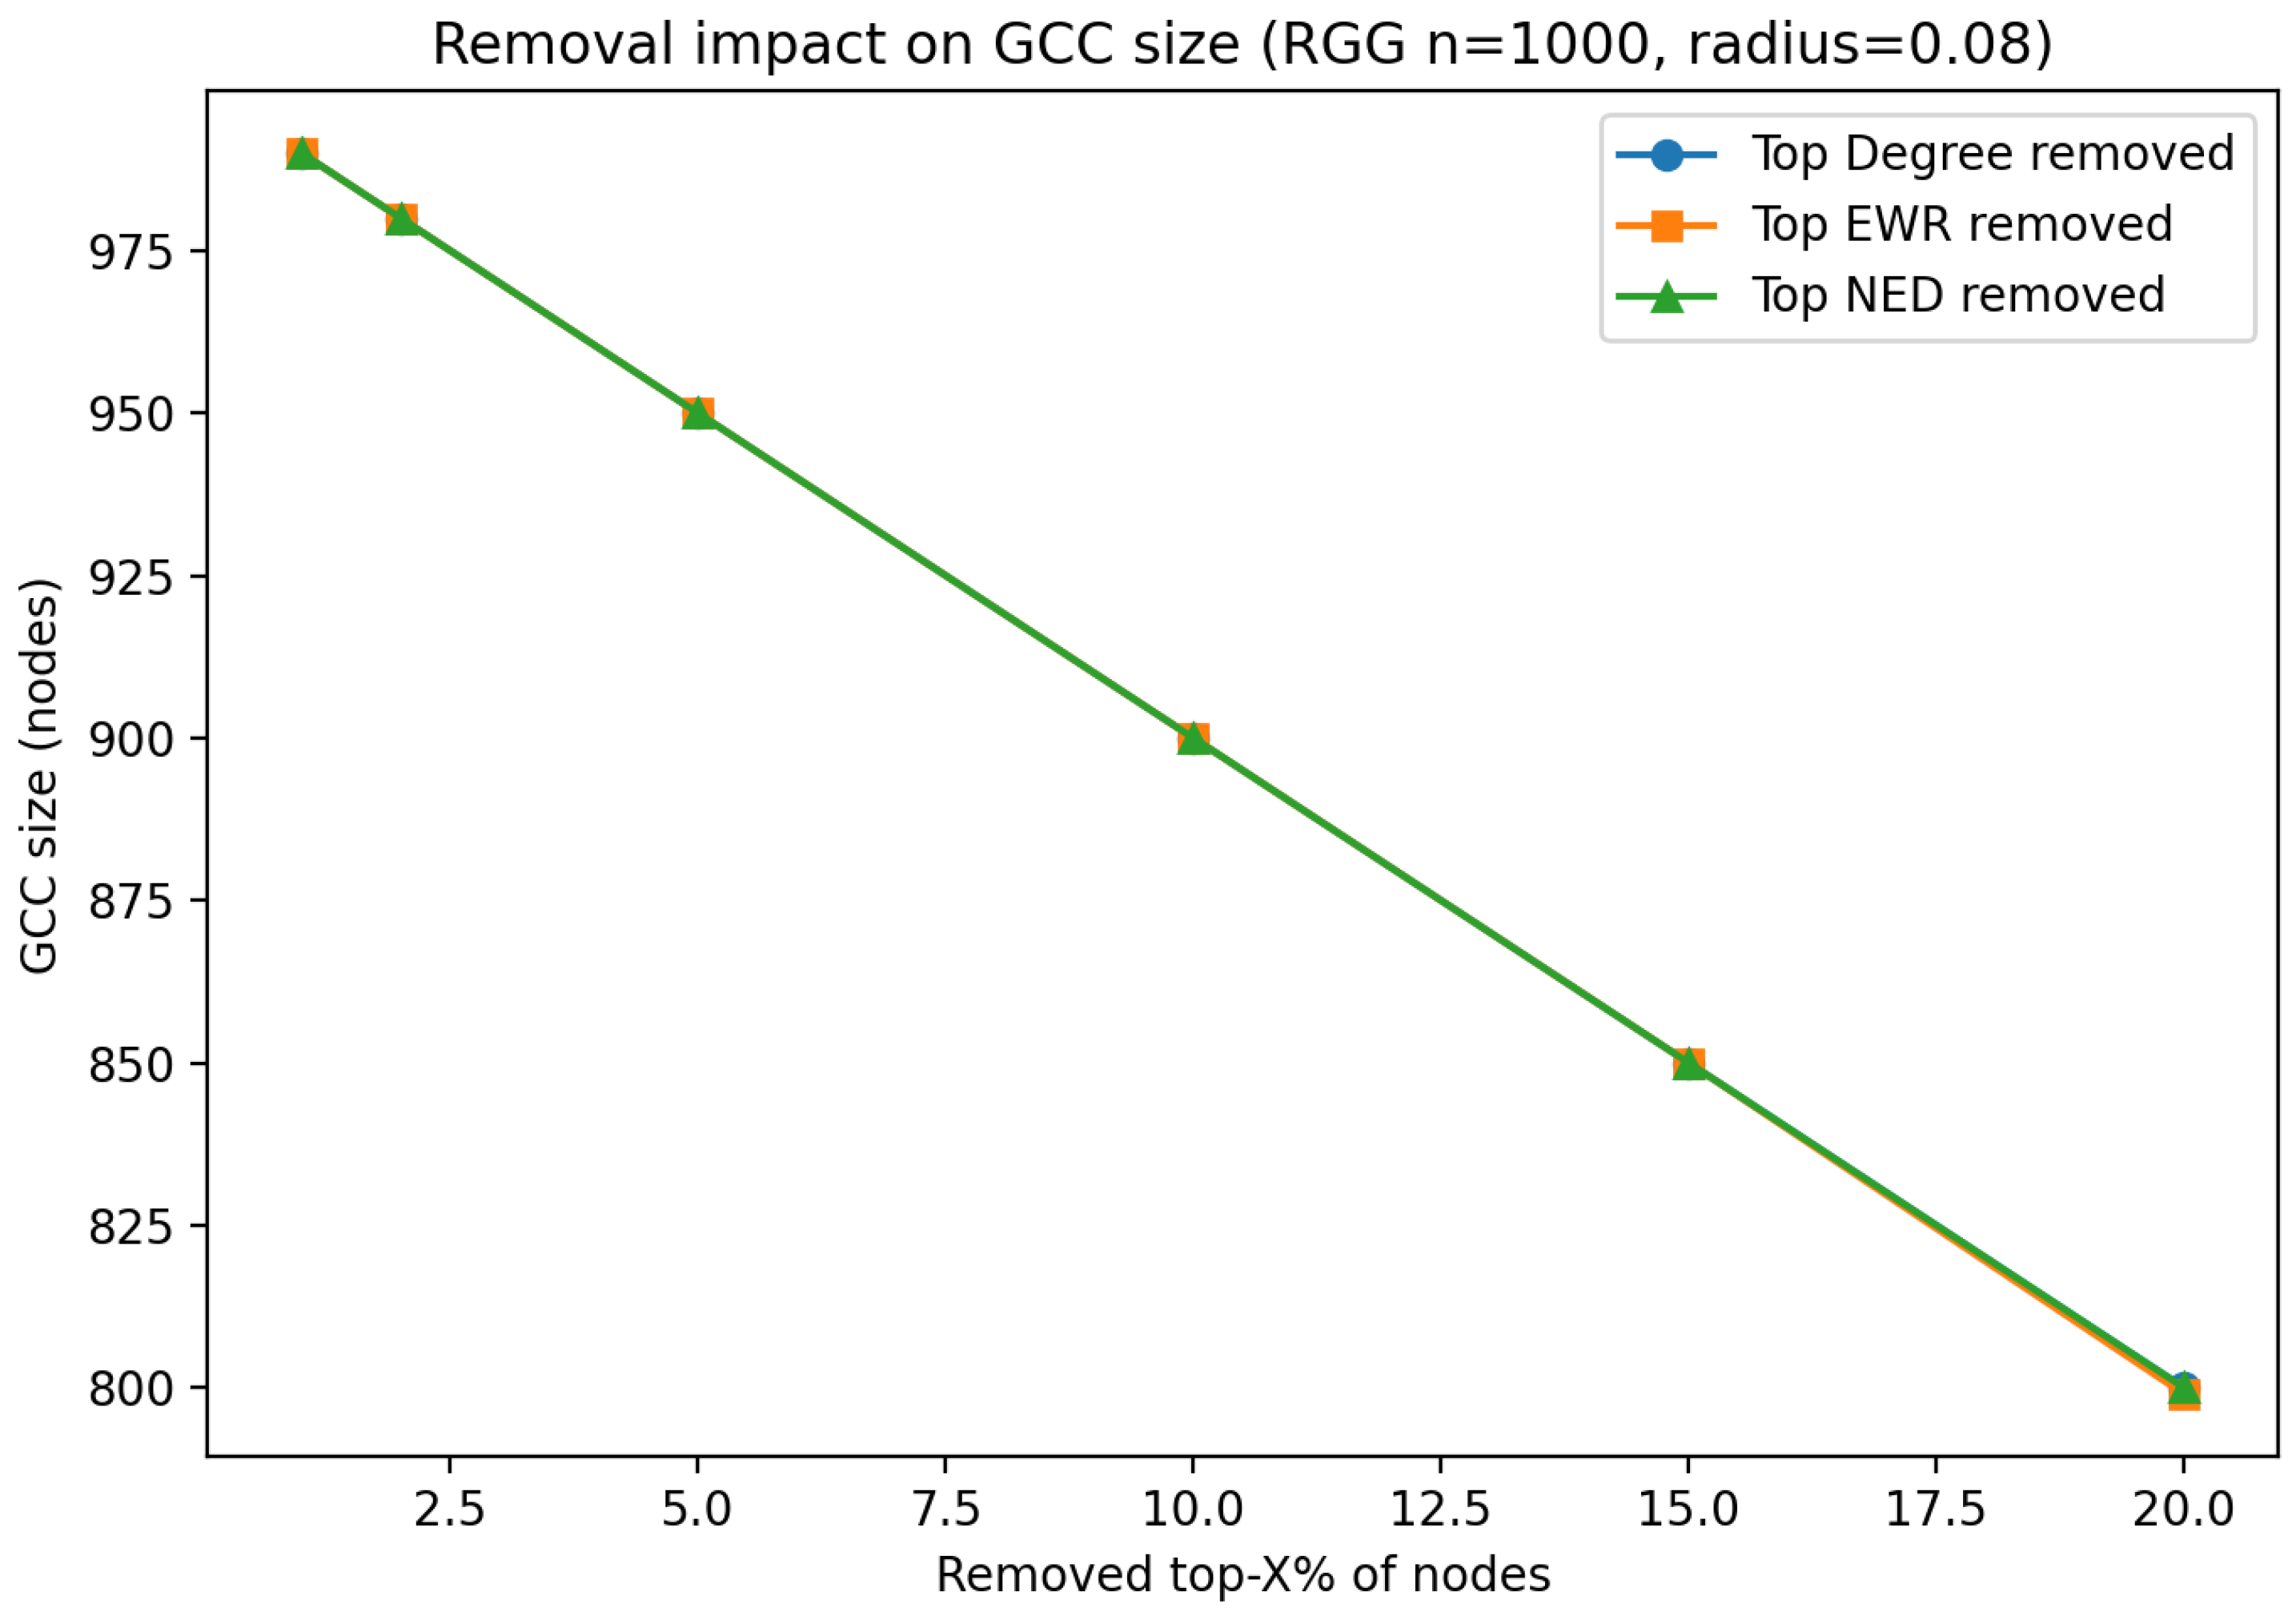
In Figure 19, removing the top-ranked nodes by degree, EWR, or NED produces nearly identical degradation curves for the giant connected component (GCC), suggesting vulnerability is largely governed by geometry rather than nuanced differences between rankings.
Edge-perturbation stability (Figure 20) is higher for NED ( r = 0.874 ) than for EWR ( r = 0.756 ), indicating NED is less sensitive to small random edge changes—useful for robust assessment in spatially constrained networks.
In RGGs, both metrics capture relevant structure: NED offers better perturbation stability but a compressed dynamic range; EWR spreads values more, aiding node differentiation in otherwise homogeneous settings. Spatial constraints, overall, attenuate the discriminative power compared to more heterogeneous graph families.

6.4. Zephyr Graph Analysis

The Zephyr topology, parameterized with m = 10 and t = 4 , represents a modular, low-diameter architecture frequently employed in quantum processor interconnection networks. Its structure combines multiple unit cells with a high degree of local connectivity and relatively short inter-cell paths, making it suitable for analyzing hybrid entropy-based centrality metrics in hardware-relevant scenarios.
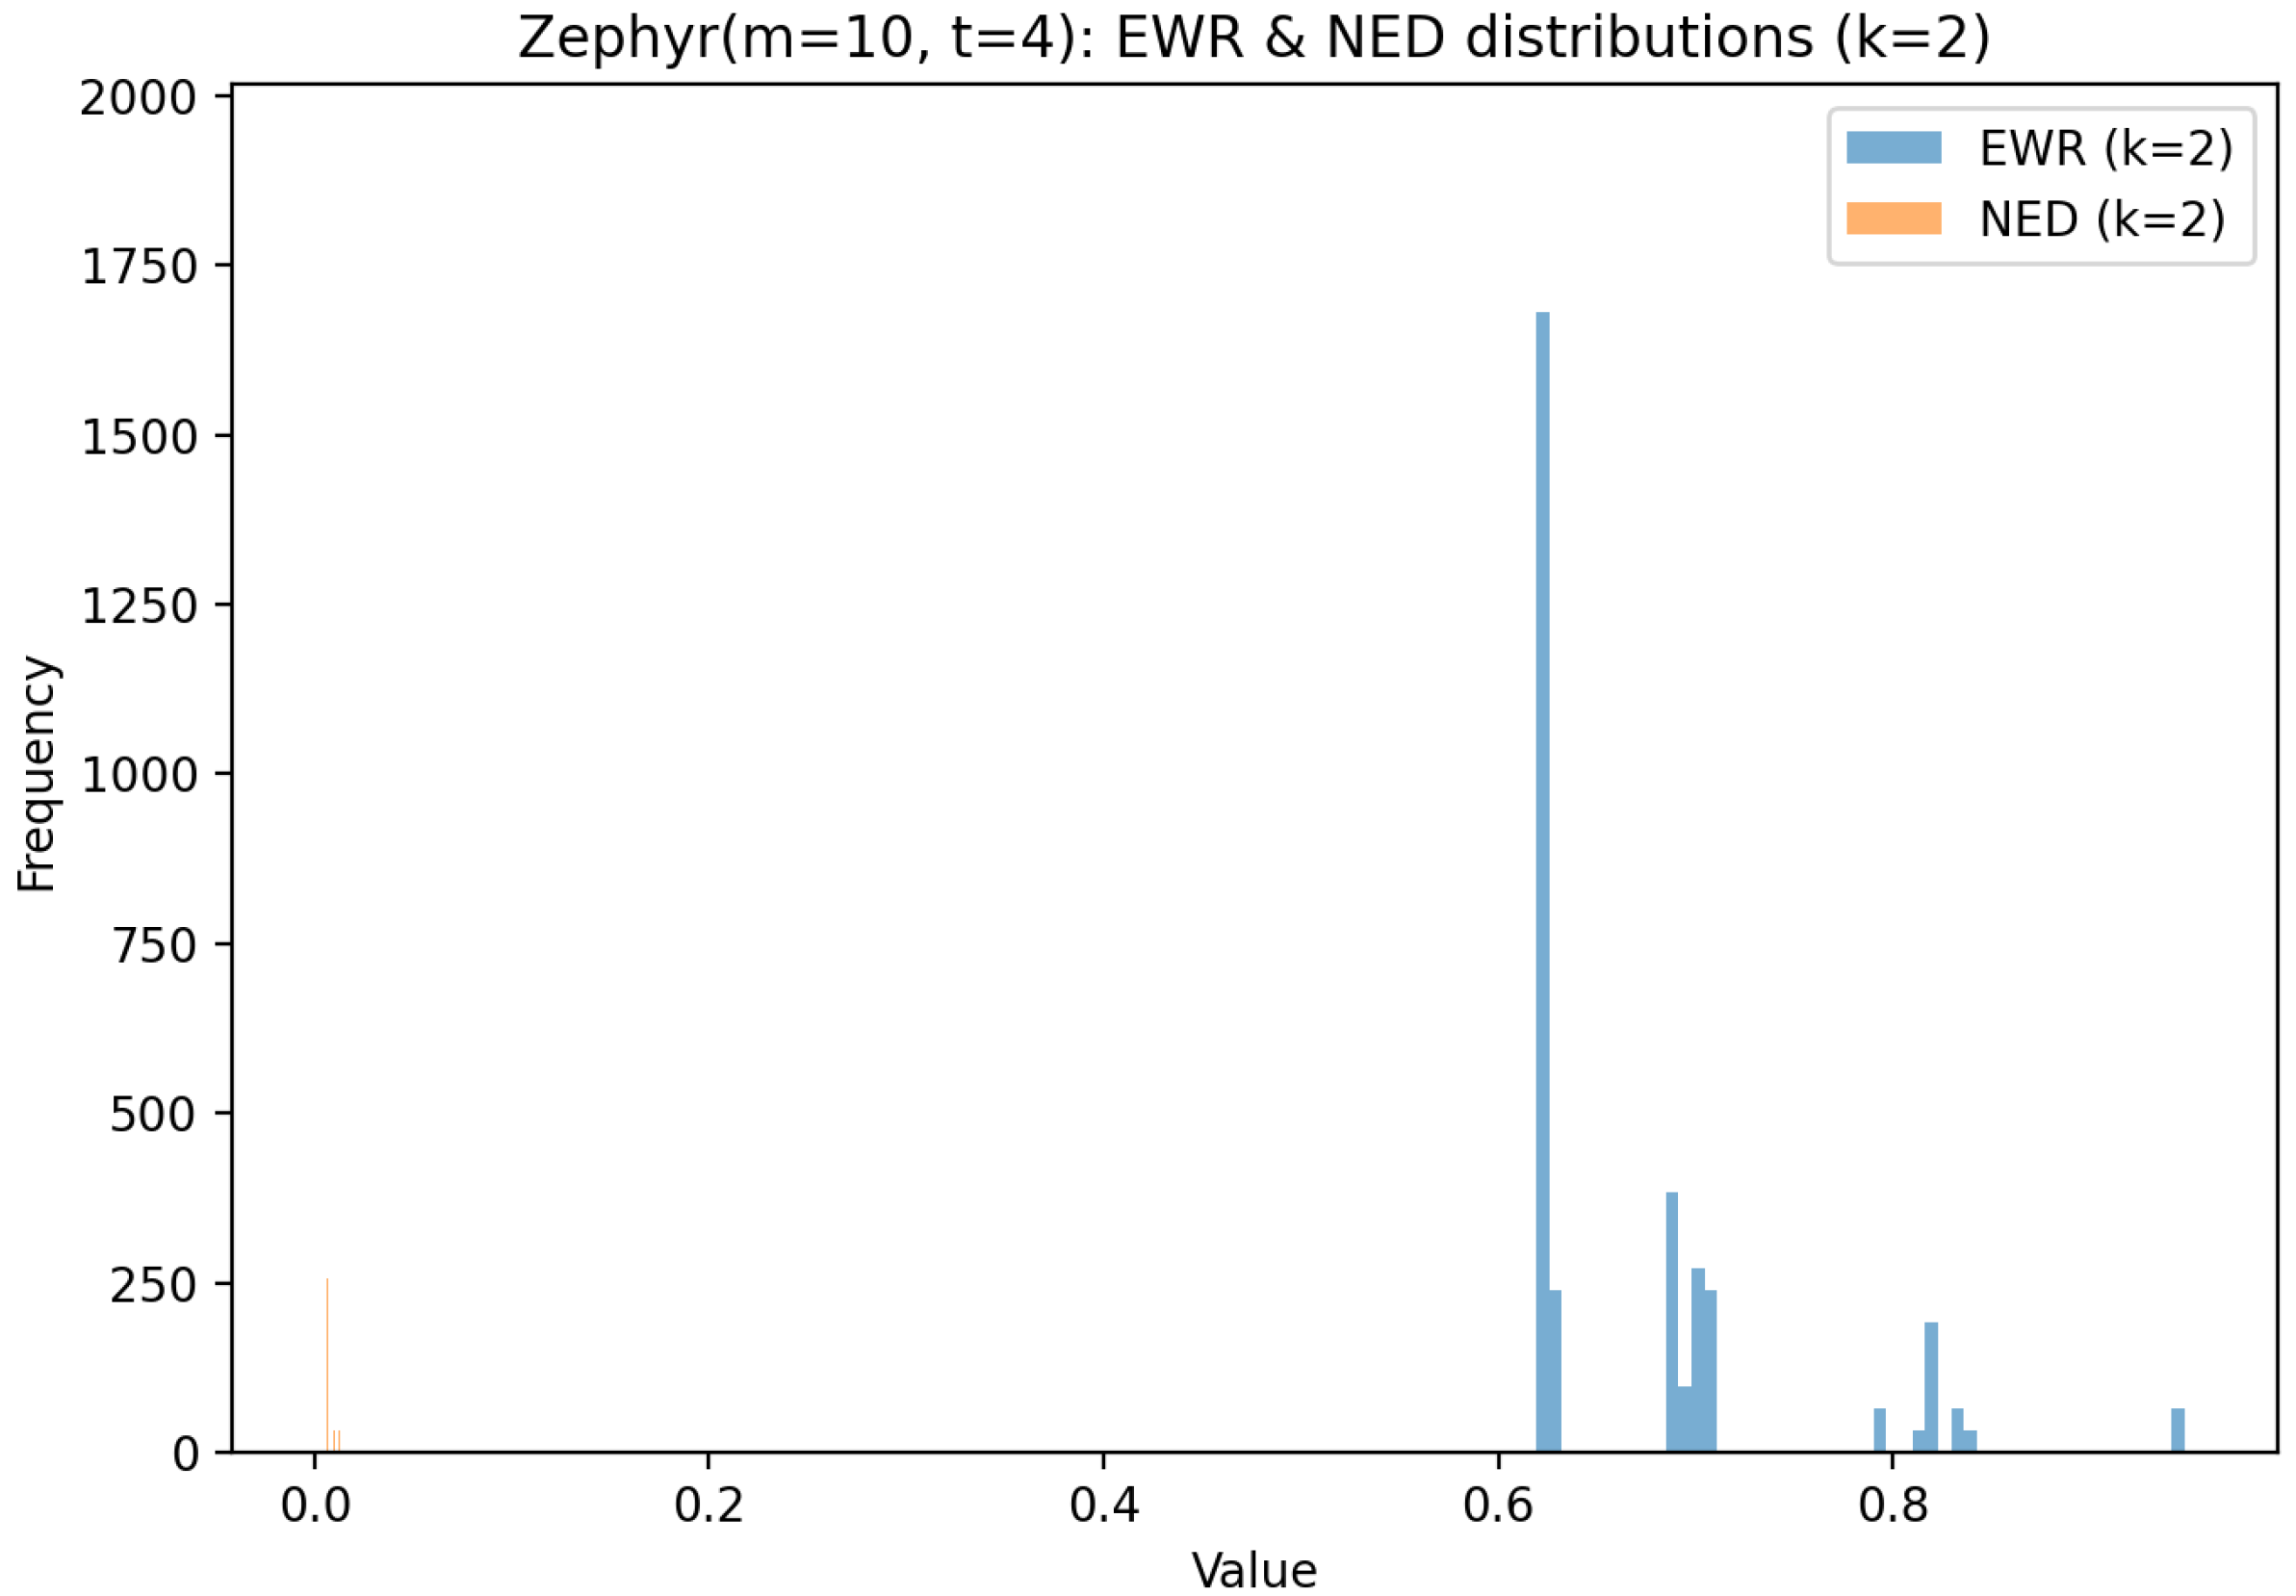
Figure 21 presents the distribution of the Entropy-Weighted Reachability (EWR) and Normalized Entropy Degree (NED) metrics for k = 2 . EWR values are concentrated in several discrete peaks between 0.6 and 0.9, indicating a high degree of uniformity in local reachability across many nodes, with small variations driven by subtle structural asymmetries. In contrast, NED values are tightly clustered near zero, suggesting that the normalized entropy of the degree distribution is minimal and highly homogeneous. This is expected in Zephyr due to the strong regularity of node degrees.
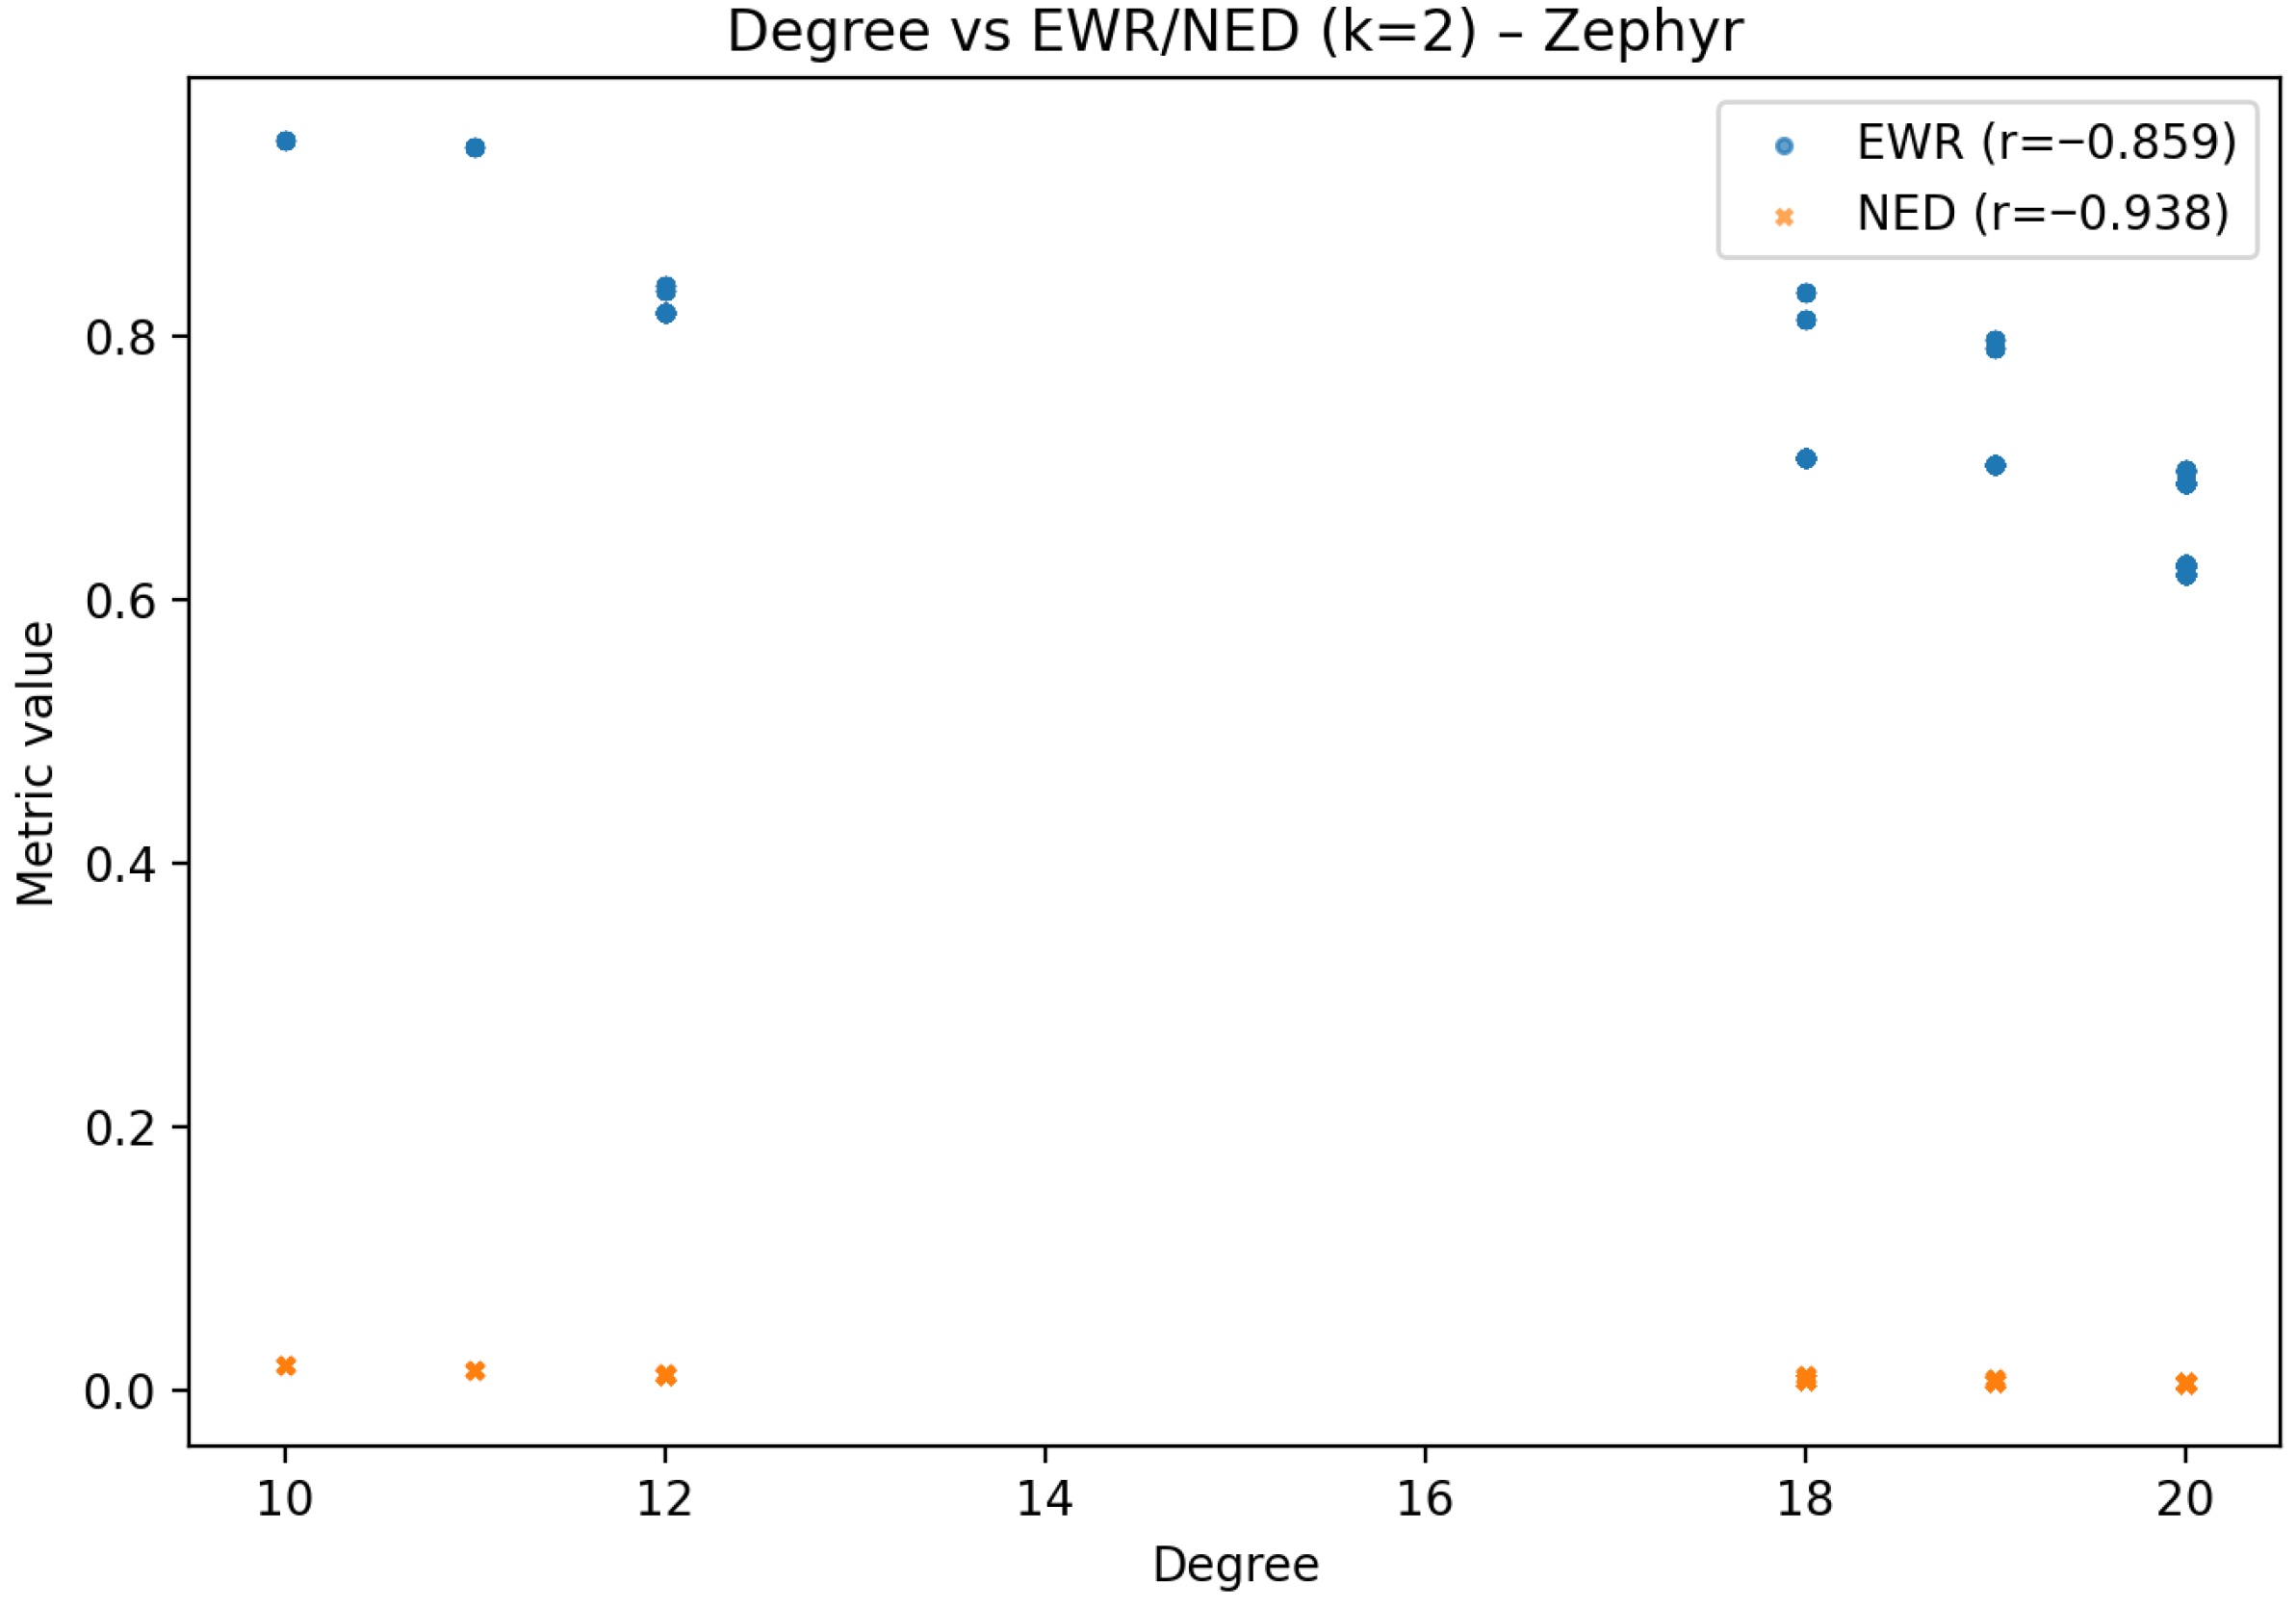
As shown in Figure 22, both metrics are strongly negatively correlated with node degree: EWR ( r = 0.859 ) and NED ( r = 0.938 ). This is consistent with the narrow degree range (10–20), where small increases in degree are associated with lower entropy-based metric values. Such behavior indicates that higher-degree nodes in Zephyr do not necessarily provide proportionally higher k-hop diversity, likely due to redundancy in local connectivity.
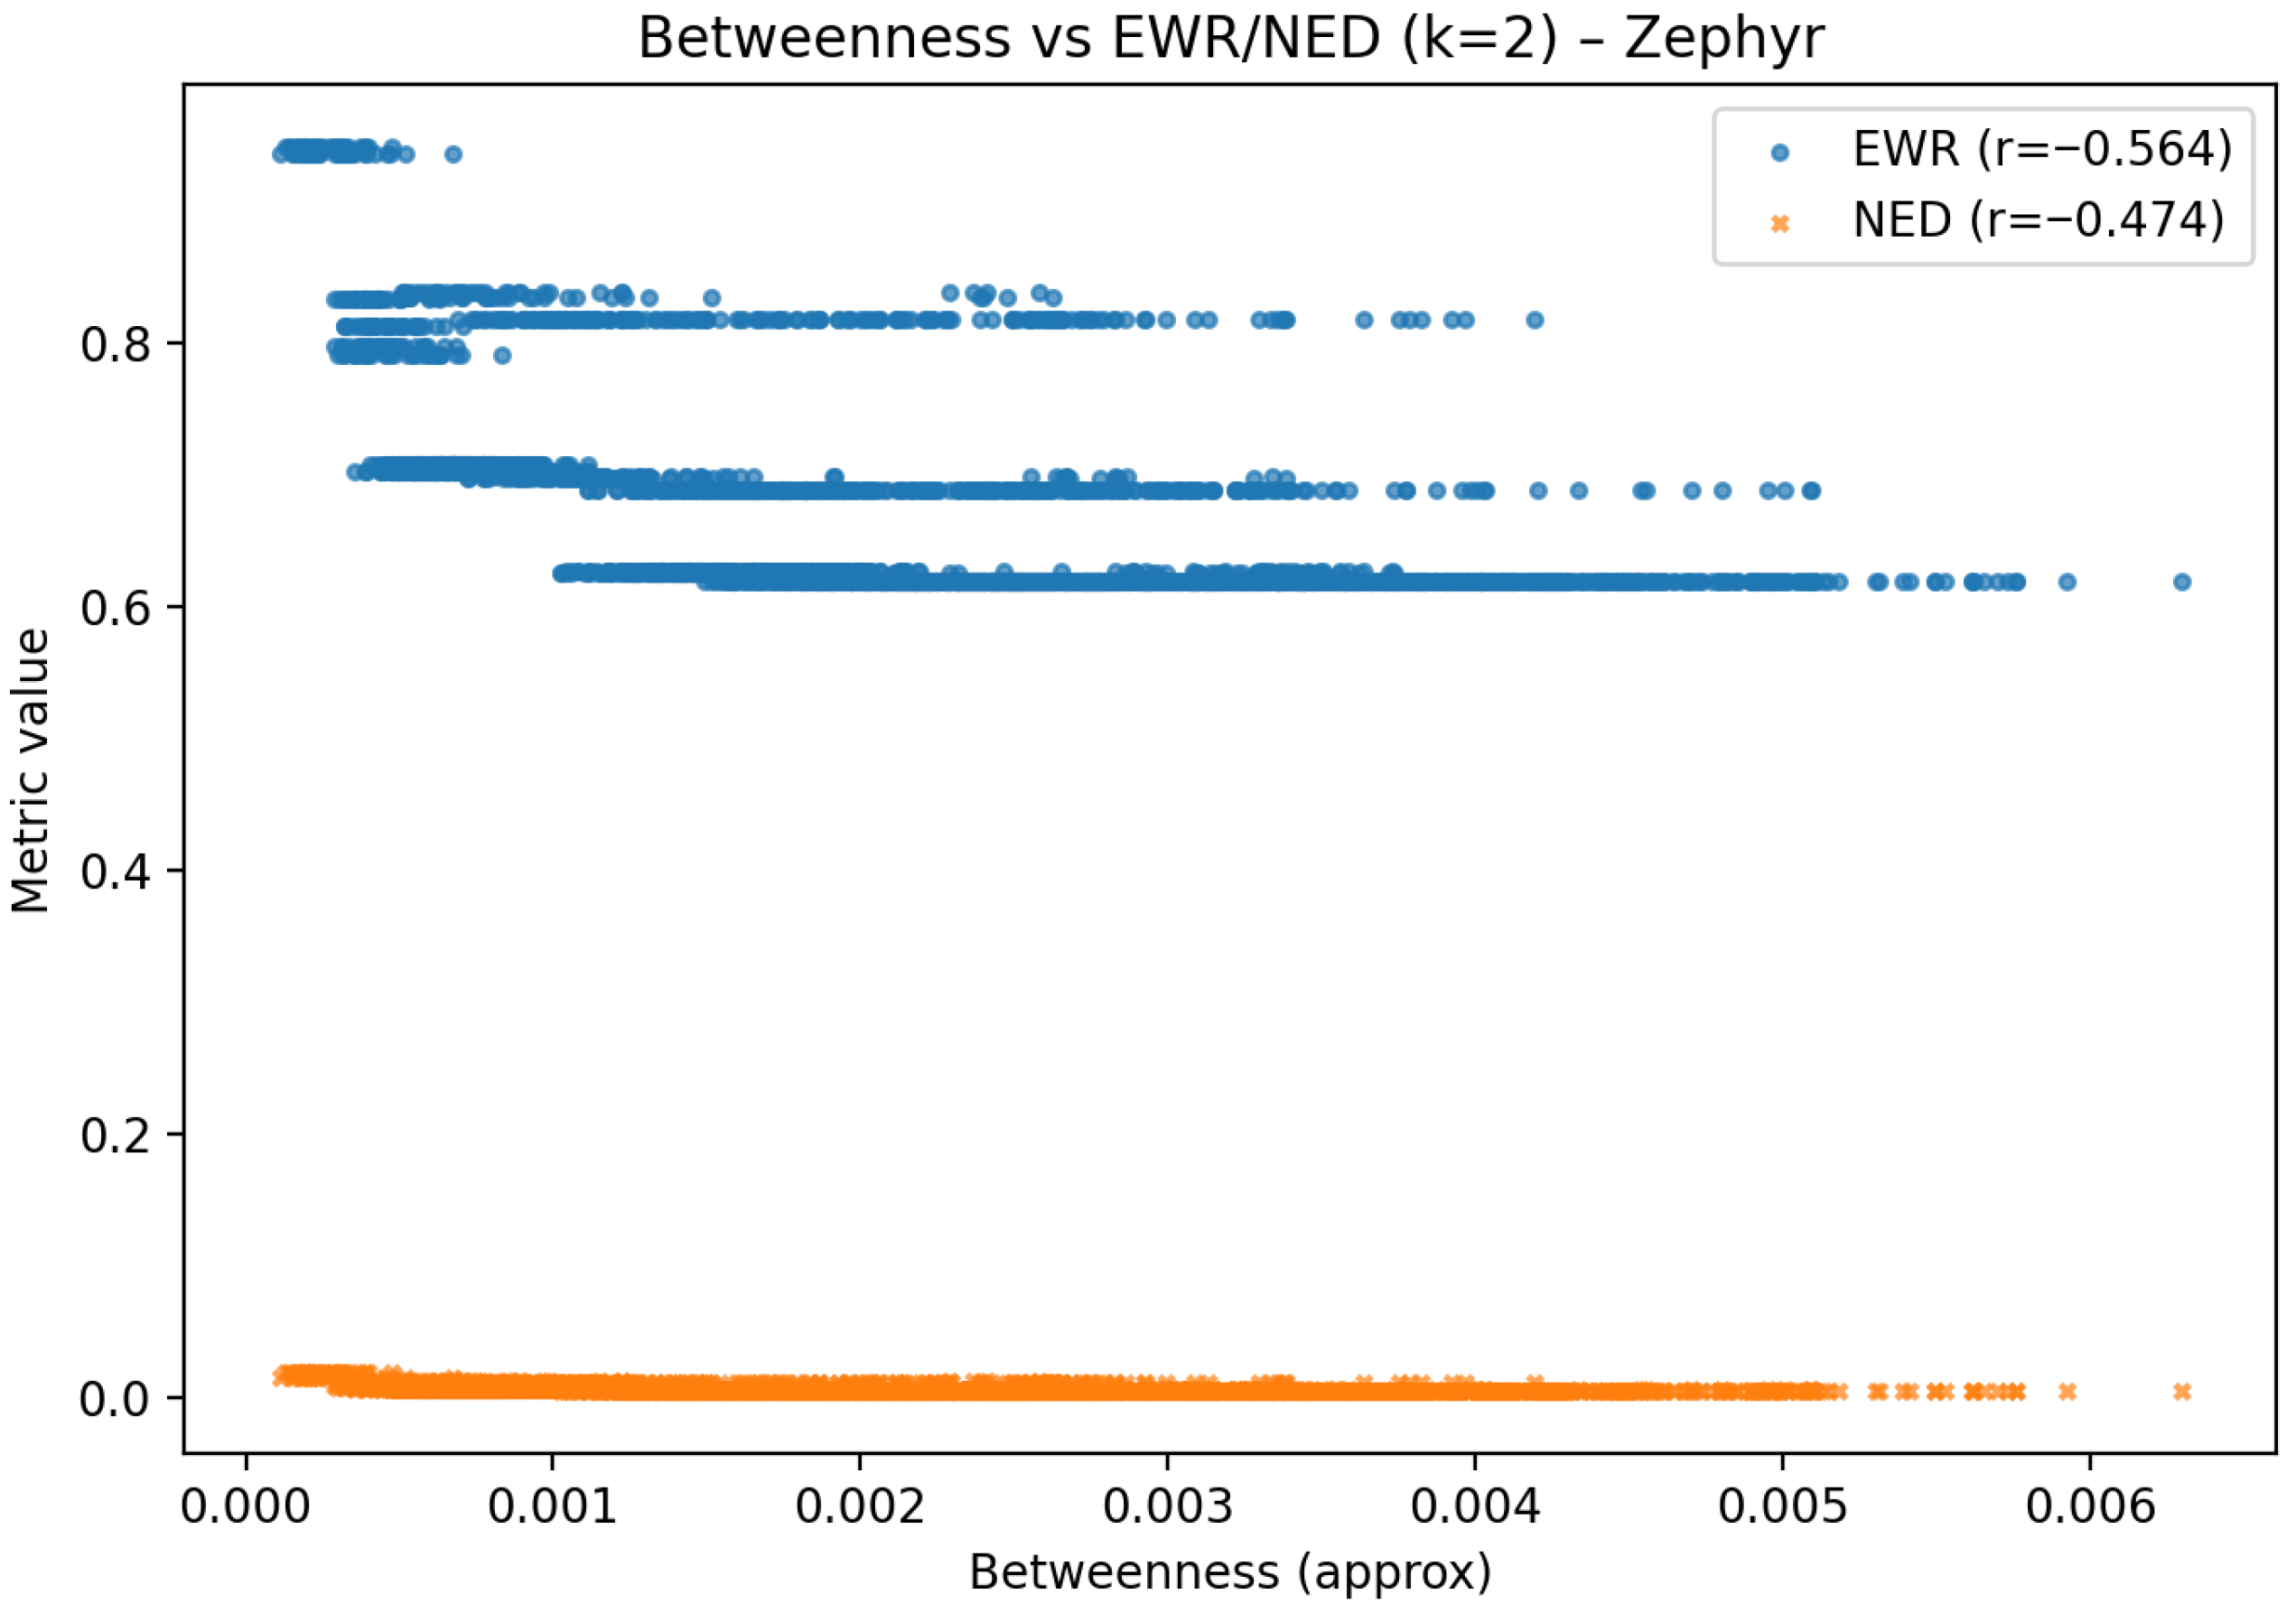
Figure 23 shows the relationship between betweenness centrality and the entropy-based metrics. Both correlations are negative, with EWR ( r = 0.564 ) and NED ( r = 0.474 ), indicating that nodes critical for shortest-path routing tend to have slightly lower k-hop entropy. This suggests that in Zephyr, high-betweenness nodes occupy structurally constrained positions, where connectivity diversity is limited despite their routing importance.
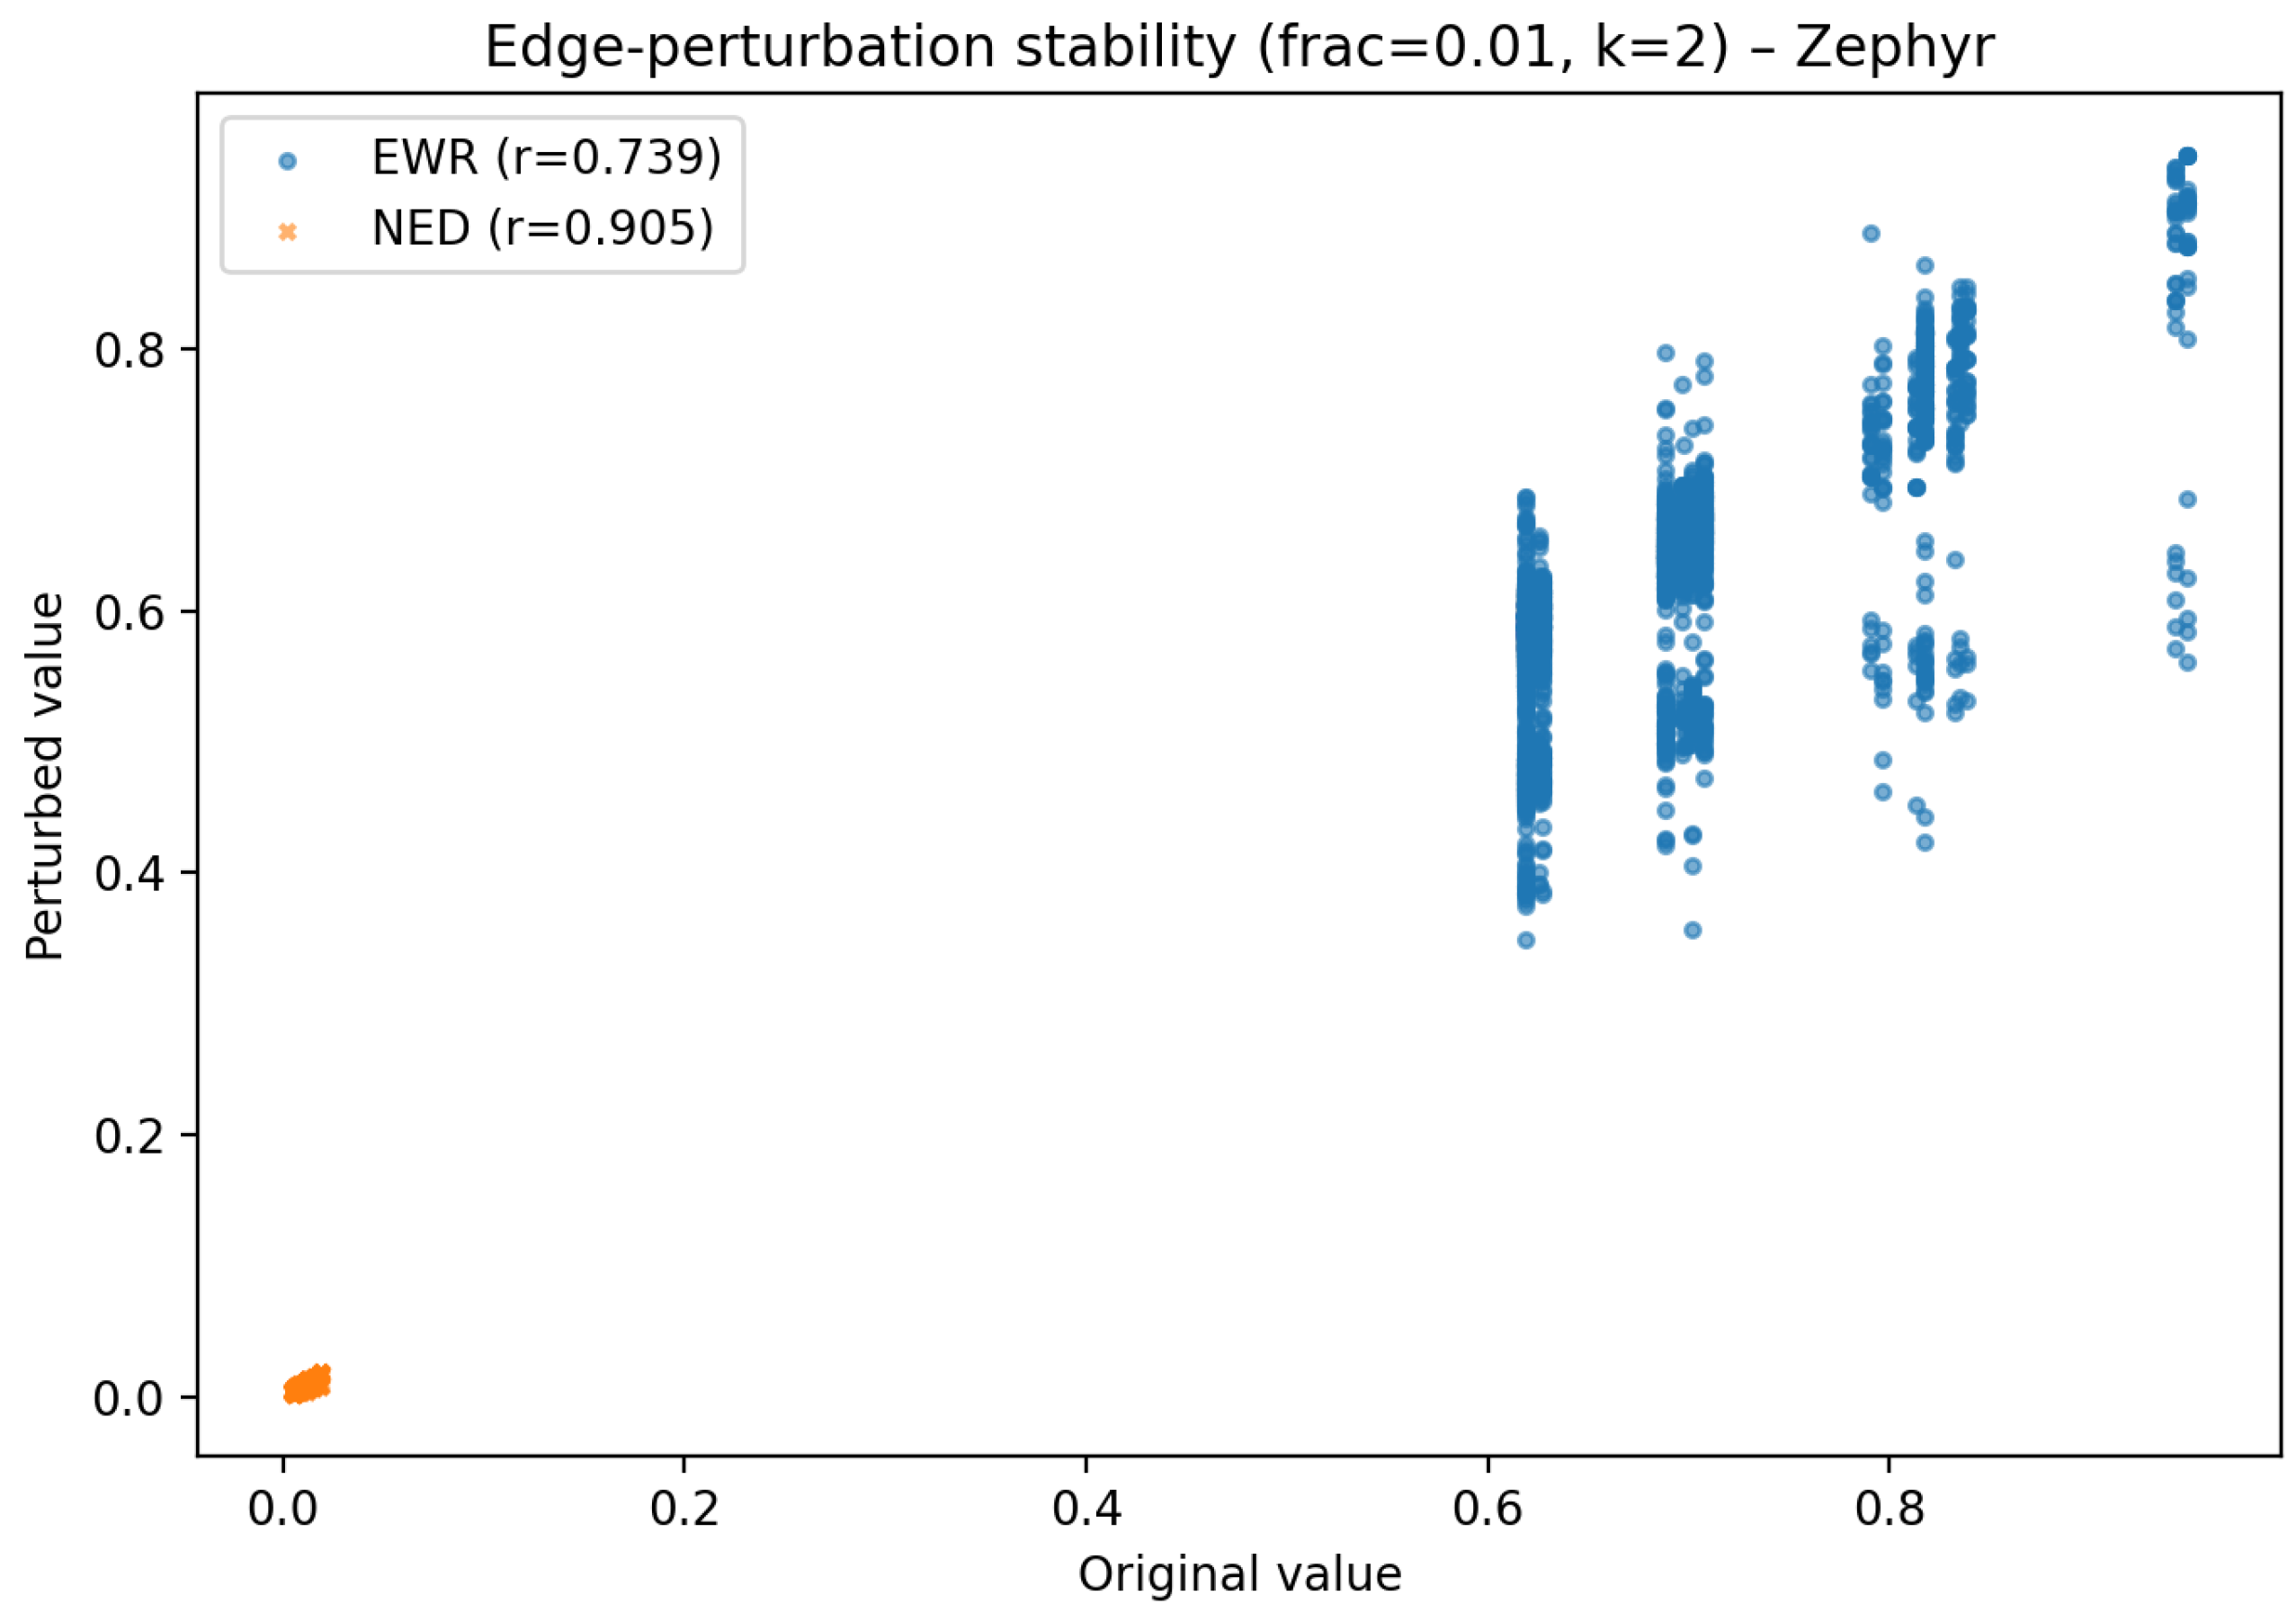
The stability of the metrics under random edge perturbation ( 1 % of edges rewired) is reported in Figure 24. NED demonstrates higher resilience ( r = 0.905 ) compared to EWR ( r = 0.739 ), showing that NED values remain more consistent despite minor topological changes. This robustness is attributable to NED’s reliance on local degree distribution, which is less affected by small perturbations in such a regular graph.
Figure 25 illustrates the reduction in the size of the Giant Connected Component (GCC) when the top-X% of nodes (by Degree, EWR, or NED) are removed. All three strategies produce nearly identical curves, reflecting the high correlation between the metrics and degree in Zephyr’s uniform topology. This indicates that entropy-based rankings do not provide a distinct advantage over simple degree targeting for fragmentation in this architecture.
In the Zephyr topology, the proposed metrics display distinct behavioral patterns. EWR values exhibit moderate stability under perturbations, whereas NED demonstrates a notably higher degree of resilience. Both measures show negative correlations with vertex degree, a consequence of the inherent regularity of the Zephyr architecture. Correlations with betweenness centrality are weaker, though still negative, indicating that vertices with high centrality are not necessarily characterized by elevated entropy-based reachability. In targeted attack simulations, the removal strategies guided by entropy-based rankings closely mirror those based on degree centrality, suggesting that for highly regular topologies such as Zephyr, the additional structural insight offered by EWR and NED may be limited. At the same time, the metrics can still inform practical design heuristics. Vertices with relatively higher EWR values indicate neighborhoods that are more redundant and structurally diverse, which may be favorable for qubit placement, as such regions provide multiple embedding options and potentially shorter chains [20,31]. Conversely, consistently low EWR or NED values correspond to homogeneous surroundings that restrict flexibility and are less desirable for critical variable mapping. From the perspective of fault-tolerant routing, NED can highlight areas with richer sets of alternative short paths, suggesting greater resilience to coupler or qubit failures. In this sense, even in a regular lattice such as Zephyr, the proposed hybrid entropy measures may provide useful heuristics for qubit allocation and for identifying structurally advantageous zones that support robust routing strategies [18].

6.5. Comparative Summary Across Network Topologies

Table 1 and Table 2 summarize the key characteristics of the EWR and NED metrics across all analyzed network topologies ( k = 2 ). The comparison includes the observed distribution shapes, correlation with classical centrality measures (degree and betweenness), robustness to random edge perturbations, and the relative efficiency of targeted node removal.
In the ER random graph, both EWR and NED follow broad, unimodal distributions and exhibit strong to very strong negative correlation with degree (EWR: r = 0.793 , NED: r = 0.648 ). Correlation with approximate betweenness is strong negative for EWR ( r = 0.602 ) and moderate negative for NED ( r = 0.457 ). Perturbation stability is very high (EWR: 0.980 , NED: 0.961 ).
The BA topology produces highly skewed metric distributions dominated by hubs. Correlations with degree are moderate negative for EWR ( r = 0.382 ) and weak negative for NED ( r = 0.265 ). Correlations with betweenness are weak negative (EWR: r = 0.292 , NED: r = 0.183 ). Stability is near-perfect (EWR: 0.986 , NED: 0.948 ), and targeted removals behave almost identically to degree-based strategies.
For the WS small-world model, distributions are narrow and peaked. Correlation with degree is moderate negative (EWR: r = 0.421 , NED: r = 0.458 ), whereas correlation with betweenness is strong negative (EWR: r = 0.691 , NED: r = 0.698 ). Perturbation stability is high (EWR: 0.937 , NED: 0.926 ).
The RGG yields narrower distributions; correlation with degree is moderate negative for EWR ( r = 0.344 ) and strong negative for NED ( r = 0.637 ). Correlation with betweenness is strong negative for EWR ( r = 0.500 ) and moderate negative for NED ( r = 0.483 ). Removal experiments show a slight advantage of the metrics over degree. Stability is moderate-to-high (EWR: 0.756 , NED: 0.874 ).
The Zephyr topology demonstrates a markedly different pattern: EWR values are concentrated into discrete peaks between 0.6 and 0.9 , whereas NED values are clustered near zero. Both metrics correlate negatively with degree (EWR: r = 0.859 , NED: r = 0.938 ) and with betweenness (EWR: r = 0.564 , NED: r = 0.474 ). Stability is moderate for EWR ( 0.739 ) and high for NED ( 0.905 ). In removal experiments, both metrics perform similarly to degree-based targeting.
Overall, Table 1 and Table 2 indicate that across standard network models EWR and NED show consistently negative associations with degree and betweenness, while in the Zephyr topology, their behavior diverges more markedly, revealing sensitivity to structural features that degree and betweenness do not capture.

6.5.1. On the Negative Correlations with Degree

Across all tested network topologies, both EWR and NED exhibit negative correlations with node degree, with the strength of the association varying by model (see Table 1 and Table 2). Using the conventional thresholds (weak: | r | < 0.3 , moderate: 0.3 | r | < 0.5 , strong: 0.5 | r | < 0.7 , very strong: | r | 0.7 ), the patterns can be summarized as follows: in Erdős–Rényi graphs, correlations are strong to very strong negative (typically very strong for EWR and strong for NED); in random geometric graphs, they are moderate to strong negative; in Watts–Strogatz networks, they are typically moderate negative; in Barabási-Albert networks, they are weak to moderate negative; in Zephyr architectures, they are very strong negative. This behavior arises from the intrinsic structure of the metrics rather than from normalization alone: high-degree nodes tend to induce more homogeneous k-hop neighborhoods, which lowers the entropy component H k ( v ) . For NED, the additional division by | N k ( v ) | further amplifies this effect by penalizing disproportionately large yet homogeneous neighborhoods. Conversely, nodes of moderate degree often generate more heterogeneous local structures, resulting in higher entropy-based scores. The consistent negative associations across diverse models therefore reflect genuine structural sensitivity, not an artifact of scaling.

6.5.2. Comparative Perspective

This behavior is distinctive compared with existing entropy-based node measures. Degree-histogram entropy also tends toward negative correlation with degree, but without redundancy/density weighting the effect is typically weaker and less consistent [2]. Von Neumann entropy measures, being spectrum-based and global, do not generally yield stable node-level correlations with degree across models [4,5]. Propagation-entropy variants emphasize dynamical influence but lack explicit penalization of redundancy [9]. By explicitly combining local entropy with structural density, EWR and NED consistently emphasize heterogeneous neighborhoods and reveal structural patterns that are either overlooked or ambiguously treated by previous entropy-based centralities [11].

7. Algorithms, Complexity, and Code Availability

The practical applicability of the proposed metrics requires explicit algorithmic formulations and an analysis of computational scalability. This section provides step-by-step procedures for computing EWR and NED on k-hop neighborhoods, together with complexity bounds that highlight both worst-case and sparse-graph regimes. Finally, implementation details and code availability are summarized to ensure reproducibility of all reported experiments.

7.1. Algorithms

Let G = ( V , E ) be a simple undirected graph and k N the hop parameter. For each v V , denote by N k ( v ) the set of vertices at distance k from v excluding v. On the subgraph induced by N k ( v ) , let deg N k ( v ) ( u ) be the local degree of u (number of neighbours inside N k ( v ) ). Define S ( v ) = u N k ( v ) deg N k ( v ) ( u ) and p u = deg N k ( v ) ( u ) / S ( v ) when S ( v ) > 0 . The local Shannon entropy is H k ( v ) = u N k ( v ) , p u > 0 p u log 2 p u . Let m k ( v ) = 1 2 u N k ( v ) deg N k ( v ) ( u ) be the edge count of the induced subgraph and n k ( v ) = | N k ( v ) | . The redundancy (edge density) is R k ( v ) = m k ( v ) n k ( v ) 2 for n k ( v ) 2 and 0 otherwise. The proposed metrics are
EWR k ( v ) = H k ( v ) · R k ( v ) , NED k ( v ) = H k ( v ) n k ( v ) · R k ( v ) ( n k ( v ) 1 ) ,
and 0 by convention when n k ( v ) { 0 , 1 } or S ( v ) = 0 .
To compute the proposed hybrid entropy-based metrics, two algorithmic procedures are required. First, the k-hop neighborhood of each vertex is extracted using a breadth-first search, as summarized in Algorithm 1. Second, the EWR and NED values are calculated for all vertices by combining the local Shannon entropy with the neighborhood density, as described in Algorithm 2. Together, these algorithms provide a reproducible framework for evaluating the metrics across different network topologies.
Algorithm 1: BFS_UpToK ( G , v , k ) (returns N k ( v ) without v)
Require: Graph G = ( V , E ) as adjacency lists; source v V ; hop radius k 1
Ensure: Set N k ( v )
1:
visited { v } ;   queue [ ( v , 0 ) ] ;    N
2:
while queue not empty do
3:
    ( u , d )  pop_front(queue)
4:
   if  d = = k  then
5:
     continue
6:
   end if
7:
   for each w N ( u )  do
8:
     if  w visited then
9:
        visited ← visited { w } ;    N N { w }
10:
        push_back(queue, ( w , d + 1 ) )
11:
     end if
12:
   end for
13:
end while
14:
return N
Algorithm 2: EWR/NED on k-hop neighborhoods (all vertices)
Require: Graph G = ( V , E ) ; hop radius k
Ensure: Arrays EWR k [ · ] , NED k [ · ]
1:
for each v V  do
2:
    N BFS _ UpToK ( G , v , k )
3:
   if  | N | < 2  then
4:
      EWR k [ v ] 0 ; NED k [ v ] 0
5:
     continue
6:
   end if
7:
   build a set for N to allow O ( 1 ) membership tests
8:
   for each u N  do
9:
      deg N ( u ) | { w N ( u ) N } |
10:
   end for
11:
    S u N deg N ( u )
12:
   if  S = 0  then
13:
      EWR k [ v ] 0 ; NED k [ v ] 0
14:
     continue
15:
   end if
16:
    H u N , deg N ( u ) > 0 deg N ( u ) S log 2 deg N ( u ) S
17:
    m 1 2 u N deg N ( u ) ;    n | N | ;    R m n 2
18:
    EWR k [ v ] H · R ;    NED k [ v ] H n · R
19:
end for

7.2. Computational Complexity

Let B k ( v ) denote the ball of radius k around v and let E ( B k ( v ) ) be the edges incident to B k ( v ) . The BFS step costs O | B k ( v ) | + | E ( B k ( v ) ) | . Computing local degrees and the induced edge count costs O u N k ( v ) deg ( u ) = O | E ( B k ( v ) ) | using O ( 1 ) membership tests. Hence, the per-vertex cost is O | B k ( v ) | + | E ( B k ( v ) ) | , and the full-run cost is
O v V | B k ( v ) | + | E ( B k ( v ) ) | .
Worst case. In dense graphs, | B k ( v ) | = Θ ( n ) and | E ( B k ( v ) ) | = Θ ( n 2 ) , so the naïve all-vertices computation can reach O ( n 3 ) . Sparse bounded-degree regime. If Δ is the maximum degree and k is fixed, | B k ( v ) | = O ( Δ k ) and u N k ( v ) deg ( u ) = O ( Δ k + 1 ) , giving per-vertex O ( Δ k + 1 ) and overall O ( n Δ k + 1 ) time and O ( Δ k ) extra memory. These bounds align with the empirical scalability observed on synthetic networks of size n = 10 3 .

7.3. Code Availability

The full implementation used in this study, including scripts for Erdős–Rényi, Barabási–Albert, Watts–Strogatz, random geometric graphs, and the Zephyr architecture, is openly available at https://github.com/drcsababiro-alt/ewr-ned-metrics (accessed on 30 August 2025). The repository contains common utilities for k-hop neighborhood extraction, entropy and redundancy computation, as well as experiment scripts that reproduce all reported figures and tables. Random seeds are fixed to ensure consistency. Dependencies: networkx, numpy, pandas, matplotlib, and dwave-networkx (Zephyr).

8. Conclusions and Future Work

Two hybrid, entropy-guided metrics were introduced on k-hop neighborhoods: Entropy-Weighted Redundancy (EWR) and Normalized Entropy Density (NED). From a theoretical standpoint, boundedness, invariance under graph isomorphisms, and well-defined extremal behaviors on canonical graph classes were established, clarifying how local entropy and structural density jointly control the metrics’ ranges and sensitivity.
A comprehensive empirical evaluation across Erdős–Rényi, Barabási–Albert, Watts–Strogatz, random geometric graphs, and the Zephyr quantum architecture revealed consistent and interpretable patterns. First, both metrics tend to associate negatively with degree and with approximate betweenness across models, with strengths that vary by topology (Table 1 and Table 2). In standard models, degree associations are typically moderate to strong negative, while betweenness associations are moderate to strong negative as well; in highly regular, hardware-constrained Zephyr graphs, the associations become very strong negative for degree. These tendencies align with the metrics’ construction: high-degree vertices induce more homogeneous local structures, reducing the entropy component, and NED additionally penalizes disproportionately large yet homogeneous neighborhoods through | N k ( v ) | .
Second, perturbation stability proved high in most settings and very high in homogeneous random graphs, indicating robustness of the rankings under mild edge rewiring. Stability remained near-perfect in BA, high in WS, and moderate-to-high in RGG; in Zephyr, stability was moderate for EWR and high for NED, reflecting the tighter structural constraints of the architecture. Third, node-removal experiments showed that EWR/NED are at least comparable to degree-based targeting in fragmenting connectivity; slight advantages over degree were observed in settings with stronger local heterogeneity, whereas behavior was largely similar in hub-dominated or highly regular regimes.
Fourth, distributional shapes carried diagnostic value. In Zephyr, EWR concentrated in discrete peaks in the 0.6–0.9 range, while NED values clustered near zero, signaling the presence of repeated local motifs with limited entropy density; in contrast, standard models exhibited broader (ER) or narrower and peaked (WS, RGG) distributions, each consistent with the underlying generative mechanisms. Together, these findings demonstrate that the proposed metrics supply information largely orthogonal to classical centralities, revealing heterogeneous neighborhoods, bridges, and structurally diverse regions that degree and betweenness only partially capture.
Because the metrics operate on k-hop neighborhoods and combine entropy with density, they are suitable for tasks where local heterogeneity and redundancy matter: identifying vulnerable connectors, prioritizing nodes for intervention, and informing topology-aware optimization. The Zephyr case indicates relevance for quantum hardware mapping and layout-aware robustness analysis, where repeated motifs and routing constraints shape the effective search space.
Discriminative power can diminish in highly regular topologies, where entropy spreads are narrow and NED concentrates near zero; this is a natural consequence of low local heterogeneity. Computational costs may become significant on very large graphs without approximation. Future directions therefore include (i) scalable approximations (sampling, sketching, streaming) for massive networks; (ii) extensions to weighted, directed, temporal and multiplex settings; (iii) integration with motif- or hypergraph-based local structure; and (iv) theoretical characterization under broader generative models, including finite-size effects and concentration bounds. These avenues are expected to further consolidate the role of hybrid entropy-based metrics as complementary tools for local structural analysis in both classical and quantum networked systems.
A limitation of the present approach is that both EWR and NED exhibit reduced discriminative power in highly regular graphs, such as the Zephyr architecture, where local structures are largely homogeneous. This constrains their ability to highlight structurally critical vertices in such settings. Future work may extend these entropy-guided metrics to dynamic or temporal networks, where the ability to track evolving structural heterogeneity and resilience over time would provide valuable additional insights.

Funding

This research was supported by the EKÖP-24 University Research Fellowship Program of the Ministry for Culture and Innovation from the source of the National Research, Development and Innovation Fund, by the Ministry of Innovation and Technology (Grant No. 2024-2.1.1-EKÖP), and by the National Research, Development and Innovation Office within the Quantum Information National Laboratory of Hungary (Grant No. 2022-2.1.1-NL-2022-00004).

Data Availability Statement

The original contributions presented in this study are included in the article. Further inquiries can be directed to the corresponding author.

Conflicts of Interest

The author declares no conflicts of interest.

References

  1. Anand, K.; Bianconi, G. Entropy measures for networks: Toward an information theory of complex topologies. Phys. Rev. E—Stat. Nonlinear Soft Matter Phys. 2009, 80, 045102. [Google Scholar] [CrossRef]
  2. Xiao, Y.; Wu, W.; Wang, H.; Xiong, M.; Wang, W. Symmetry-based structure entropy of complex networks. Phys. A Stat. Mech. Its Appl. 2008, 387, 2611–2619. [Google Scholar] [CrossRef]
  3. Mowshowitz, A.; Dehmer, M. Entropy and the complexity of graphs revisited. Entropy 2012, 14, 559–570. [Google Scholar] [CrossRef]
  4. Passerini, F.; Severini, S. The von Neumann entropy of networks. arXiv 2008, arXiv:0812.2597v2. [Google Scholar] [CrossRef]
  5. Han, L.; Escolano, F.; Hancock, E.R.; Wilson, R.C. Graph characterizations from von Neumann entropy. Pattern Recognit. Lett. 2012, 33, 1958–1967. [Google Scholar] [CrossRef]
  6. Choi, H.; He, J.; Hu, H.; Shi, Y. Fast computation of von Neumann entropy for large-scale graphs via quadratic approximations. Linear Algebra Its Appl. 2020, 585, 127–146. [Google Scholar] [CrossRef]
  7. Chen, P.-Y.; Wu, L.; Liu, S.; Rajapakse, I. Fast incremental von Neumann graph entropy computation: Theory, algorithm, and applications. In Proceedings of the International Conference on Machine Learning-PMLR, Long Beach, CA, USA, 9–15 June 2019; Volume 97, pp. 1091–1101. Available online: http://proceedings.mlr.press/v97/chen19j/chen19j.pdf (accessed on 9 August 2025).
  8. Paton, J.; Hartle, H.; Stepanyants, H.; van der Hoorn, P.; Krioukov, D. Entropy of labeled versus unlabeled networks. Phys. Rev. E 2022, 106, 054308. [Google Scholar] [CrossRef]
  9. Yu, Y.; Zhao, B.; Chen, L.; Gao, T.; Li, J. Identifying important nodes in complex networks based on node propagation entropy. Entropy 2022, 24, 275. [Google Scholar] [CrossRef]
  10. Fortunato, S.; Hric, D. Community detection in networks: A user guide. Phys. Rep. 2016, 659, 1–44. [Google Scholar] [CrossRef]
  11. Omar, Y.M.; Plapper, P. A survey of information entropy metrics for complex networks. Entropy 2020, 22, 1417. [Google Scholar] [CrossRef]
  12. Angelidis, G.; Ioannidis, E.; Makris, G.; Antoniou, I.; Varsakelis, N. Competitive Conditions in Global Value Chain Networks: An Assessment Using Entropy and Network Analysis. Entropy 2020, 22, 1068. [Google Scholar] [CrossRef]
  13. Ai, X. Node Importance Ranking of Complex Networks with Entropy Variation. Entropy 2017, 19, 303. [Google Scholar] [CrossRef]
  14. Liu, S.; Gao, H. The Structure Entropy-Based Node Importance Ranking Method for Graph Data. Entropy 2023, 25, 941. [Google Scholar] [CrossRef]
  15. Sen, B.; Chu, S.-H.; Parhi, K.K. Ranking Regions, Edges and Classifying Tasks in Functional Brain Graphs by Sub-Graph Entropy. Sci. Rep. 2019, 9, 7628. [Google Scholar] [CrossRef]
  16. Estrada, E. Complex networks in the Euclidean space of communicability distances. Phys. Rev. E 2012, 85, 066122. [Google Scholar] [CrossRef]
  17. Newman, M. Networks, 2nd ed.; Oxford University Press: Oxford, UK, 2018; ISBN 9780198805090. [Google Scholar]
  18. Boothby, T.; King, A.D.; Roy, A. Fast clique minor generation in Chimera qubit connectivity graphs. Quantum Inf. Process. 2016, 15, 495–508. [Google Scholar] [CrossRef]
  19. Dattani, N.S.; Szalay, S.; Chancellor, N. Pegasus: The second connectivity graph for large-scale quantum annealing hardware. arXiv 2019, arXiv:1901.07636. [Google Scholar] [CrossRef]
  20. Cai, J.; Macready, W.G.; Roy, A. A practical heuristic for finding graph minors. arXiv 2014, arXiv:1406.2741. [Google Scholar] [CrossRef]
  21. Pelofske, E.; Hahn, G.; Djidjev, H. Decomposition algorithms for solving NP-hard problems on a quantum annealer. J. Signal Process. Syst. 2022, 93, 405–420. [Google Scholar] [CrossRef]
  22. Biamonte, J.; Wittek, P.; Pancotti, N.; Rebentrost, P.; Wiebe, N.; Lloyd, S. Quantum machine learning. Nature 2017, 549, 195–202. [Google Scholar] [CrossRef]
  23. Biró, C.; Kusper, G. Some k-Hop Based Graph Metrics and Node Ranking in Wireless Sensor Networks. Ann. Math. Informaticae 2019, 50, 19–37. [Google Scholar] [CrossRef]
  24. Biró, C. Analysis of D-Wave Topologies with Classical Graph Metrics. Int. J. Math. Comput. Sci. 2024, 19, 1171–1175. [Google Scholar]
  25. Biró, C.; Kusper, G. Analysis of D-Wave Topologies with k-Hop-Based Graph Metrics. Quantum Rep. 2025, 7, 17. [Google Scholar] [CrossRef]
  26. Biró, C. Structural Sensitivity in Graphs: An Entropy-Based k-Hop Metric and its Applications. In Proceedings of the 2025 IEEE 19th International Symposium on Applied Computational Intelligence and Informatics (SACI), Budapest, Hungary, and Timişoara, Romania, 19–24 May 2025; pp. 273–278. [Google Scholar] [CrossRef]
  27. Erdős, P.; Rényi, A. On the evolution of random graphs. A Magyar Tudományos Akadémia Matematikai Kutató Intézetének Közleményei 1959, 5, 17–61. [Google Scholar]
  28. Barabási, A.-L.; Albert, R. Emergence of scaling in random networks. Science 1999, 286, 509–512. [Google Scholar] [CrossRef]
  29. Watts, D.J.; Strogatz, S.H. Collective dynamics of ’small-world’ networks. Nature 1998, 393, 440–442. [Google Scholar] [CrossRef]
  30. Penrose, M. Random Geometric Graphs; Oxford University Press: Oxford, UK, 2003; ISBN 9780191545030. [Google Scholar]
  31. Boothby, K.; King, D.A.; Raymond, J. Zephyr Topology of D-Wave Quantum Processors. D-Wave Technical Report. 2021. Available online: https://www.dwavequantum.com/media/2uznec4s/14-1056a-a_zephyr_topology_of_d-wave_quantum_processors.pdf (accessed on 9 August 2025).
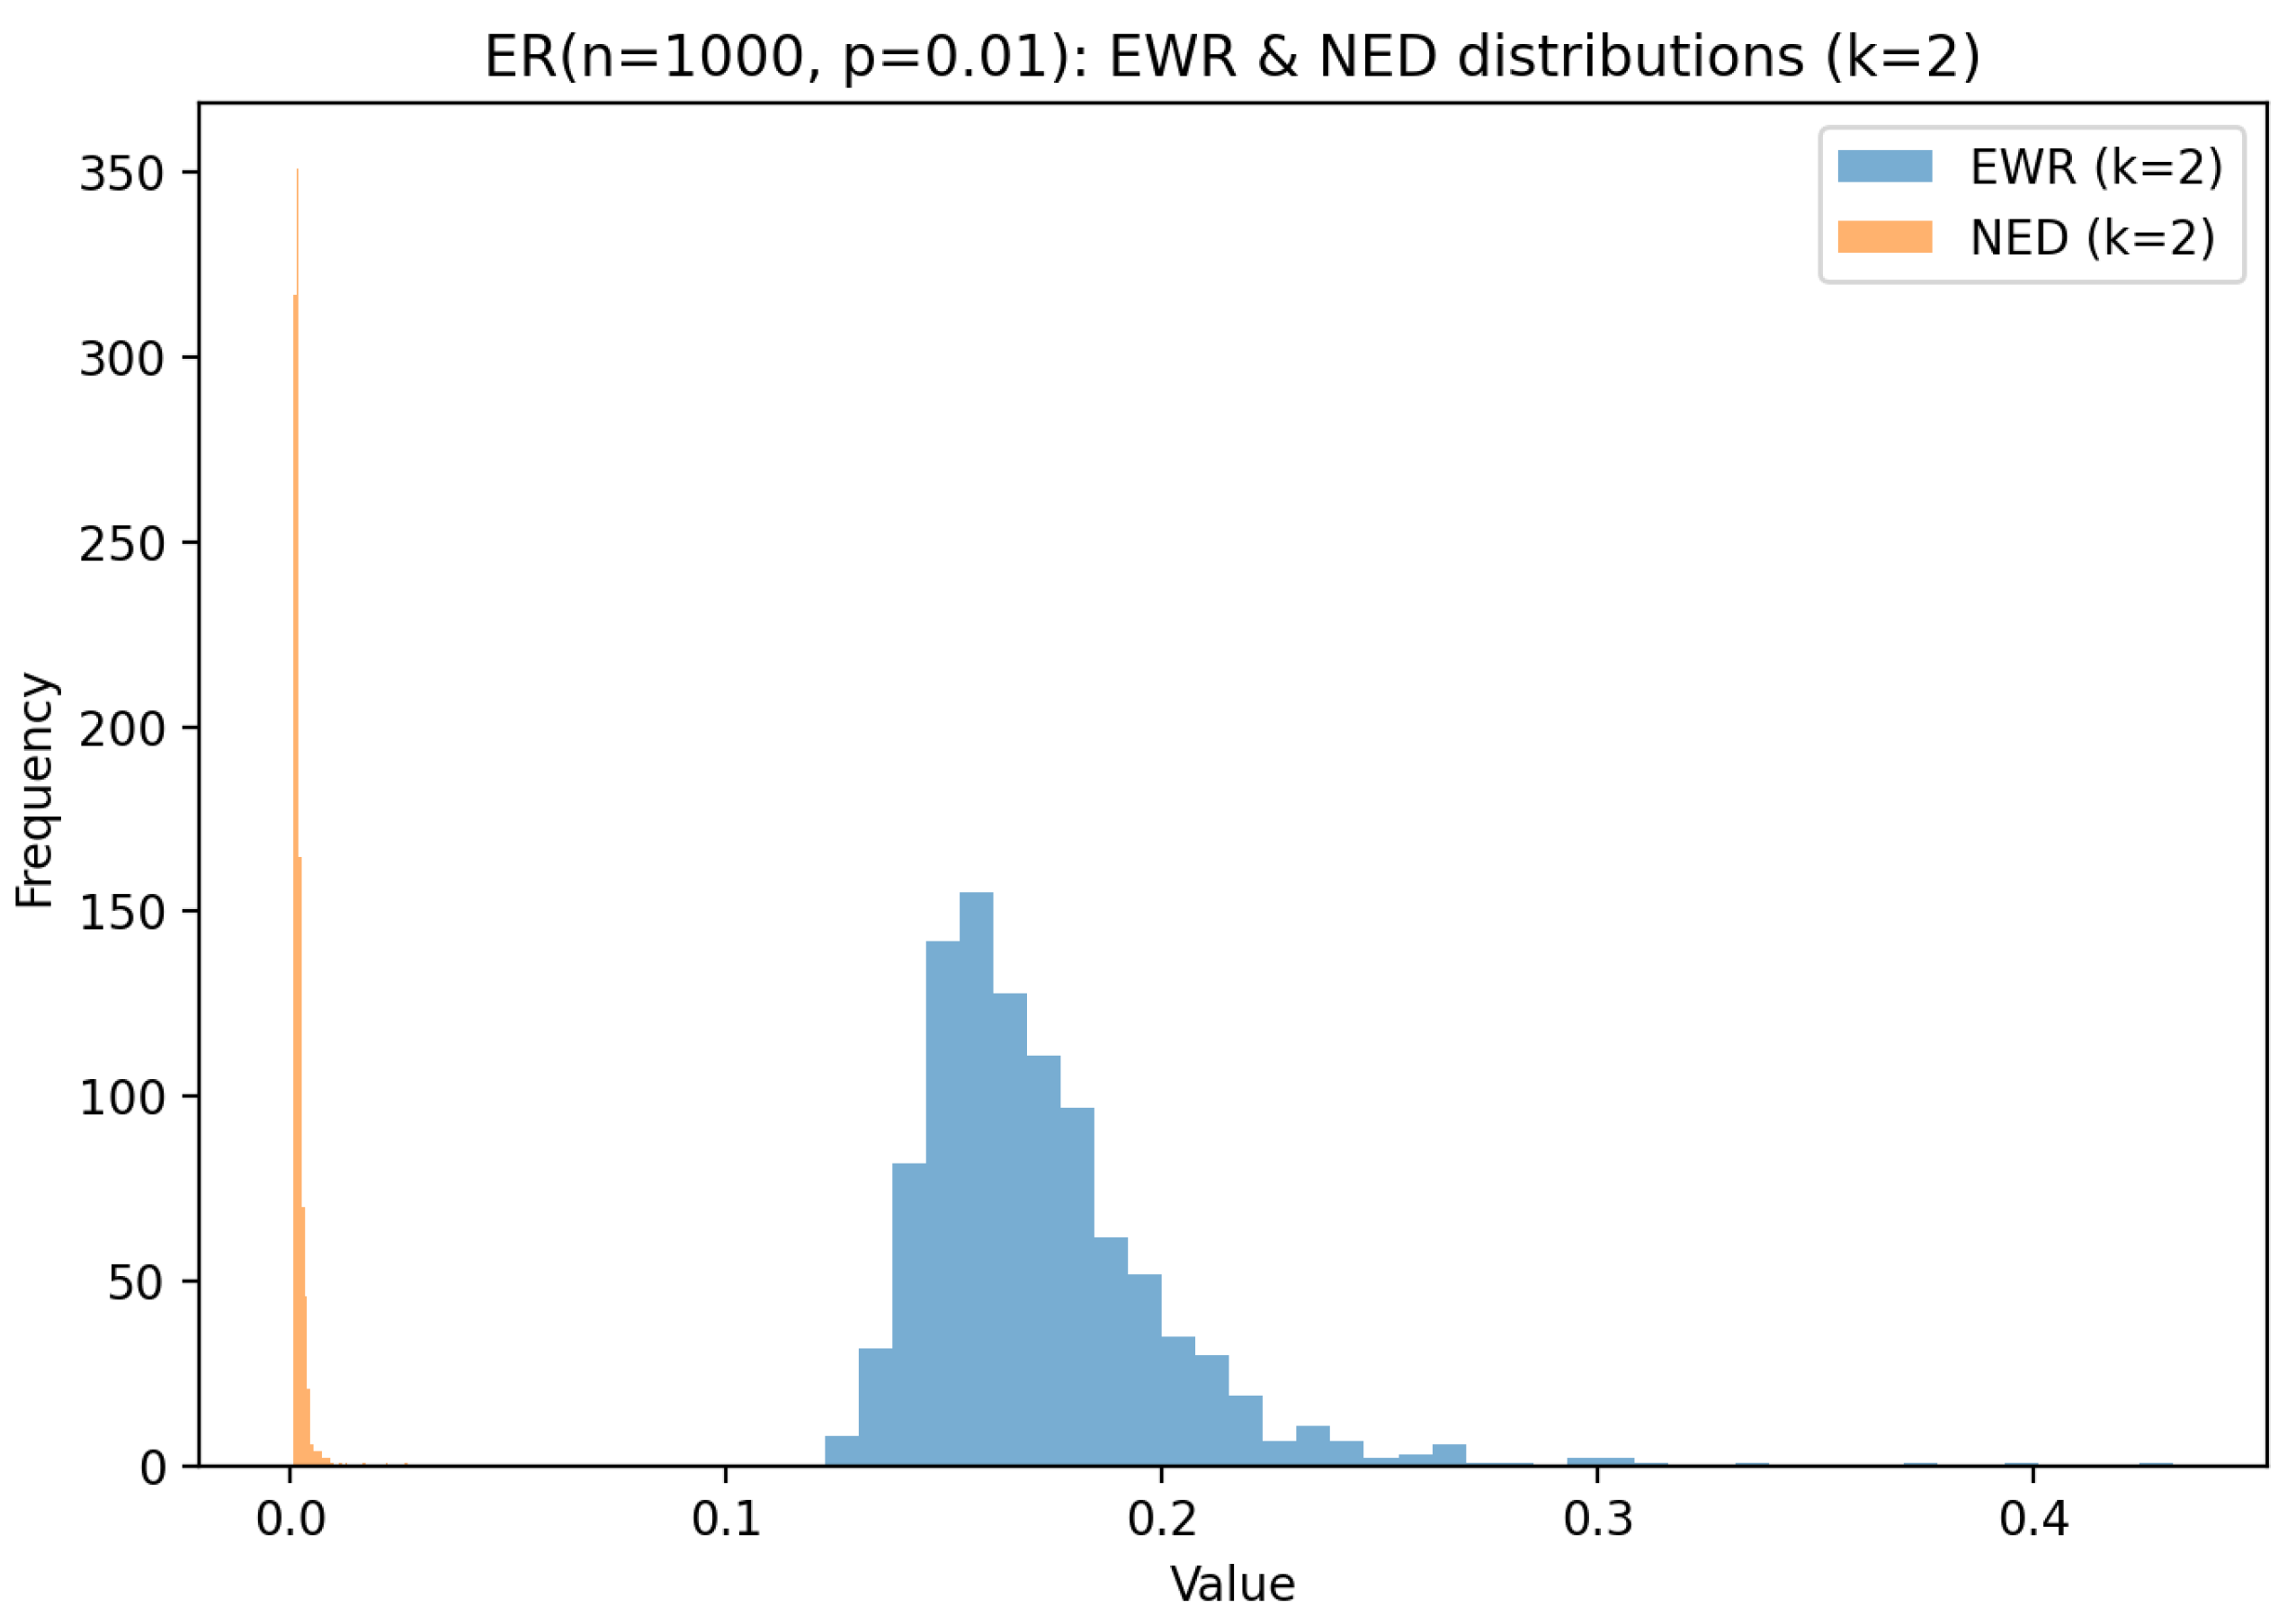
Figure 1. Value distributions of EWR and NED for the ER network ( n = 1000 , p = 0.01 , k = 2 ).
Mathematics 13 02902 g001
Figure 2. Relationship between EWR and NED versus node degree in the ER network ( n = 1000 , p = 0.01 , k = 2 ).
Mathematics 13 02902 g002
Figure 3. Betweenness versus EWR/NED in the ER network (n = 1000, p = 0.01 , k = 2 ).
Mathematics 13 02902 g003
Figure 4. Edge-perturbation stability of EWR and NED in the ER network ( n = 1000 , p = 0.01 , k = 2 ).
Mathematics 13 02902 g004
Figure 5. Impact of targeted removal on GCC size in the ER network ( n = 1000 , p = 0.01 ).
Mathematics 13 02902 g005
Figure 6. Distribution of EWR and NED values for the BA network ( n = 1000 , m = 3 , k = 2 ).
Mathematics 13 02902 g006
Figure 7. Degree versus EWR/NED in the BA network ( n = 1000 , m = 3 , k = 2 ).
Mathematics 13 02902 g007
Figure 8. Betweenness versus EWR/NED in the BA network ( n = 1000 , m = 3 , k = 2 ).
Mathematics 13 02902 g008
Figure 9. Metric stability under 1 % random edge rewiring for the BA network ( k = 2 ).
Mathematics 13 02902 g009
Figure 10. Impact of targeted node removal on GCC size in the BA network.
Mathematics 13 02902 g010
Figure 11. Distribution of EWR and NED values for the WS graph ( n = 1000 , k = 6 , β = 0.1 , k = 2 ).
Mathematics 13 02902 g011
Figure 12. Degree versus EWR/NED in the WS network ( n = 1000 , k = 6 , β = 0.1 , k = 2 ).
Mathematics 13 02902 g012
Figure 13. Betweenness versus EWR/NED in the WS network ( n = 1000 , k = 6 , β = 0.1 , k = 2 ).
Mathematics 13 02902 g013
Figure 14. Impact of targeted node removal on GCC size for the WS graph.
Mathematics 13 02902 g014
Figure 15. Edge-perturbation stability for the WS graph ( frac = 0.01 , k = 2 ).
Mathematics 13 02902 g015
Figure 16. RGG ( n = 1000 , radius = 0.08 ): empirical distributions of EWR and NED ( k = 2 ). NED is highly concentrated near zero; EWR spans a moderate range.
Mathematics 13 02902 g016
Figure 17. Degree versus EWR/NED in the RGG ( n = 1000 , r a d i u s = 0.08 , k = 2 ).
Mathematics 13 02902 g017
Figure 18. Betweenness versus EWR/NED in the RGG ( n = 1000 , r a d i u s = 0.08 , k = 2 ).
Mathematics 13 02902 g018
Figure 19. Targeted removals on RGG: GCC size vs. removed top-X% by Degree/EWR/NED. Nearly identical curves imply geometry dominates vulnerability.
Mathematics 13 02902 g019
Figure 20. Edge-perturbation stability of EWR and NED in the RGG ( n = 1000 , r a d i u s = 0.08 , k = 2 ).
Mathematics 13 02902 g020
Figure 21. Distribution of EWR and NED in the Zephyr ( m = 10 , t = 4 , k = 2 ).
Mathematics 13 02902 g021
Figure 22. Degree versus EWR/NED in the Zephyr network ( m = 10 , t = 4 , k = 2 ).
Mathematics 13 02902 g022
Figure 23. Betweenness versus EWR/NED in the Zephyr ( m = 10 , t = 4 , k = 2 ).
Mathematics 13 02902 g023
Figure 24. Edge-perturbation stability of EWR and NED in the Zephyr ( m = 10 , t = 4 , k = 2 ).
Mathematics 13 02902 g024
Figure 25. Impact of targeted node removal on GCC size in Zephyr.
Mathematics 13 02902 g025
Table 1. EWR and NED distributions and correlations across network topologies ( k = 2 ).
TopologyEWR DistributionNED DistributionDegree Corr. (EWR/NED)Betweenness Corr. (EWR/NED)
ERBroad, unimodalBroad, unimodal 0.793 / 0.648 0.602 / 0.457
BARight-skewed, hubs dominateRight-skewed, hubs dominate 0.382 / 0.265 0.292 / 0.183
WSNarrow, peakedNarrow, peaked 0.421 / 0.458 0.691 / 0.698
RGGNarrow, moderate spreadNarrow, low spread 0.344 / 0.637 0.500 / 0.483
ZephyrDiscrete peaks (0.6–0.9)Near-zero cluster 0.859 / 0.938 0.564 / 0.474
Table 2. Perturbation stability and removal effect of EWR and NED across network topologies ( k = 2 ).
TopologyPerturb. Stability (EWR/NED)Removal Effect
ER 0.980 / 0.961 Metrics outperform degree slightly
BA 0.986 / 0.948 Metrics ≈ degree targeting
WS 0.937 / 0.926 Metrics ≈ degree targeting
RGG 0.756 / 0.874 Slight metric advantage over degree
Zephyr 0.739 / 0.905 Metrics ≈ degree targeting
Disclaimer/Publisher’s Note: The statements, opinions and data contained in all publications are solely those of the individual author(s) and contributor(s) and not of MDPI and/or the editor(s). MDPI and/or the editor(s) disclaim responsibility for any injury to people or property resulting from any ideas, methods, instructions or products referred to in the content.