Growth Processing and Strategies: A Way to Improve the Gas Sensing Performance of Nickel Oxide-Based Devices


Abstract
1. Introduction
2. Pristine Nickel Oxide Semiconductor: Growth Strategies
2.1. Vapor-Phase Deposition
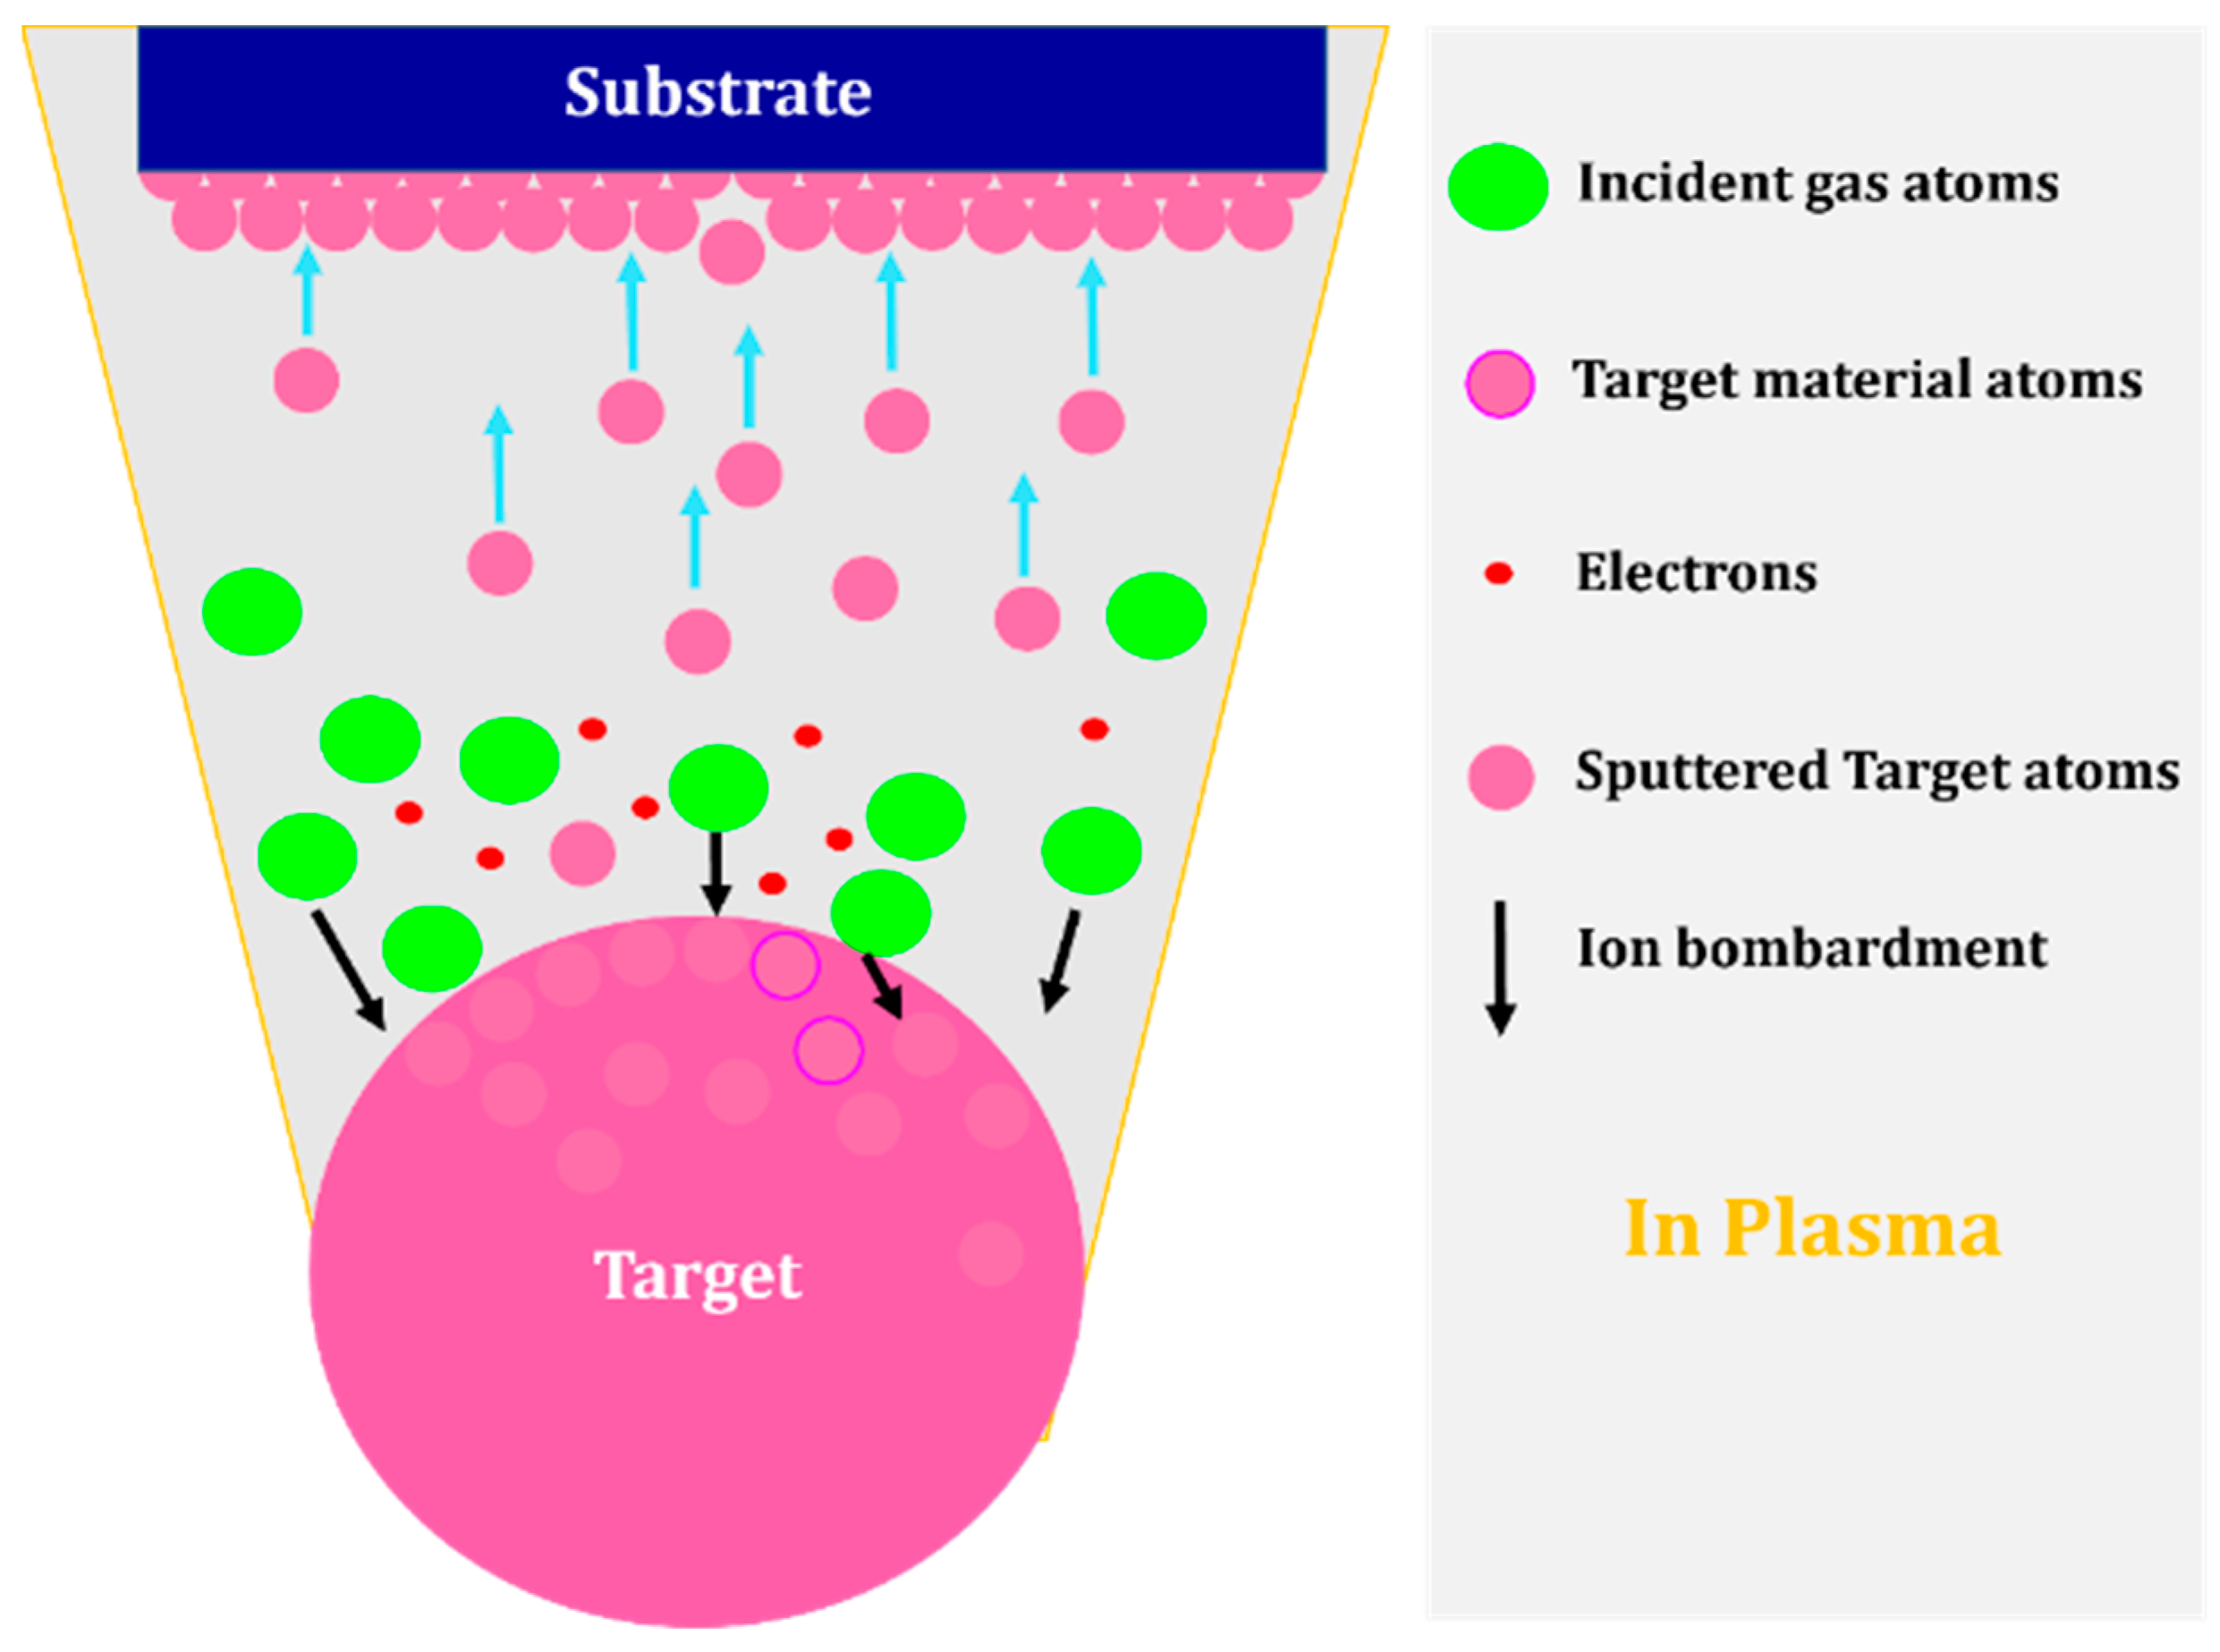
2.1.1. Sputtering

| Reference | Pressure (mTorr) | Time (s) | Substrate—Temperature | Power (W) | Mode | Film Thickness (nm) |
|---|---|---|---|---|---|---|
| [22] | 2.25 | N/A | ITO/Glass—RT | 200 | DC * | 150 |
| [23] | 0.003 | 3600 | Soda-Lime Glass (SLG)—RT | 90 | RF * | 200 |
| [24] | 10 | NA | PET/ITO—RT | 50 | RF | 200 |
| [25] | 7.5 | 9000 | Glass—RT | 250 | RF | 222 |
| [26] | 3.75 | NA | FTO/Glass—RT | 70 | RF | 25 |
| [27] | 9 | NA | ITO/Glass—RT | 120 | DC | 250 |
| [28] | 15 | 5 | Glass—RT | 100 | RF | 4.99 |
| 10 | 21.85 | |||||
| 15 | 31.50 | |||||
| 20 | 42.10 | |||||
| [29] | 3.75 | NA | Platinum thin film—400 °C | 40 | DC | 50–200 |
| [30] | 7.5 | 3600 | Glass—300 °C | 120 | DC | 160.2 |
| 9 | 168.8 | |||||
| 10.5 | 166.9 | |||||
| 12 | 157.5 | |||||
| 13.5 | 150.0 | |||||
| [31] | 37.5 | NA | Silica—400 °C | 100 | RF | 30 |
| 7.5 | Silica—RT | 50 | 30 | |||
| [32] | 112.5 | 10,800 | Glass—RT | 140 | DC | NA |
2.1.2. Thermal Evaporation–Condensation
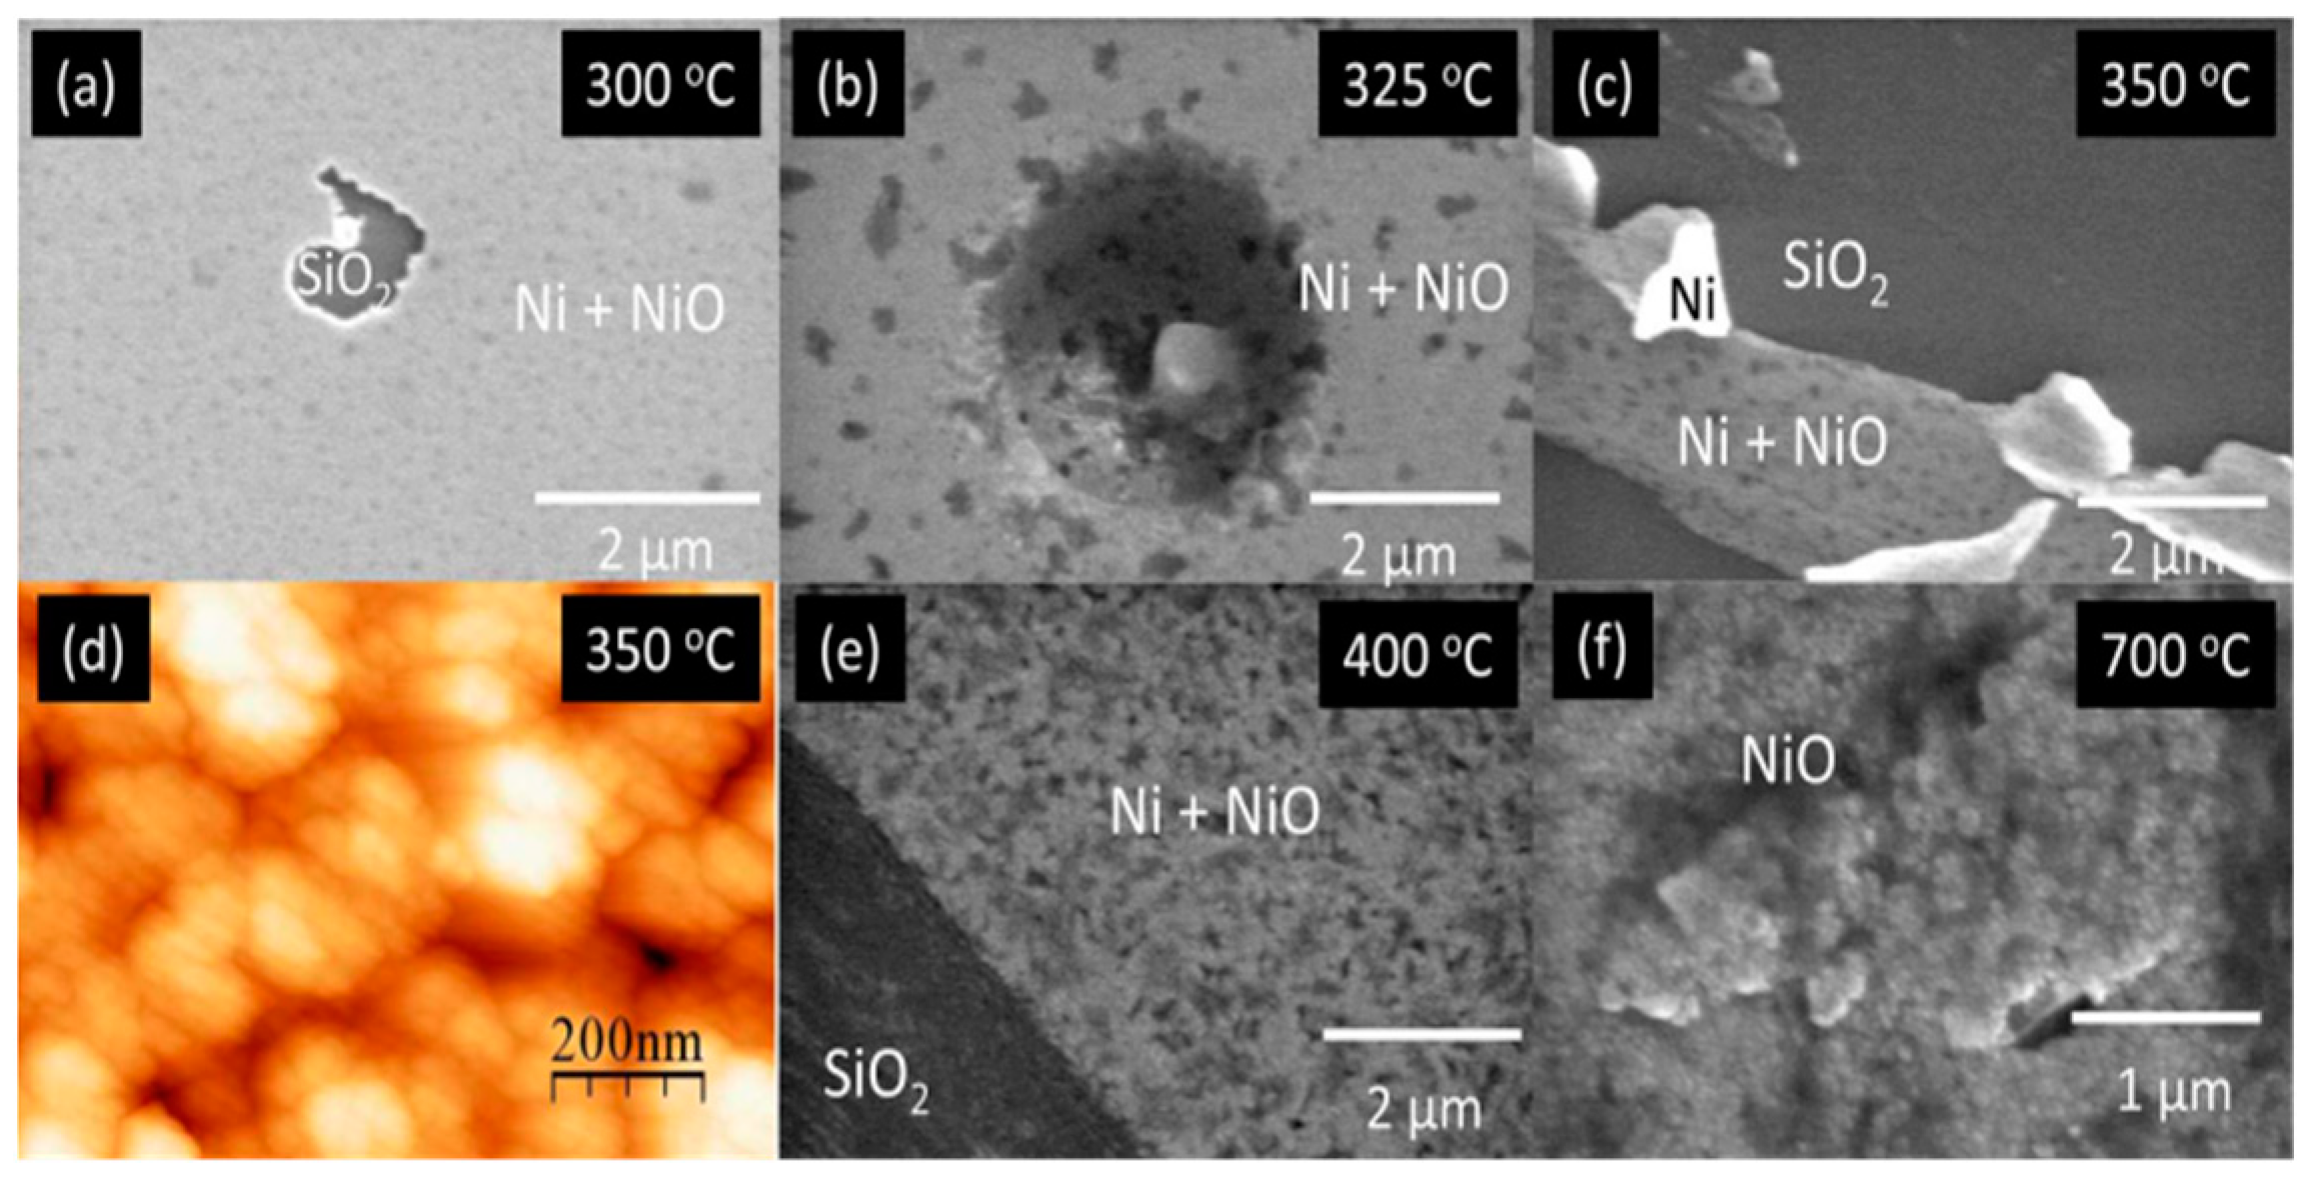
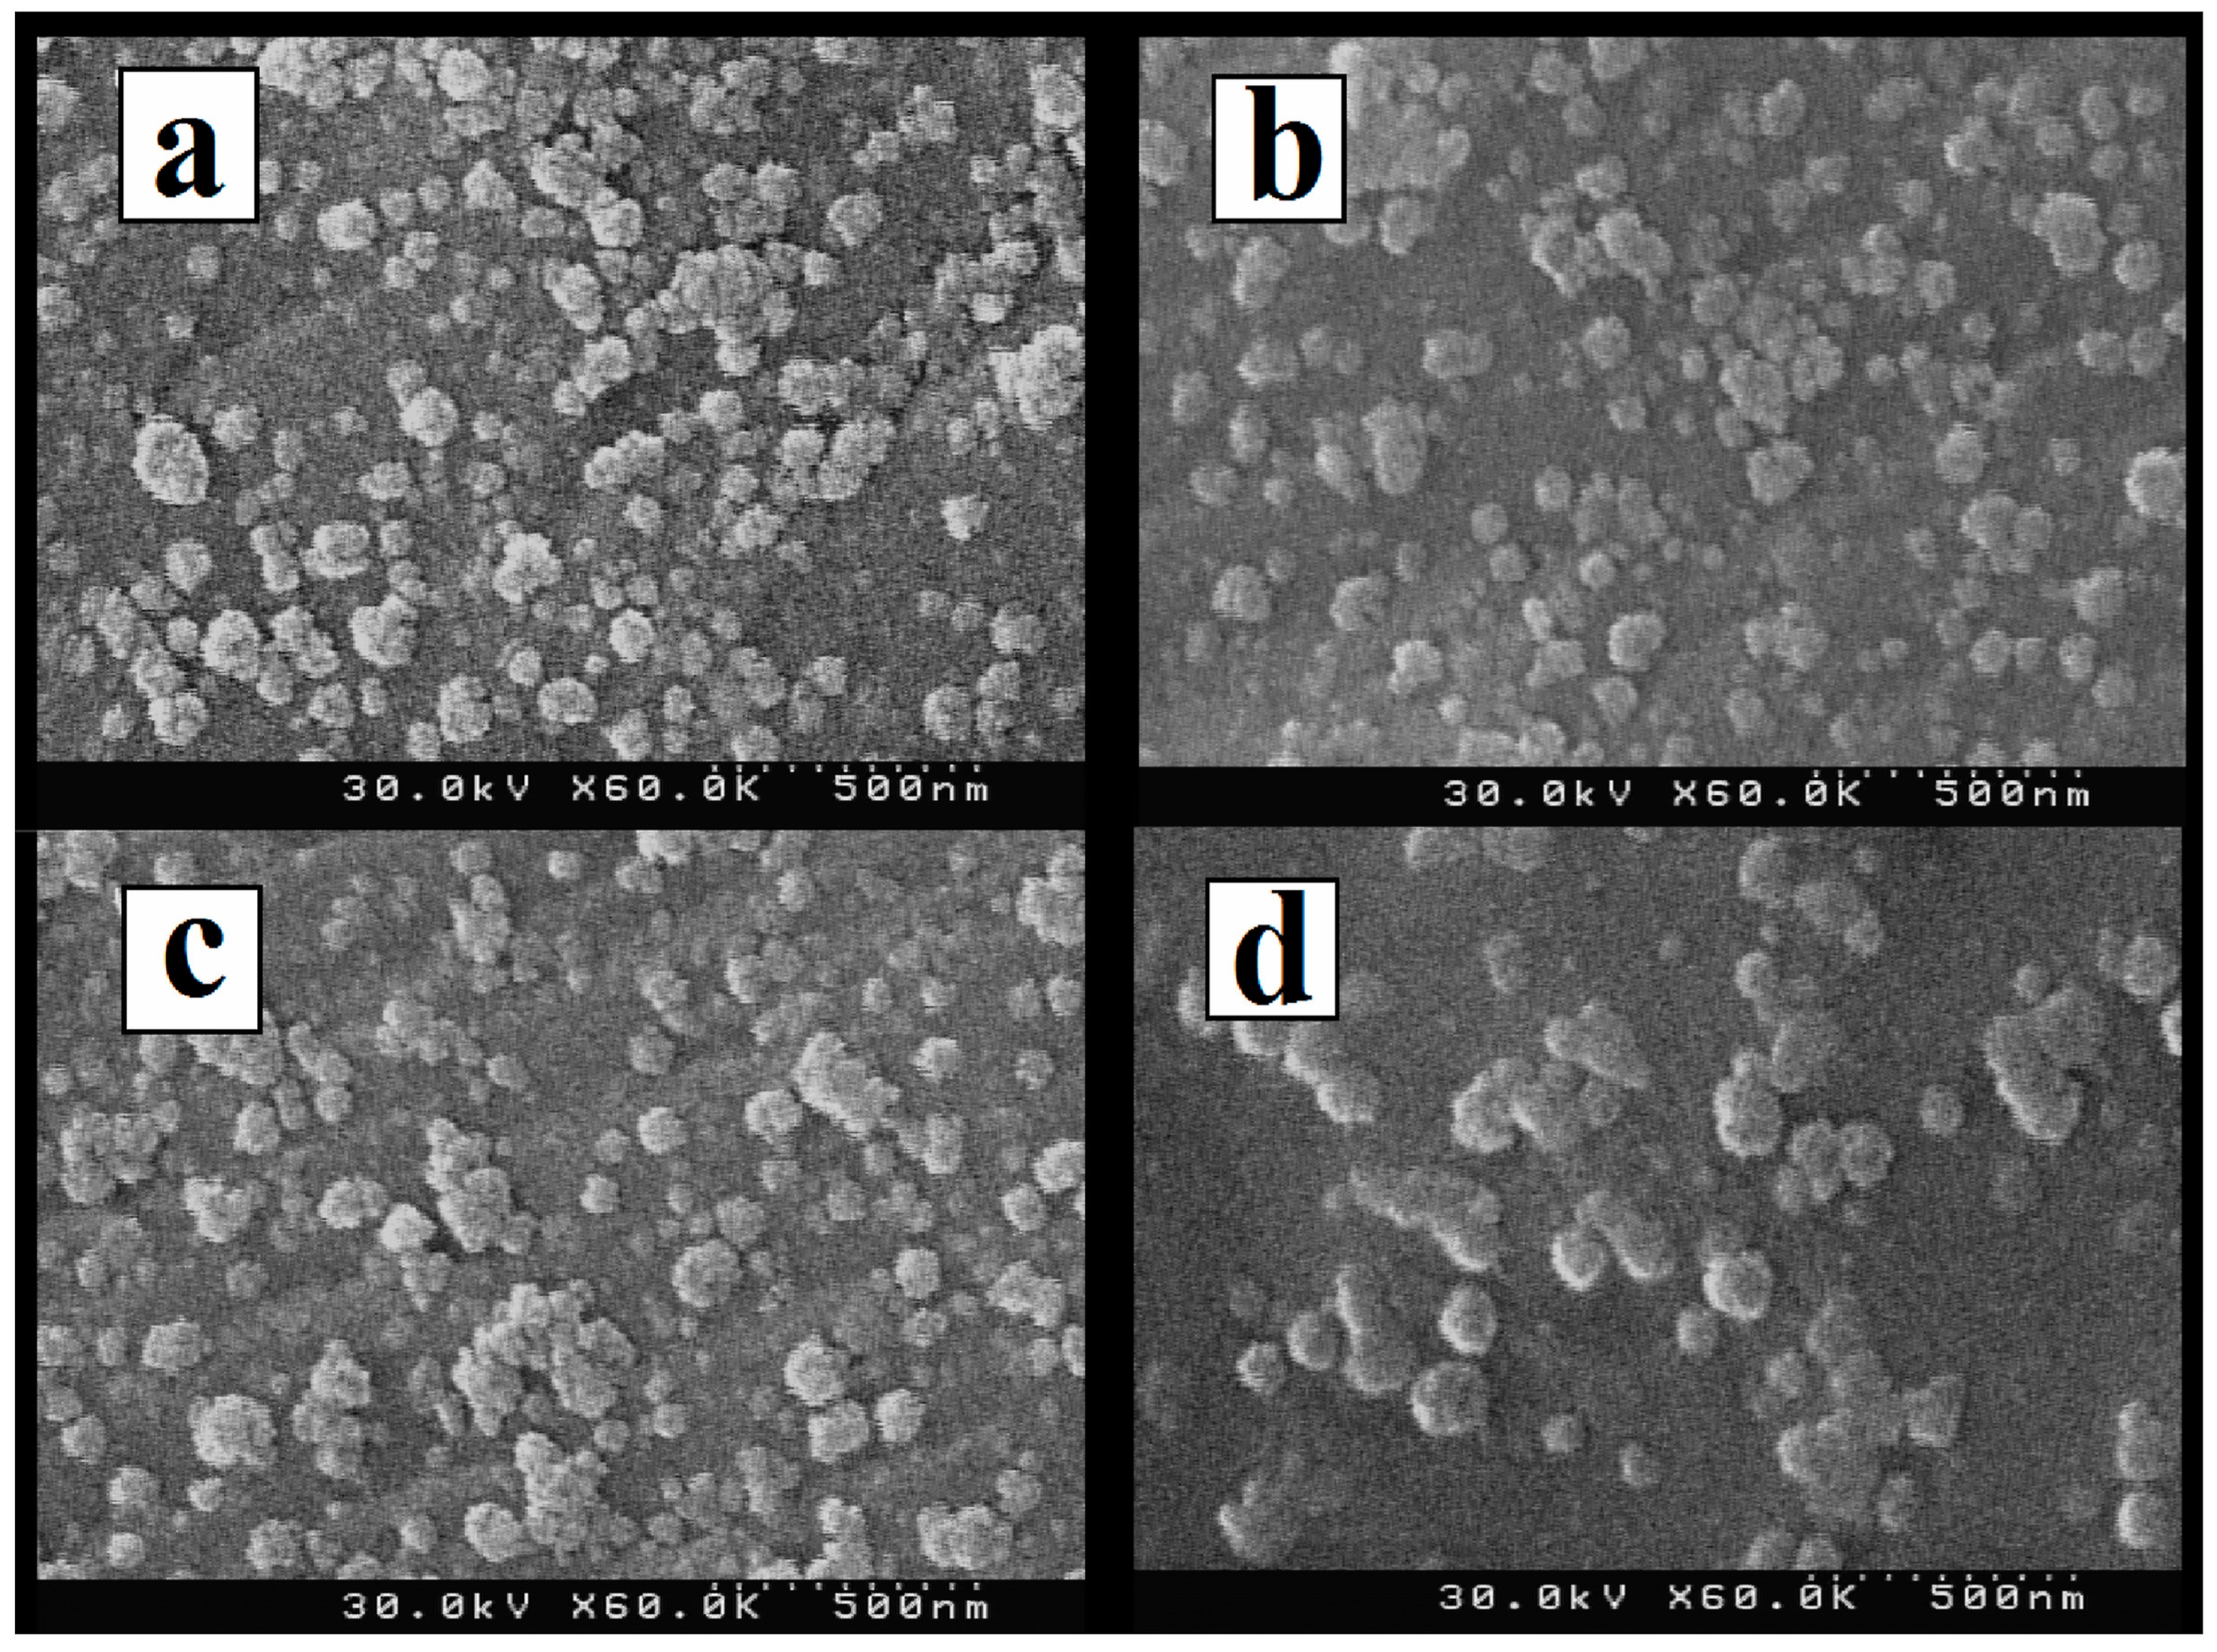
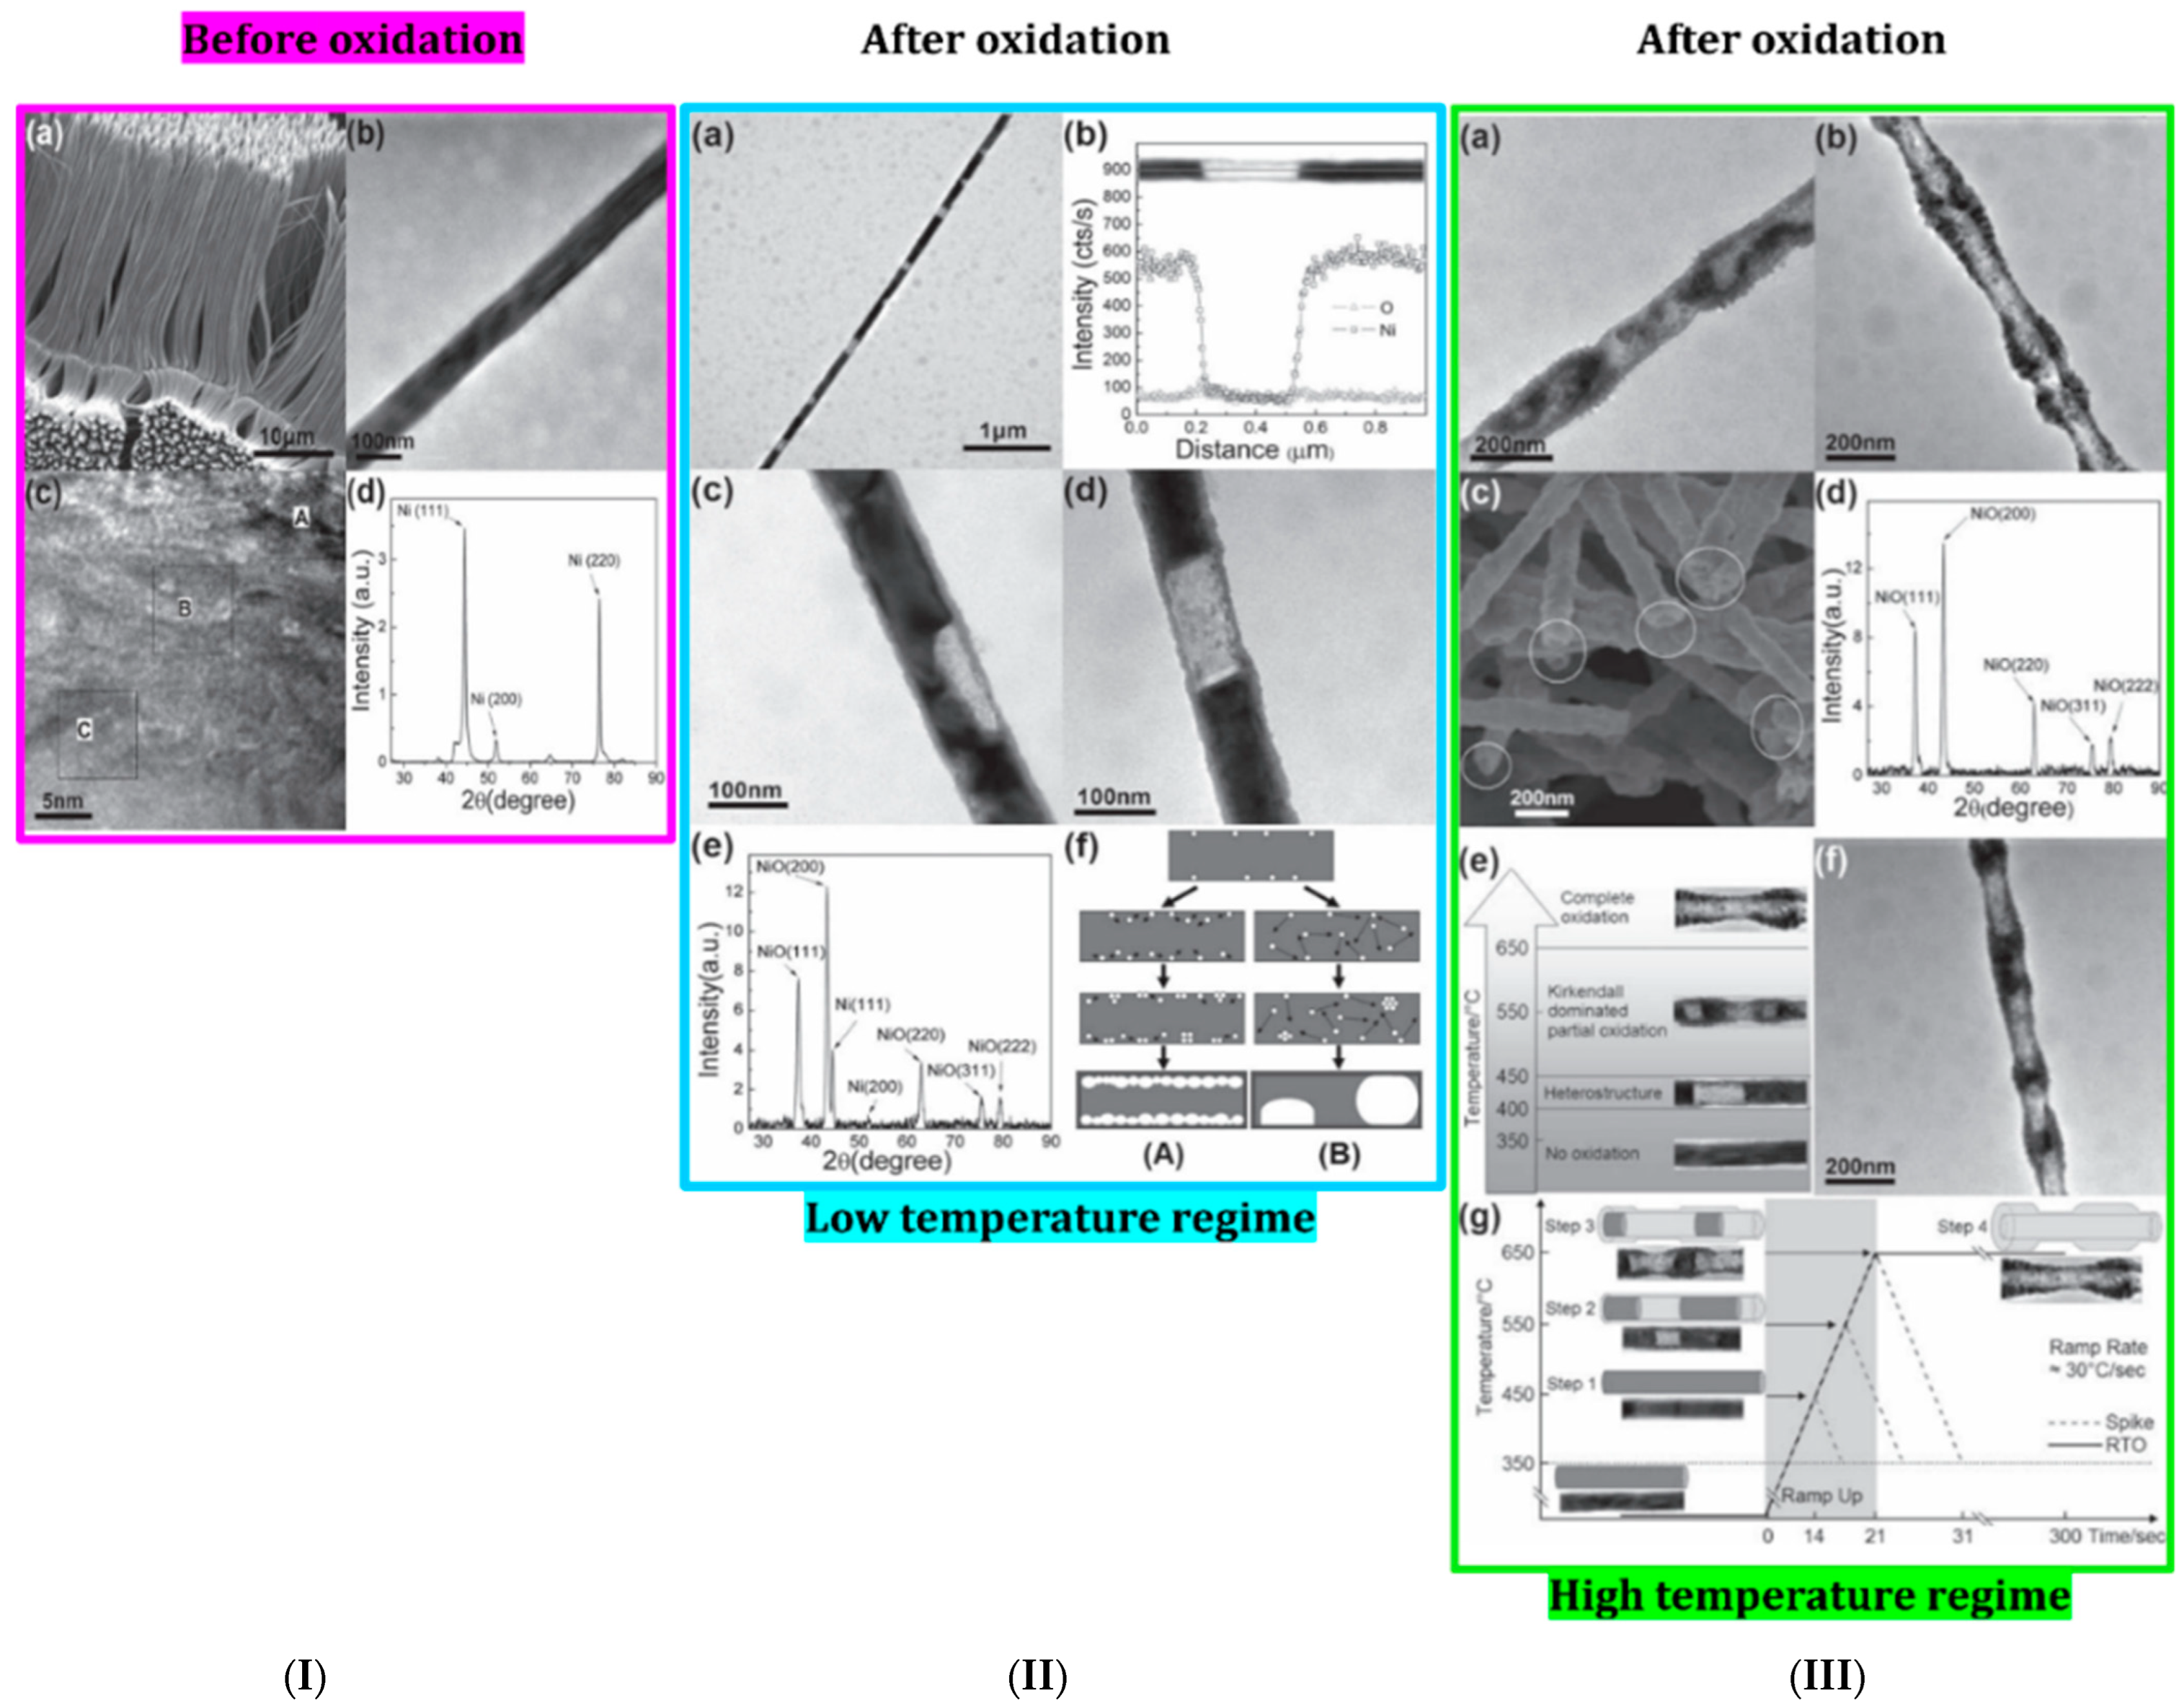
2.1.3. Thermal Oxidation
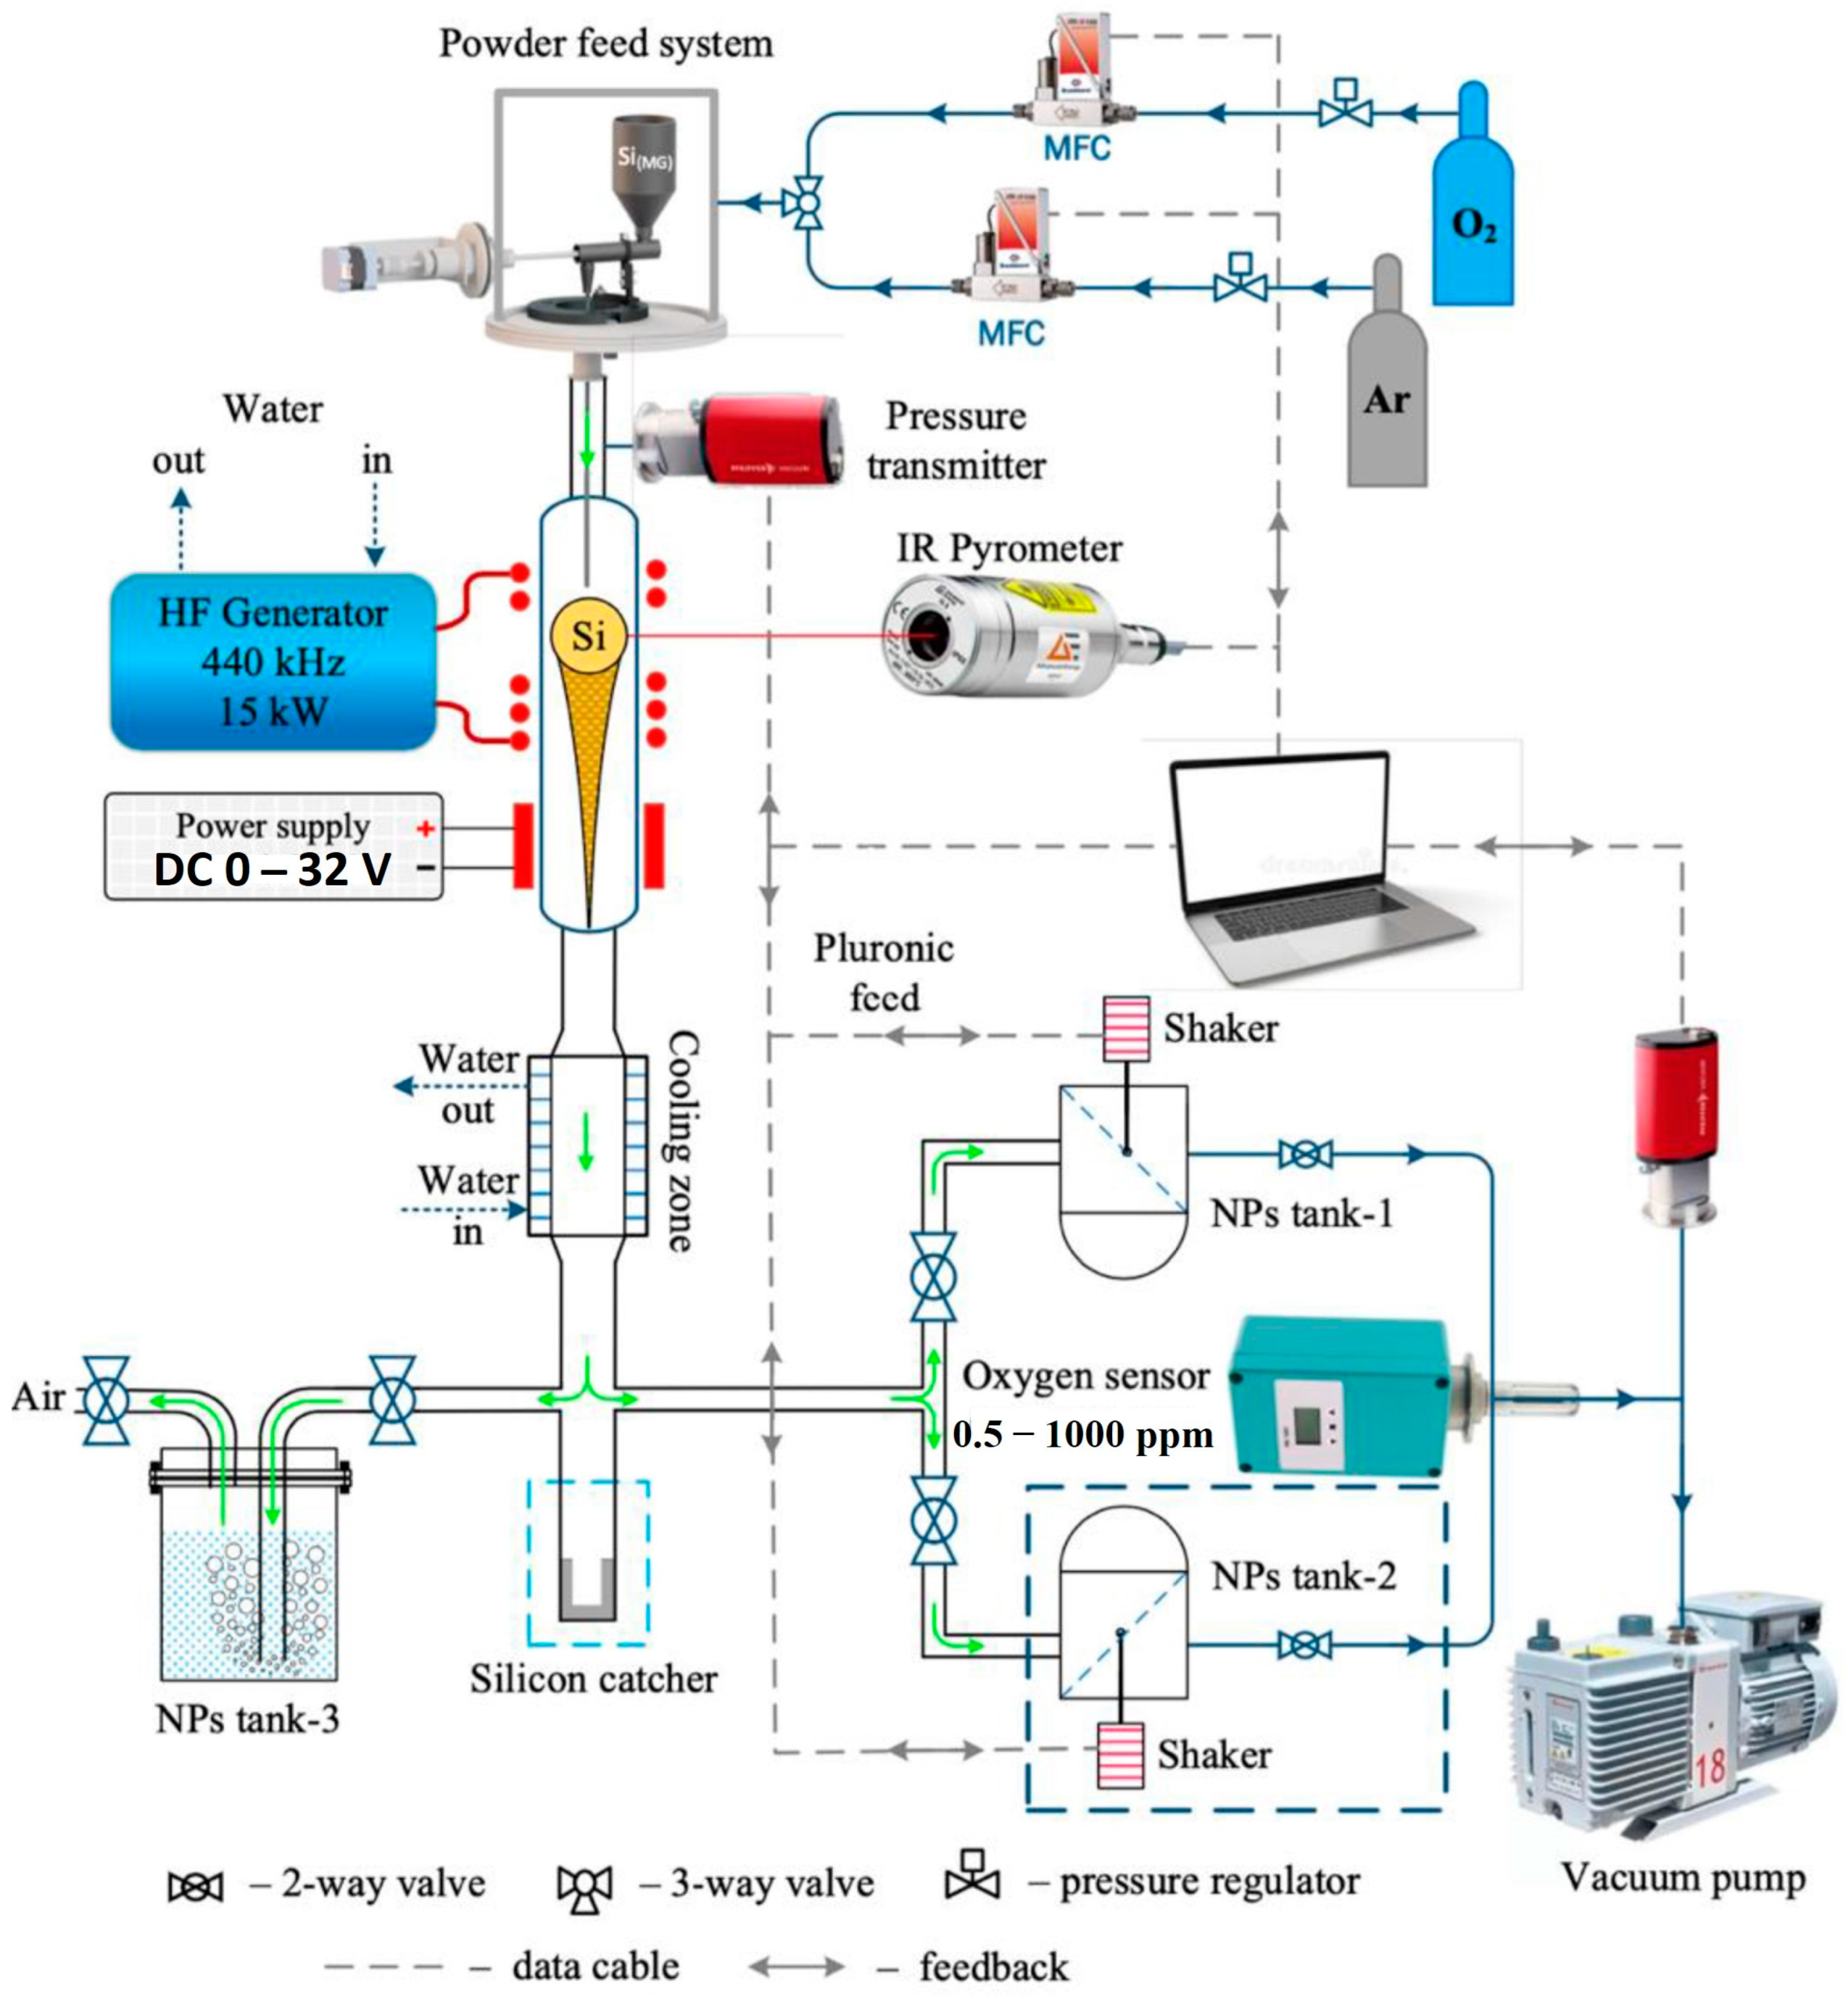
2.1.4. Levitation–Jet Synthesis (LJS)
2.1.5. Molecular Beam Epitaxy
2.1.6. Metal–Organic Chemical Vapor Deposition
2.1.7. Atomic Layer Deposition
2.2. Liquid-Phase Deposition
2.2.1. Chemical Bath Deposition (CBD)
2.2.2. Electrodeposition
2.2.3. Electrospinning
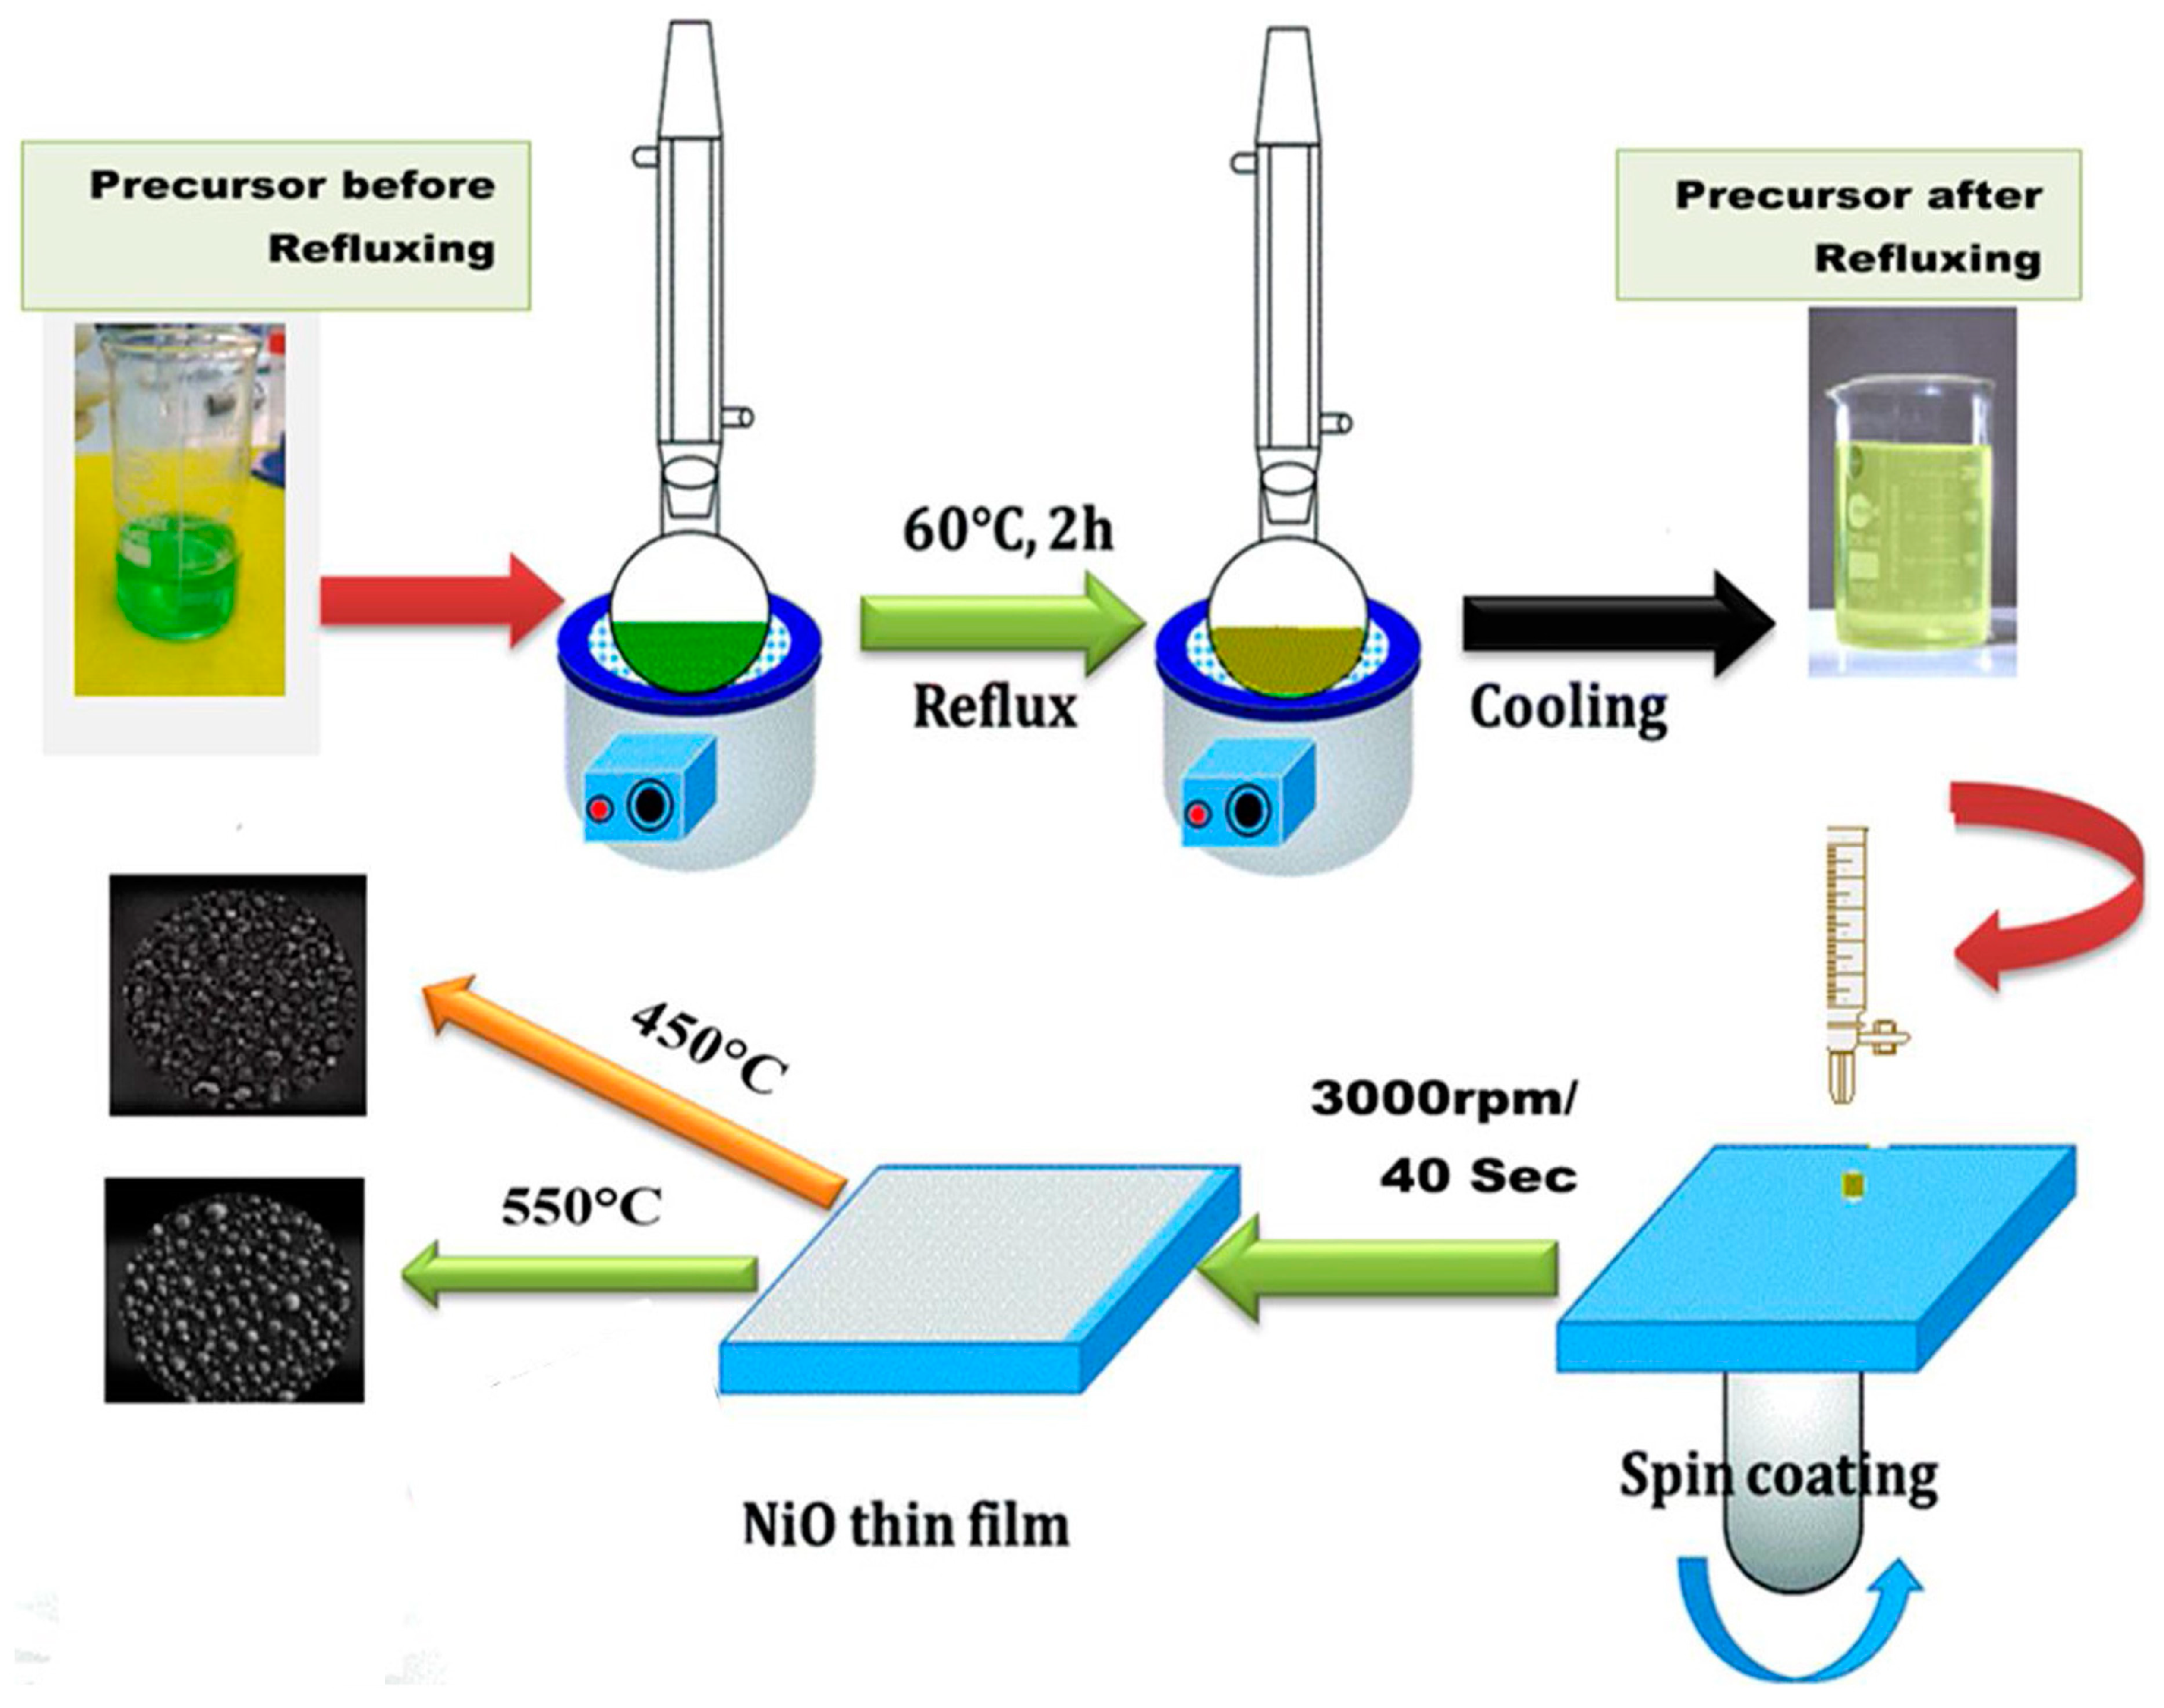
2.2.4. Spin Coating
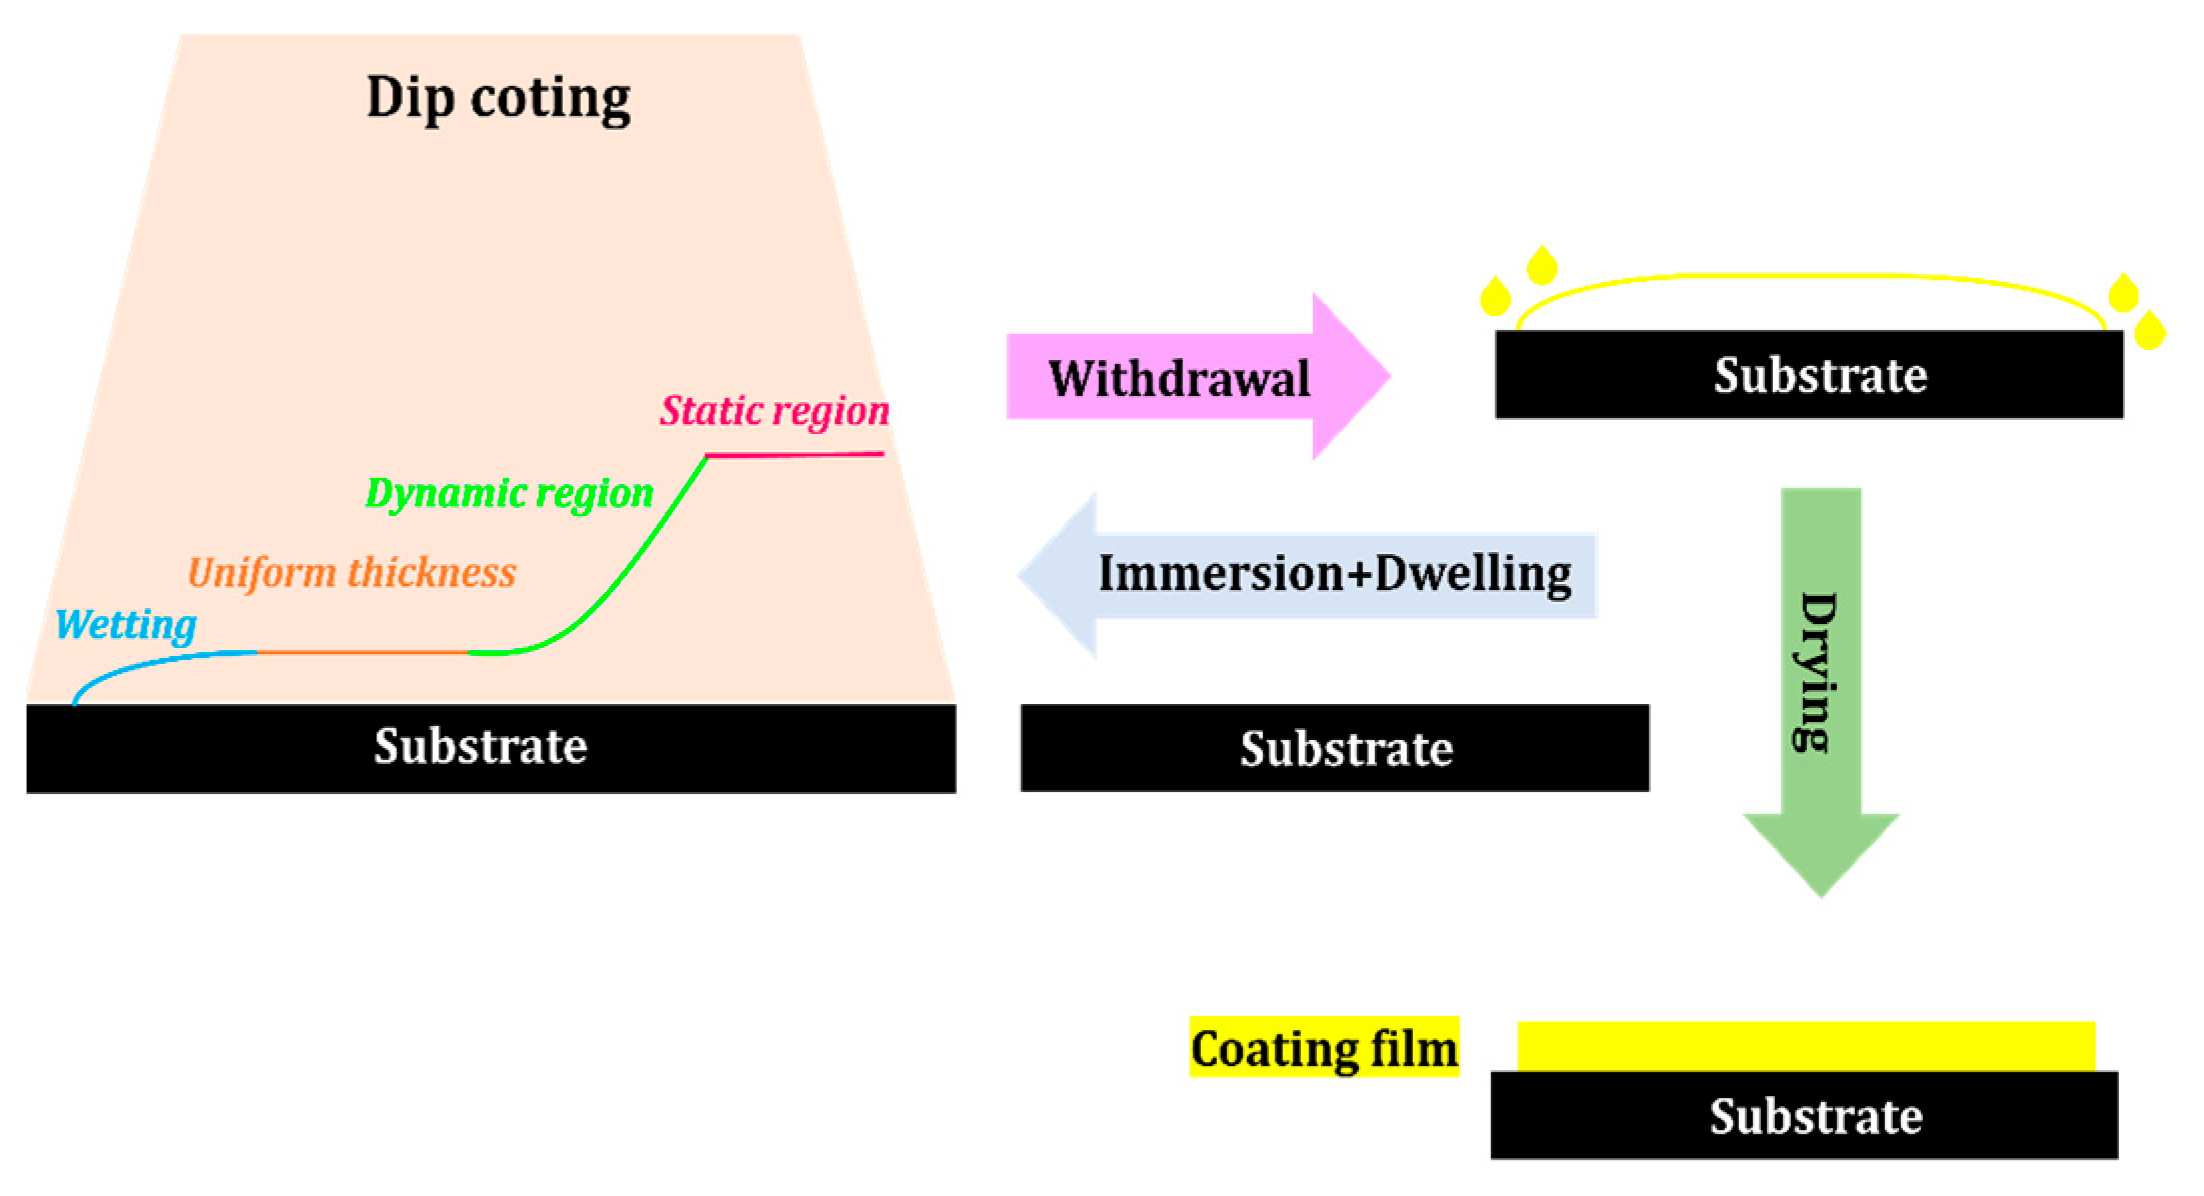
2.2.5. Dip Coating
2.2.6. Spray Coating
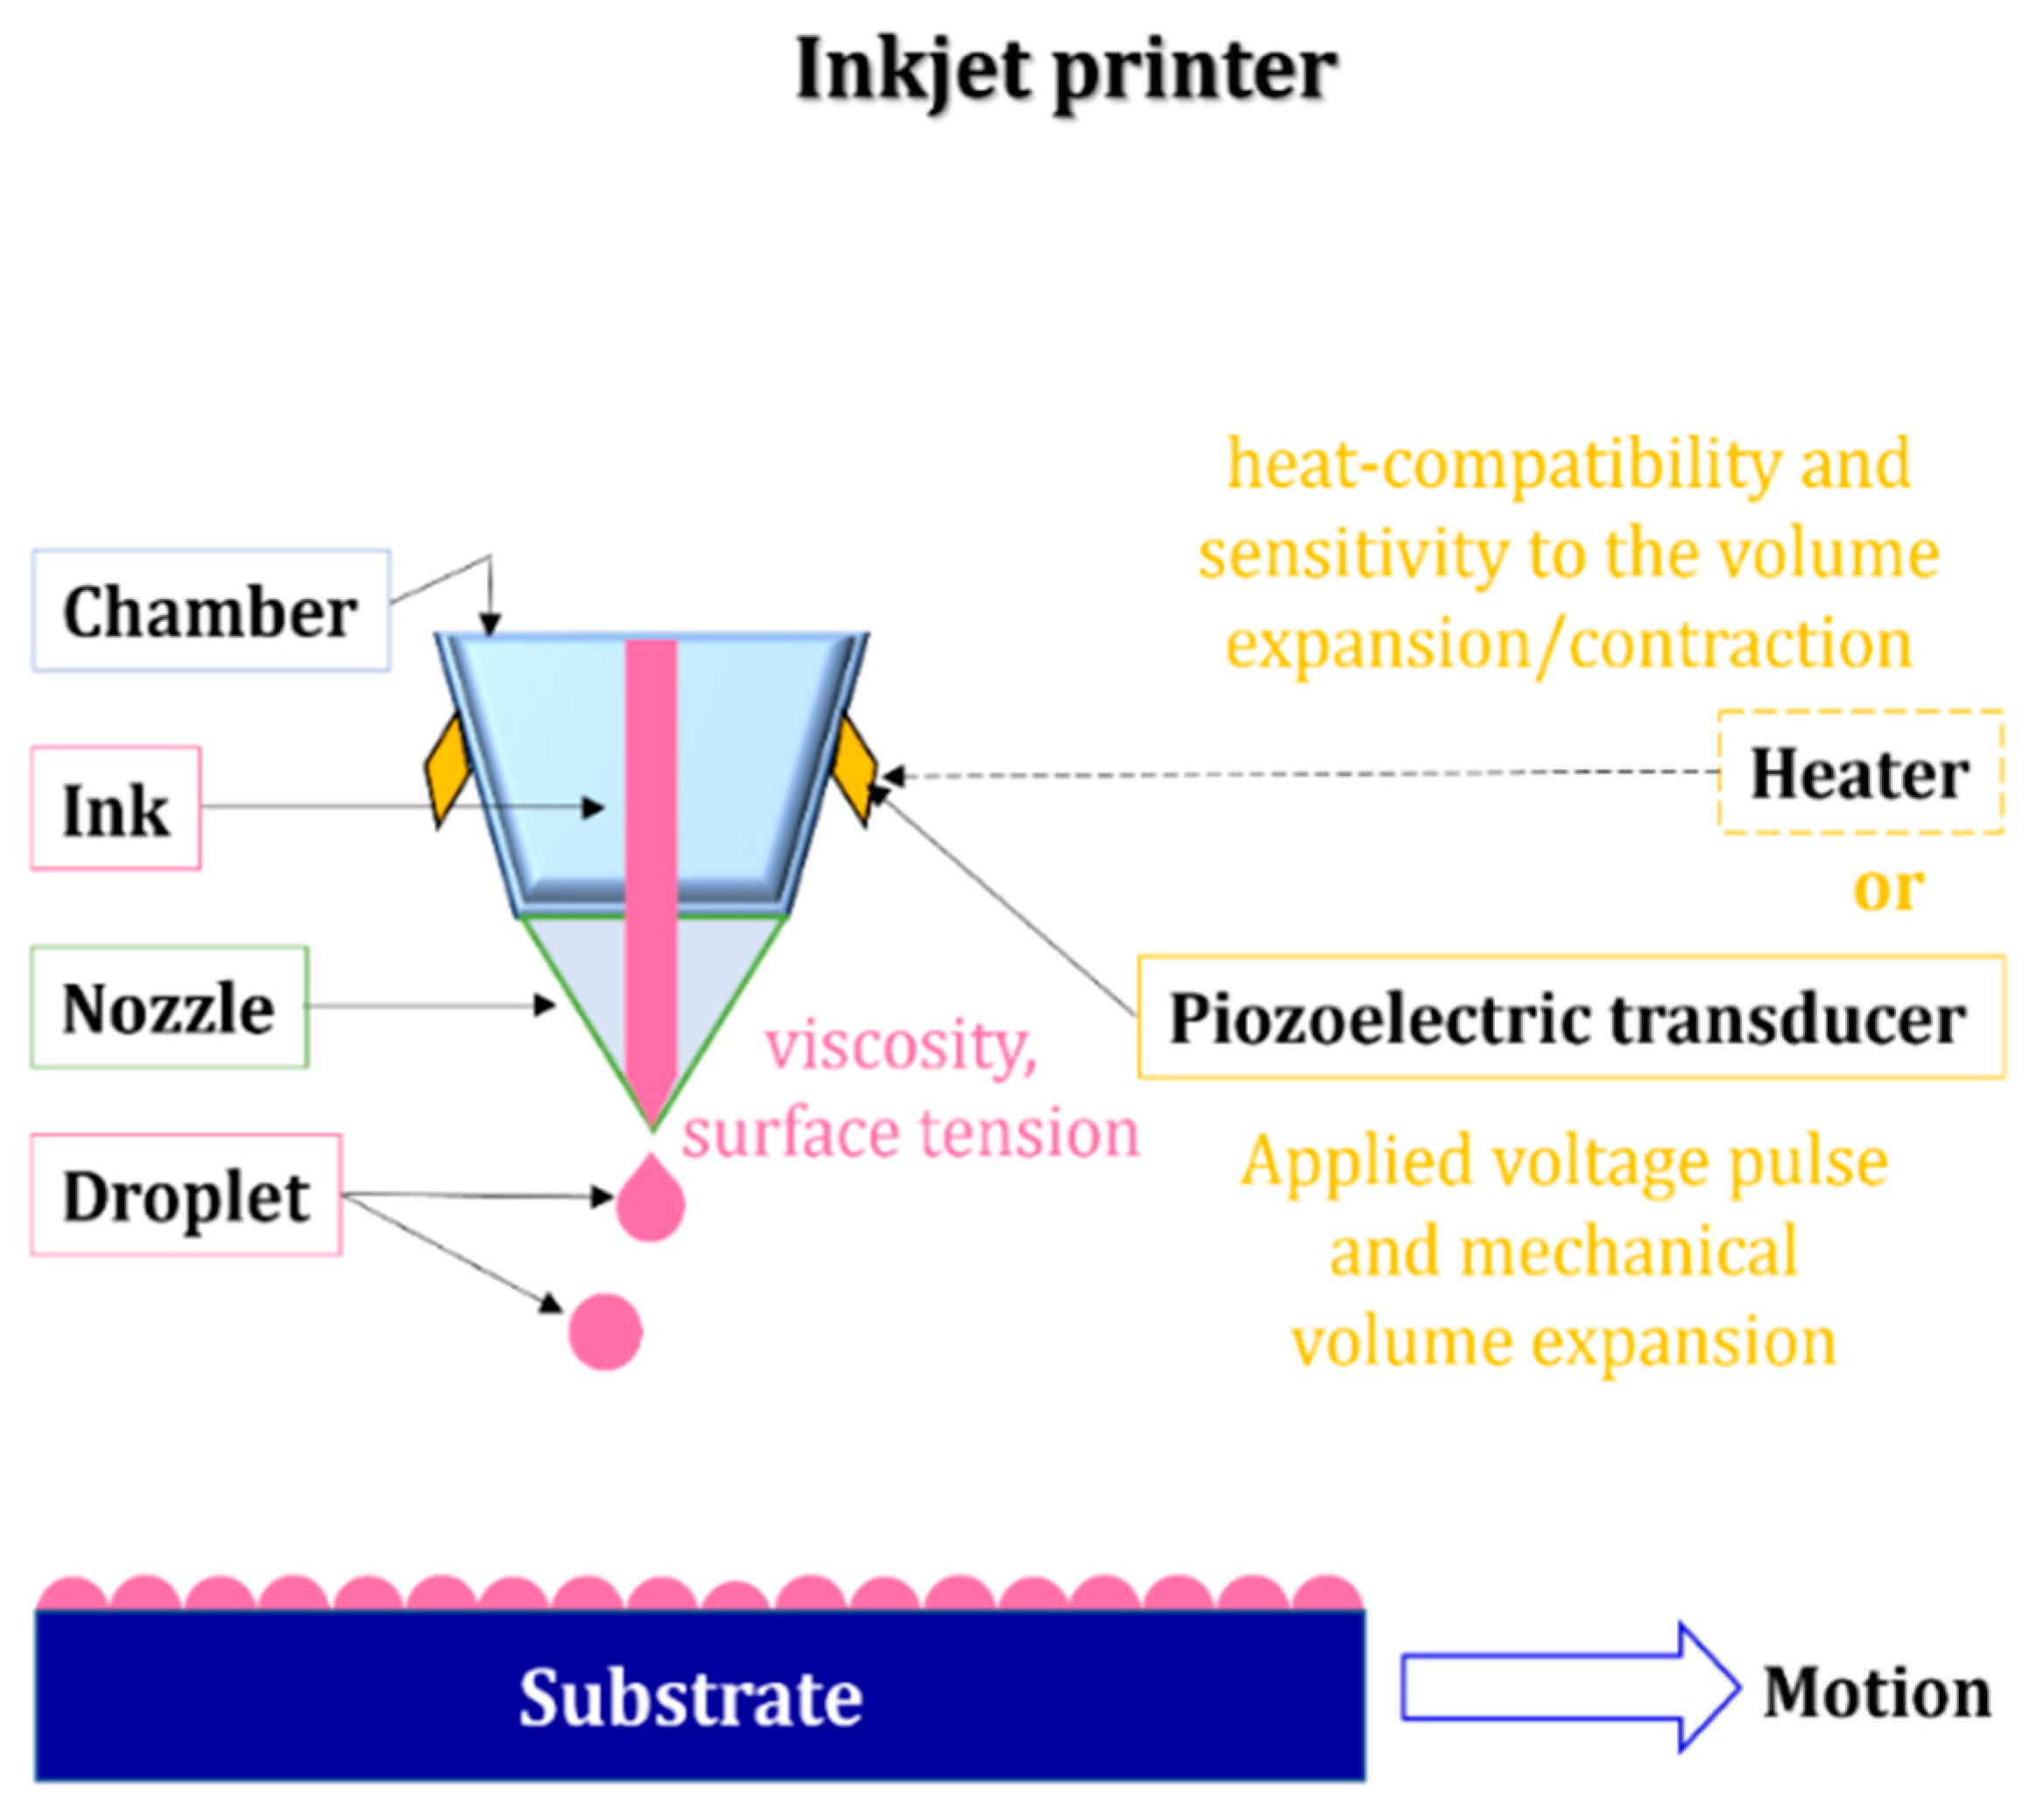
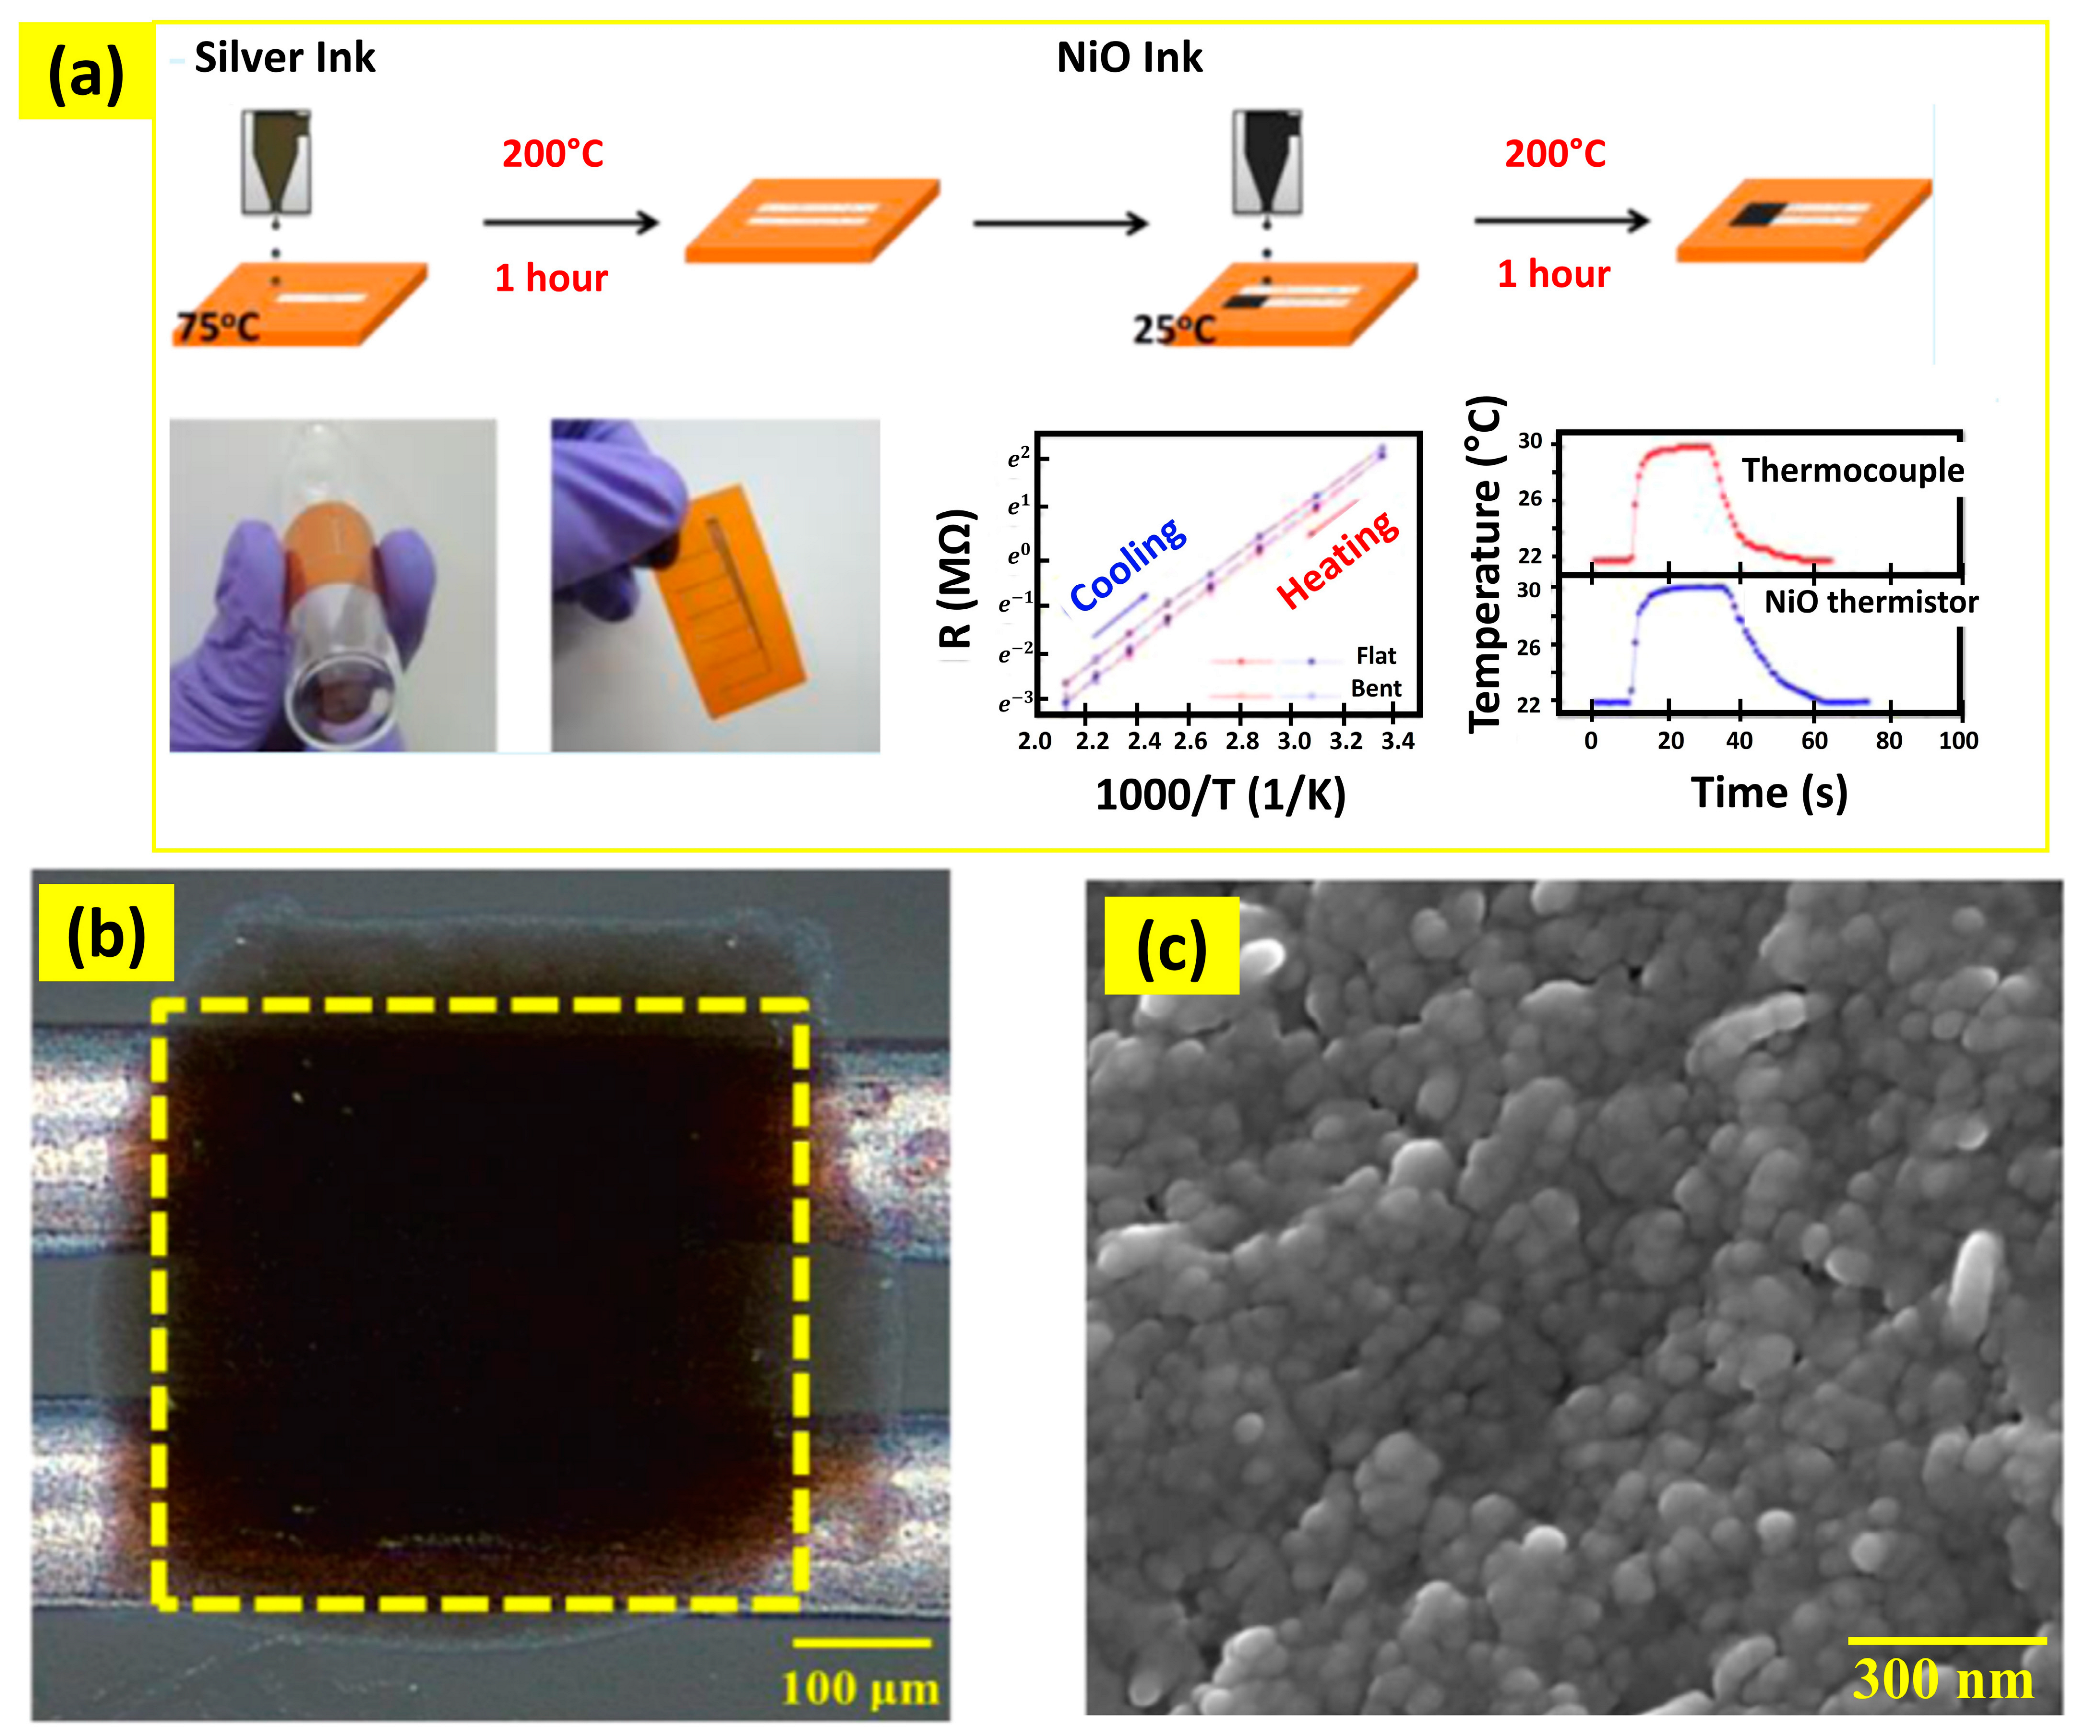
2.2.7. Inkjet Printing
2.3. Solution Processing
2.3.1. Hydrothermal
2.3.2. Sol–Gel
2.3.3. Micro-Emulsion
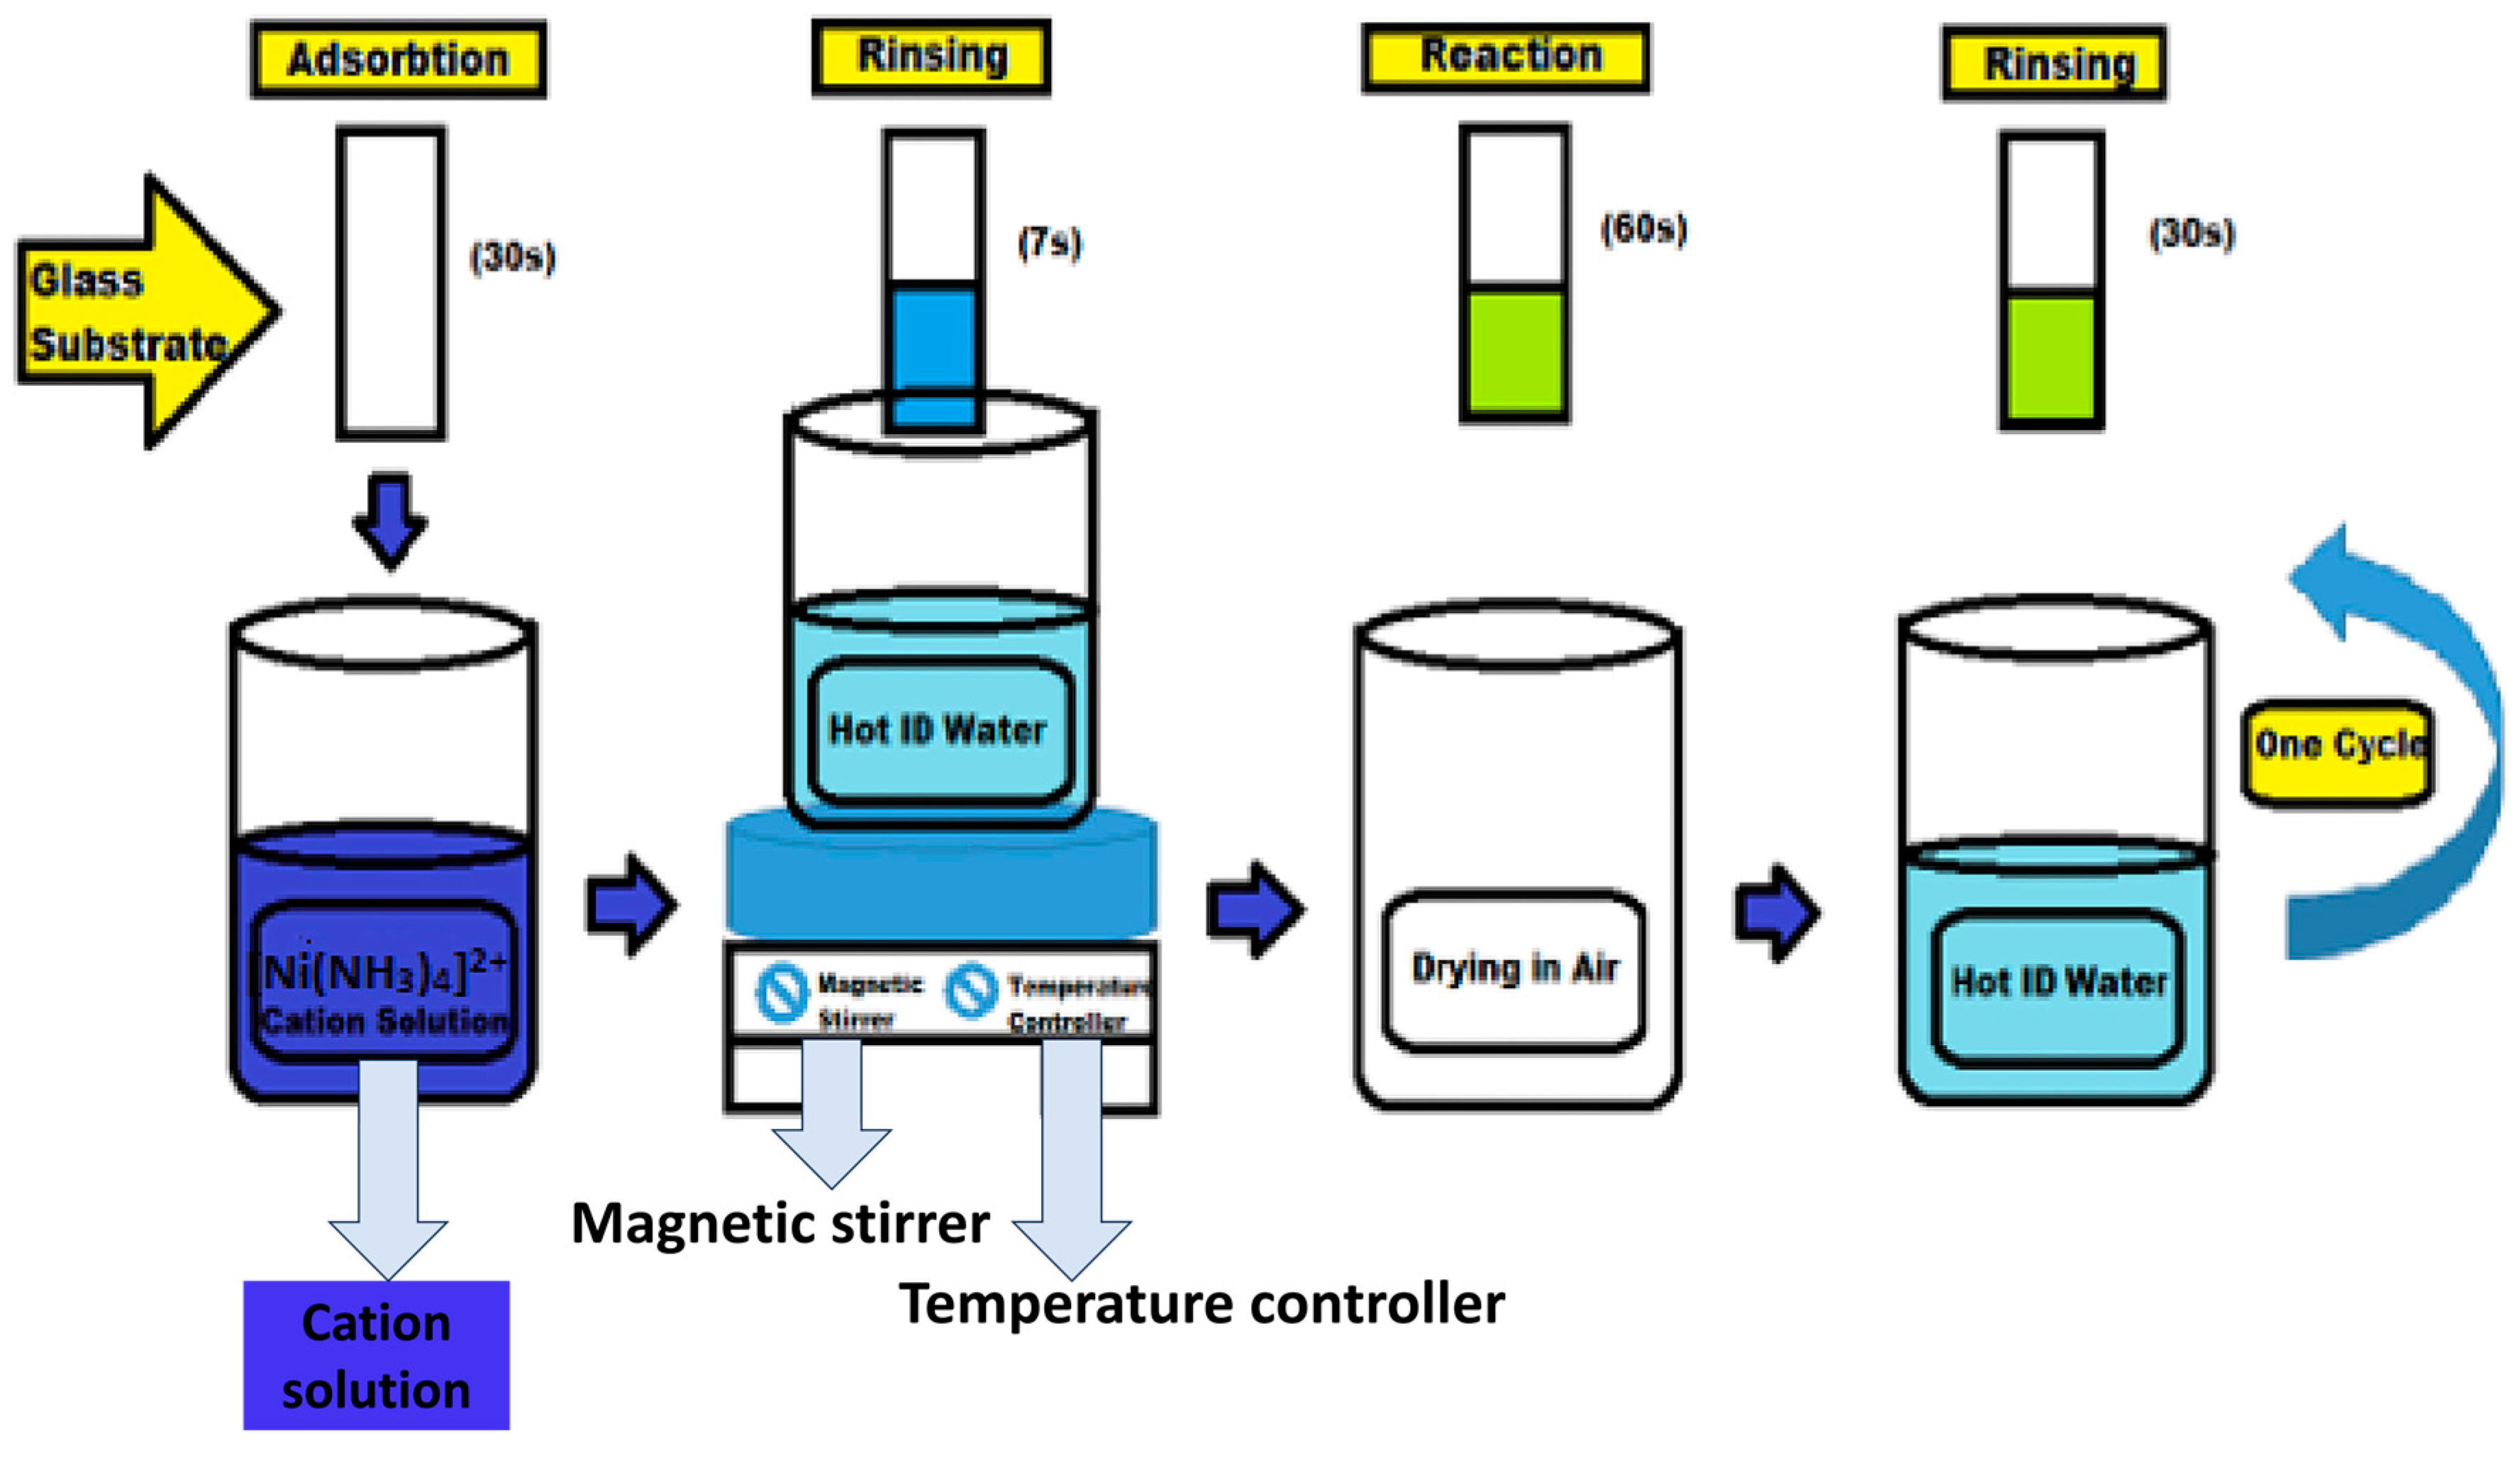
2.3.4. Successive Ionic Layer Adsorption and Reaction Method (SILAR)
3. Gas Sensing Mechanism
3.1. Impact of Growth Method on Gas Sensing Performances
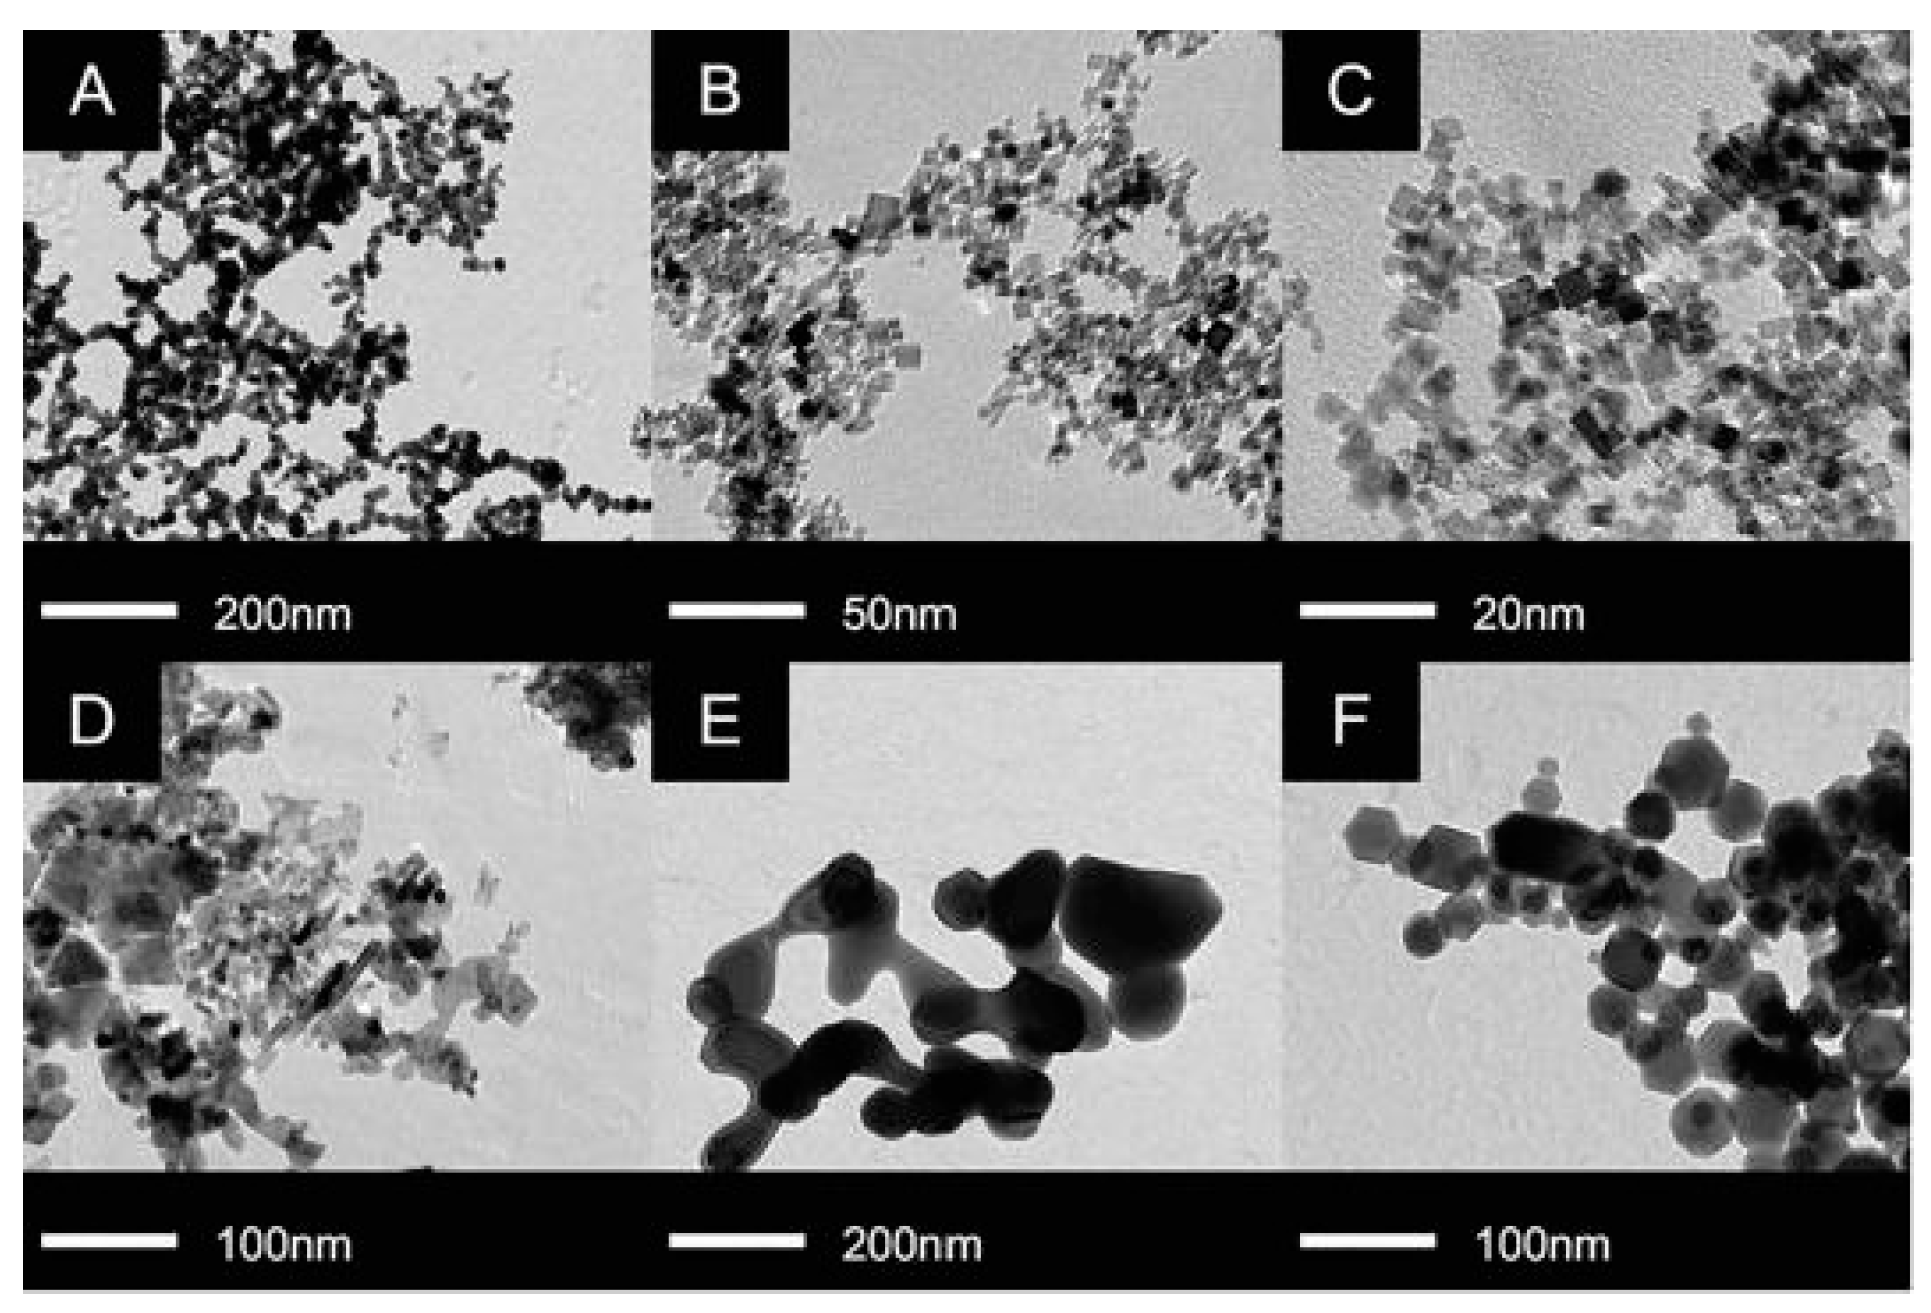
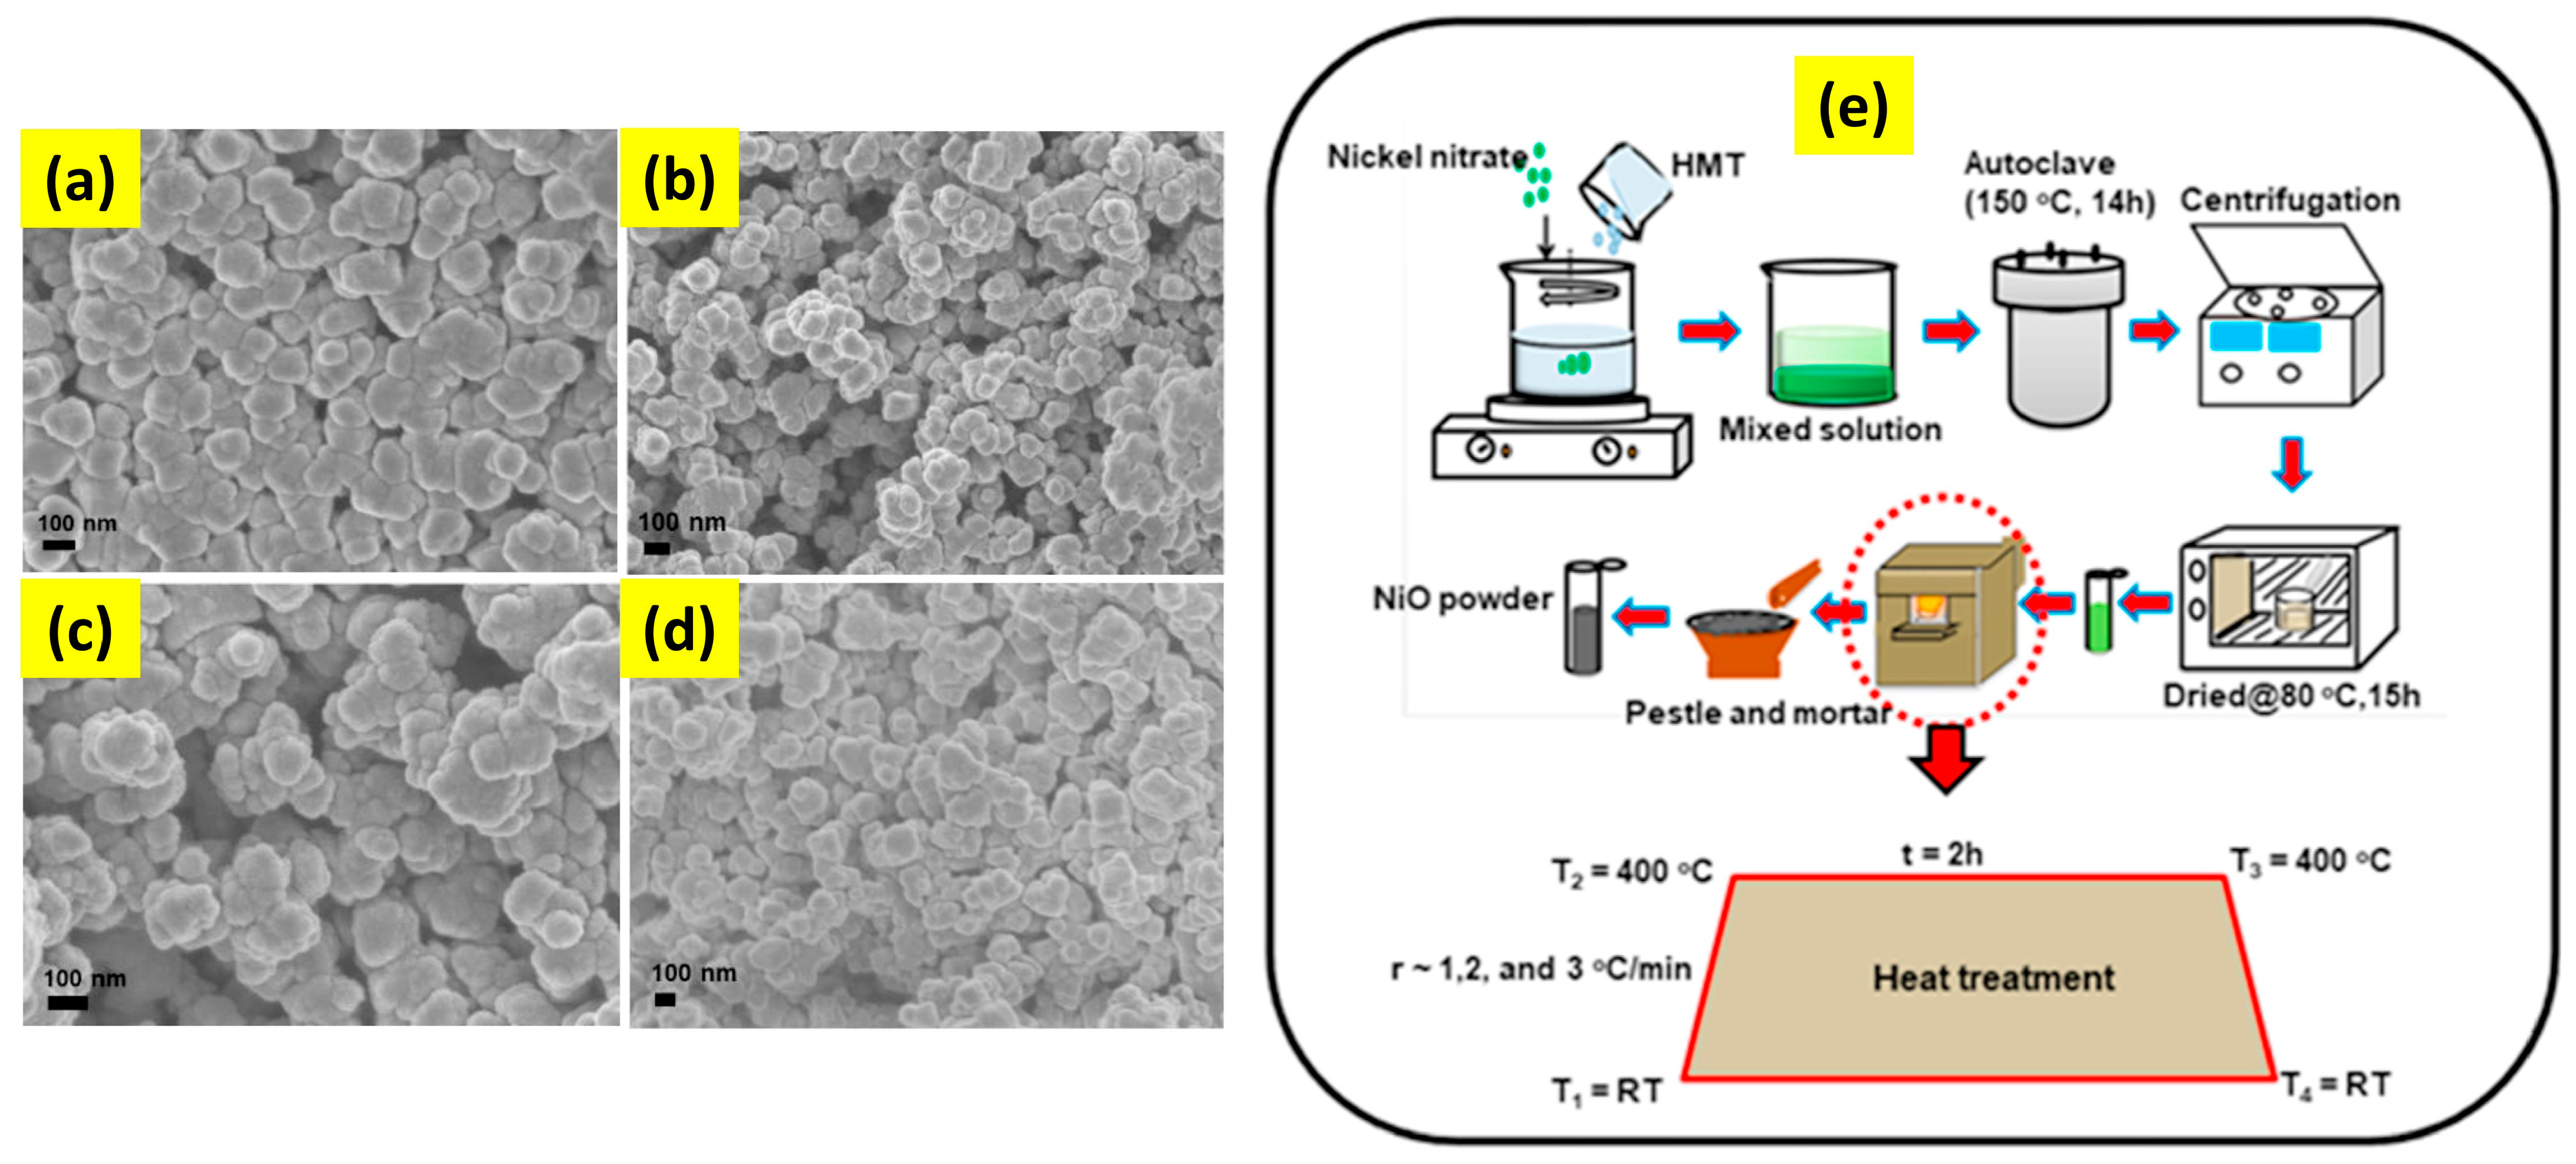
- Dissolving tri-sodium citrate dihydrate (0.588 g) and nickel chloride hexahydrate (0.475 g) in 40 mL of deionized water and stirring them vigorously until reaching a clear green solution into which 20 mL of ethanol was added under stirring to make a transparent mixture that is transferred to the lined-autoclave at 190 °C for 8 h and 12 h, resulting in NiO solid spheres.
- Dissolving the same amount of nickel chloride with urea (0.6 g) in 40 mL of deionized water and 10 mL of ethanol to which 0.002 mol of CTAB agent was added and stirred until the solution was clear and transferred to the autoclave at 200 °C for 8 h and 12 h, resulting in NiO porous spheres.
- Dissolving the same amount of nickel chloride with urea (3.5 g) in 20 mL of deionized water and 20 mL of ethanol under stirring to obtain a clear blue solution that is transferred to the autoclave at 140 °C for 8 h and 12 h, resulting in NiO hollow spheres.
3.2. Inorganic Composites NiO–X
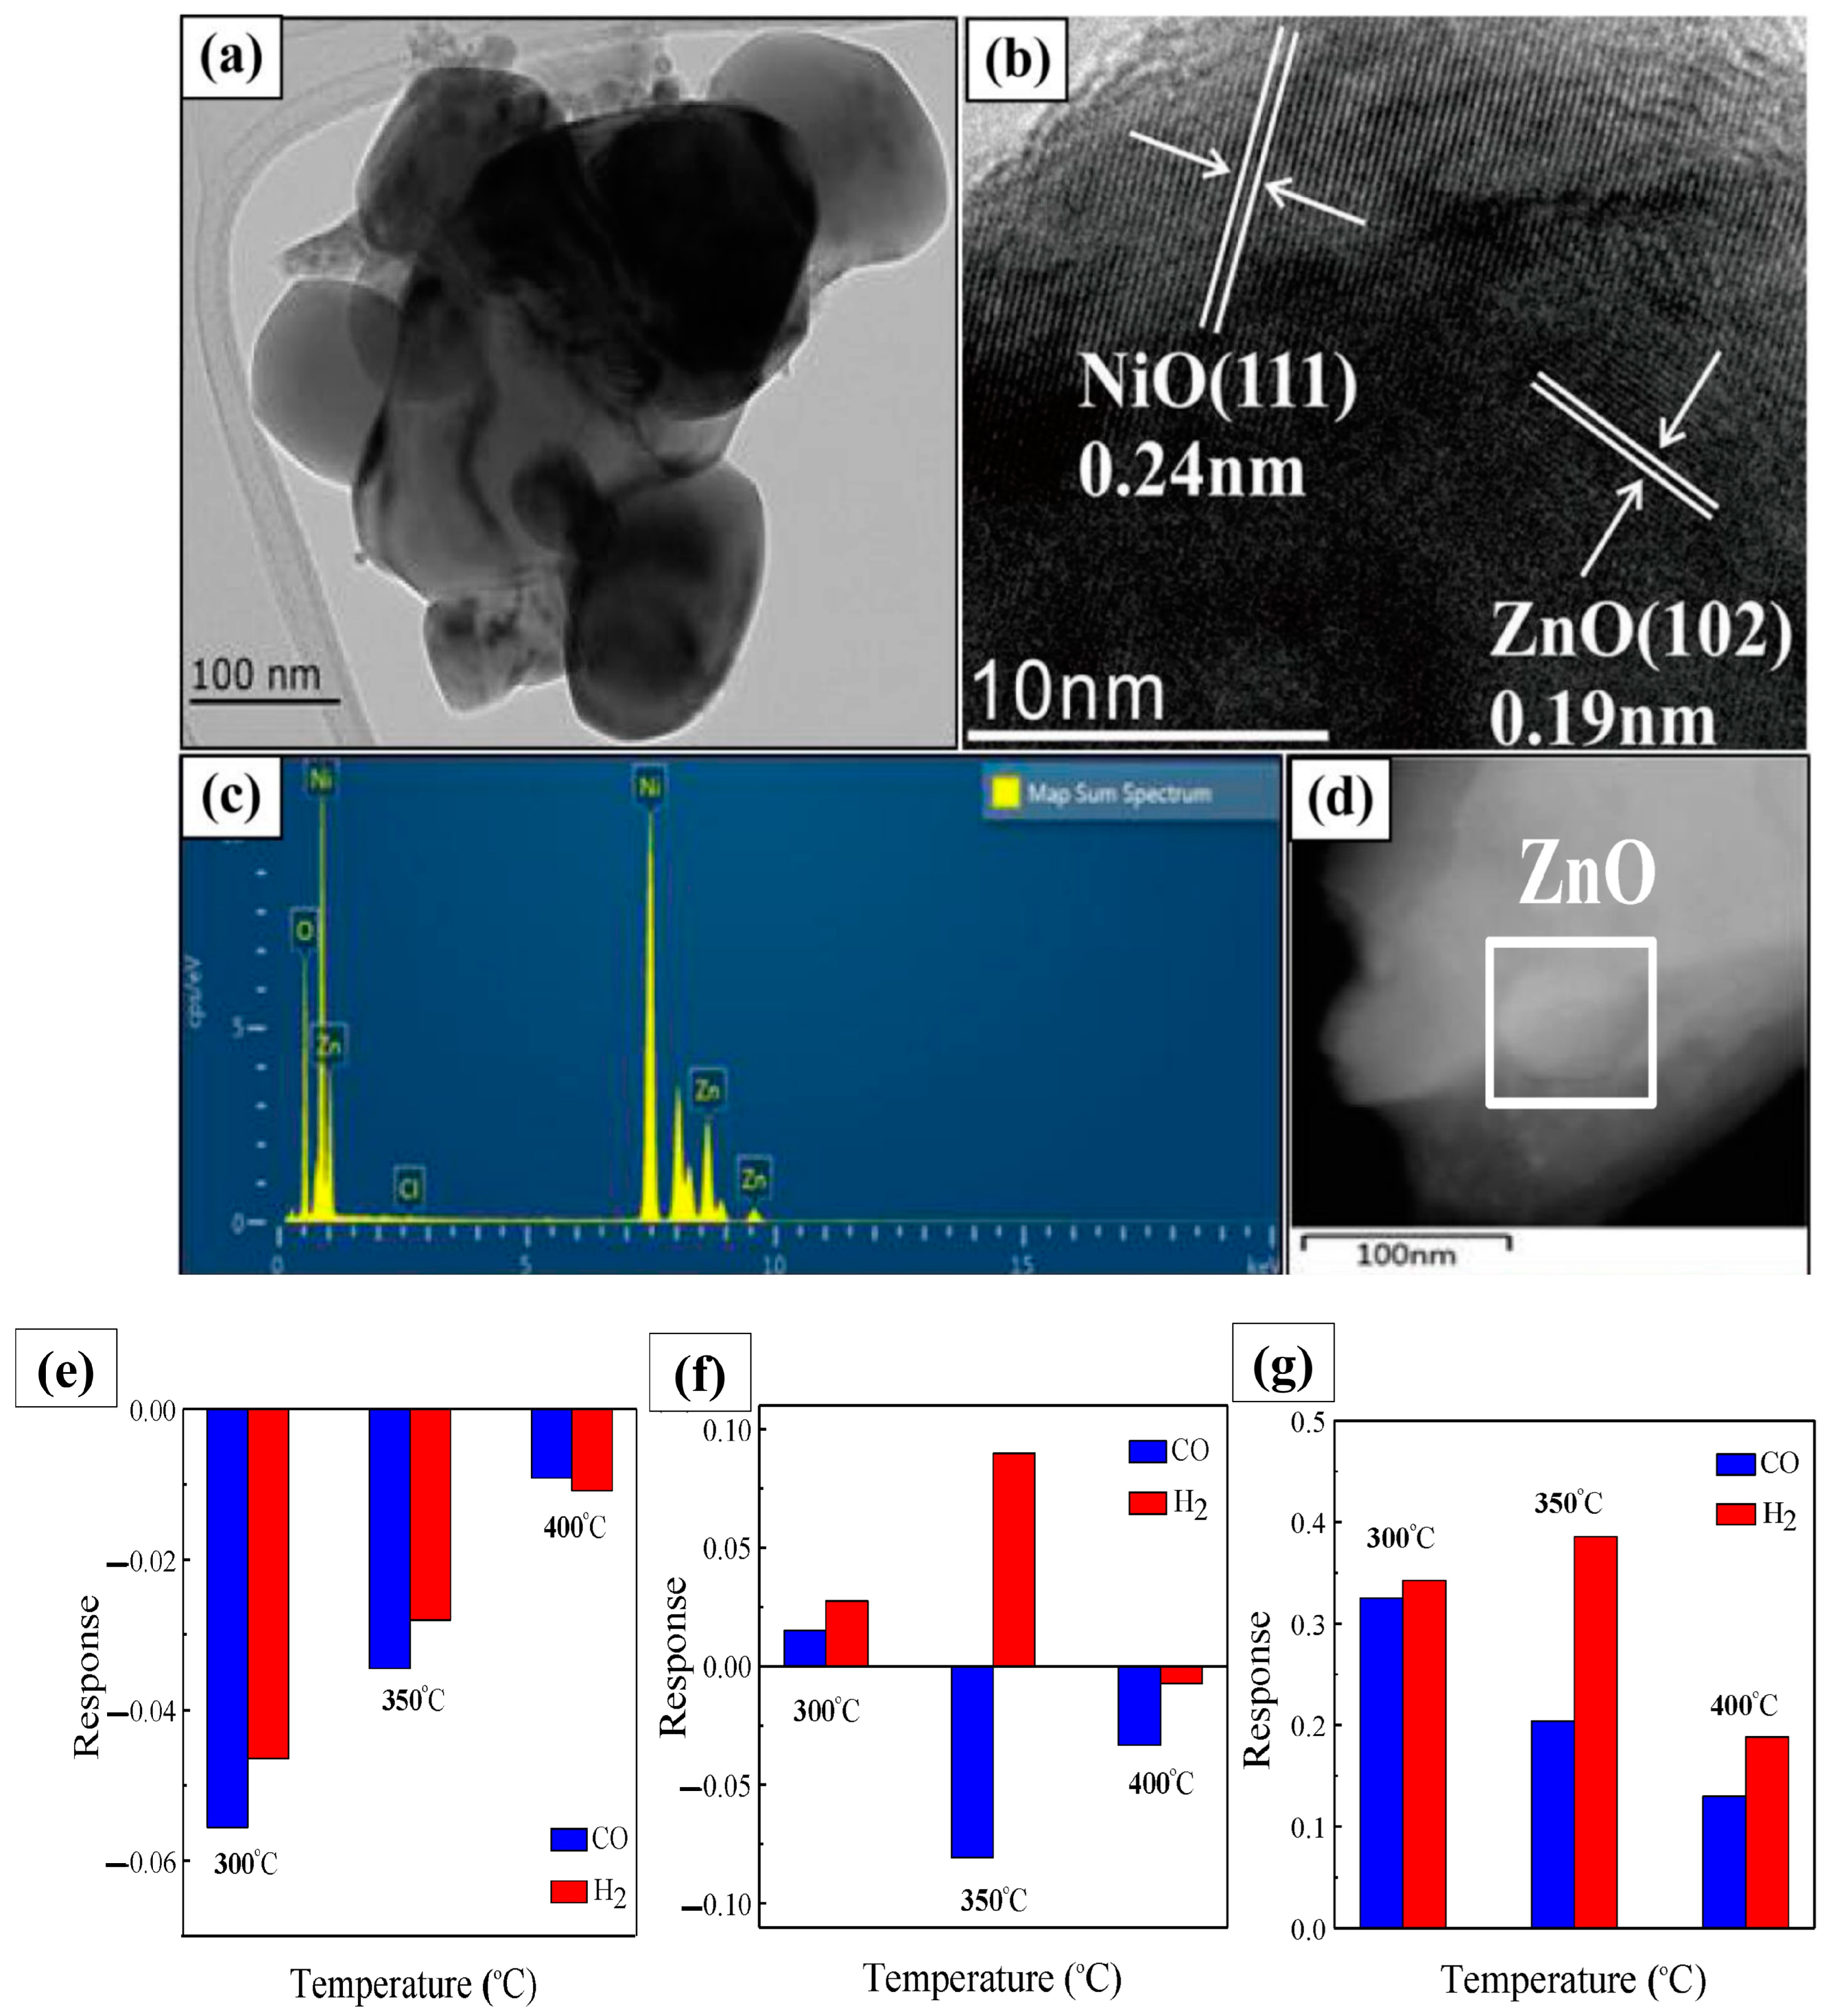
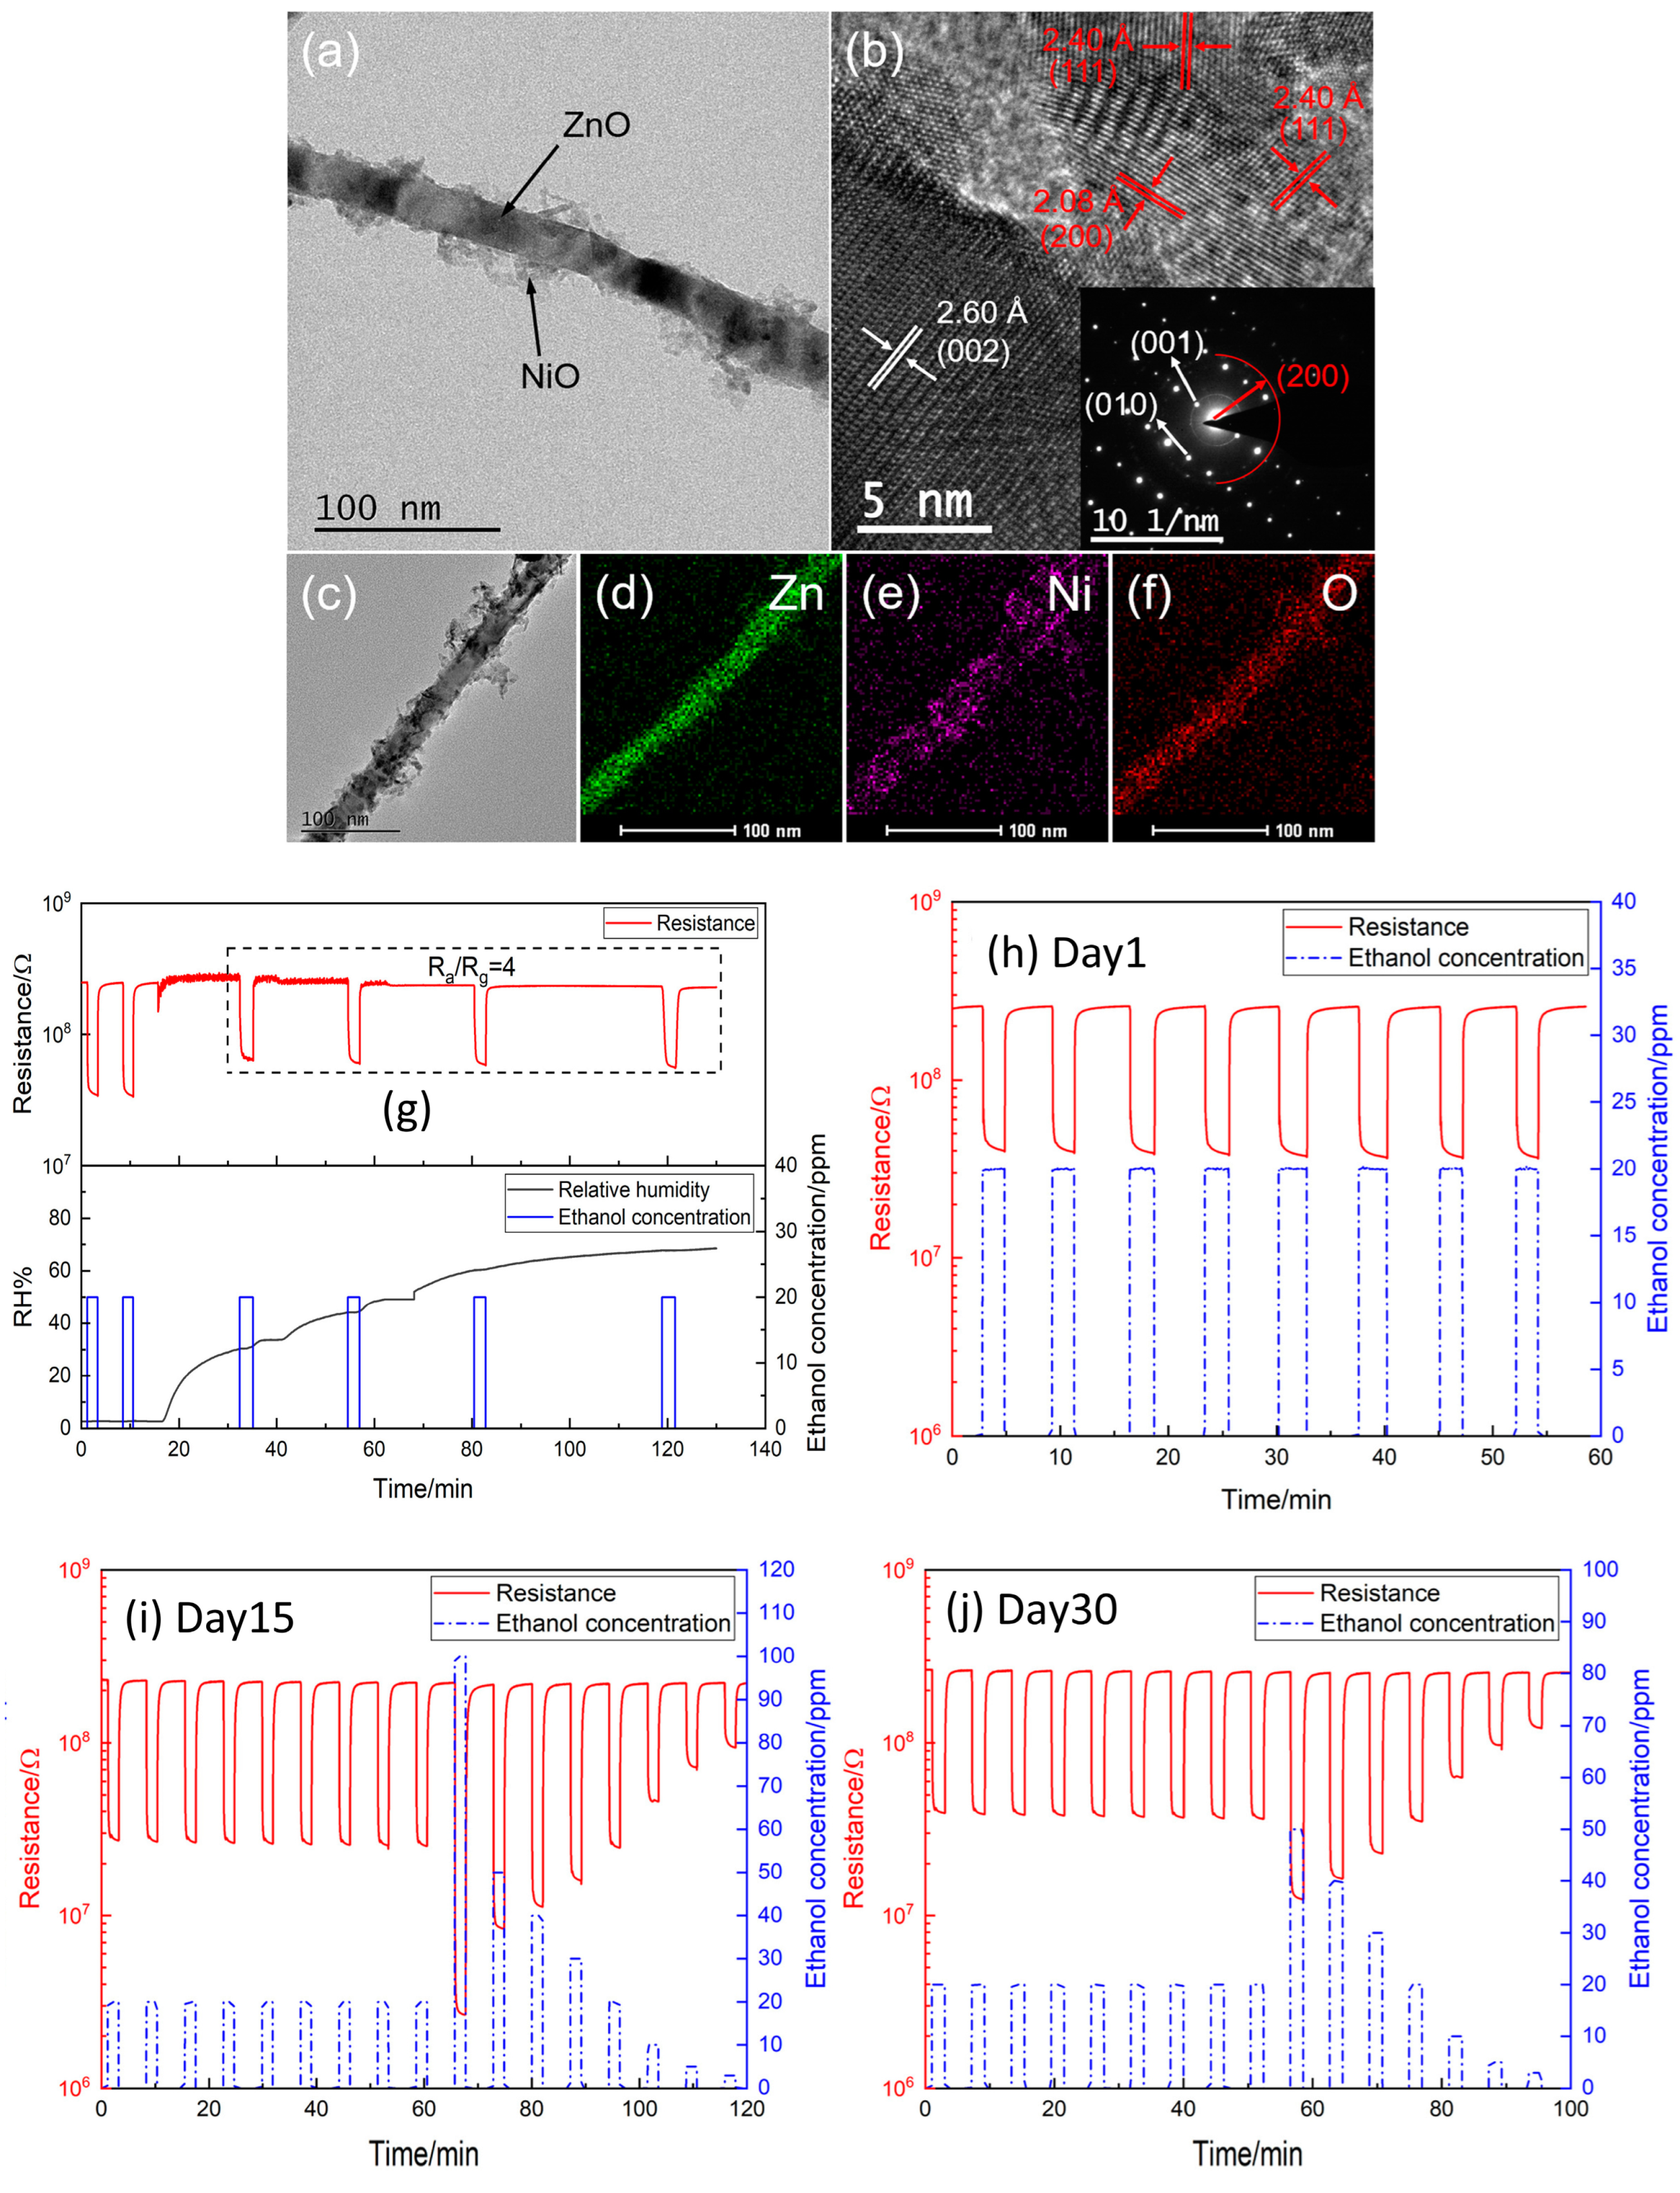
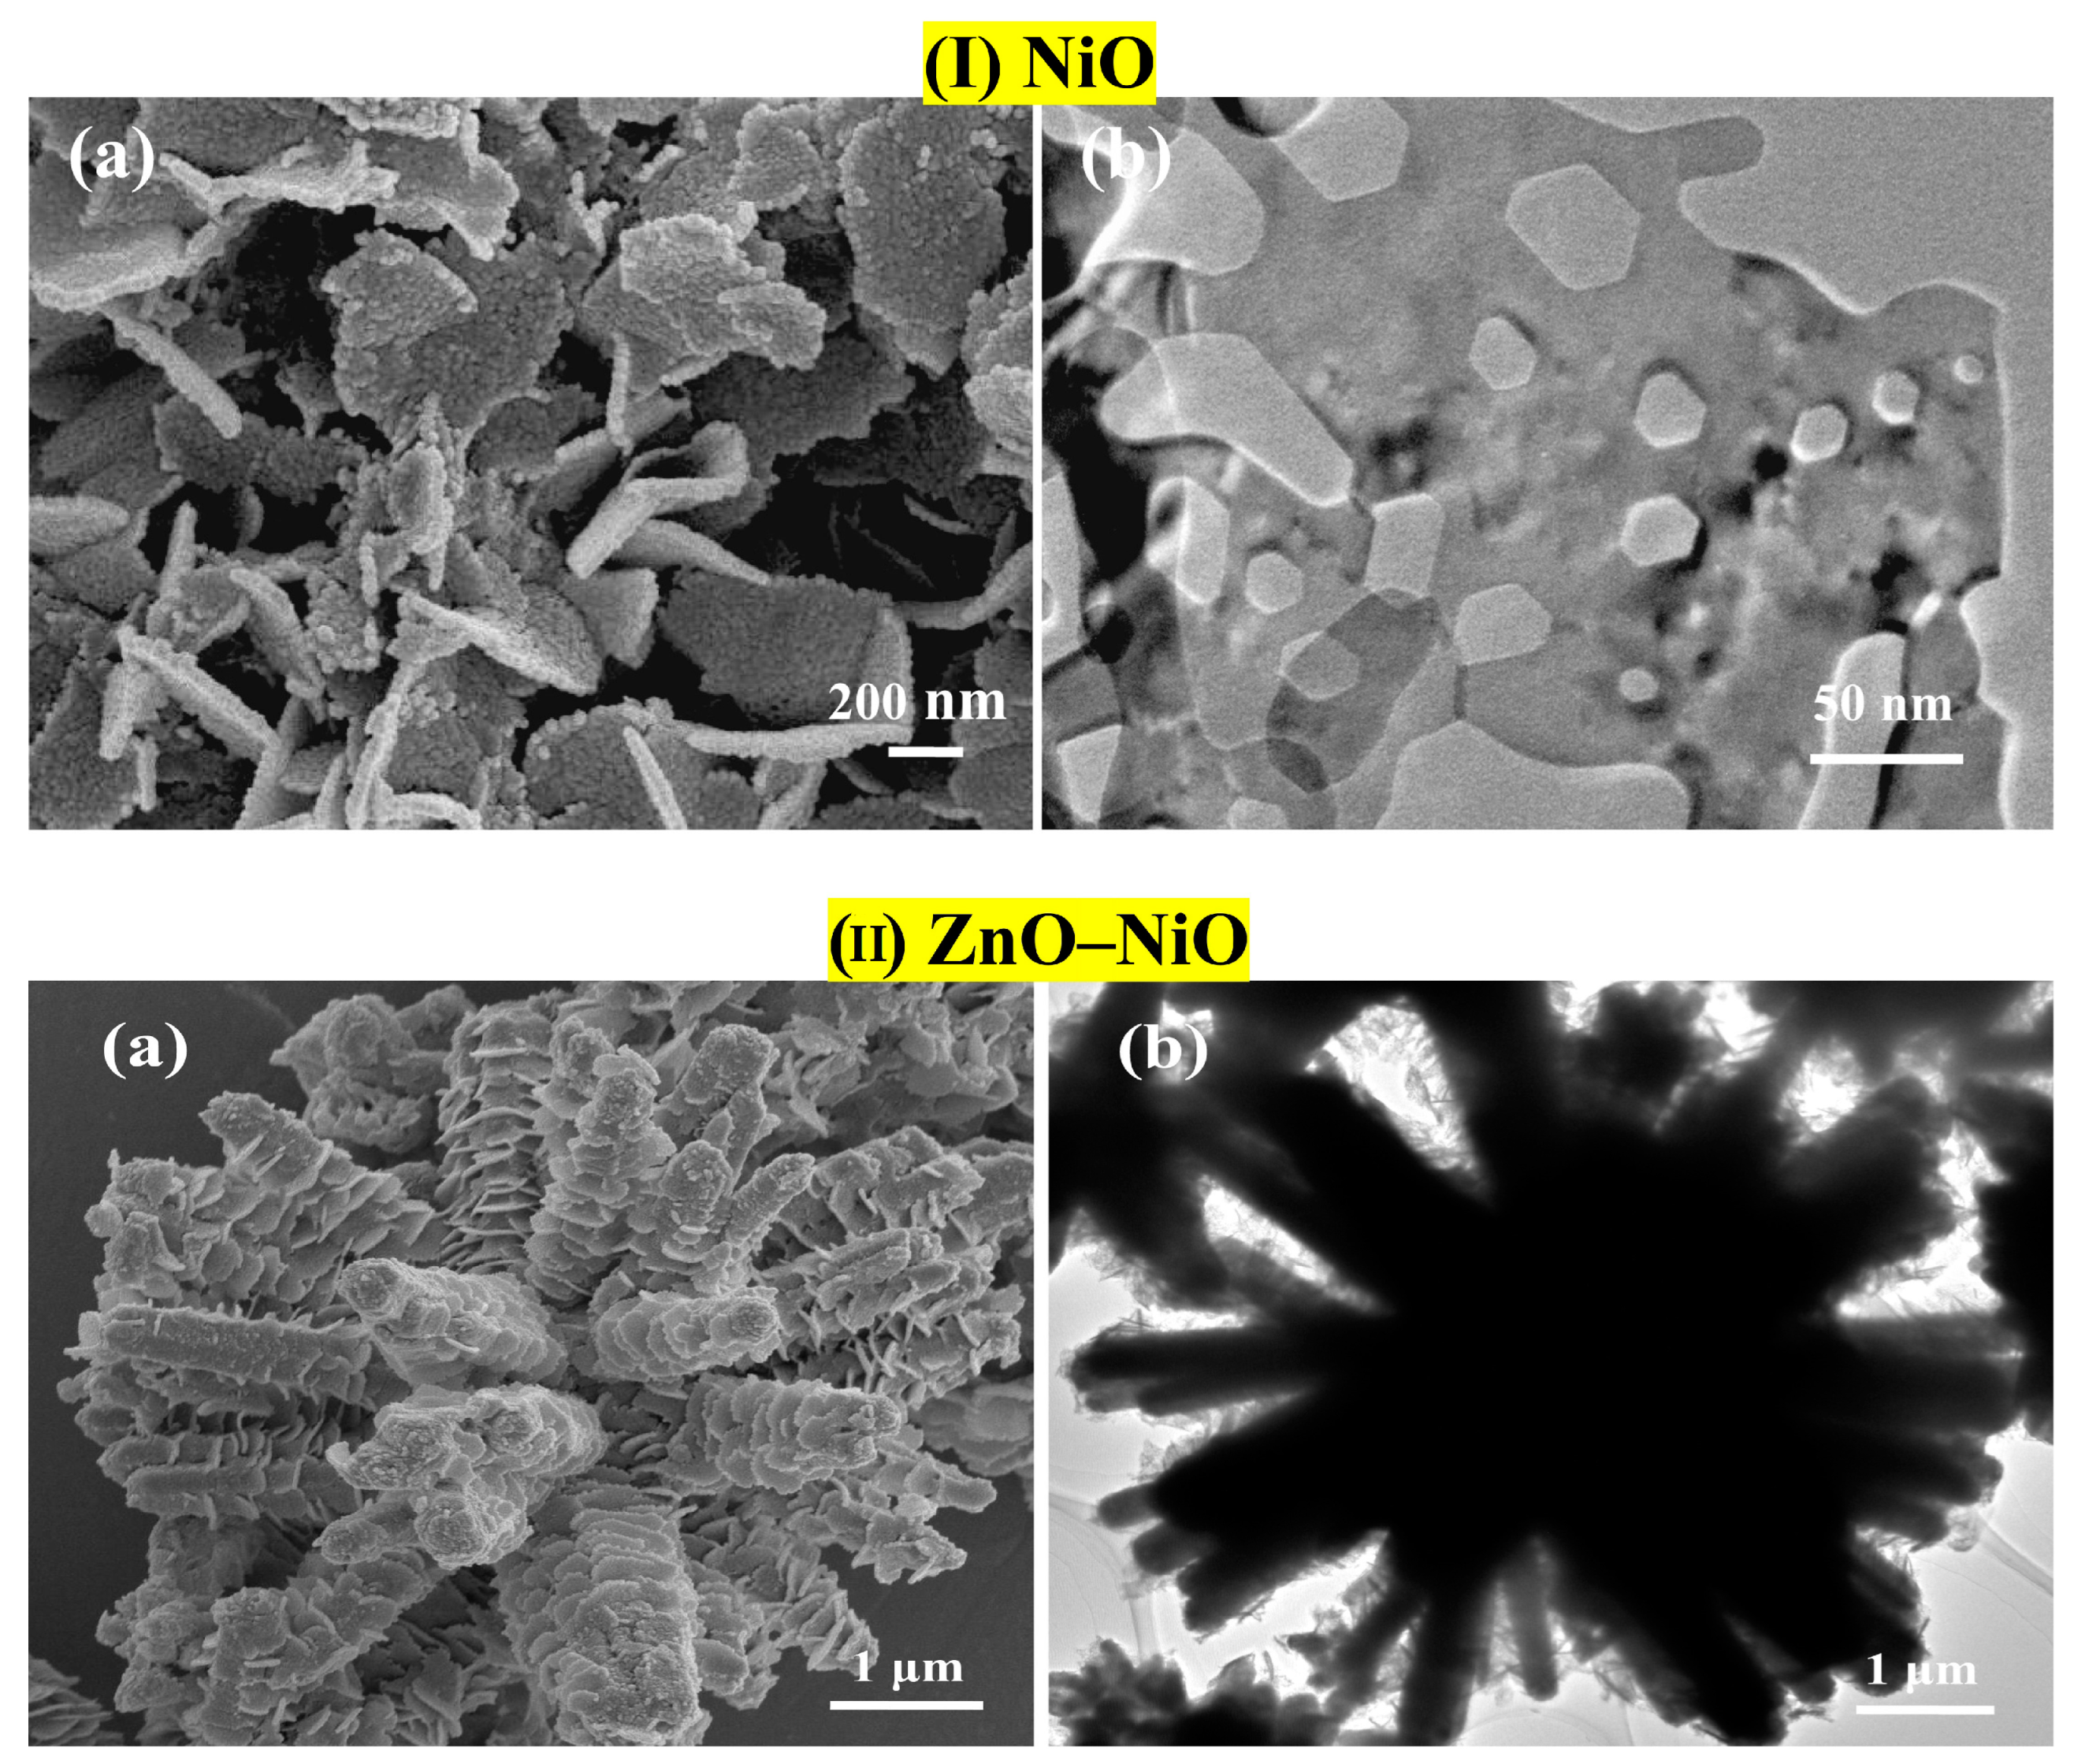
3.2.1. X = ZnO
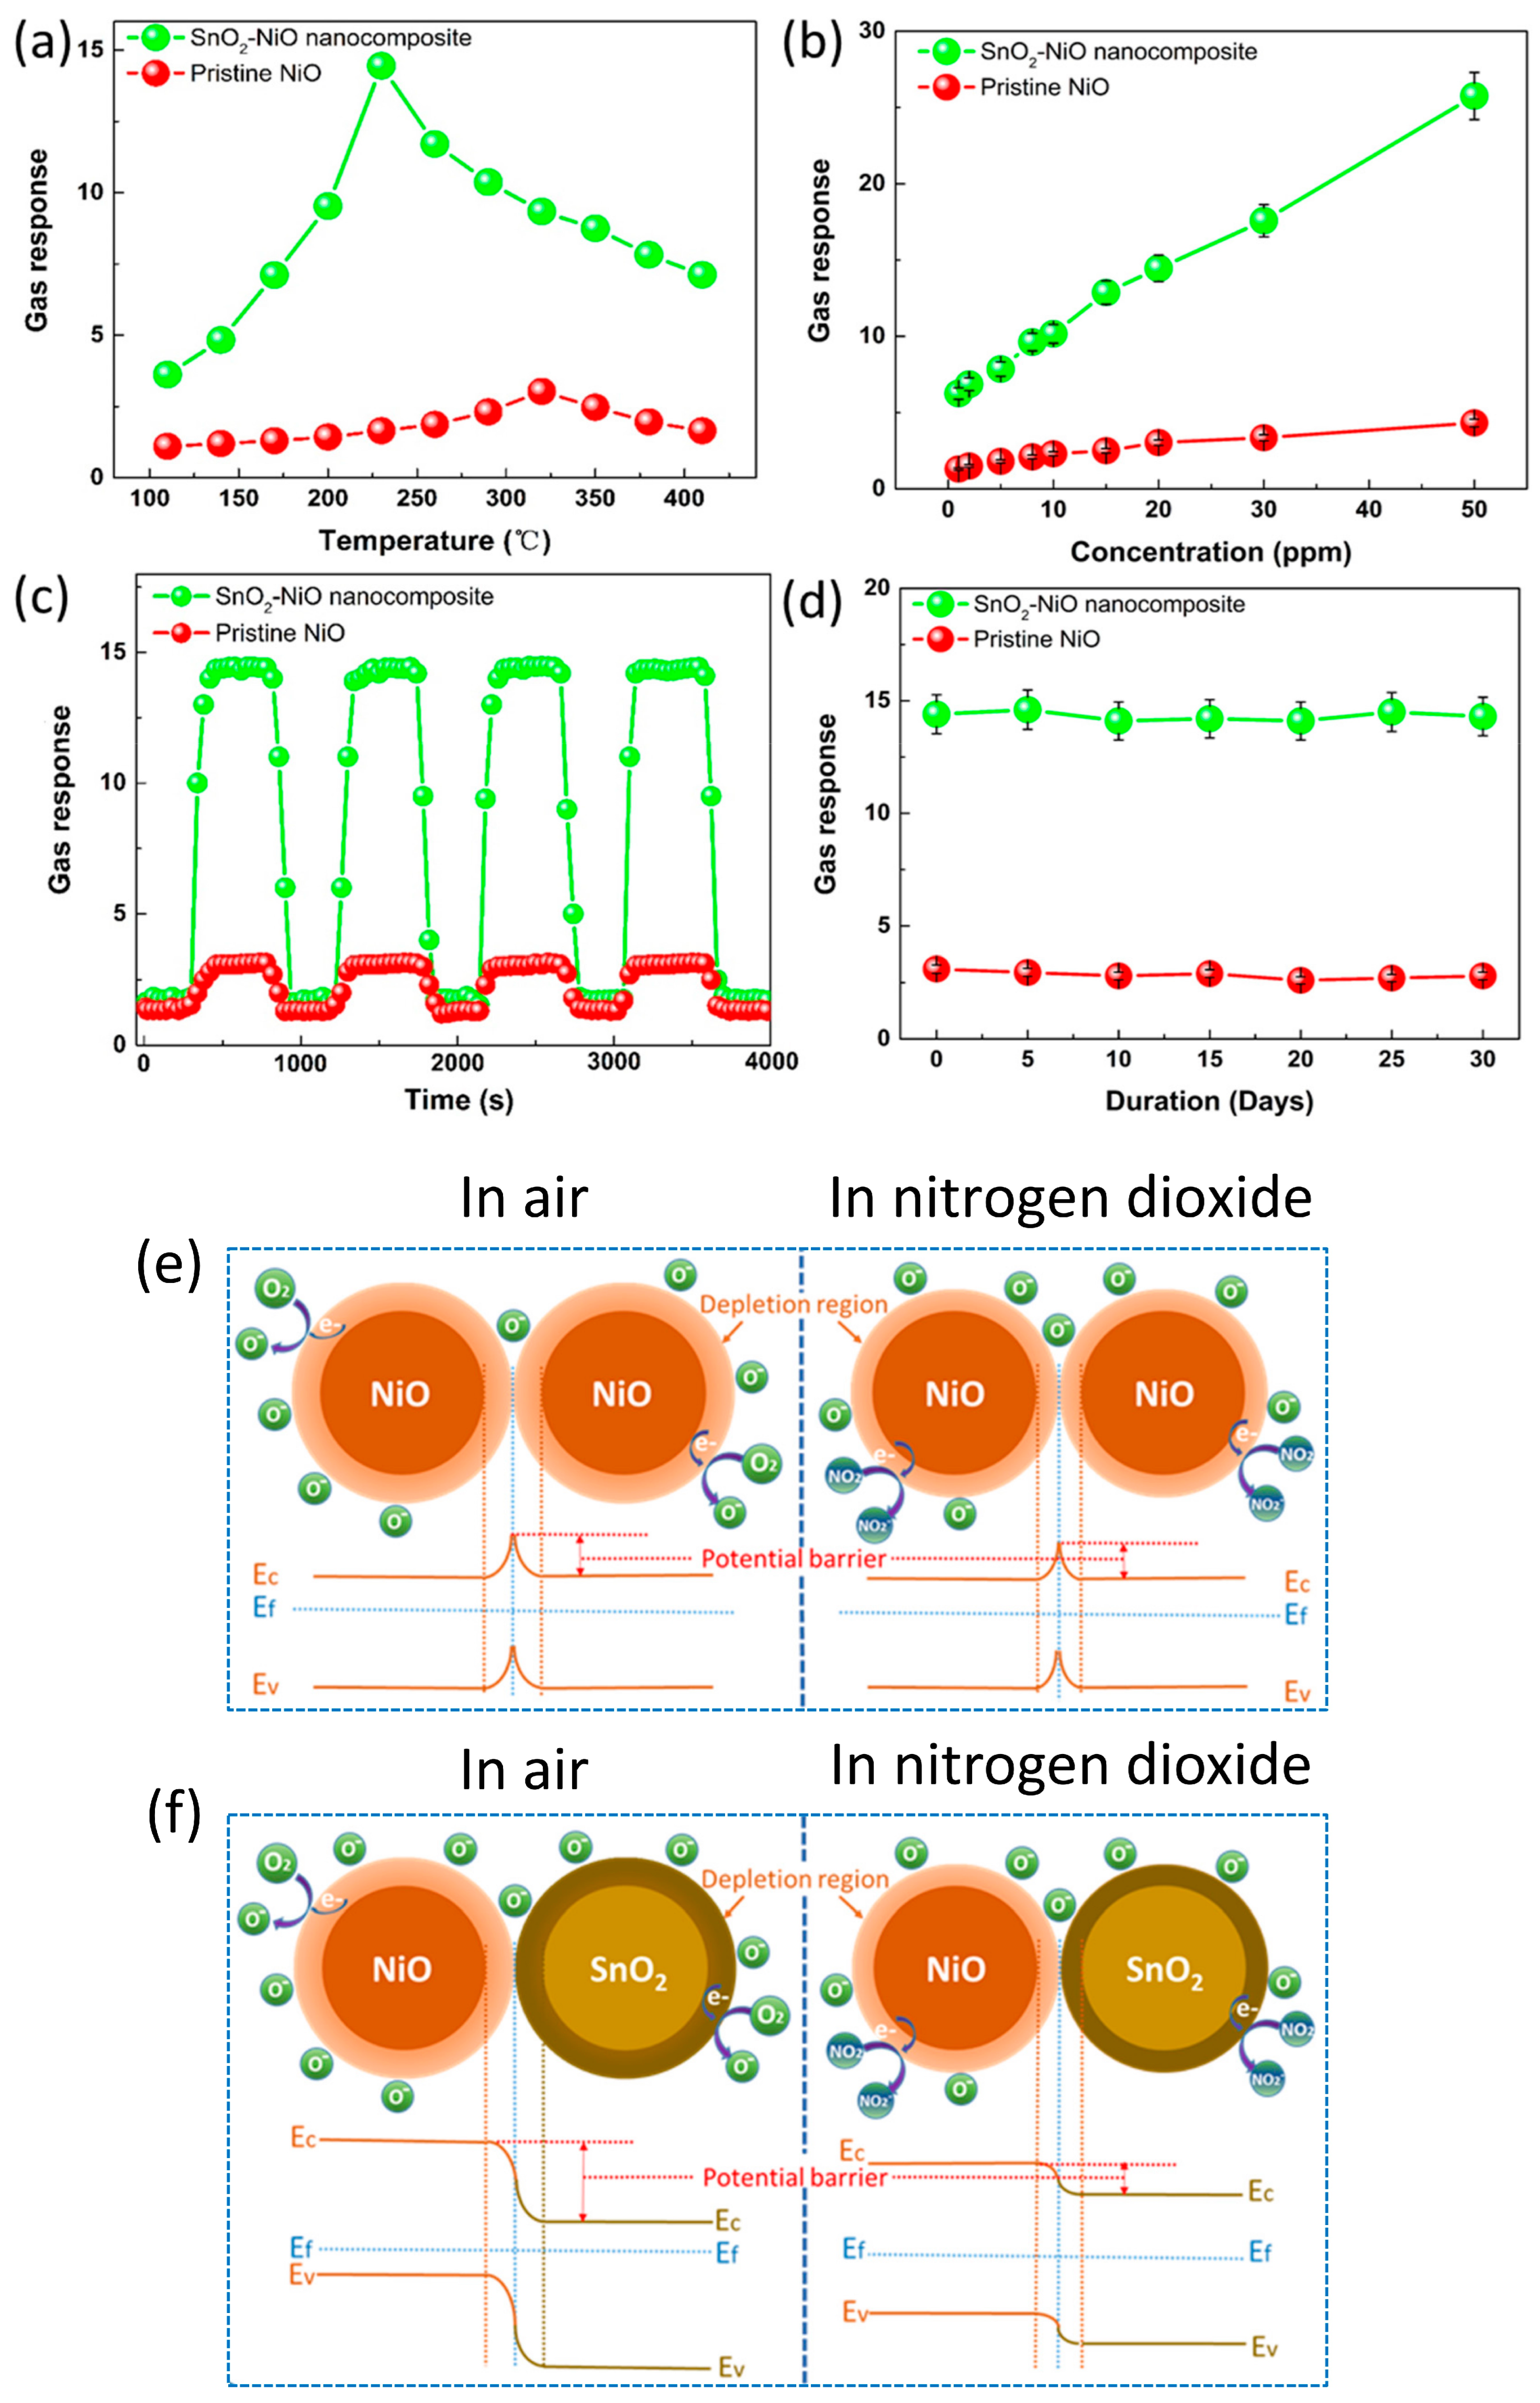
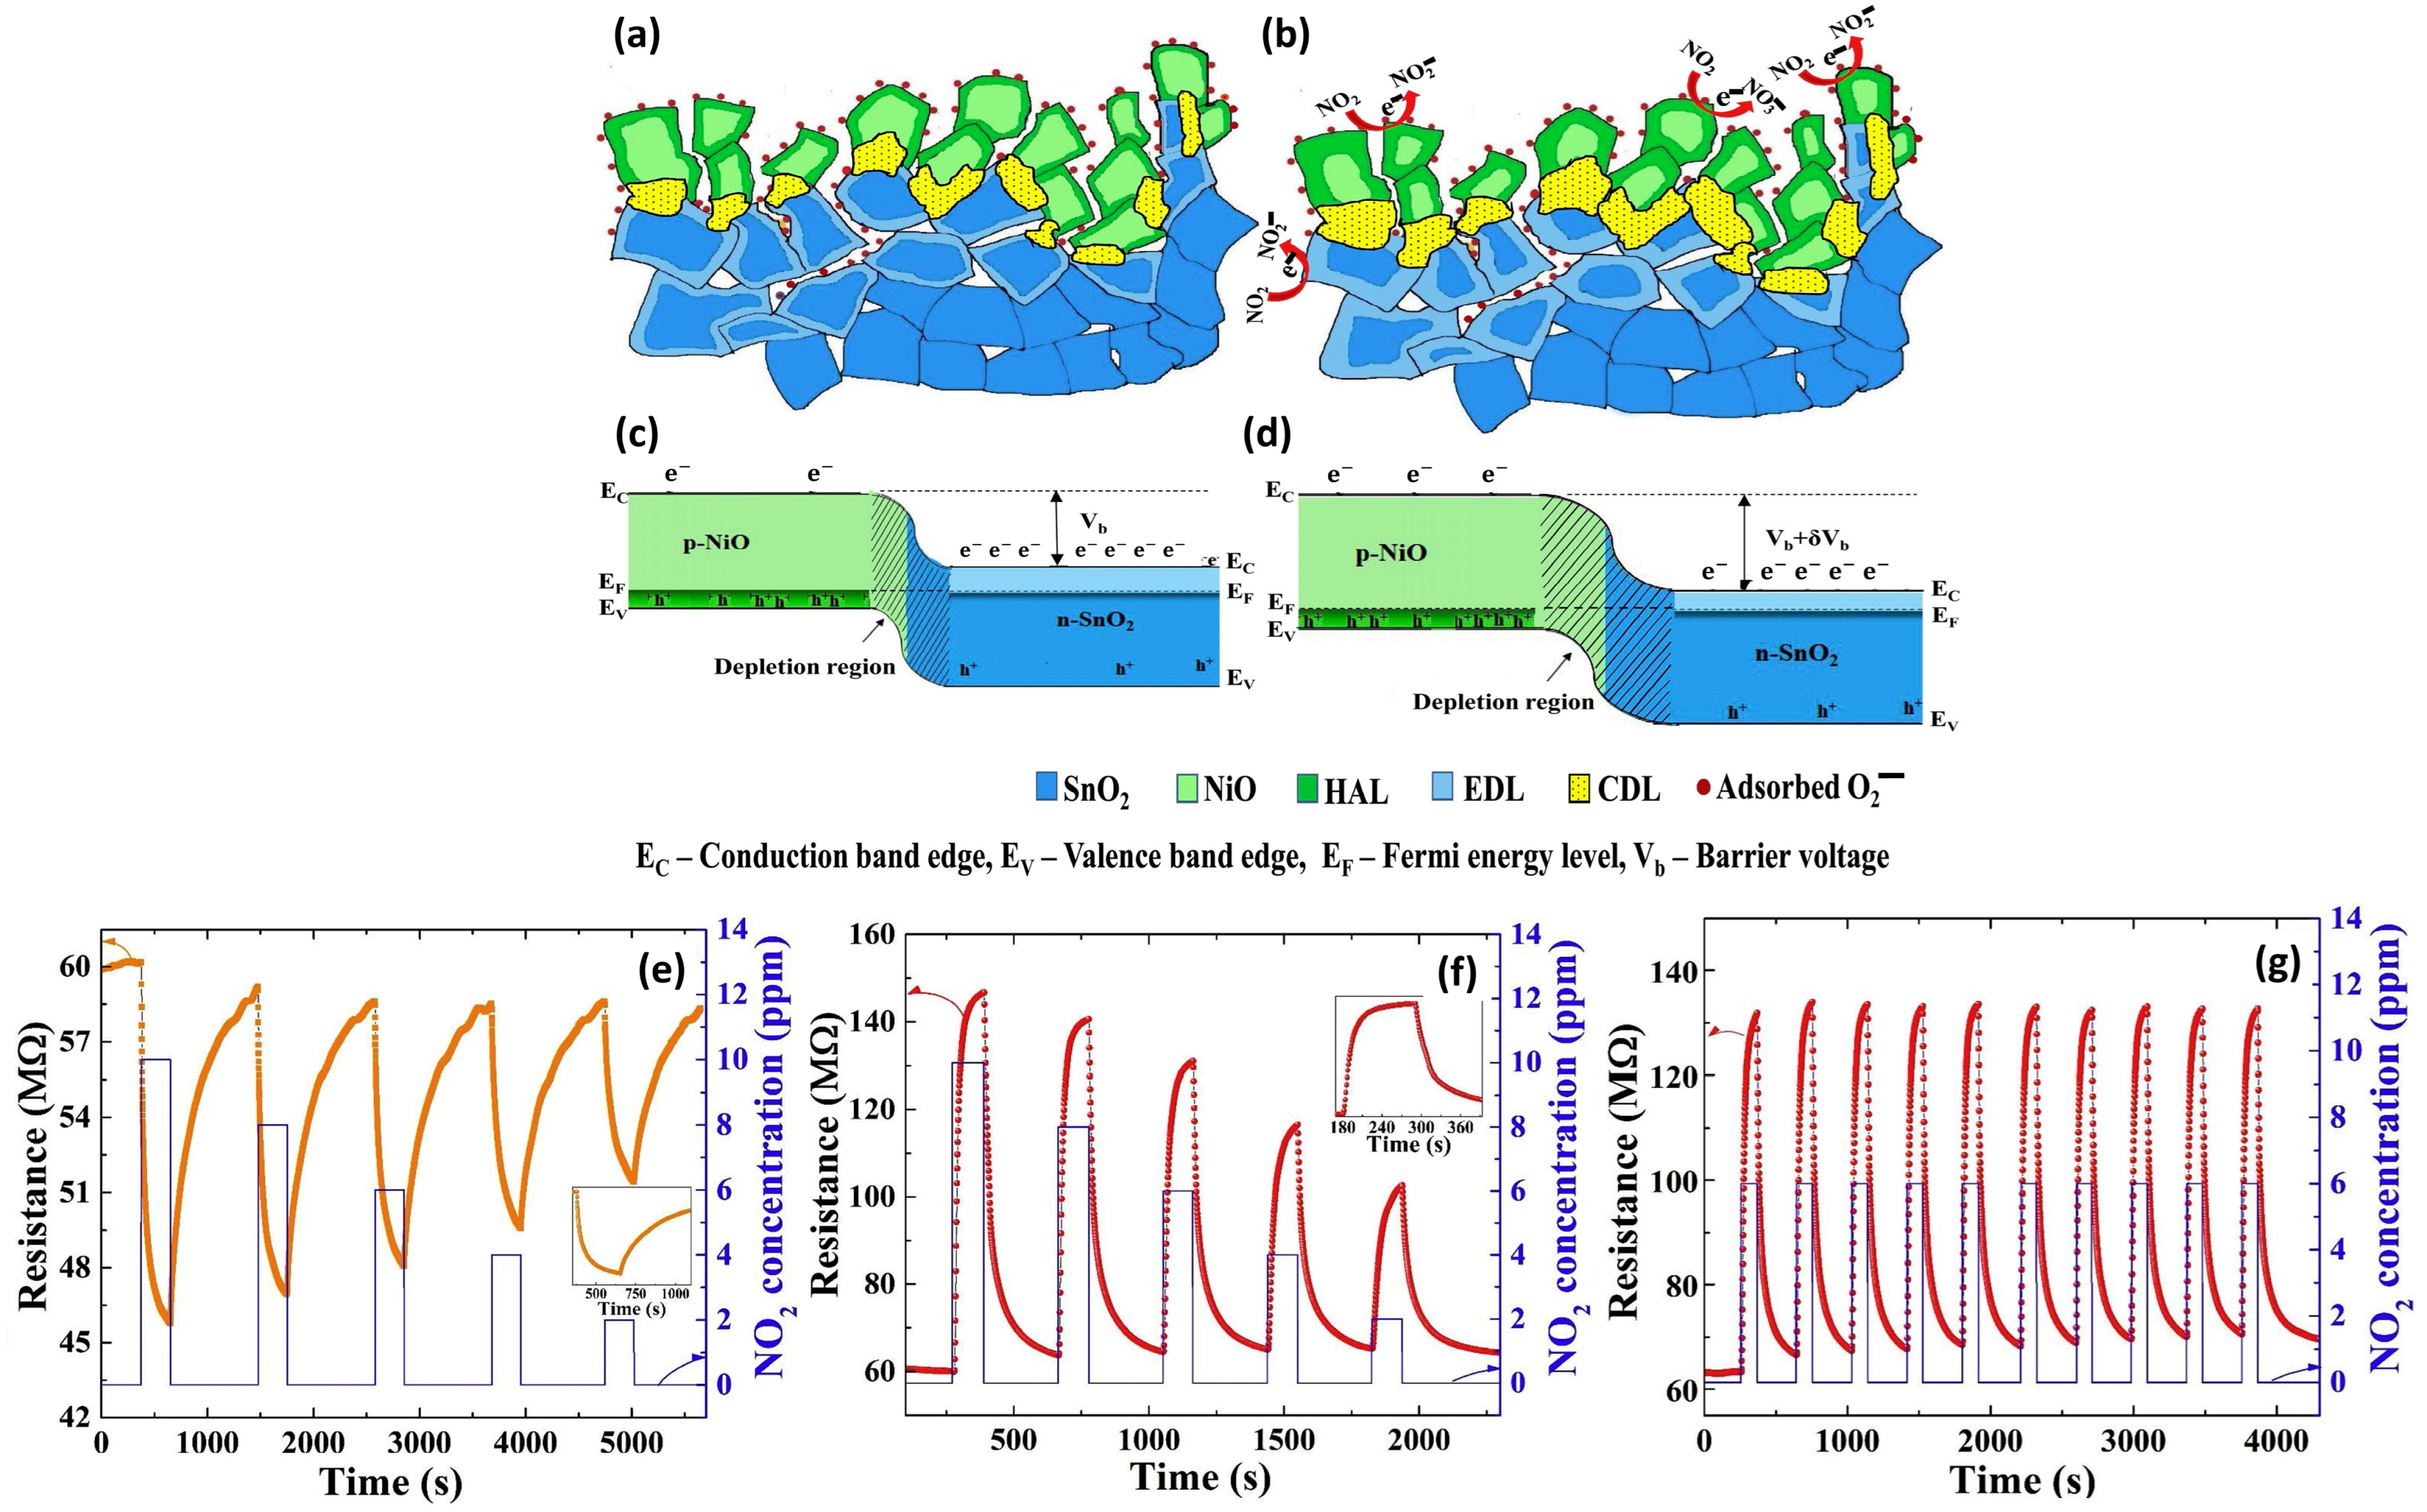
3.2.2. X = SnO2
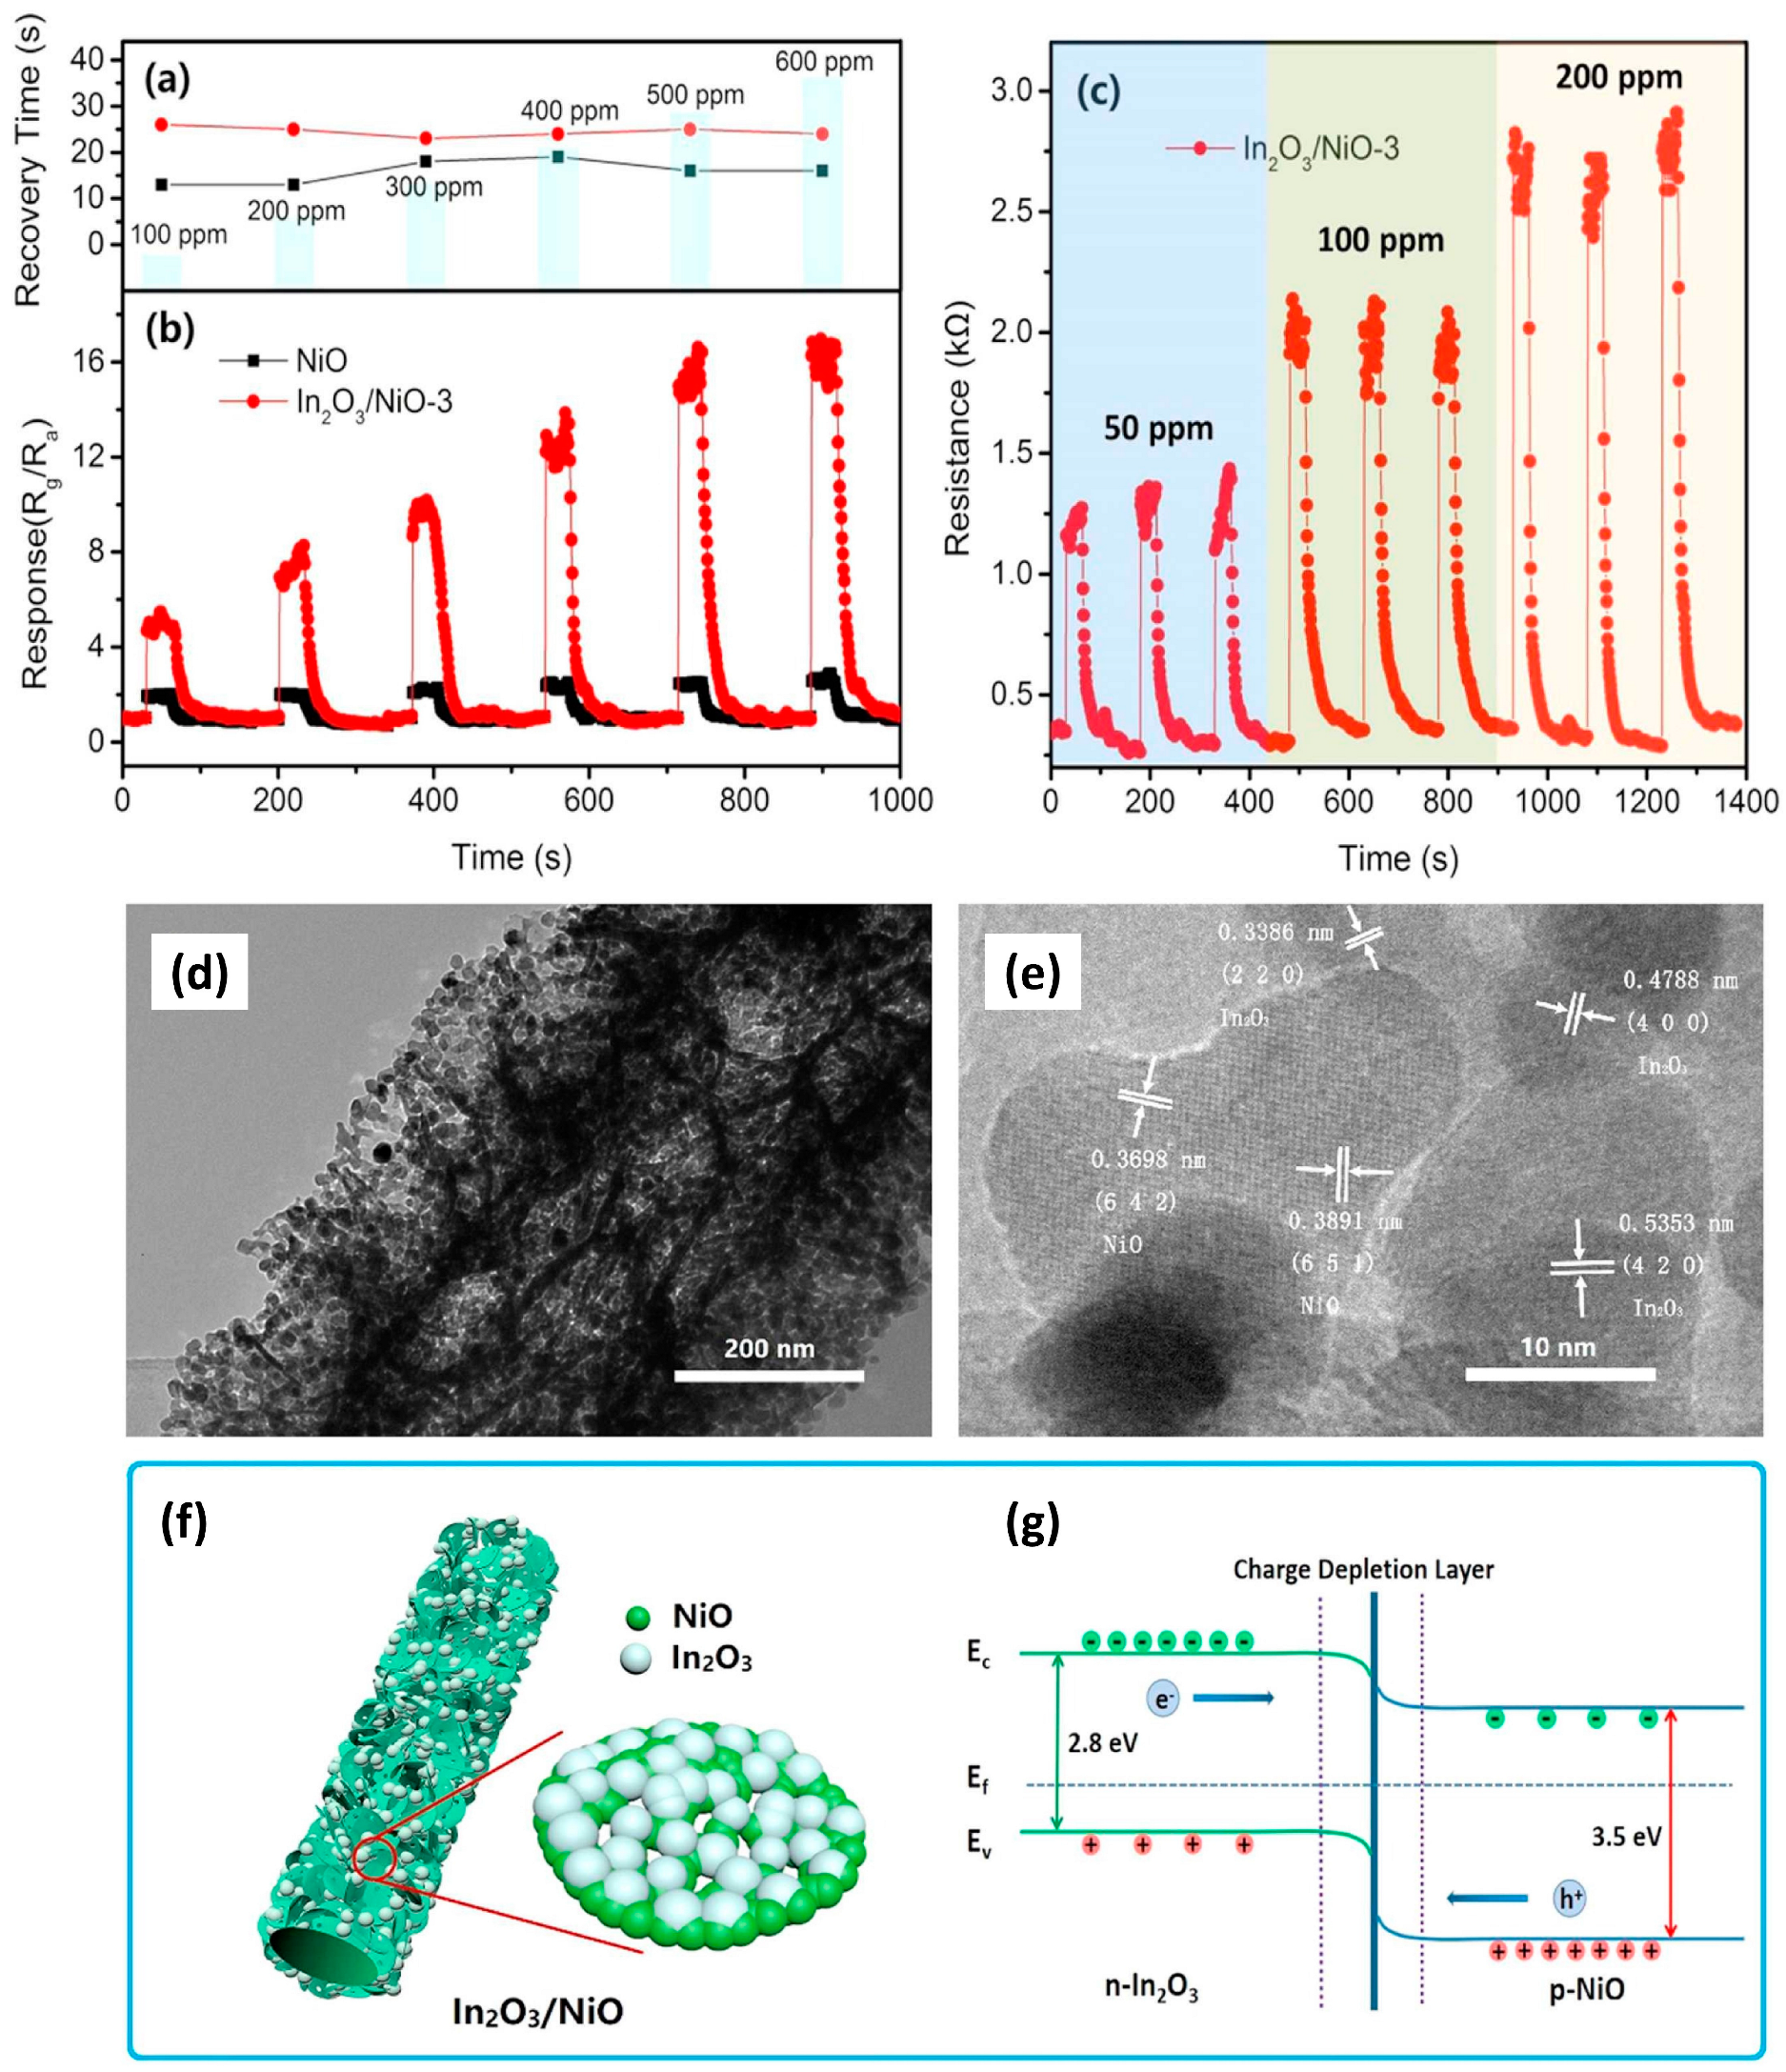
3.2.3. X = In2O3
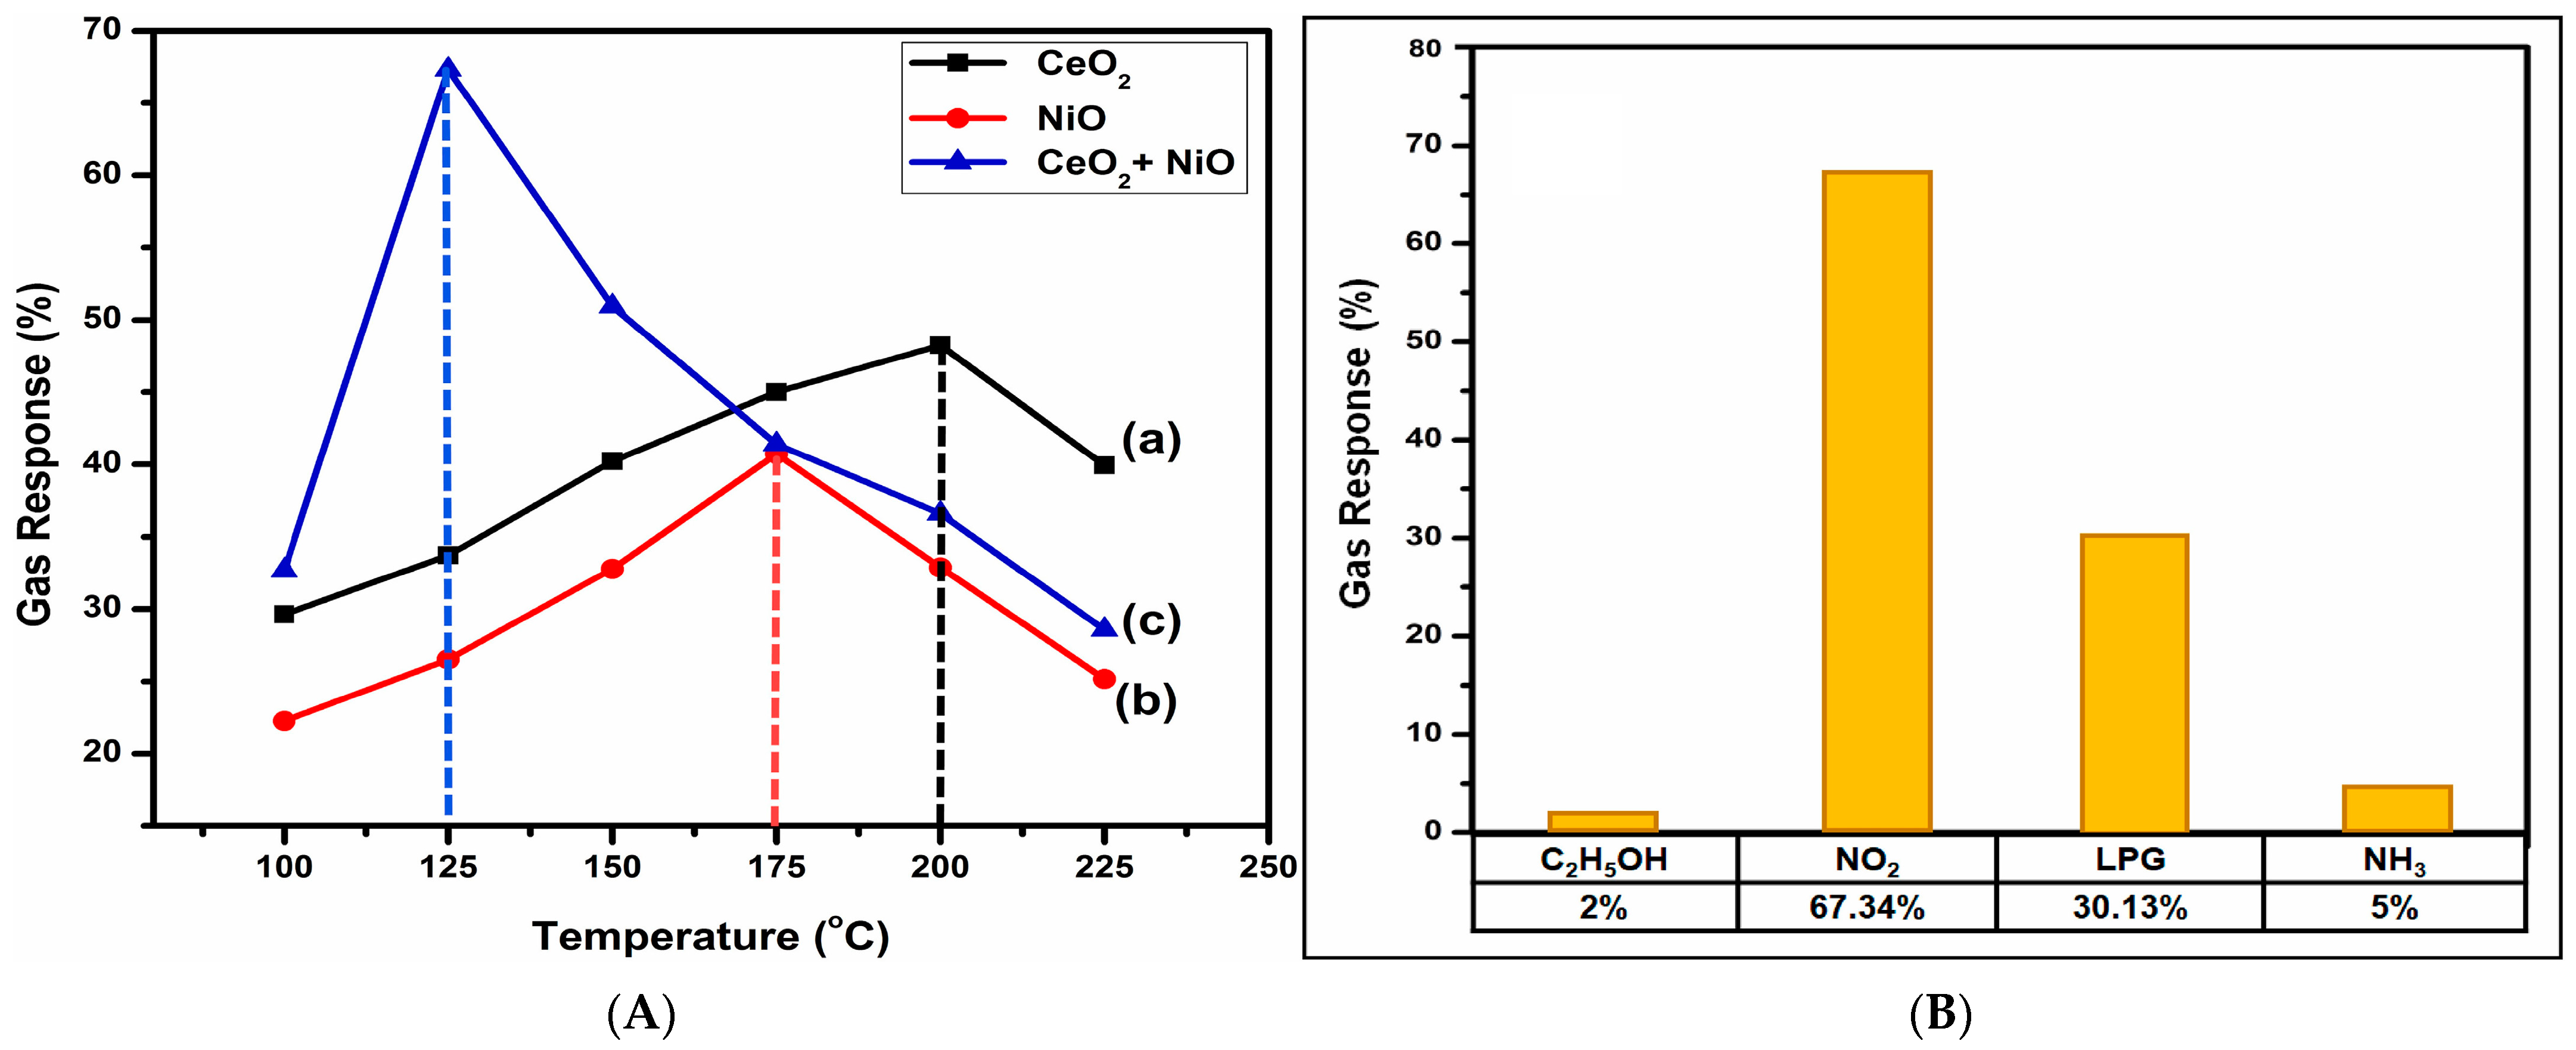
3.2.4. X = CeO2
3.2.5. X = Fe2O3
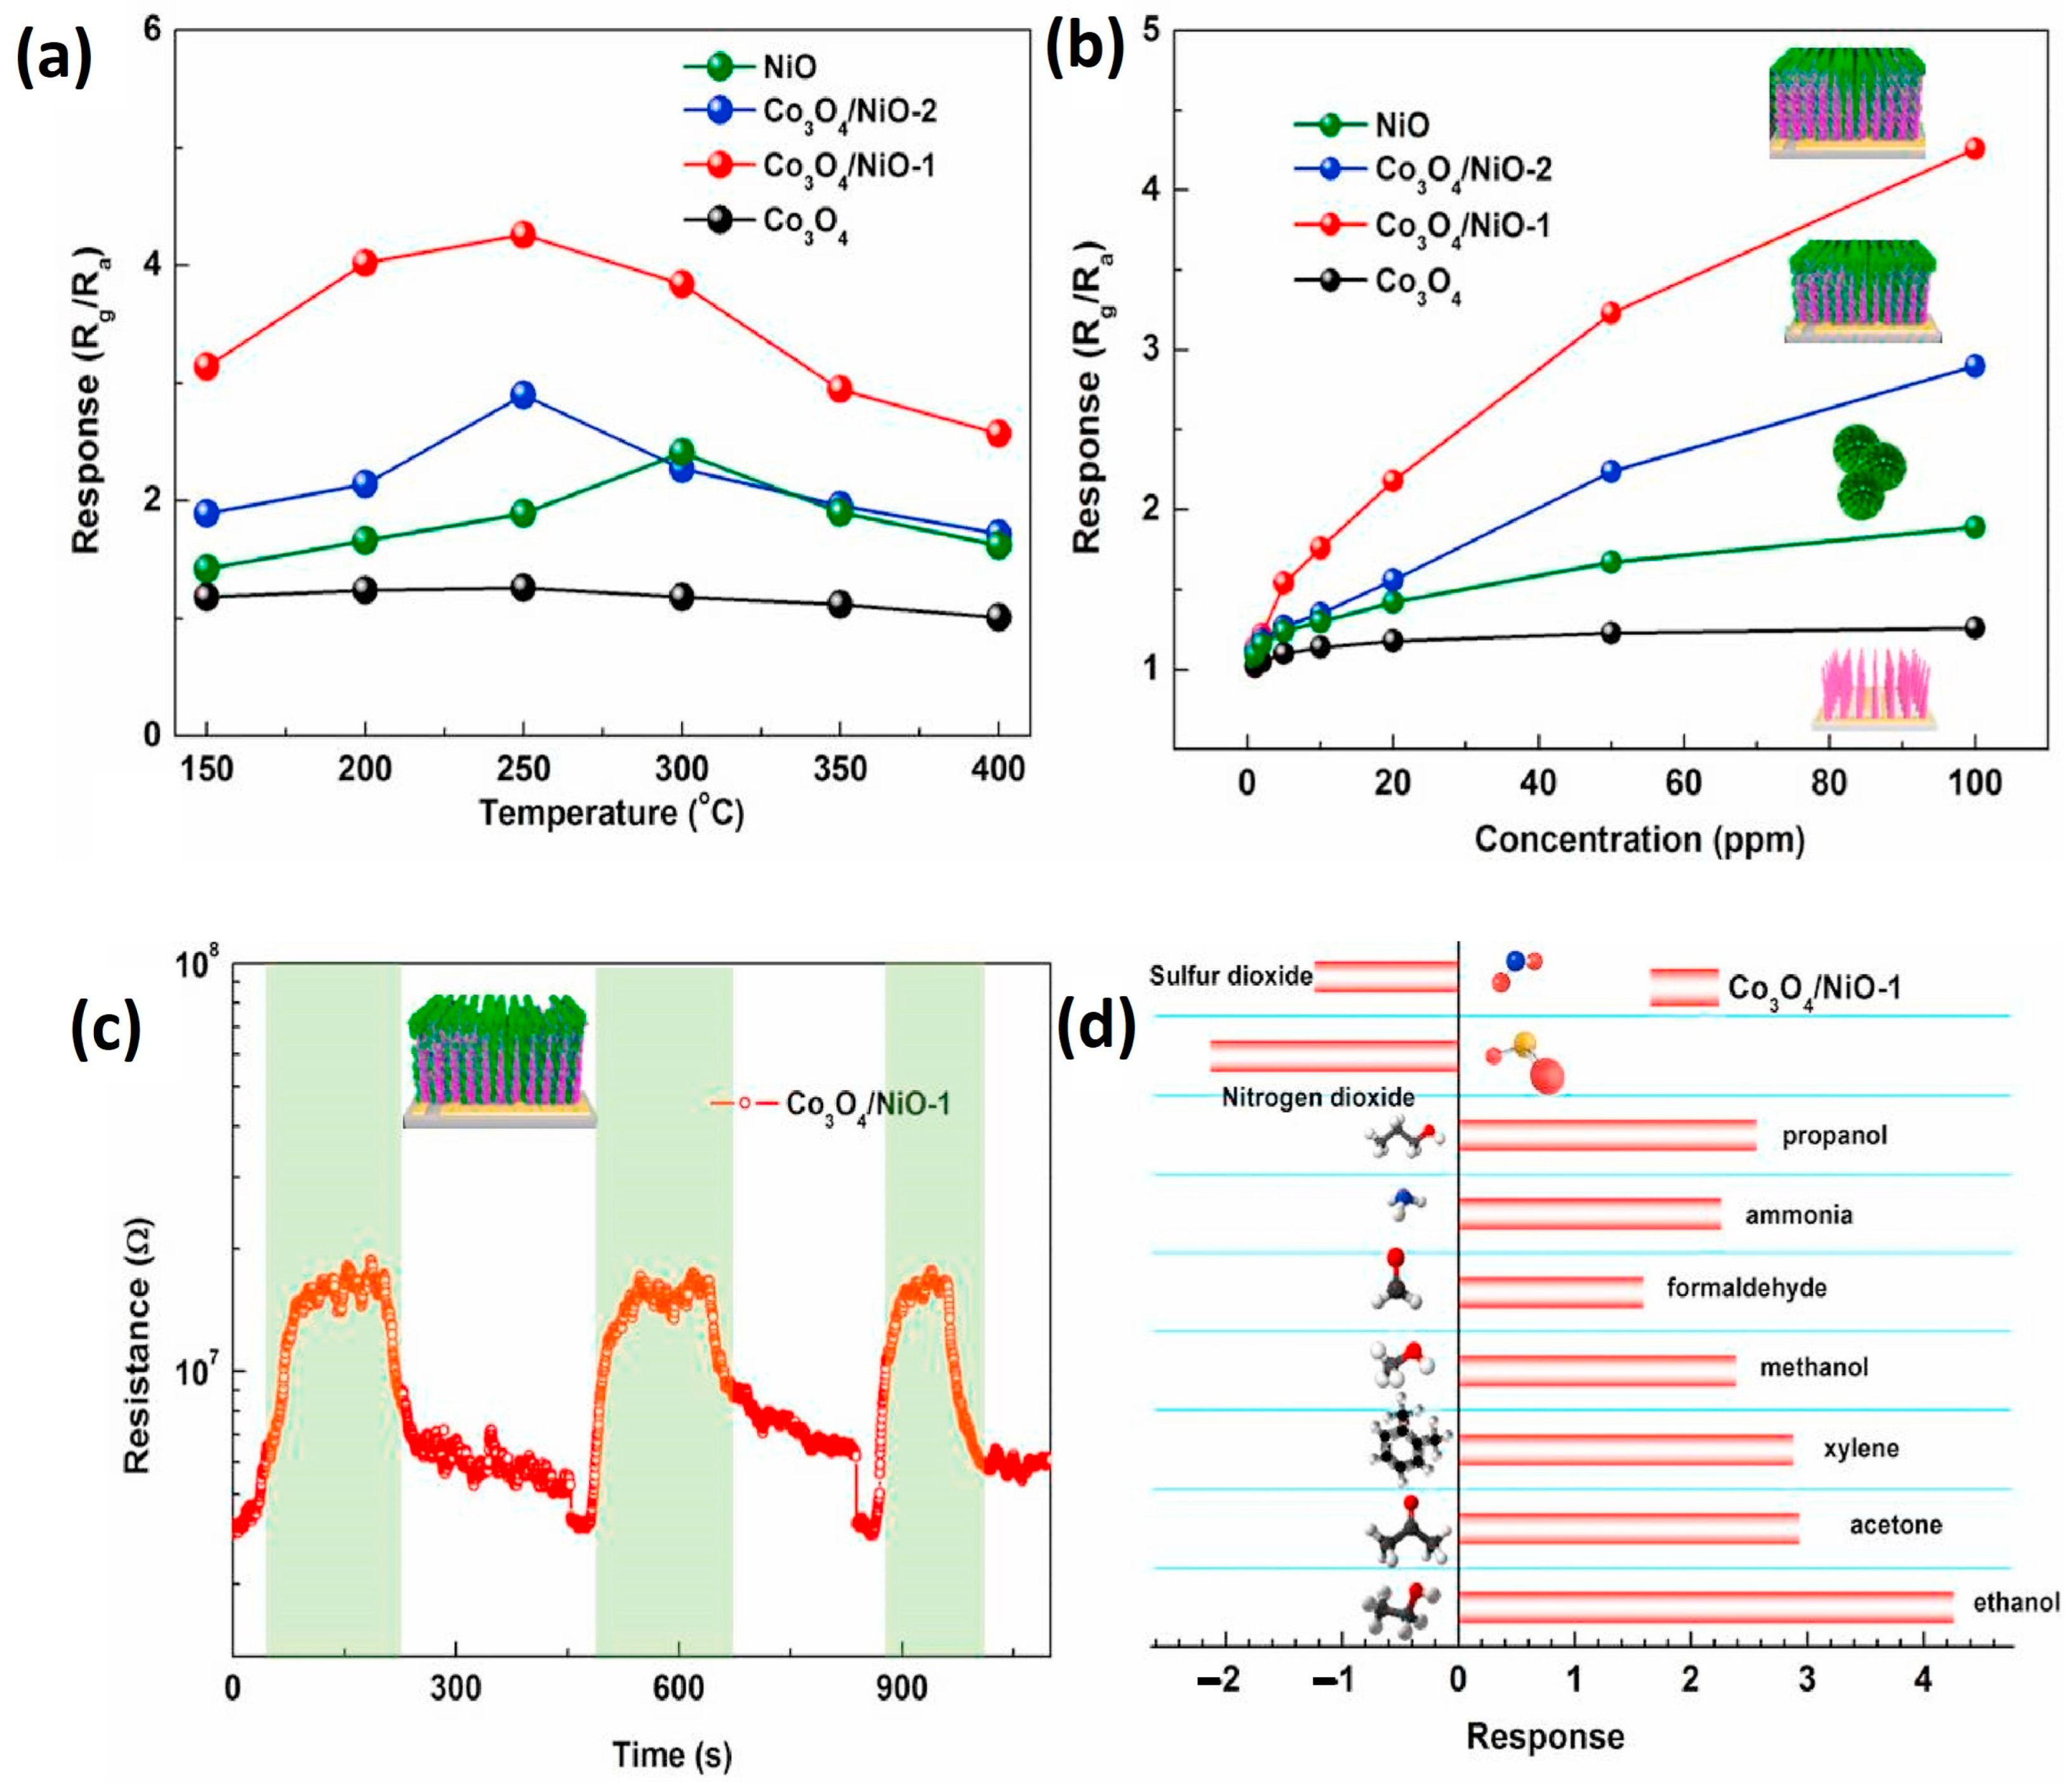
3.2.6. X = Co3O4
3.2.7. X = CuO
3.3. Modified NiO Structure with
3.3.1. Noble Metal Nanoparticles NPs
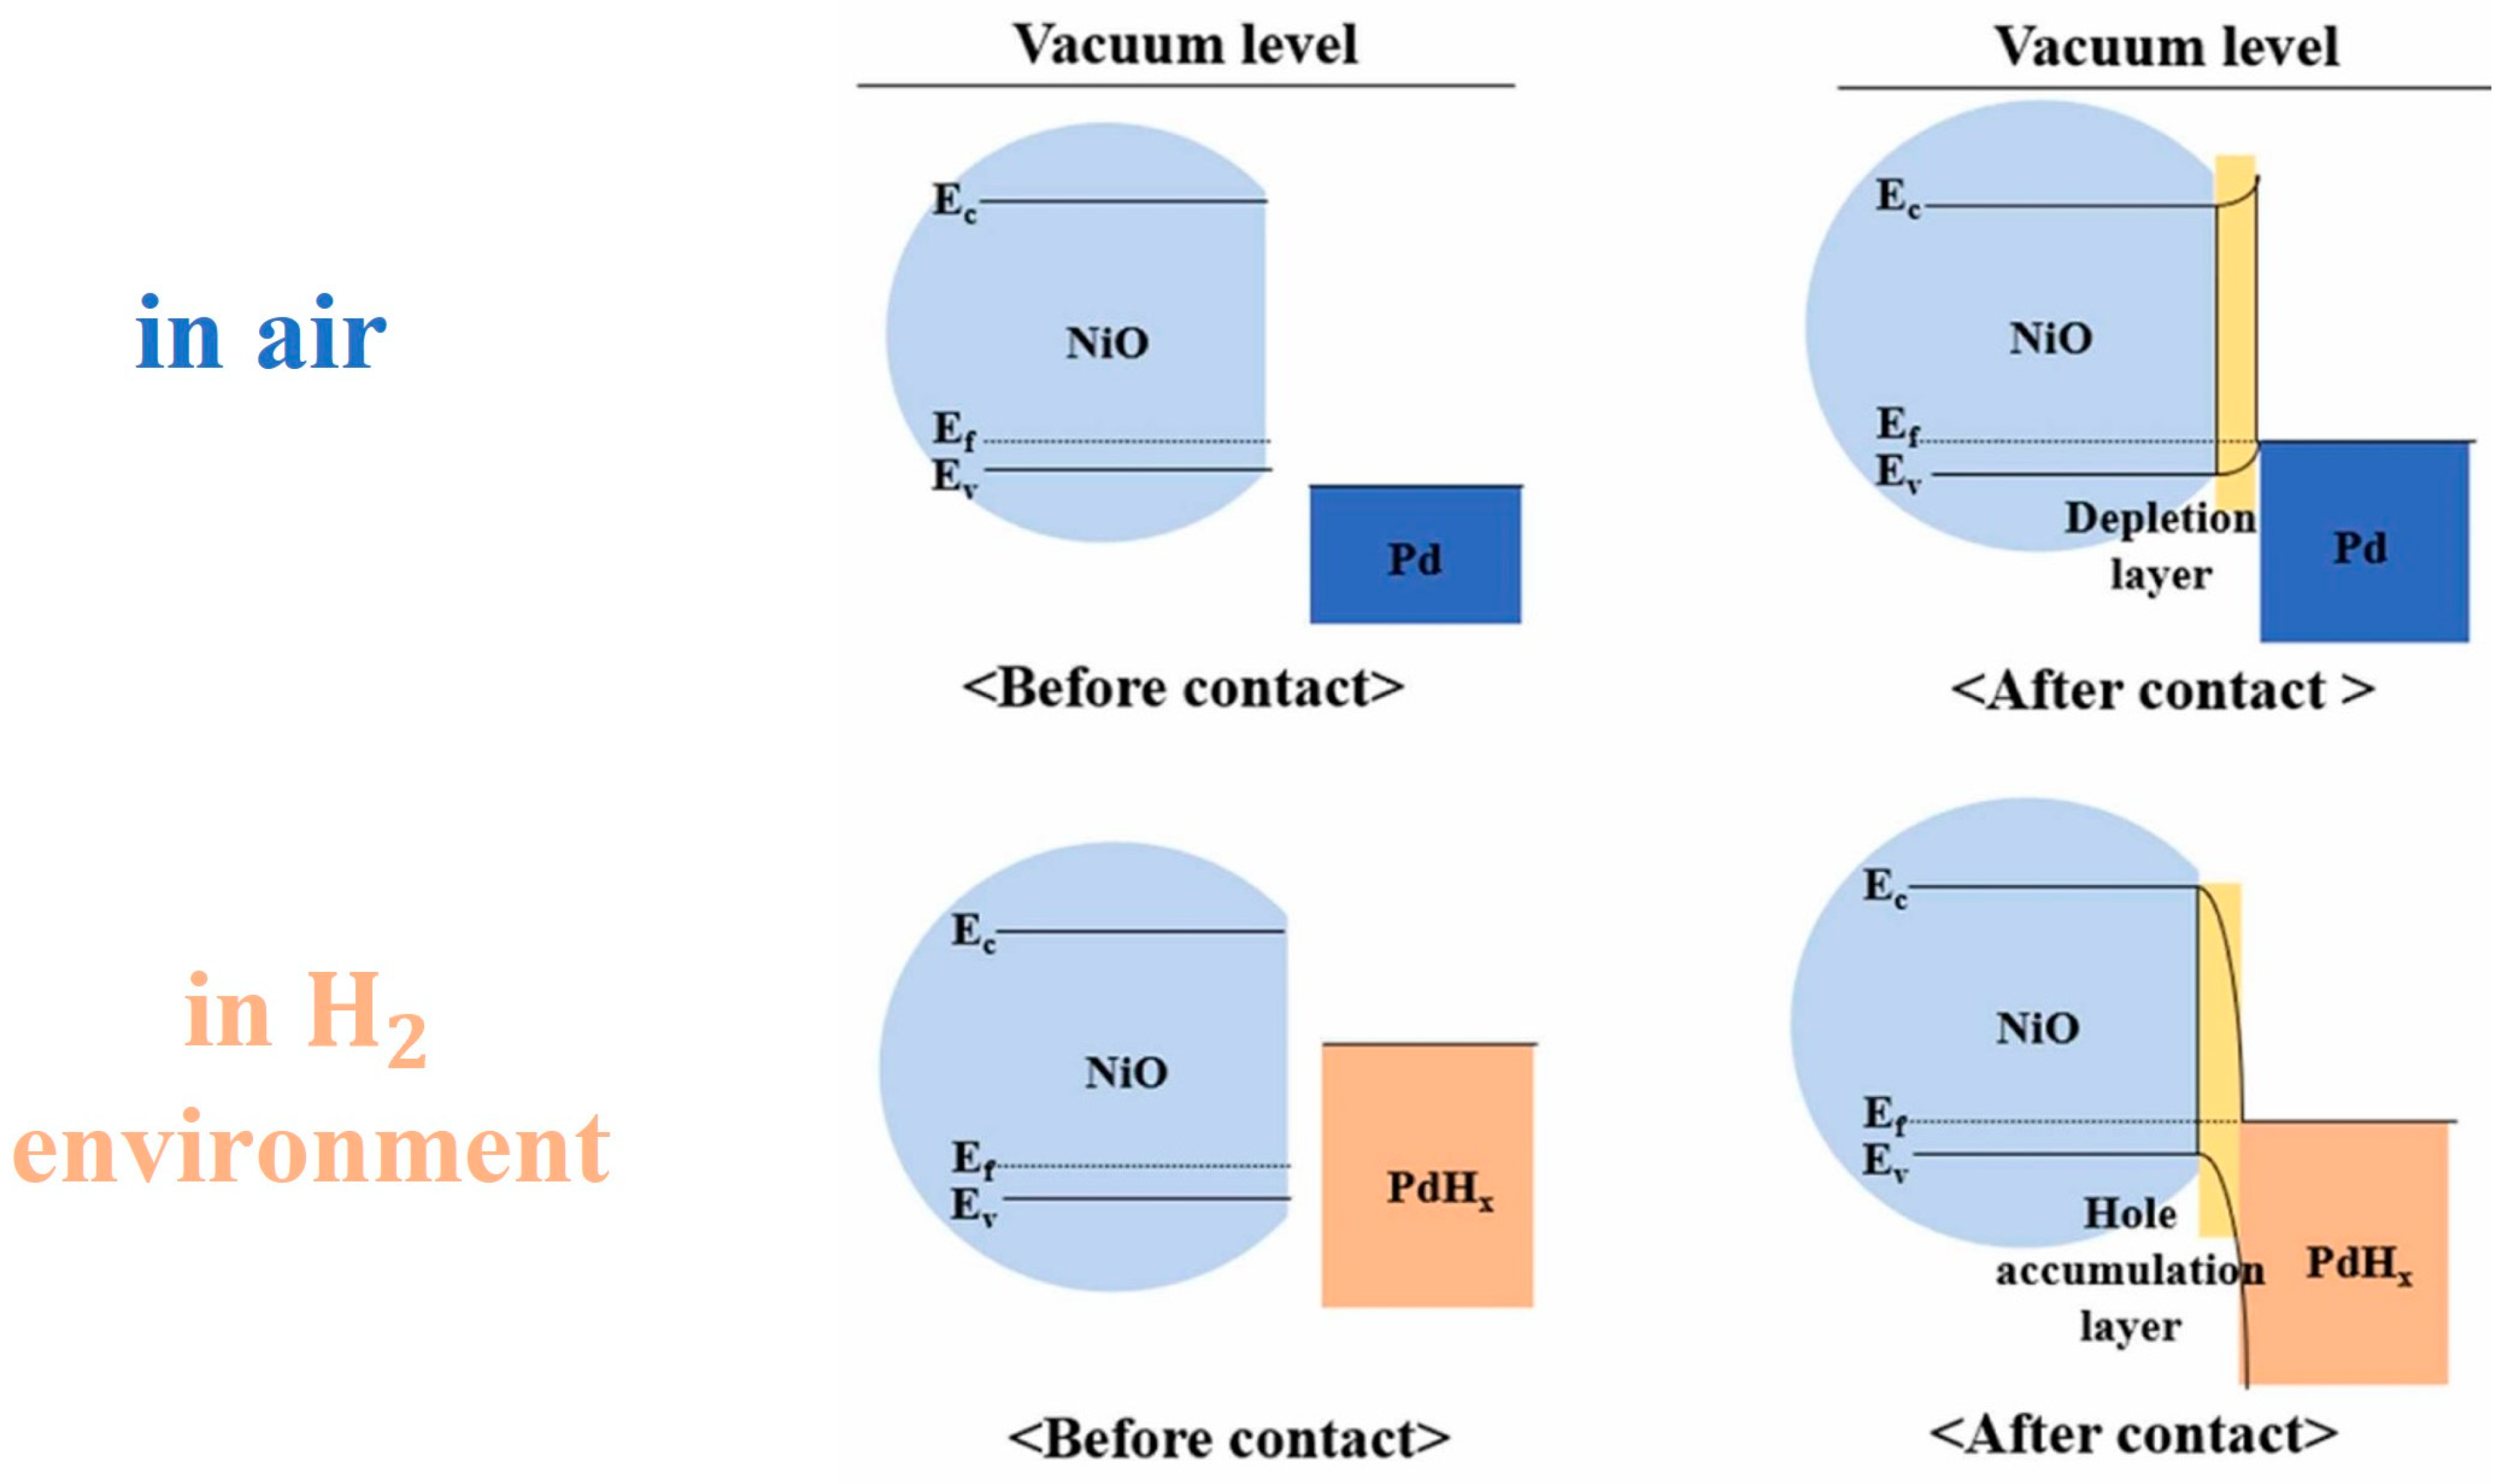
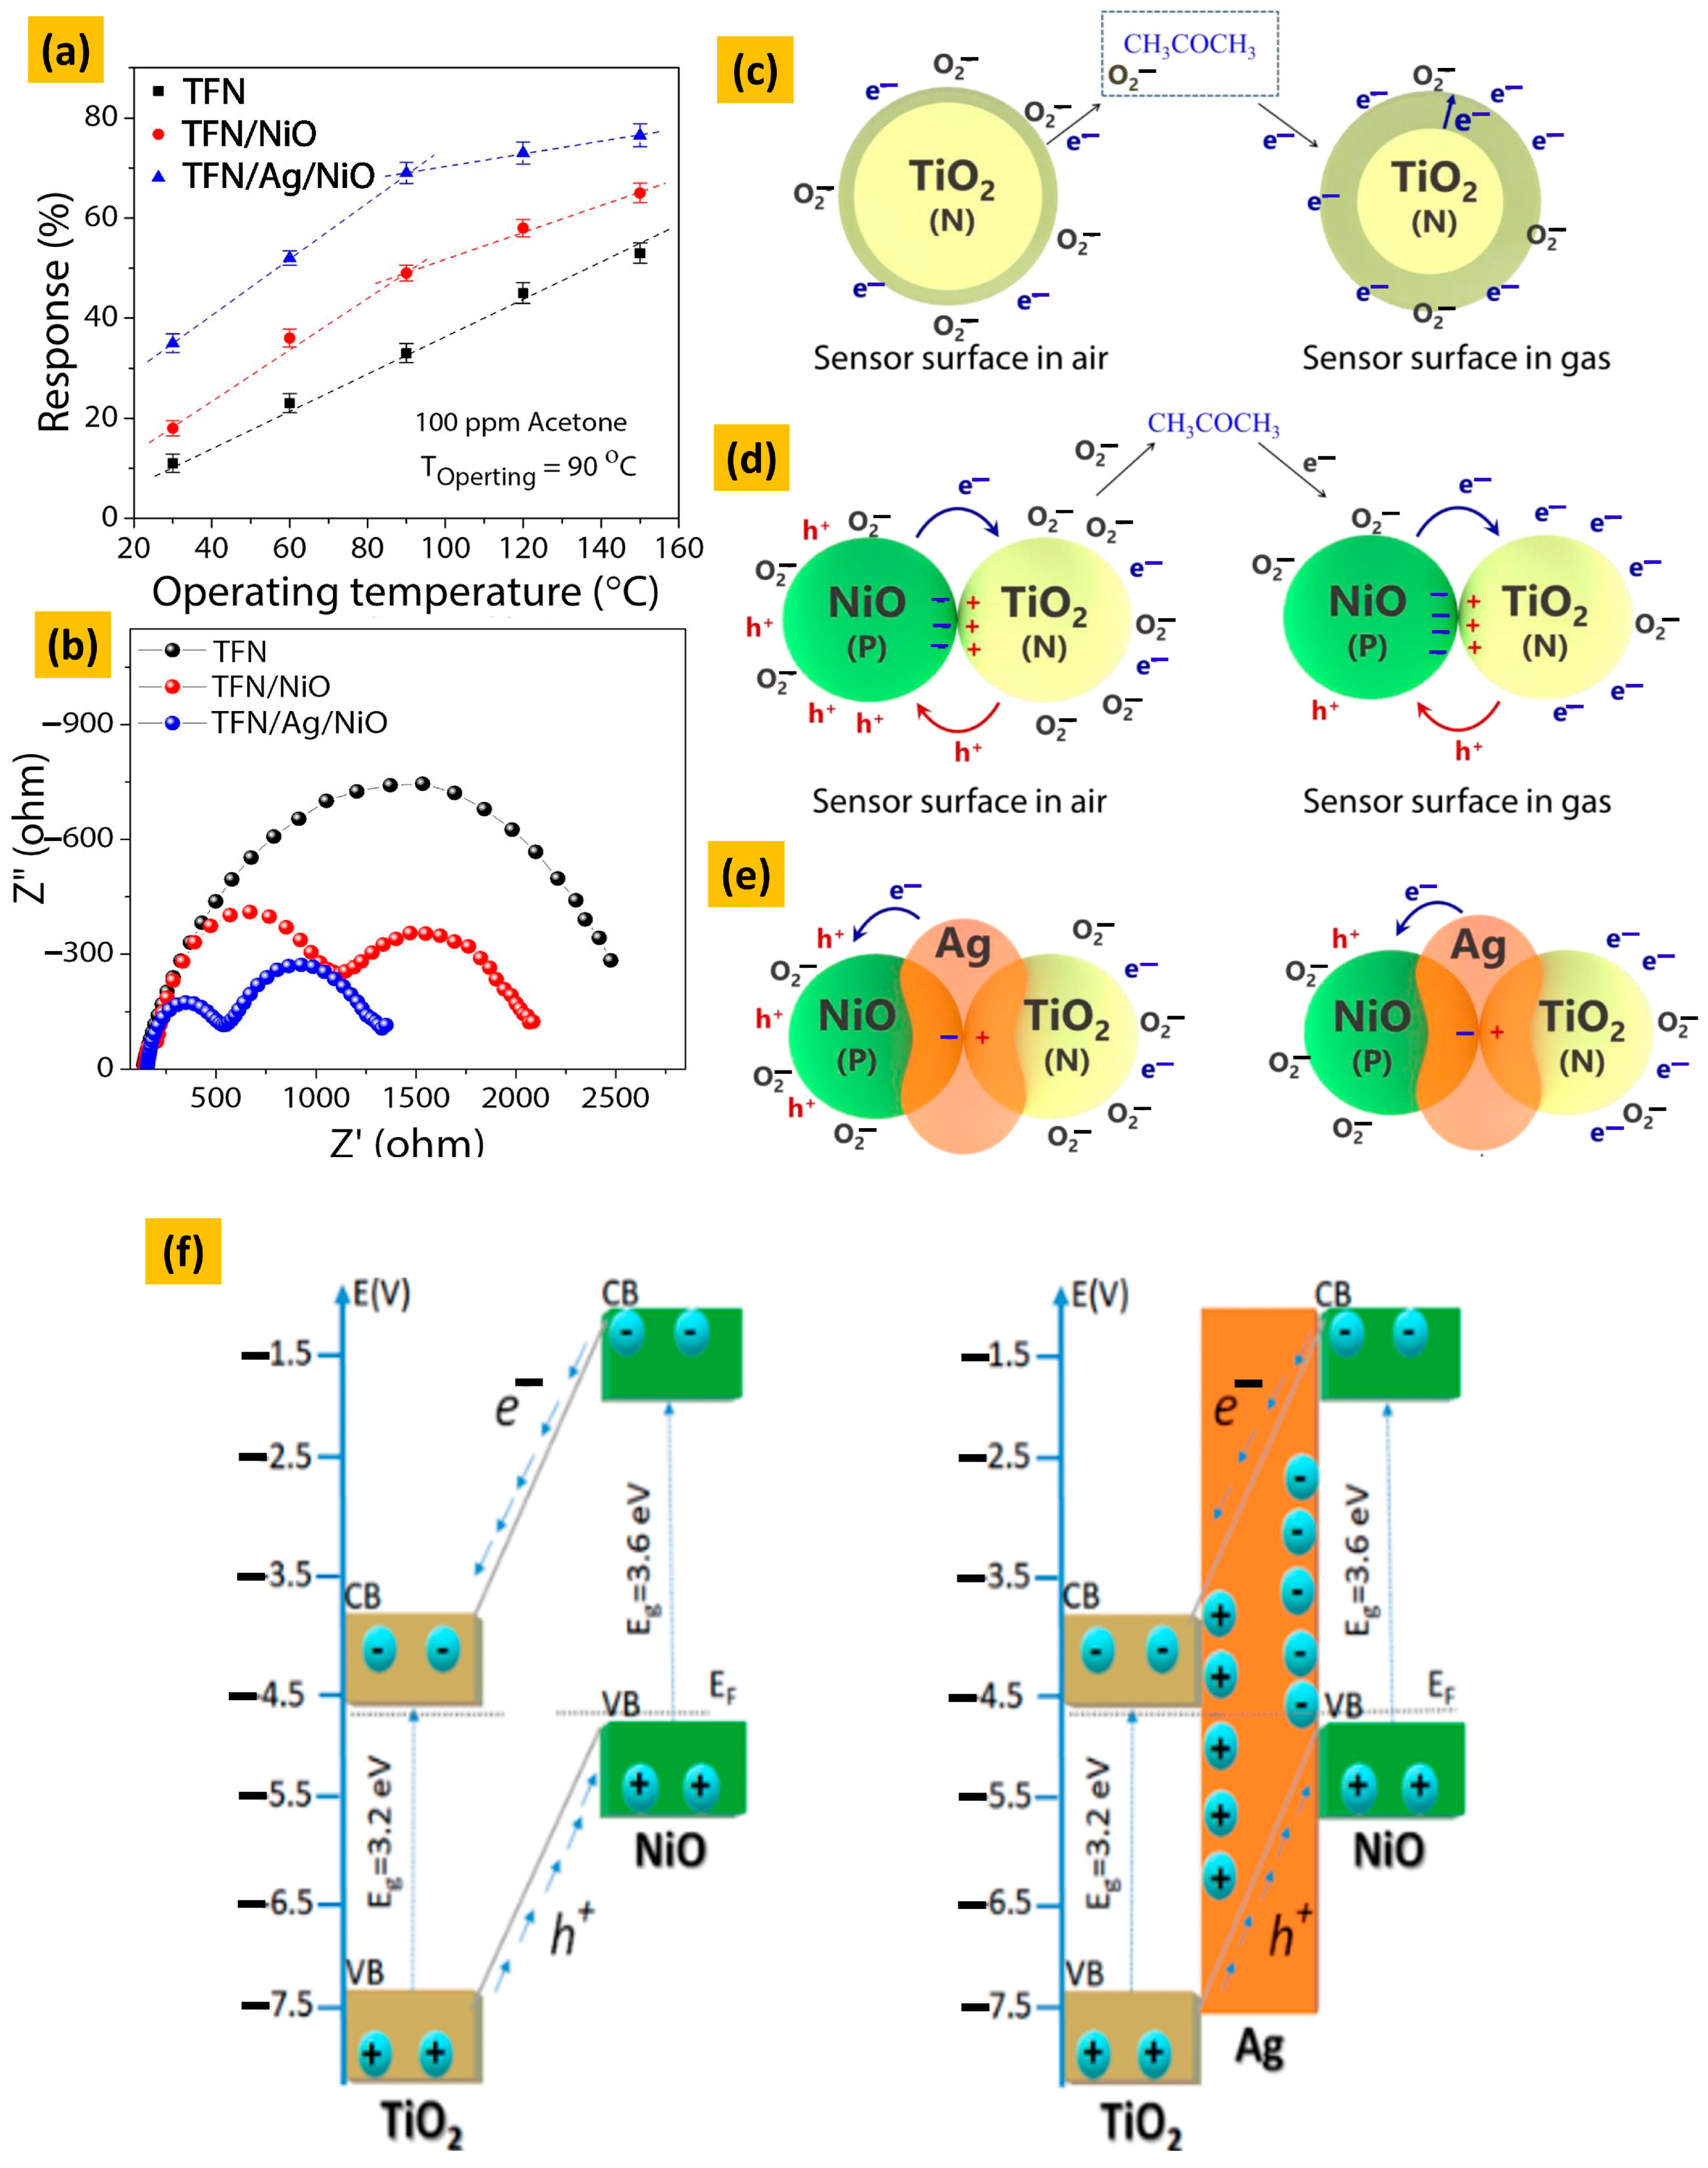
- The electronic sensitization mechanism in NiO decorated with noble metals can be explained using the Schottky barrier theory. According to this theory, when a metal is in contact with NiO, a potential barrier is formed at the interface due to the difference in work function between the metal and the semiconductor. The transfer of electrons from the noble metal to the NiO surface or vice versa depends on the work function of each component, leading to the formation of a depletion layer at the NiO/noble metal interface. The presence of the depletion layer increases the surface reactivity of the NiO, so it enhances its gas-sensing performance.
- Upon exposure to a gas, the noble metals catalyze the oxidation or reduction of gas molecules on the surface of the sensor, leading to a change in its electrical conductivity. The change in conductivity is proportional to the gas concentration, allowing the sensor to detect the presence and concentration of the gas. The chemical sensitization mechanism in nickel oxide decorated with noble metals can be explained based on the Langmuir–Hinshelwood (LH) model. According to this model, the reaction between the gas molecule and the surface of the sensor occurs in two steps: adsorption and reaction. The reactant molecules are first adsorbed onto the sensing surface, where they form reactive intermediates that can subsequently react with other adsorbed species or desorb back into the gas phase.
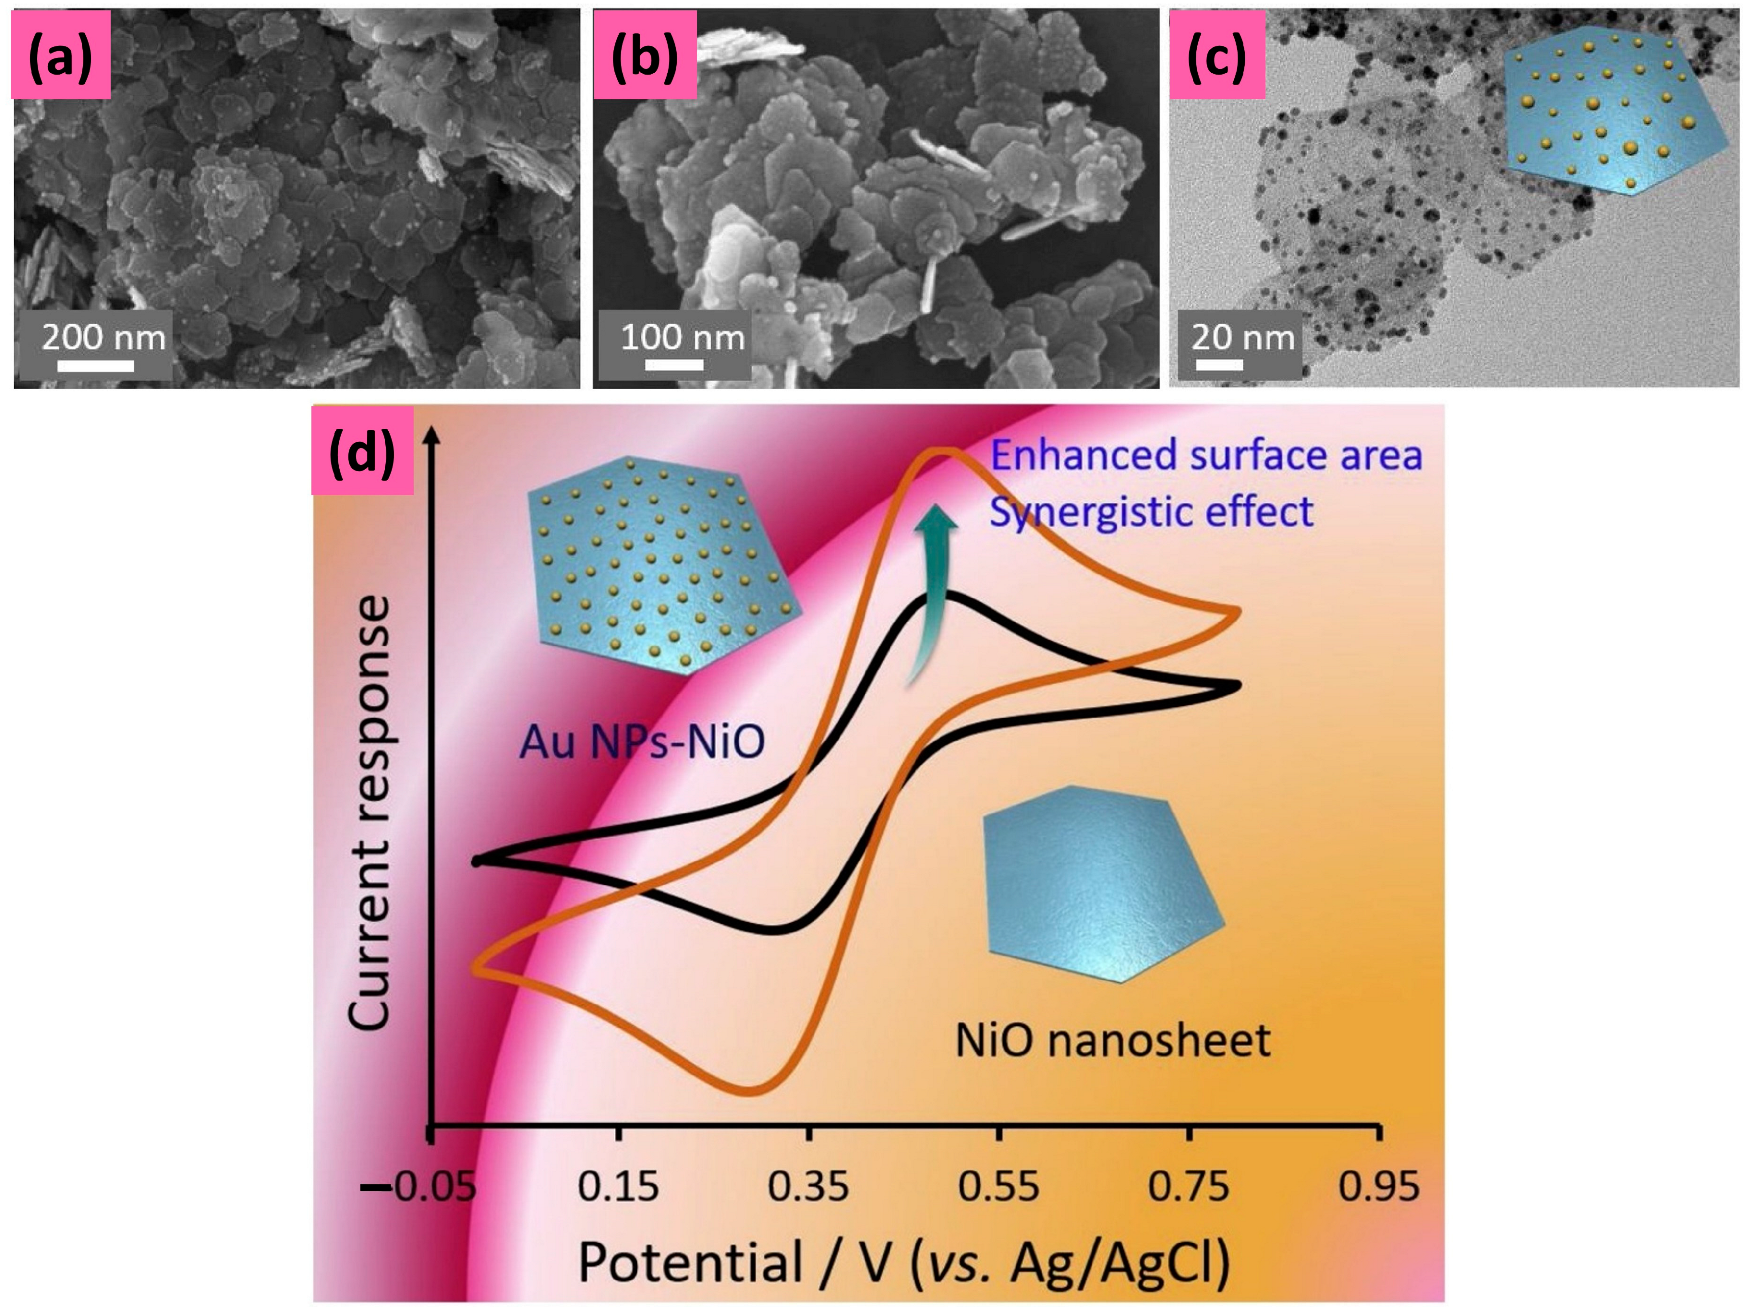
- Increased surface area: The addition of such nanoparticles increases the surface area of the sensor, providing more sites for gas molecules to interact with the NiO surface.
- Improved catalytic activity: Noble metallic nanoparticles act as a catalyst for the reaction between reducing gas molecules and oxygen species on the NiO surface, leading to an increase in the sensitivity of the sensor towards reducing gases.
- Enhanced charge transfer: The addition of such nanoparticles can improve the charge transfer between the NiO and the gas molecules, leading to a more significant change in the electrical conductivity of the sensor upon exposure to reducing gases/oxidizing gases.
- Reduced operating temperature: The presence of these metallic nanoparticles can lower the operating temperature of the sensor, allowing it to be used in applications where high temperatures are not practical.
3.3.2. Carbon-Based Nanomaterials
3.3.3. Conducting Polymers
- The hollow structure on which aniline can be polymerized provides a larger specific surface area, facilitating increased adsorption of target gas molecules;
- The p–p heterojunction resulted from the difference in work functions between the two materials inducing holes’ transfer from PANI to NiO, leading to the formation of a hole depletion layer (HDL) on the PANI side and a hole accumulation layer (HAL) on the NiO side. This configuration results in higher initial resistance and enhances the sensitivity of the gas-sensing behavior of the h–NiO–PANI composite.
4. Conclusions and Outlooks
Author Contributions
Funding
Data Availability Statement
Conflicts of Interest
References
- Wei, H.; Zhang, H.; Song, B.; Yuan, K.; Xiao, H.; Cao, Y.; Cao, Q. Metal–Organic Framework (MOF) Derivatives as Promising Chemiresistive Gas Sensing Materials: A Review. Int. J. Environ. Res. Public Health 2023, 20, 4388. [Google Scholar] [CrossRef] [PubMed]
- Eranna, G.; Joshi, B.C.; Runthala, D.P.; Gupta, R.P. Oxide Materials for Development of Integrated Gas Sensors—A Comprehensive Review. Crit. Rev. Solid State Mater. Sci. 2004, 29, 111–188. [Google Scholar] [CrossRef]
- Dey, A. Semiconductor metal oxide gas sensors: A review. Mater. Sci. Eng. B 2018, 229, 206–217. [Google Scholar] [CrossRef]
- Wang, C.; Yin, L.; Zhang, L.; Xiang, D.; Gao, R. Metal Oxide Gas Sensors: Sensitivity and Influencing Factors. Sensors 2010, 10, 2088–2106. [Google Scholar] [CrossRef] [PubMed]
- Zhong, M.; Hisatomi, T.; Kuang, Y.; Zhao, J.; Liu, M.; Iwasi, A.; Jia, Q.; Nishiyama, H.; Minegishi, T.; Nakabayashi, M.; et al. Surface Modification of CoOx Loaded BiVO4 Photoanodes with Ultrathin p-Type NiO Layers for Improved Solar Water Oxidation. J. Am. Chem. Soc. 2015, 137, 5053–5060. [Google Scholar] [CrossRef] [PubMed]
- Neiva, E.G.; Oliveira, M.M.; Marcolino, L.H.; Zarbin, A.J. Nickel nanoparticles with hcp structure: Preparation, deposition as thin films and application as electrochemical sensor. J. Colloid Interface Sci. 2016, 468, 34–41. [Google Scholar] [CrossRef] [PubMed]
- Miura, N.; Wang, J.; Nakatou, M.; Elumalai, P.; Zhuiykov, S.; Hasei, M. High-temperature operating characteristics of mixed-potential-type NO2 sensor based on stabilized-zirconia tube and NiO sensing electrode. Sens. Actuators B Chem. 2006, 114, 903–909. [Google Scholar] [CrossRef]
- Diao, C.-C.; Huang, C.-Y.; Yang, C.-F.; Wu, C.-C. Morphological, Optical, and Electrical Properties of p-Type Nickel Oxide Thin Films by Nonvacuum Deposition. Nanomaterials 2020, 10, 636. [Google Scholar] [CrossRef]
- Aslinjensipriya, A.; Sylvia Reena, R.; Ragu, P.; Grace Infantiya, S.; Mangalam, G.; Justin Raj, C.; Jerome Das, S. Exploring the influence of tin in micro-structural, magneto-optical and antimicrobial traits of nickel oxide nanoparticles. Surf. Interfaces 2021, 28, 101605. [Google Scholar] [CrossRef]
- Chen, W.; Wu, Y.; Yue, Y.; Liu, J.; Zhang, W.; Yang, X.; Chen, H.; Bi, E.; Ashraful, I.; Grätzel, M.; et al. Efficient and stable large-area perovskite solar cells with inorganic charge extraction layers. Science 2015, 350, 944–948. [Google Scholar] [CrossRef]
- Jang, W.-L.; Lu, Y.-M.; Hwang, W.-S.; Hsiung, T.-L.; Wang, H.P. Point defects in sputtered NiO films. Appl. Phys. Lett. 2009, 94, 062103. [Google Scholar] [CrossRef]
- Kumar, N.; Lee, H.B.; Hwang, S.; Kang, J.-W. Large-area, green solvent spray deposited nickel oxide films for scalable fabrication of triple-cation perovskite solar cells. J. Mater. Chem. A 2020, 8, 3357–3368. [Google Scholar] [CrossRef]
- Wilson, R.L.; Simion, C.E.; Stanoiu, A.; Taylor, A.; Guldin, S.; Covington, J.A.; Carmalt, C.J.; Blackman, C.S. Humidity-Tolerant Ultrathin NiO Gas-Sensing Films. ACS Sens. 2020, 5, 1389–1397. [Google Scholar] [CrossRef] [PubMed]
- Simion, C.; Junker, B.; Weimar, U.; Stanoiu, A.; Bârsan, N. Sensing mechanisms of CO and H2 with NiO material–DRIFTS investigations. Sens. Actuators B Chem. 2023, 390, 134028. [Google Scholar] [CrossRef]
- Simion, C.E.; Ghica, C.; Mihalcea, C.G.; Ghica, D.; Mercioniu, I.; Somacescu, S.; Florea, O.G.; Stanoiu, A. Insights about CO Gas-Sensing Mechanism with NiO-Based Gas Sensors—The Influence of Humidity. Chemosensors 2021, 9, 244. Available online: https://www.mdpi.com/2227-9040/9/9/244 (accessed on 3 February 2024). [CrossRef]
- Liu, Y.S.; Gao, C.; Li, Q.; Pang, H. Nickel Oxide/Graphene Composites: Synthesis and Applications. Chemistry 2019, 25, 2141–2160. [Google Scholar] [CrossRef] [PubMed]
- Mokoena, T.P.; Swart, H.C.; Motaung, D.E. A review on recent progress of p-type nickel oxide based gas sensors: Future perspectives. J. Alloys Compd. 2019, 805, 267–294. [Google Scholar] [CrossRef]
- Li, Q.; Zeng, W.; Li, Y. NiO-Based Gas Sensors for Ethanol Detection: Recent Progress. J. Sens. 2022, 2022, 1855493. [Google Scholar] [CrossRef]
- Prajesh, R.; Goyal, V.; Nahid, M.; Saini, V.; Singh, A.K.; Sharma, A.K.; Bhargava, J.; Agarwal, A. Nickel oxide (NiO) thin film optimization by reactive sputtering for highly sensitive formaldehyde sensing. Sens. Actuators B Chem. 2020, 318, 128166. [Google Scholar] [CrossRef]
- Hotovy, I.; Spiess, L.; Predanocy, M.; Rehacek, V.; Racko, J. Sputtered nanocrystalline NiO thin films for very low ethanol detection. Vacuum 2014, 107, 129–131. [Google Scholar] [CrossRef]
- Urs, K.M.B.; Sahoo, K.; Bhat, N.; Kamble, V. Complementary Metal Oxide Semiconductor-Compatible Top-Down Fabrication of a Ni/NiO Nanobeam Room Temperature Hydrogen Sensor Device. ACS Appl. Electron. Mater. 2022, 4, 87–91. [Google Scholar] [CrossRef]
- Wang, R.; Lin, H.; Zhu, H.; Wan, M.; Shen, K.; Mai, Y. Preparation, investigation and application of nickel oxide thin films in flexible all-thin-film electrochromic devices: From material to device. J. Alloys Compd. 2021, 898, 162879. [Google Scholar] [CrossRef]
- Terlemezoglu, M.; Surucu, O.; Isik, M.; Gasanly, N.M.; Parlak, M. Temperature-dependent optical characteristics of sputtered NiO thin films. Appl. Phys. A 2021, 128, 50. [Google Scholar] [CrossRef]
- Pooyodying, P.; Son, Y.-H.; Sung, Y.-M.; Ok, J.-W. The effect of sputtering Ar gas pressure on optical and electrical properties of flexible ECD device with WO3 electrode deposited by RF magnetron sputtering on ITO/PET substrate. Opt. Mater. 2021, 123, 111829. [Google Scholar] [CrossRef]
- Elmassi, S.; Narjis, A.; Nkhaili, L.; Elkissani, A.; Amiri, L.; Drissi, S.; Abali, A.; Bousseta, M.; Outzouhit, A. Effect of annealing on structural, optical and electrical properties of nickel oxide thin films synthesized by the reactive radio frequency sputtering. Phys. B Condens. Matter. 2022, 639, 413980. [Google Scholar] [CrossRef]
- Peng, Z.; Zuo, Z.; Qi, Q.; Hou, S.; Fu, Y.; Zou, D. Managing the Double-Edged Sword of Ni3+ in Sputter-Deposited NiO x by Interfacial Redox Reactions for Efficient Perovskite Solar Cells. ACS Appl. Energy Mater. 2023, 6, 1396–1403. [Google Scholar] [CrossRef]
- Li, H.; Li, Y.; Li, X.; Xie, A.; Sun, D.; Wang, Y. Effects of Sputtering Pressure on Electrochromic Properties of NiO films Prepared by DC Magnetron Sputtering. J. Electrochem. Soc. 2022, 169, 116508. [Google Scholar] [CrossRef]
- Astinchap, B.; Awrang, S.M.; Norian, E. Surface characterization of NiO thin films deposited by RF-magnetron sputtering at different thickness: Statistical and multifractal approach. Microsc. Res. Tech. 2022, 85, 3056–3068. [Google Scholar] [CrossRef]
- Poulain, R.; Rohrer, J.; Hermans, Y.; Dietz, C.; Brötz, J.; Proost, J.; Chatenet, M.; Klein, A. Origin of Surface Reduction upon Water Adsorption on Oriented NiO Thin Films and Its Relation to Electrochemical Activity. J. Phys. Chem. C 2022, 126, 1303–1315. [Google Scholar] [CrossRef]
- Gao, X.; Meng, X. Effect of reactive pressure on direct current-sputtered NiO films with improved p-type conduction ability. Phys. B Condens. Matter. 2023, 650, 414540. [Google Scholar] [CrossRef]
- Mohr, J.; Hennen, T.; Bedau, D.; Nag, J.; Waser, R.; Wouters, D.J. Fabrication of highly resistive NiO thin films for nanoelectronic applications. Adv. Phys. Res. 2022, 1, 2200008. [Google Scholar] [CrossRef]
- Hameed, A.M.; Hameed, M.A. Spectroscopic characteristics of highly pure metal oxide nanostructures prepared by DC reactive magnetron sputtering technique. Emergent Mater. 2022, 6, 627–633. [Google Scholar] [CrossRef]
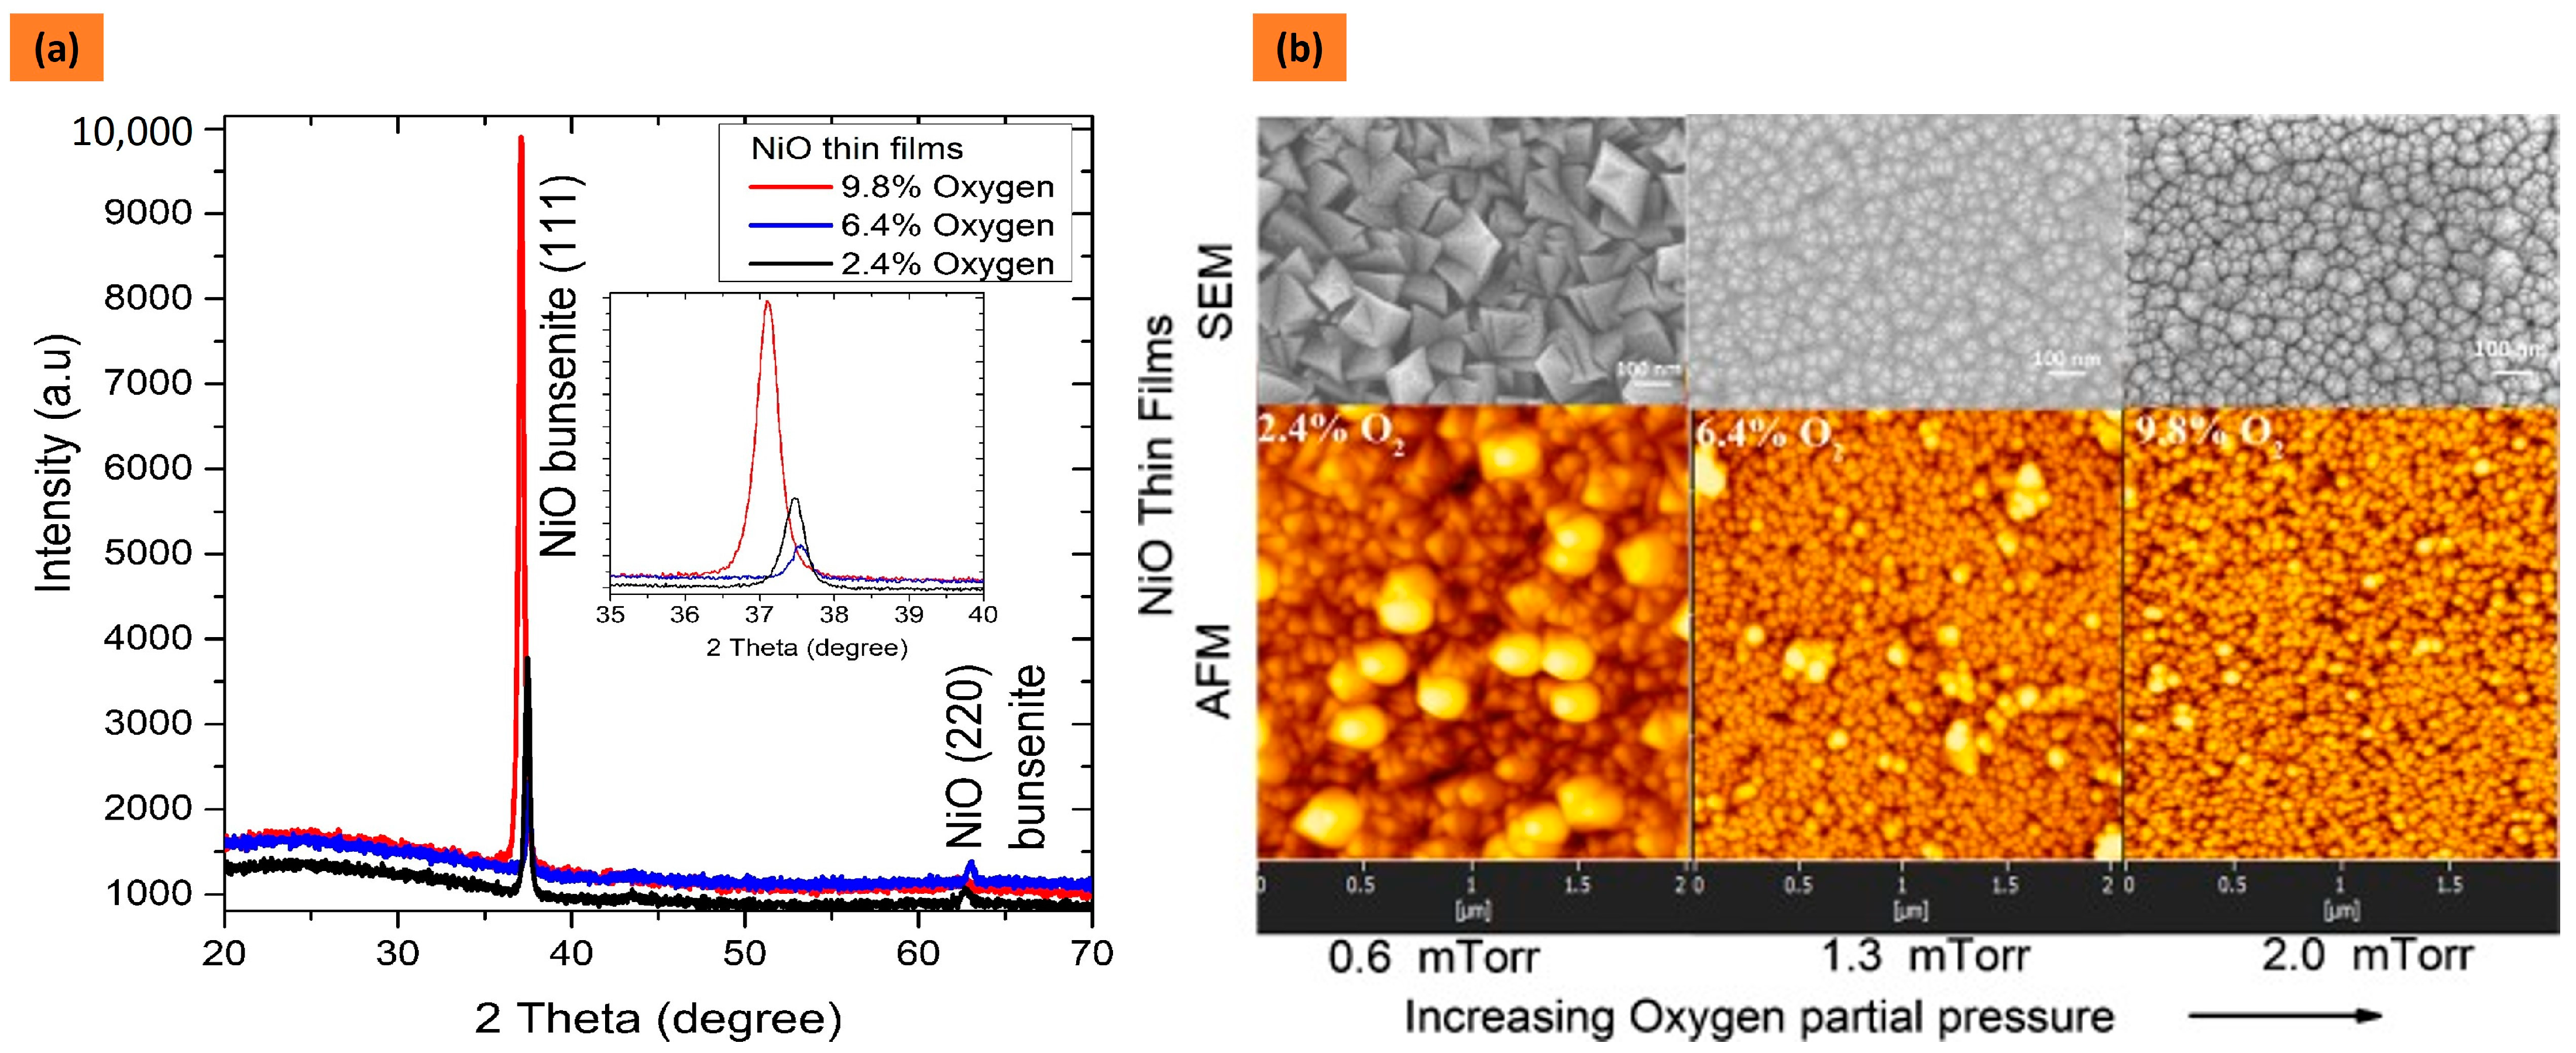
- Turgut, E.; Çoban, Ö.; Sarıtaş, S.; Tüzemen, S.; Yıldırım, M.; Gür, E. Oxygen partial pressure effects on the RF sputtered p-type NiO hydrogen gas sensors. Appl. Surf. Sci. 2018, 435, 880–885. [Google Scholar] [CrossRef]
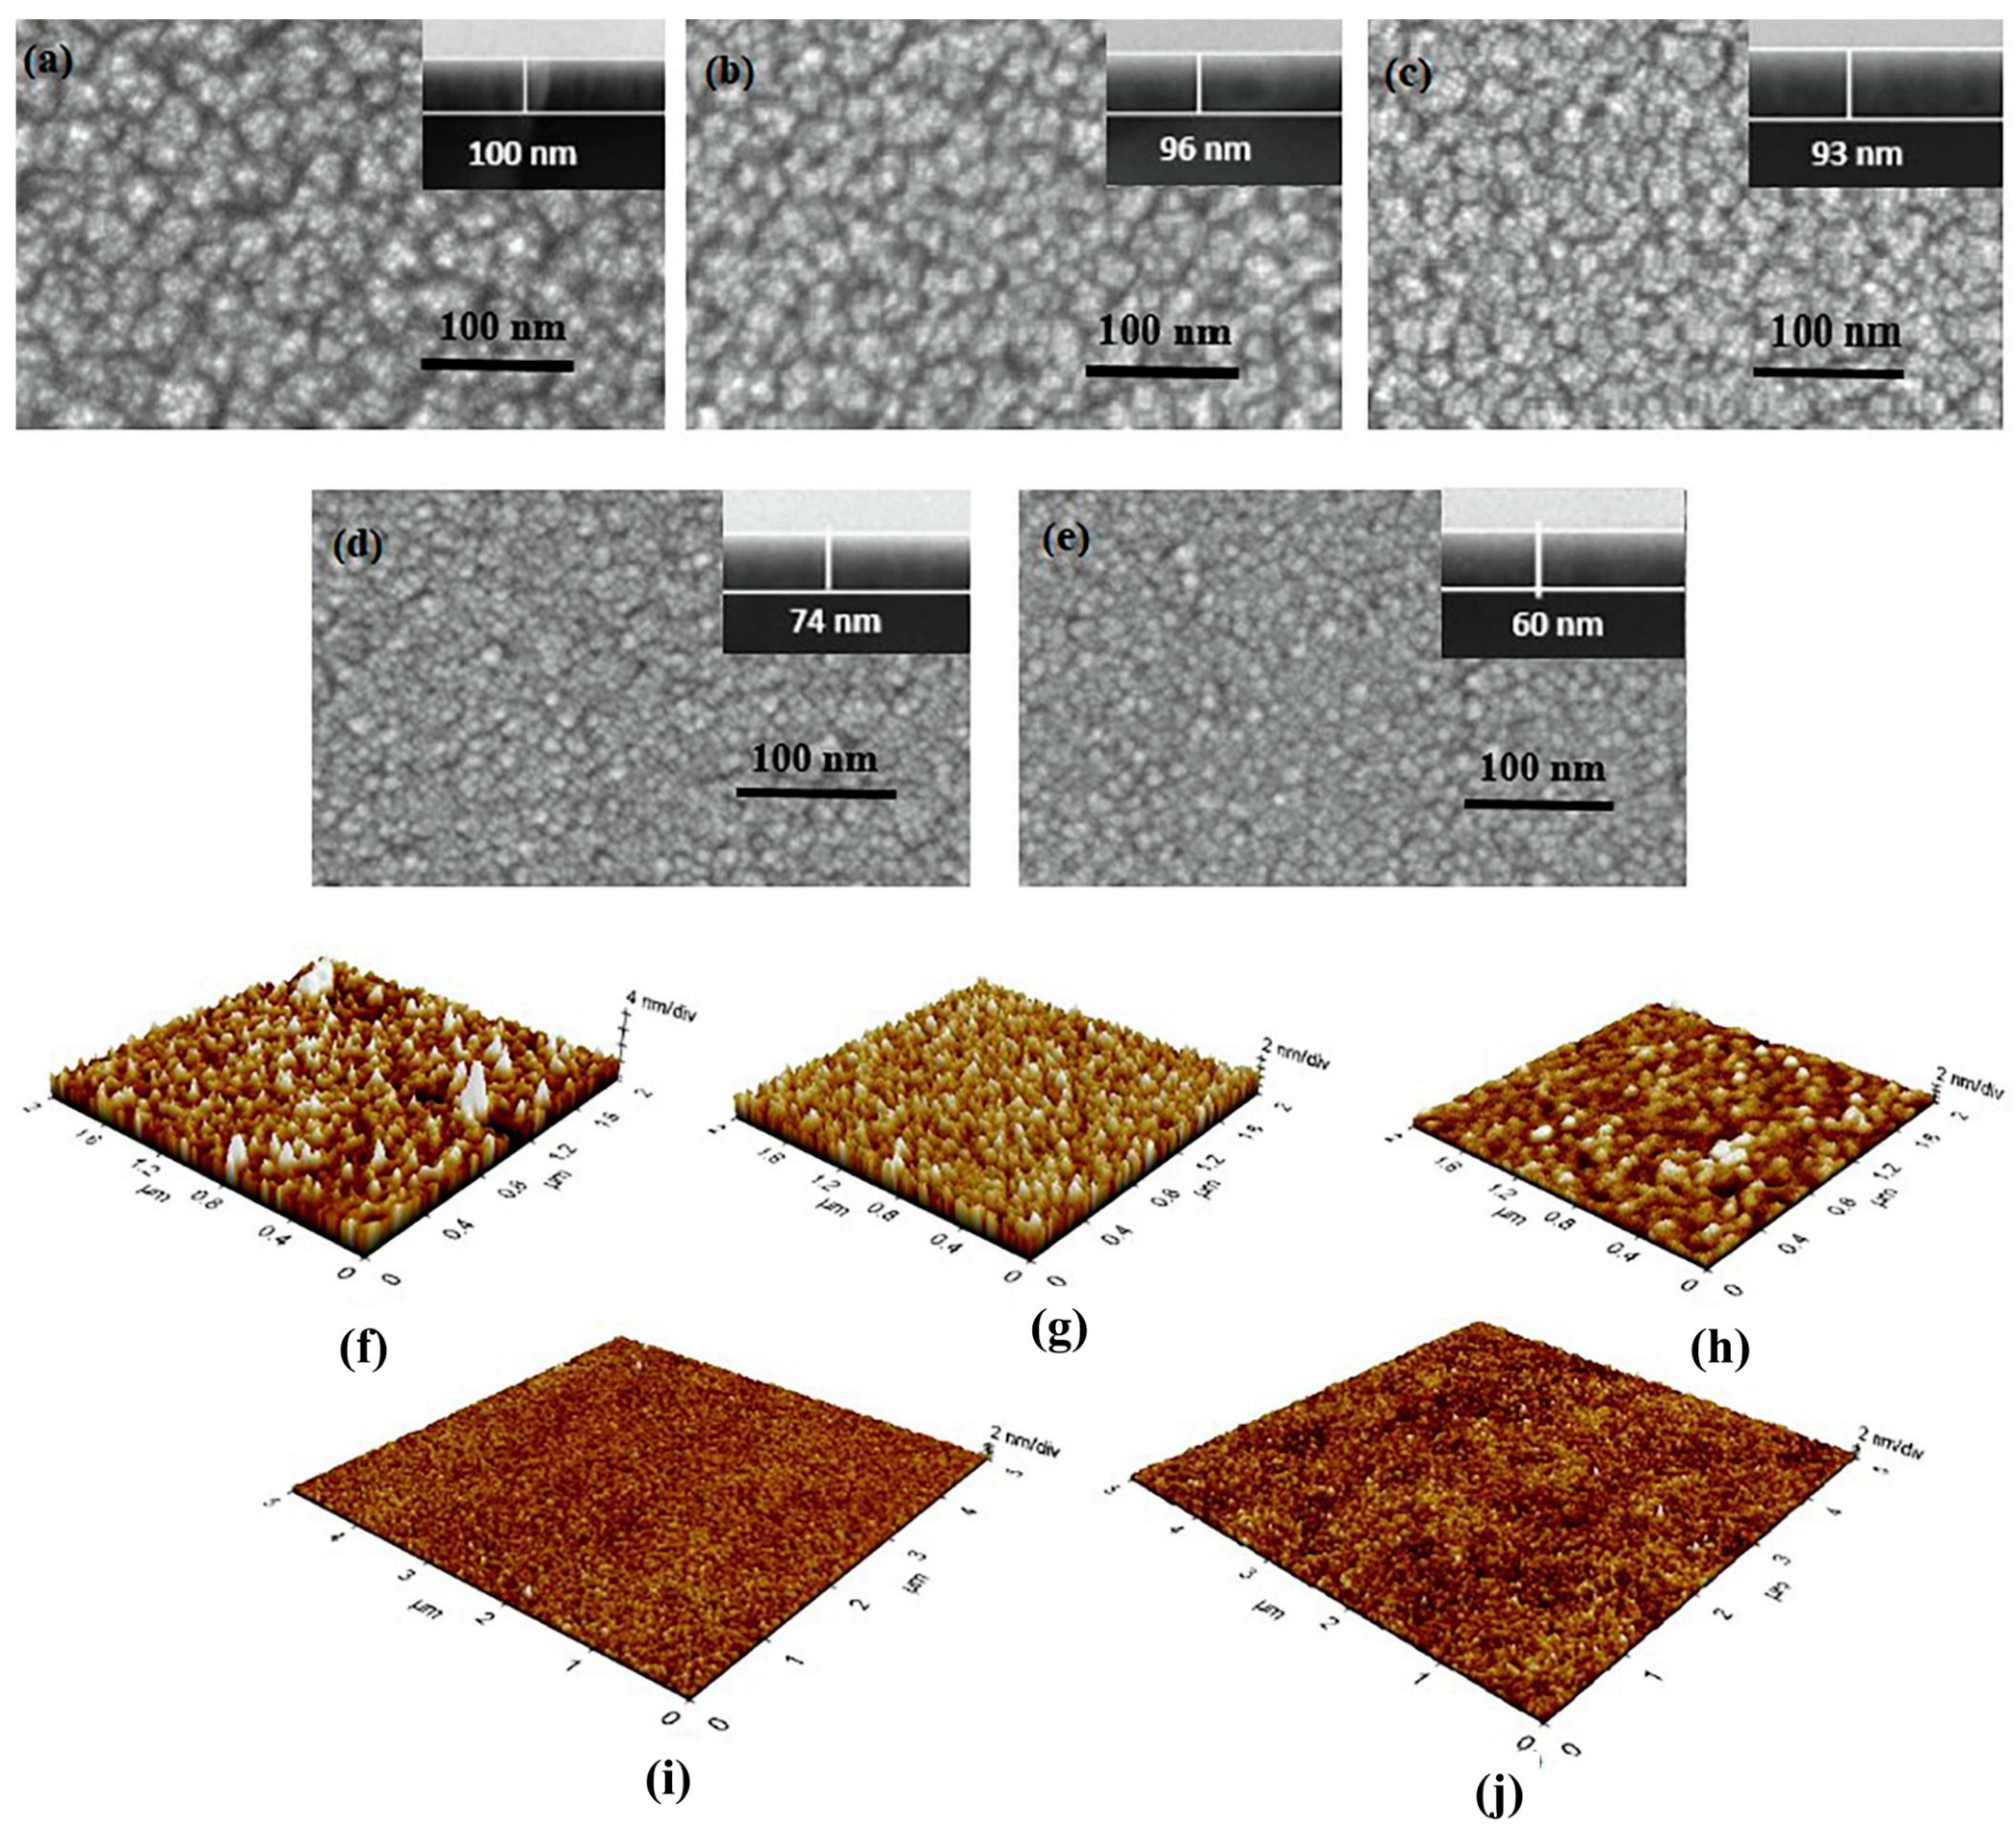
- Jamal, M.S.; Shahahmadi, S.A.; Chelvanathan, P.; Alharbi, H.F.; Karim, M.R.; Dar, M.A.; Luqman, M.; Alharthi, N.H.; Al-Harthi, Y.S.; Aminuzzaman, M.; et al. Effects of growth temperature on the photovoltaic properties of RF sputtered undoped NiO thin films. Results Phys. 2019, 14, 102360. [Google Scholar] [CrossRef]
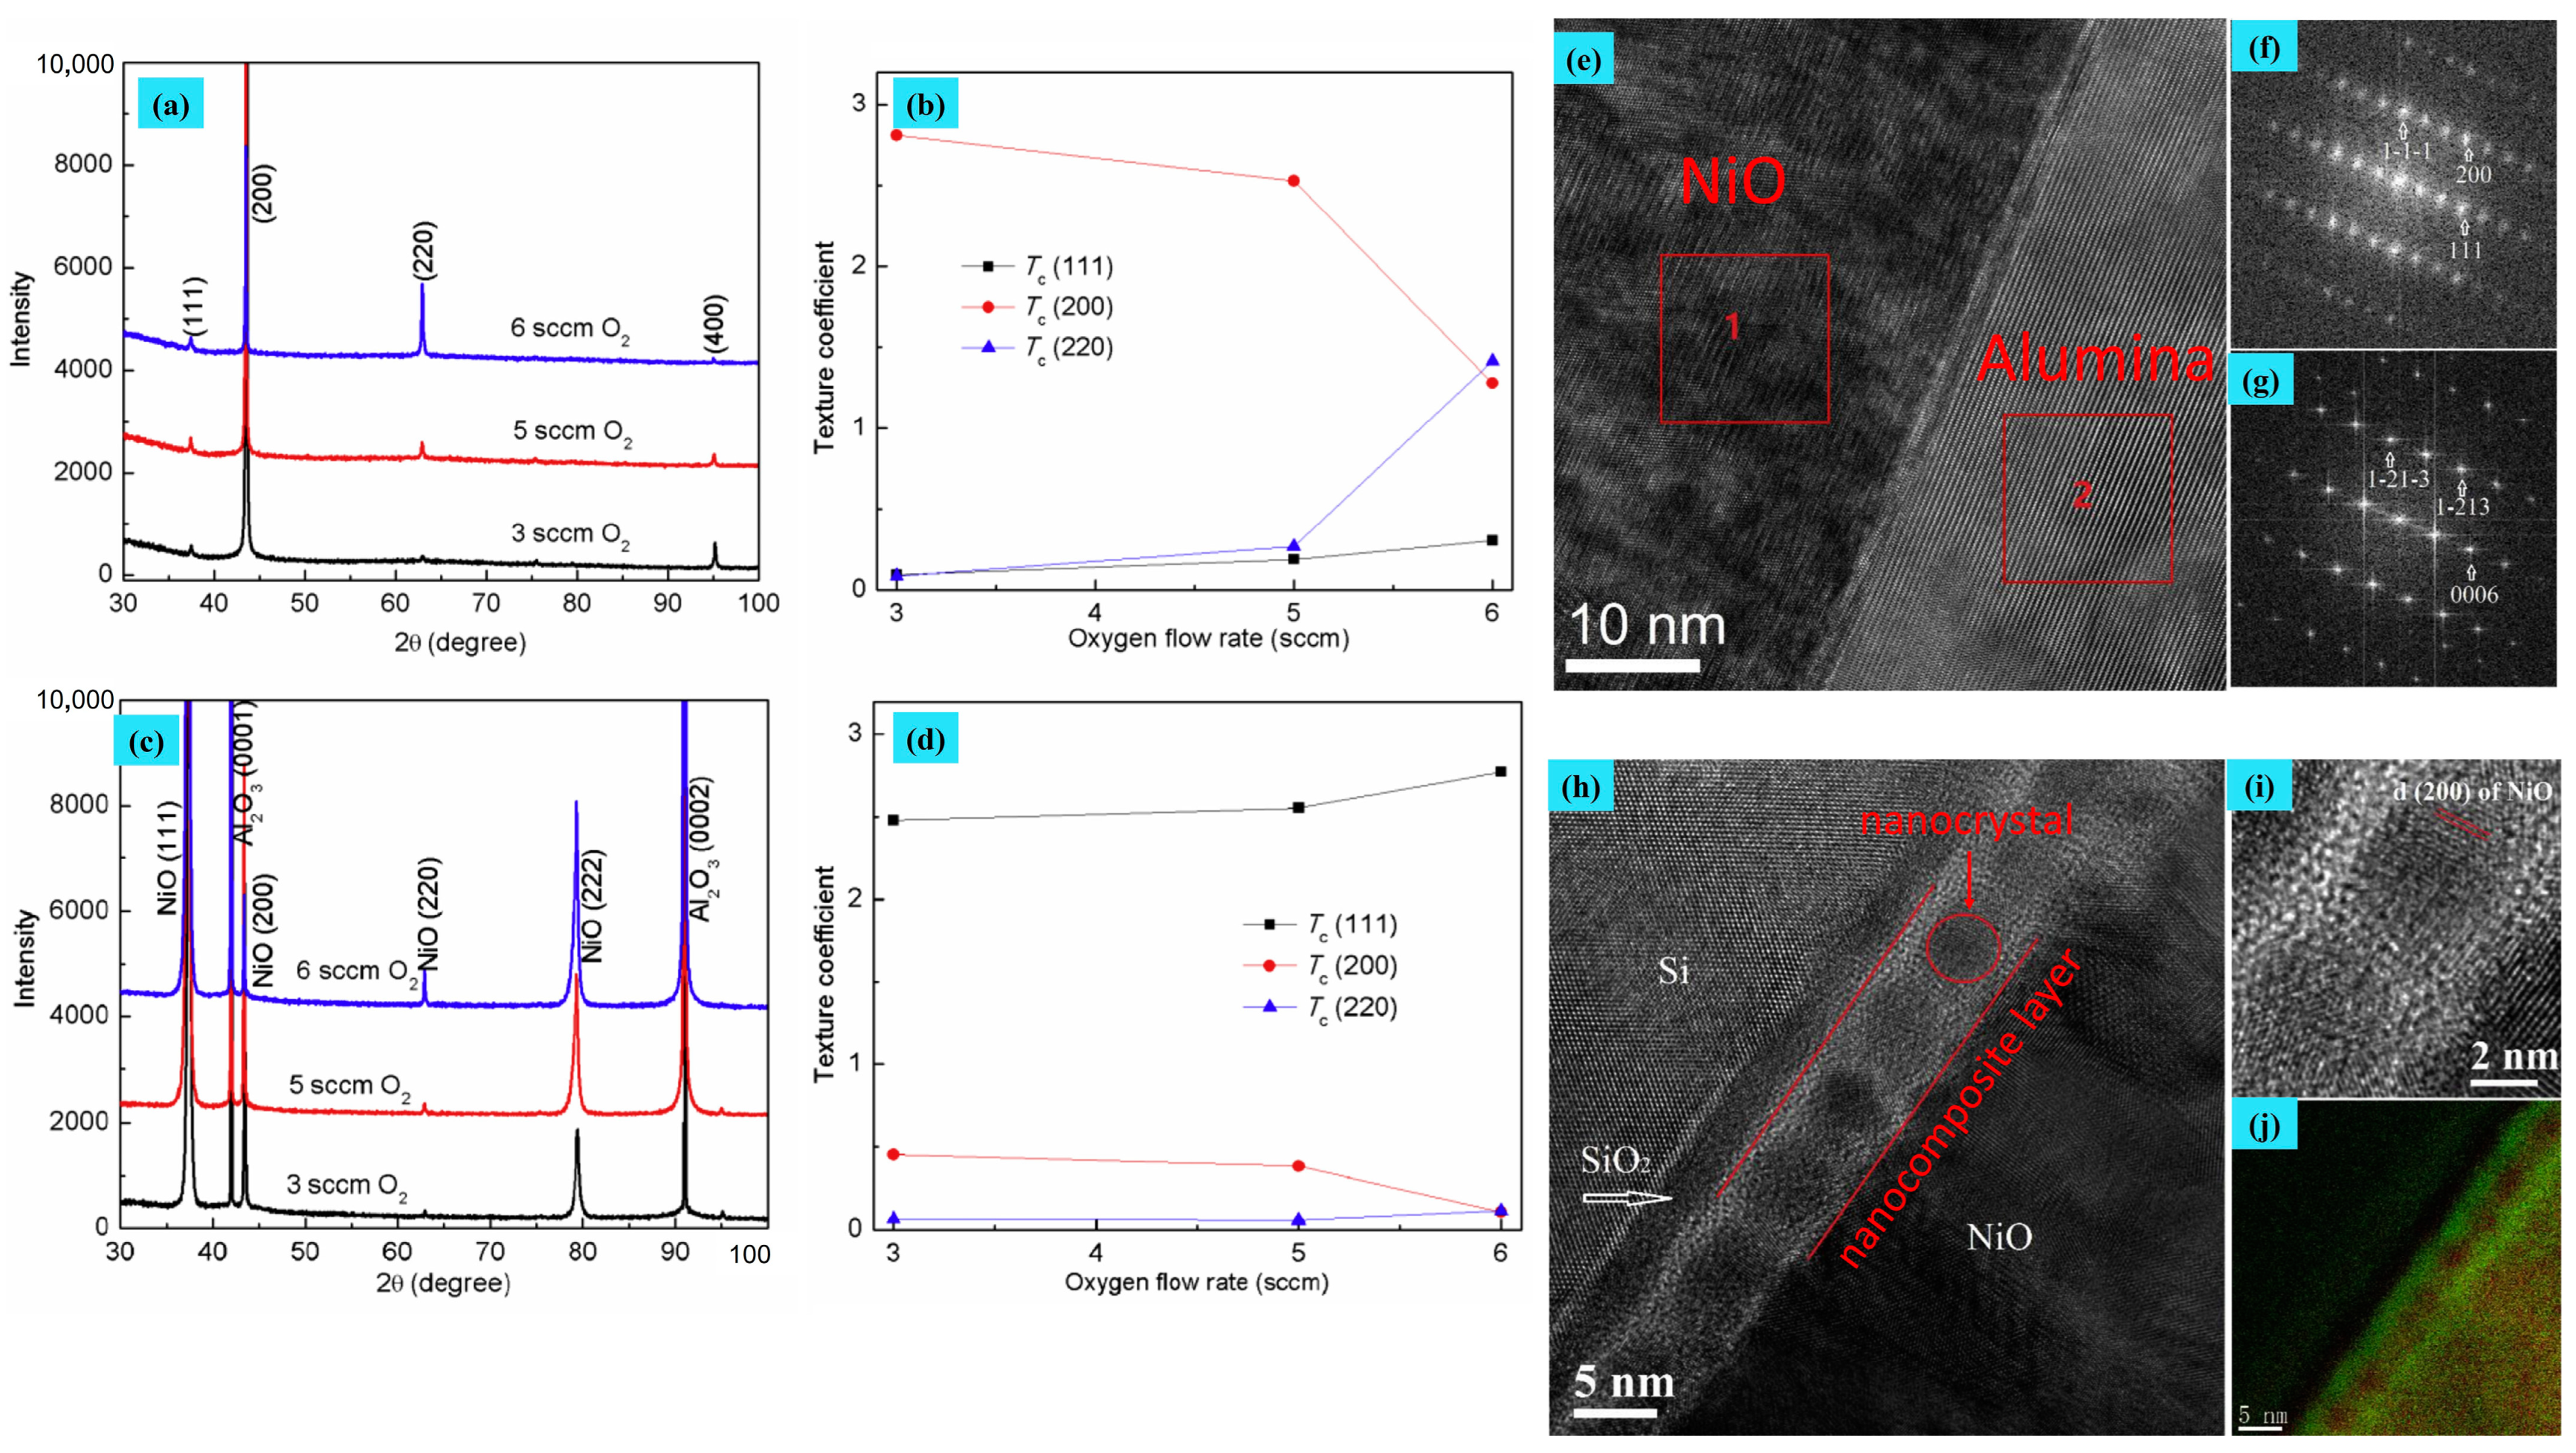
- Wang, Y.; Ghanbaja, J.; Boulet, P.; Horwat, D.; Pierson, J. Growth, interfacial microstructure and optical properties of NiO thin films with various types of texture. Acta Mater. 2018, 164, 648–653. [Google Scholar] [CrossRef]
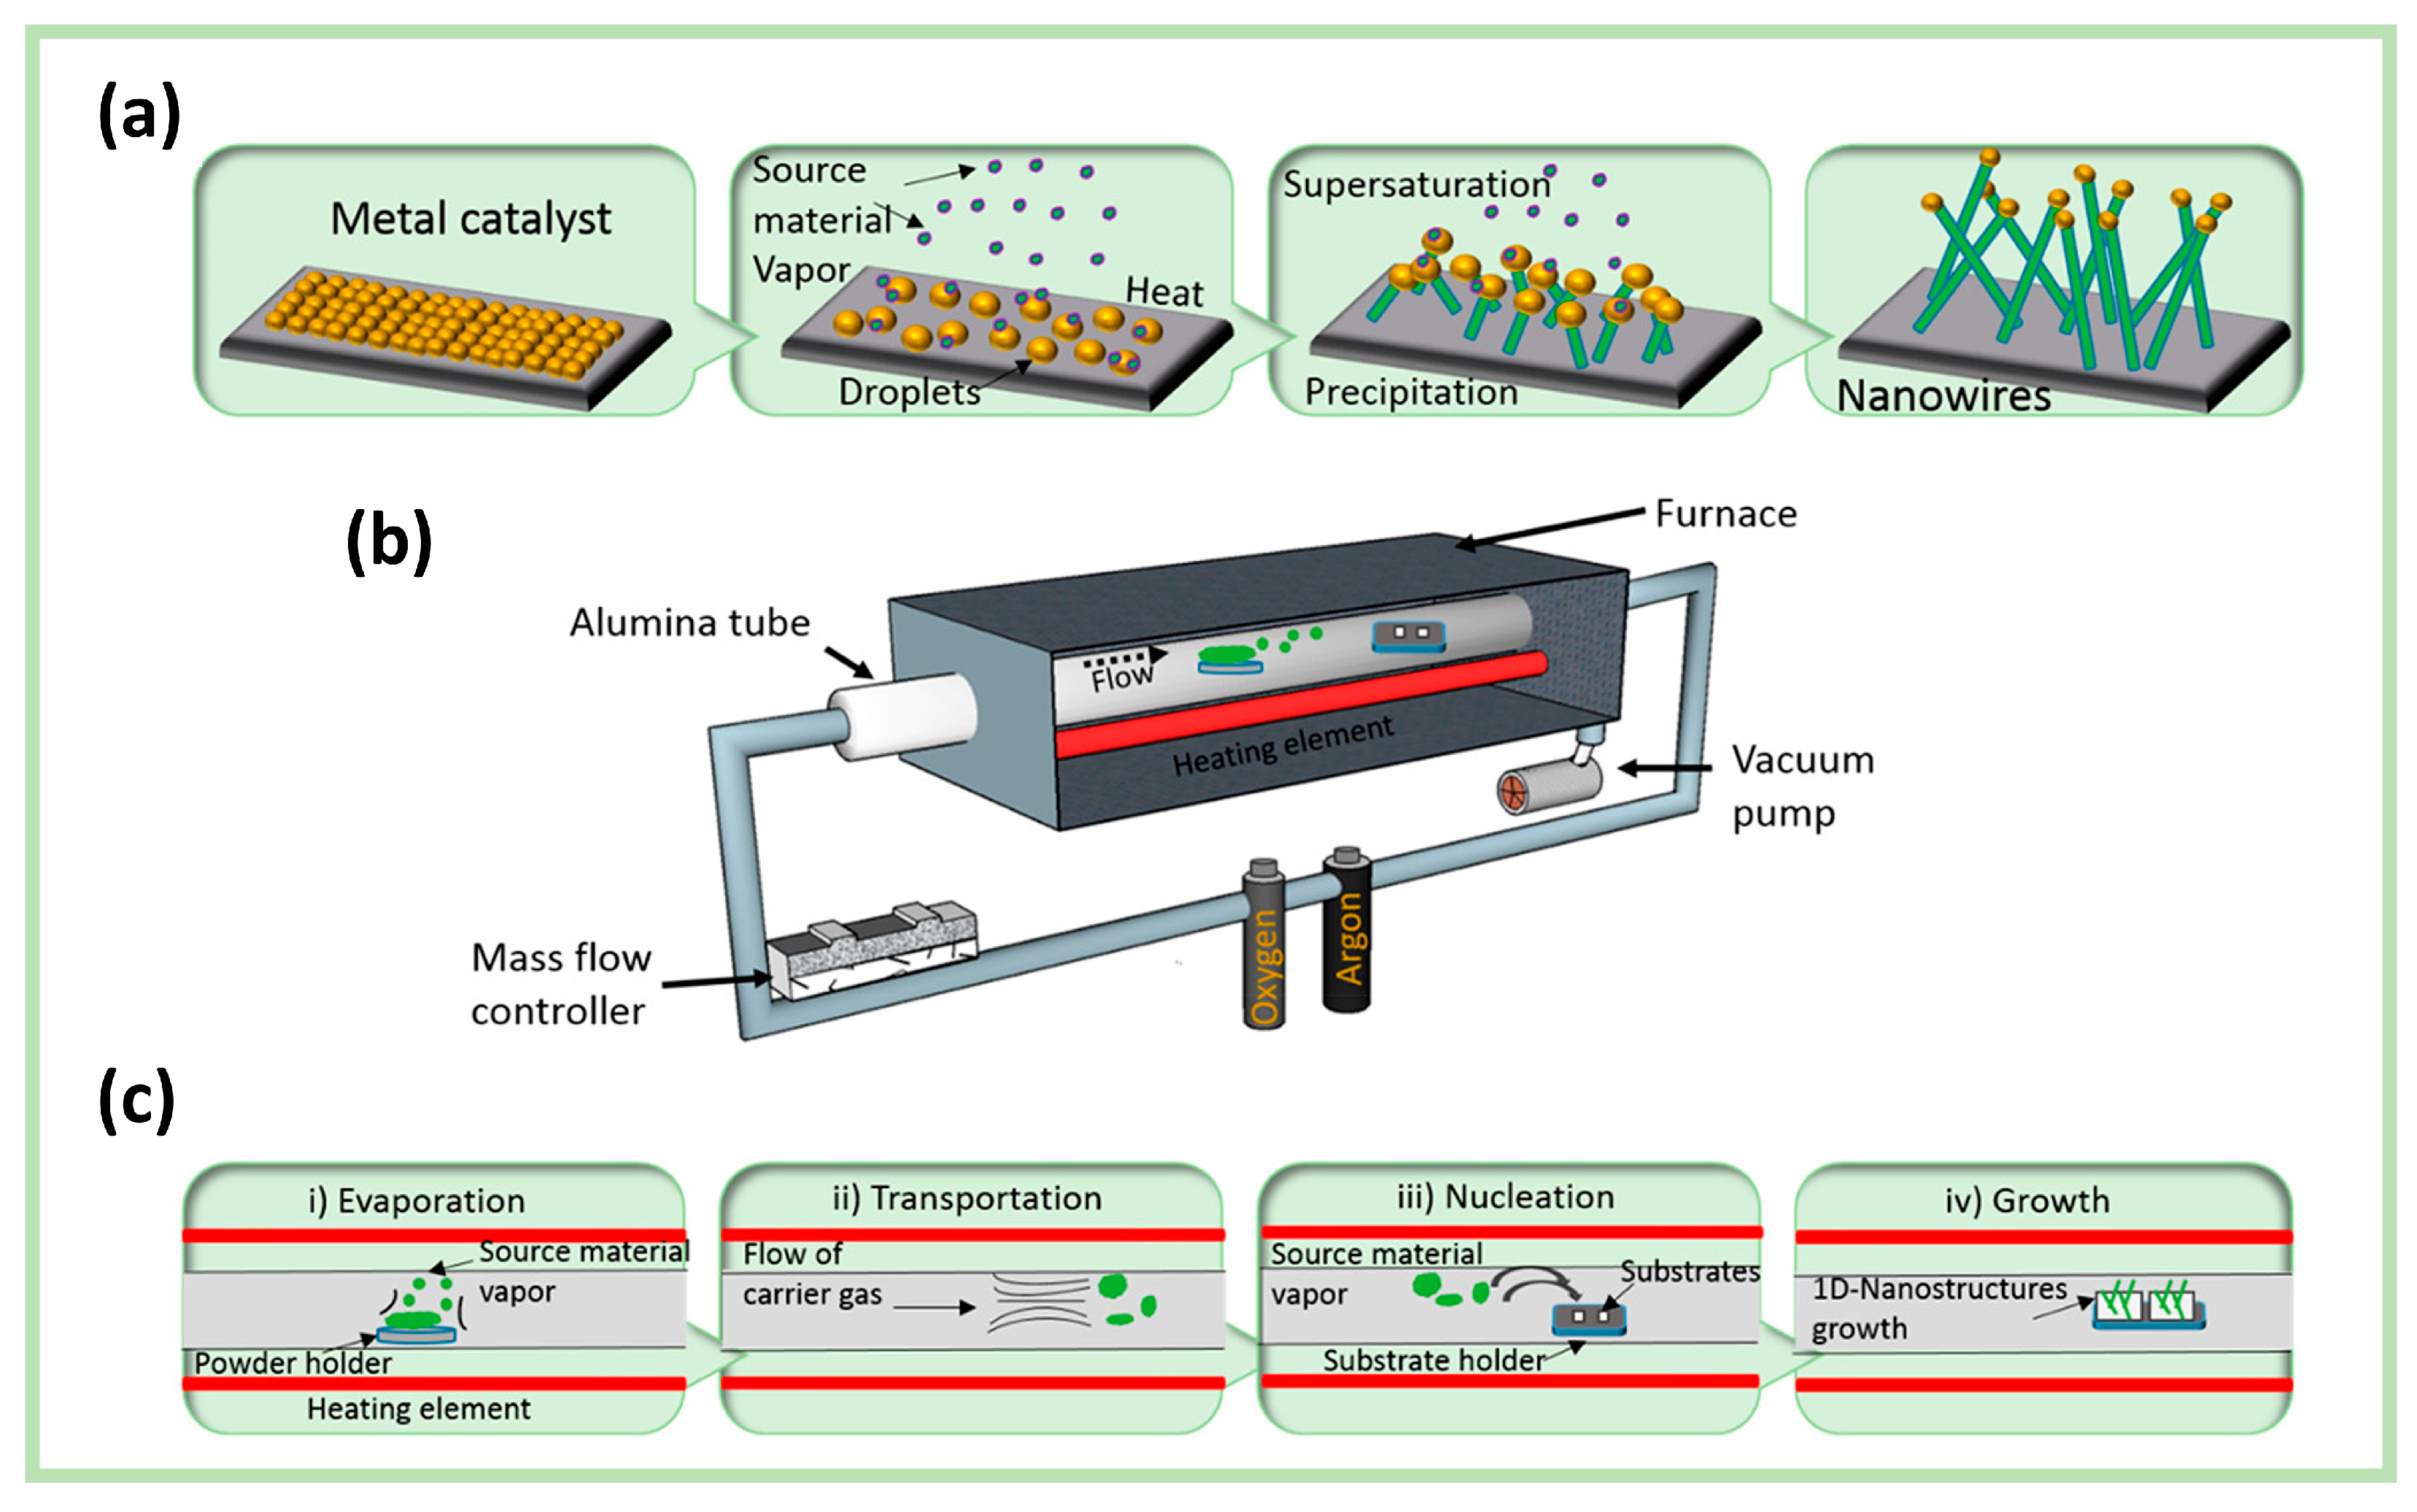
- Comini, E.; Bianchi, S.; Faglia, G.; Ferroni, M.; Vomiero, A.; Sberveglieri, G. Functional nanowires of tin oxide. Appl. Phys. A 2007, 89, 73–76. [Google Scholar] [CrossRef]
- Zhu, Z.; Chen, T.-L.; Gu, Y.; Warren, J.; Osgood, R.M. Zinc Oxide Nanowires Grown by Vapor-Phase Transport Using Selected Metal Catalysts: A Comparative Study. Chem. Mater. 2005, 17, 4227–4234. [Google Scholar] [CrossRef]
- Kim, T.; Kim, J.; Kumar, M.S.; Suh, E.-K.; Nahm, K. Influence of ambient gases on the morphology and photoluminescence of ZnO nanostructures synthesized with nickel oxide catalyst. J. Cryst. Growth 2004, 270, 491–497. [Google Scholar] [CrossRef]
- García-Alonso, J.; Maestre, D.; Bartolomé, J.; García-Tecedor, M.; Vásquez-López, A.; Taeño, M.; del Prado, F.; Nogales, E.; Cremades, A. Synthesis of low dimensional oxide based complex materials by a vapor-solid method. In Oxide-Based Materials and Devices XII; SPIE: Cambridge, MA, USA, 2021; Volume 11687, pp. 125–134. [Google Scholar] [CrossRef]
- Singh, Y.R.; Kataria, S.; Barshilia, H.C. Different Morphologies of Zinc Oxide Nanostructures Grown Under Similar Deposition Conditions During Vapor–Liquid–Solid Growth. Nanosci. Nanotechnol. Lett. 2013, 5, 1224–1230. [Google Scholar] [CrossRef]
- Kaur, N.; Singh, M.; Comini, E. One-Dimensional Nanostructured Oxide Chemoresistive Sensors. Langmuir 2020, 36, 6326–6344. [Google Scholar] [CrossRef]
- Kaur, N.; Comini, E.; Zappa, D.; Poli, N.; Sberveglieri, G. Nickel oxide nanowires: Vapor liquid solid synthesis and integration into a gas sensing device. Nanotechnology 2016, 27, 205701. [Google Scholar] [CrossRef] [PubMed]
- Strawbridge, A.; Rapp, R.A. The Role of Reactive Elements on Scale Growth in High-Temperature Oxidation of Pure Nickel, Iron, Cobalt, and Copper: I. Oxidation Kinetics and Scale Morphology. J. Electrochem. Soc. 1994, 141, 1905. [Google Scholar] [CrossRef]
- Hiralal, P.; Unalan, H.E.; Wijayantha, K.G.U.; Kursumovic, A.; Jefferson, D.; MacManus-Driscoll, J.L.; Amaratunga, G.A.J. Growth and process conditions of aligned and patternable films of iron (III) oxide nanowires by thermal oxidation of iron. Nanotechnology 2008, 19, 455608. [Google Scholar] [CrossRef] [PubMed]
- Zappa, D.; Comini, E.; Zamani, R.; Arbiol, J.; Morante, J.; Sberveglieri, G. Copper oxide nanowires prepared by thermal oxidation for chemical sensing. Procedia Eng. 2011, 25, 753–756. [Google Scholar] [CrossRef]
- Zappa, D.; Comini, E.; Sberveglieri, G. Thermally oxidized zinc oxide nanowires for use as chemical sensors. Nanotechnology 2013, 24, 444008. [Google Scholar] [CrossRef] [PubMed]
- Liu, Y.Y.; Natesan, K. The Adherence of Nickel Oxide on Nickel during High-Temperature Oxidation. MRS Proc. 1988, 119, 213. [Google Scholar] [CrossRef]
- Pinnel, M.; Tompkins, H.; Heath, D. Oxidation of Nickel and Nickel-Gold Alloys in Air at 50°–150° C. J. Electrochem. Soc. 1979, 126, 1274. [Google Scholar] [CrossRef]
- Dastan, D.; Shan, K.; Jafari, A.; Marszalek, T.; Mohammed, M.K.A.; Tao, L.; Shi, Z.; Chen, Y.; Yin, X.T.; Alharbi, N.D.; et al. Influence of heat treatment on H2S gas sensing features of NiO thin films deposited via thermal evaporation technique. Mater. Sci. Semicond. Process. 2023, 154, 107232. [Google Scholar] [CrossRef]
- De Los Santos Valladares, L.; Ionescu, A.; Holmes, S.; Barnes, C.H.W.; Dominguez, A.B.; Quispe, O.A.; González, J.C.; Milana, S.; Barbone, M.; Ferrari, A.C.; et al. Characterization of Ni thin films following thermal oxidation in air. J. Vac. Sci. Technol. B 2014, 32, 051808. [Google Scholar] [CrossRef]
- Hajakbari, F. Characterization of nanocrystalline nickel oxide thin films prepared at different thermal oxidation temperatures. J. Nanostruct. Chem. 2020, 10, 97–103. [Google Scholar] [CrossRef]
- Peraldi, R.; Monceau, D.; Jean, S.; Pieraggi, B. High temperature oxidation of high purity nickel: Oxide scale morphology and growth kinetics. Mater. High Temp. 2003, 20, 649–655. [Google Scholar] [CrossRef]
- Mrowec, S.; Grzesik, Z. Oxidation of nickel and transport properties of nickel oxide. J. Phys. Chem. Solids 2004, 65, 1651–1657. [Google Scholar] [CrossRef]
- Marciuš, M.; Ristić, M.; Ivanda, M.; Musić, S. Formation and microstructure of nickel oxide films. J. Alloys Compd. 2012, 541, 238–243. [Google Scholar] [CrossRef]
- Ren, Y.; Chim, W.K.; Chiam, S.Y.; Huang, J.Q.; Pi, C.; Pan, J.S. Formation of Nickel Oxide Nanotubes with Uniform Wall Thickness by Low-Temperature Thermal Oxidation through Understanding the Limiting Effect of Vacancy Diffusion and the Kirkendall Phenomenon. Adv. Funct. Mater. 2010, 20, 3336–3342. [Google Scholar] [CrossRef]
- Vorotyntsev, A.V.; Markov, A.N.; Kapinos, A.A.; Petukhov, A.N.; Atlaskin, A.A.; Golovacheva, A.A.; Vilkov, I.V.; Yunin, P.A.; Vorotyntsev, V.M.; Vorotyntsev, I.V. Direct synthesis of nanostructural and nanospherical silica using induction jet levitation: Synthesis, design and catalytic application. Mater. Today Chem. 2022, 26, 101004. [Google Scholar] [CrossRef]
- Morozov, Y.G.; Belousova, O.V.; Kuznetsov, M.V.; Ortega, D.; Parkin, I.P. Electric field-assisted levitation-jet aerosol synthesis of Ni/NiO nanoparticles. J. Mater. Chem. 2012, 22, 11214–11223. [Google Scholar] [CrossRef]
- Hernández, P.T.; Kuznetsov, M.V.; Morozov, I.G.; Parkin, I.P. Application of levitation-jet synthesized nickel-based nanoparticles for gas sensing. Mater. Sci. Eng. B 2019, 244, 81–92. [Google Scholar] [CrossRef]
- Baiutti, F.; Wrobel, F.; Christiani, G.; Logvenov, G. Oxide molecular beam epitaxy of complex oxide heterointerfaces. In Metal Oxide-Based Thin Film Structures; Elsevier: Amsterdam, The Netherlands, 2018; pp. 53–78. [Google Scholar]
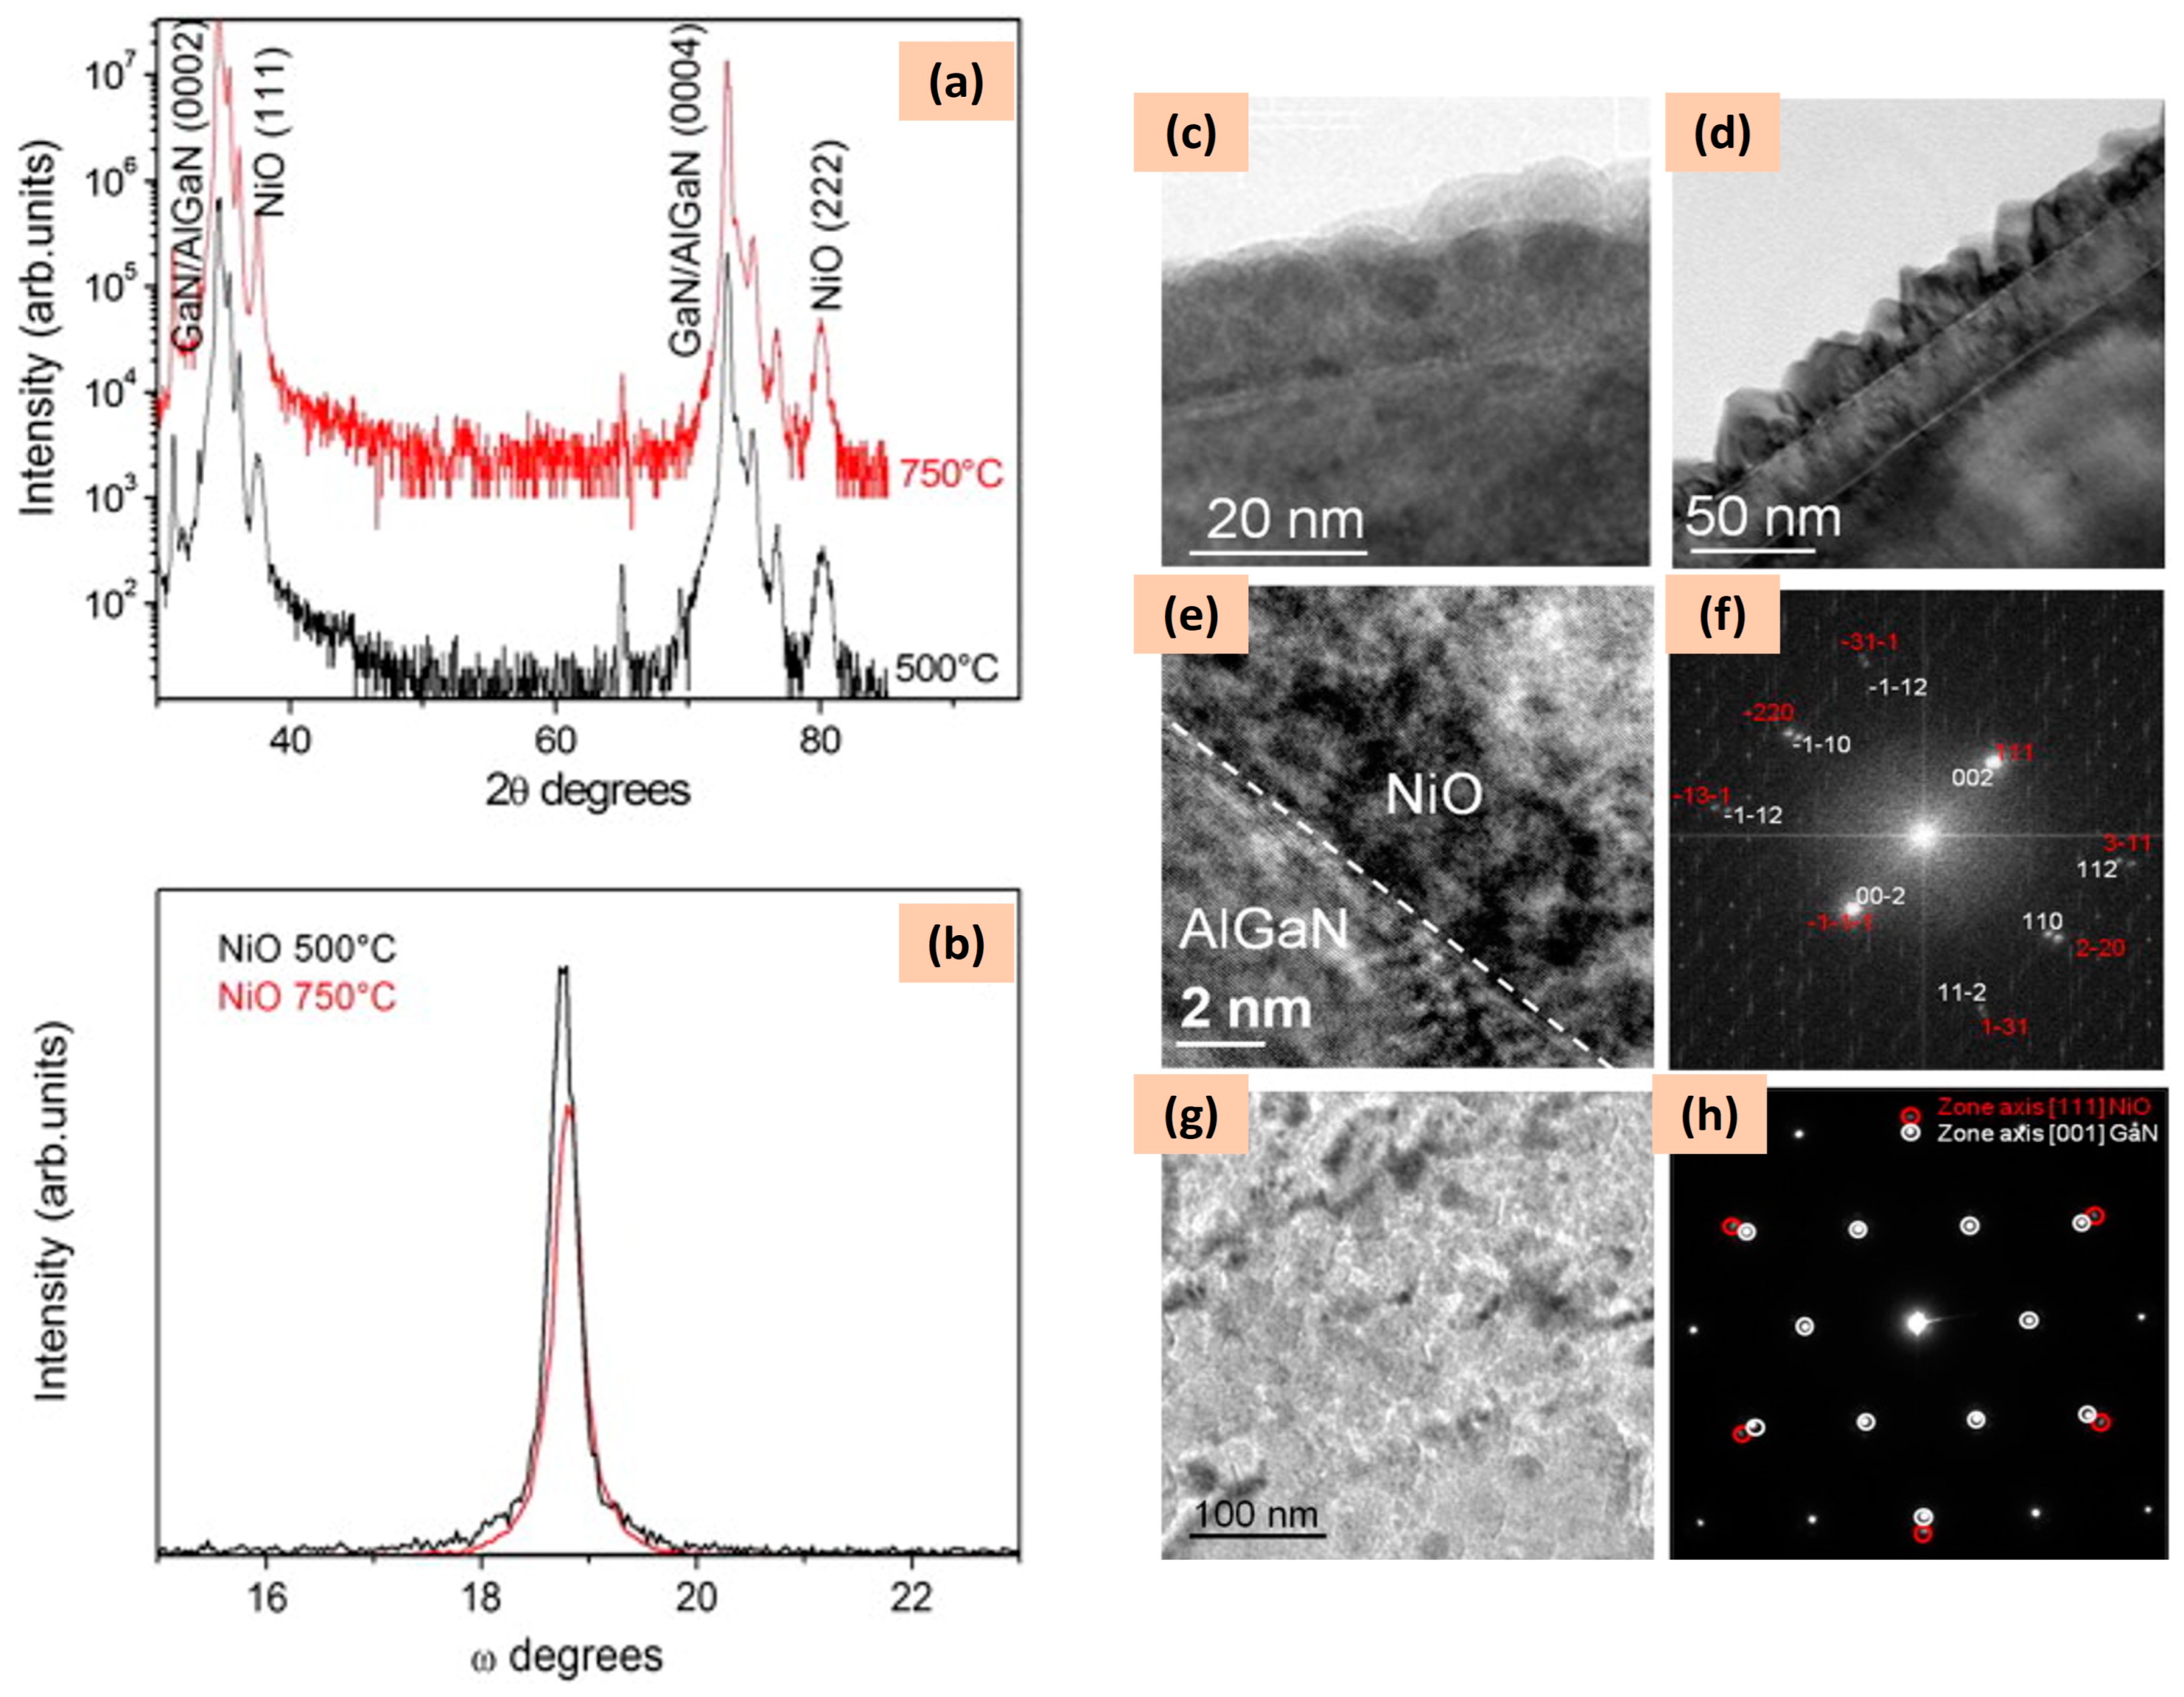
- Budde, M.; Remmele, T.; Tschammer, C.; Feldl, J.; Franz, P.; Lähnemann, J.; Cheng, Z.; Hanke, M.; Ramsteiner, M.; Albrecht, M.; et al. Plasma-assisted molecular beam epitaxy of NiO on GaN(00.1). J. Appl. Phys. 2020, 127, 015306. [Google Scholar] [CrossRef]
- Zhang, Z.; Lukaszew, R.A.; Cionca, C.; Pan, X.; Clarke, R.; Yeadon, M.; Zambano, A.; Walko, D.; Dufresne, E.; te Velthius, S. Correlated structural and magnetization reversal studies on epitaxial Ni films grown with molecular beam epitaxy and with sputtering. J. Vac. Sci. Technol. A 2004, 22, 1868–1872. [Google Scholar] [CrossRef]
- Chaudhary, K.T. Thin film deposition: Solution based approach. In Thin Films; IntechOpen: Budhapest, Hungary, 2021. [Google Scholar]
- Herman, M.A.; Sitter, H. Molecular Beam Epitaxy: Fundamentals and Current Status; Springer Science & Business Media: Berlin/Heidelberg, Germany, 2012. [Google Scholar]
- Lane, P.A.; Wright, P.J.; Crosbie, M.J.; Pitt, A.D.; Reeves, C.L.; Cockayne, B.; Jones, A.C.; Leedham, T.J. Liquid injection metal organic chemical vapour deposition of nickel zinc ferrite thin films. J. Cryst. Growth 1998, 192, 423–429. [Google Scholar] [CrossRef]
- Liu, X.; Chan, S.H.; Wu, F.; Li, Y.; Keller, S.; Speck, J.S.; Mishra, U.K. Metalorganic chemical vapor deposition of Al2O3 using trimethylaluminum and O2 precursors: Growth mechanism and crystallinity. J. Cryst. Growth 2014, 408, 78–84. [Google Scholar] [CrossRef]
- Seisenbaeva, G.A.; Kessler, V.G. Precursor directed synthesis–“molecular” mechanisms in the Soft Chemistry approaches and their use for template-free synthesis of metal, metal oxide and metal chalcogenide nanoparticles and nanostructures. Nanoscale 2014, 6, 6229–6244. [Google Scholar] [CrossRef] [PubMed]
- Kukimoto, H. MOCVD—Current state and future. J. Cryst. Growth 1989, 95, 360–362. [Google Scholar] [CrossRef]
- Wright, P.J.; Crosbie, M.J.; Williams, D.J.; Lane, P.A.; Jones, A.C.; Leedham, T.J.; Davies, H.O. Metal organic chemical vapor deposition (MOCVD) of oxides and ferroelectric materials. J. Mater. Sci. Mater. Electron. 2002, 13, 671–678. [Google Scholar] [CrossRef]
- Nigro, R.L.; Battiato, S.; Greco, G.; Fiorenza, P.; Roccaforte, F.; Malandrino, G. Metal Organic Chemical Vapor Deposition of nickel oxide thin films for wide band gap device technology. Thin Solid Films 2014, 563, 50–55. [Google Scholar] [CrossRef]
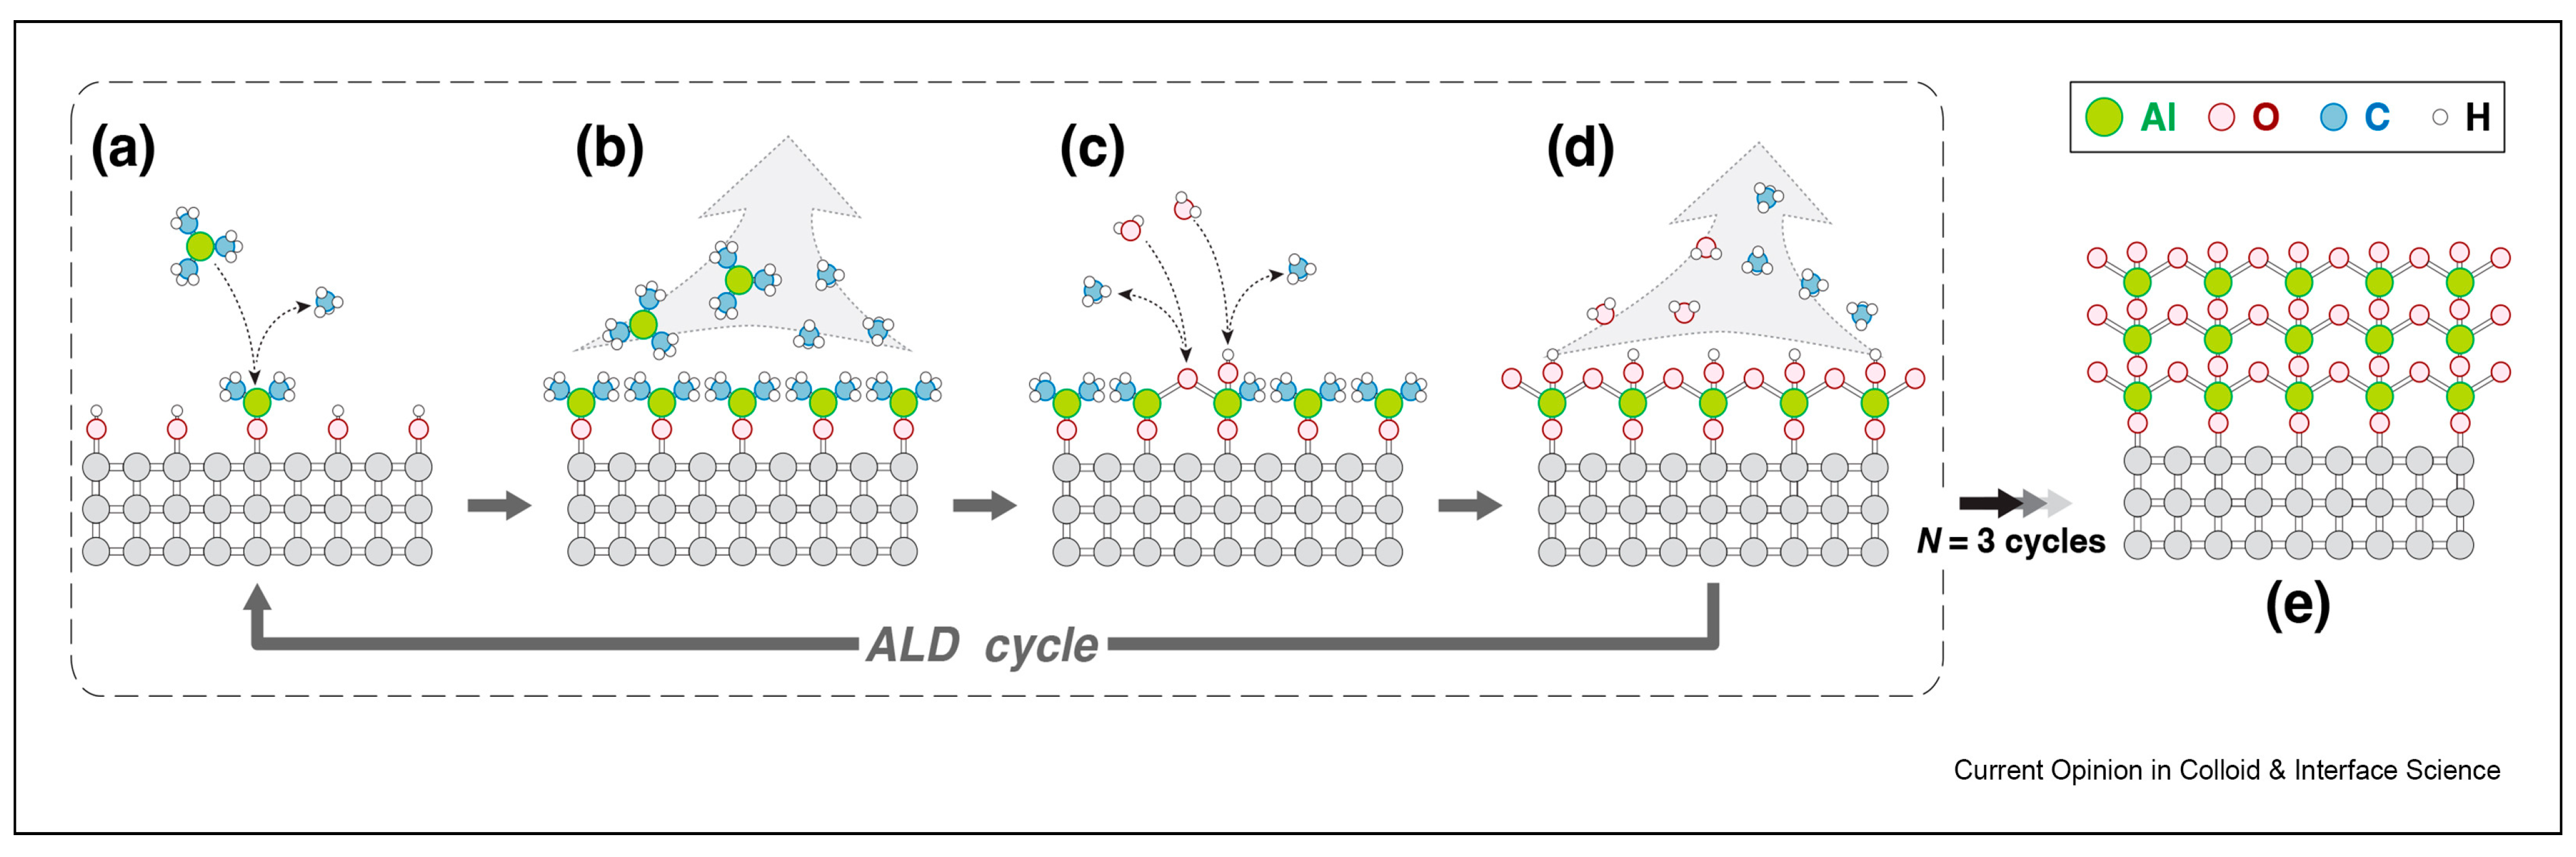
- George, S.M. Atomic Layer Deposition: An Overview. Chem. Rev. 2009, 110, 111–131. [Google Scholar] [CrossRef] [PubMed]
- Santinacci, L. Atomic layer deposition: An efficient tool for corrosion protection. Curr. Opin. Colloid Interface Sci. 2023, 63, 101674. [Google Scholar] [CrossRef]
- Pan, H.; Wang, C.; Zhang, Z.; Li, Y.; Hou, X.; Zheng, W.; Liu, X.; Wan, Y.; Zhang, J. Oxygen vacancy-enriched ALD NiO sub-50 nm thin films for enhanced triethylamine detection. Appl. Phys. Lett. 2022, 121, 111603. [Google Scholar] [CrossRef]
- Hile, D.; Swart, H.; Motloung, S.; Kroon, R.; Egbo, K.; Koao, L. The effect of annealing time on zinc selenide thin films deposited by photo-assisted chemical bath deposition. J. Phys. Chem. Solids 2020, 140, 109381. [Google Scholar] [CrossRef]
- He, H. Thermal-assisted chemical bath deposition and optical property of CuS films. Optoelectron. Adv. Mater.-Rapid Commun. 2011, 5, 1301–1306. [Google Scholar]
- Lin, W.-W.; Wang, N.-W.; Lan, Z.-Y.; Huang, Z.-P.; Lin, L.-M.; Ye, Q.-Y.; Chen, S.-Y.; Chen, G.-L. A facile Ion-Exchange assisted chemical bath deposition of CuSbS2 for thin film solar cells. Sol. Energy 2022, 244, 465–473. [Google Scholar] [CrossRef]
- Han, S.-Y.; Lee, D.-H.; Chang, Y.-J.; Ryu, S.-O.; Lee, T.-J.; Chang, C.-H. The Growth Mechanism of Nickel Oxide Thin Films by Room-Temperature Chemical Bath Deposition. J. Electrochem. Soc. 2006, 153, C382. [Google Scholar] [CrossRef]
- Hao, F.; Verma, A.; Mukherjee, P.P. Electrodeposition stability of metal electrodes. Energy Storage Mater. 2019, 20, 1–6. [Google Scholar] [CrossRef]
- Maile, N.; Shinde, S.; Koli, R.; Fulari, A.; Kim, D.; Fulari, V. Effect of different electrolytes and deposition time on the supercapacitor properties of nanoflake-like Co(OH)2 electrodes. Ultrason. Sonochem. 2018, 51, 49–57. [Google Scholar] [CrossRef] [PubMed]
- Firat, Y. Influence of current density on Al:NiO thin films via electrochemical deposition: Semiconducting and electrochromic properties. Mater. Sci. Semicond. Process. 2020, 109, 104958. [Google Scholar] [CrossRef]
- Park, B.-O.; Lokhande, C.; Park, H.-S.; Jung, K.-D.; Joo, O.-S. Performance of supercapacitor with electrodeposited ruthenium oxide film electrodes—Effect of film thickness. J. Power Sources 2004, 134, 148–152. [Google Scholar] [CrossRef]
- Zhang, Y.; Xie, L.-Z.; Yuan, C.-X.; Zhang, C.-L.; Liu, S.; Peng, Y.-Q.; Li, H.-R.; Zhang, M. Preparation of 3D rose-like nickel oxide nanoparticles by electrodeposition method and application in gas sensors. J. Mater. Sci. Mater. Electron. 2015, 27, 1817–1827. [Google Scholar] [CrossRef]
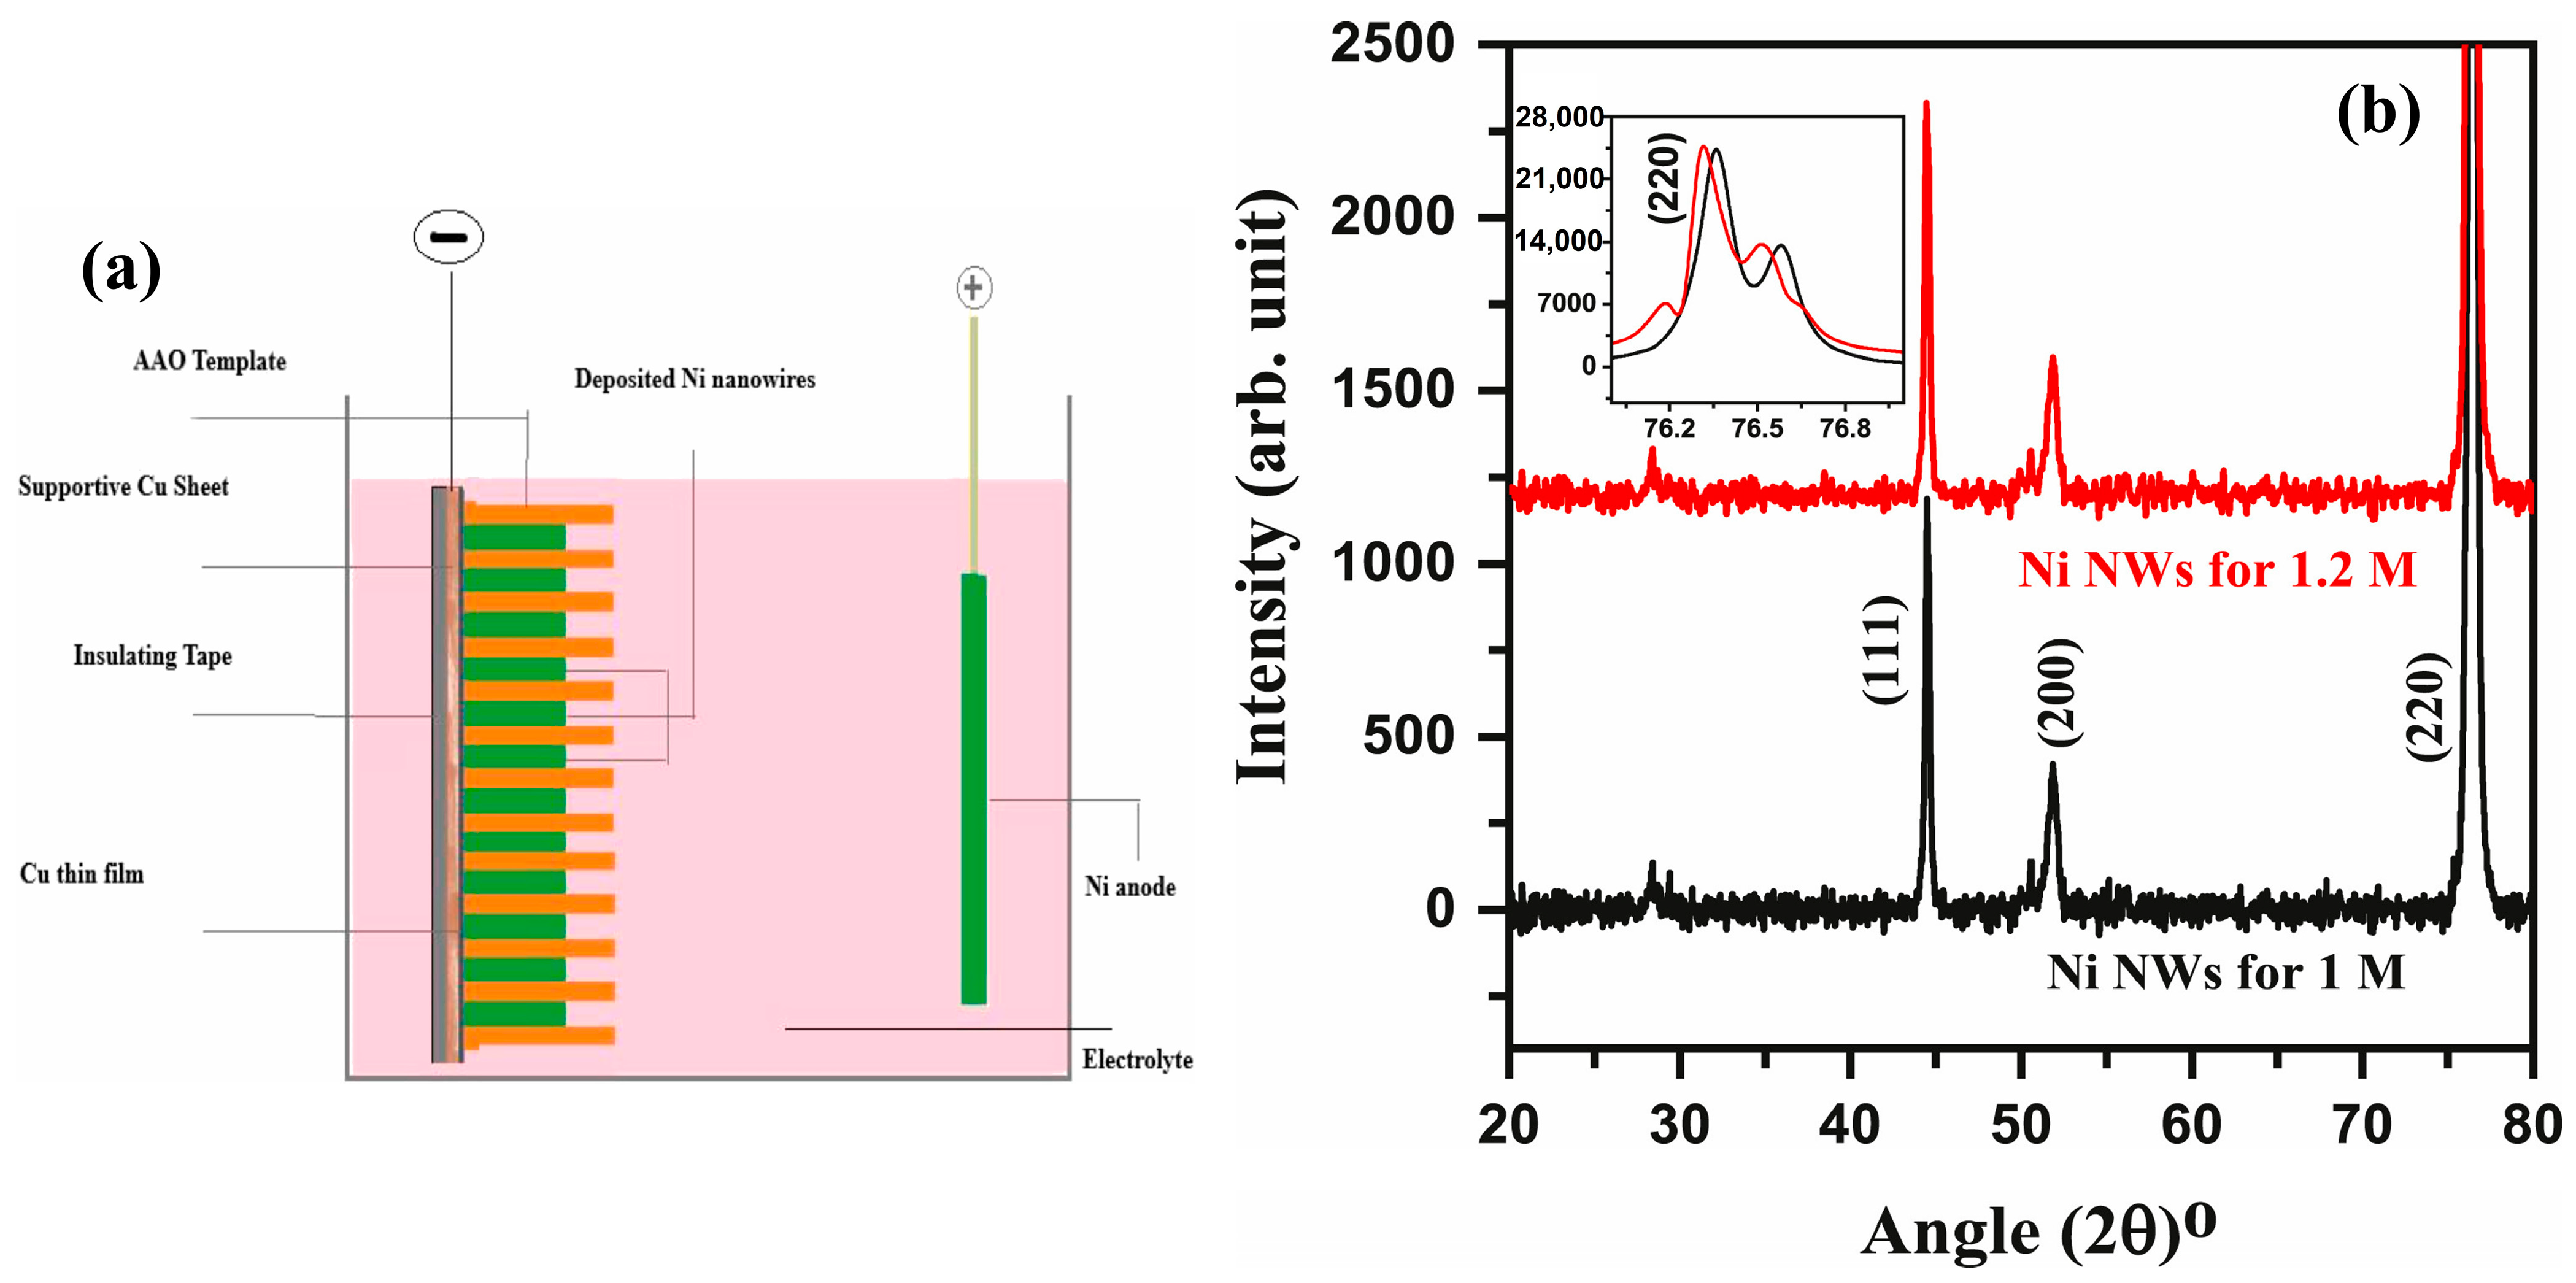
- Shahzad, A.; Khan, I.A.; Manzoor, A.; Kashif, M.; Ahsan, M.; He, M.; Razzokov, J. Synthesis of nickel nanowires (Ni-NWs) as high ferromagnetic material by electrodeposition technique. Heliyon 2022, 9, e12576. [Google Scholar] [CrossRef]
- Xue, J.; Wu, T.; Dai, Y.; Xia, Y. Electrospinning and Electrospun Nanofibers: Methods, Materials, and Applications. Chem. Rev. 2019, 119, 5298–5415. [Google Scholar] [CrossRef]
- Katsogiannis, K.A.G.; Vladisavljević, G.T.; Georgiadou, S.; Rahmani, R. Assessing the Increase in Specific Surface Area for Electrospun Fibrous Network due to Pore Induction. ACS Appl. Mater. Interfaces 2016, 8, 29148–29154. [Google Scholar] [CrossRef]
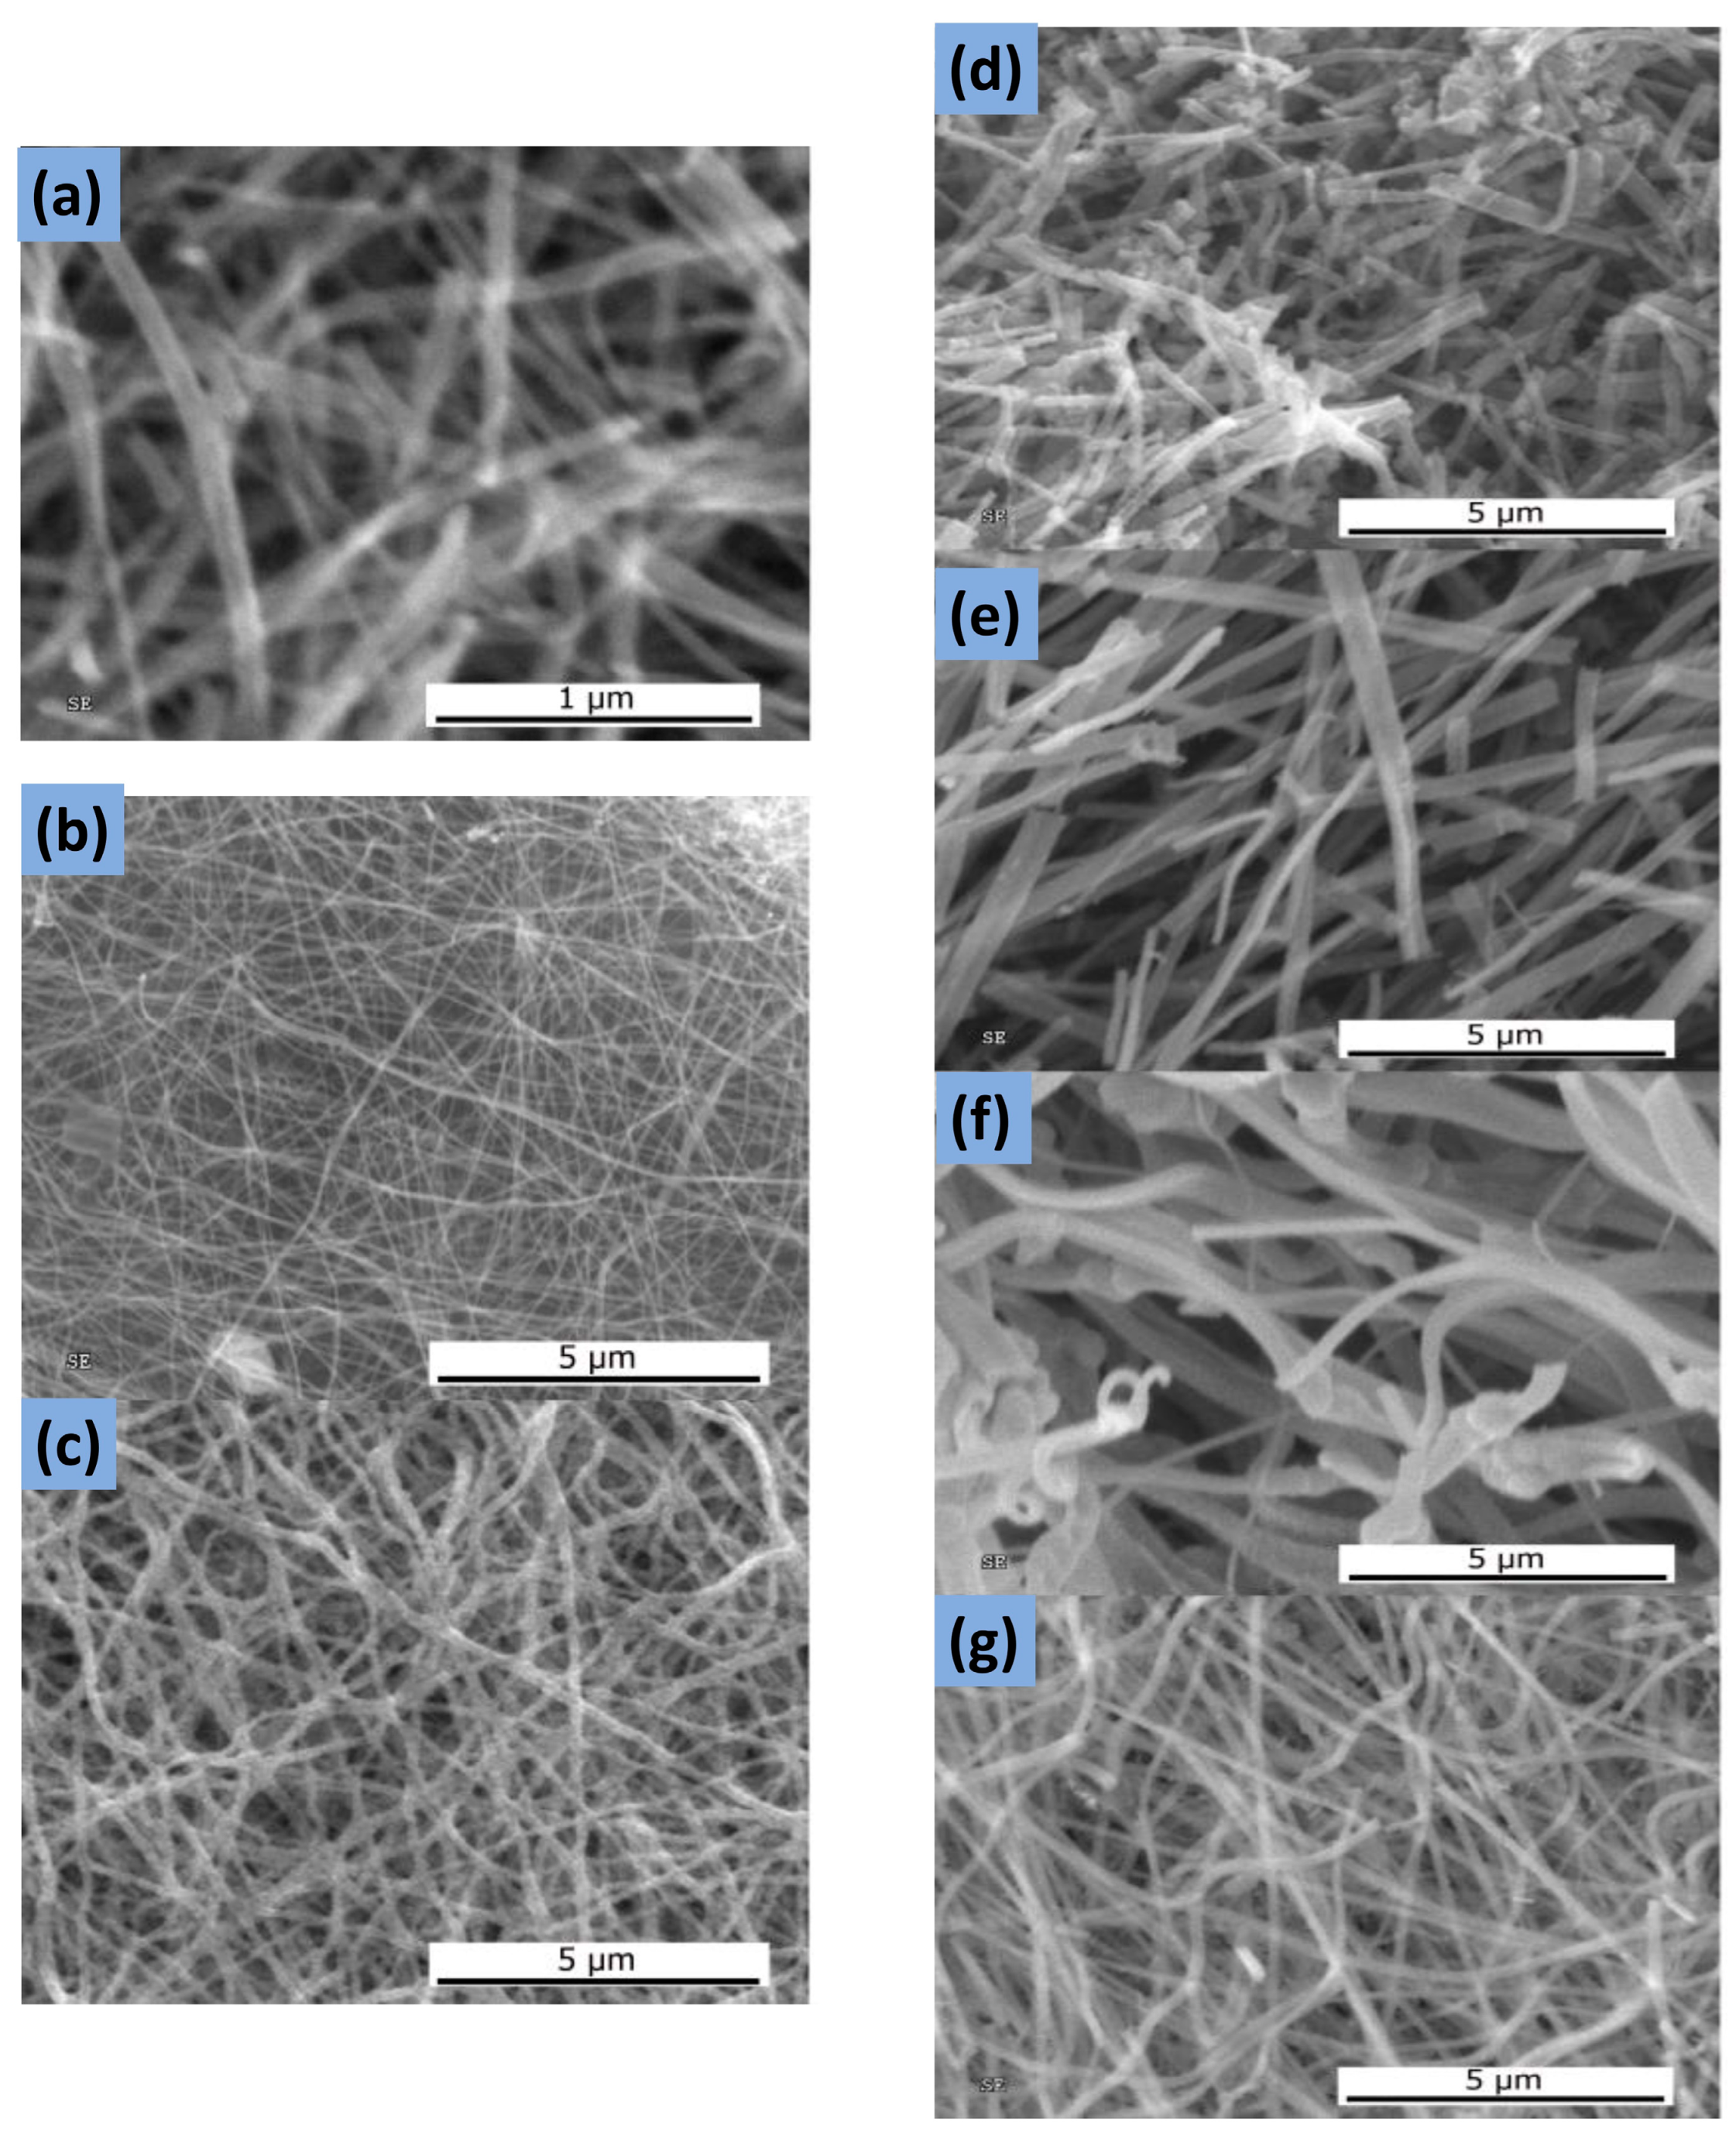
- Ercolano, G.; Farina, F.; Cavaliere, S.; Jones, D.J.; Rozière, J. Nickel Based Electrospun Materials with Tuned Morphology and Composition. Nanomaterials 2016, 6, 236. [Google Scholar] [CrossRef]
- Balogun, M.-S.; Zeng, Y.; Qiu, W.; Luo, Y.; Onasanya, A.; Olaniyi, T.K.; Tong, Y. Three-dimensional nickel nitride (Ni3N) nanosheets: Free standing and flexible electrodes for lithium ion batteries and supercapacitors. J. Mater. Chem. A 2016, 4, 9844–9849. [Google Scholar] [CrossRef]
- Liu, H.; Wang, X.; He, G.; Lin, Y.; Wei, J.; Zheng, J.; Zheng, G.; Sun, D. Electrospun nickel oxide nanofibers for gas sensor application. In Proceedings of the 8th Annual IEEE International Conference on Nano/Micro Engineered and Molecular Systems, Suzhou, China, 7–10 April 2013; pp. 377–380. [Google Scholar]
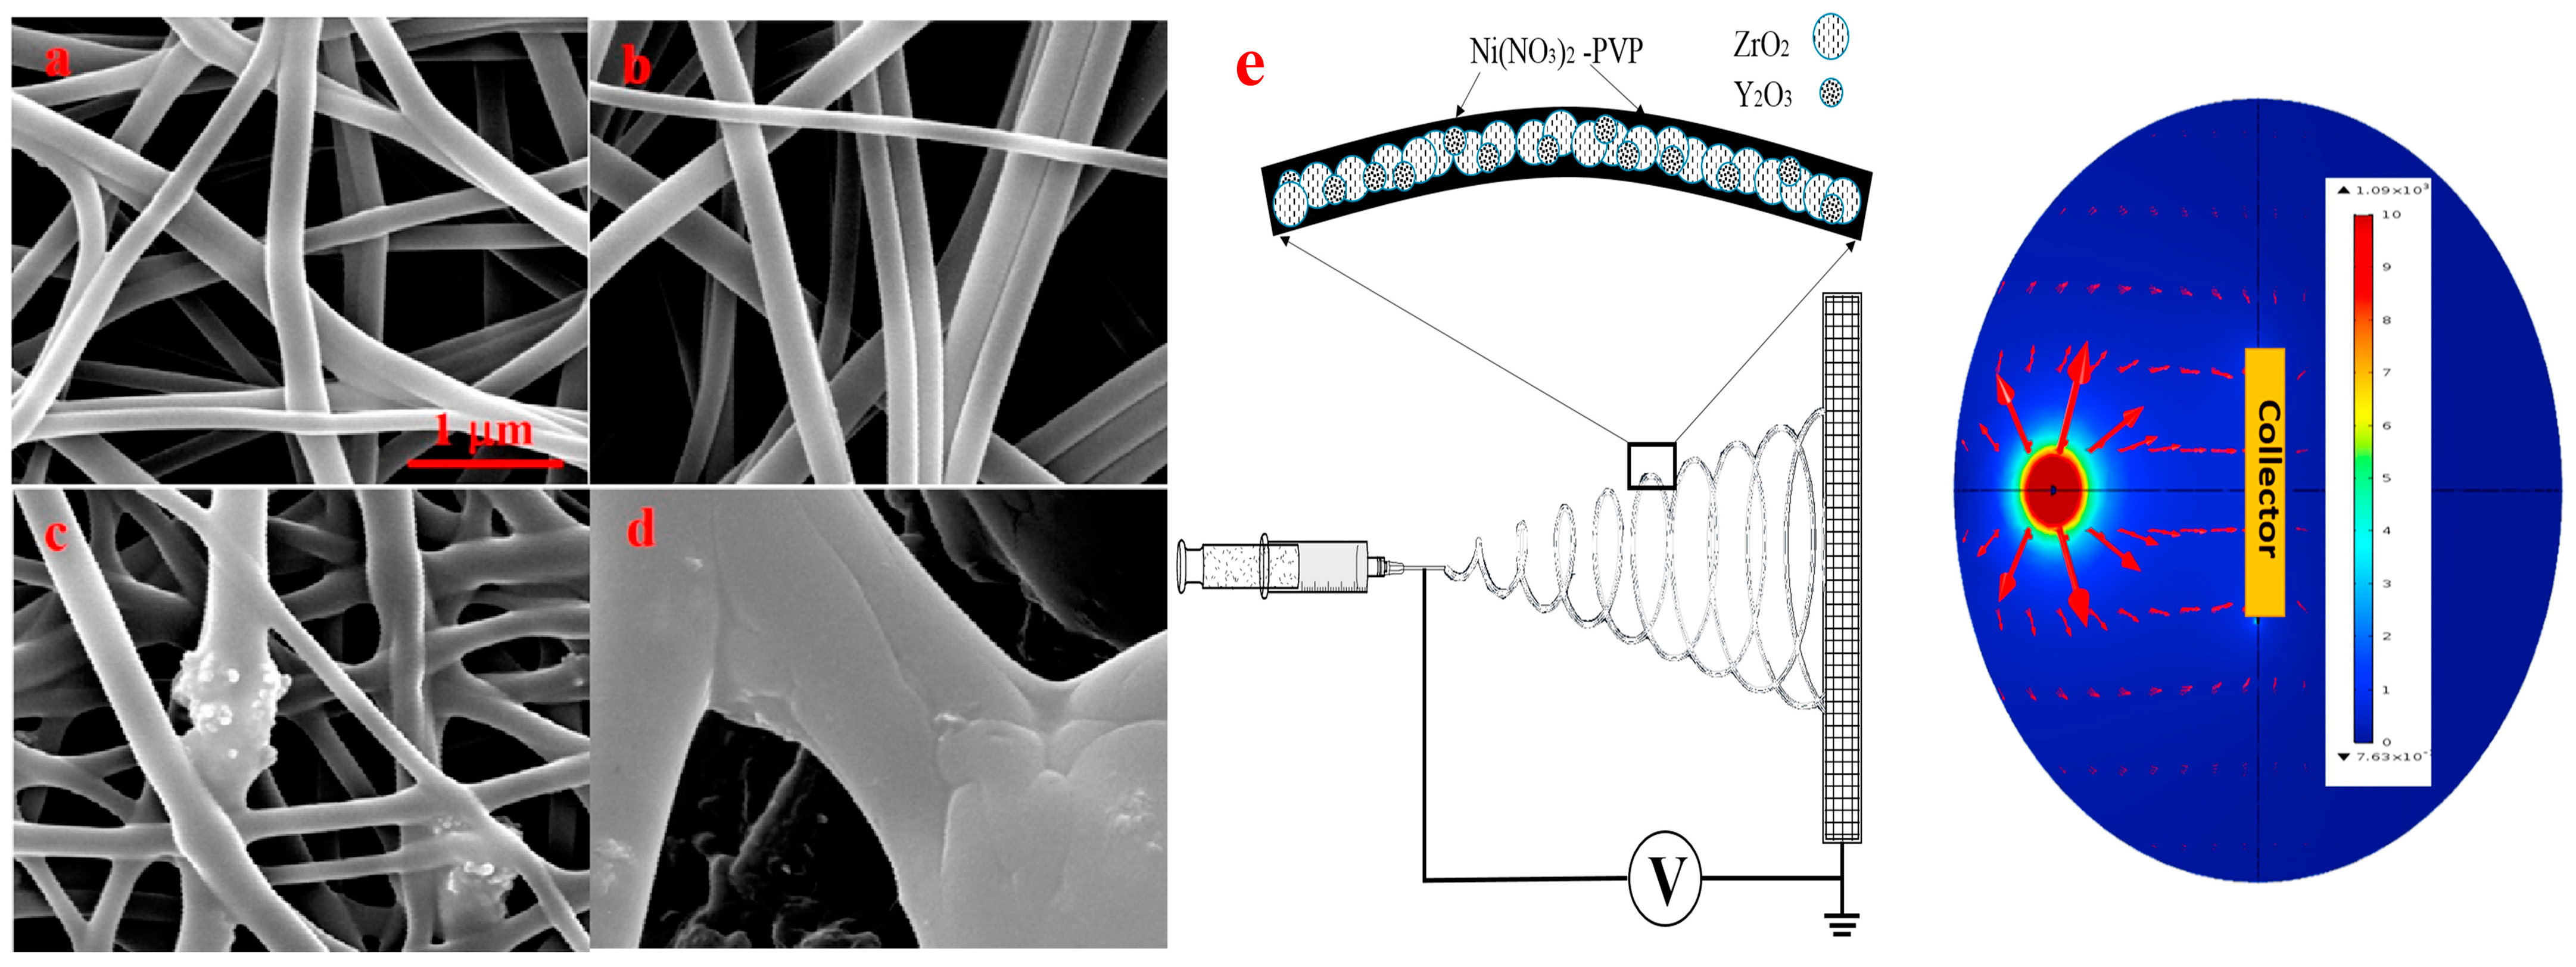
- Yu, G.; Li, T.S.; Xu, M.; Andersson, M.; Li, B.; Tang, H.; Parbey, J.; Shao, J. Fabrication of nickel-YSZ cermet nanofibers via electrospinning. J. Alloys Compd. 2017, 693, 1214–1219. [Google Scholar] [CrossRef]
- Haider, A.J.; Al-Anbari, R.; Sami, H.M.; Haider, M.J. Photocatalytic activity of nickel oxide. J. Mater. Res. Technol. 2019, 8, 2802–2808. [Google Scholar] [CrossRef]
- Chtouki, T.; Soumahoro, L.; Kulyk, B.; Bougharraf, H.; Kabouchi, B.; Erguig, H.; Sahraoui, B. Comparison of structural, morphological, linear and nonlinear optical properties of NiO thin films elaborated by Spin-Coating and Spray Pyrolysis. Optik 2017, 128, 8–13. [Google Scholar] [CrossRef]
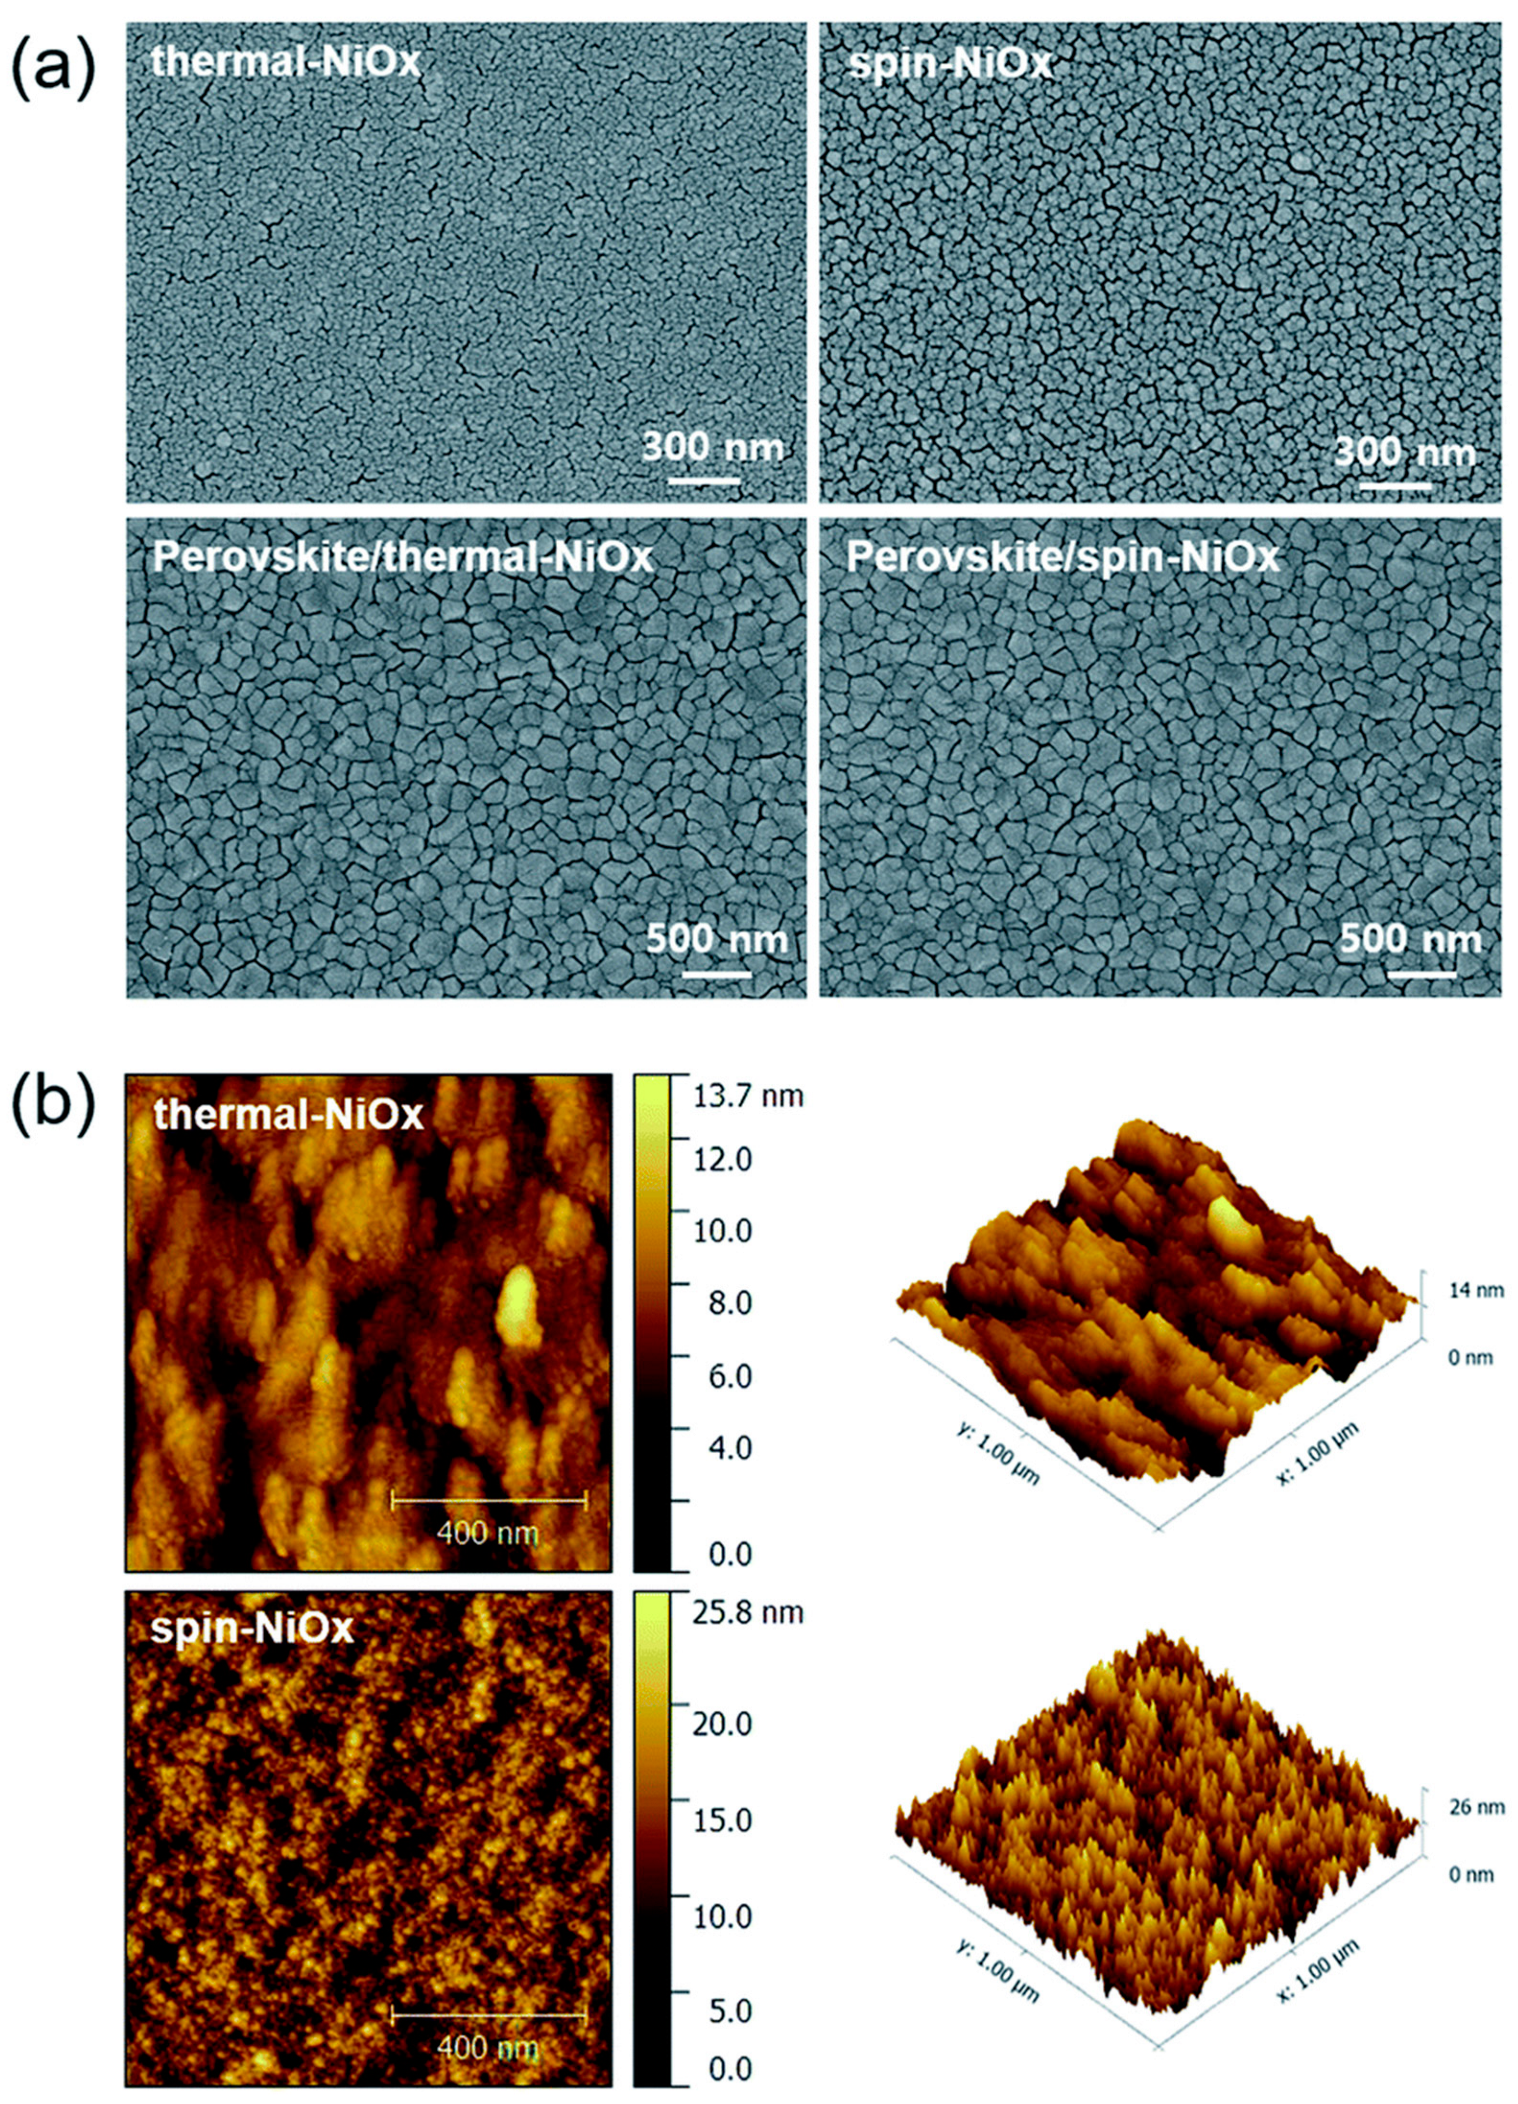
- Kim, S.-K.; Seok, H.-J.; Kim, D.-H.; Choi, D.-H.; Nam, S.-J.; Kim, S.-C.; Kim, H.-K. Comparison of NiO x thin film deposited by spin-coating or thermal evaporation for application as a hole transport layer of perovskite solar cells. RSC Adv. 2020, 10, 43847–43852. [Google Scholar] [CrossRef] [PubMed]
- Chtouki, T.; El Mrabet, M.; Tarbi, A.; Goncharova, I.; Erguig, H. Comprehensive review of the morphological, linear and nonlinear optical characterization of spin-coated NiO thin films for optoelectronic applications. Opt. Mater. 2021, 118, 111294. [Google Scholar] [CrossRef]
- Tang, X.; Yan, X. Dip-coating for fibrous materials: Mechanism, methods and applications. J. Sol-Gel Sci. Technol. 2016, 81, 378–404. [Google Scholar] [CrossRef]
- Kalangestani, F.C.; Simiari, M.; Ghodsi, F.E. Preparation and characterization of vanadium-doped nickel oxide nanostructure deposited by dip-coating technique. Eur. Phys. J. Plus 2021, 136, 517. [Google Scholar] [CrossRef]
- Reale, A.; LA Notte, L.; Salamandra, L.; Polino, G.; Susanna, G.; Brown, T.M.; Brunetti, F.; Di Carlo, A. Spray Coating for Polymer Solar Cells: An Up-to-Date Overview. Energy Technol. 2015, 3, 385–406. [Google Scholar] [CrossRef]
- Srikanth, A.; Basha, G.M.T.; Venkateshwarlu, B. A Brief Review on Cold Spray Coating Process. Mater. Today Proc. 2020, 22, 1390–1397. [Google Scholar] [CrossRef]
- Desai, J.D. Nickel oxide thin films by spray pyrolysis. J. Mater. Sci. Mater. Electron. 2016, 27, 12329–12334. [Google Scholar] [CrossRef]
- Desai, J.; Min, S.-K.; Jung, K.-D.; Joo, O.-S. Spray pyrolytic synthesis of large area NiOx thin films from aqueous nickel acetate solutions. Appl. Surf. Sci. 2006, 253, 1781–1786. [Google Scholar] [CrossRef]
- Calvert, P. Inkjet Printing for Materials and Devices. Chem. Mater. 2001, 13, 3299–3305. [Google Scholar] [CrossRef]
- Huang, C.-C.; Kao, Z.-K.; Liao, Y.-C. Flexible Miniaturized Nickel Oxide Thermistor Arrays via Inkjet Printing Technology. ACS Appl. Mater. Interfaces 2013, 5, 12954–12959. [Google Scholar] [CrossRef] [PubMed]
- Heinrich, C.A.; Candela, P.A. Fluids and ore formation in the Earth’s crust. In Treatise on Geochemistry, 2nd ed.; Elsevier: Amsterdam, The Netherlands, 2014; Volume 13, pp. 1–28. [Google Scholar]
- Gan, Y.X.; Jayatissa, A.H.; Yu, Z.; Chen, X.; Li, M. Hydrothermal Synthesis of Nanomaterials. J. Nanomater. 2020, 2020, 89170. [Google Scholar] [CrossRef]
- Rungchet, A.; Chindaprasirt, P.; Wansom, S.; Pimraksa, K. Hydrothermal synthesis of calcium sulfoaluminate–belite cement from industrial waste materials. J. Clean. Prod. 2016, 115, 273–283. [Google Scholar] [CrossRef]
- Tavakoli, A.; Sohrabi, M.; Kargari, A. A review of methods for synthesis of nanostructured metals with emphasis on iron compounds. Chem. Pap. 2007, 61, 151–170. [Google Scholar] [CrossRef]
- Nadimpalli, N.K.V.; Bandyopadhyaya, R.; Runkana, V. Thermodynamic analysis of hydrothermal synthesis of nanoparticles. Fluid Phase Equilibria 2018, 456, 33–45. [Google Scholar] [CrossRef]
- Wilson, M. The origin and formation of clay minerals in soils: Past, present and future perspectives. Clay Miner. 1999, 34, 7–25. [Google Scholar] [CrossRef]
- Wang, C.; Huang, W.; Wang, Y.; Cheng, Y.; Zou, B.; Fan, X.; Yang, J.; Cao, X. Synthesis of monodispersed La2Ce2O7 nanocrystals via hydrothermal method: A study of crystal growth and sintering behavior. Int. J. Refract. Met. Hard Mater. 2012, 31, 242–246. [Google Scholar] [CrossRef]
- Soa, W.-W.; Janga, J.-S.; Rheeb, Y.-W.; Kima, K.-J.; Moon, S.-J. Preparation of Nanosized Crystalline CdS Particles by the Hydrothermal Treatment. J. Colloid Interface Sci. 2001, 237, 136–141. [Google Scholar] [CrossRef] [PubMed]
- Tiwari, A.; Michalska-Domanska, M.; Dhoble, S.J. 10—Nanocomposite-based functional materials: Synthesis, properties, and applications. In Functional Materials from Carbon, Inorganic, and Organic Sources; Dhoble, S.J., Nande, A., Kalyani, N.T., Tiwari, A., Arof, A.K., Eds.; Woodhead Publishing: Cambridge, MA, USA, 2023; pp. 317–365. [Google Scholar]
- Erdem, S.; Erdem, B.; Öksüzoğlu, R.M.; Çıtak, A. Effect of calcination temperature on the structural and magnetic properties of Ni/SBA-15 nanocomposite. J. Porous Mater. 2015, 22, 689–698. [Google Scholar] [CrossRef]
- Mokoena, T.P.; Hillie, K.T.; Swart, H.C.; Leshabane, N.; Tshilongo, J.; Motaung, D.E. Fabrication of a propanol gas sensor using p-type nickel oxide nanostructures: The effect of ramping rate towards luminescence and gas sensing characteristics. Mater. Chem. Phys. 2020, 253, 123316. [Google Scholar] [CrossRef]
- Parashar, M.; Shukla, V.K.; Singh, R. Metal oxides nanoparticles via sol–gel method: A review on synthesis, characterization and applications. J. Mater. Sci. Mater. Electron. 2020, 31, 3729–3749. [Google Scholar] [CrossRef]
- Milea, C.; Bogatu, C.; Duta, A. The influence of parameters in silica sol-gel process. Bull. Transilv. Univ. Bras. 2011, 4, 53. [Google Scholar]
- Guastaferro, M.; Reverchon, E.; Baldino, L. Polysaccharide-based aerogel production for biomedical applications: A comparative review. Materials 2021, 14, 1631. [Google Scholar] [CrossRef]
- Niederberger, M. Nonaqueous Sol–Gel Routes to Metal Oxide Nanoparticles. Acc. Chem. Res. 2007, 40, 793–800. [Google Scholar] [CrossRef]
- Kakihana, M. Invited review “sol-gel” preparation of high temperature superconducting oxides. J. Sol-Gel Sci. Technol. 1996, 6, 7–55. [Google Scholar] [CrossRef]
- Vinogradov, A.V.; Vinogradov, V.V. Low-temperature sol–gel synthesis of crystalline materials. RSC Adv. 2014, 4, 45903–45919. [Google Scholar] [CrossRef]
- Sakka, S. History of ferroelectric materials prepared by sol-gel method. J. Sol-Gel Sci. Technol. 2022, 101, 140–175. [Google Scholar] [CrossRef]
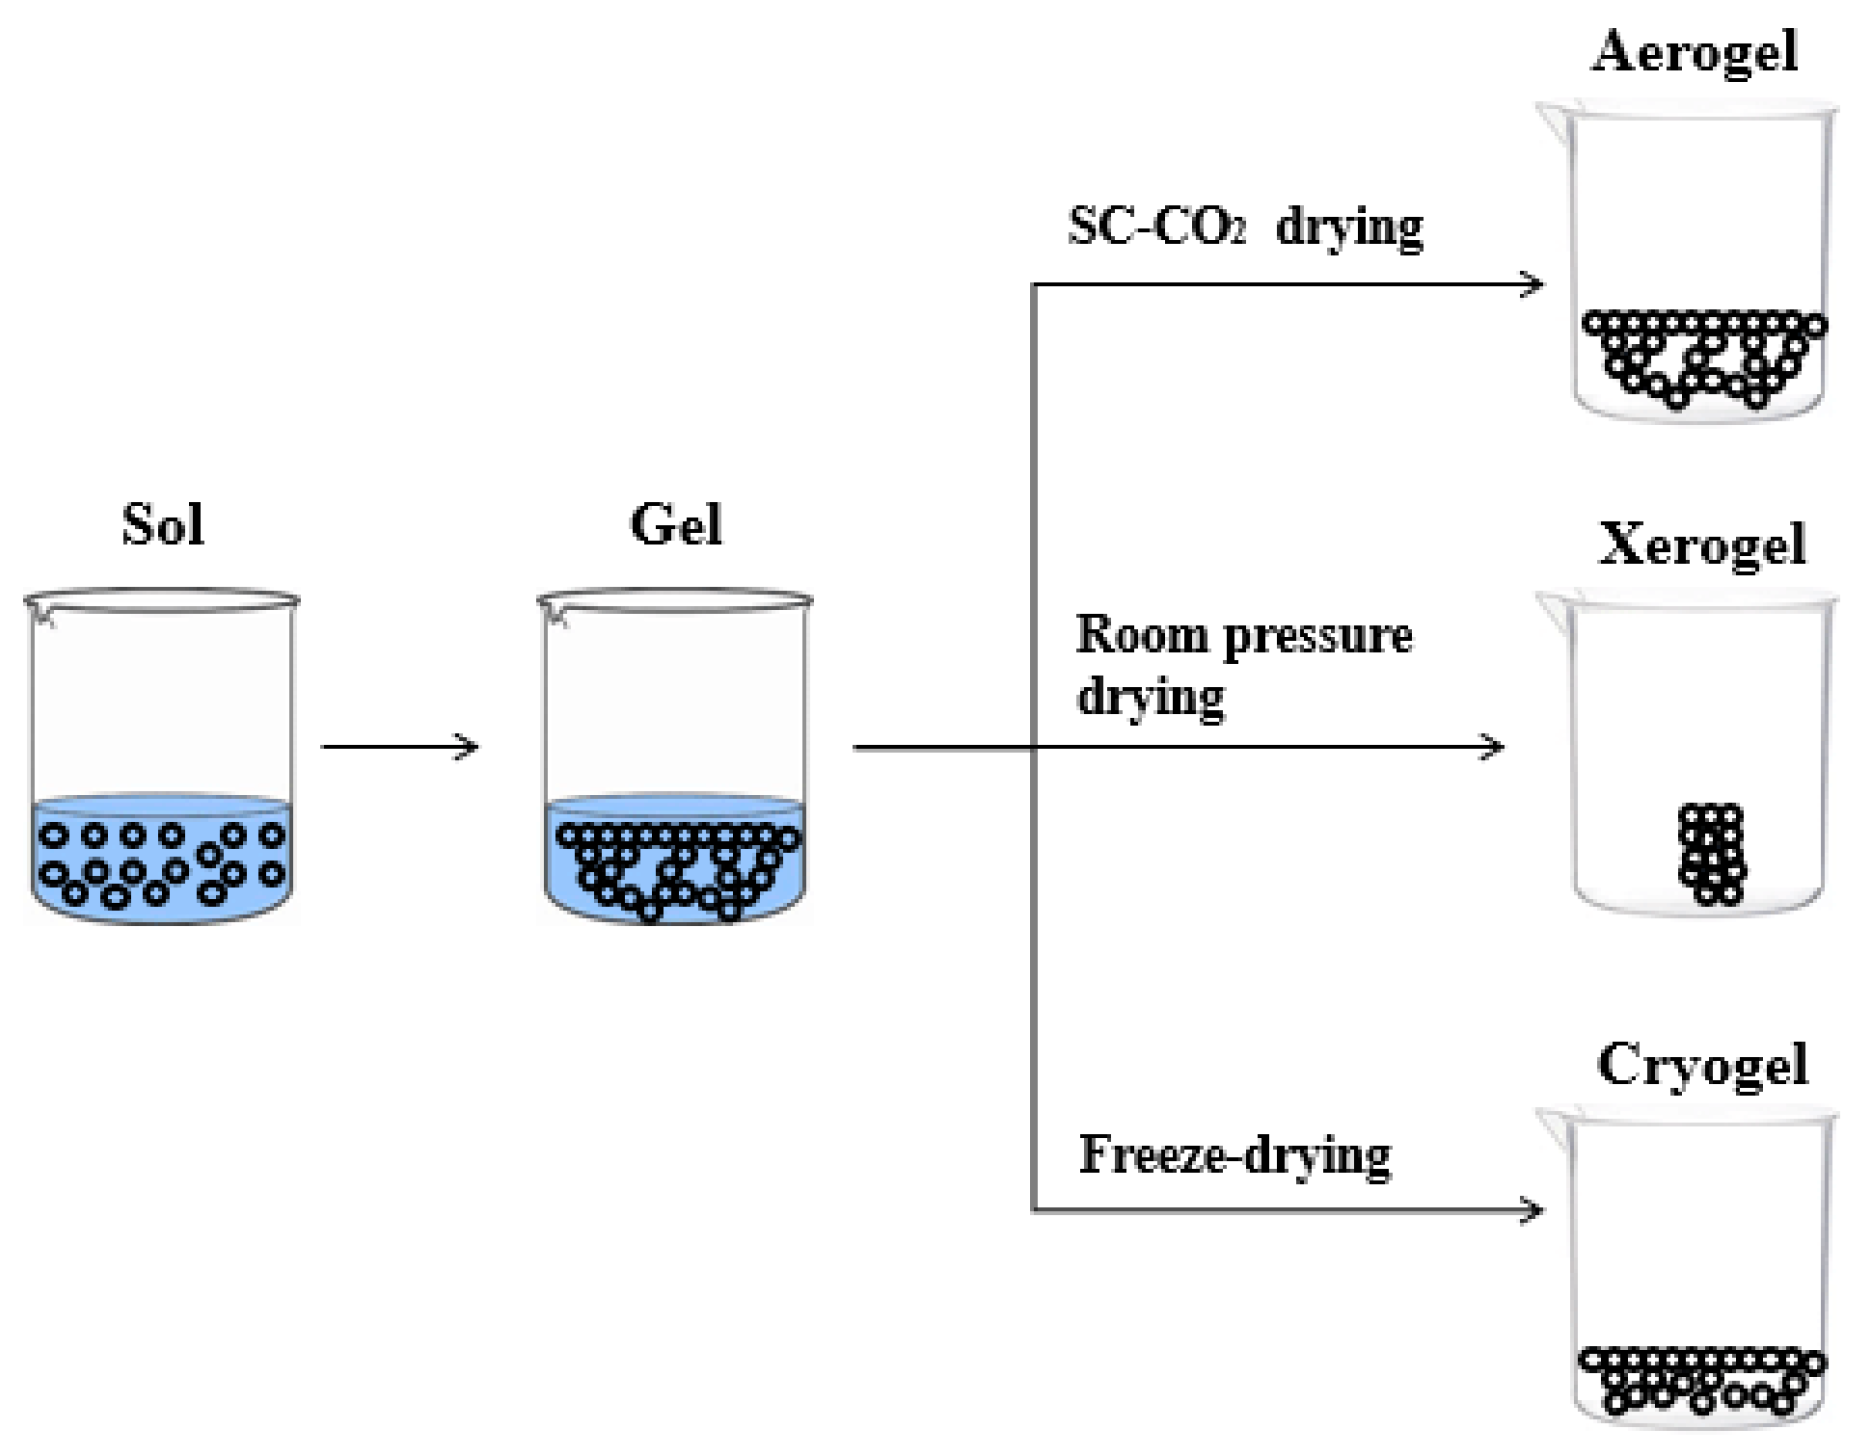
- Babaei, E.; Bazyari, A. Effects of drying conditions on physicochemical properties of epoxide sol−gel derived α-Fe2O3 and NiO: A comparison between xerogels and aerogels. Ceram. Int. 2022, 48, 33340–33349. [Google Scholar] [CrossRef]
- Li, Y.; He, X.; Cao, M. Micro-emulsion-assisted synthesis of ZnS nanospheres and their photocatalytic activity. Mater. Res. Bull. 2008, 43, 3100–3110. [Google Scholar] [CrossRef]
- Shi, W.; Lu, W.; Jiang, L. Fabrication of Amphiphilic Gold Nanoparticles of Well-Defined Size, High Concentration and Robust Colloidal Stability Fabrication of Amphiphilic Gold Nanoparticles of Well-Defined Size, High Concentration and Robust Colloidal Stability Fabrication of Amphiphilic Gold Nanoparticles of Well-Defined Size, High Concentration and Robust Colloidal Stability. J. Nanosci. Nanotechnol. 2009, 9, 5764–5769. [Google Scholar] [CrossRef] [PubMed]
- Rao, J.P.; Geckeler, K.E. Polymer nanoparticles: Preparation techniques and size-control parameters. Prog. Polym. Sci. 2011, 36, 887–913. [Google Scholar] [CrossRef]
- Jamil, S.; Janjua, M.R.S.A. Synthetic Study and Merits of Fe3O4 Nanoparticles as Emerging Material. J. Clust. Sci. 2017, 28, 2369–2400. [Google Scholar] [CrossRef]
- Wang, S.; Xin, X.; Zhang, H.; Shen, J.; Zheng, Y.; Song, Z.; Yang, Y. Stable monodisperse colloidal spherical gold nanoparticles formed by an imidazolium gemini surfactant-based water-in-oil microemulsion with excellent catalytic performance. RSC Adv. 2016, 6, 28156–28164. [Google Scholar] [CrossRef]
- Yu, X.M.; Meng, S.X.; Feng, Y.Q.; Liu, L.; Peng, X. TiO2 Particles with Controlled Size Prepared by a Simple Micro-Emulsion Method and their Application in the Dye-Senstitized Solar Cell. Adv. Mater. Res. 2012, 512, 214–218. [Google Scholar] [CrossRef]
- Entezari, M.H.; Ghows, N. Micro-emulsion under ultrasound facilitates the fast synthesis of quantum dots of CdS at low temperature. Ultrason. Sonochem. 2011, 18, 127–134. [Google Scholar] [CrossRef]
- Malik, M.A.; Wani, M.Y.; Hashim, M.A. Microemulsion method: A novel route to synthesize organic and inorganic nanomaterials. Arab. J. Chem. 2012, 5, 397–417. [Google Scholar] [CrossRef]
- Pei, L.; Wu, P.; Liu, J.; Wang, J. Effect of Nonionic Surfactant on the Micro-Emulsifying Water in Silicone Media. J. Surfactants Deterg. 2017, 20, 247–254. [Google Scholar] [CrossRef]
- Duan, S.; Tang, R.; Xue, Z.; Zhang, X.; Zhao, Y.; Zhang, W.; Zhang, J.; Wang, B.; Zen, S.; Sun, D. Effective removal of Pb(II) using magnetic Co0.6Fe2.4O4 micro-particles as the adsorbent: Synthesis and study on the kinetic and thermodynamic behaviors for its adsorption. Colloids Surf. A Physicochem. Eng. Asp. 2015, 469, 211–223. [Google Scholar] [CrossRef]
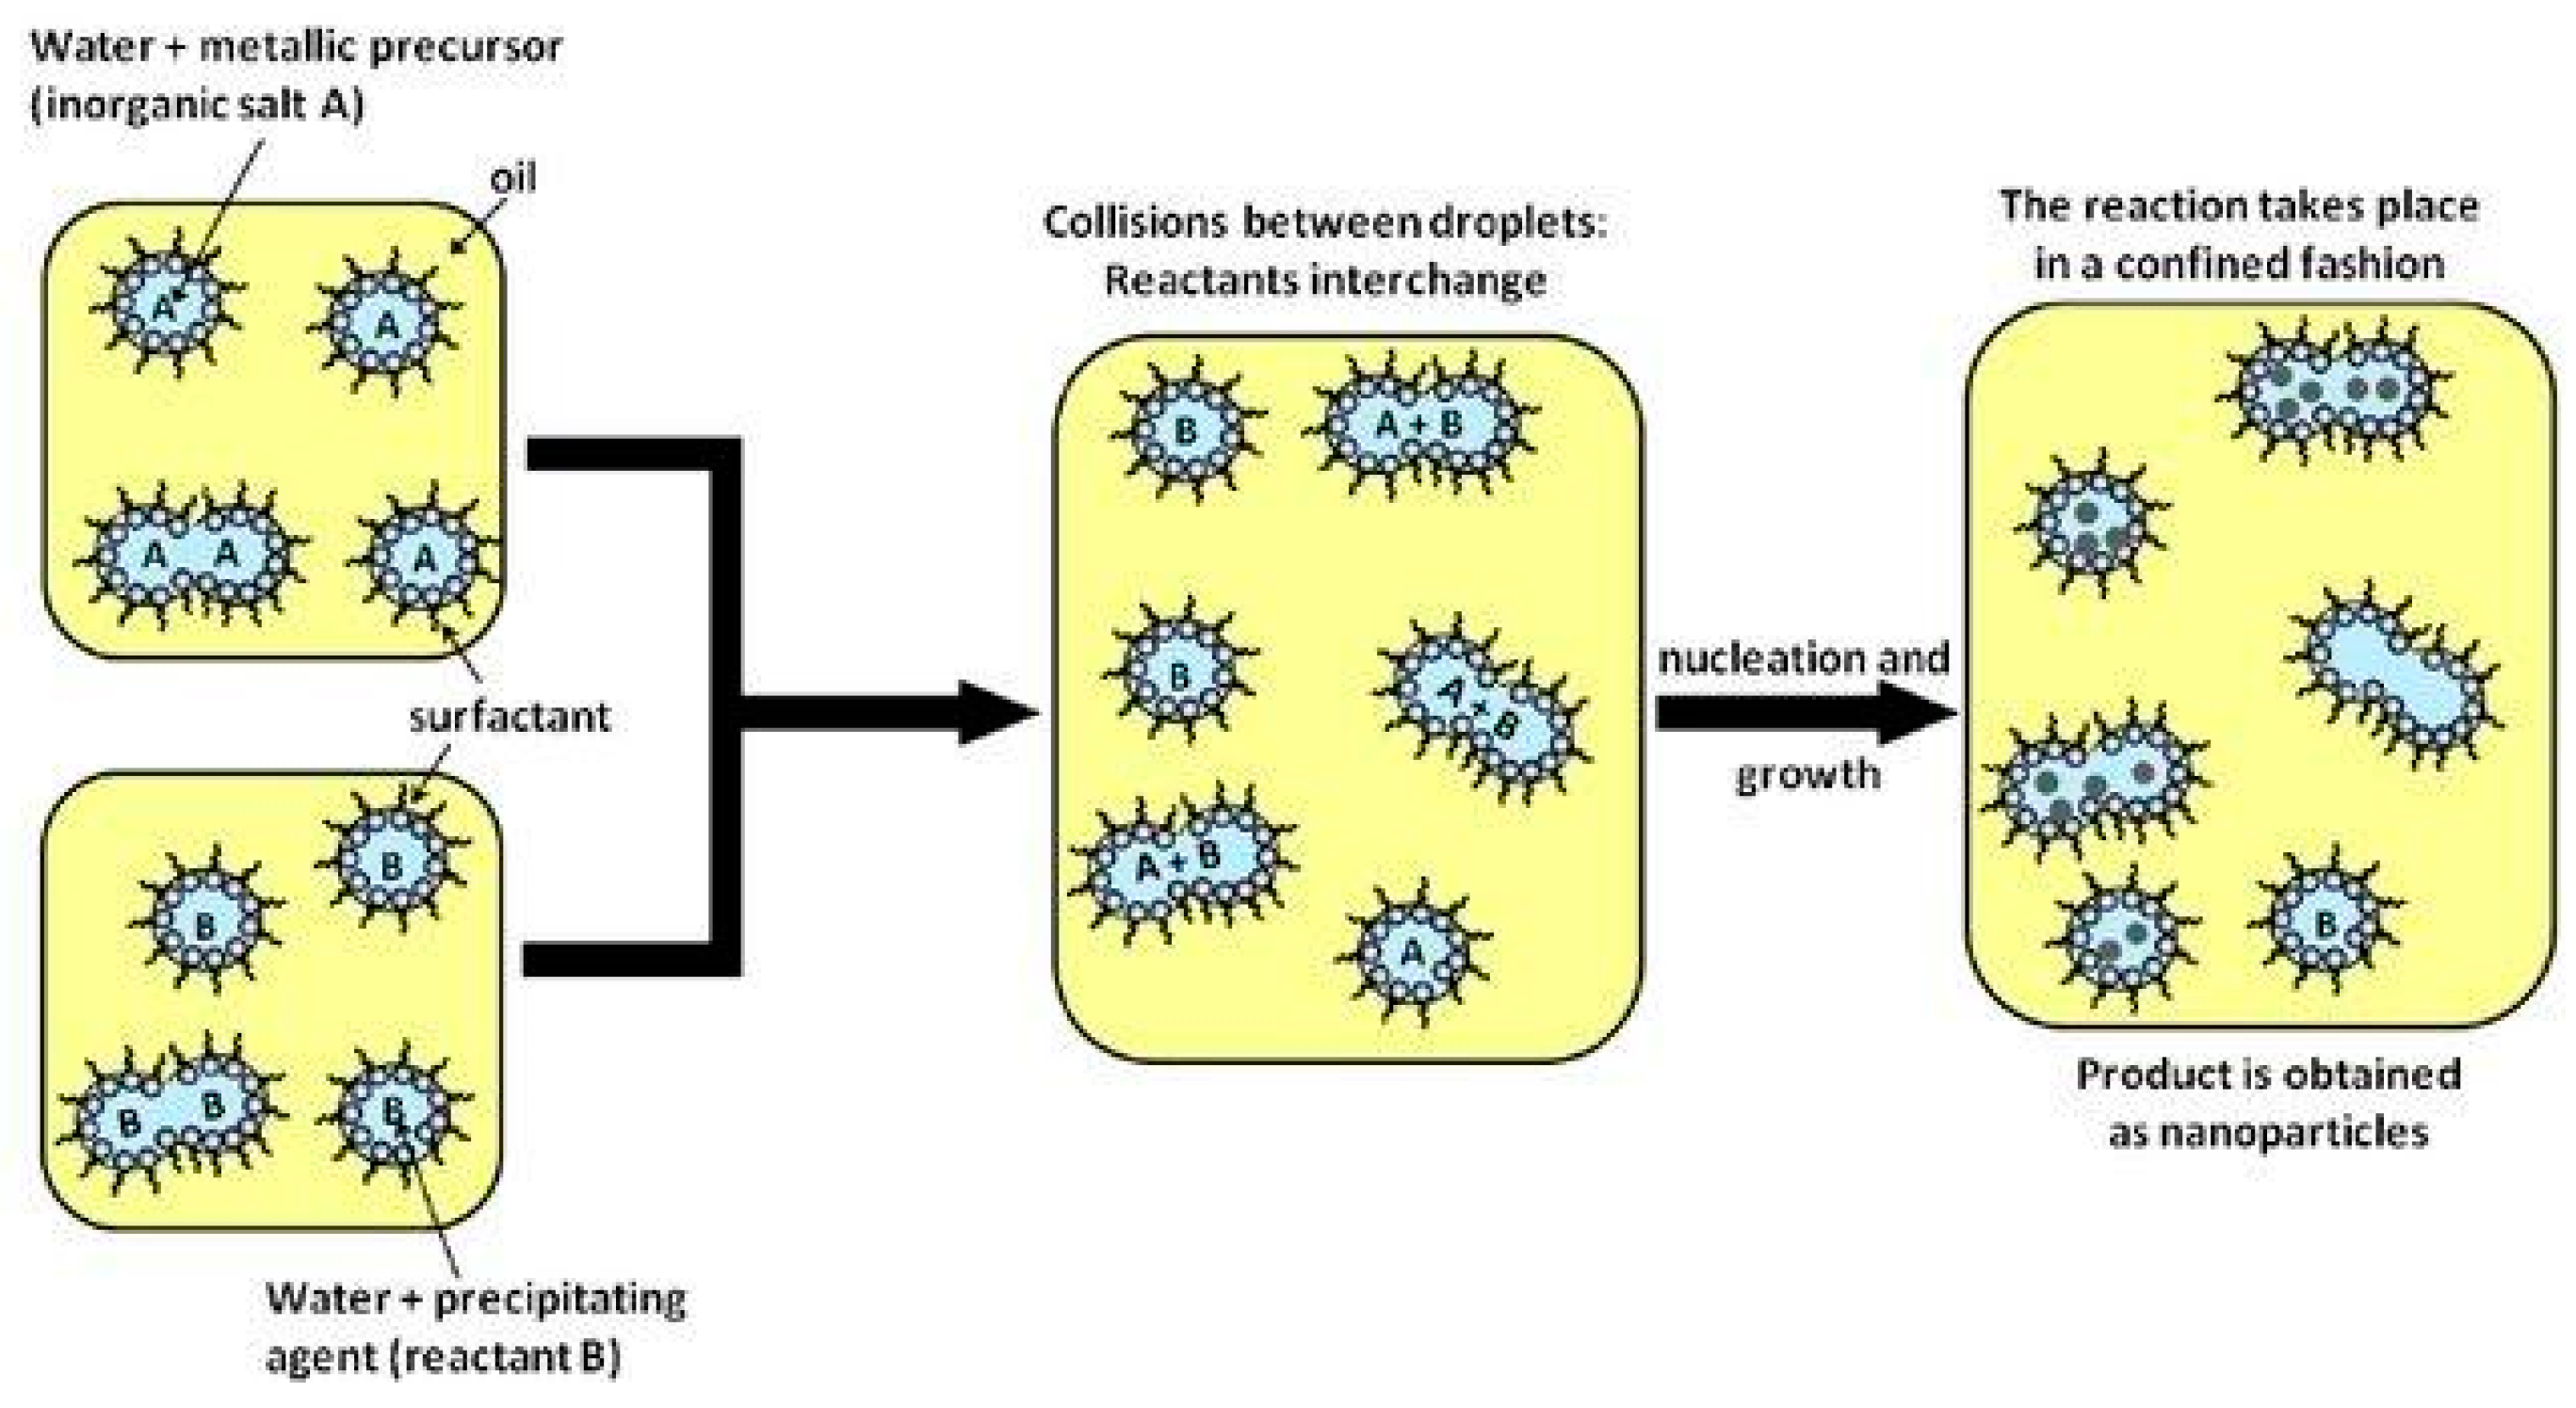
- Sanchez-Dominguez, M.; Aubery, C.; Solans, C. New trends on the synthesis of inorganic nanoparticles using microemulsions as confined reaction media. Smart Nanopart. Technol. 2012, 195–220. [Google Scholar]
- Elayampallayam, T. Studies on synthesis, structure and optical properties of nickel nanoparticles. J. Ovonic Res. Vol. 2012, 8, 47–51. [Google Scholar]
- Ahmad, T.; Ramanujachary, K.V.; Lofland, S.E.; Ganguli, A.K. Magnetic and electrochemical properties of nickel oxide nanoparticles obtained by the reverse-micellar route. Solid State Sci. 2006, 8, 425–430. [Google Scholar] [CrossRef]
- Akaltun, Y.; Çayır, T. Fabrication and characterization of NiO thin films prepared by SILAR method. J. Alloys Compd. 2015, 625, 144–148. [Google Scholar] [CrossRef]
- Das, M.R.; Roy, A.; Mpelane, S.; Mukherjee, A.; Mitra, P.; Das, S. Influence of dipping cycle on SILAR synthesized NiO thin film for improved electrochemical performance. Electrochim. Acta 2018, 273, 105–114. [Google Scholar] [CrossRef]
- Taşdemirci, T.Ç. Influence of annealing on properties of SILAR deposited nickel oxide films. Vacuum 2019, 167, 189–194. [Google Scholar] [CrossRef]
- Wang, X.; Wang, Y.; Tian, F.; Liang, H.; Kui, W.; Zhao, X.; Lu, Z.; Jiang, K.; Yang, L.; Lou, X. From the Surface Reaction Control to Gas-Diffusion Control: The Synthesis of Hierarchical Porous SnO2 Microspheres and Their Gas-Sensing Mechanism. J. Phys. Chem. C 2015, 119, 15963–15976. [Google Scholar] [CrossRef]
- Ji, H.; Zeng, W.; Li, Y. Gas sensing mechanisms of metal oxide semiconductors: A focus review. Nanoscale 2019, 11, 22664–22684. [Google Scholar] [CrossRef]
- Shailja; Singh, K.J.; Singh, R.C. Highly sensitive and selective ethanol gas sensor based on Ga-doped NiO nanoparticles. J. Mater. Sci. Mater. Electron. 2021, 32, 11274–11290. [Google Scholar] [CrossRef]
- Nakate, U.T.; Ahmad, R.; Patil, P.; Yu, Y.; Hahn, Y.-B. Ultra thin NiO nanosheets for high performance hydrogen gas sensor device. Appl. Surf. Sci. 2019, 506, 144971. [Google Scholar] [CrossRef]
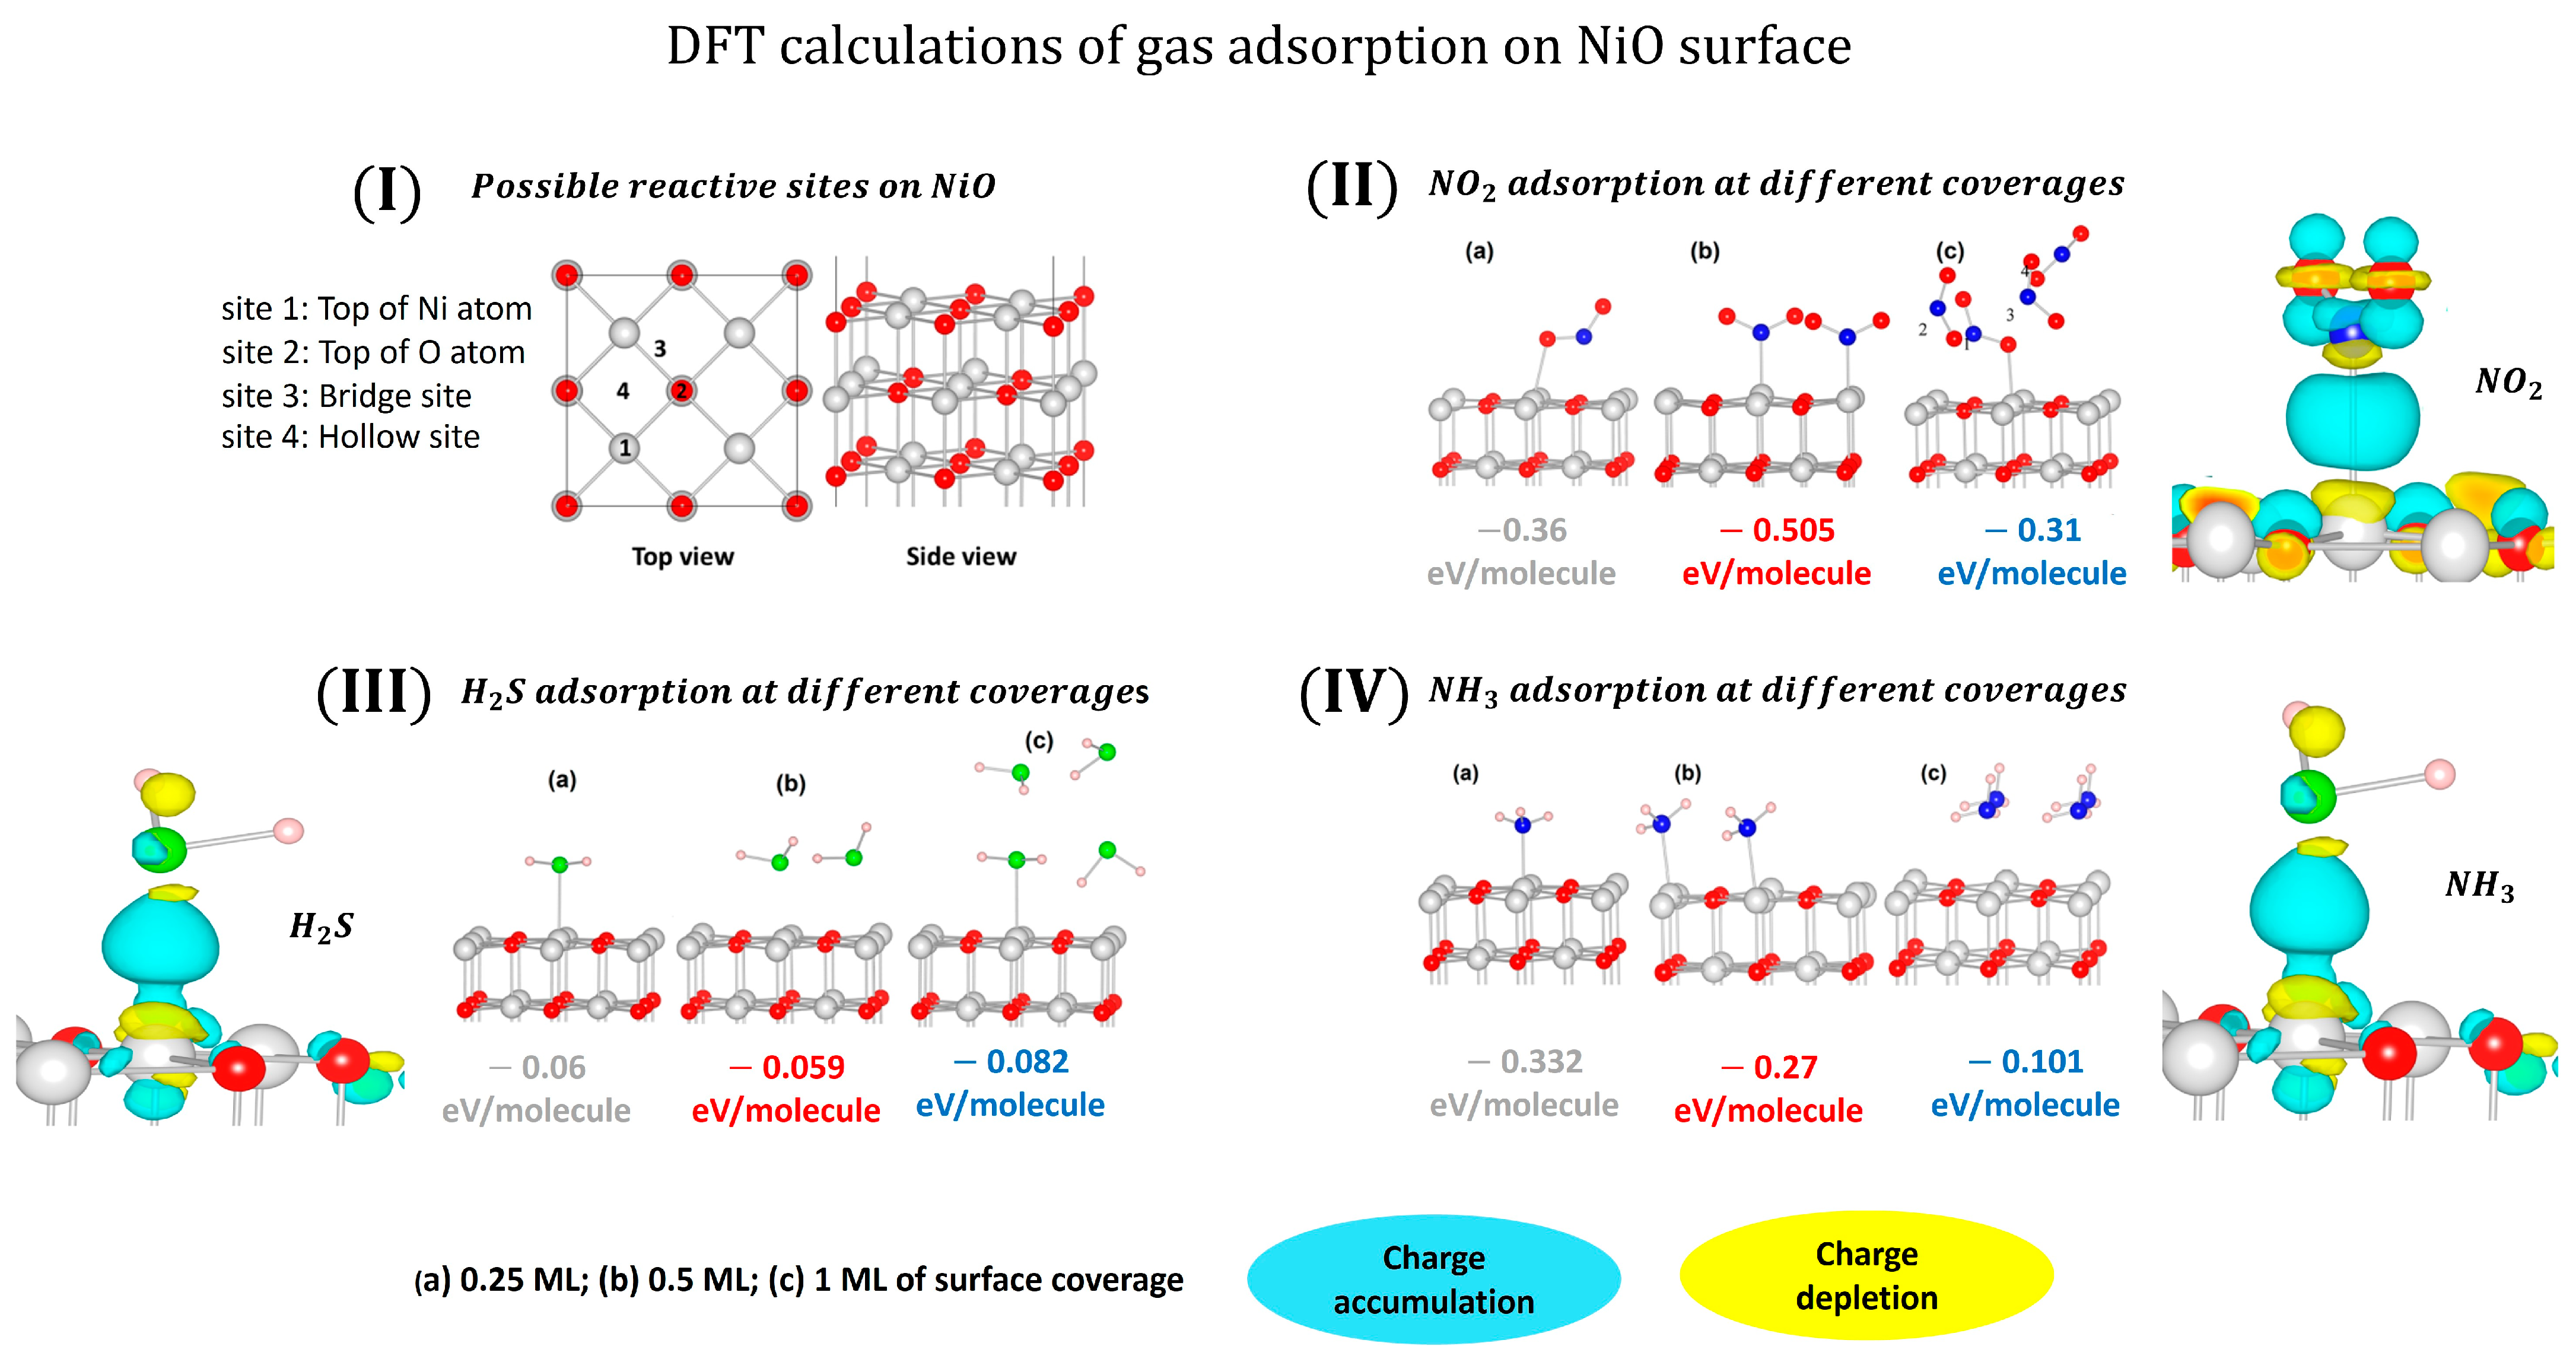
- Wang, B.; Nisar, J.; Ahuja, R. Molecular Simulation for Gas Adsorption at NiO (100) Surface. ACS Appl. Mater. Interfaces 2012, 4, 5691–5697. [Google Scholar] [CrossRef] [PubMed]
- Gomaa, M.; Sayed, M.; Patil, V.; Boshta, M.; Patil, P. Gas sensing performance of sprayed NiO thin films toward NO2 gas. J. Alloys Compd. 2021, 885, 160908. [Google Scholar] [CrossRef]
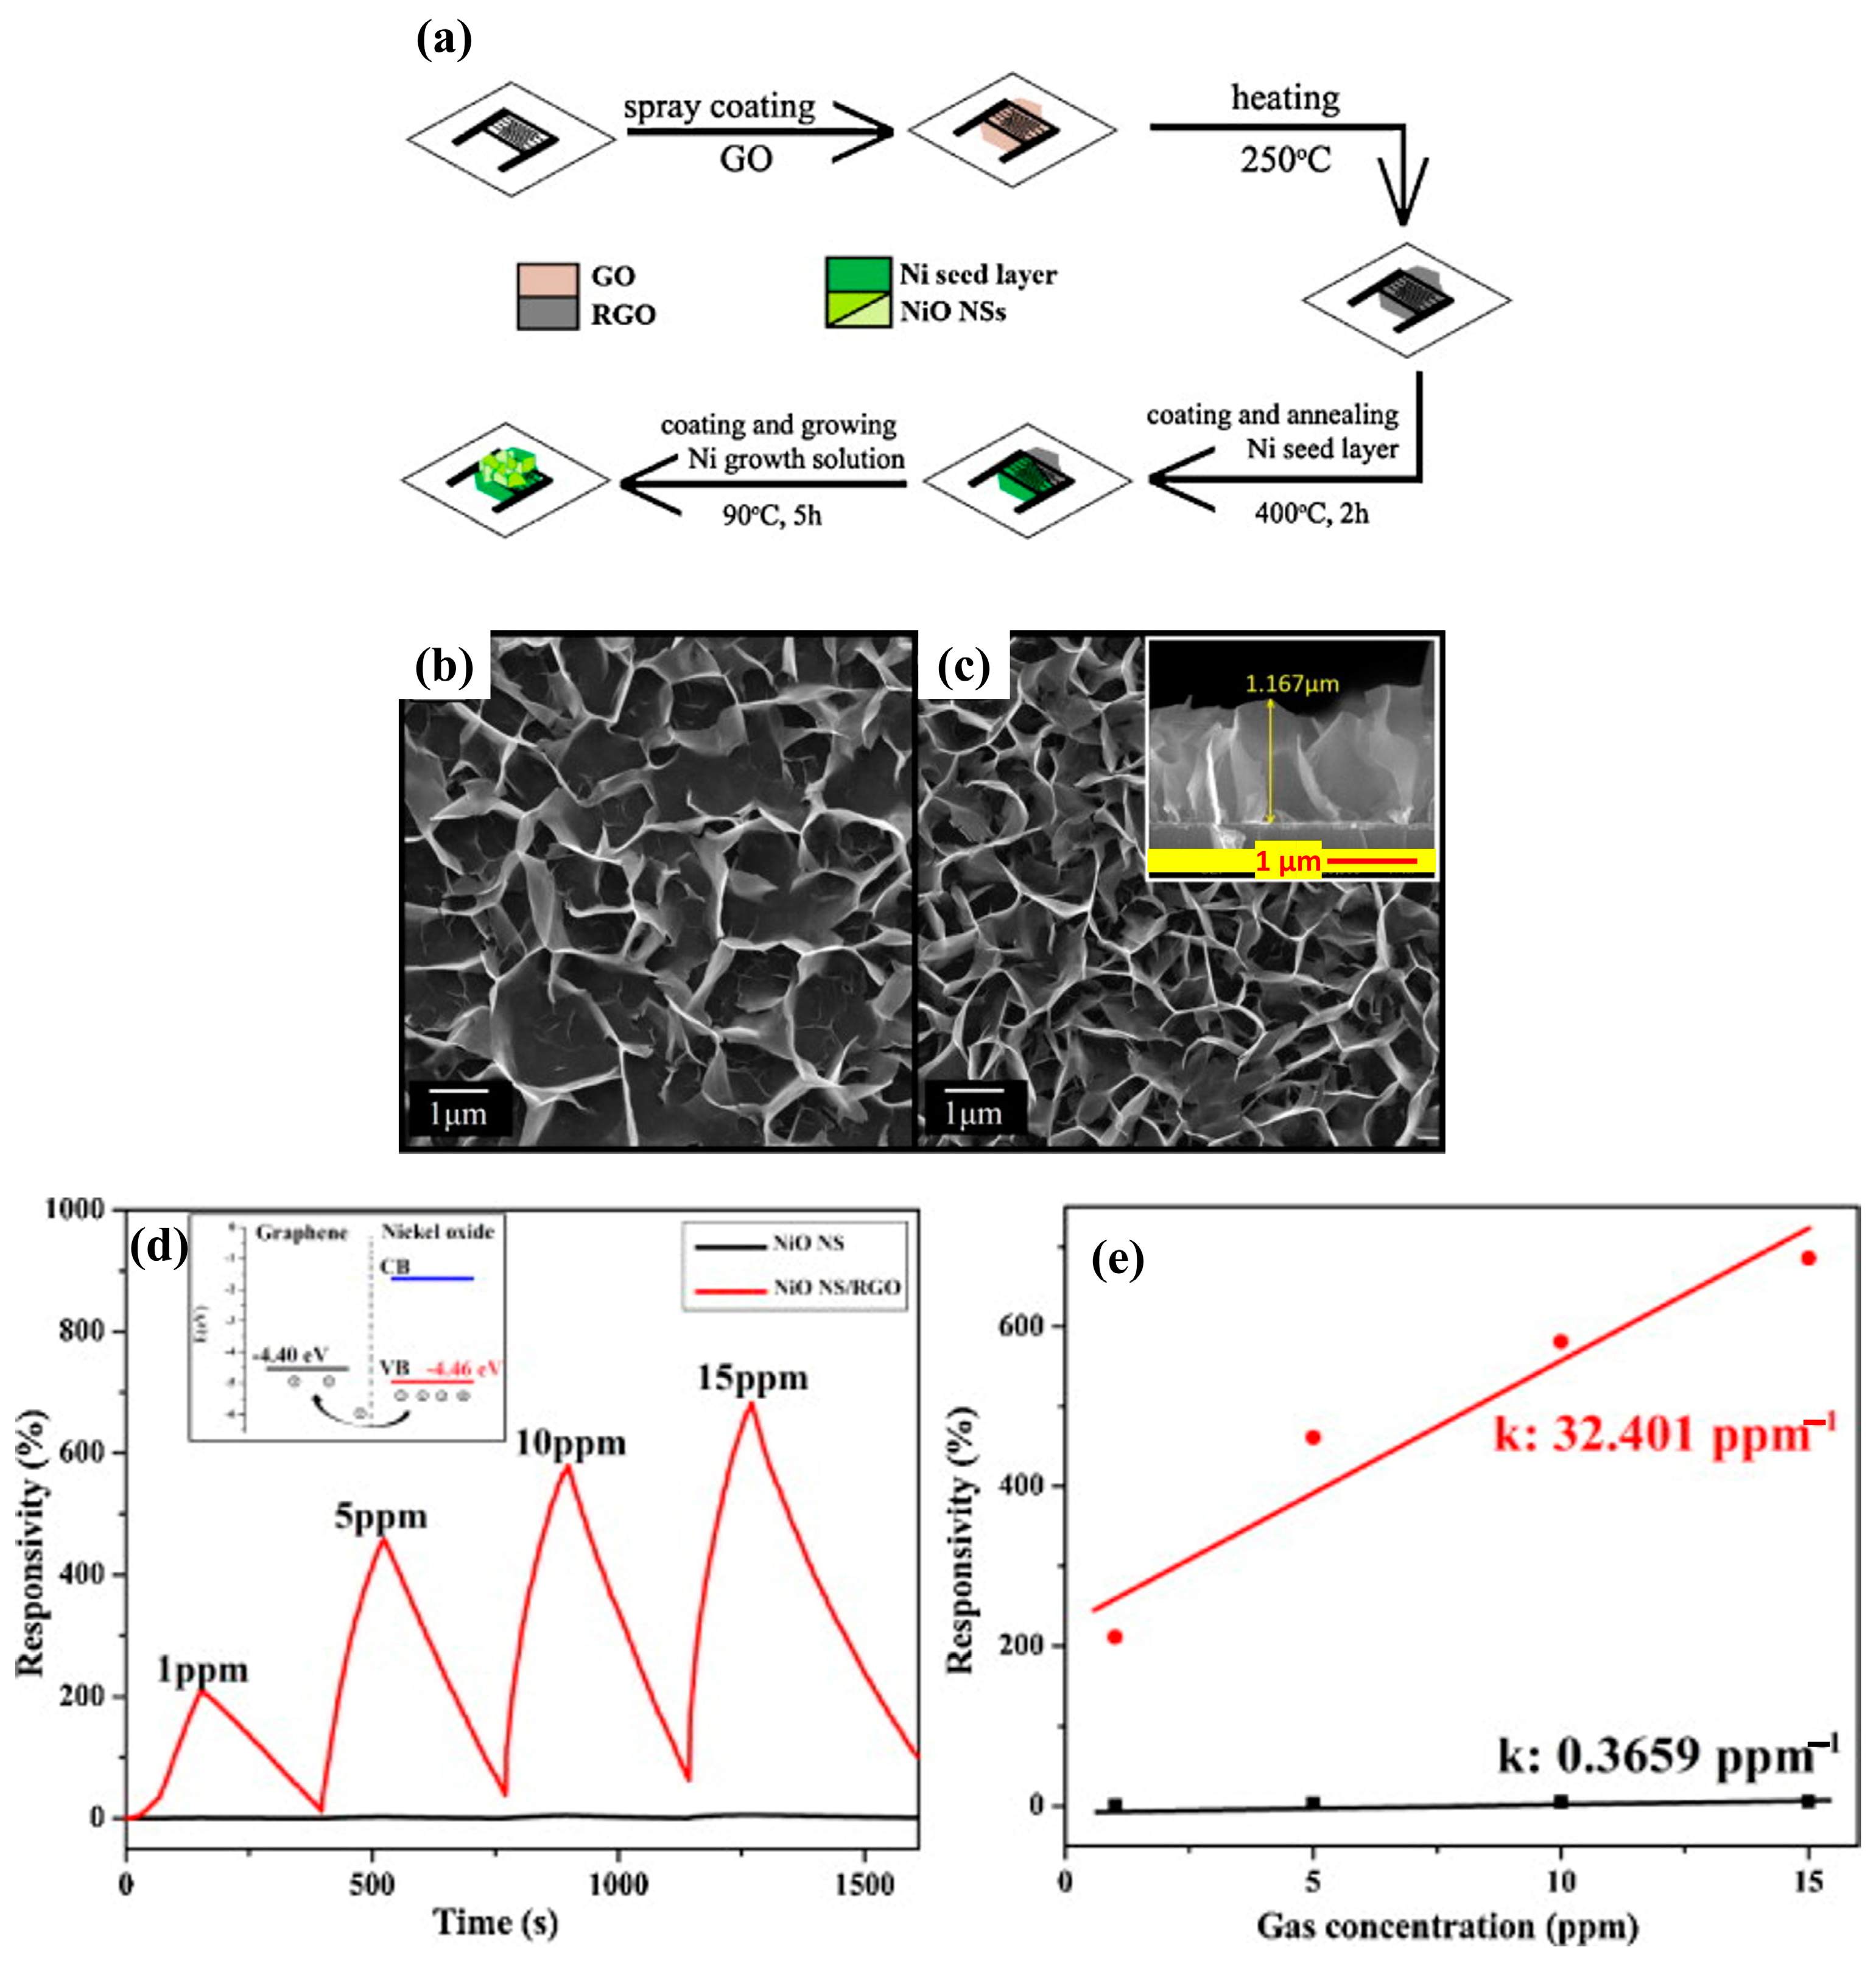
- Zhang, J.; Zeng, D.; Zhao, S.; Wu, J.; Xu, K.; Zhu, Q.; Zhang, G.; Xie, C. Room temperature NO2 sensing: What advantage does the rGO–NiO nanocomposite have over pristine NiO? Phys. Chem. Chem. Phys. 2015, 17, 14903–14911. [Google Scholar] [CrossRef] [PubMed]
- Kampitakis, V.; Gagaoudakis, E.; Zappa, D.; Comini, E.; Aperathitis, E.; Kostopoulos, A.; Kiriakidis, G.; Binas, V. Highly sensitive and selective NO2 chemical sensors based on Al doped NiO thin films. Mater. Sci. Semicond. Process. 2020, 115, 105149. [Google Scholar] [CrossRef]
- Zhang, J.; Zeng, D.; Zhu, Q.; Wu, J.; Huang, Q.; Xie, C. Effect of Nickel Vacancies on the Room-Temperature NO2 Sensing Properties of Mesoporous NiO Nanosheets. J. Phys. Chem. C 2016, 120, 3936–3945. [Google Scholar] [CrossRef]
- Haunsbhavi, K.; Kumar, K.D.A.; Mele, P.; Aldossary, O.M.; Ubaidullah, M.; Mahesh, H.M.; Murahari, P.; Angadi, B. Pseudo n-type behaviour of nickel oxide thin film at room temperature towards ammonia sensing. Ceram. Int. 2021, 47, 13693–13703. [Google Scholar] [CrossRef]
- Mokoena, T.P.; Tshabalala, Z.P.; Hillie, K.T.; Swart, H.C.; Motaung, D.E. The blue luminescence of p-type NiO nanostructured material induced by defects: H2S gas sensing characteristics at a relatively low operating temperature. Appl. Surf. Sci. 2020, 525, 146002. [Google Scholar] [CrossRef]
- Lu, Y.; Ma, Y.H.; Ma, S.Y.; Jin, W.X.; Yan, S.H.; Xu, X.L.; Chen, Q. Curly porous NiO nanosheets with enhanced gas-sensing properties. Mater. Lett. 2017, 190, 252–255. [Google Scholar] [CrossRef]
- Mokoena, T.P.; Swart, H.C.; Hillie, K.T.; Tshabalala, Z.P.; Jozela, M.; Tshilongo, J.; Motaung, D.E. Enhanced propanol gas sensing performance of p-type NiO gas sensor induced by exceptionally large surface area and crystallinity. Appl. Surf. Sci. 2021, 571, 151121. [Google Scholar] [CrossRef]
- Nie, C.; Zeng, W.; Li, Y. The 3D crystal morphologies of NiO gas sensor and constantly improved sensing properties to ethanol. J. Mater. Sci. Mater. Electron. 2018, 30, 1794–1802. [Google Scholar] [CrossRef]
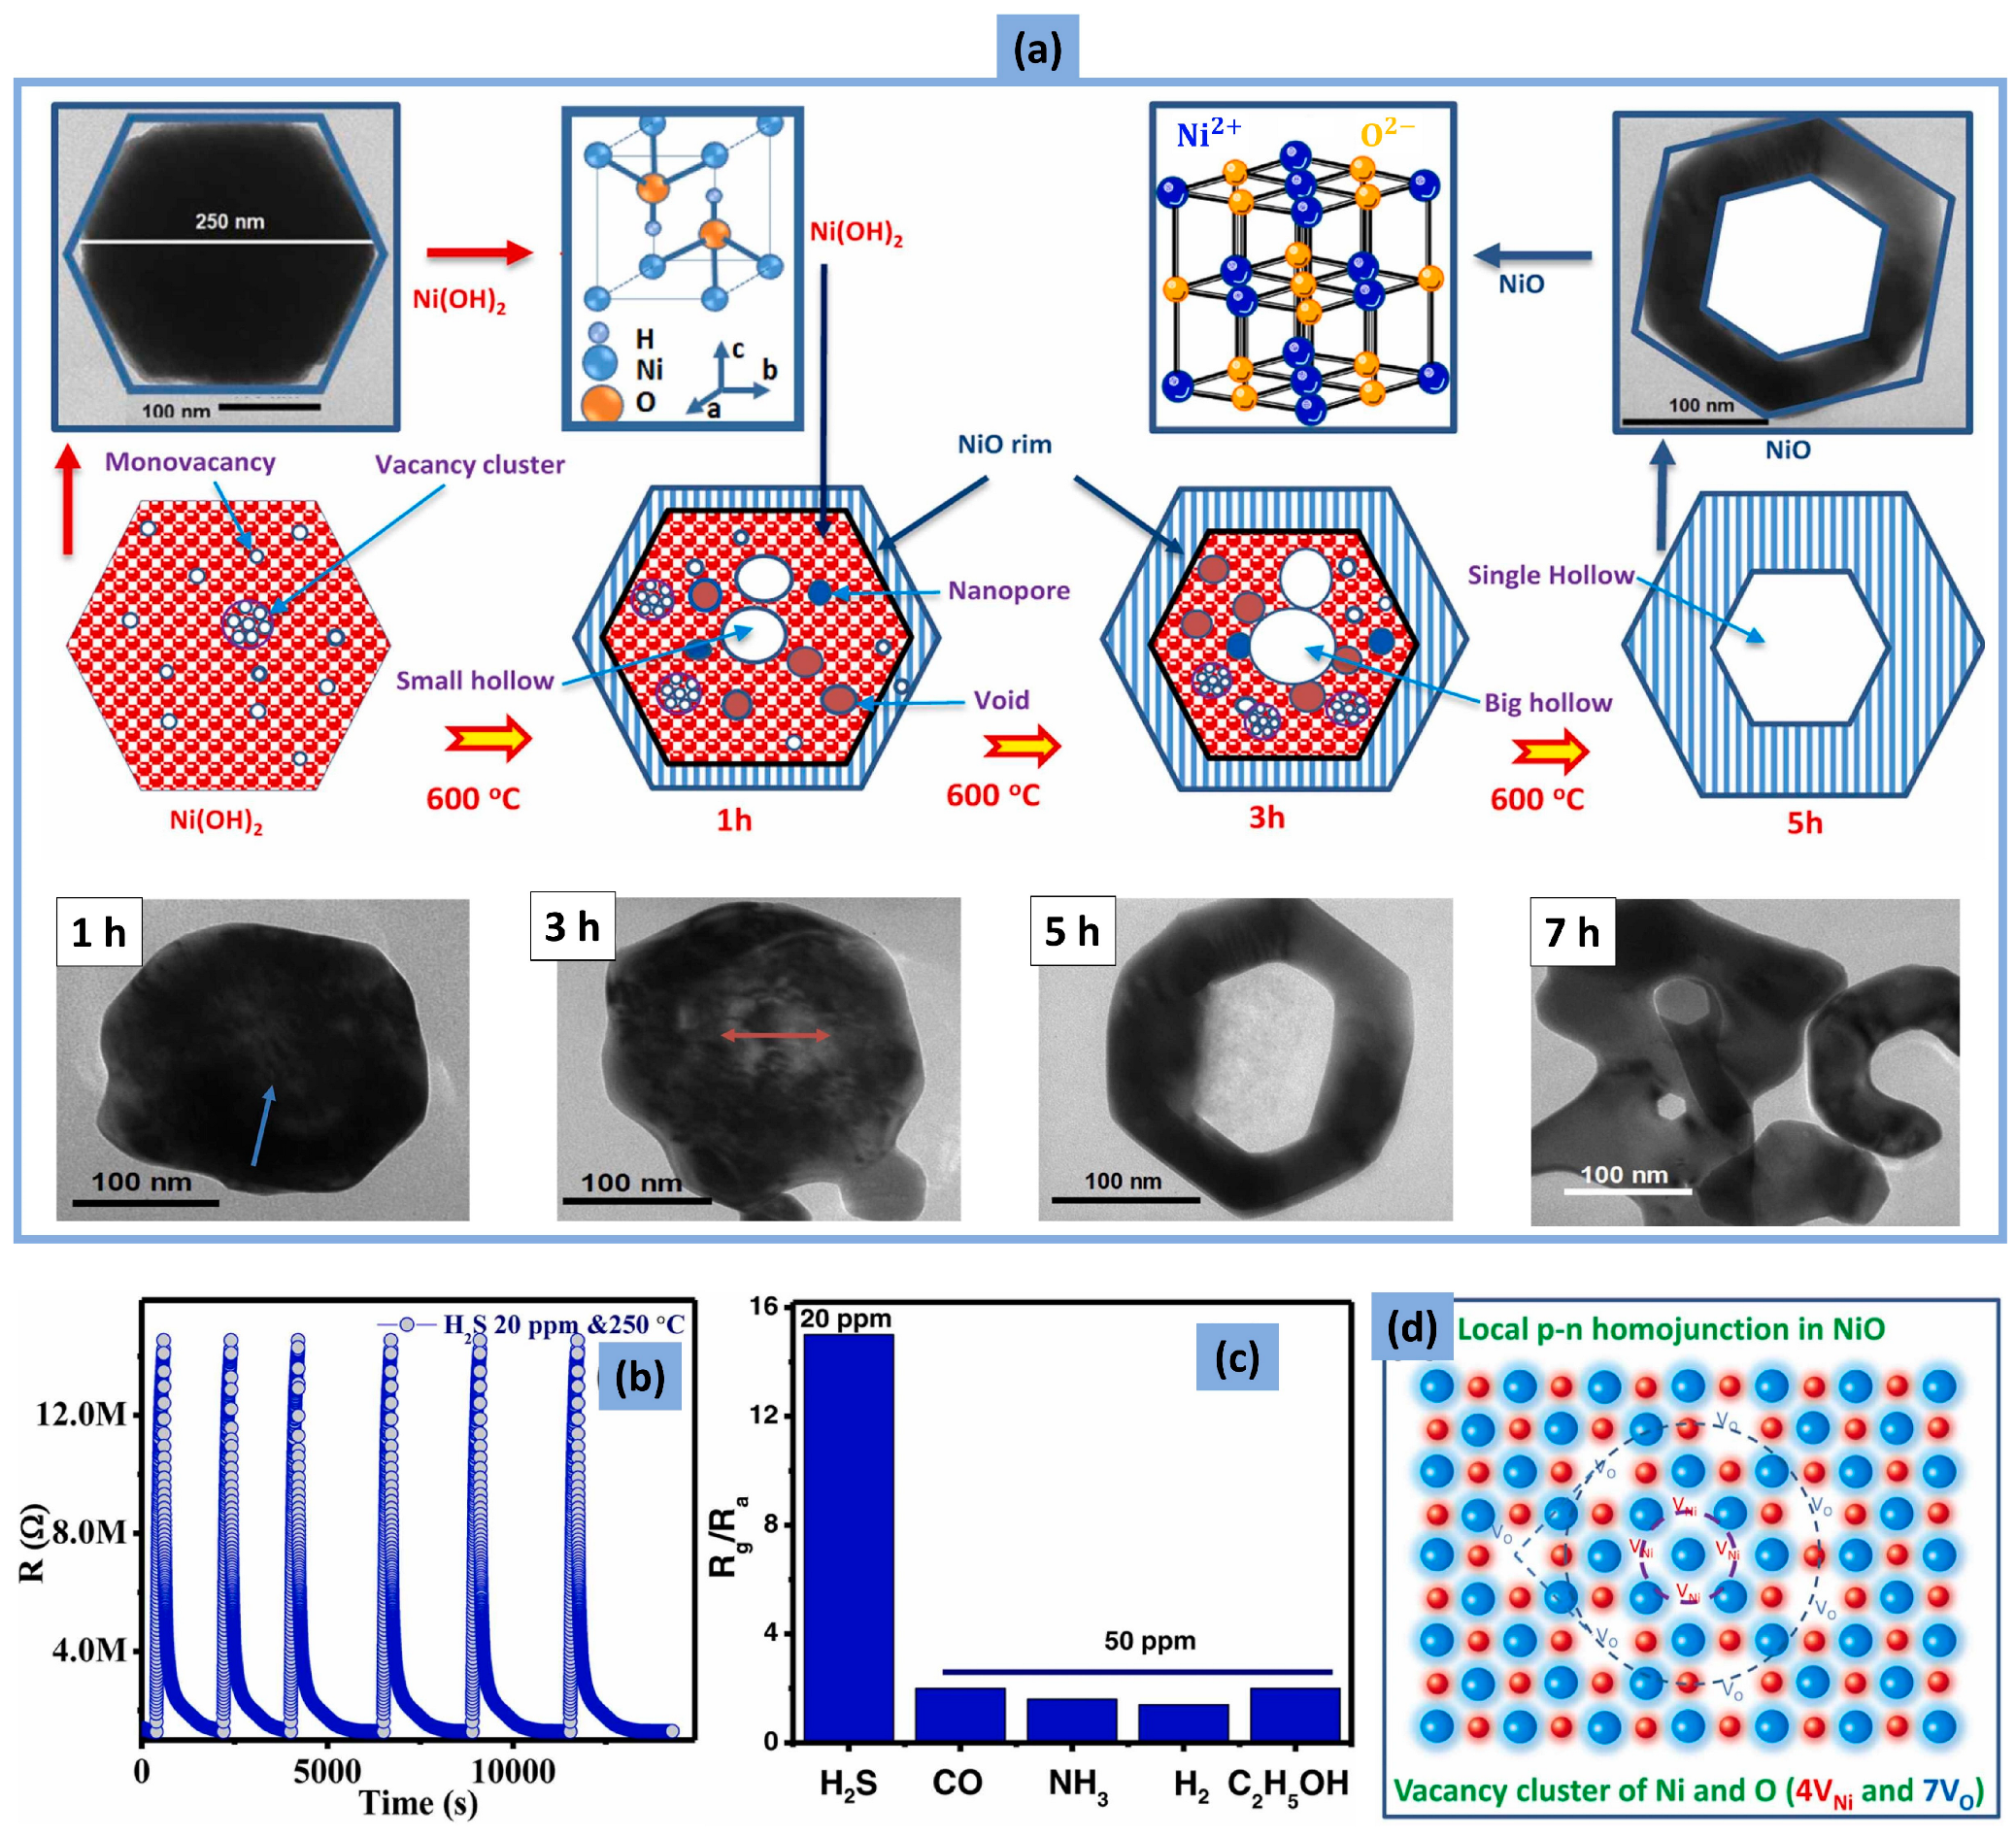
- Dang, T.K.; Cuong, N.D.; Sinh, V.H.; Long, H.T.; Hieu, L.T.; Thy, P.N.A.; Quang, D.T.; Son, L.T.; Phuc, P.T.; Hue, P.T.; et al. Hexagonal annular-NiO nanoarchitecture with local p-n homojunctions: Novel formation mechanism and H2S gas sensing properties. J. Alloys Compd. 2023, 933, 167782. [Google Scholar] [CrossRef]
- Zhou, Q.; Lu, Z.; Wei, Z.; Xu, L.; Gui, Y.; Chen, W. Hydrothermal Synthesis of Hierarchical Ultrathin NiO Nanoflakes for High-Performance CH4 Sensing. Front. Chem. 2018, 6, 194. [Google Scholar] [CrossRef] [PubMed]
- Haidry, A.A.; Yucheng, W.; Fatima, Q.; Raza, A.; Zhong, L.; Chen, H.; Mandebvu, C.R.; Ghani, F. Synthesis and characterization of TiO2 nanomaterials for sensing environmental volatile compounds (VOCs): A review. Trends Anal. Chem. 2024, 170, 117454. [Google Scholar] [CrossRef]
- Dang, T.T.L.; Tonezzer, M.; Nguyen, V.H. Hydrothermal growth and hydrogen selective sensing of nickel oxide nanowires. J. Nanomater. 2015, 2015, 6. [Google Scholar] [CrossRef]
- Lin, L.; Liu, T.; Miao, B.; Zeng, W. Synthesis of NiO nanostructures from 1D to 3D and researches of their gas-sensing properties. Mater. Res. Bull. 2013, 48, 449–454. [Google Scholar] [CrossRef]
- Dhas, S.D.; Maldar, P.S.; Patil, M.D.; Waikar, M.R.; Sonkawade, R.G.; Moholkar, A.V. Sol-gel synthesized nickel oxide nanostructures on nickel foam and nickel mesh for a targeted energy storage application. J. Energy Storage 2021, 47, 103658. [Google Scholar] [CrossRef]
- Zhao, S.; Shen, Y.; Zhou, P.; Zhang, J.; Zhang, W.; Chen, X.; Wei, D.; Fang, P.; Shen, Y. Highly selective NO2 sensor based on p-type nanocrystalline NiO thin films prepared by sol–gel dip coating. Ceram. Int. 2018, 44, 753–759. [Google Scholar] [CrossRef]
- Yuan, C.; Li, H.; Xie, L.; Wang, F.; Deng, H.; Chang, F.; Sun, Y. Flower-like NiO nanostructures synthesized by electrodeposition method for efficient detection of toluene gas. RSC Adv. 2015, 5, 92128–92133. [Google Scholar] [CrossRef]
- Zhang, Y.; Xie, L.-Z.; Li, H.-R.; Wang, P.; Liu, S.; Peng, Y.-Q.; Zhang, M. Facile Synthesis of Rose-Like NiO Nanoparticles and Their Ethanol Gas-Sensing Property. Chin. Phys. Lett. 2015, 32, 098103. [Google Scholar] [CrossRef]
- Pai, S.H.S.; Mondal, A.; Barathy T, R.; Ajitha, B.; Samuel E, J.J.; Reddy, Y.A.K. Effect of calcination temperature on NiO for hydrogen gas sensor performance. Int. J. Hydrogen Energy 2024, 50, 928–941. [Google Scholar] [CrossRef]
- Song, Z.; Zhang, L.; Zhou, Q.; Zhang, Z.; Dong, Z.; Nie, L.; Liu, Q.; Pan, G. In-situ synthesis of needle-like PdO-decorated NiO thin films on Al2O3 substrates for high-performance H2 sensors. Ceram. Int. 2022, 48, 31746–31754. [Google Scholar] [CrossRef]
- Wang, C.; Cui, X.; Liu, J.; Zhou, X.; Cheng, X.; Sun, P.; Hu, X.; Li, X.; Zheng, J.; Lu, G. Design of Superior Ethanol Gas Sensor Based on Al-Doped NiO Nanorod-Flowers. ACS Sens. 2016, 1, 131–136. [Google Scholar] [CrossRef]
- Kaur, N.; Zappa, D.; Comini, E. Shelf Life Study of NiO Nanowire Sensors for NO2 Detection. Electron. Mater. Lett. 2019, 15, 743–749. [Google Scholar] [CrossRef]
- Kaur, N.; Zappa, D.; Ferroni, M.; Poli, N.; Campanini, M.; Negrea, R.; Comini, E. Branch-like NiO/ZnO heterostructures for VOC sensing. Sens. Actuators B Chem. 2018, 262, 477–485. [Google Scholar] [CrossRef]
- Kaur, N.; Comini, E.; Poli, N.; Zappa, D.; Sberveglieri, G. NiO/ZnO Nanowire-heterostructures by Vapor Phase Growth for Gas Sensing. Procedia Eng. 2016, 168, 1140–1143. [Google Scholar] [CrossRef]
- San, X.; Li, M.; Liu, D.; Wang, G.; Shen, Y.; Meng, D.; Meng, F. A facile one-step hydrothermal synthesis of NiO/ZnO heterojunction microflowers for the enhanced formaldehyde sensing properties. J. Alloys Compd. 2018, 739, 260–269. [Google Scholar] [CrossRef]
- Ao, D.; Li, Z.; Fu, Y.; Tang, Y.; Yan, S.; Zu, X. Heterostructured NiO/ZnO Nanorod Arrays with Significantly Enhanced H2S Sensing Performance. Nanomaterials 2019, 9, 900. Available online: https://www.mdpi.com/2079-4991/9/6/900 (accessed on 20 June 2023). [CrossRef]
- Zhou, W.-D.; Dastan, D.; Li, J.; Yin, X.-T.; Wang, Q. Discriminable sensing response behavior to homogeneous gases based on n-ZnO/p-NiO composites. Nanomaterials 2020, 10, 785. [Google Scholar] [CrossRef]
- Liang, Y.-C.; Chang, Y.-C. The effect of Ni content on gas-sensing behaviors of ZnO–NiO p–n composite thin films grown through radio-frequency cosputtering of ceramic ZnO and NiO targets. CrystEngComm 2020, 22, 2315–2326. [Google Scholar] [CrossRef]
- Zhao, S.; Shen, Y.; Xia, Y.; Pan, A.; Zhou, L.; Carraro, C.; Maboudian, R. Synthesis and gas sensing properties of NiO/ZnO heterostructured nanowires. J. Alloys Compd. 2021, 877, 160189. [Google Scholar] [CrossRef]
- Lu, Y.; Ma, Y.; Ma, S.; Yan, S. Hierarchical heterostructure of porous NiO nanosheets on flower-like ZnO assembled by hexagonal nanorods for high-performance gas sensor. Ceram. Int. 2017, 43, 7508–7515. [Google Scholar] [CrossRef]
- Wei, Z.; Zhou, Q.; Wang, J.; Lu, Z.; Xu, L.; Zeng, W. Hydrothermal Synthesis of SnO2 Nanoneedle-Anchored NiO Microsphere and its Gas Sensing Performances. Nanomaterials 2019, 9, 1015. [Google Scholar] [CrossRef] [PubMed]
- Mangalam, S.K.; Jose, A.S.; K., P.; Chowdhury, P.; Barshilia, H.C. Sputter deposited p-NiO/n-SnO2 porous thin film heterojunction based NO2 sensor with high selectivity and fast response. Sens. Actuators B Chem. 2020, 310, 127830. [Google Scholar] [CrossRef]
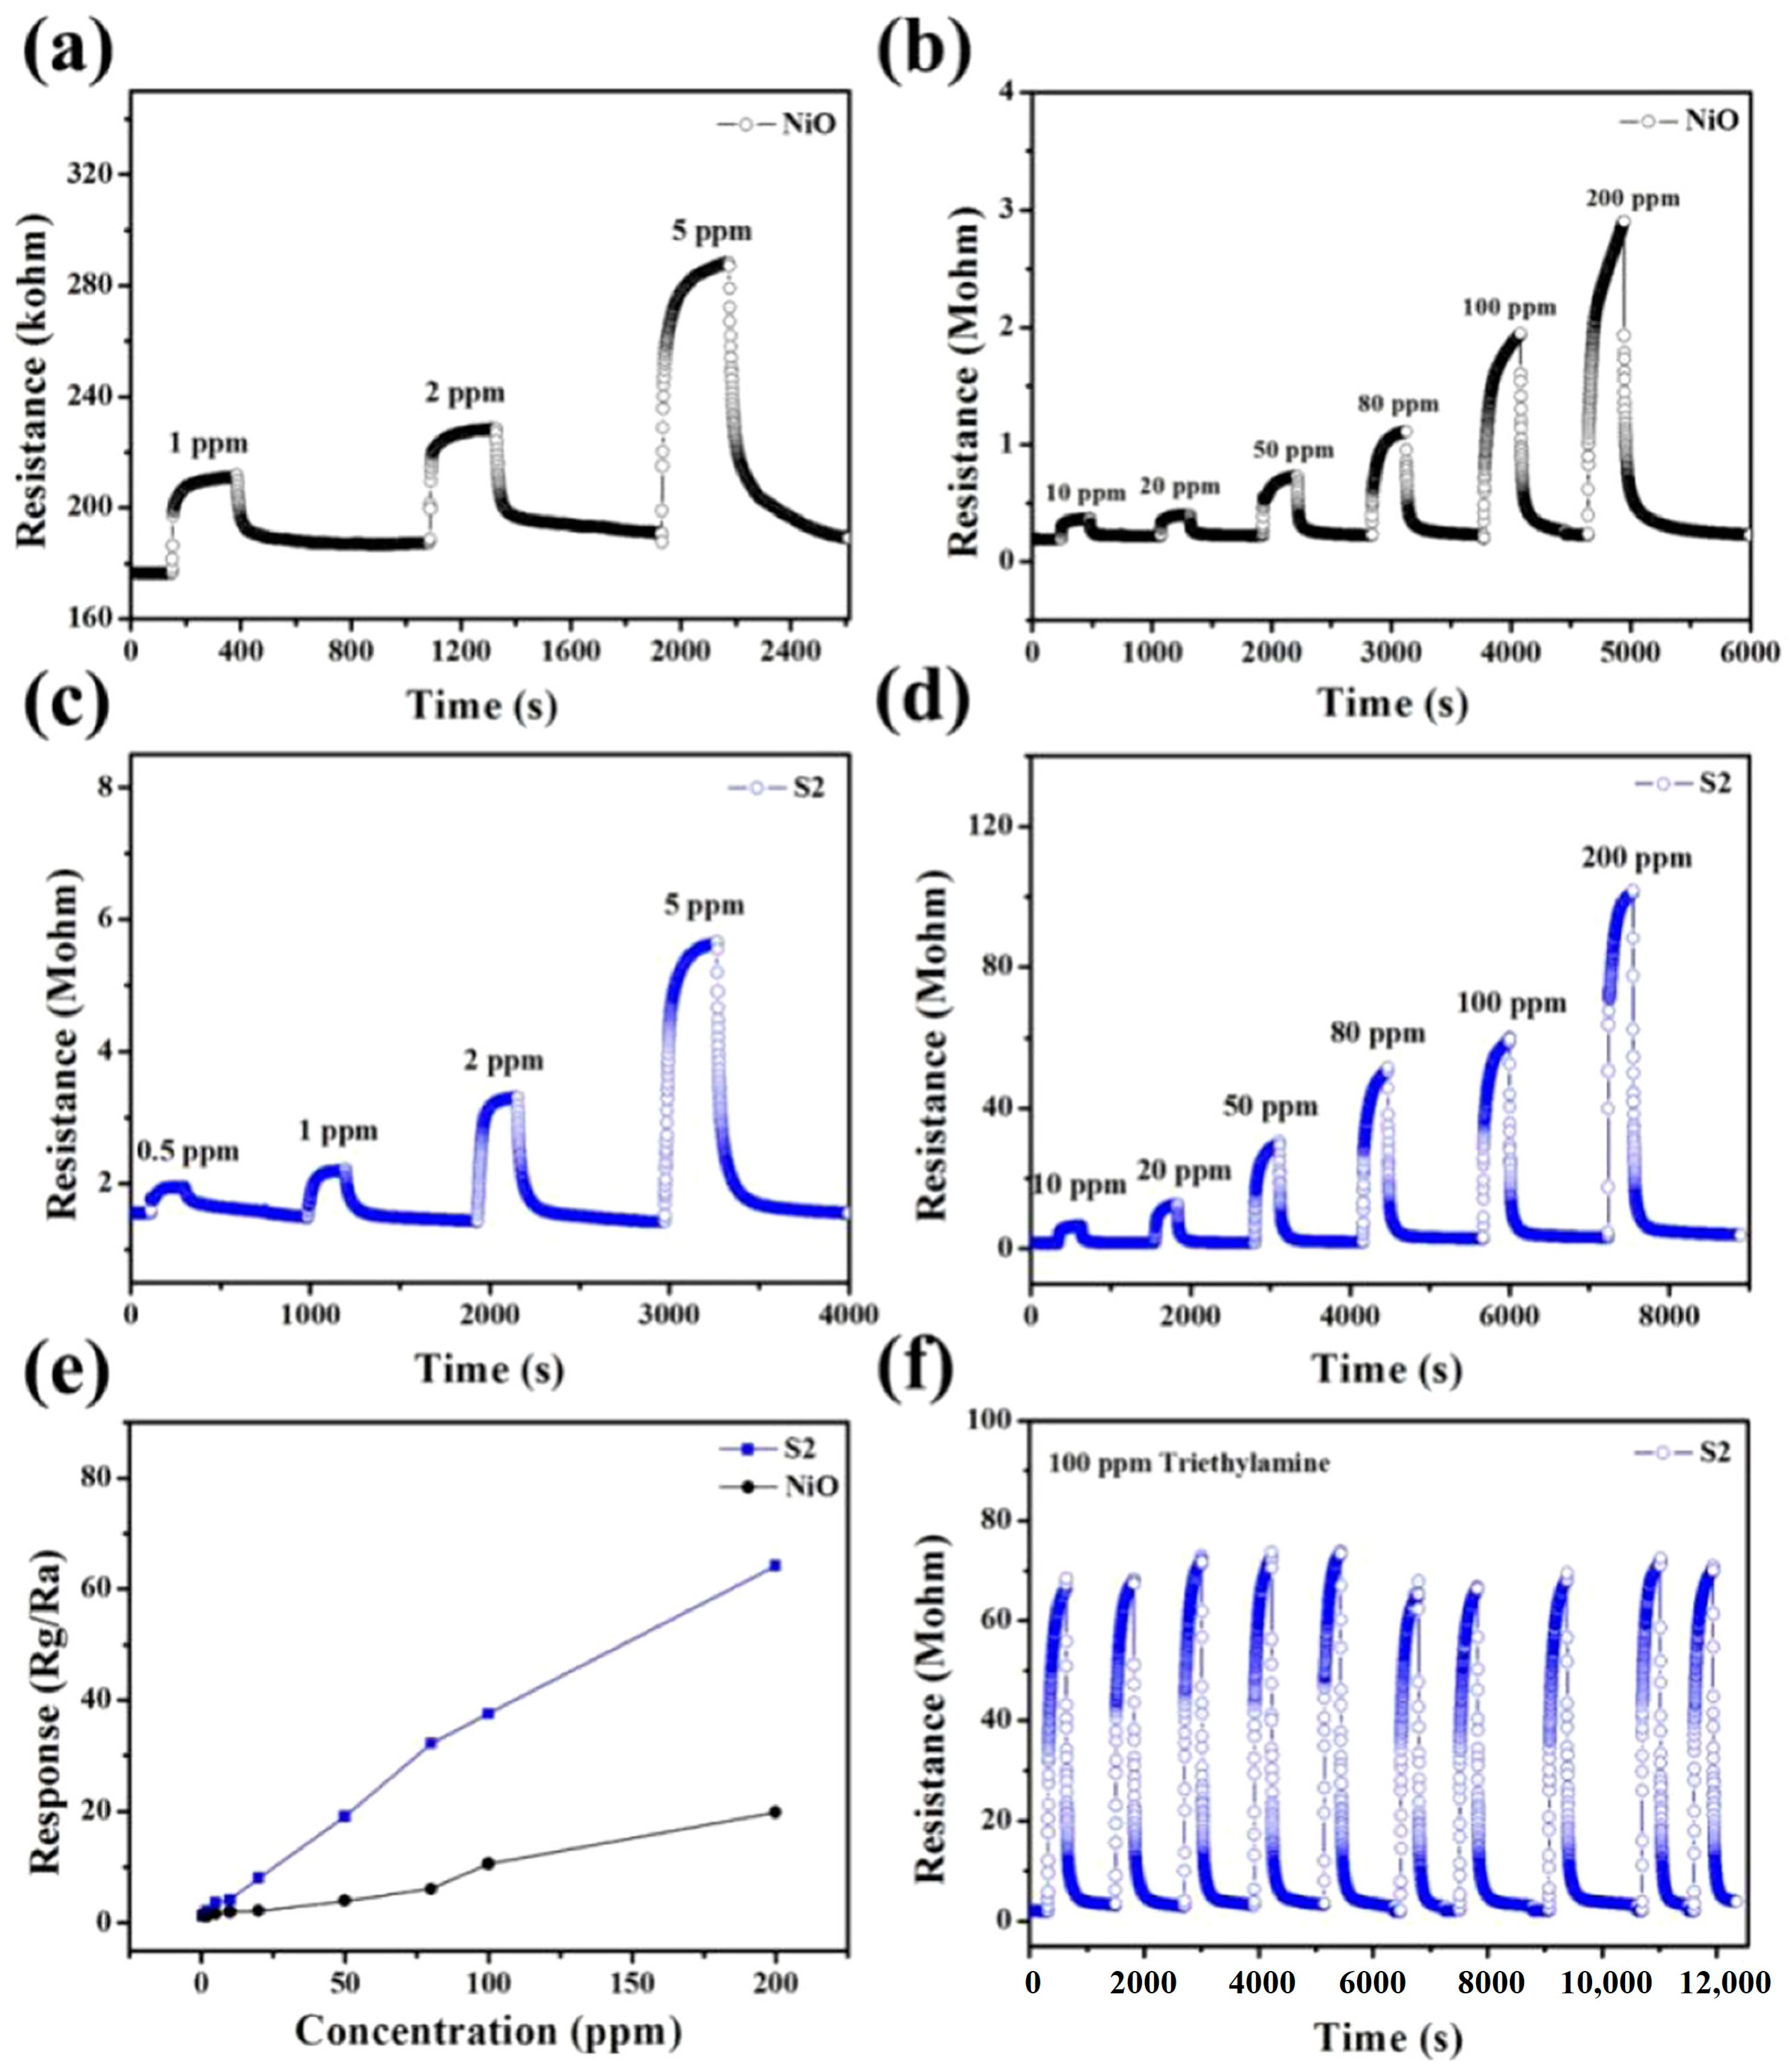
- Bai, S.; Liu, C.; Luo, R.; Chen, A. Metal organic frameworks-derived sensing material of SnO2/NiO composites for detection of triethylamine. Appl. Surf. Sci. 2018, 437, 304–313. [Google Scholar] [CrossRef]
- Yan, S.; Song, W.; Wu, D.; Jin, S.; Dong, S.; Hao, H.; Gao, W. Assembly of In2O3 nanoparticles decorated NiO nanosheets heterostructures and their enhanced gas sensing characteristics. J. Alloys Compd. 2021, 896, 162887. [Google Scholar] [CrossRef]
- Yu, Q.; Jin, R.; Zhao, L.; Wang, T.; Liu, F.; Yan, X.; Wang, C.; Sun, P.; Lu, G. MOF-Derived Mesoporous and Hierarchical Hollow-Structured In2O3-NiO Composites for Enhanced Triethylamine Sensing. ACS Sens. 2021, 6, 3451–3461. [Google Scholar] [CrossRef]
- Deus, R.C.; Amoresi, R.A.C.; Desimone, P.M.; Schipani, F.; Rocha, L.S.R.; Ponce, M.A.; Simoes, A.Z.; Longo, E. Electrical behavior of cerium dioxide films exposed to different gases atmospheres. Ceram. Int. 2016, 42, 15023–15029. [Google Scholar] [CrossRef]
- Li, H.; Qu, Y.; Zhang, X. The gas sensor utilizing CeO2 nanorods for the low temperature detection of hydrogen. Inorg. Chem. Commun. 2021, 130, 108692. [Google Scholar] [CrossRef]
- Zito, C.A.; Perfecto, T.M.; Dippel, A.-C.; Volanti, D.P.; Koziej, D. Low-Temperature Carbon Dioxide Gas Sensor Based on Yolk–Shell Ceria Nanospheres. ACS Appl. Mater. Interfaces 2020, 12, 17745–17751. [Google Scholar] [CrossRef] [PubMed]
- Kabure, A.; Shirke, B.; Mane, S.; Garadkar, K. Microwave-assisted sol-gel synthesis of CeO2–NiO nanocomposite based NO2 gas sensor for selective detection at lower operating temperature. J. Indian Chem. Soc. 2022, 99, 100369. [Google Scholar] [CrossRef]
- Liu, Y.; Sun, X.; Zhou, Z.; Lei, Y. Electrospun Ce–Ni–O composite nanofibers for highly selective propane detection at high temperature based on its rapid reaction kinetics. J. Mater. Chem. A 2014, 2, 14038–14047. [Google Scholar] [CrossRef]
- Long, N.V.; Teranishi, T.; Yang, Y.; Thi, C.M.; Cao, Y.; Nogami, M. Iron Oxide Nanoparticles for Next Generation Gas Sensors. Int. J. Met. Mater. Eng. 2015, 1, 1–18. [Google Scholar] [CrossRef] [PubMed]
- Wang, G.; Gou, X.; Horvat, J.; Park, J. Facile Synthesis and Characterization of Iron Oxide Semiconductor Nanowires for Gas Sensing Application. J. Phys. Chem. C 2008, 112, 15220–15225. [Google Scholar] [CrossRef]
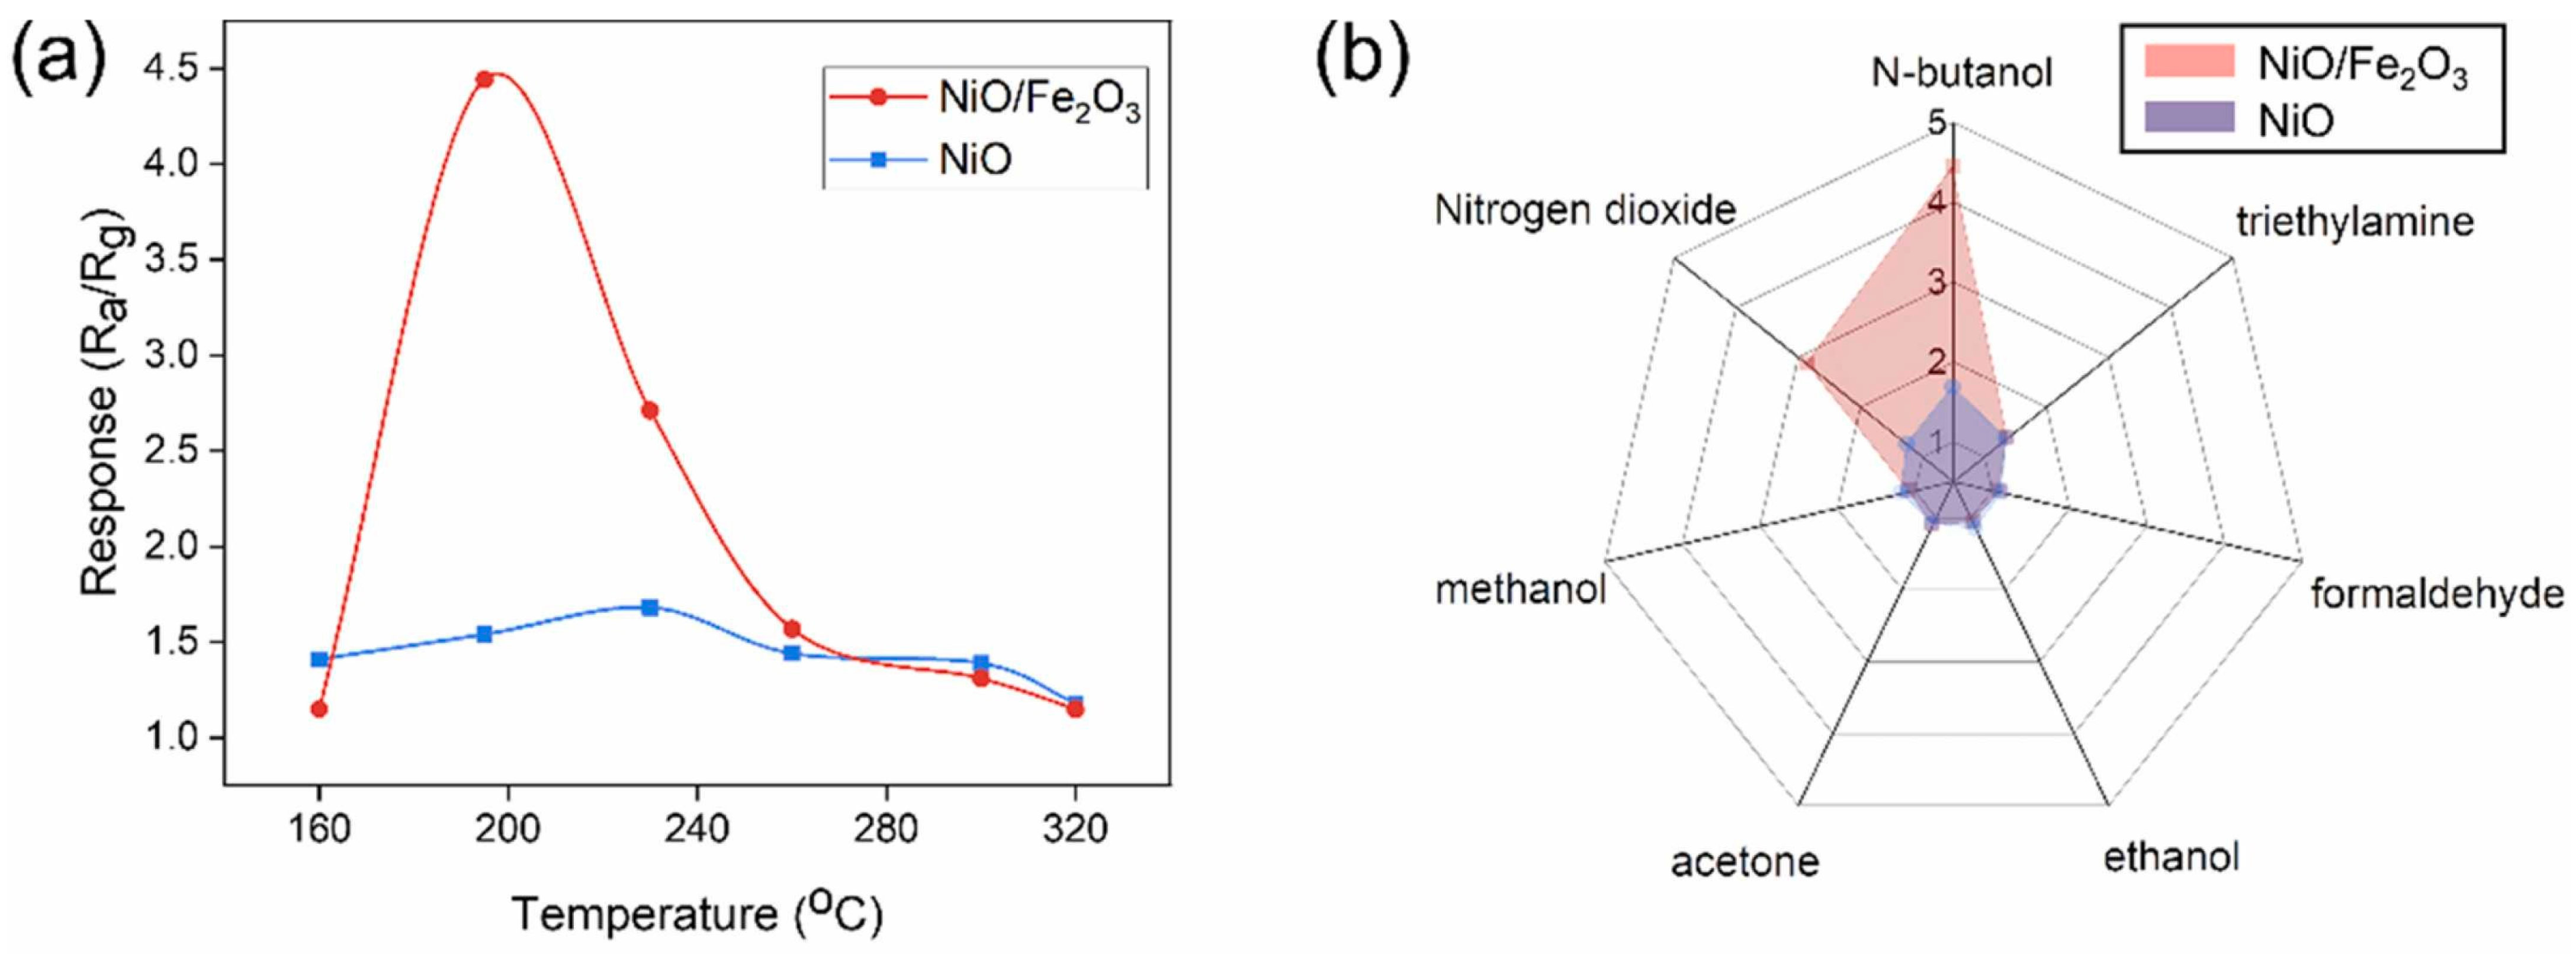
- Pan, H.; Li, Z.; Lou, C.; Lei, G.; Xie, J.; Zheng, W.; Liu, X.; Zhang, J. Anchoring Fe2O3 nanosheets on NiO nanoprisms to regulate the electronic properties for improved n-butanol detection. Sens. Actuators B Chem. 2022, 354, 131223. [Google Scholar] [CrossRef]
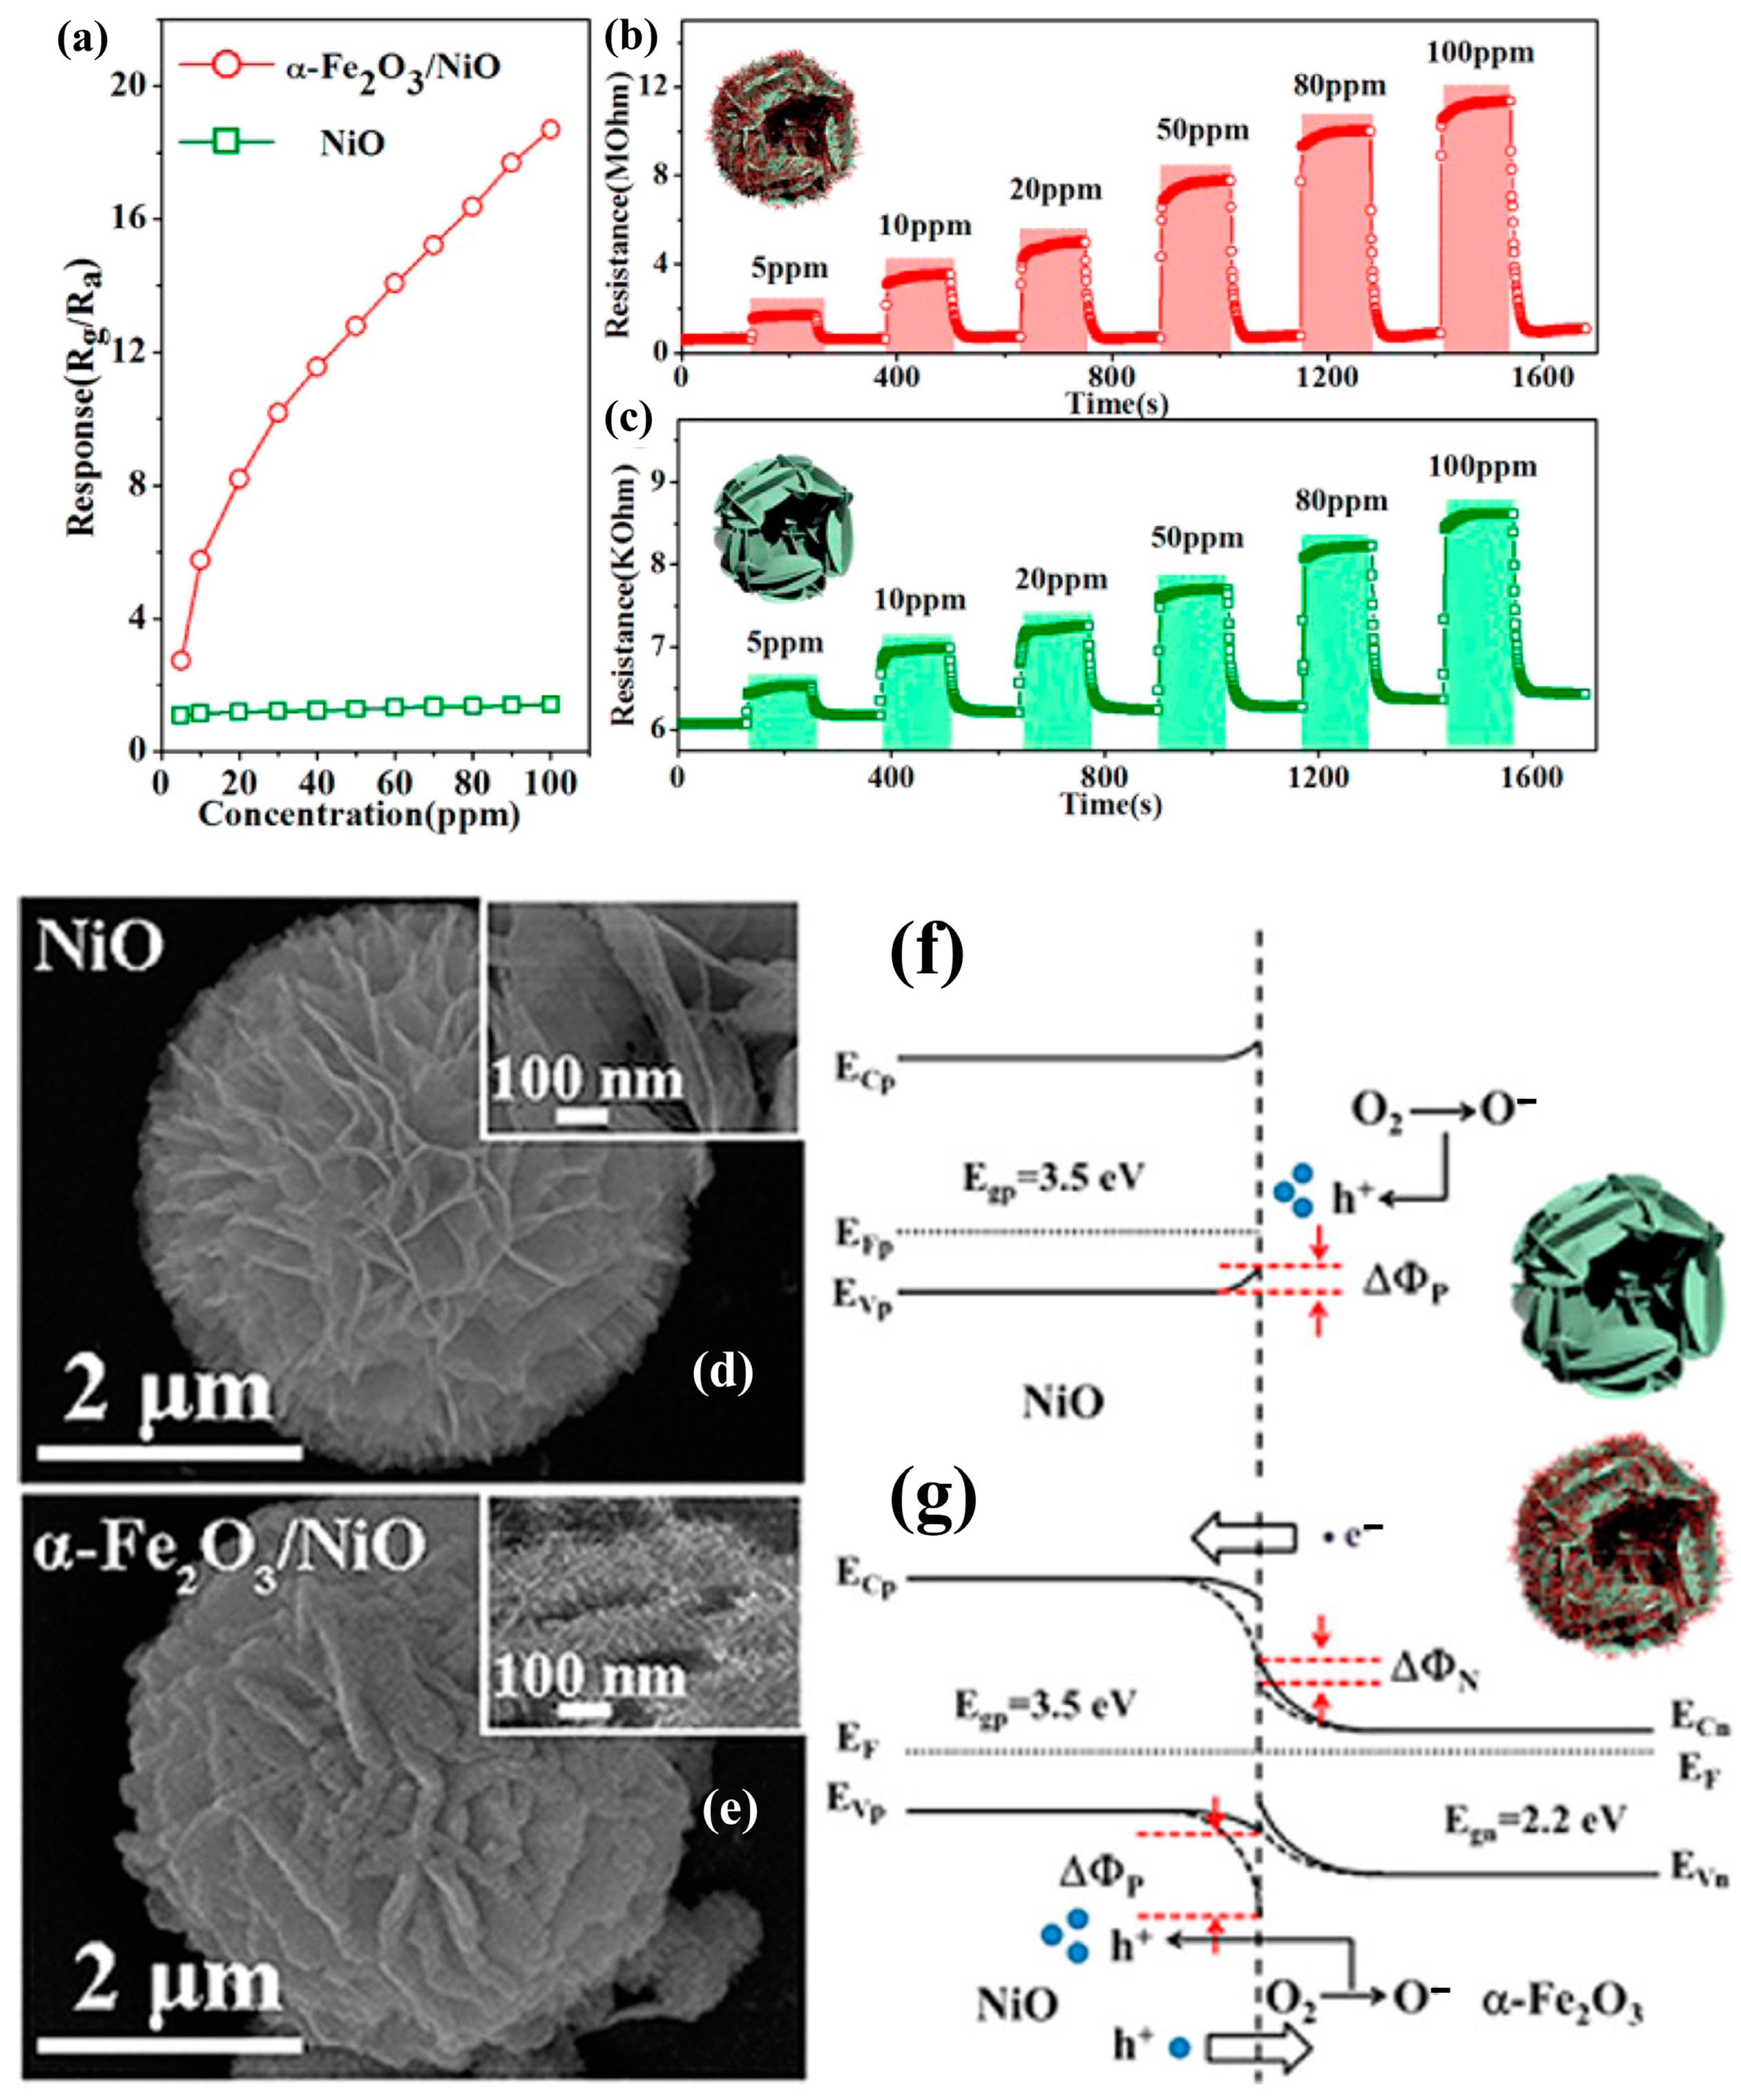
- Wang, C.; Cheng, X.; Zhou, X.; Sun, P.; Hu, X.; Shimanoe, K.; Lu, G.; Yamazoe, N. Hierarchical α-Fe2O3/NiO composites with a hollow structure for a gas sensor. ACS Appl. Mater. Interfaces 2014, 6, 12031–12037. [Google Scholar] [CrossRef] [PubMed]
- Lee, C.-S.; Dai, Z.; Jeong, S.-Y.; Kwak, C.-H.; Kim, B.-Y.; Kim, D.H.; Jang, H.W.; Park, J.-S.; Lee, J.-H. Monolayer Co3O4 inverse opals as multifunctional sensors for volatile organic compounds. Chemistry 2016, 22, 7102–7107. [Google Scholar] [CrossRef]
- Gao, J.; Liu, C.; Guo, S.; Yang, L.; Yang, Y.; Xu, K. Hetero-epitaxy growth of cobalt oxide/nickel oxide nanowire arrays on alumina substrates for enhanced ethanol sensing characteristics. Ceram. Int. 2022, 48, 3849–3859. [Google Scholar] [CrossRef]
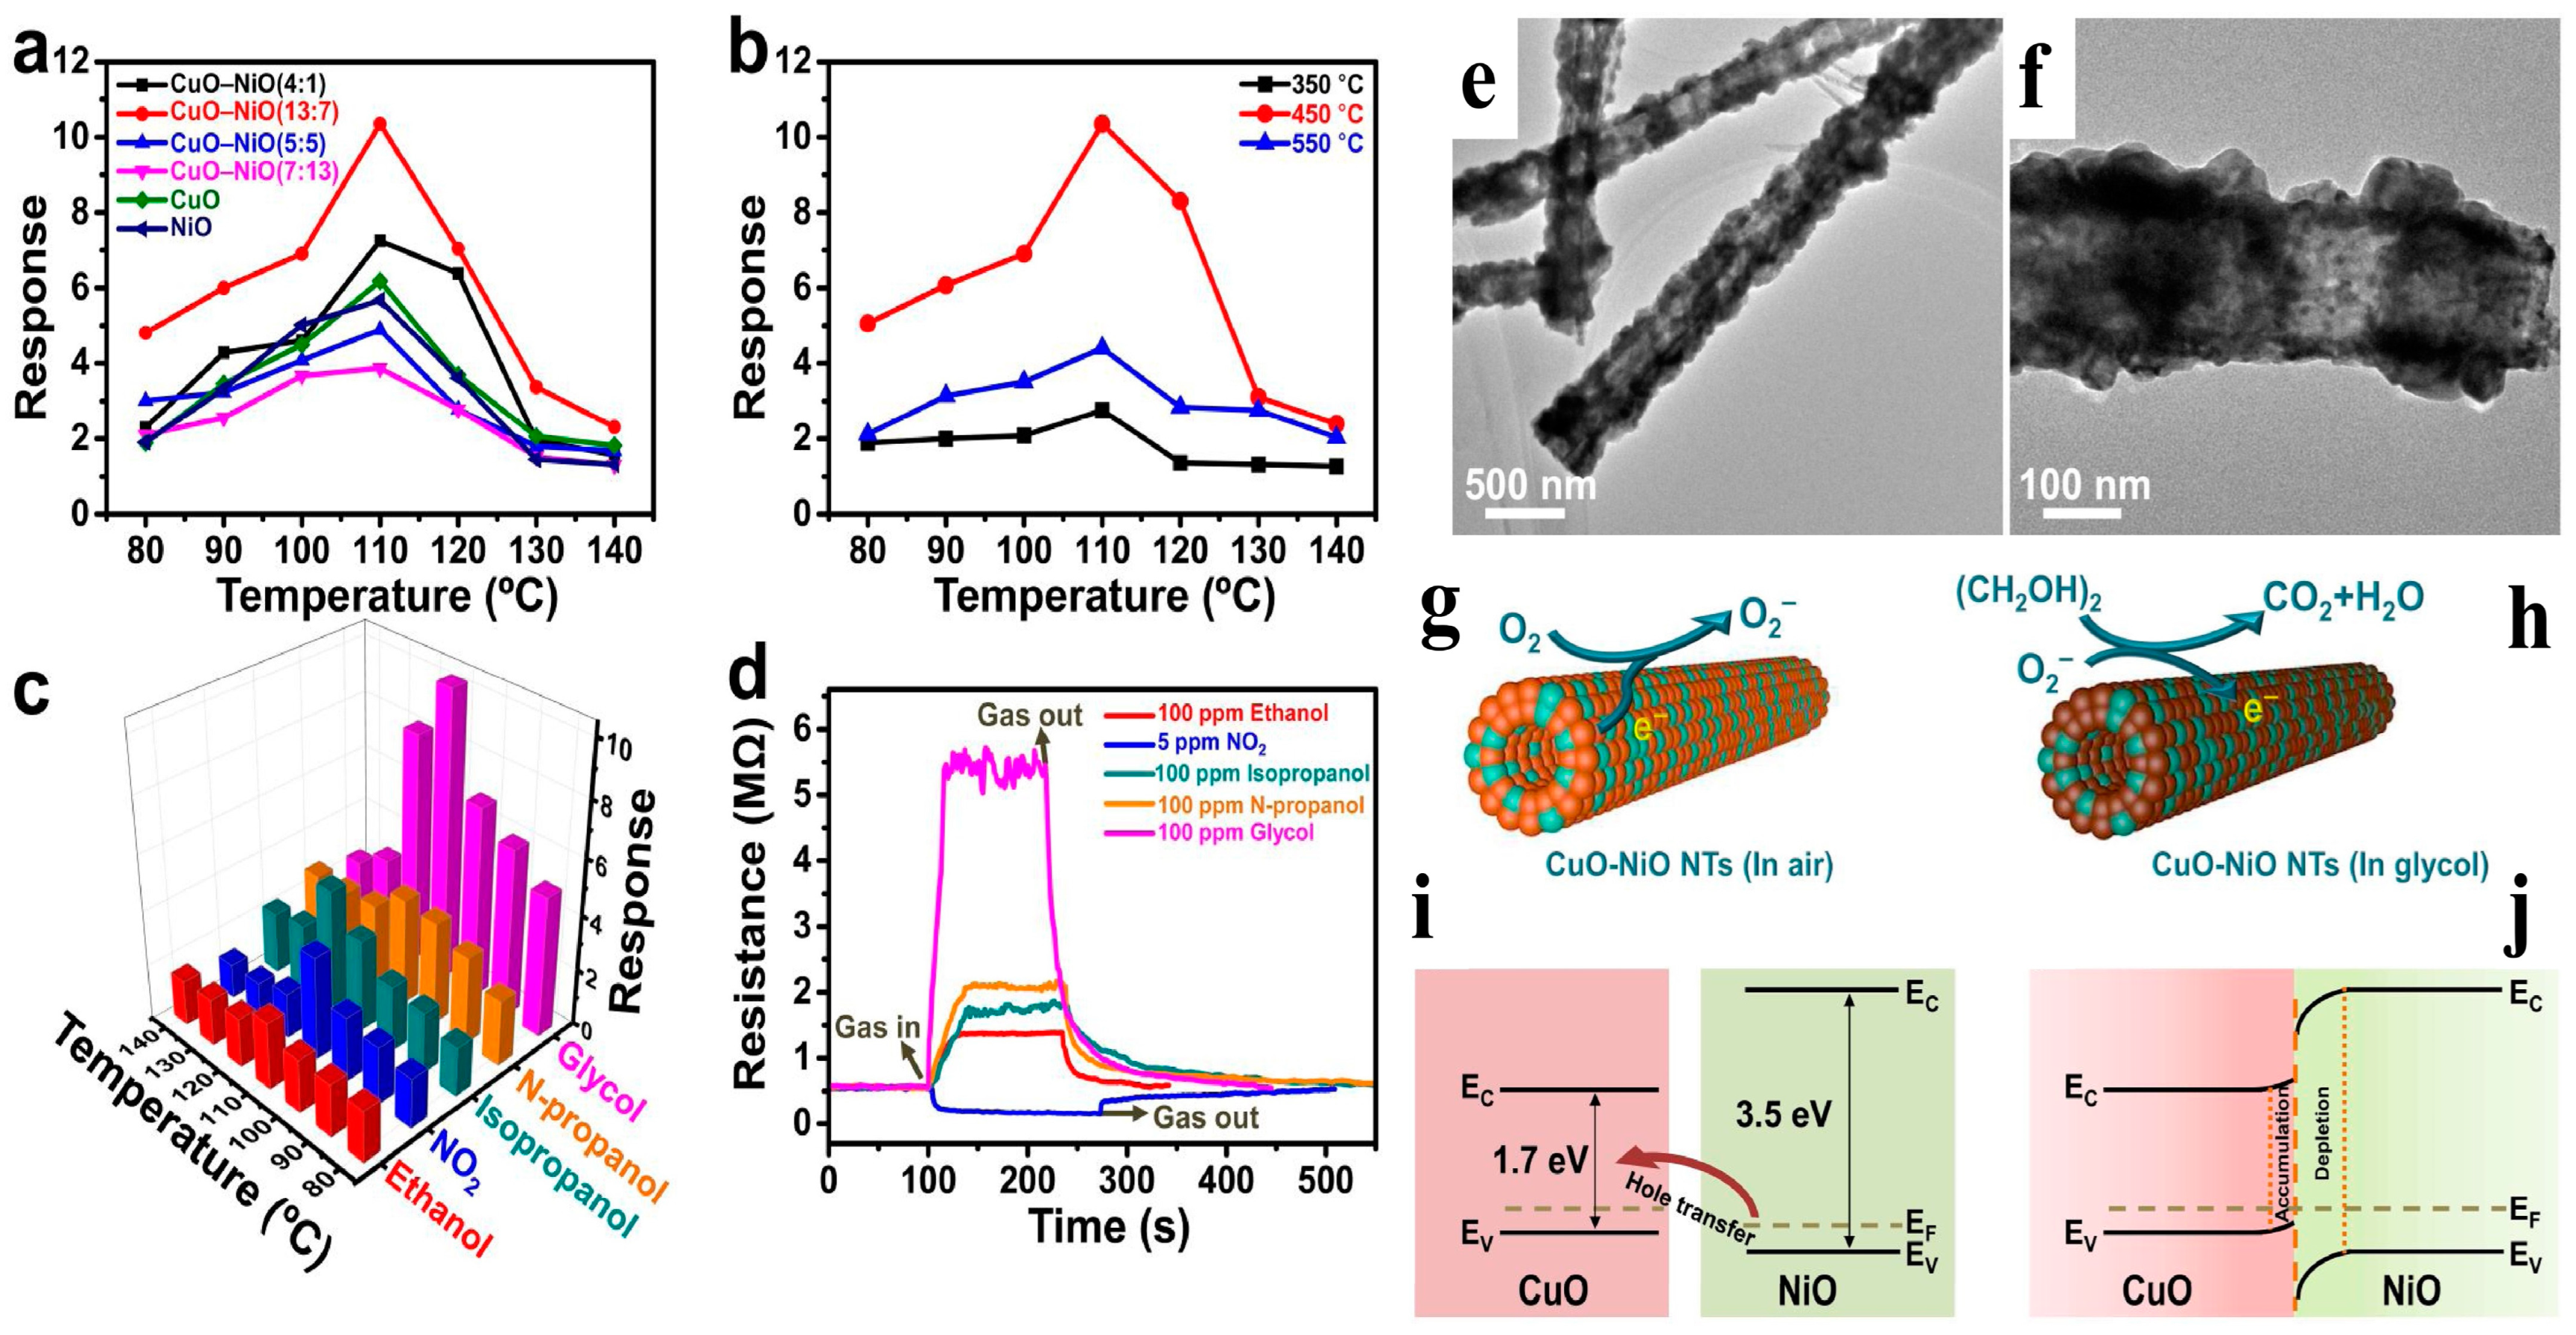
- Su, C.; Zhang, L.; Han, Y.; Ren, C.; Zeng, M.; Zhou, Z.; Su, Y.; Hu, N.; Wei, H.; Yang, Z. Controllable synthesis of heterostructured CuO–NiO nanotubes and their synergistic effect for glycol gas sensing. Sens. Actuators B Chem. 2019, 304, 127347. [Google Scholar] [CrossRef]
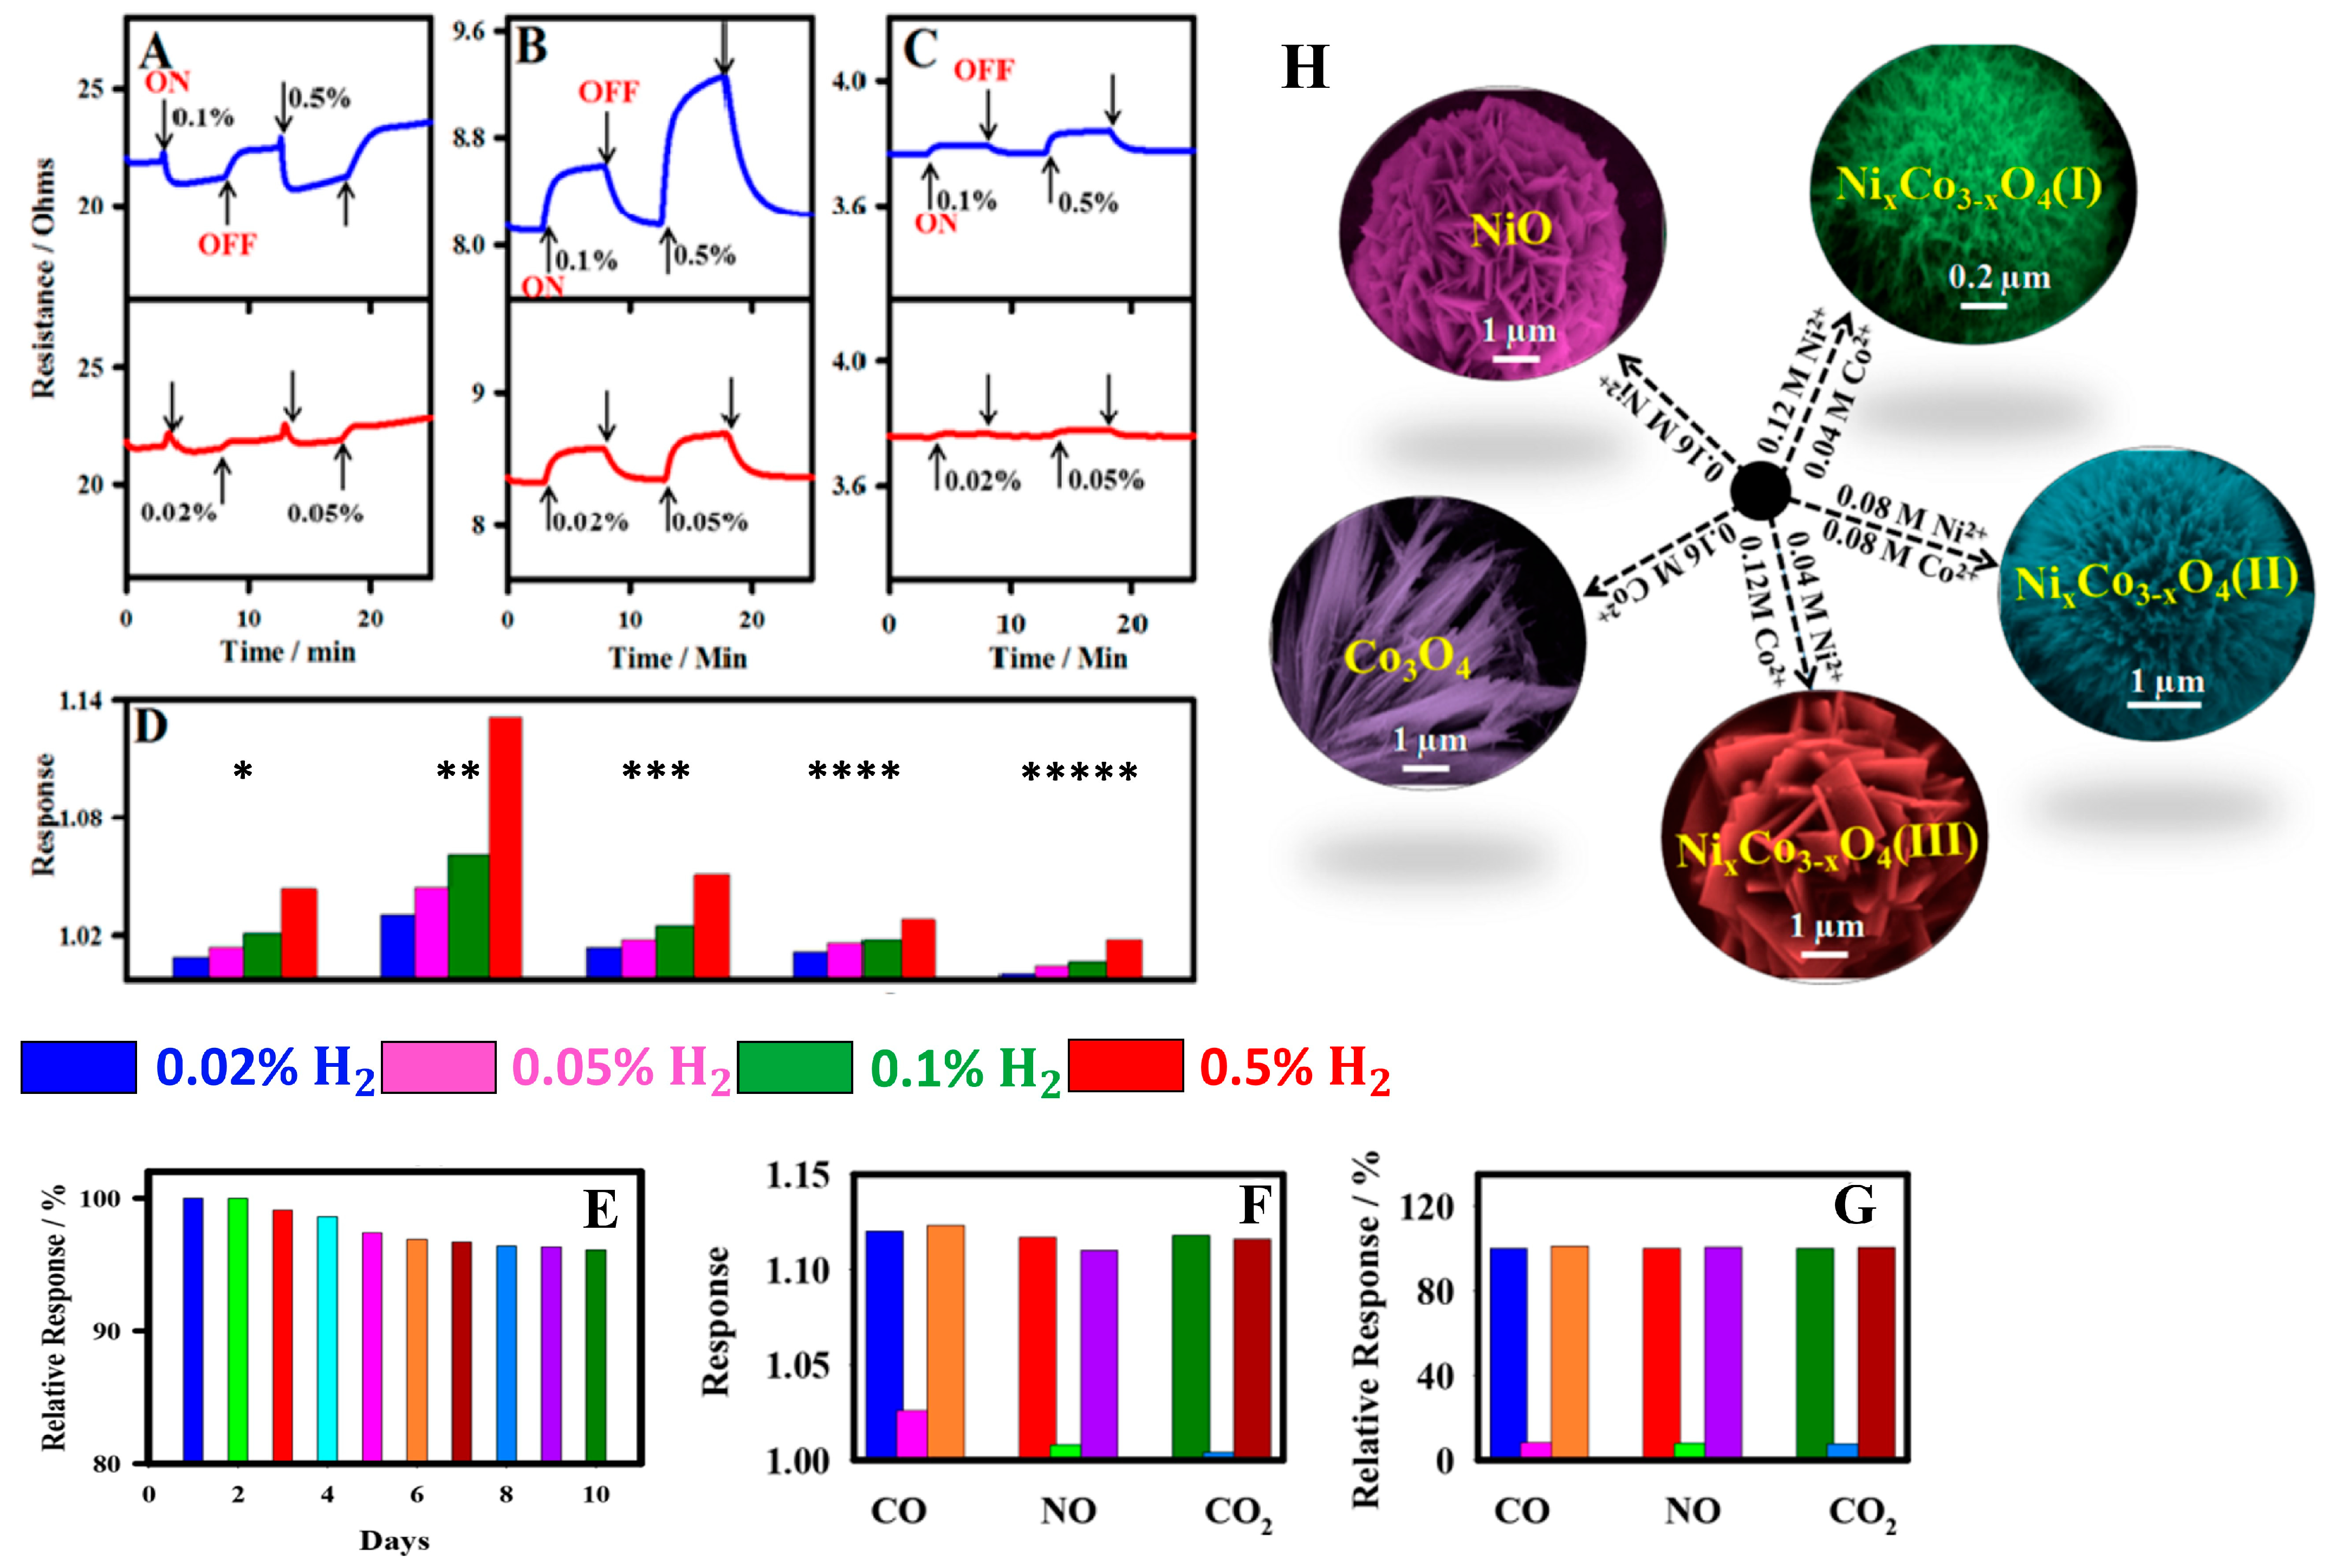
- Govindhan, M.; Sidhureddy, B.; Chen, A. High-Temperature Hydrogen Gas Sensor Based on Three-Dimensional Hierarchical-Nanostructured Nickel–Cobalt Oxide. ACS Appl. Nano Mater. 2018, 1, 6005–6014. [Google Scholar] [CrossRef]
- Sui, L.; Yu, T.; Zhao, D.; Cheng, X.; Zhang, X.; Wang, P.; Xu, Y.; Gao, S.; Zhao, H.; Gao, Y.; et al. In situ deposited hierarchical CuO/NiO nanowall arrays film sensor with enhanced gas sensing performance to H2S. J. Hazard. Mater. 2020, 385, 121570. [Google Scholar] [CrossRef]
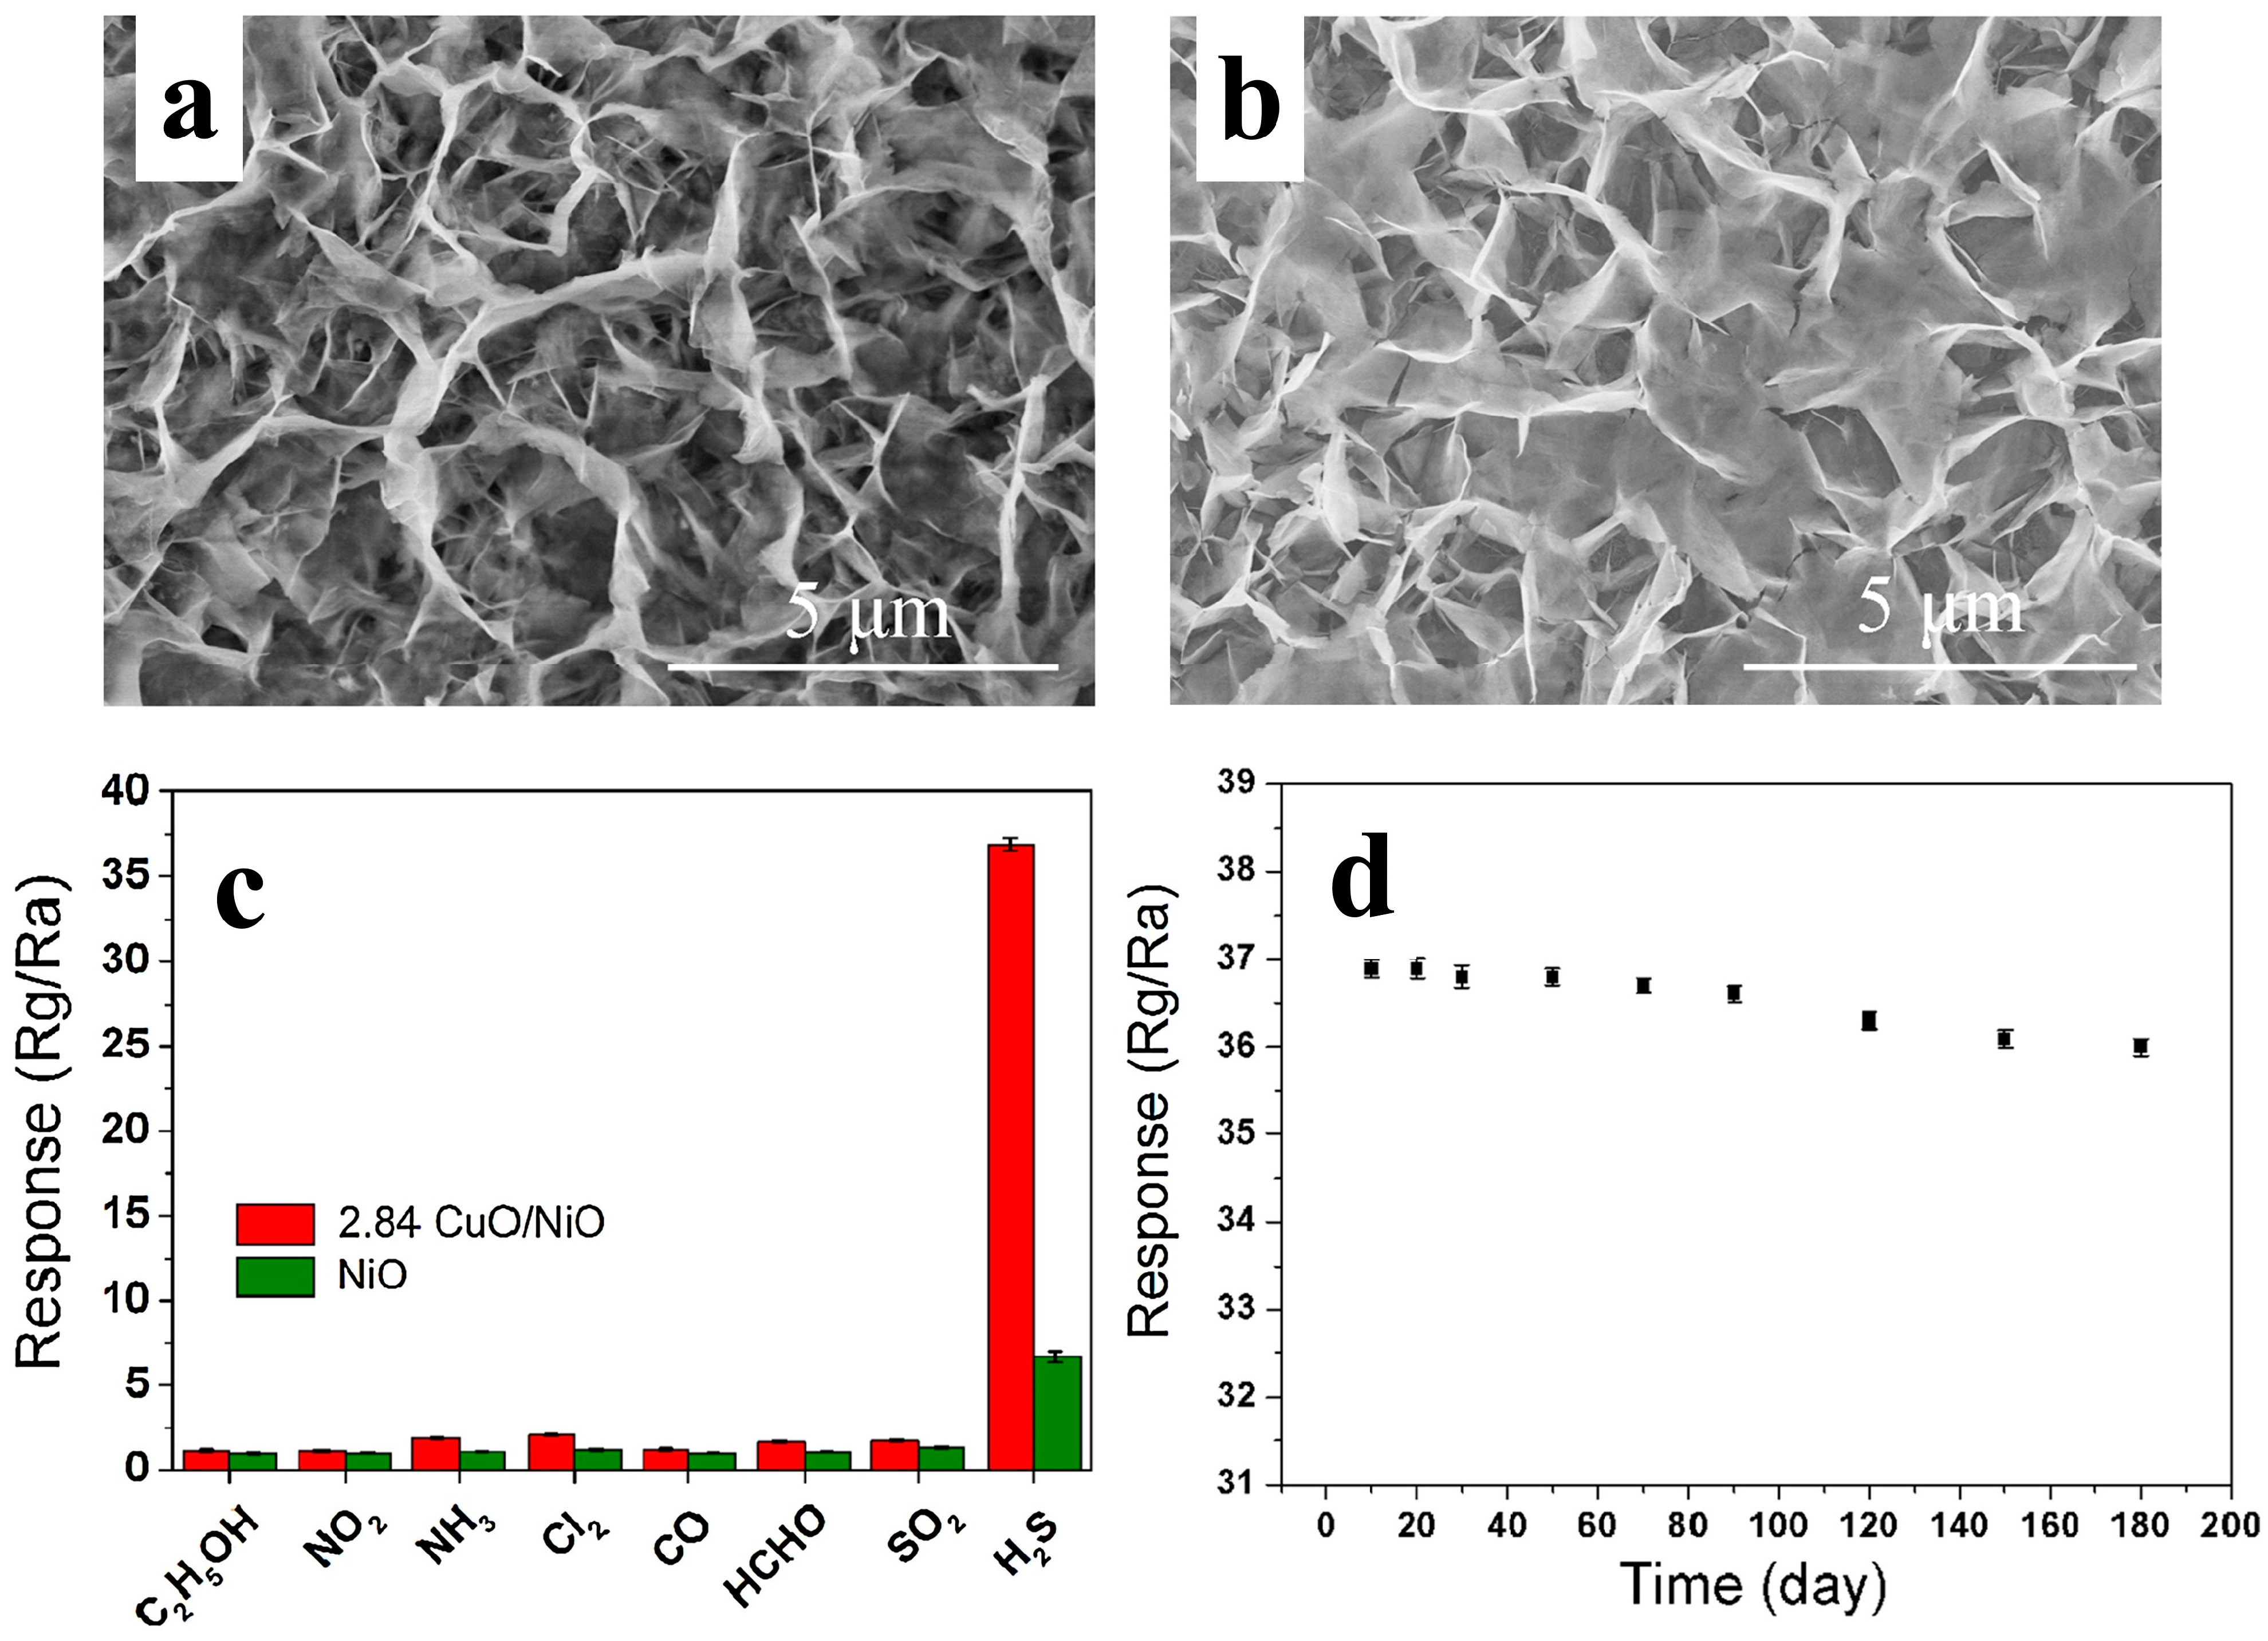
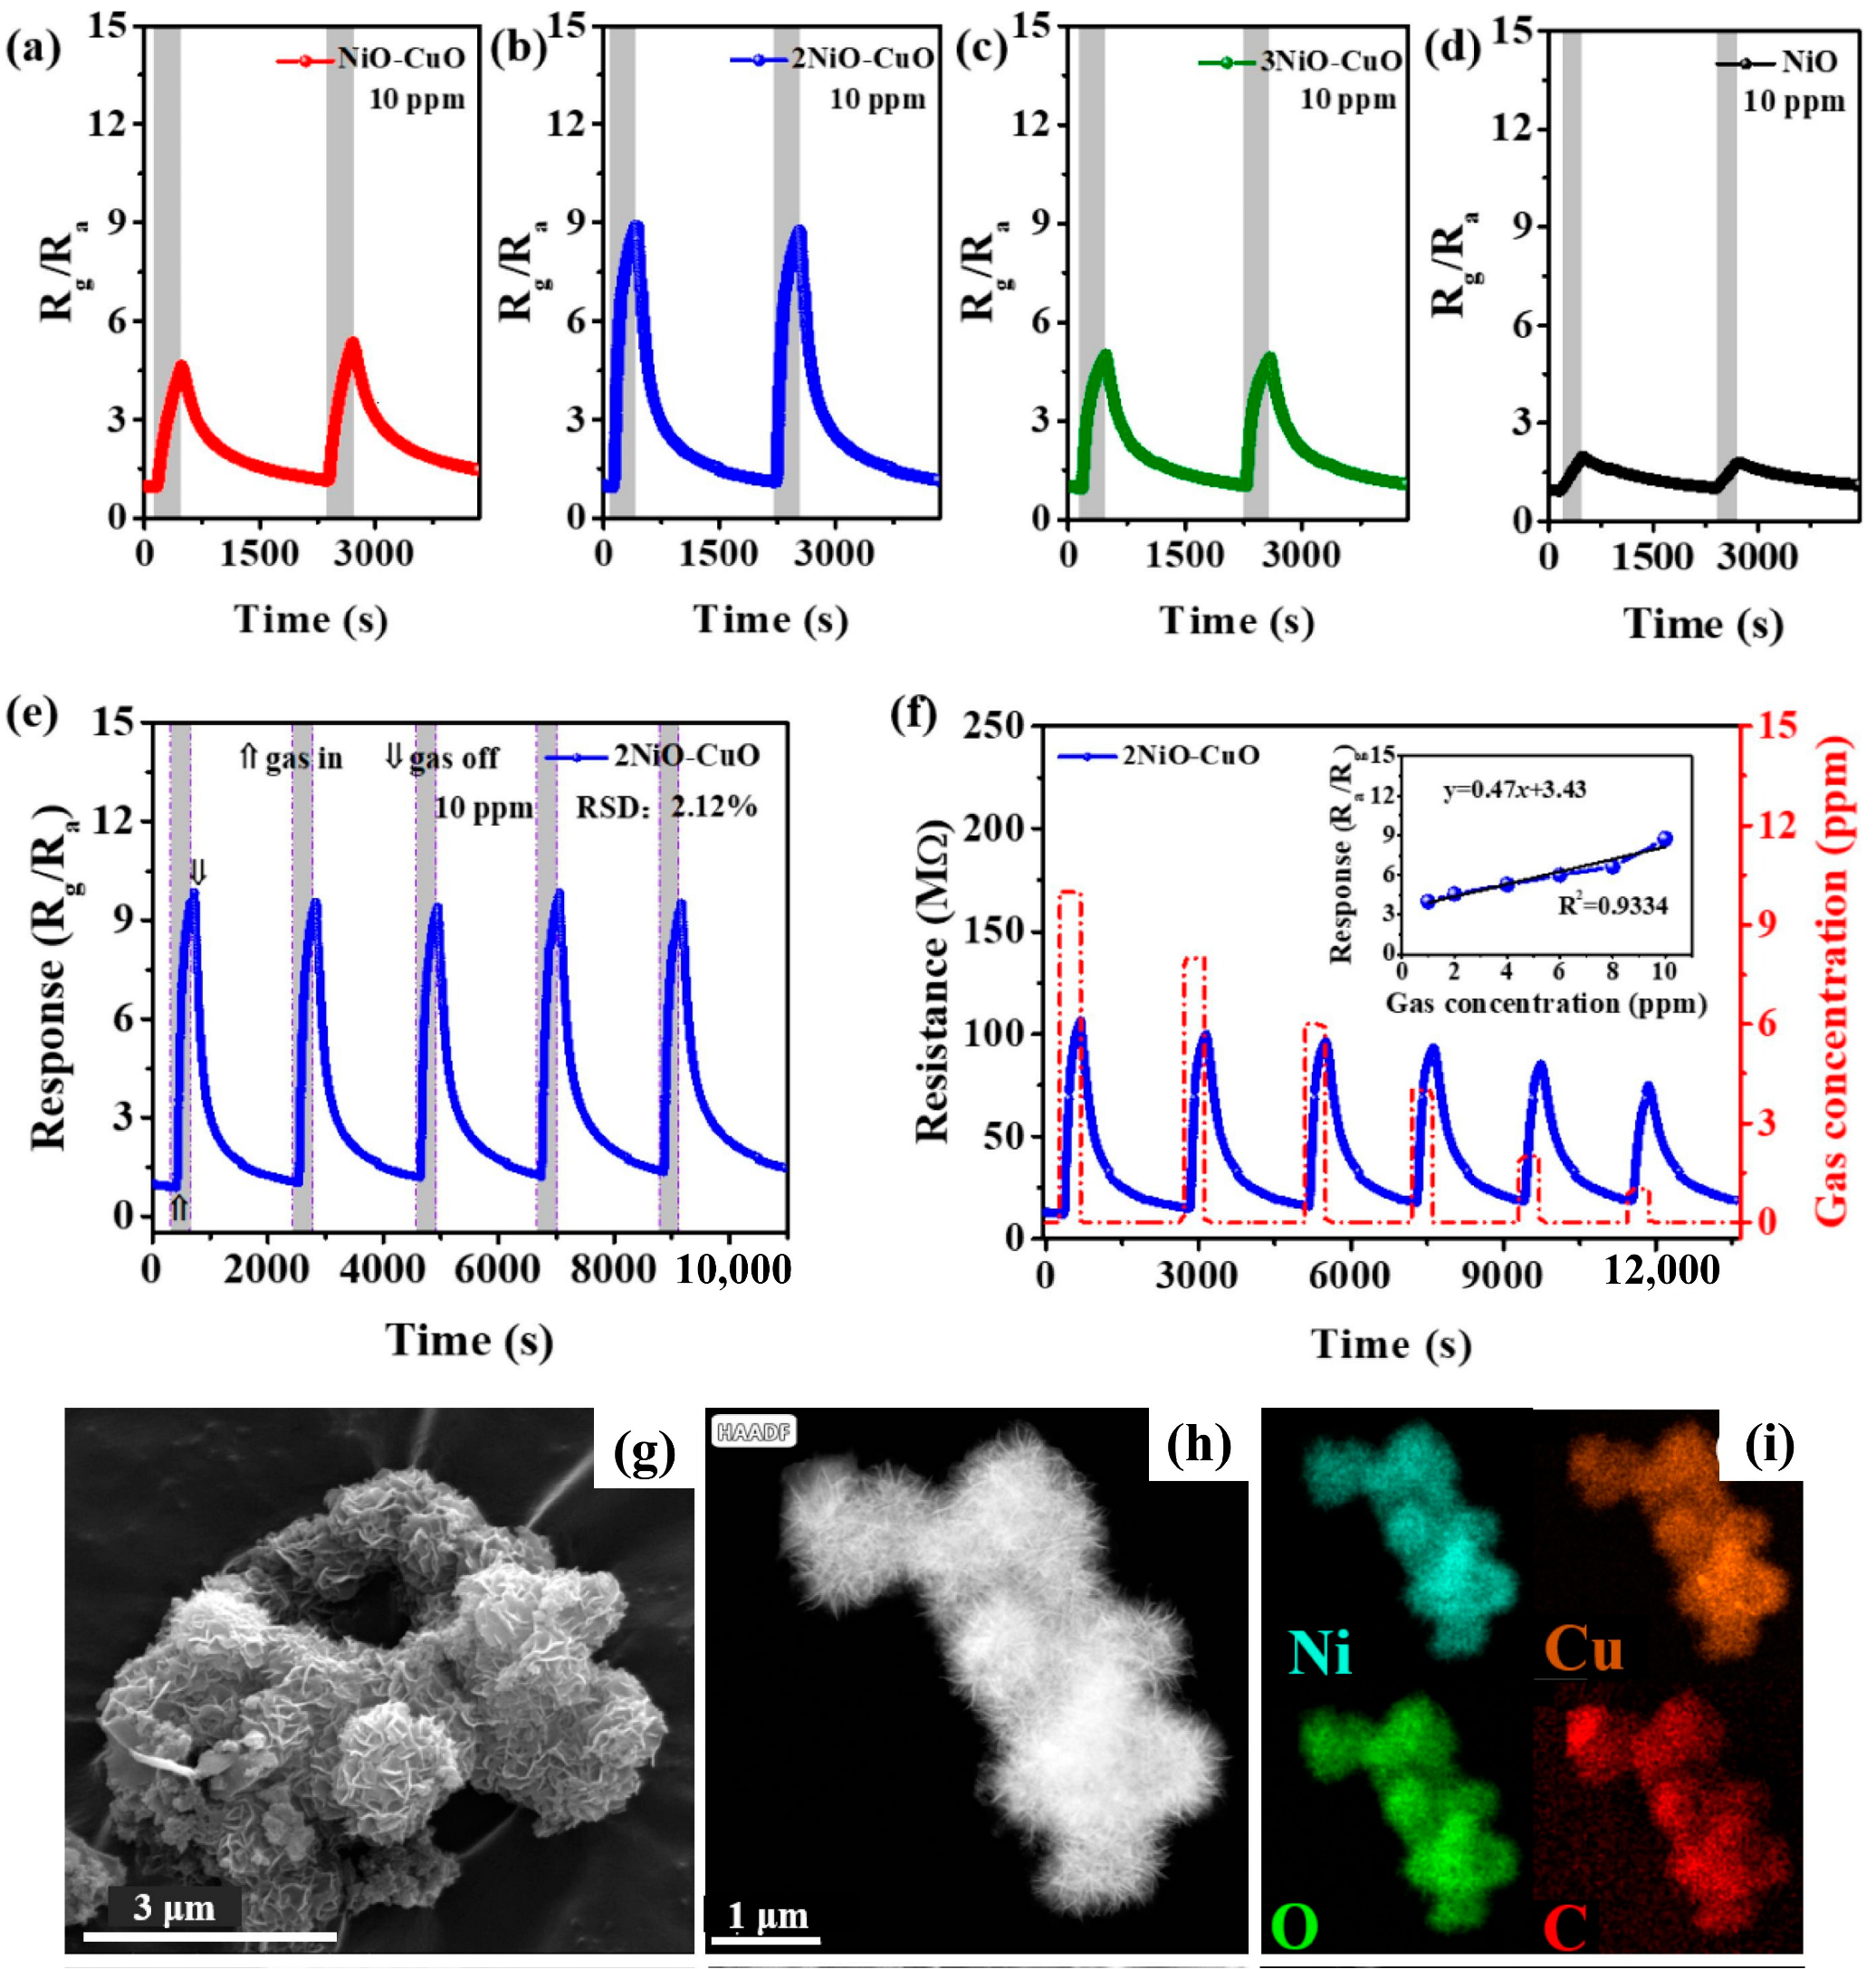
- Ding, Y.; Zhuang, Q.; Guo, X.; Li, H.; Liang, C.; Du, B.; Zhao, C.; Shi, Y.; Meng, G.; Li, R.; et al. NiO-CuO hydrangeas-like composite derived from Ni/Cu bimetallic MOFs for sensitive detection of H2S at room temperature. Appl. Surf. Sci. 2023, 612, 155792. [Google Scholar] [CrossRef]
- Nayak, A.K.; Ghosh, R.; Santra, S.; Guha, P.K.; Pradhan, D. Hierarchical nanostructured WO3–SnO2 for selective sensing of volatile organic compounds. Nanoscale 2015, 7, 12460–12473. [Google Scholar] [CrossRef] [PubMed]
- Liu, H.; Wang, Z.; Cao, G.; Pan, G.; Yang, X.; Qiu, M.; Sun, C.; Shao, J.; Li, Z.; Zhang, H. Construction of hollow NiO/ZnO p-n heterostructure for ultrahigh performance toluene gas sensor. Mater. Sci. Semicond. Process. 2022, 141, 106435. [Google Scholar] [CrossRef]
- Wang, S.-C.; Wang, X.-H.; Qiao, G.-Q.; Chen, X.-Y.; Wang, X.-Z.; Wu, N.-N.; Tian, J.; Cui, H.-Z. NiO nanoparticles-decorated ZnO hierarchical structures for isopropanol gas sensing. Rare Met. 2022, 41, 960–971. [Google Scholar] [CrossRef]
- Selvaraj, B.; Rayappan, J.B.B.; Babu, K. Room temperature ZnO/NiO heterostructure sensing response: A breath biomarker sensor. J. Alloys Compd. 2022, 914, 165224. [Google Scholar] [CrossRef]
- Zhang, J.; Li, J. The Oxygen Vacancy Defect of ZnO/NiO Nanomaterials Improves Photocatalytic Performance and Ammonia Sensing Performance. Nanomaterials 2022, 12, 433. [Google Scholar] [CrossRef]
- Xu, S.; Wang, J.; Lin, H.; Li, R.; Cheng, Y.; Sang, S.; Zhuo, K. ZnO/NiO nanofibers prepared by electrostatic spinning for rapid ammonia detection at room temperature. Electron. Mater. Lett. 2022, 18, 568–577. [Google Scholar] [CrossRef]
- Nagarjuna, Y.; Hsiao, Y.-J. Low-Temperature Ammonia Gas Sensor Based on NiO/ZnO Heterojunction Nanosheet on MEMS Devices. J. Electrochem. Soc. 2022, 169, 077502. [Google Scholar] [CrossRef]
- Wang, X.; Wang, S.; Tian, J.; Cui, H.; Wang, X. Synthesis of 1D SnO2 nanorods/2D NiO porous nanosheets p-n heterostructures for enhanced ethanol gas sensing performance. Vacuum 2022, 205, 111399. [Google Scholar] [CrossRef]
- Das, S.; Kumar, A.; Singh, J.; Kumar, M. Fabrication and modeling of laser ablated NiO nanoparticles decorated SnO2 based formaldehyde sensor. Sens. Actuators B Chem. 2023, 387, 133824. [Google Scholar] [CrossRef]
- Hsiao, Y.-J.; Shi, Z.-H.; Nagarjuna, Y.; Huang, Z.-Y.; Lai, T.-Y.; Wu, S. Double-Layered NiO/SnO2 Sensor for Improved SO2 Gas Sensing with MEMS Microheater Device. ECS J. Solid State Sci. Technol. 2022, 11, 057002. [Google Scholar] [CrossRef]
- Yin, X.-T.; Dastan, D.; Gity, F.; Li, J.; Shi, Z.; Alharbi, N.D.; Liu, Y.; Tan, X.-M.; Gao, X.-C.; Ma, X.-G.; et al. Gas sensing selectivity of SnO2-xNiO sensors for homogeneous gases and its selectivity mechanism: Experimental and theoretical studies. Sens. Actuators A Phys. 2023, 354, 114273. [Google Scholar] [CrossRef]
- Liang, Y.; Li, H.; Zhao, X.; Xue, L.; Tang, L.; Xue, F.; Yu, T.; Yang, Y. Crystal facets-controlled NiO/SnO2 p-n heterostructures with engineered surface and interface towards triethylamine sensing. J. Alloys Compd. 2023, 947, 169503. [Google Scholar] [CrossRef]
- Perrone, O.M.; Roveda, A.C.; de Moraes, D.A.; Theodoro, R.d.S.; Volanti, D.P. Highly efficient detection of ethanol by SnO2 nanoparticles-decored NiO nanocuboids. Mater. Res. Bull. 2023, 158, 112086. [Google Scholar] [CrossRef]
- Cai, Z.; Park, J.; Park, S. Synergistic effect of Pd and Fe2O3 nanoparticles embedded in porous NiO nanofibers on hydrogen gas detection: Fabrication, characterization, and sensing mechanism exploration. Sens. Actuators B Chem. 2023, 388, 133836. [Google Scholar] [CrossRef]
- Li, L.; Zhou, L.; Hu, Z.; Li, T.; Chen, B.; Li, H.-Y.; Liu, H. Hollow-Out Fe2O3-Loaded NiO Heterojunction Nanorods Enable Real-Time Exhaled Ethanol Monitoring under High Humidity. ACS Appl. Mater. Interfaces 2023, 15, 15707–15720. [Google Scholar] [CrossRef]
- Zhang, D.; Wang, T.; Huo, L.; Gao, S.; Li, B.; Guo, C.; Yu, H.; Major, Z.; Zhang, X.; Cheng, X.; et al. Small size porous NiO/NiFe2O4 nanocubes derived from Ni-Fe bimetallic metal–organic frameworks for fast volatile organic compounds detection. Appl. Surf. Sci. 2023, 623, 157075. [Google Scholar] [CrossRef]
- Yang, J.; Han, W.; Jiang, B.; Wang, X.; Sun, Y.; Wang, W.; Lou, R.; Ci, H.; Zhang, H.; Lu, G. Electrospinning Derived NiO/NiFe2O4 Fiber-in-Tube Composite for Fast Triethylamine Detection under Different Humidity. ACS Sens. 2022, 7, 995–1007. [Google Scholar] [CrossRef]
- Perrone, O.M.; Roveda, A.C.; de Moraes, D.A.; Volanti, D.P. The enhanced n-butanol sensing performance of In2O3 loaded NiO cuboid heterostructure. J. Alloys Compd. 2023, 930, 167483. [Google Scholar] [CrossRef]
- Wang, X.; Zhang, W.; Wang, X.; Li, X.; Sui, X.; Liu, G.; Li, B.; Zhou, J.; Xie, E.; Zhang, Z. Facile fabrication of NiO foam@Sn-doped In2O3 nanowire heterosturctures for highly sensitive ethylene glycol gas sensors at low temperatures. Sens. Actuators B Chem. 2023, 377, 132991. [Google Scholar] [CrossRef]
- Zhang, S.; Li, J.; Han, L.; Zhang, B.; Wang, Y.; Zhang, Z. Preparation of porous NiO/In2O3 nanoflower-like composites and their dual selectivity for CO/CH4. Mater. Res. Bull. 2023, 165, 112332. [Google Scholar] [CrossRef]
- Wu, Z.; Zhang, H.; Ji, H.; Yuan, Z.; Meng, F. Novel combined waveform temperature modulation method of NiO-In2O3 based gas sensor for measuring and identifying VOC gases. J. Alloys Compd. 2022, 918, 165510. [Google Scholar] [CrossRef]
- Meng, D.; Qiao, T.; Wang, G.; Shen, Y.; San, X.; Pan, Y.; Meng, F. NiO-functionalized In2O3 flower-like structures with enhanced trimethylamine gas sensing performance. Appl. Surf. Sci. 2022, 577, 151877. [Google Scholar] [CrossRef]
- Zhang, H.; Wei, W.; Tao, T.; Li, X.; Xia, X.; Bao, Y.; Lourenço, M.; Homewood, K.; Huang, Z.; Gao, Y. Hierarchical NiO/TiO2 heterojuntion-based conductometric hydrogen sensor with anti-CO-interference. Sens. Actuators B Chem. 2023, 380, 133321. [Google Scholar] [CrossRef]
- Lee, J.-H.; Kim, J.-Y.; Mirzaei, A.; Nam, M.-S.; Kim, H.W.; Kim, S.S. Room-temperature detection of acetone gas by PANI/NiO-loaded TiO2 nanoparticles under UV irradiation. Sens. Actuators B Chem. 2023, 374, 132850. [Google Scholar] [CrossRef]
- Li, C.; Choi, P.G.; Masuda, Y. Highly Sensitive and Selective Gas Sensors Based on NiO/MnO2@NiO Nanosheets to Detect Allyl Mercaptan Gas Released by Humans under Psychological Stress. Adv. Sci. 2022, 9, e2202442. [Google Scholar] [CrossRef]
- Wang, X.; Zhang, W.; Wang, X.; Li, X.; Sui, X.; Jiang, H.; Liu, G.; Li, B.; Sheng, Y.; Zhou, J.; et al. Heterostructure engineering of NiO foam/In2S3 film for high-performance ethylene glycol gas sensors. Sens. Actuators B Chem. 2023, 392, 134110. [Google Scholar] [CrossRef]
- Yang, J.; Gui, Y.; Wang, Y.; He, S. NiO/Ti3C2Tx MXene nanocomposites sensor for ammonia gas detection at room temperature. J. Ind. Eng. Chem. 2023, 119, 476–484. [Google Scholar] [CrossRef]
- Zhang, P.; Sun, Y.; Ning, T.; Ren, Q.; Xu, M.; Zhao, X.; Chen, Q.; Huang, N.; Luo, X.; Zhai, C.; et al. Ultrasensitive Gas Sensor Based on Ball-Flower Like Wo3/Nio Composites for Fast No2 Detection. Available online: https://papers.ssrn.com/sol3/papers.cfm?abstract_id=4290985 (accessed on 27 December 2023).
- Li, H.; Ding, B.; Wu, J.; Lv, Q. Synthesis of MoO3/NiO nanolamella and their enhanced hydrogen sensing performance. Inorg. Chem. Commun. 2022, 145, 109967. [Google Scholar] [CrossRef]
- Yang, W.; Fang, B.; Xiao, X.; Meng, H.; Liu, S. Hierarchical core-shell heterostructures of α-MoO3 nanorods@NiO nanosheets for significant detection of ethyl acetate vapor. Sens. Actuators B Chem. 2022, 358, 131457. [Google Scholar] [CrossRef]
- Koo, W.-T.; Choi, S.-J.; Kim, S.-J.; Jang, J.-S.; Tuller, H.L.; Kim, I.-D. Heterogeneous Sensitization of Metal–Organic Framework Driven Metal@Metal Oxide Complex Catalysts on an Oxide Nanofiber Scaffold Toward Superior Gas Sensors. J. Am. Chem. Soc. 2016, 138, 13431–13437. [Google Scholar] [CrossRef] [PubMed]
- Hwang, J.; Jung, H.; Shin, H.-S.; Kim, D.-S.; Kim, D.S.; Ju, B.-K.; Chun, M.P. The Effect of Noble Metals on Co Gas Sensing Properties of In2O3 Nanoparticles. Appl. Sci. 2021, 11, 4903. [Google Scholar] [CrossRef]
- Rai, P.; Yoon, J.-W.; Jeong, H.-M.; Hwang, S.-J.; Kwak, C.-H.; Lee, J.-H. Design of highly sensitive and selective Au@NiO yolk–shell nanoreactors for gas sensor applications. Nanoscale 2014, 6, 8292–8299. [Google Scholar] [CrossRef] [PubMed]
- Ahmad, R.; Bedük, T.; Majhi, S.M.; Salama, K.N. One-step synthesis and decoration of nickel oxide nanosheets with gold nanoparticles by reduction method for hydrazine sensing application. Sens. Actuators B Chem. 2019, 286, 139–147. [Google Scholar] [CrossRef]
- Balamurugan, C.; Cho, K.; Park, B.; Kim, J.; Kim, N.; Pak, Y.; Kong, J.; Kwon, S. Large modulation of the chemical and electronic sensitization of TiO2/Ag/NiO nanostructure via in situ hydrothermal-induced heterointerface engineering. Chem. Eng. J. 2022, 430, 132690. [Google Scholar] [CrossRef]
- Tian, K.; Wang, X.-X.; Li, H.-Y.; Nadimicherla, R.; Guo, X. Lotus pollen derived 3-dimensional hierarchically porous NiO microspheres for NO2 gas sensing. Sens. Actuators B Chem. 2016, 227, 554–560. [Google Scholar] [CrossRef]
- Fu, J.; Zhao, C.; Zhang, J.; Peng, Y.; Xie, E. Enhanced Gas Sensing Performance of Electrospun Pt-Functionalized NiO Nanotubes with Chemical and Electronic Sensitization. ACS Appl. Mater. Interfaces 2013, 5, 7410–7416. [Google Scholar] [CrossRef]
- Fasaki, I.; Kandyla, M.; Tsoutsouva, M.; Kompitsas, M. Optimized hydrogen sensing properties of nanocomposite NiO:Au thin films grown by dual pulsed laser deposition. Sens. Actuators B Chem. 2013, 176, 103–109. [Google Scholar] [CrossRef][Green Version]
- Shin, W.; Matsumiya, M.; Izu, N.; Murayama, N. Hydrogen-selective thermoelectric gas sensor. Sens. Actuators B Chem. 2003, 93, 304–308. [Google Scholar] [CrossRef]
- Wang, X.; Lu, J.; Han, W.; Yang, J.; Jiang, B.; Sun, Y.; Zhang, H.; Lu, G. Co-PBA MOF-derived hierarchical hollow Co3O4@NiO microcubes functionalized with Pt for superior H2S sensing. Sens. Actuators B Chem. 2021, 342, 130028. [Google Scholar] [CrossRef]
- Chen, H.-I.; Hsiao, C.-Y.; Chen, W.-C.; Chang, C.-H.; Chou, T.-C.; Liu, I.-P.; Lin, K.-W.; Liu, W.-C. Characteristics of a Pt/NiO thin film-based ammonia gas sensor. Sens. Actuators B Chem. 2018, 256, 962–967. [Google Scholar] [CrossRef]
- Majhi, S.M.; Naik, G.K.; Lee, H.-J.; Song, H.-G.; Lee, C.-R.; Lee, I.-H.; Yu, Y.-T. Au@NiO core-shell nanoparticles as a p-type gas sensor: Novel synthesis, characterization, and their gas sensing properties with sensing mechanism. Sens. Actuators B Chem. 2018, 268, 223–231. [Google Scholar] [CrossRef]
- Kruefu, V.; Wisitsoraat, A.; Phokharatkul, D.; Tuantranont, A.; Phanichphant, S. Enhancement of p-type gas-sensing performances of NiO nanoparticles prepared by precipitation with RuO2 impregnation. Sens. Actuators B Chem. 2016, 236, 466–473. [Google Scholar] [CrossRef]
- John, R.A.B.; Kumar, A.R. Tailoring on p-type conductivity of nickel oxide nanostructures by palladium for the detection of 2-methoxy ethanol. J. Mater. Sci. Mater. Electron. 2023, 34, 664. [Google Scholar] [CrossRef]
- Nakate, U.T.; Ahmad, R.; Patil, P.; Wang, Y.; Bhat, K.S.; Mahmoudi, T.; Yu, Y.T.; Suh, E.; Hahn, Y.-B. Improved selectivity and low concentration hydrogen gas sensor application of Pd sensitized heterojunction n-ZnO/p-NiO nanostructures. J. Alloys Compd. 2019, 797, 456–464. [Google Scholar] [CrossRef]
- Kandyla, M.; Chatzimanolis-Moustakas, C.; Guziewicz, M.; Kompitsas, M. Nanocomposite NiO:Pd hydrogen sensors with sub-ppm detection limit and low operating temperature. Mater. Lett. 2014, 119, 51–55. [Google Scholar] [CrossRef]
- Al-Bahrani, M.R.; Ahmad, W.; Mehnane, H.F.; Chen, Y.; Cheng, Z.; Gao, Y. Enhanced Electrocatalytic Activity by RGO/MWCNTs/NiO Counter Electrode for Dye-sensitized Solar Cells. Nano-Micro Lett. 2015, 7, 298–306. [Google Scholar] [CrossRef]
- Yang, C.; Qing, Y.; An, K.; Zhang, Z.; Wang, L.; Liu, C. Facile synthesis of the N-doped graphene/nickel oxide with enhanced electrochemical performance for rechargeable lithium-ion batteries. Mater. Chem. Phys. 2017, 195, 149–156. [Google Scholar] [CrossRef]
- Ahmad, R.; A Shah, M. Hydrothermally synthesised nickel oxide nanostructures on nickel foam and nickel foil for supercapacitor application. Ceram. Int. 2023, 49, 6470–6478. [Google Scholar] [CrossRef]
- Yadav, A.; Verma, N. Efficient hydrogen production using Ni-graphene oxide-dispersed laser-engraved 3D carbon micropillars as electrodes for microbial electrolytic cell. Renew. Energy 2019, 138, 628–638. [Google Scholar] [CrossRef]
- Irfan, M.; Liu, X.; Li, S.; Khan, I.U.; Li, Y.; Wang, J.; Wang, X.; Du, X.; Wang, G.; Zhang, P. High-performance glucose fuel cell with bimetallic Ni–Co composite anchored on reduced graphene oxide as anode catalyst. Renew. Energy 2020, 155, 1118–1126. [Google Scholar] [CrossRef]
- Refaat, Z.; El Saied, M.; Abo El Naga, A.O.; Shaban, S.A.; Hassan, H.B.; Shehata, M.R.; El Kady, F.Y. Efficient CO2 methanation using nickel nanoparticles supported mesoporous carbon nitride catalysts. Sci. Rep. 2023, 13, 4855. [Google Scholar] [CrossRef] [PubMed]
- Liu, G.-T.; Chen, H.-F.; Lin, G.-M.; Ye, P.; Wang, X.-P.; Jiao, Y.-Z.; Guo, X.-Y.; Wen, Y.; Yang, H.-F. One-step electrodeposition of graphene loaded nickel oxides nanoparticles for acetaminophen detection. Biosens. Bioelectron. 2014, 56, 26–32. [Google Scholar] [CrossRef]
- Buledi, J.A.; Liu, G.-T.; Liu, G.-T.; Liu, G.-T.; Liu, G.-T.; Liu, G.-T.; Liu, G.-T. A Reusable Nickel Oxide Reduced Graphene Oxide Modified Platinum Electrode for the Detection of Linezolid Drug. Ind. Eng. Chem. Res. 2023, 62, 4665–4675. [Google Scholar] [CrossRef]
- Dung, N.Q.; Patil, D.; Jung, H.; Kim, J.; Kim, D. NiO-decorated single-walled carbon nanotubes for high-performance nonenzymatic glucose sensing. Sens. Actuators B Chem. 2013, 183, 381–387. [Google Scholar] [CrossRef]
- Wang, B.; Gu, Y.; Chen, L.; Ji, L.; Zhu, H.; Sun, Q. Gas sensing devices based on two-dimensional materials: A review. Nanotechnology 2022, 33, 252001. [Google Scholar] [CrossRef]
- Gavgani, J.N.; Tavakoli, N.; Heidari, H.; Mahyari, M. Graphene-based nanocomposites sensors for detection of ammonia. Int. J. Environ. Anal. Chem. 2022, 1–25. [Google Scholar] [CrossRef]
- Sun, D.; Luo, Y.; Debliquy, M.; Zhang, C. Graphene-enhanced metal oxide gas sensors at room temperature: A review. Beilstein J. Nanotechnol. 2018, 9, 2832–2844. [Google Scholar] [CrossRef]
- Kiranakumar, H.V.; Thejas, R.; Naveen, C.S.; Khan, M.I.; Prasanna, G.D.; Reddy, S.; Oreijah, M.; Guedri, K.; Bafakeeh, O.T.; Jameel, M. A review on electrical and gas-sensing properties of reduced graphene oxide-metal oxide nanocomposites. Biomass-Convers. Biorefinery 2022, 1–11. [Google Scholar] [CrossRef]
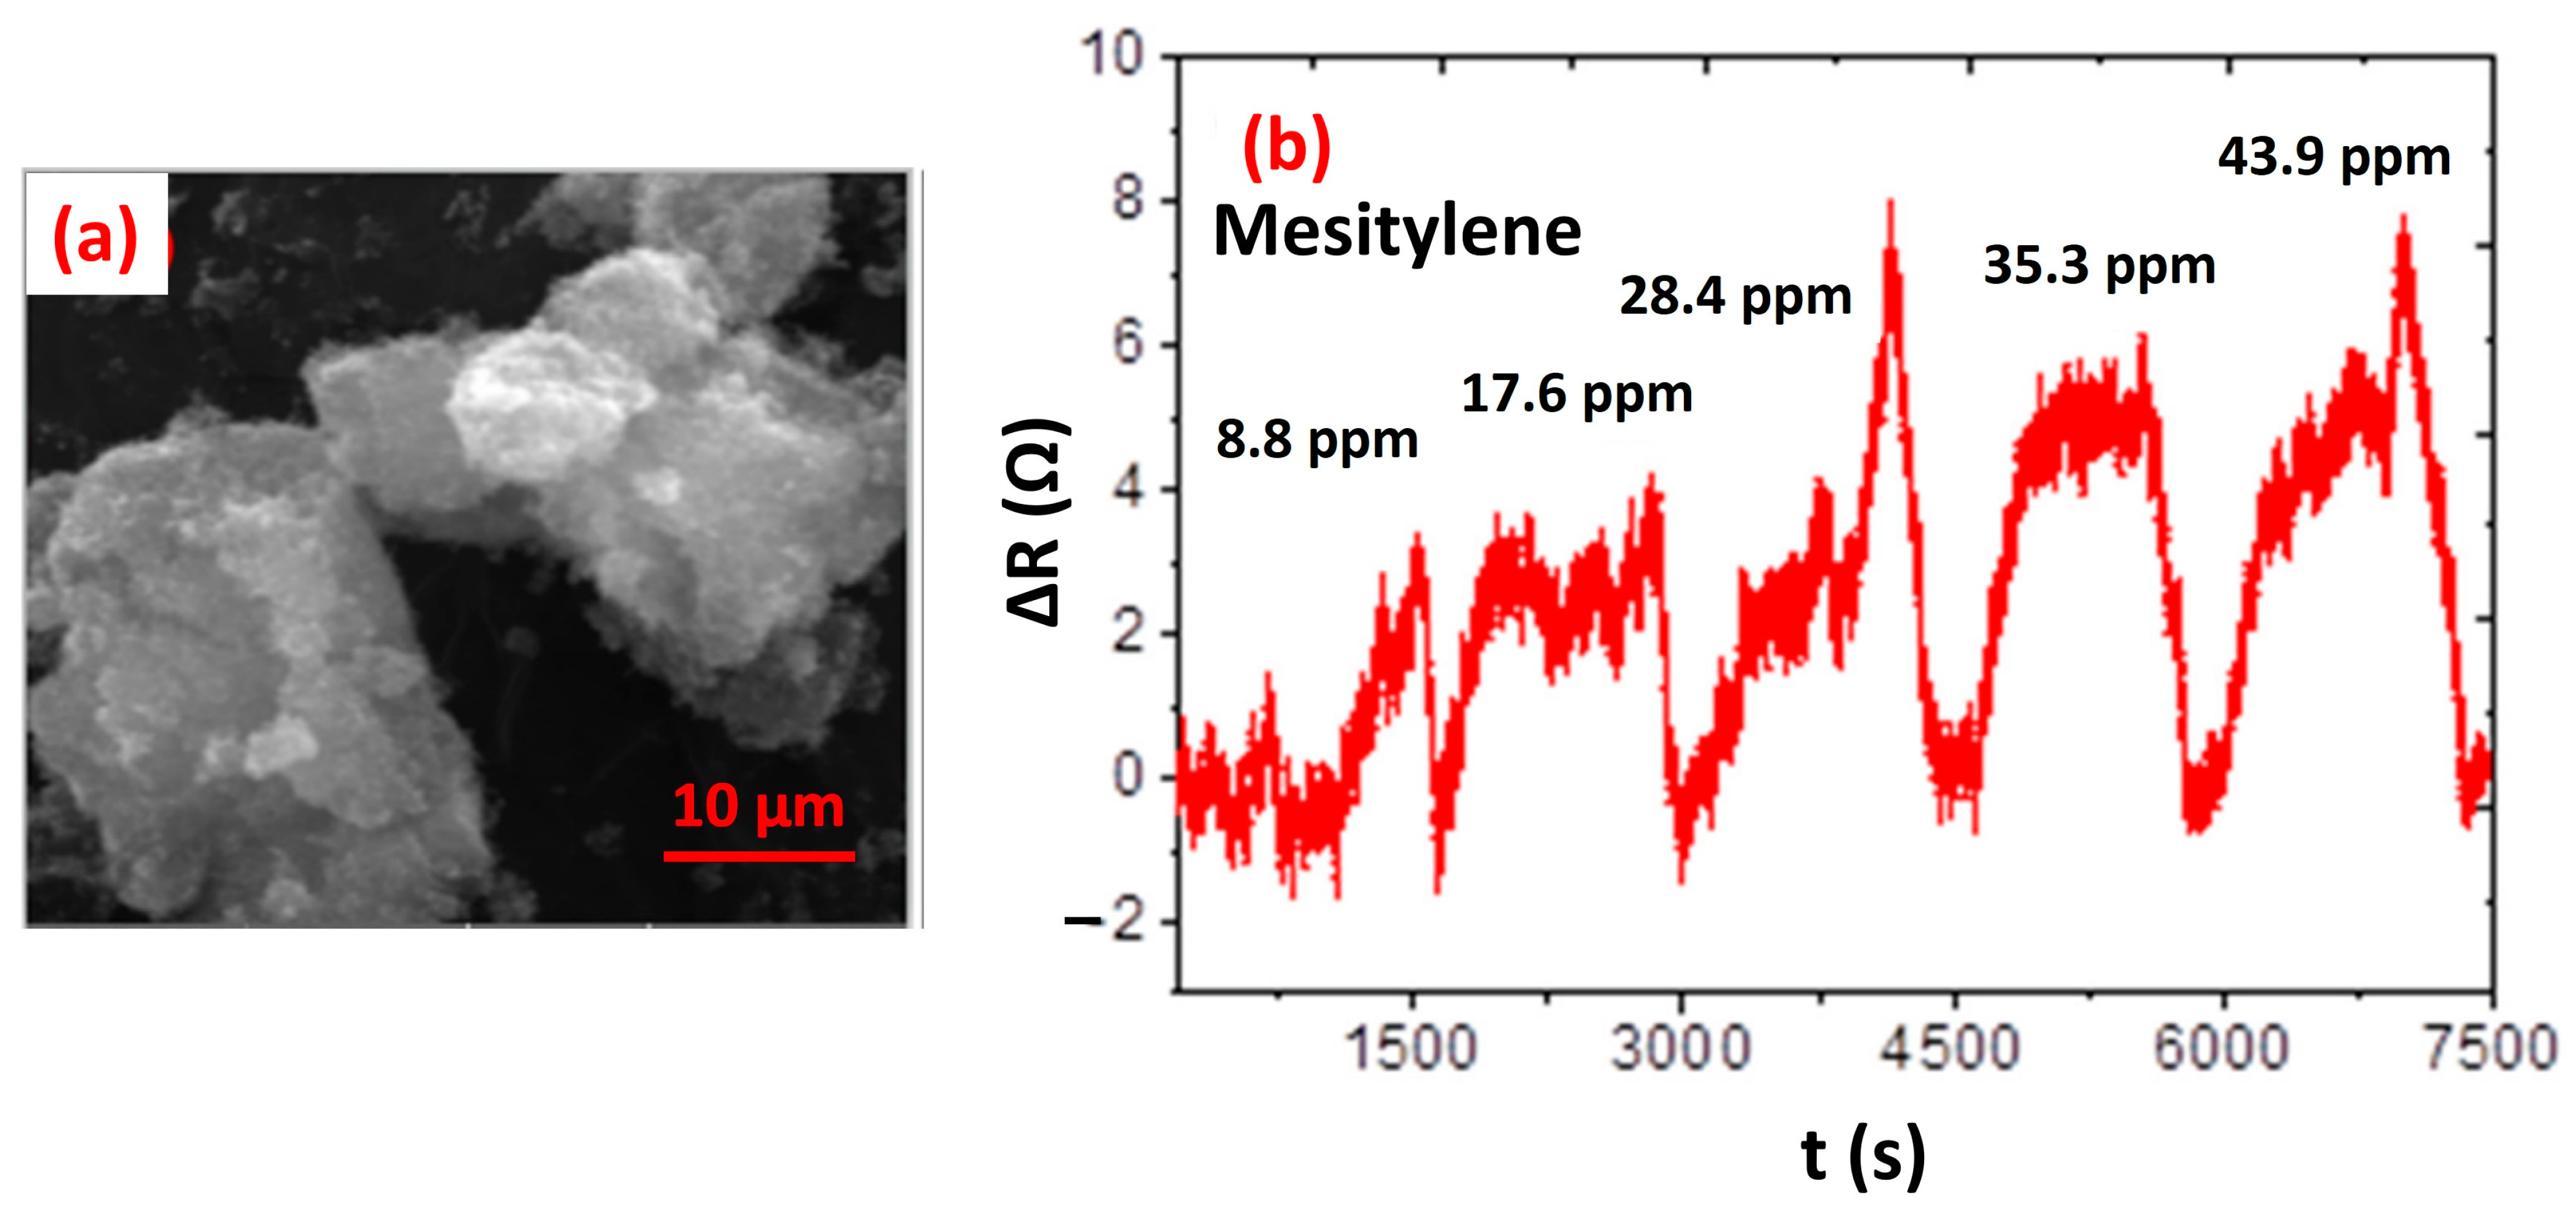
- Malepe, L.; Ndungu, P.; Ndinteh, D.T.; Mamo, M.A. Nickel Oxide-Carbon Soot-Cellulose Acetate Nanocomposite for the Detection of Mesitylene Vapour: Investigating the Sensing Mechanism Using an LCR Meter Coupled to an FTIR Spectrometer. Nanomaterials 2022, 12, 727. [Google Scholar] [CrossRef] [PubMed]
- Ngo, Y.-L.T.; Hur, S.H. Low-temperature NO2 gas sensor fabricated with NiO and reduced graphene oxide hybrid structure. Mater. Res. Bull. 2016, 84, 168–176. [Google Scholar] [CrossRef]
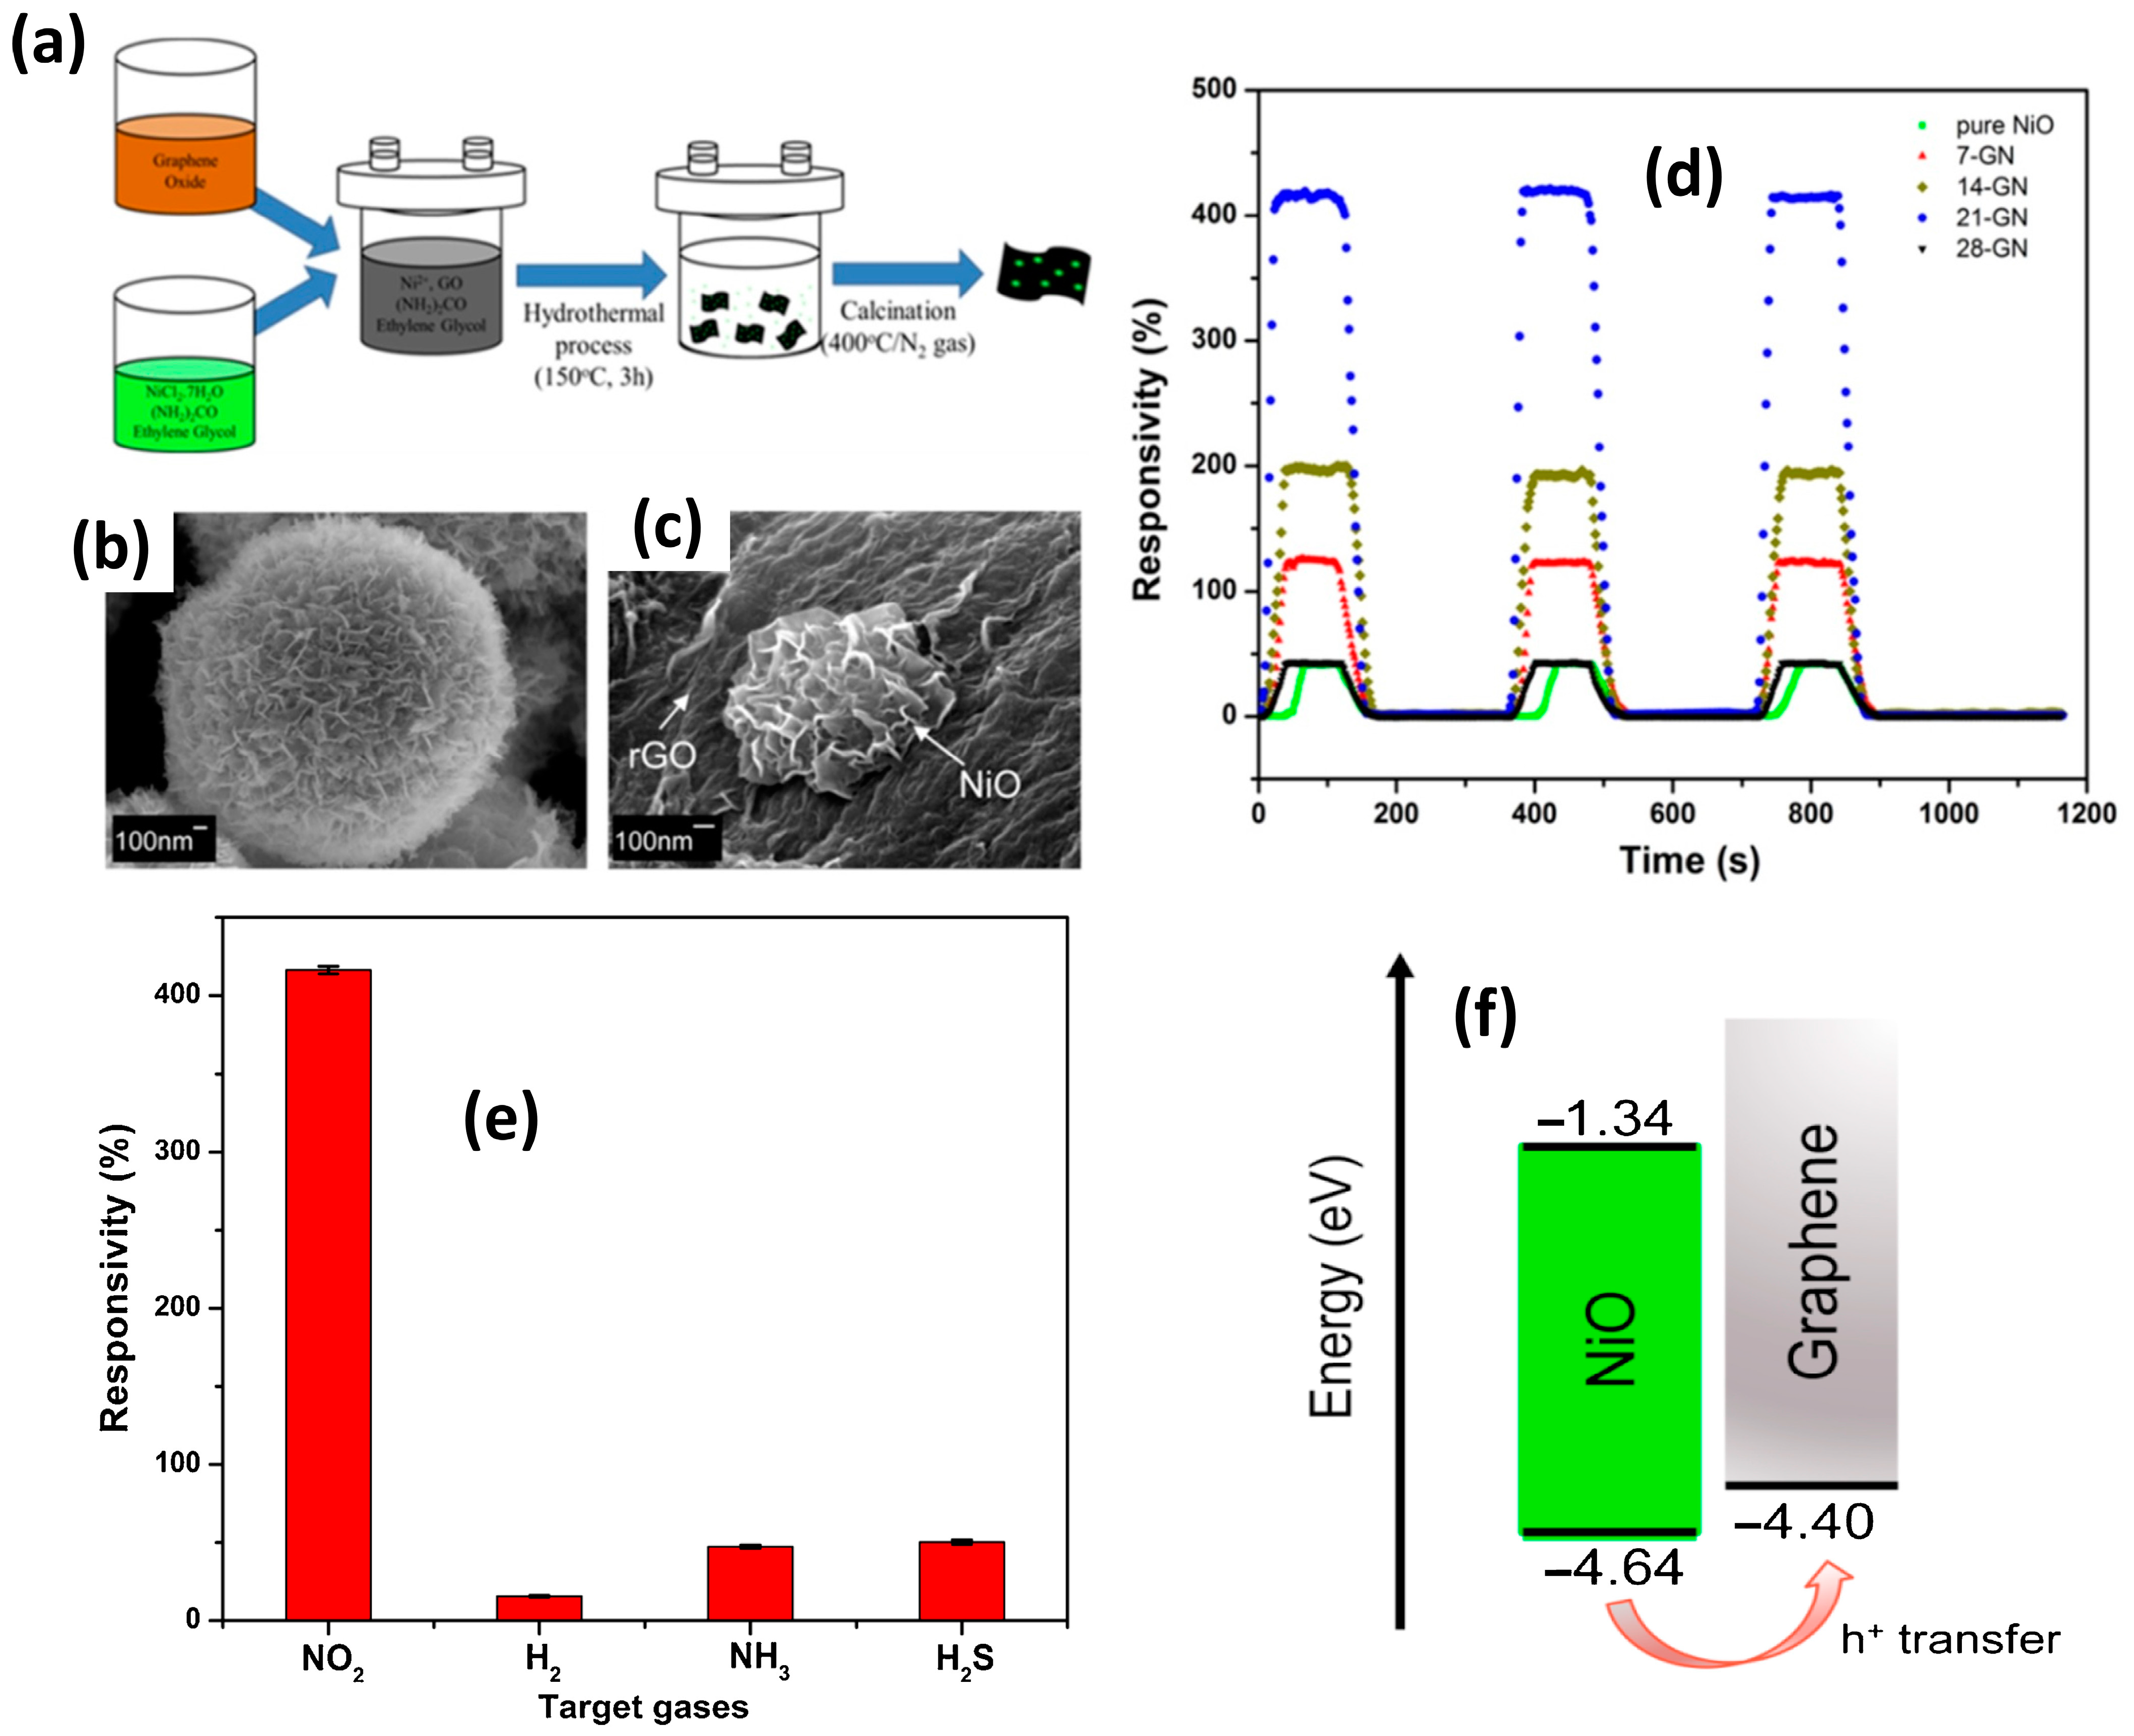
- Hoa, L.T.; Tien, H.N.; Luan, V.H.; Chung, J.S.; Hur, S.H. Fabrication of a novel 2D-graphene/2D-NiO nanosheet-based hybrid nanostructure and its use in highly sensitive NO2 sensors. Sens. Actuators B Chem. 2013, 185, 701–705. [Google Scholar] [CrossRef]
- Zhang, D.; Chang, H.; Li, P.; Liu, R. Characterization of nickel oxide decorated-reduced graphene oxide nanocomposite and its sensing properties toward methane gas detection. J. Mater. Sci. Mater. Electron. 2016, 27, 3723–3730. [Google Scholar] [CrossRef]
- Bayoumy, A.M.; Gomaa, I.; Elhaes, H.; Sleim, M.; Ibrahim, M.A. Application of Graphene/Nickel Oxide Composite as a Humidity Sensor. Egypt. J. Chem. 2021, 64, 85–91. [Google Scholar]
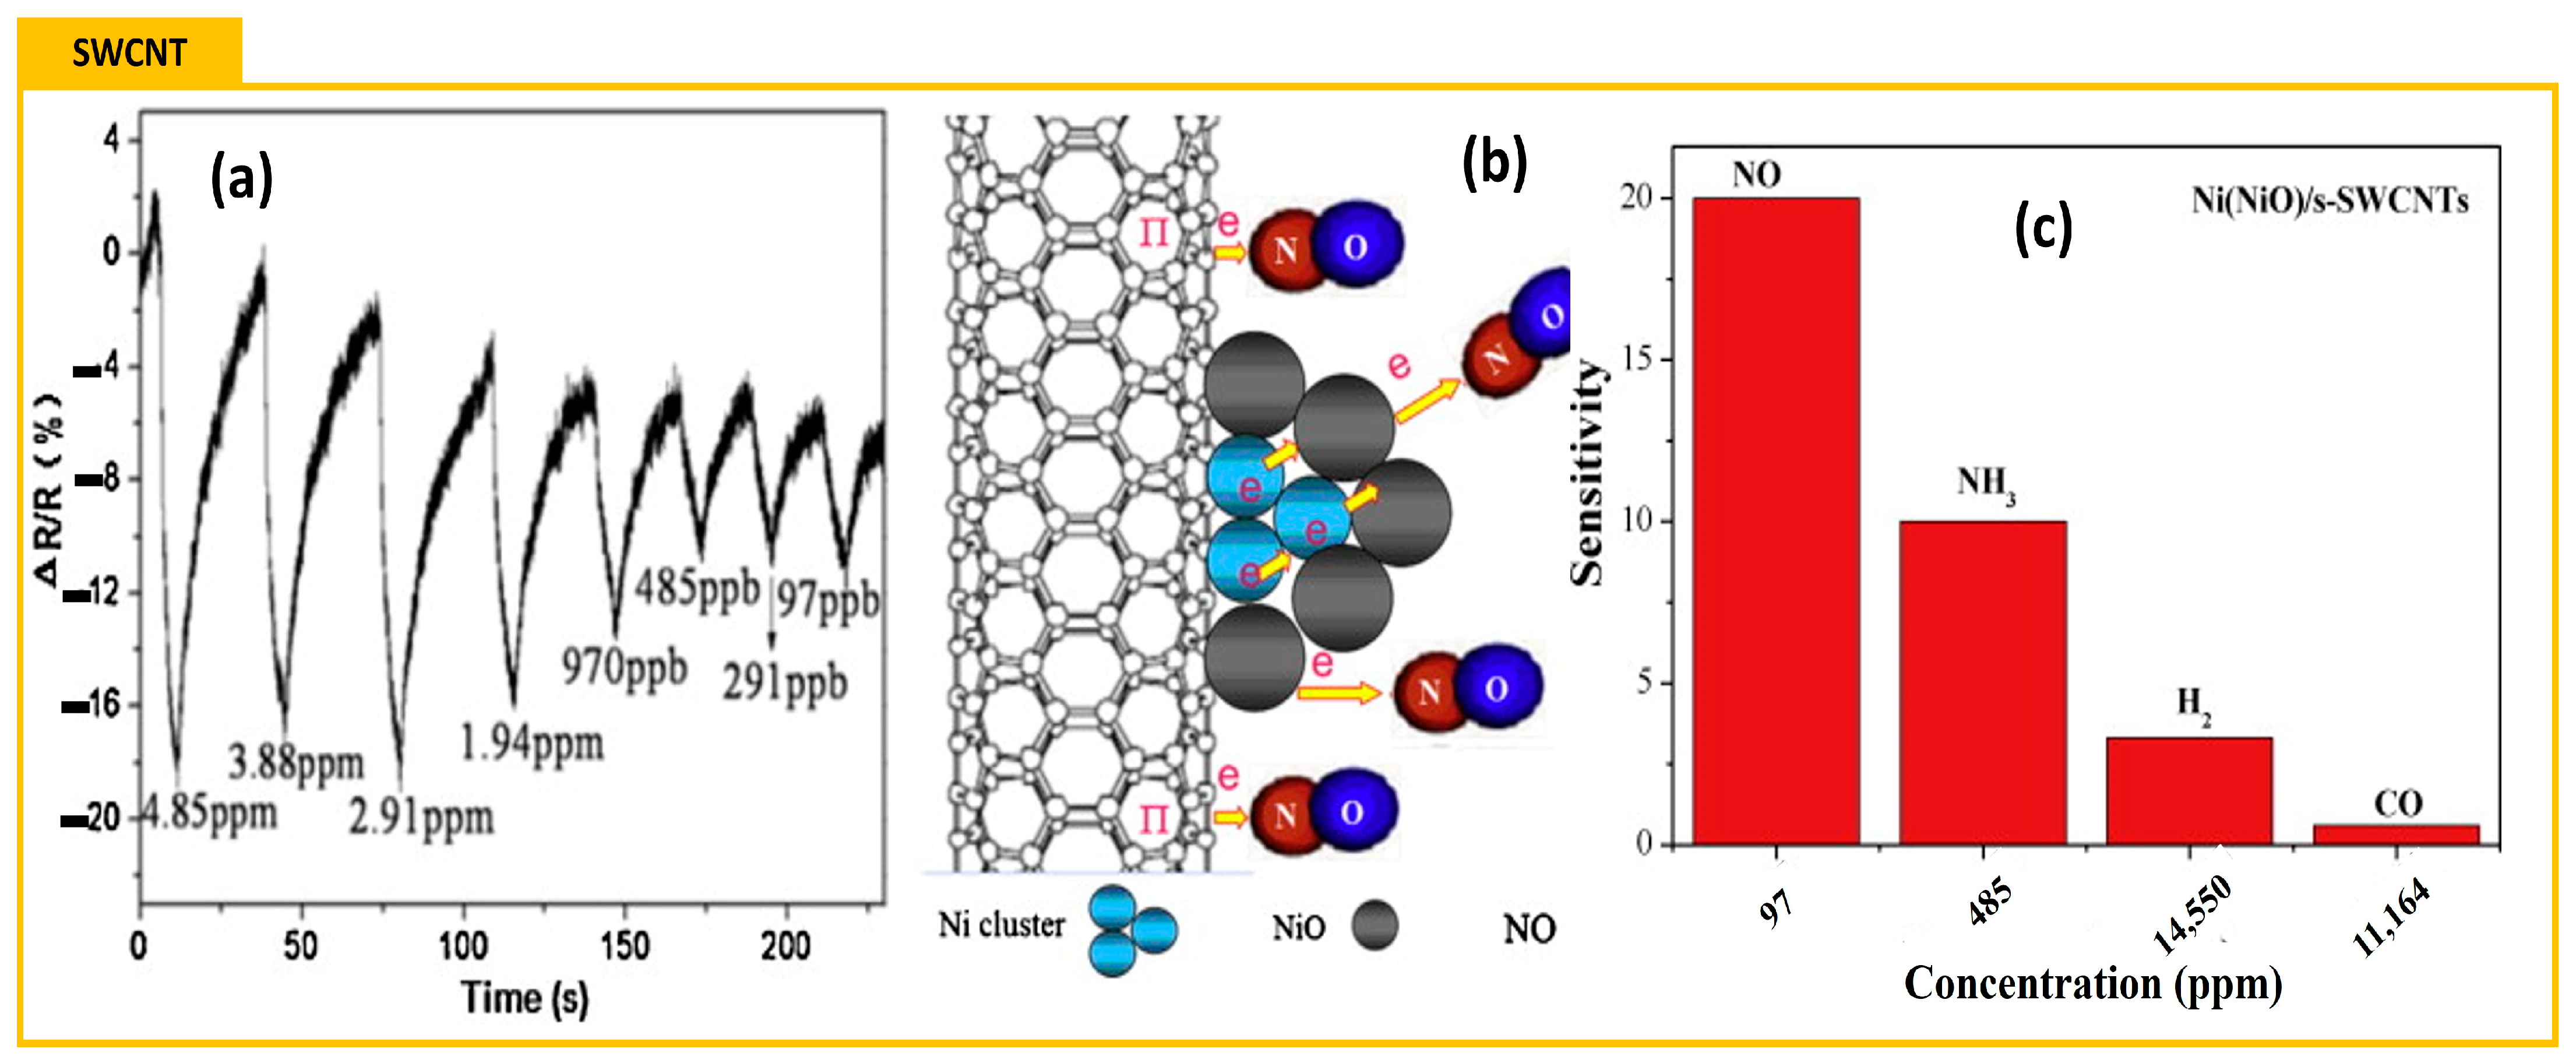
- Li, L.; Zhang, G.; Chen, L.; Bi, H.-M.; Shi, K.-Y. Ni(NiO)/single-walled carbon nanotubes composite: Synthesis of electro-deposition, gas sensing property for NO gas and density functional theory calculation. Mater. Res. Bull. 2013, 48, 504–511. [Google Scholar] [CrossRef]
- Chen, N.; Li, Q.; Li, Y.; Deng, D.; Xiao, X.; Wang, Y. Facile synthesis and gas sensing performances based on nickel oxide nanoparticles/multi-wall carbon nanotube composite. J. Mater. Sci. Mater. Electron. 2015, 26, 8240–8248. [Google Scholar] [CrossRef]
- Adekunle, A.S.; Ozoemena, K.I. Electron transfer behaviour of single-walled carbon nanotubes electro-decorated with nickel and nickel oxide layers. Electrochim. Acta 2008, 53, 5774–5782. [Google Scholar] [CrossRef]
- Hua, C.; Shang, Y.; Wang, Y.; Xu, J.; Zhang, Y.; Li, X.; Cao, A. A flexible gas sensor based on single-walled carbon nanotube-Fe2O3 composite film. Appl. Surf. Sci. 2017, 405, 405–411. [Google Scholar] [CrossRef]
- Lu, G.; Ocola, L.E.; Chen, J. Room-temperature gas sensing based on electron transfer between discrete tin oxide nanocrystals and multiwalled carbon nanotubes. Adv. Mater. 2009, 21, 2487–2491. [Google Scholar] [CrossRef]
- Govind, A.; Bharathi, P.; Mathankumar, G.; Mohan, M.K.; Archana, J.; Harish, S.; Navaneethan, M. Enhanced charge transfer in 2D carbon- rich g-C3N4 nanosheets for highly sensitive NO2 gas sensor applications. Diam. Relat. Mater. 2022, 128, 109205. [Google Scholar] [CrossRef]
- Li, X.; Wang, Y.; Tian, W.; Cao, J. Graphitic Carbon Nitride Nanosheets Decorated Flower-like NiO Composites for High-Performance Triethylamine Detection. ACS Omega 2019, 4, 9645–9653. [Google Scholar] [CrossRef] [PubMed]
- Srirattanapibul, S.; Nakarungsee, P.; Issro, C.; Tang, I.-M.; Thongmee, S. Performance of NiO intercalated rGO nanocomposites for NH3 sensing at room temperature. Mater. Sci. Semicond. Process. 2022, 137, 106221. [Google Scholar] [CrossRef]
- Yang, M.; Zhang, X.; Cheng, X.; Xu, Y.; Gao, S.; Zhao, H.; Huo, L. Hierarchical NiO Cube/Nitrogen-Doped Reduced Graphene Oxide Composite with Enhanced H2S Sensing Properties at Low Temperature. ACS Appl. Mater. Interfaces 2017, 9, 26293–26303. [Google Scholar] [CrossRef]
- Kamal, T. High performance NiO decorated graphene as a potential H2 gas sensor. J. Alloys Compd. 2017, 729, 1058–1063. [Google Scholar] [CrossRef]
- Kavitha, G.; Vinoth Kumar, J.; Arulmozhi, R.; Kamath, S.M.; Priya, A.K.; Rao, K.S.; Abirami, N. 2D graphene supported nickel oxide nano-composite for fiber optic ethanol gas sensing, removal of azo dye, and biological activity. J. Mater. Sci. Mater. Electron. 2022, 33, 9498–9511. [Google Scholar] [CrossRef]
- Jung, D.; Han, M.; Lee, G.S. Gas-sensing properties of multi-walled carbon-nanotube sheet coated with NiO. Carbon 2014, 78, 156–163. [Google Scholar] [CrossRef]
- Yan, Y.; Yang, G.; Xu, J.-L.; Zhang, M.; Kuo, C.-C.; Wang, S.-D. Conducting polymer-inorganic nanocomposite-based gas sensors: A review. Sci. Technol. Adv. Mater. 2020, 21, 768–786. [Google Scholar] [CrossRef]
- Šetka, M.; Drbohlavová, J.; Hubálek, J. Nanostructured Polypyrrole-Based Ammonia and Volatile Organic Compound Sensors. Sensors 2017, 17, 562. [Google Scholar] [CrossRef]
- Hu, Q.; Wang, Z.; Chang, J.; Wan, P.; Huang, J.; Feng, L. Design and preparation of hollow NiO sphere- polyaniline composite for NH3 gas sensing at room temperature. Sens. Actuators B Chem. 2021, 344, 130179. [Google Scholar] [CrossRef]
- Singh, P.; Kushwaha, C.S.; Shukla, S.; Dubey, G. Synthesis and Humidity Sensing Properties of NiO Intercalated Polyaniline Nanocomposite. Polym. Technol. Mater. 2019, 58, 139–147. [Google Scholar] [CrossRef]
- Ramesan, M.T.; Nushhat, K.; Parvathi, K.; Anilkumar, T. Nickel oxide @ polyindole/phenothiazine blend nanocomposites: Preparation, characterization, thermal, electrical properties and gas sensing applications. J. Mater. Sci. Mater. Electron. 2019, 30, 13719–13728. [Google Scholar] [CrossRef]
- Ramesan, M.T.; Santhi, V. Synthesis, characterization, conductivity and sensor application study of polypyrrole/silver doped nickel oxide nanocomposites. Compos. Interfaces 2018, 25, 725–741. [Google Scholar] [CrossRef]
- Zhang, J.; Wu, C.; Li, T.; Xie, C.; Zeng, D. Highly sensitive and ultralow detection limit of room-temperature NO2 sensors using in-situ growth of PPy on mesoporous NiO nanosheets. Org. Electron. 2020, 77, 105504. [Google Scholar] [CrossRef]


| Structure | Temperature (°C) | Duration (min) | Crystallite Size (nm) | Pressure (mbar) |
|---|---|---|---|---|
| Granular films with the formation of cracks when increasing temperature [51] | 500 | 240 | 17 | NA |
| 600 | 240 | 21 | NA | |
| 700 | 240 | 41 | NA | |
| 800 | 240 | 45 | NA | |
| Cellular and porous structure [52] | 700 | 17 | N/A | 1013.25 |
| Granular film [49] | 500 | 240 | 31 | NA |
| 600 | 240 | 38 | NA | |
| 700 | 240 | 52 | NA | |
| 800 | 240 | 73 | NA | |
| Compact morphology with columnar and facetted NiO grains [52] | 1100 | 2000 | N/A | 1013.25 |
| Coarse-grained structure [53] | 1400 | 1200 | N/A | 1 |
| Nanosized granular surface [54] | 400 | 60 | N/A | NA |
| Nano-rings [54] | 600 | 60 | N/A | NA |
| Slightly porous film with pseudospherical particles [54] | 800 | 60 | N/A | NA |
| Nanoplates of NiO with an average thickness of 17 nm [54] | 500 | 240 | N/A | NA |
| Gas Species | Gas Concentration (ppm) | Experiment | Morphology | Operating Temperature | ) or Gas Response |
|---|---|---|---|---|---|
| Hydrogen | 200 | Hydrothermal approach [159] | Nanoparticles | 250 °C | 97.2% |
| 50 | Ultrasonic spray pyrolysis [160] | Angular grains | 250 °C | 17 | |
| 5000 | Sputtering + Plasma oxidation [21] | Nanobeam | 25 °C | 45% | |
| 5000 | Sputtering + thermal oxidation [21] | Nanobeam | 25 °C | 9 | |
| Ethanol | 5 | DC reactive magnetron sputtering [20] | Granular film | 250 °C | 6% |
| 5 | Electrodeposition [81] | Nano-roses | 230 °C | 9.11 * | |
| 100 | Solvothermal reaction [161] | Nanorod-flowers | 200 °C | 1.9 * |
| X-NiO | Structure | Target Gas | Operating Temperature (°C) | Response | Response Time/Recovery Time (s/s) |
|---|---|---|---|---|---|
| X = ZnO | Hollow microspheres [192] | Toluene (100 ppm) | 300 | 240 | 2/33 |
| NPs-decorated hierarchical structure [193] | Isopropanol (100 ppm) | 280 | 52.4 | 8/50 | |
| Multi-junction interconnected structure [194] | Acetone (100 ppm) | RT | 6.06 | 28/34 | |
| NPs [195] | Ammonia (3000 ppm) | RT | 0.278 | 50/5–7 | |
| Nanofibers [196] | Ammonia (300 ppm) | RT | 0.46 | 100/25 | |
| Nanosheets [197] | Ammonia (18 ppm) | 35 | 0.558 | 8/28 | |
| X = SnO2 | One-dimensional nanorods/two-dimensional porous nanosheets heterostructure [198] | Ethanol (100 ppm) | 300 | 25.7 | 17/23 |
| NPs-decorated thin film [199] | Formaldehyde (50 ppm) | 210 | 31.04 | 18/105 | |
| Double-layered heterostructure [200] | Sulfur dioxide (2 ppm) | 250 | 0.3 | 48/51 | |
| Composite [201] | Carbon oxide (400 ppm) | 350 | NA | 63/77 | |
| Nanocrystals/porous nanosheets structure [202] | Hydrogen (400 ppm) | 350 | NA | 29/49 | |
| NPs/nanocuboids [203] | Triethylamine (100 ppm) | 400 | 78.5 | <3/120 | |
| NPs-decorated thin film [199] | Ethanol (100 ppm) | 350 | 84 | 3/NA | |
| X = Fe2O3 | Nanosheets/nano-prisms [183] | n-butanol (100 ppm) | 200 | 24.15 | 120/6 |
| NPS/nanofibers [204] | Hydrogen (1000 ppm) | 250 | 199.24 | 11/105 | |
| Hollow-out loaded nanorods [205] | Ethanol (10 ppm) | 150 | 51.2 | NA | |
| X = NiFe2O4 | Nanocubes with porous heterostructure [206] Fiber-in-tube heterostructure [207] | Trimethylamine (100 ppm) | 170 | 10.7 | 28.8/20.8 |
| Toluene (100 ppm) | 170 | 19 | 19.6/81.3 | ||
| Formaldehyde (100 ppm) | 170 | 24.9 | 10/11.6 | ||
| Triethylamine (100 ppm) | 170 | 56.4 | 11.2/14.4 | ||
| Ethanol (100 ppm) | 170 | 58.4 | 16.8/13.7 | ||
| Aniline (100 ppm) | 170 | 96.8 | 29.4/164.6 | ||
| Ethyl acetate (100 ppm) | 170 | 129 | 26/15.8 | ||
| Acetone (100 ppm) | 170 | 150.3 | 12.8/15.6 | ||
| Triethylamine (50 ppm) | 300 | 8.93 | 16/3 | ||
| X = In2O3 | Cuboid heterostructure [208] | n-butanol (100 ppm) | 350 | 412 | 6/<2500 |
| Nanowires/three-dimensional porous foam [209] | Ethylene glycol (100 ppm) | 125 | 160.72 | 8.7/19.3 | |
| Porous nanoflower-like composite [210] | Methane (4000 ppm) | 340 | 2 | NA | |
| Nanospheric composite [211] | Carbon oxide (300 ppm) | 280 | 8 | NA | |
| Flower-like microspheres with nanoneedles [212] | N-propanol (100 ppm) | 250 | NA | NA | |
| Nanowires/three-dimensional porous foam [209] | Trimethylamine (10 ppm) | 200 | 20.51 | 39/43 | |
| X = TiO2 | Nanosheets/nano-rods [213] NPs [214] | Hydrogen (1000 ppm) Carbon oxide (1000 ppm) Acetone (50 ppm) | 25 25 25 (under UV) 300 | 2.09 0.06 <6 25 | NA NA NA NA |
| X = CuO | Hydrangea-like composite [190] | Hydrogen sulfide (1 ppm) | 25 | 11 | NA |
| X = MnO2 | Nanosheets [215] | Allyl Mercaptan (40 ppm) | 275 | 11.28 | 115/25 |
| X = In2S3 | Foam/thin film [216] | Ethylene glycol (100 ppm) | 150 | 180.39 | 11.43/6.16 |
| X = Ti3C2Tx MXene | NPs/stacked accordion-like structure [217] | Ammonia (50 ppm) | RT | 6.13 | 60/19 |
| X = WO3 | Ball-flower-like composite [218] | Nitrogen dioxide (10 ppm) | 200 | 16.06 | 9/13 |
| X = MoO3 | Nanolamella [219] | Hydrogen (200 ppm) | RT | <1.5 | 60/148 |
| Core-shell heterostructure (nanorods/nanosheets) [220] | Ethyl acetate (100 ppm) | 250 | 34.91 | 67/82 |
| Structure | Noble Metal | Gas Species | Temperature (°C) | Response | Response Time/Recovery Time (s/s) |
|---|---|---|---|---|---|
| NiO yolk–shell nanoparticles [223] | Au | H2S (5 ppm) | 300 | 108.92 | NA |
| NiO microspheres [226] | Pd | NO2 (1.8 ppm) | 50 | 1.33 | 430/936 |
| NiO nanotubes [227] | Pt | Ethanol (100 ppm) | 200 | 20.85 | NA |
| NiO thin film [228] | Au | H2 (2000 ppm) | 128 | <20 | NA |
| NiO thin film [229] | Pt | H2 (3% H2/air) | 45 | 305 * | NA |
| NiO–TiO2 composite [225] | Ag | Acetone (100 ppm) | 90 | 0.70 | 25/40 |
| NiO–Co3O4 composite [230] | Pt | H2S (100 ppm) | 200 | 250 | 213/135 |
| NiO microspheres [226] | Pd | NO2 (1.8 ppm) | 250 | 203 | 73/169 |
| NiO thin film [231] | Pt | NH3 (1000 ppm) | 300 | 1278 | 15/76 (at 350 °C) |
| NiO nanoparticles [232] | Au | Ethanol (100 ppm) | 200 | 2.54 | 250/420 |
| NiO nanoparticles [233] | Ru | Ethanol (2000 ppm) | 350 | 35.9 | 35/NA |
| NiO nanoparticles [234] | Pd | 2-methoxy ethanol (100 ppm) | 25 | 4882 | 3.68/3.76 |
| NiO–ZnO nanocomposite [235] | Pd | H2 (100 ppm) | 225 | 0.72 | NA |
| NiO film [236] | Pd | H2 (0.7 ppm) | 130 | 0.135 | 600/NA |
| Structure | Carbon Compound | Gas Species | Temperature (°C) | Response |
|---|---|---|---|---|
| NiO nanoparticles [250] | Carbon soot | Mesitylene (43.9 ppm) | RT | NA |
| NiO granular structure [253] | rGO | Methane (1000 ppm) | 260 | 0.15 |
| NiO nanoparticles [262] | rGO | NH3 (100 ppm) | RT | 4.14 |
| NiO nanosheets [252] | rGO | NO2 (15 ppm) | N/A | <7 |
| NiO hierarchical cubes [263] | N-doped rGO | H2S (50 ppm) | 92 | 31.95 |
| Hexagonal NiO nanosheets [142] | rGO | NO2 (60 ppm) | RT | >7 |
| Flower-like NiO microspheres [251] | rGO | NO2 (100 ppm) | 100 | NA |
| NiO rod-shaped particles [264] | Graphene | H2 (2000 ppm) | 200 | 0.524 |
| NiO nanoparticles [265] | Graphene oxide | Ethanol (500 ppm) | RT | >0.2 |
| NiO nanoparticles [255] | SWCNT | NO (97 ppb) | 18 | 0.05 |
| Aggregated flake-like NiO [256] | MWCNT | Ethanol (500 ppm) | 180 | 3 |
| NiO particles [266] | Carbon nanotubes | H2 (5 sccm) | RT | <0.03 |
| Flower-like NiO [261] | Carbon nitride | TEA (500 ppm) | 280 | 20.03 |
| Structure | Conducting Polymer | Gas Species | Temperature | Response |
|---|---|---|---|---|
| NiO hollow spheres [269] | PANI | NH3 (10 ppm) | RT | 0.431 |
| NiO spheres [269] | PANI | NH3 (10 ppm) | RT | 0.287 |
| NiO nanoparticles [271] | PIN/PTZ blend | NH3 (100 ppm) | RT | >0.9 |
| Ag–NiO nanoparticles [272] | PPy | NH3 (100 ppm) | RT | <0.5 |
| Mesoporous NiO nanosheets [273] | PPy | NO2 (60 ppm) | RT | 45 |
Disclaimer/Publisher’s Note: The statements, opinions and data contained in all publications are solely those of the individual author(s) and contributor(s) and not of MDPI and/or the editor(s). MDPI and/or the editor(s) disclaim responsibility for any injury to people or property resulting from any ideas, methods, instructions or products referred to in the content. |
© 2024 by the authors. Licensee MDPI, Basel, Switzerland. This article is an open access article distributed under the terms and conditions of the Creative Commons Attribution (CC BY) license (https://creativecommons.org/licenses/by/4.0/).
Share and Cite
Ben Arbia, M.; Comini, E. Growth Processing and Strategies: A Way to Improve the Gas Sensing Performance of Nickel Oxide-Based Devices. Chemosensors 2024, 12, 45. https://doi.org/10.3390/chemosensors12030045
Ben Arbia M, Comini E. Growth Processing and Strategies: A Way to Improve the Gas Sensing Performance of Nickel Oxide-Based Devices. Chemosensors. 2024; 12(3):45. https://doi.org/10.3390/chemosensors12030045
Chicago/Turabian StyleBen Arbia, Marwa, and Elisabetta Comini. 2024. "Growth Processing and Strategies: A Way to Improve the Gas Sensing Performance of Nickel Oxide-Based Devices" Chemosensors 12, no. 3: 45. https://doi.org/10.3390/chemosensors12030045
APA StyleBen Arbia, M., & Comini, E. (2024). Growth Processing and Strategies: A Way to Improve the Gas Sensing Performance of Nickel Oxide-Based Devices. Chemosensors, 12(3), 45. https://doi.org/10.3390/chemosensors12030045