Abstract
In a typical ultra-deep high-temperature and high-pressure heterogeneous reservoir in Xinjiang, gas channeling quickly occurs during gas injection because of the heterogeneity of the reservoir, the low viscosity of gas injection, and the high gas-oil fluidity ratio. The identification and prediction methods of gas channeling in gas injection development were studied. First, gas channeling discrimination parameters were determined by the numerical simulation method. According to the ratio of gas to oil produced and the composition of oil and gas produced, the flow stages of formation fluid were divided into five regions: gas phase zone, two-phase zone, miscible zone, dissolved gas and oil zone, and original oil zone. The basis for gas channeling identification (namely, the field characterization parameters for gas channeling discrimination) was discovered through analysis and the knowledge of the operability of field monitoring data as the following two parameters: (1) the C1 content rising again on the previous platform when the trailing edge of the two-phase zone is produced and (2) the continuous rise of the gas-oil ratio in production. Then, considering the original high-pressure characteristics of the reservoir, the field characterization parameters of gas channeling under different formation pressures in the exploitation process (namely, C1 content and gas-oil ratio) were simulated and determined. Thus, a gas channeling discrimination method was established for gas injection development in ultra-deep high-temperature and high-pressure heterogeneous reservoirs. According to this gas injection approach, a gas channeling discrimination method was developed, and the field gas channeling judgment was carried out for a gas injection effective D1 well. The results of gas tracer detection were compared to verify the accuracy of this method, leading to strong support for this method in slowing down the gas channeling.
1. Introduction
Gas injection has become an important method to improve oil recovery in ultra-deep heterogeneous reservoirs. However, in the process of gas injection development, due to the heterogeneity of the formation, with the increase of the injected pore volume multiple (PV), the leading edge of the injected gas will form a dominant flow channel along the highly permeable layer in the formation and break through to the bottom of the production well (gas crossing phenomenon), which reduces the sweep coefficient of the injected gas and leads to the poor development effect of gas injection.
Gas channeling is generally judged by a large rise in gas-oil ratio [1]. Studies on gas injection and gas channeling in gas cap reservoirs and condensate gas reservoirs have been conducted in China, mainly in the analysis of influencing factors of gas channeling and prevention of gas channeling [1,2,3,4,5,6,7,8,9,10,11]. However, there are few studies on the definition of gas channeling in gas injection drive. At present, only Si Yong studied the identification of gas injection and gas channeling in a fractured buried hill reservoir in 2020 [12]. He used numerical simulation to analyze the characteristic curves of production gas-oil ratio in different gas channeling directions, and concluded that there were different gas-oil ratio derivative curve characteristics in three different gas channeling types: top, bottom, and transverse. However, for ultra-deep and high-pressure heterogeneous complex reservoirs, the gas-oil ratio has several upward changes in different stages of the gas injection production process, so the gas channeling cannot be judged solely from the gas-oil ratio or its derivative change, and the variation characteristics of gas-oil ratio and other gas channeling characterization parameters in different fluid phase zones and pressure drop process should be considered.
The current judgment methods of gas channeling mainly include the empirical parameter method [2,3,7,13], plate method [14], numerical simulation method [15], and dynamic monitoring method [6,16]. Among them, the first two methods are mainly applied in the judgment of gas channeling in condensate gas reservoirs [13,17], and dynamic monitoring discriminant method is commonly used in gas channeling discrimination [8,9,10], such as the gas flooding front technology monitored by microseismic monitoring or the dynamic tracer monitoring method, while the numerical simulation method is more mature in the judgment of gas channeling in hydrocarbon reservoir injection. The numerical simulation method can establish the 3D geological model corresponding to the actual reservoir situation and set up a corresponding component model scheme for injected gas. Therefore, the numerical simulation method has strong adaptability and practicability in judging gas channeling in reservoir gas injection.
Taking an oil reservoir in Xinjiang as an example, the author used the numerical simulation method to analyze and find the characterization parameters of gas channeling, due to the heterogeneity in the gas injection process, and finally established a gas channeling discrimination method for ultra-deep high-temperature and high-pressure heterogeneous reservoirs.
2. Materials and Methods
2.1. Reservoir Profile
In the study of an ultra-deep high-temperature and high-pressure heterogeneous reservoir in Xinjiang, there are intercalations between and within each sand group. The average porosity of the reservoir was 15.1% and the average permeability was 68.1 mD. The 0 and 1 sand groups belonged to low porosity and low permeability reservoirs, and the 2, 3, and 5 sand groups belonged to medium porosity and medium permeability reservoirs, and the overall performance of the reservoir was medium porosity and medium permeability reservoirs. The surface oil density was 0.8547–0.8778 g/cm3, the viscosity was 5.23–12.47 MPa·s (20 °C), the original formation pressure was 62.38 MPa, the pressure coefficient was 1.12, and the original formation temperature was 140 °C. Since 2014, major development tests of top natural gas injection assisted gravity flooding have been carried out. By the end of December 2021, 13 wells had been opened, with a daily oil level of 379 T at the wellhead and a comprehensive water cut of 48.84%. The gas viscosity was small, the gas-oil fluidity ratio was high, and the gas channeling phenomenon occurred easily, which lead to the low sweep coefficient, especially reservoir heterogeneity which aggravated the gas channeling. There were four gas injection wells in this reservoir. At present, with the progress of gas injection, the overall gas-oil ratio has kept rising, which has led to the deterioration of gas injection development effect. Therefore, it is urgent to identify gas channeling to prevent gas channeling.
2.2. Numerical Model Establishment and PVT Fitting of Crude Oil
In this study, a single well mechanism numerical simulation model was established.
With the PVTi phase calculation software of Eclipse [18] and the combination of reservoir geological parameters, a three-dimensional three-phase component mechanism model was established to fit multiple indexes, such as crude oil density under the crude oil formation condition, gas-oil ratio in flash test, saturation pressure, and PV relationship in the isocomponent expansion test. By analyzing the variation of gas-oil ratio and molar content of each component of produced gas in different fluid phase zones, and combining with the operability of field monitoring data, the characterization parameters of gas channeling discriminating in the field can be determined.
The PR equation of state was selected for simulation, and then appropriate critical parameters of state equation were selected for regression to fit the experimental results. The critical parameters of each component after regression were obtained for the prediction calculation and simulation study of fluid. A Cartesian grid system was used in the model (Table 1), with a total of 51 × 31 × 119 grids, with a grid size of 800 × 400 × 100 and injection-production well spacing of 400 m.

Table 1.
Main parameters of the numerical simulation mechanism model.
The setting parameters of the numerical simulation mechanism model are shown in the following table.
The reservoir in Xinjiang had the advantage of rich natural gas resources and had oil displacement properties under ultra-high-temperature conditions; in addition, the physical properties of crude oil was good, and so was suitable for the injection of natural gas to enhance oil recovery via the injection of more gas components (mainly methane).
The intermediate hydrocarbon content in the well flow of a reservoir in Xinjiang was 0.1182 and the content above C7 was 0.75931. At 140 °C and 47.9 MPa, the gas-oil ratio was 15.1 m3/m3. The bubble point pressure of crude oil was low at 6.072 MPa. The volume coefficient of crude oil was 1.0904 m3/m3. The shrinkage rate of crude oil was 8.29% and its shrinkage was low; the average gas dissolution coefficient was 2.487 m3/m3/MPa and the average gas dissolution coefficient was low. Crude oil density was low at 0.8549 g/cm3. The above showed that the reservoir had good physical properties of crude oil, suitable for gas injection to enhance oil recovery.
By adjusting the thermodynamic parameters of heavy components, mainly C11+, the above main indexes were fitted. After fitting, the calculated values of the software were compared with the measured values (Table 2). Overall, the fitting errors of several main indicators were below 5%.
Table 2.
Matching comparison of main properties of formation crude oil fluid.
The software calculated that the value of the relative volume fitted by PV relationship was basically consistent with the experimental measured value. The pressure-density relationship was also very close, the error was generally below 1%, the fitting effect was good. The fitted critical properties and thermodynamic parameters of each component could be used for further phase analysis.
2.3. Gas Channeling Discrimination Method Research
In the multi-stage contact process of gas injection, mass transfer between injected gas and formation crude oil causes the changes of phase characteristics and physical parameters (composition, interfacial tension, point degree, density, etc.). Mass transfer between components is the main mechanism of miscible displacement.
The characteristics of fluid flow in porous media and the change of phase state of each component can be expressed by a three-dimensional, three-phase, multi-component mechanical mathematical model. At the same time, the phase equilibrium calculation of an oil and gas system can be used to accurately evaluate the phase characteristics of reservoir fluid and the variation of phase characteristics in the extraction-dissolution mass transfer process between injected gas and formation fluid [19].
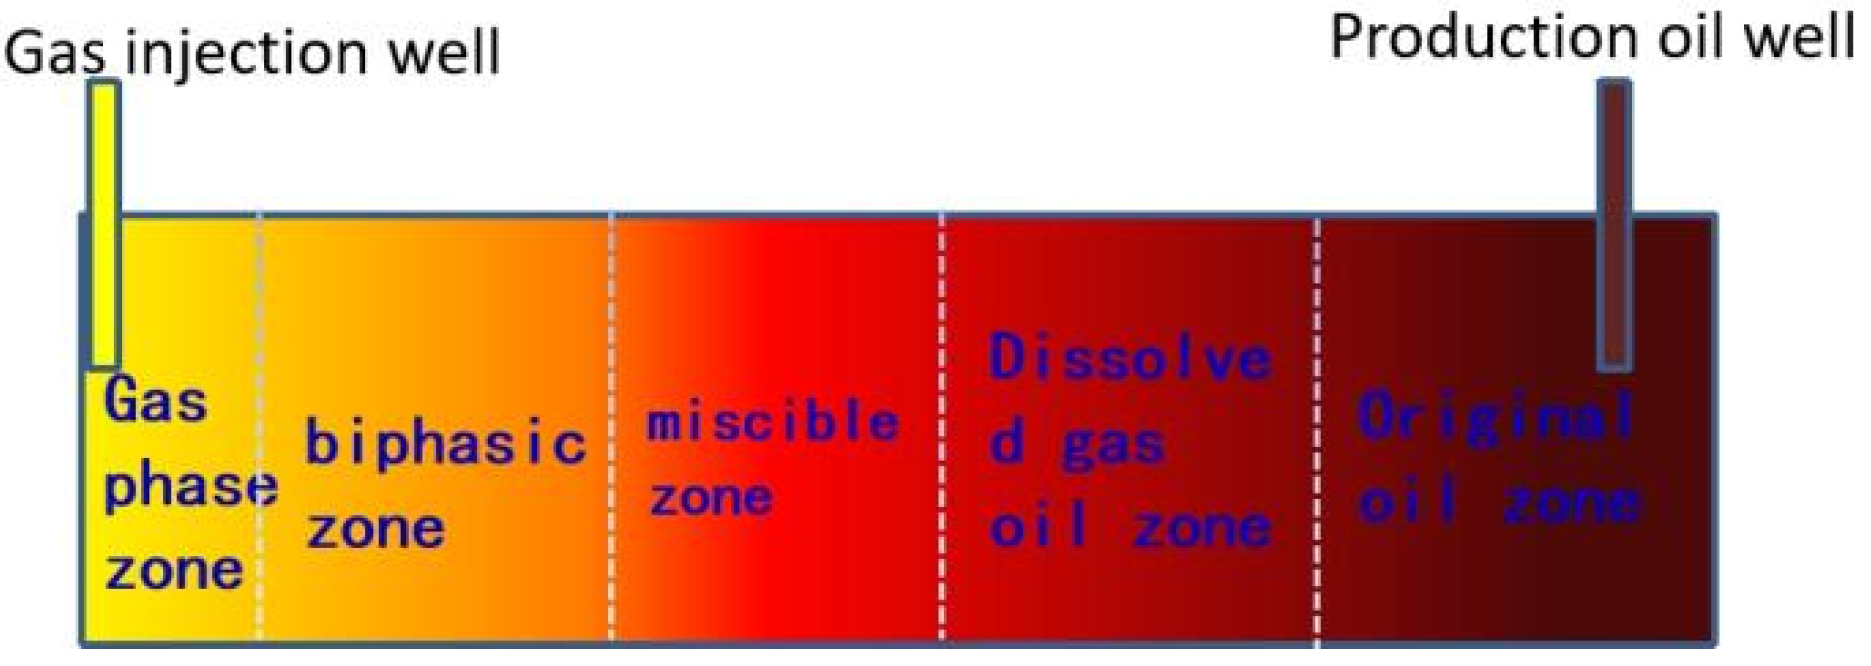
Research was conducted regarding the numerical simulation method on the mechanism model. In the process of gas injection, the fluid produced by the production well is in different phase zones in its formation, and its properties vary. In immiscible flooding, the injected gas at the displacement front is partially dissolved in oil to reduce viscosity and improve flow capacity. In the near-miscible flooding, the mass transfer effect is more obvious, the viscosity of crude oil is further reduced, and the near-miscible zone is formed. During miscible flooding, the injected dry gas continuously contacts with the formation crude oil and gradually forms a miscible zone. Under the three modes of immiscible flooding, near-miscible flooding, and miscible flooding, the formation fluid can be divided into five regions: gas-phase zone, two-phase zone, miscible zone, dissolved gas-oil zone, and original oil zone (Figure 1).

Figure 1.
Division diagram of formation fluid flow stages.
For miscible flooding, the output of miscible zone is the most favorable. Natural gas is fully dissolved in crude oil, which plays a role in reducing its viscosity, reducing two-phase interfacial tension, increasing crude oil volume and supplementing formation energy. When the miscible zone fluid is displaced, it enters the two-phase zone production stage. At this time, the oil production decreases and the gas-oil ratio increases. The oil saturation in the front of two-phase zone is relatively high, and the oil production can be maintained at a certain level. The gas saturation at the trailing edge of the two-phase zone rises to a higher level. At this time, the injected gas no longer plays a displacement role, so the state corresponding to this time point is considered to be gas channeling. After the occurrence of gas channeling, the P-T phase diagram, C1 molar content, gas-oil ratio, density, and viscosity of the produced well flow will change.
3. Results
3.1. Determination of Gas Channeling Identification Parameters
In terms of dynamic simulation of the above model, the main production indicators with the production time relationship were as follows (Figure 2 and Figure 3).
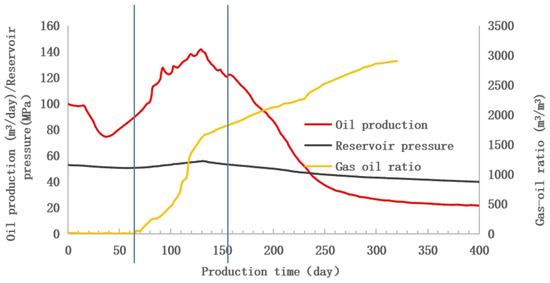
Figure 2.
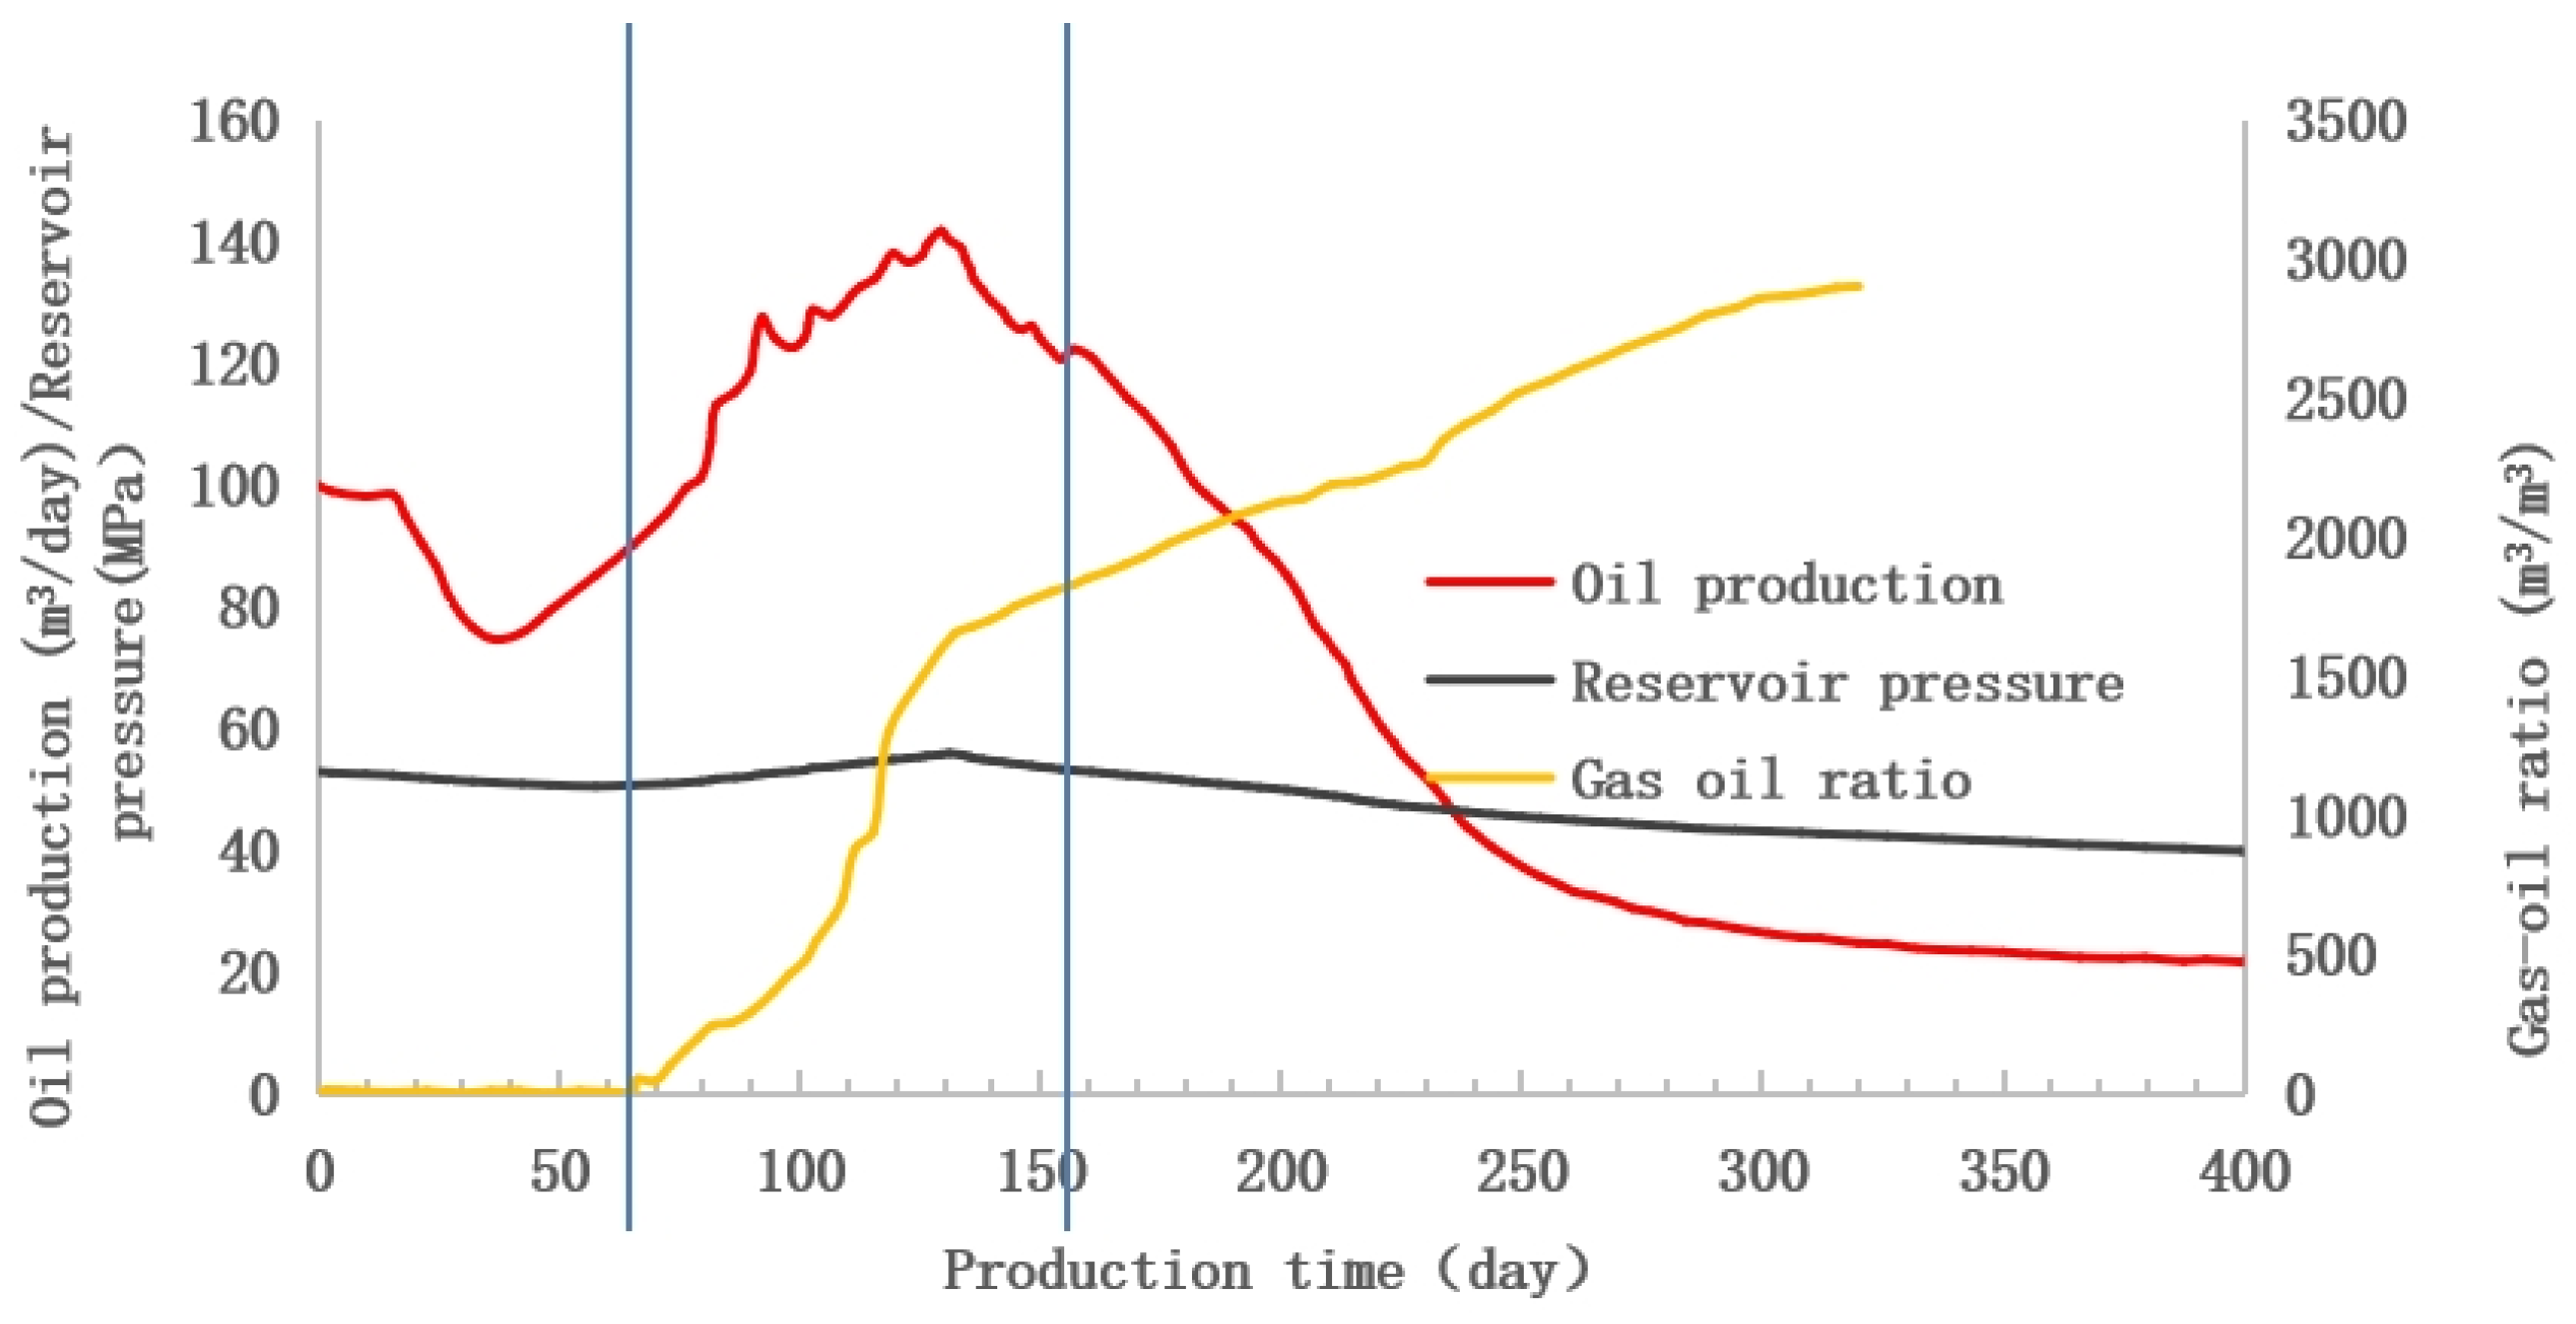
Prediction curve of oil production and gas-oil ratio of production well.
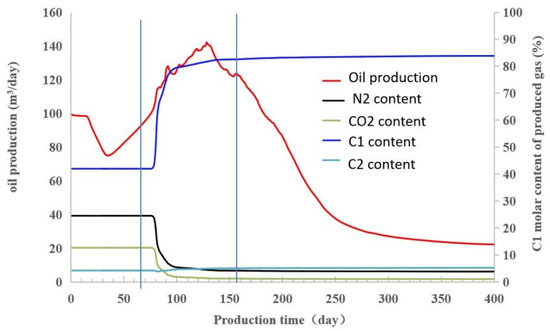
Figure 3.
Analysis of gas channeling parameter selection.
Based on the analysis of changes in oil production, gas-oil ratio, and molar content of C1 component of produced gas, combined with the distribution of oil saturation in different periods, it can be divided into three main production stages:
The first stage was the original oil phase output stage, which lasted for 0~66 days. As the formation pressure drops in the early stages, oil production declined quickly. The increase of oil production in the later period was due to the replenishment of formation energy by injected gas. The main discrimination method at this stage was as follows: the produced natural gas is dissolved gas of original crude oil, so the gas production was small and the gas-oil ratio was constant at about 14 m3/m3.
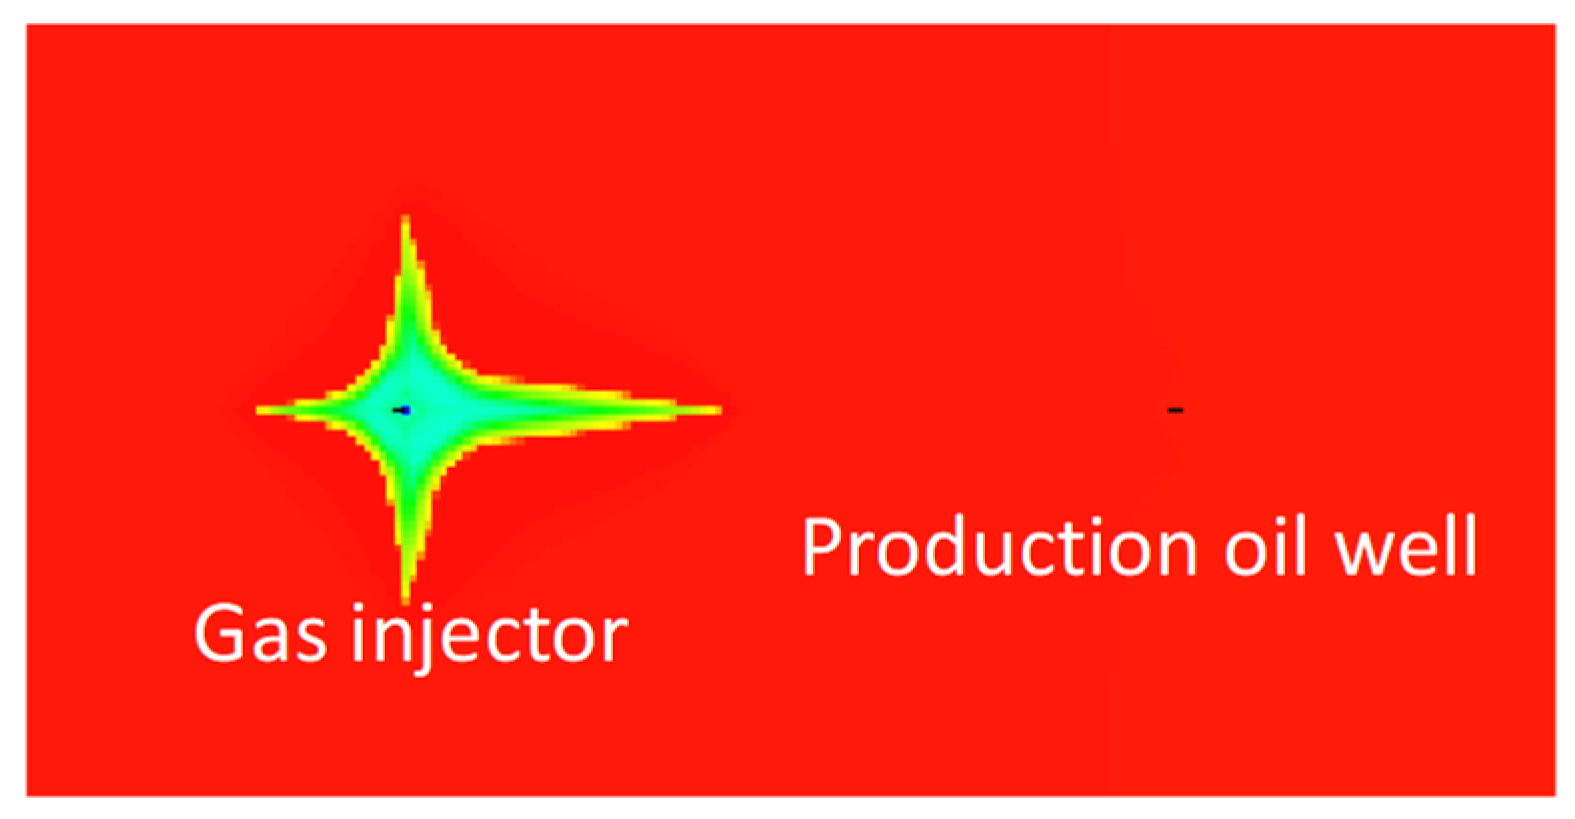
From the oil saturation distribution (Figure 4), when the production time was 30 days, the oil saturation around the injection well changed significantly, while the oil saturation around the production well did not change significantly. However, because the injection wells continuously inject gas, the injected gas plays a role in replenishment of the formation energy to a certain extent, and the oil production of the production wells is increased by constantly flooding the crude oil around the production wells. However, at this time, the flow of the produced wells was still the original formation crude oil, so the gas-oil ratio index was constant.
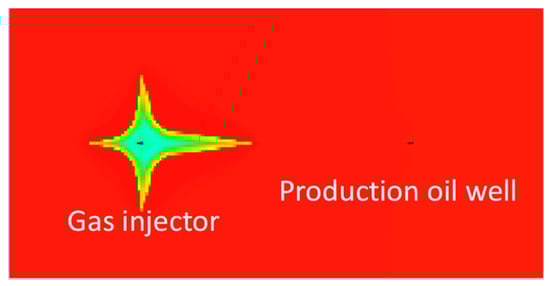
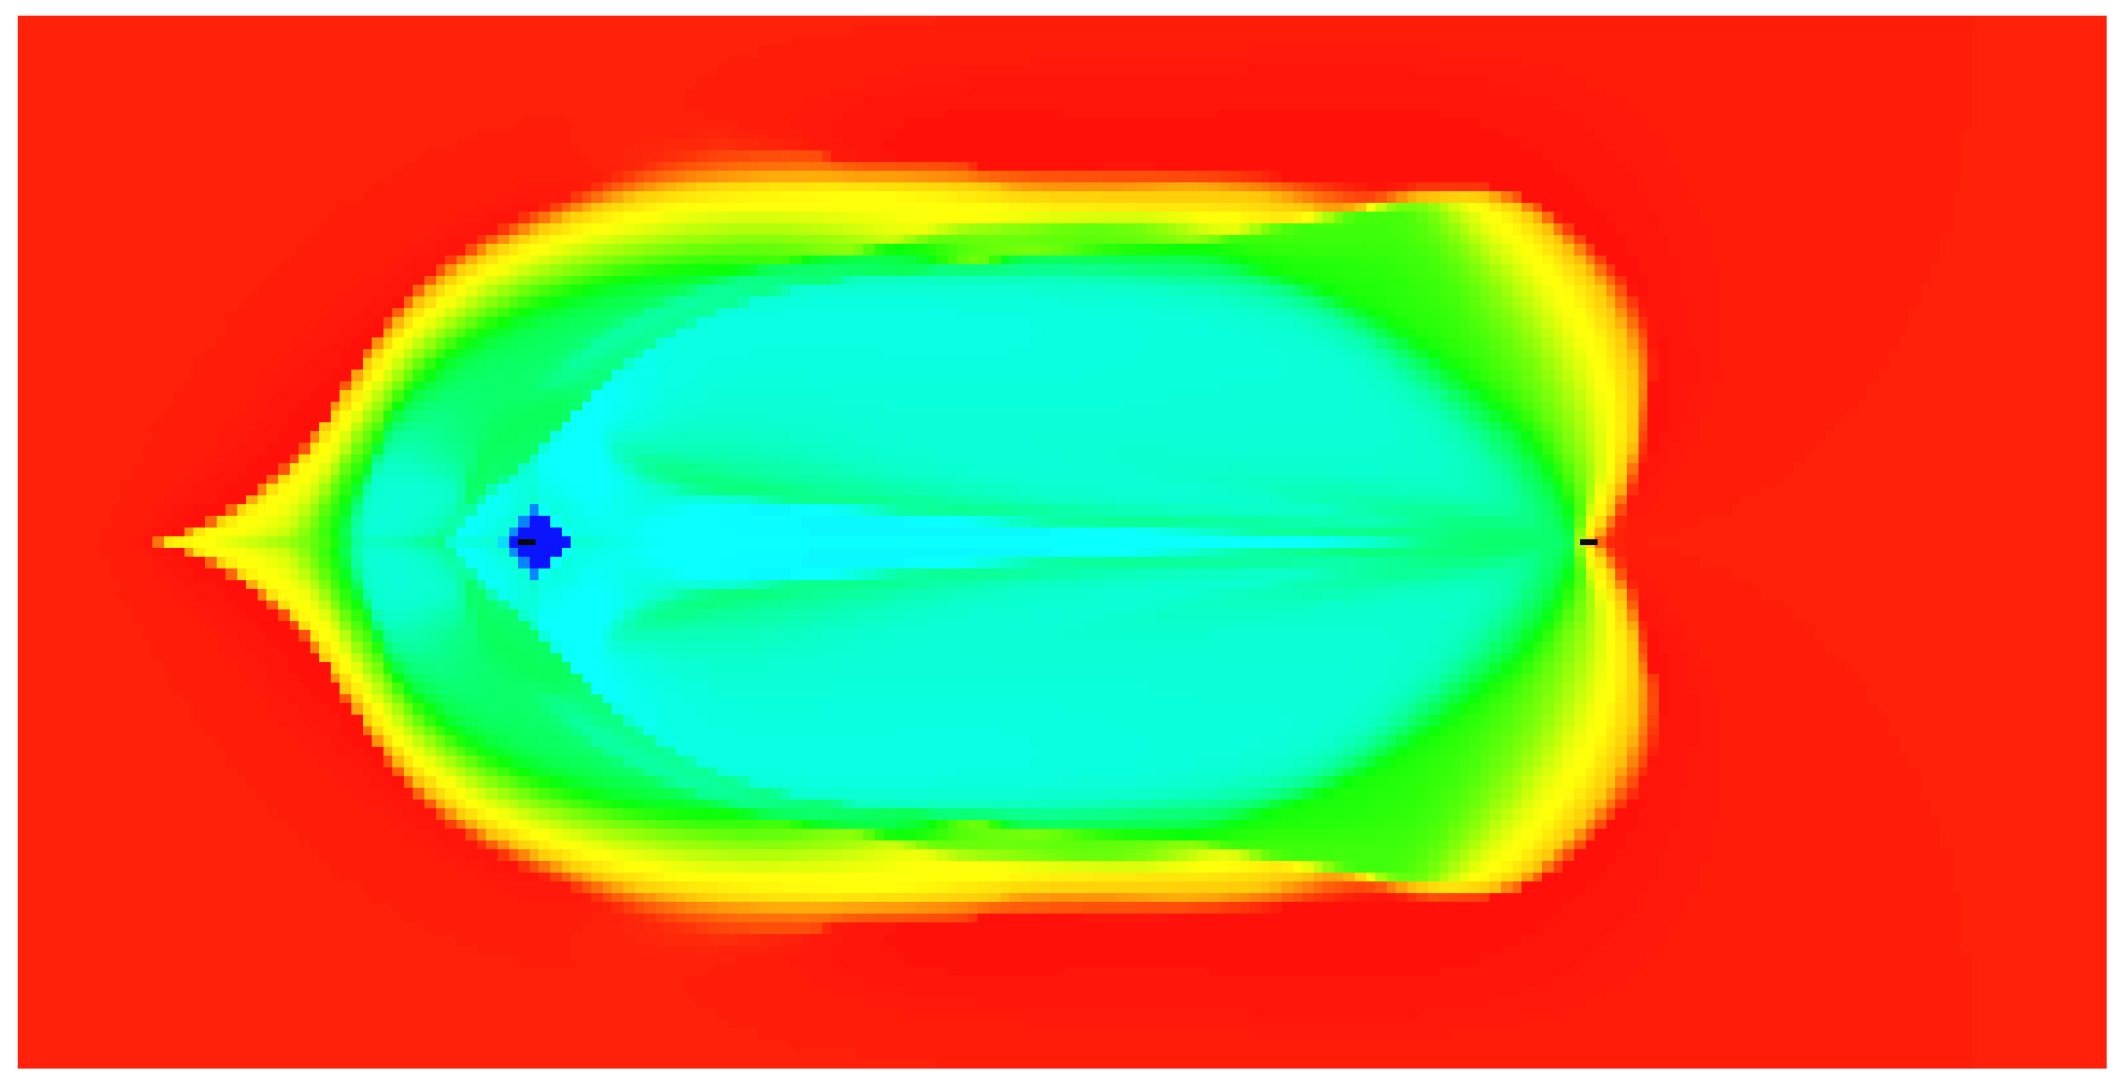
Figure 4.
Distribution of formation oil saturation at 30 days of production.
The second stage was the output stage of dissolved gas-oil zone, miscible zone, and front edge of the two-phase zone, which lasted for 66–154 days. The production characteristics of this stage were comprehensively analyzed in terms of oil production, gas-oil ratio, and C1 content of produced gas.
Of the corresponding relationships of the three main indicators in each phase zone, the initial oil production, gas-oil ratio, and content of produced gas C1 increased rapidly, which was the well performance of the output stage of the dissolved gas-oil area. In the middle, the oil production in the miscible flooding stage peaked (the platform production was due to the result of a period of time in the miscible zone), the gas-oil ratio appeared in steps, and the C1 content of the produced gas increased steadily. In the later stage, the oil production decreased rapidly, the gas-oil ratio continued to rise, and C1 content of the produced gas began to rise again. The later stage should involve the two-phase drive front reaching the production well. However, in order to accurately divide the miscible zone, the early dissolved gas oil zone, and the later two-phase drive front zone, there is no accurate criterion from the morphological characteristics of each index. In this study, from the perspective of gas channeling judgment, the time when C1 content rose to the high value platform again after the production of the two-phase flooding front was marked as the end of production at this stage, and it was divided into the mixed zone in the formation.
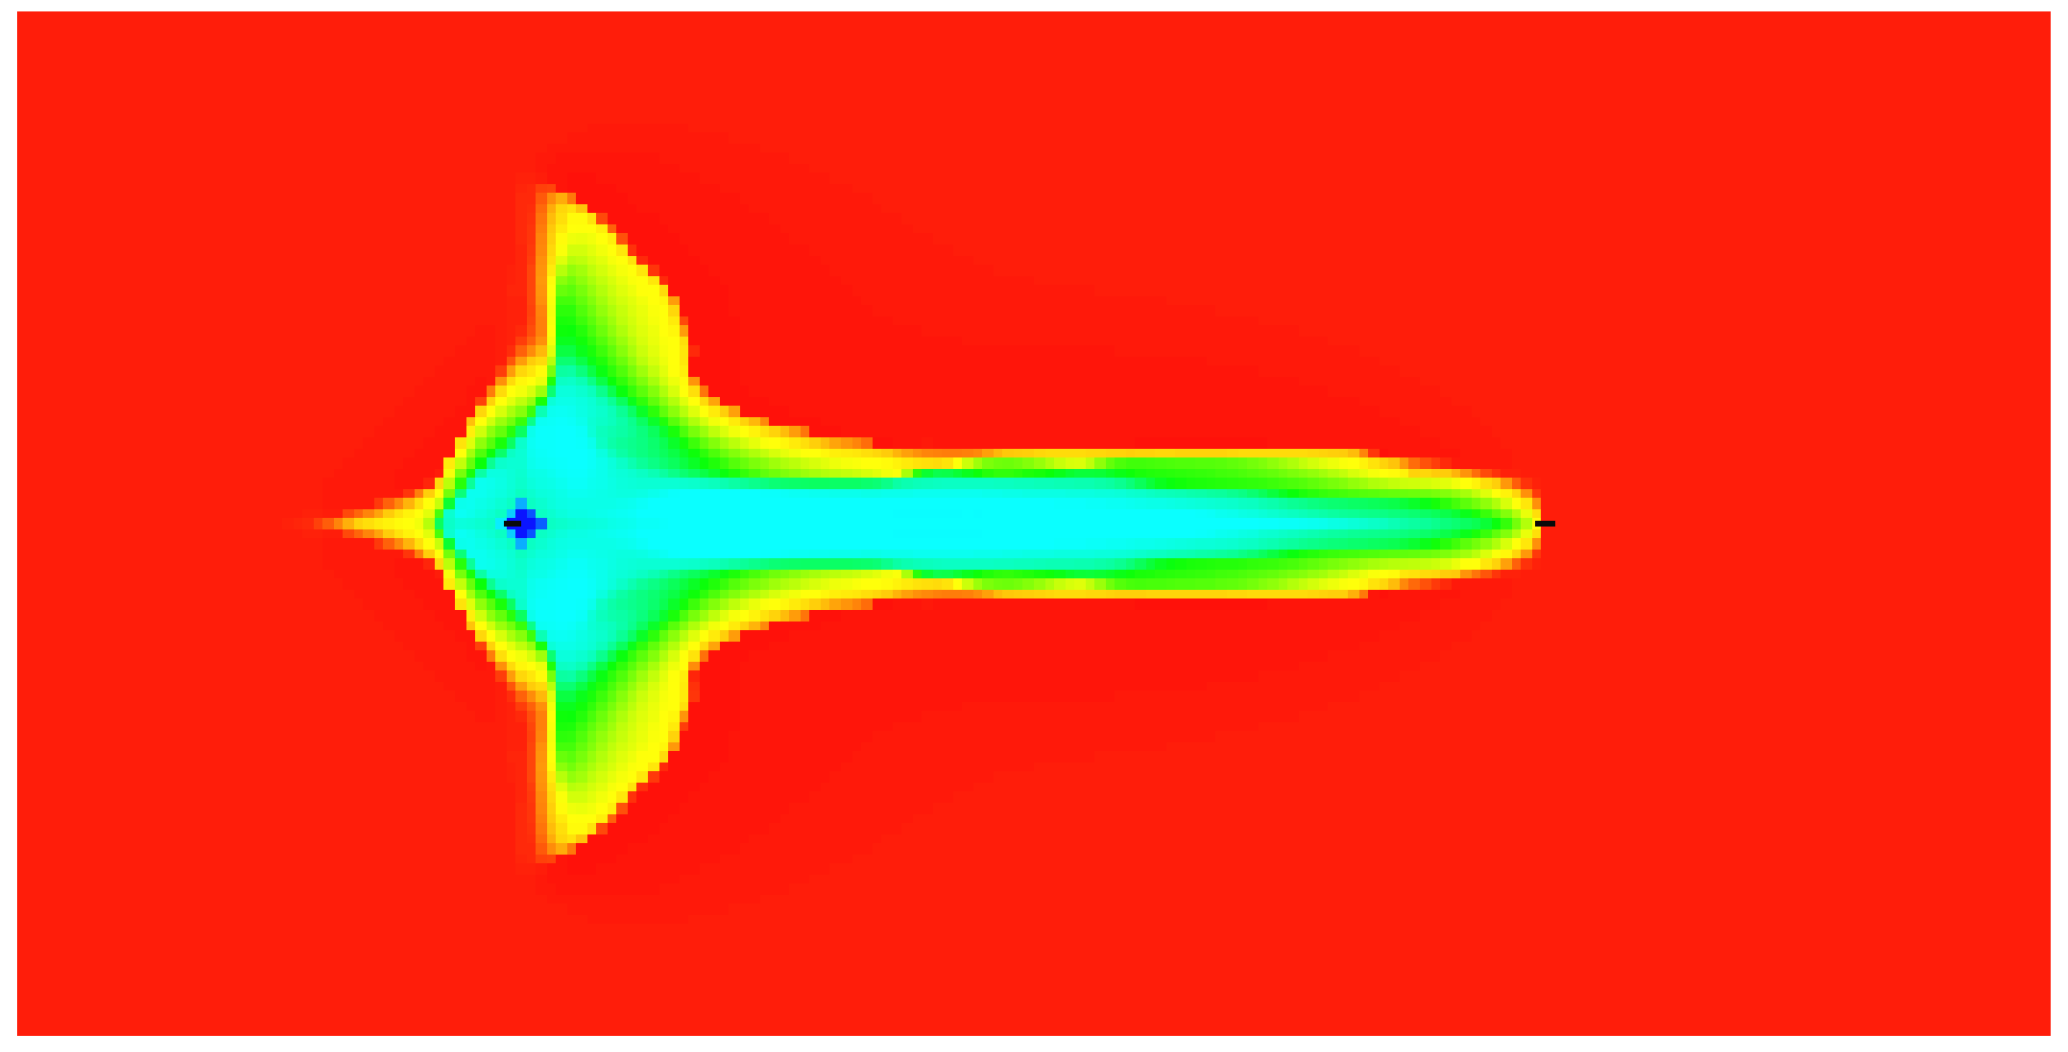
In terms of oil saturation distribution, at 100 and 130 days of production (Figure 5 and Figure 6), the fluid saturation around the injection well was basically the same, although the saturation around the producing well was different. Therefore, no matter when miscible, dissolved gas-oil zone or the front of the two-phase zone was produced, there was little difference in oil saturation near the production well, which made it difficult to accurately classify different stages. Due to the limited volume of injected gas and the late gas channeling, the reservoir pressure generally showed a downward trend during the gas injection stage. In the miscible phase, the injected gas not only played the role of oil displacement but also replenished the reservoir energy, resulting in a peak of oil production and a certain recovery of reservoir pressure. However, due to the limited injected gas, the pressure continued to decline after the miscible phase (Figure 2).
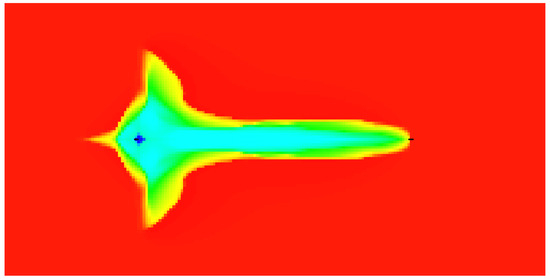
Figure 5.
Distribution of formation oil saturation at 100 days of production.
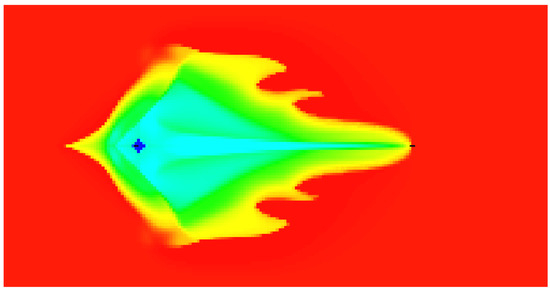
Figure 6.
Distribution of formation oil saturation at 130 days of production.
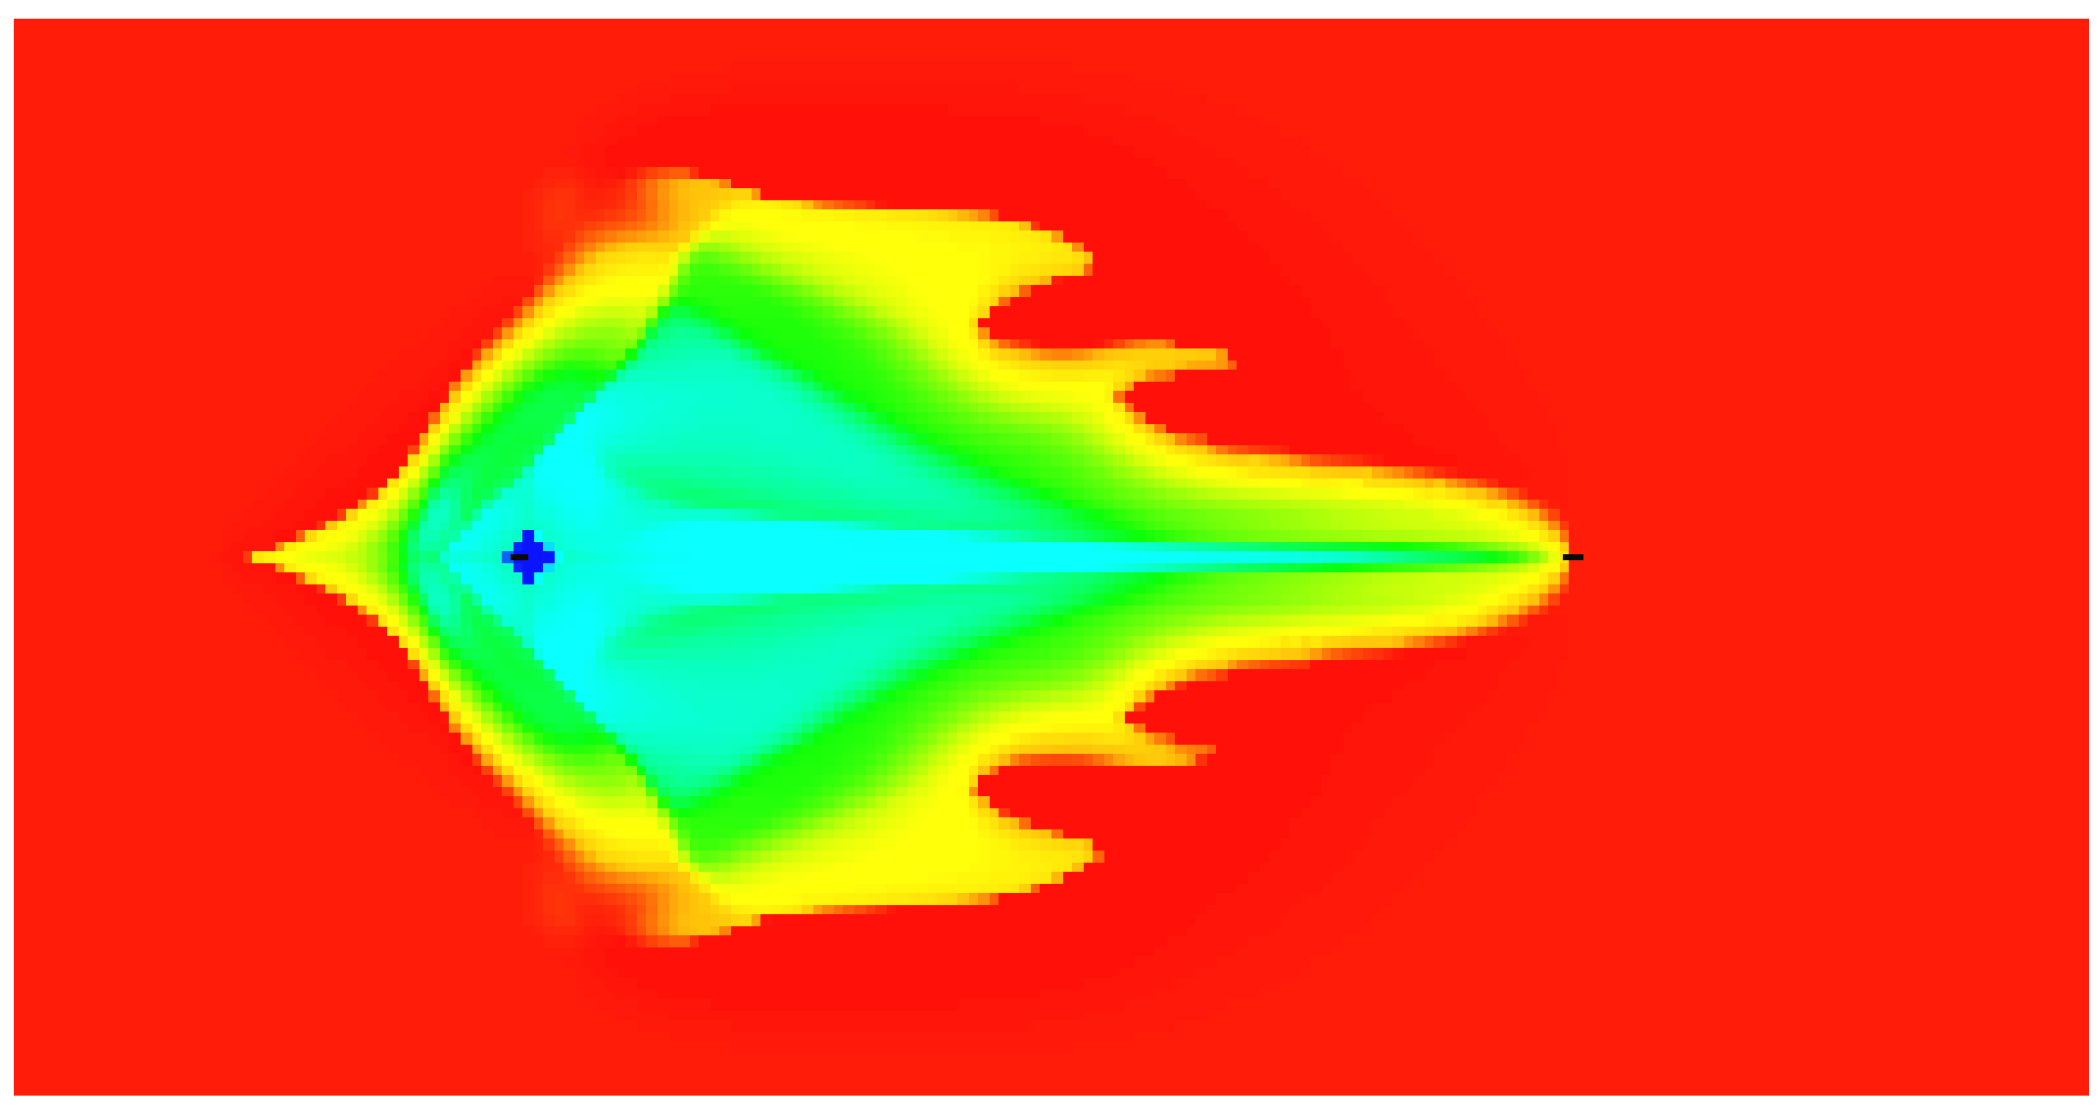
The third stage was the output stage of the trailing edge of the two-phase band, 154 days later (Figure 7). After the mixing zone fluid was produced, the producing well began to enter the trailing edge of the two-phase zone. This stage had the following characteristics: oil production decreased significantly, gas-oil ratio showed an obvious upward trend, and the content of produced gas C1 showed a continuous upward trend again on the basis of relatively stable in the early stage.
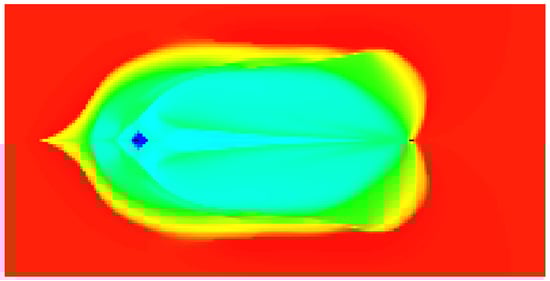
Figure 7.
Distribution of formation oil saturation at 400 days of production.
From the perspective of oil saturation distribution, when the production time was 400 days, the fluid saturation around the production well changed significantly during this period, and the gas and oil phases were dominant in a large range, and the gas saturation near the wellbore increased significantly. At this time, the production well produced gas and oil two-phase which cannot form miscible or near miscible. At this stage, the proportion of injected gas output increased continuously, the gas-oil ratio increased continuously, the oil production decreased continuously, and the molar content of C1 component of produced gas increased continuously.
From the analysis of the molar content of different components (Figure 3), C1 always had the highest molar content of produced gas, which was much higher than other components such as N2 and C2. In addition, from the variation trend of C1, the value after gas channeling was obviously much higher than that in the previous stage, which had a good background value basis. Because of the low content of other components, the change in values before and after gas channeling were relatively small. In practice, it is appropriate to choose C1 content with high background value and high change value as the judgment index.
In summary, for the purpose of identifying gas channeling, C1 content will rise again on the previous platform in the third stage; that is, when the trailing edge of the two-phase zone is produced and the gas-oil ratio at this time point is taken as the discriminant index to comprehensively discriminate gas channeling in actual production wells (Table 3).
Table 3.
Production index characteristics corresponding to each production phase zone of miscible flooding mode.
3.2. Determination of Gas Channeling Identification Parameter Values under Different Formation Pressures
Second, considering the high pressure of the reservoir, different formation pressures are set in the injection and production mechanism model to predict the production well performance. The gas-oil ratio and C1 molar content of produced gas were analyzed and the field characterization parameters of gas channeling under different formation pressures were determined.
Considering the actual formation pressure of the reservoir, the model formation pressure was set as follows: the maximum pressure was the original pressure of 62 MPa, and then decreased to 41 MPa at every 3 MPa point. Therefore, the formation pressure was set as P = 62, 59, 56, 53, 50, 47, 44, and 41 MPa, and the model was dynamically predicted to obtain the relationship between main production indicators under different formation pressures and production time (Table 4), and the following gas breakthrough identification standards were obtained as reference values for field discrimination.
Table 4.
Criteria for gas channeling.
When the formation pressure was high (P > 50 MPa), the recommended values were: gas-oil ratio 1650 m3/m3, C1 content 82.5%.
When the formation pressure was moderate (47 MPa < P ≤ 50 MPa), the recommended values were: gas-oil ratio 1450 m3/m3, C1 content 82.5%.
When the formation pressure was low (P < 47 MPa), there was no miscibility and near-miscibility, and the gas injection effect is poor. The recommended values were: gas-oil ratio greater than 1800 m3/m3, C1 content 83.3%.
This paper presented a method of gas channeling identification, which has not been studied before. It is aimed at the characteristics of high-pressure heterogeneous reservoirs, and its gas-oil ratio had increased and changed several times in different stages of the gas injection and production process. Therefore, the gas-oil ratio proposed by Si Yong [16] or its derivative change cannot be used to judge the gas flow. Instead, the identification parameters of gas channeling at the trailing edge of the two-phase zone and their values under different pressure conditions were specified. For example, when the formation pressure was greater than 50 MPa, the C1 content produced at the trailing edge of the two-phase zone rose again on the previous platform, and the gas-oil ratio was about 1650, and the C1 content value was 82.5%, which was judged to be the occurrence of gas channeling.
3.3. Application and Verification of Gas Channeling Identification Method
According to the determined results of the above gas channeling identification parameters, combined with the actual production well oil production, gas-oil ratio, and produced gas C1 content, the field gas channeling judgment was carried out for a gas injection effective D1 well and then compared with the detection results of the gas tracer method to verify the accuracy of the method.
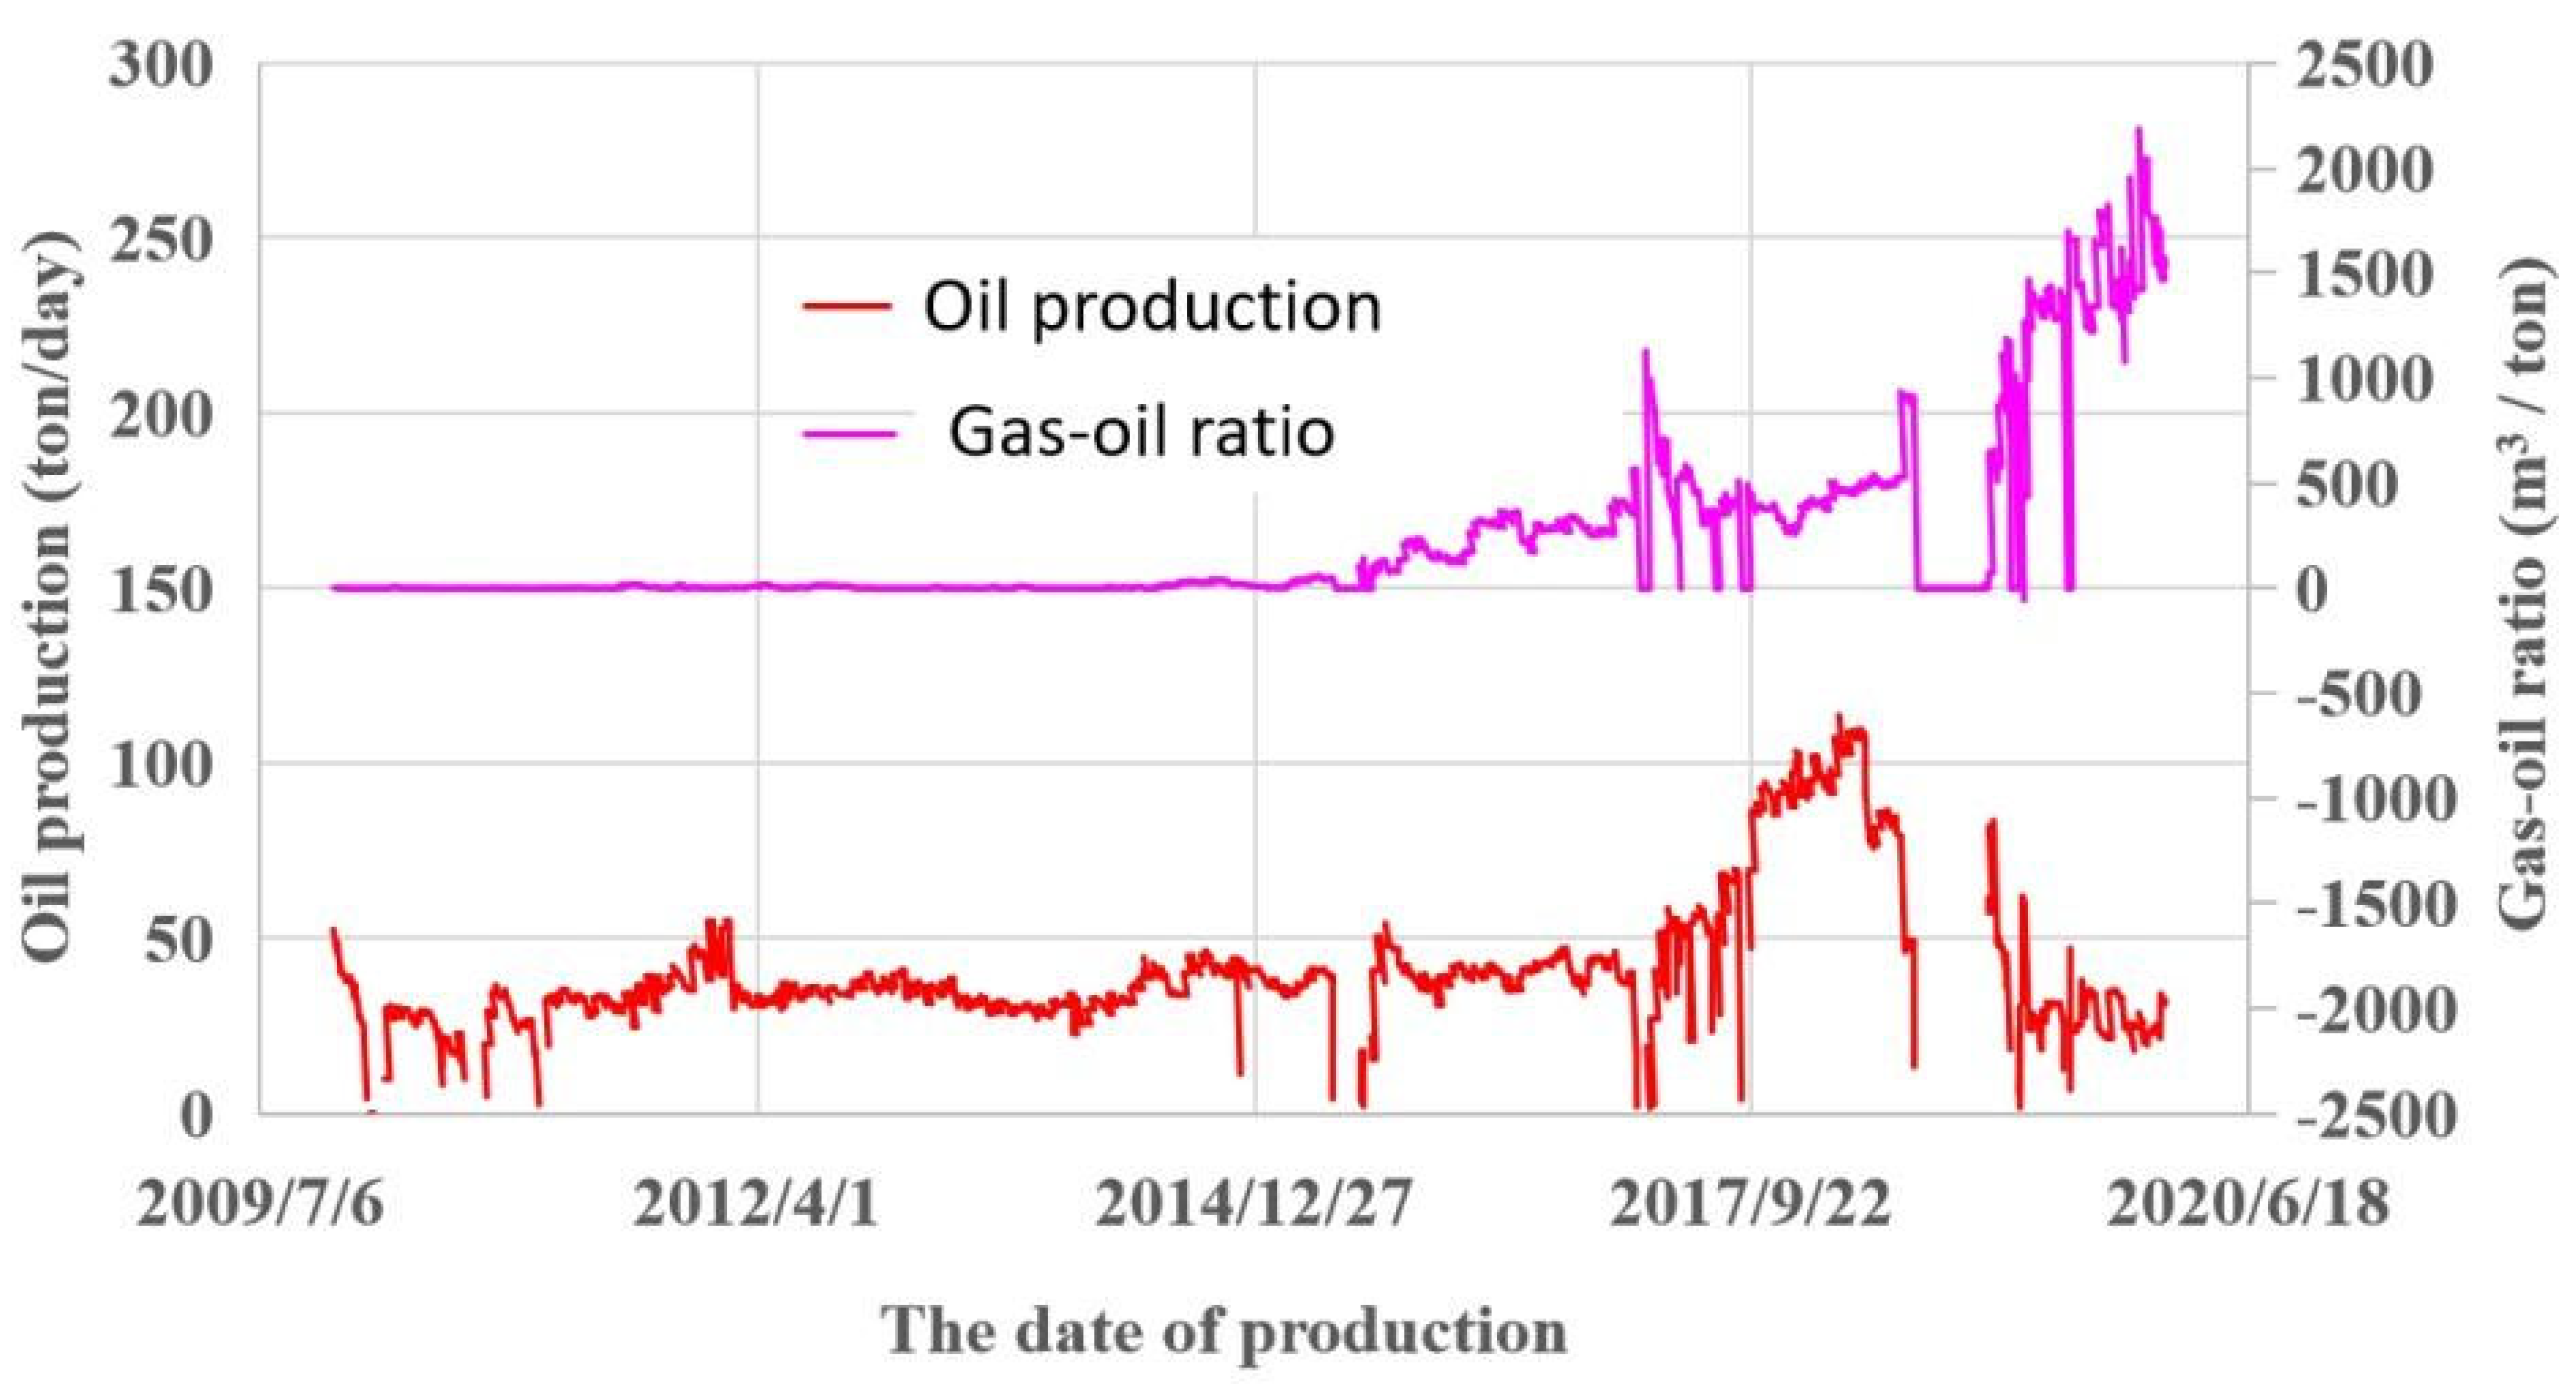
Before June 2014, the oil production and gas-oil ratio of well D1 with a gas injection effect were basically constant (Figure 8 and Figure 9) and the gas-oil ratio was low at only about 10 m3/m3, which was the production stage of the original oil zone. In June 2014, the gas-oil ratio gradually increased and C1 content initially increased rapidly. This stage was analyzed as the production stage of dissolved gas-oil area. From April 2017 to July 2019, oil production showed an obvious upward trend, and the gas-oil ratio decreased slightly during the same period, but basically remained at a plateau. Compared with the early stage, the increase trend of C1 content was obviously slowed down, and even there was a significant low value in the middle (around September 2019). Generally speaking, this stage is the production stage of miscible zone. Then it entered the leading edge production stage of the two-phase zone, and the gas-oil ratio started to rise slowly and C1 content increased to a high value. Then it entered the two-phase zone trailing edge production stage. At this time, the oil production decreased, the gas-oil ratio increased, and the C1 content of produced gas entered a high value platform.

Figure 8.
Production curve of oil production and gas-oil ratio of a gas injection affected well D1.
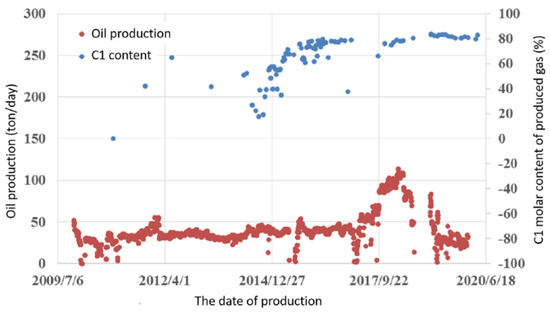
Figure 9.
Production curve of oil production and gas C1 content in a gas injection well D11.
According to the gas channeling discriminant parameter and its value (the pressure is 53 MPa at this time), it can be judged that gas channeling occurred around September 2019, namely the output stage at the trailing edge of the two-phase zone. At this time, the oil production decreased, the gas-oil ratio increased, and the C1 content of produced gas entered a high value platform. The corresponding gas-oil ratio was 1642 m3/m3, and C1 content was more than 82.6%. The gas-oil ratio decreased in early 2020, but the oil production was significantly lower, so it was accurate to predict that the well had gas channeling.
In addition, gas tracer monitoring in late 2019 showed that the gas in the well was mainly from injection gas from the adjacent D2 well. Therefore, it was determined that the gas channeling source of the production well was the D2 well and that gas channeling had indeed occurred. The comparison results between the two methods show that the identification results based on gas channeling characterization parameters are consistent with the actual results, which prove the accuracy and reliability of gas-oil ratio and C1 molar content as gas channeling discrimination parameters. Compared with the gas tracer monitoring method, the investment cost is lower and the workload is less.
In conclusion, according to the gas-oil ratio in production and the composition of oil and gas in production, the flow stages of formation fluid can be divided into five zones: gas-phase zone, two-phase zone, miscible zone, dissolved gas-oil zone, and original oil zone. For the purpose of gas channeling identification, the time when C1 content rises again at the trailing edge of the two-phase zone is taken as the cut-off point for gas channeling identification. Combined with the gas-oil ratio at this time point as a discriminant index, the results of the gas tracer method were compared to prove its accuracy and reliability.
4. Conclusions
- (1)
- When the produced fluid is in different phase zones in the formation, it exhibits different properties. The injected gas is dry gas with high C1 content. From the prediction curve, the gas-oil ratio and C1 content are the most sensitive to the produced fluid. Considering the convenience of field parameter selection, the gas-oil ratio and C1 content of produced gas were selected as the field characterization parameters for gas channeling discrimination.
- (2)
- According to the variation characteristics of output parameters under different pressure conditions, the gas channeling judgment standards under different pressures were established from several parameters, such as oil production, gas-oil ratio, and C1 content of produced gas.
- (3)
- The gas channeling discrimination method proposed in this paper was based on oil production, gas-oil ratio, and C1 content of produced gas to judge gas channeling in production wells on site, and the results of gas tracer detection were compared to prove its accuracy and reliability. The method has low cost and simple operation.
Author Contributions
J.L.: Data sorting, gas channeling discrimination method, writing—original draft preparation; L.W.: Investigation, verification, writing—editing. All authors have read and agreed to the published version of the manuscript.
Funding
This research received no external funding.
Institutional Review Board Statement
Not applicable.
Informed Consent Statement
Not applicable.
Data Availability Statement
Not applicable.
Acknowledgments
This work was supported by many technicians who have contributed to the research, and we hope to show our sincere thanks to them.
Conflicts of Interest
The authors declare no conflict of interest.
References
- Zhao, X.; Shi, L.; Wang, W.; Bai, Y.; Tian, F. Study on gas channeling law of CO2 flooding in heterogeneous ultra-low permeability reservoir. J. Southwest Pet. Univ. (Sci. Technol. Ed.) 2017, 39, 131–139. [Google Scholar]
- Wu, J. Study on Gas Channeling Law and Flow Mechanism of Fractured-Vuggy Carbonate Reservoir; China University of Petroleum: Beijing, China, 2016. [Google Scholar]
- Li, J.; Gao, B.; Gong, N.; Xie, Z.; Chen, Y.; Han, Y. A new evaluation method of gas channeling resistance based on fuzzy mathematics and its application. Drill. Fluid Complet. Fluid. 2017, 34, 69–74. [Google Scholar]
- Zhang, Y.; Li, X.; Sun, Z.; Li, Z.; Liu, W.; Zhang, Y. Quantitative evaluation method and application of gas channeling in gas injection development of condensate gas reservoir. Oil Drill. Prod. Technol. 2017, 39, 667–672. [Google Scholar]
- Peng, S. Study on gas channeling law of CO2 flooding in ultra-low permeability reservoir of Zhenglizhuang Oilfield, Shengli. J. Oil Gas Technol. 2013, 35, 147–169. [Google Scholar]
- Li, C. Influencing factors and rules of carbon dioxide flooding gas channeling in ultra-low permeability reservoirs. Spec. Oil Gas Reserv. 2018, 25, 82–86. [Google Scholar]
- Gao, Y.; Zhao, M.; Wang, J.; Zong, C. Production characteristics and gas channing law of CO2 immiscible flooding in ultra-low permeability reservoirs. Pet. Explor. Dev. 2014, 41, 79–85. [Google Scholar] [CrossRef]
- Wei, Q.; Hou, J.; Hao, H.; Song, Z. Study on gas channeling law of CO2 drive in ultra-low permeability reservoir. Pet. Sci. Bull. 2019, 4, 145–153. [Google Scholar]
- Li, C.; Han, H. Identification of CO2 gas channeling channel in the early stage of gas injection by grey fuzzy comprehensive evaluation method. Pet. Geol. Oilfield Dev. Daqing 2018, 37, 116–120. [Google Scholar]
- Li, J. Study on gas channeling characteristics and influencing factors of reservoir developed by CO2 injection. J. Oil Gas Technol. 2012, 34, 153–169. [Google Scholar]
- Saifullin, E.; Zhanbossynova, S.; Zharkov, D.; Varfolomeev, M.A.; Shanbosinova, S.K.; Zharkov, D.A.; Nazarychev, S.A.; Malakhov, A.O.; Sagirov, R.N. Laboratory Studies for Design of a Foam Pilot for Reducing Gas Channeling from Gas Cap in Production Well in Messoyakhskoye Field. SPE Reserv. Eval. Eng. 2022, 25, 472–485. [Google Scholar] [CrossRef]
- Si, Y.; Zhao, J.; Liang, F. Establishment and application of gas channeling identification method in Buried hill reservoir. J. Shaanxi Univ. Sci. Technol. 2020, 38, 94–101. [Google Scholar]
- Liu, D.; Zhang, J.; Wang, Y.; Yan, Z. Distinguishing method and application of gas channeling in condensate gas reservoirs. Nat. Gas Explor. Dev. 2008, 31, 27–83. [Google Scholar]
- Zhu, Y.; Li, B.; Song, W.; Tang, M.; Zhang, F.-E. Discussion on the method of distinguishing gas channeling in condensate gas reservoirs by using charts. Pet. Geol. Recovery Effic. 2004, 6, 53–85. [Google Scholar]
- Wei, Y.; Li, Z.; Wang, X.; Cui, T.; Ding, G.; Mou, W.; Kang, J. Judgment, adjustment and effect of gas injection front breakthrough in Kekeya condensate gas reservoir. Nat. Gas Ind. 2006, 6, 97–99. [Google Scholar]
- Pan, X. Numerical Simulation of Nitrogen Injection Foam for Controlling Water Channeling Technology; Northeast Petroleum University: Daqing, China, 2011. [Google Scholar]
- Wang, B.; Zhu, Y. Gas cap channeling in a gas cap field. Nat. Gas Ind. 2000, 3, 79–84. [Google Scholar]
- Schulumberger. PVTI and ECLIPSE 300; Schulumberger: Beijing, China, 2005. [Google Scholar]
- Yuan, H.; Johns, R.T.; Egwuenu, A.M.; Dindoruk, B. Improved MMP Correlations for CO2 Floods Using Analytical Gasflooding Theory. SPE Reserv. Eval. Eng. 2005, 8, 418–425. [Google Scholar] [CrossRef]


Publisher’s Note: MDPI stays neutral with regard to jurisdictional claims in published maps and institutional affiliations. |
© 2022 by the authors. Licensee MDPI, Basel, Switzerland. This article is an open access article distributed under the terms and conditions of the Creative Commons Attribution (CC BY) license (https://creativecommons.org/licenses/by/4.0/).