Article

Numerical Simulation and Field Test Research on Vibration Reduction of PDC Cutting of Pebbled Sandstone under Composite Impact Load

1
CNPC Engineering Technology R & D Company Limited, Beijing 102206, China
2
National Engineering Research Center of Oil & Gas Drilling and Completion Technology, Beijing 102206, China
3
School of Petroleum Engineering, China University of Petroleum (East China), Qingdao 266580, China
*
Authors to whom correspondence should be addressed.
Processes 2023, 11(3), 671; https://doi.org/10.3390/pr11030671
Submission received: 16 January 2023 / Revised: 16 February 2023 / Accepted: 21 February 2023 / Published: 22 February 2023
(This article belongs to the Special Issue Oil and Gas Well Engineering Measurement and Control)

Abstract

:
Downhole vibrations caused by rock breaking when drilling through pebbled sandstone formations negatively affect the rate of penetration (ROP) and the safety of downhole tools. Therefore, it is of great significance to study the cutting characteristics of pebbled sandstone and find a method of reducing the drilling vibrations of pebbled sandstone formations. Based on the DEM (discrete element method), a simulation model of pebbled sandstone considering the random filling of high-strength gravels was established by using the random polygon distribution method. The influence of gravel content on the strength parameters and the breaking state of the pebbled sandstone samples was analyzed. Additionally, a DEM model of PDC cutting rocks loaded by a spring–mass system was established, and the Stribeck effect of contact friction between the PDC cutter and the rock was analyzed. The periodic vibration and the stick–slip phenomenon of the cutting system during the drilling process were presented by this model. The model was employed to simulate and explore the influence of composite impact load on stick–slip vibration during PDC cutting of pebbled sandstone. The simulation results showed that the composite impact load had a more obvious effect on mitigating the vibration of PDC cutting of pebbled sandstone under the condition of a higher horizontal impact amplitude coefficient (qh = 40%). Based on the simulation results, a composite impactor with a large impact angle α = 70° was selected to conduct the field tests in the pebbled sandstone formation of Well T1. The results showed that, compared to conventional drilling, the average WOB (weight on bit) of the section drilled with the composite impactor decreased by 57.13%, the standard deviation of the WOB decreased by 57.29%, and the average ROP increased by 98.31%. The employing of composite impactors in pebbled sandstone formations can significantly reduce drilling vibration, improve ROP, and protect bits and downhole instruments.

1. Introduction

Increasing drilling rate of penetration (ROP) is the primary way to save drilling investment and increase the benefit of oil and gas resource development. However, with long-term, large-scale exploration and development of oil and gas resources, the engineering environment of newly discovered oil fields is very unfriendly to drilling, which makes it increasingly difficult to increase the ROP [1]. For example, more and more gravel-bearing formations are being drilled, but the economic and time costs of drilling operations in these formations are generally higher due to highly heterogeneous rocks and strong and abrasive gravel particles. Drilling into formations bearing high-strength gravel particles is easy to cause severe vibrations of the bit, including stick–slip and bit bouncing, which then lead to serious damage, fracture, or even collapse of the bit cutters. The working time of a bit is very short, and the trip time will significantly increase. Besides, when drilling into these formations, it is common to weaken the drilling parameters to reduce downhole vibrations, which further restricts ROP improvement. Therefore, it is crucial to study the characteristics and performance of cutting highly heterogeneous gravel-bearing rocks to improve ROP and reduce drilling risks related to vibrations.
Polycrystalline Diamond Compact (PDC) bits have been used in rotary drilling since about the 1900s and have become the most commonly used type of bits in oil and gas drilling [2]. In China and the United States, more than 85% of the drilled footage in recent years used PDC bits. PDC cutters are in direct contact with formation rocks during drilling, and the study of PDC rock-breaking characteristics has the most direct guiding role in realizing efficient rock breaking. Aiming at the problem of PDC bit rock breaking, researchers have carried out a lot of theoretical and numerical simulation research. In the early research, the relation between the load state of a PDC bit and the rock-breaking volume was examined, aiming to predict the ROP and the wear of the bit [3,4,5,6,7]. Warren and Sinor [8] (1989) proposed a drag-bit performance model to predict the removed volume of rock penetrated by the designed layout of bit cutters. The model predictions compared well to laboratory drilling tests for four radically different bit designs when used on four different rocks. The relationship model between bit force and ROP is widely adopted as the bit boundary conditions in the process of drill-string mechanical modeling [9,10]. With the development of computer technology and the demand for rock-breaking enhancement of PDC bits, numerical simulation has become one of the important ways to analyze the rock-breaking performance of the bit. In the beginning, rock-breaking simulations of tools were not included in the cutting behavior, and the focuses were on the process of the tools when invading a rock under a static load. Chiaia [11] (2001) built a lattice model to discuss the process of indentation of brittle and quasi-brittle materials and pointed out that increasing the size of the indenters improves the local fracture mechanisms. The number of indenters also has a significant effect on the rock-breaking process and the generation of cracks in the rock. Simultaneous loading of multiple indenters with an appropriate line spacing seems to provide a possibility of forming larger rock chips, controlling the direction of subsurface cracks, and consuming a minimum total specific energy [12]. Later, the rock-breaking behavior of PDC cutters was studied by using the finite element method (FEM) and discrete element method (DEM). The effects of rock type and material model on PDC cutting force and cutting depth were studied to verify the simulation method and obtain reliable modeling parameters [13,14,15,16]. Jaime [17,18] (2011) employed LS-DYNA to simulate the rock-cutting process of PDC cutters; introduced the modeling method, material model selection, and parameter modification process in detail; and analyzed the sensitivity of rock-breaking behavior to loading parameters and material parameters. In addition, the effects of cutter velocity, friction coefficient, and rake angle on rock cutting were investigated to explore the rock-breaking mechanism of the bit and to optimize the bit design [19]. These simulations demonstrated the importance of the explicit finite element model for simulating the rock cutting and fragmentation process.
With the development of bit machining and design technology, the techniques of percussion drilling and non-plane cutter bit are widely used at present, and corresponding numerical simulation methods have been explored. In addition, the temperature and pressure of a wellbore have a significant influence on rock failure [20,21,22]. Therefore, various factors, such as bottom hole pressure and temperature influencing rock-breaking performance, are considered [23]. Guarin et al. [24] (1949) introduced the first case, in the oil field history, of rotary drilling with an impact tool that accomplished extended intervals of formation for sustained periods of time. Melamed et al. [25] summarized several early percussion drilling tools. Subsequently, numerous studies and experiments were conducted to explore impact drilling techniques. The effects of cutter geometry parameters, cutting angle, impact load, and cutting speed on crack propagation, debris formation, and damage evolution of rock were extensively studied [26,27]. Xiong et al. [28] (2021) investigated mixed tool cutting of granite with stinger PDC cutters and conventional PDC cutters, and they pointed out that the hybrid PDC bits that combine conventional and stinger PDC cutters have significant advantages in drilling hard, interbedded, and highly abrasive rocks. Dong and Chen [29] (2018) conducted a 3D full-scale PDC bit model to study the dynamic damage characteristics of anisotropic shale during impact rotary drilling. The aim of these studies is to explore the mechanism of PDC cutting rock under an axial impact load or a torque impact load and find realistic ways to improve the efficiency of rock drilling [30]. In recent years, improving the rock-breaking efficiency of PDC bits and reducing bit vibrations have been considered equally important in dealing with complex downhole drilling conditions [31,32]. Additionally, a compound impact load is considered to be an effective method to achieve this goal [33].
The heterogeneity of rock is one of the main causes of bit vibration and significantly impacts the strength and fracture characteristics of rock [34]. Therefore, it is necessary to consider the heterogeneity of rock when simulating rock cutting under a compound impact load [34]. The possibility of simulating heterogeneous rock failure using the finite element method (FEM) or the discrete element method (DEM) has been confirmed [35]. It is more convenient to establish a DEM heterogeneous model by changing the bond strength between the contact particles [36]. However, in the aforementioned studies of rock-breaking mechanisms, the investigation of gravel-bearing rock, which has stronger heterogeneity caused by the huge strength difference between the matrix and the gravel broken by a PDC cutter, under a compound impact load is still in the exploratory stage. Furthermore, the simulation method using a constant boundary of bit loading or cutting depth to characterize such cutters has obvious defects. The stick–slip phenomenon and continuous cutting in the process of rock breaking cannot be simulated at the same time.
In this paper, a heterogeneous rock modeling method based on the discrete element theory is proposed. In this method, a random polygonal aggregate is used to characterize the gravel particles inside the rock. The fracture characteristics of a PDC cutting heterogeneous gravel-bearing rock under the action of a compound impact load are simulated and studied. On this basis, field tests to reduce the rock-breaking vibration of gravel-bearing formation with a composite impactor are carried out. The method and conclusions of this paper provide theoretical basis and technical reference for ROP improvement and safe drilling in gravel-bearing formations.

2. Simulation Method

The DEM was first introduced into rock mechanics by Cundall, and a particle assembly program based on the DEM was proposed in 1979 [37]. It is based on the idea that the object researched is composed of a certain number of arbitrary particles or particle clusters with mass and volume in the particle assembly procedure. The particles are specified as disks with unit thickness in the two-dimensional (2D) model, whereas the particles are assumed to be spherical in the three-dimensional (3D) model. The particles interact with each other through the prescribed contact model and follow Newton’s law and Hooke’s law. The macro performance of the object is described by calculating the motion and stress state of each particle. It has high operability in rock microstructure modeling. It is simpler and more intuitive than the finite element method during the mechanical behavior simulation of discontinuous rock mass. Additionally, it has been widely used to solve rock mechanics problems [38], as shown in Figure 1.
Using a particle flow program is an essential method of solving practical problems using the discrete element theory. It is assumed that particles (clusters) are rigid bodies with a certain mass and interface, and each particle (cluster) can translate or rotate independently. Additionally, the particles (clusters) are allowed to overlap with one another in a relatively small area of the interface contact. There is a finite stiffness bonding at the contact, which can bear a specific load. The bonding will be removed when the load reaches the bonding strength. The interaction law between the particles (clusters) and between the particles (clusters) and the boundary is specified in the contact model, which is used to calculate the relative motion and the load transfer between the particles (clusters) [39].
The contact between particles in a 2D DEM model is represented in Figure 2. The generated contact particles have a definite radius R, a centroid vector x , a translational velocity x ˙ , and an angular velocity relative to the centroid ω . The position vector x c , the normal vector n ^ c , the relative translational velocity δ ˙ , and the relative angular velocity θ ˙ of the contact surface can be calculated using Equations (1)–(4), respectively:
x c = x ( A ) + ( R ( A ) + g c 2 ) n ^ c
n ^ c = x ( B ) x ( A ) d
δ ˙ = x ˙ c ( B ) x ˙ c ( A )
θ ˙ = ω ( B ) ω ( A )
where gc is the minimum gap length between the contact disks, with gc = d ( R ( A ) + R ( B ) ) ; d is the center distance between two contact parts, with d = x ( B ) x ( A ) ; and x ˙ c is the translational velocity at the contact, with x ˙ c = x ˙ + ω ( x c x ) .
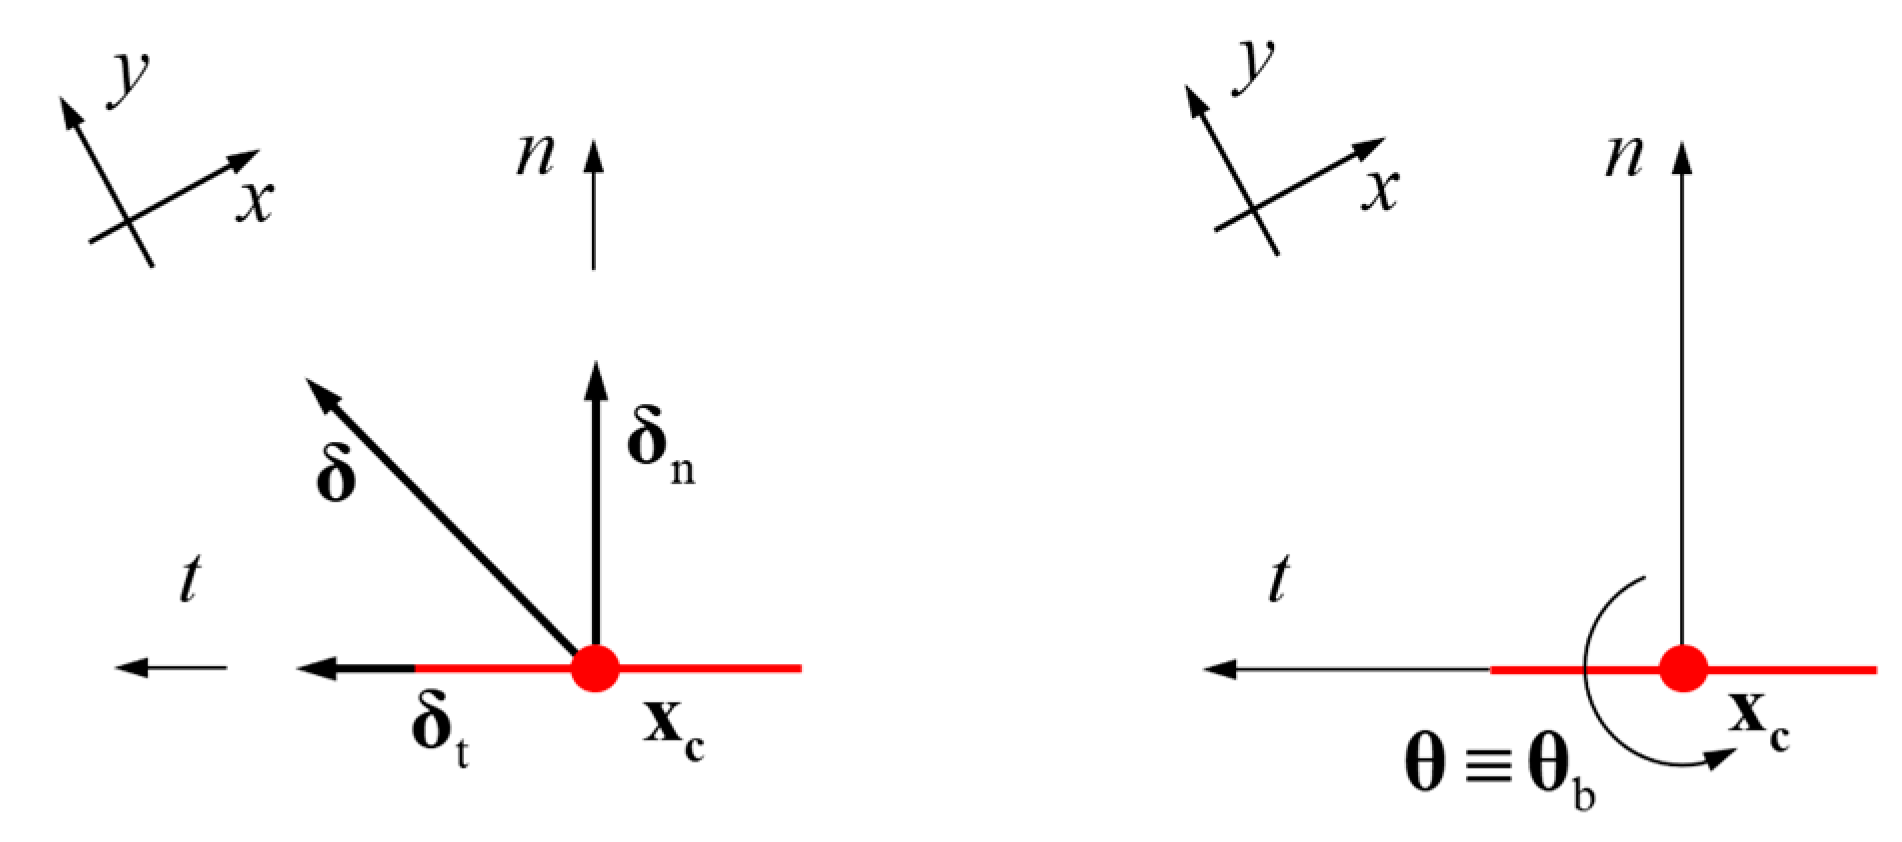
The normal unit vector of n × t surface is defined as k ^ = n ^ c × t ^ c for convenient calculation. Equations (5) and (6) can be obtained by decomposing the relative translational velocity δ ˙ and the relative angular velocity θ ˙ along n ^ c and t ^ c , respectively, as shown in Figure 3.
δ ˙ = δ ˙ n + δ ˙ t
θ ˙ = θ ˙ bk
where δ ˙ n is the relative translational velocity of the contact along n ^ c , with δ ˙ n = δ ˙ n n ^ c ; δ ˙ t is the relative translational velocity of the contact along t ^ c , with δ ˙ t = δ ˙ δ ˙ n ; and θ ˙ bk is the angular velocity around k ^ at the contact.
Assuming that the time step is Δ t , the relative displacement increment Δ δ and the relative rotation angle increment Δ θ of the contact can be expressed using Equations (7) and (8), respectively:
Δ δ = Δ δ n n ^ c + Δ δ t t ^ c
Δ θ = Δ θ b = θ ˙ bk Δ t
where Δ δ n is the displacement increment along the coordinate axis n ^ c , with Δ δ n = δ ˙ n Δ t , and Δ δ t is the displacement increment along the coordinate axis t ^ c , with Δ δ t = δ ˙ t Δ t .
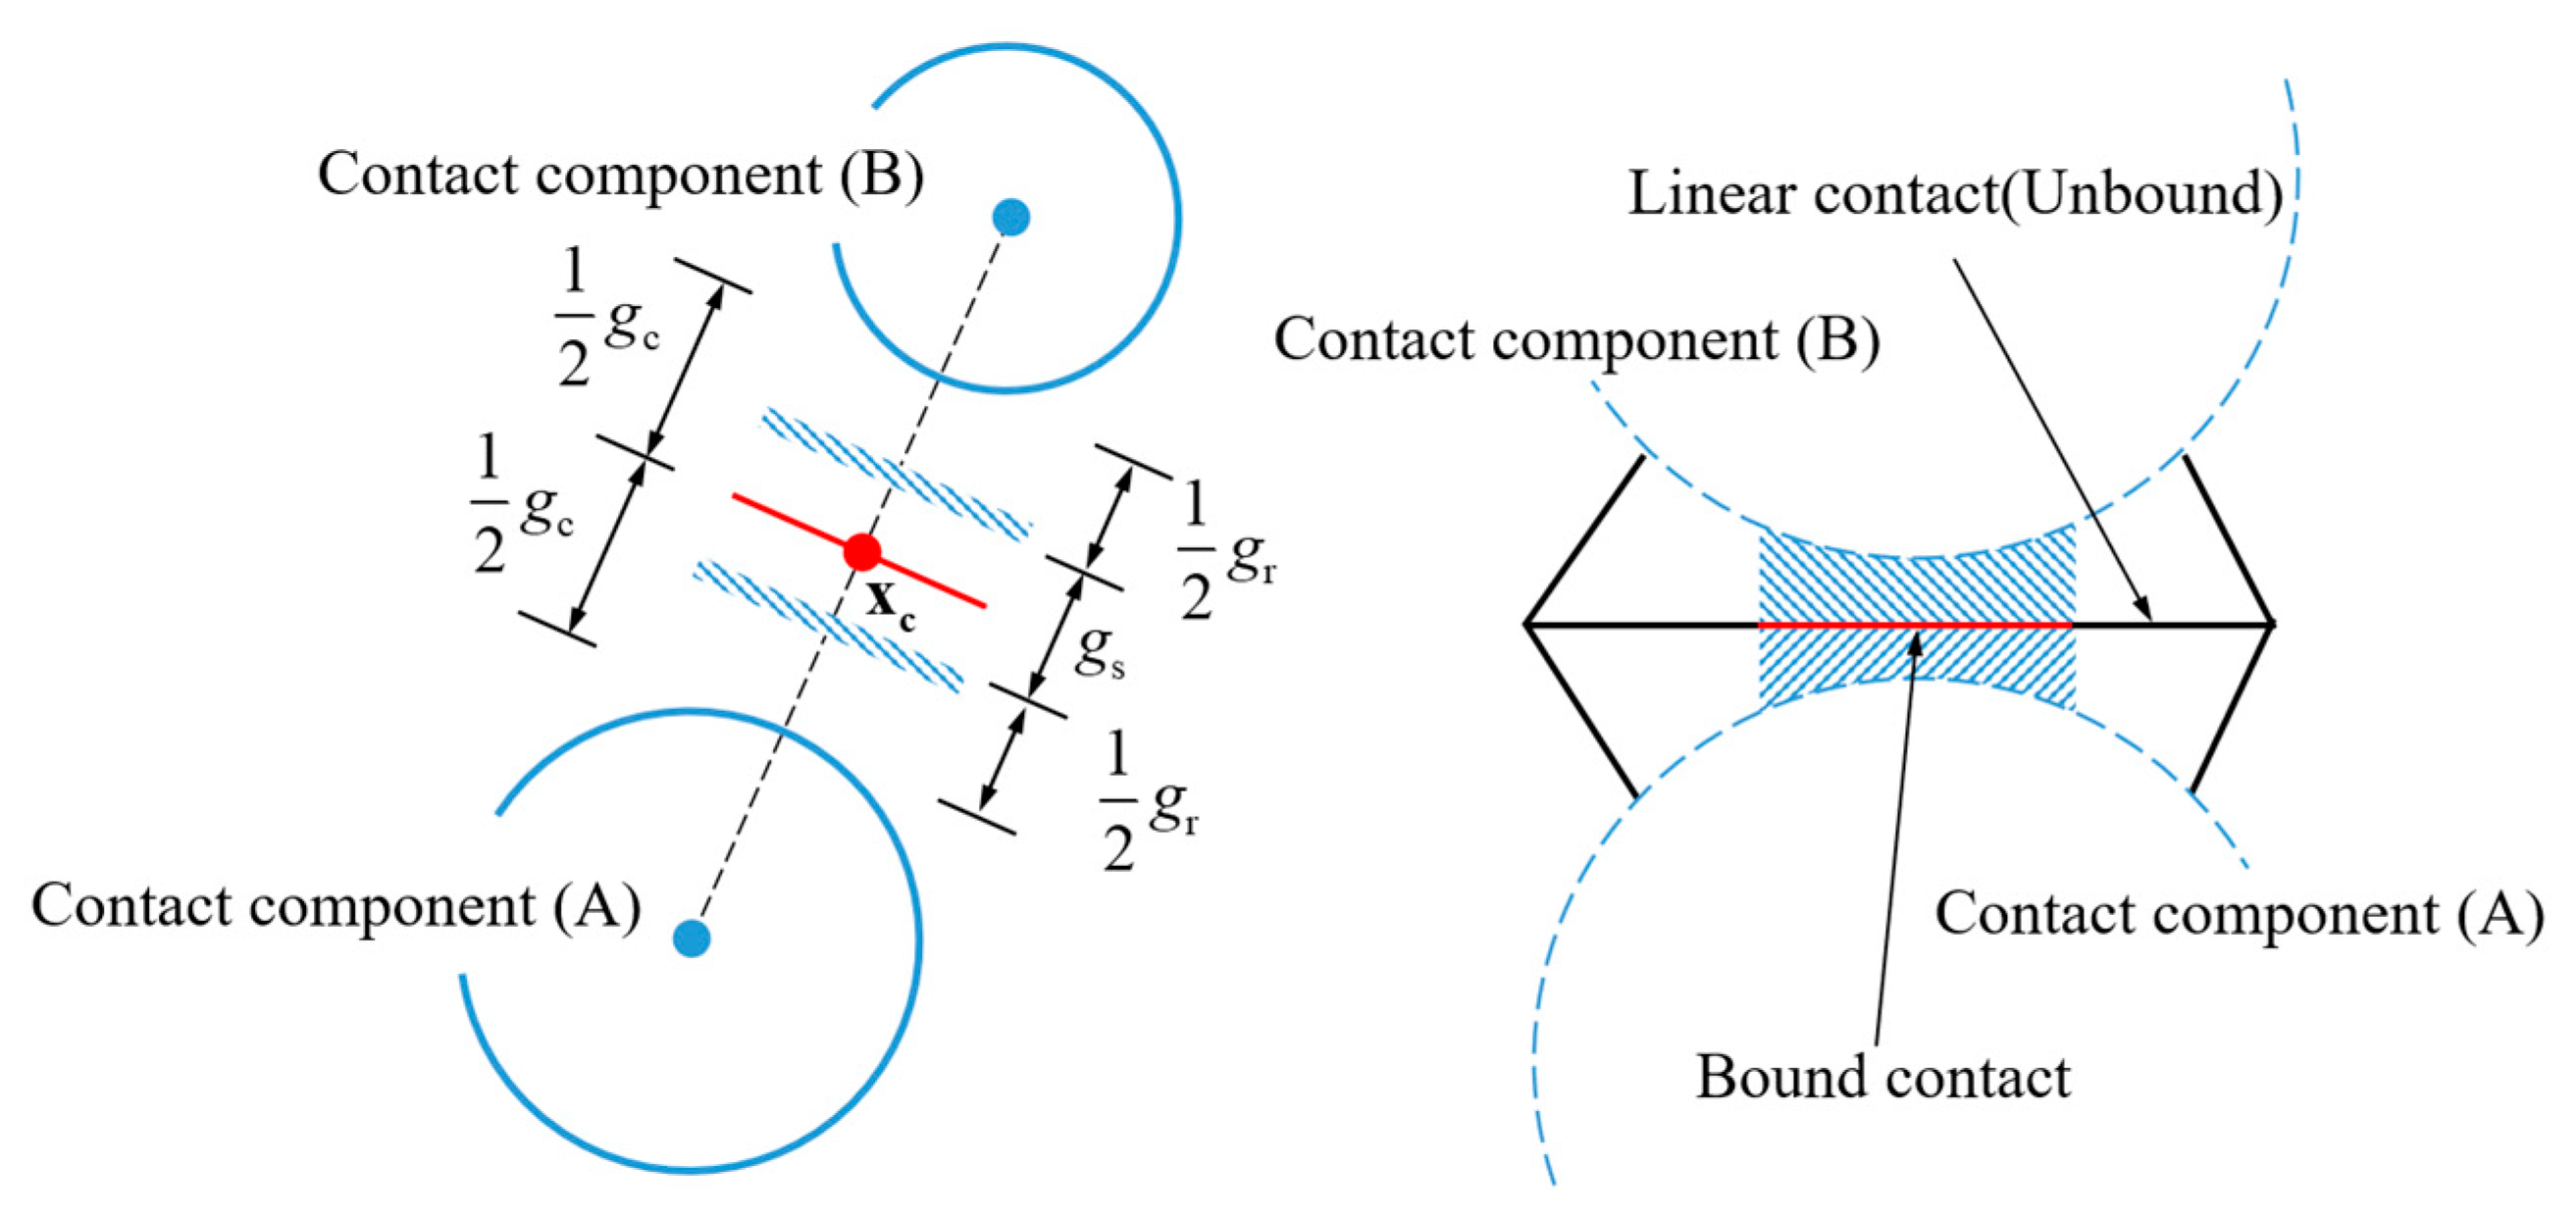
The contact kinematics law obtained from Equations (1)–(8) is the basis for judging the contact state and calculating the load transfer. It is assumed that the contact components contact each other and activate the contact model, when the traverse contact gap, gs ≤ 0, is based on the reference contact distance of gr, as shown in Figure 4. The contact in the model can be regarded as a combination of linear contact (the contacts only transfer compression, but not tension and torque) and adhesive contact (the contacts are rigid connection) when the failure of cemented materials (such as rock) are calculated.
The linear contact model and the parallel-bond model are shown in Figure 5 [40]. The parallel-bond force and torque calculation formula is expressed in Equation (9):
{ F c = F l + F d + F ¯ M c = M ¯
where F c and M c are the contact force and contact torque, respectively; F l is the linear contact force; F d is the dashpot force; F ¯ is the parallel-bond force; and M ¯ is the parallel-bond moment.
According to the definition of the parallel-bond model, the parallel-bond stress σ ¯ (tensile stress if σ ¯ > 0) is calculated based on Equation (10). The bond will be broken when σ ¯ > σ ¯ c , and σ ¯ c is defined as the bond strength. In this case, F ¯ = 0 , M ¯ = 0 , and the parallel-bond contact model changes to the linear contact model.
σ ¯ = F ¯ n A ¯ + β ¯ M ¯ b R ¯ I ¯
Here, F ¯ n is the normal parallel-bond force; A ¯ is bonding cross-sectional area, with A ¯ = 2 R ¯ t , t = 1 , and R ¯ = min ( R ( A ) , R ( B ) ) in the 2D model; β ¯ is the contribution coefficient of torque to contact stress, with β ¯ [ 0 , 1 ] ; M ¯ b is the parallel-bond moment; and I ¯ is the moment of inertia, with I ¯ = 2 3 t R ¯ 3 .

3. Modeling of Pebbled Sandstone

3.1. Modeling Steps

The inhomogeneity of pebbled sandstone is mainly manifested in the material inhomogeneity between the sandstone matrix and the filled gravel. The matrix area and the gravel area are separated by generating a stochastic regular polygon closed boundary. These polygons are set as the gravel material and are surrounded by sandstone material. The modeling process is shown in Figure 6, which includes the following steps:
(1)
Establish the polygon-generating area according to the size of the rock and generate points p 0 ( i ) ( x 0 ( i ) , y 0 ( i ) ) randomly in this area.
(2)
Take a random radius r ( i ) within the set granularity range ( r min , r max ) to generate a circle Θ ( i ) with p 0 ( i ) as the center and r ( i ) as the radius.
(3)
Judge whether Θ ( i ) intersects with the circumscribed circle Θ ( j ) ( j = 1 , 2 , , i 1 ) of all the polygons generated, and return to Step 1 in the case of intersection.
(4)
Take point p 1 ( 1 ) ( x 1 ( 1 ) , y 1 ( 1 ) ) on the circle to generate an arbitrary regular n ( i ) polygon with circle Θ ( i ) as the circumscribed circle and p 1 ( i ) as the vertex. The included angle between the line between point p 0 ( i ) and point p 1 ( i ) and the x -axis square is a random angle α ( i ) .
(5)
Calculate the sum of the areas of all polygons currently generated and the volume ratio of the rock sample, P g ( i ) = j = 1 i A p ( j ) A × 100 % , to characterize the gravel content. If P g ( i ) P set , the cycle ends, where A p is the polygon area, A is the rock model area, and P set is the gravel content.
Figure 6. Generation process of pebbled sandstone samples.
Processes 11 00671 g006
In the modeling program, the coordinates of the polygon center point ( x 0 ( i ) , y 0 ( i ) ) , the radius r ( i ) of the circumscribed circle, the polygon rotation angle α ( i ) , and the number n ( i ) of polygon sides can be adjusted by establishing different random distribution models to choose the distribution law of the generated random numbers.

3.2. Comparison and Validation

In the process of rock-breaking simulation using the particle flow code, the mechanical properties of particles and bonds are characterized by micro-mechanical parameters. The micro-mechanical parameters adopted in the simulation are not directly related to the macro-mechanical parameters of the natural rock, but they can be determined by the simulation tests. The simulation tests adopt the trial-and-error method to compare the results of the simulated macro-mechanical parameters of the rock obtained from each test with the actual rock sample until the error is acceptable. At this time, the adopted micro-mechanical parameters are the DEM modeling parameters of the actual rock sample. In the calibration process of the micro-mechanical parameters of the discrete element rock model, the filling gravel of the rock samples refers to the test data of the actual rock samples in the Tabei area, and the material parameters of the pebbled sandstone matrix refer to the pure sandstone rock samples [41]. The macro-mechanical parameters of the rocks are shown in Table 1. The micro-mechanical parameters of the DEM rock models are calibrated using the UCS (uniaxial compression strength) simulation tests, and the results are shown in Table 2.
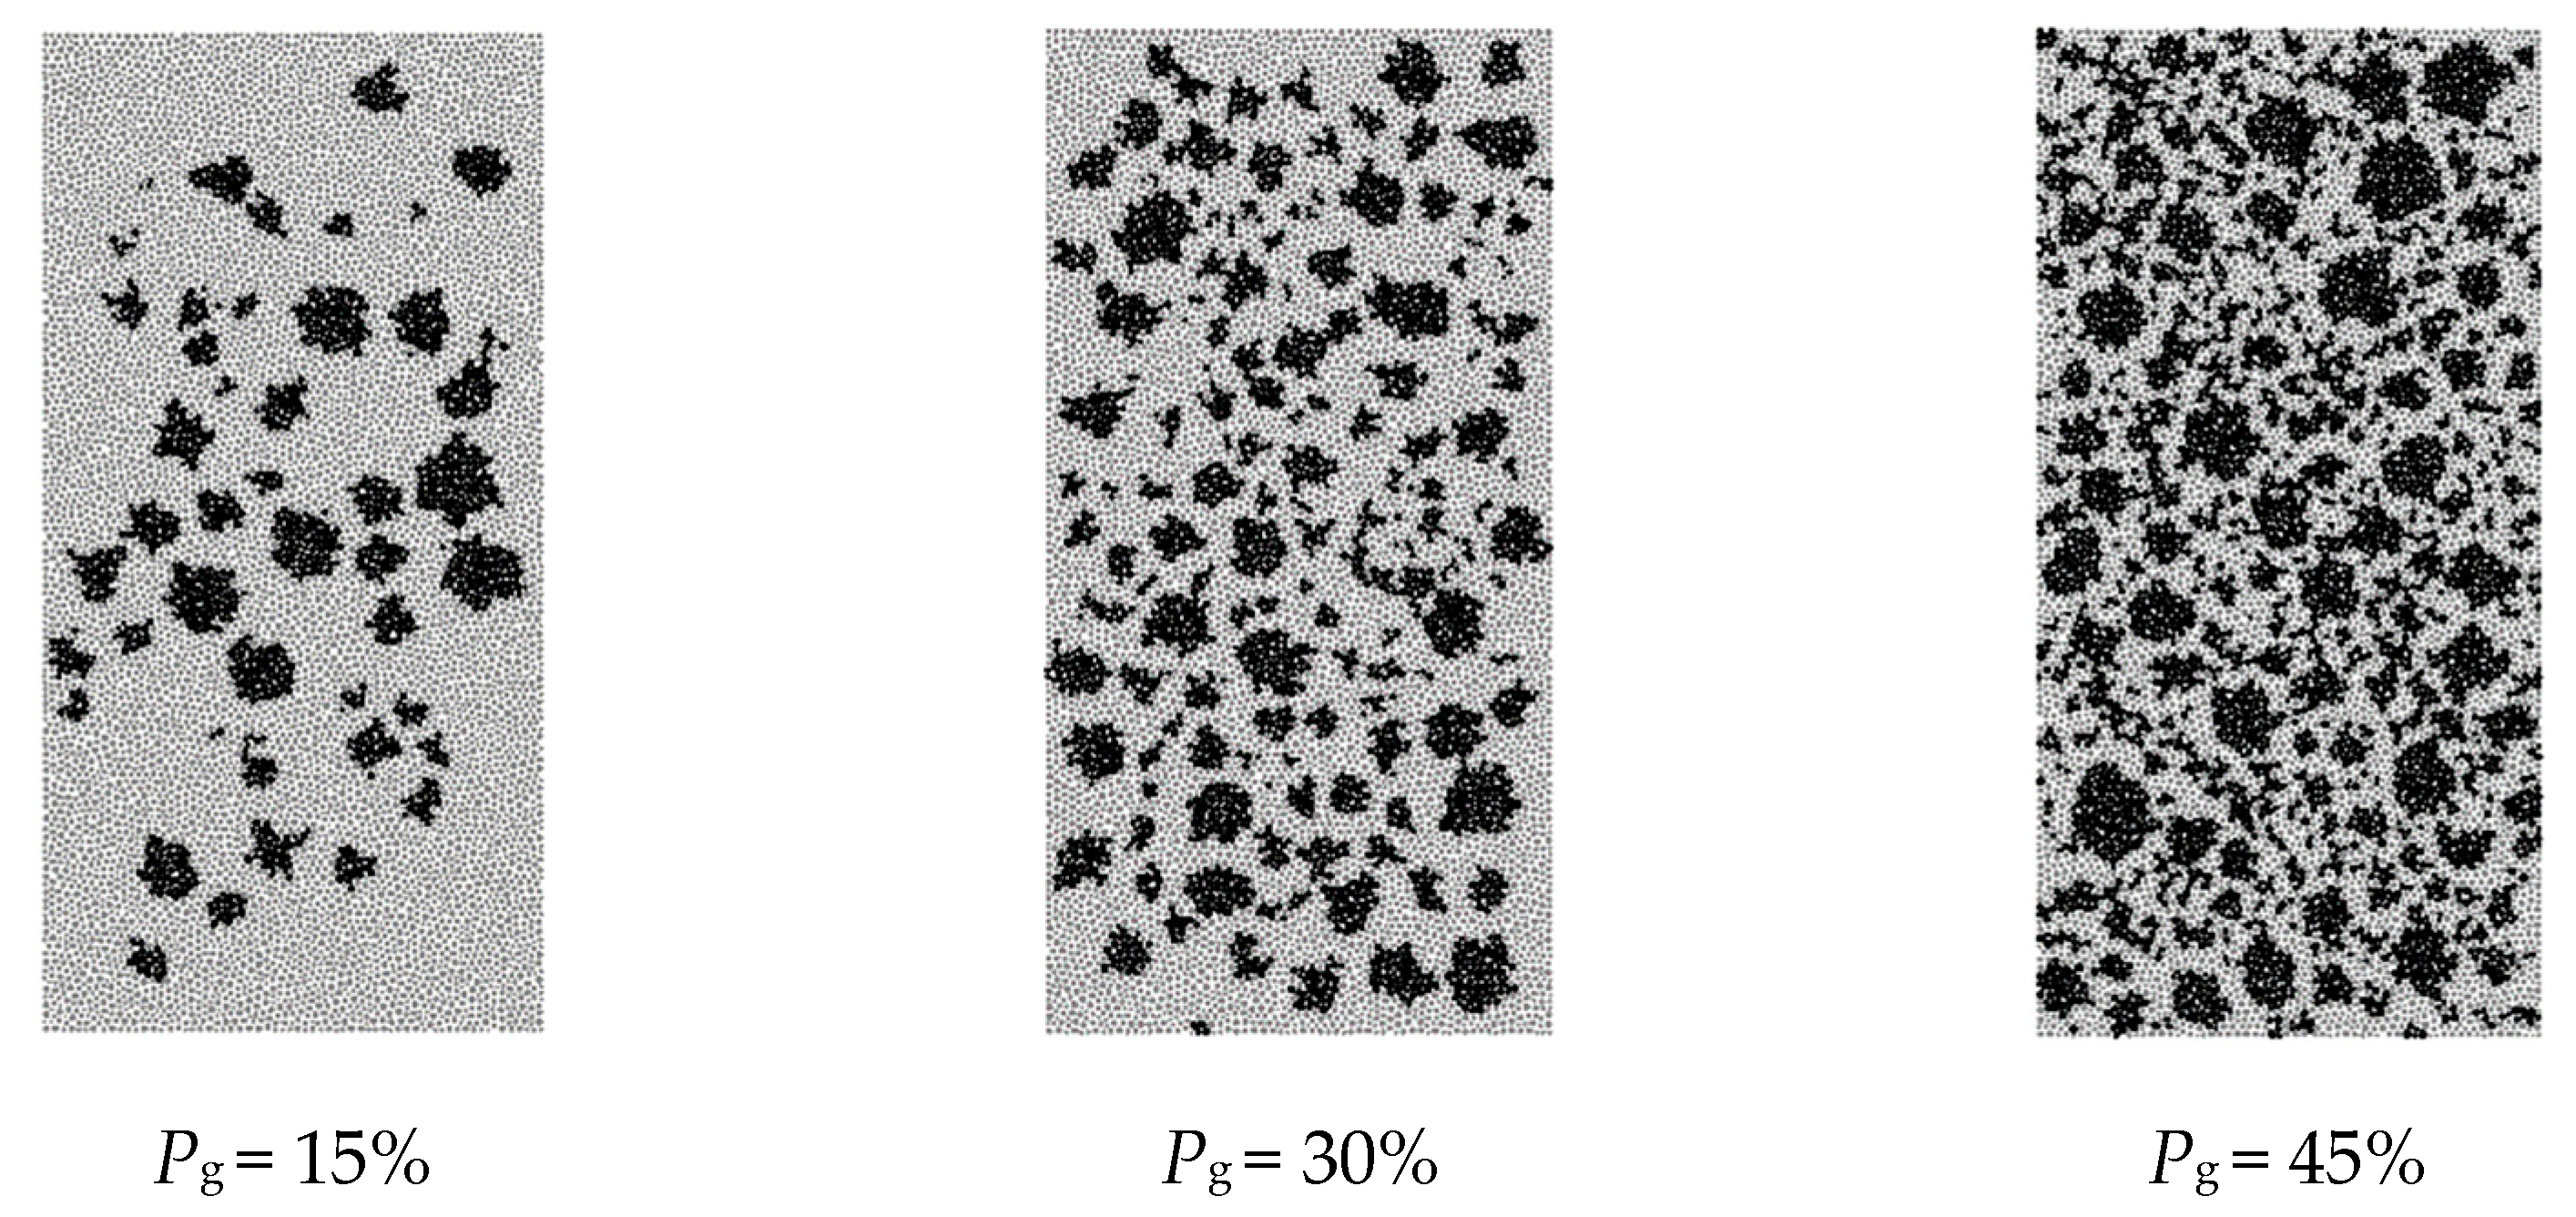
In order to obtain the mechanical properties of gravelly sandstone with different gravel content, the uniaxial compression and crushing process of pebbled sandstone with 5–45% Pg is simulated. The physical model is established by using the stochastic regular polygon filling method. Some rock samples after particle filling are shown in Figure 7. The light parts in the figure are pure sandstone material, and the dark parts are filled gravel material. The rock sample used in the simulation is a standard core column of 50 mm × 100 mm in size. The minimum radius of the modeled particles is 0.3 mm, and the maximum particle size is 0.5 mm. A total of 8753 particles are generated.
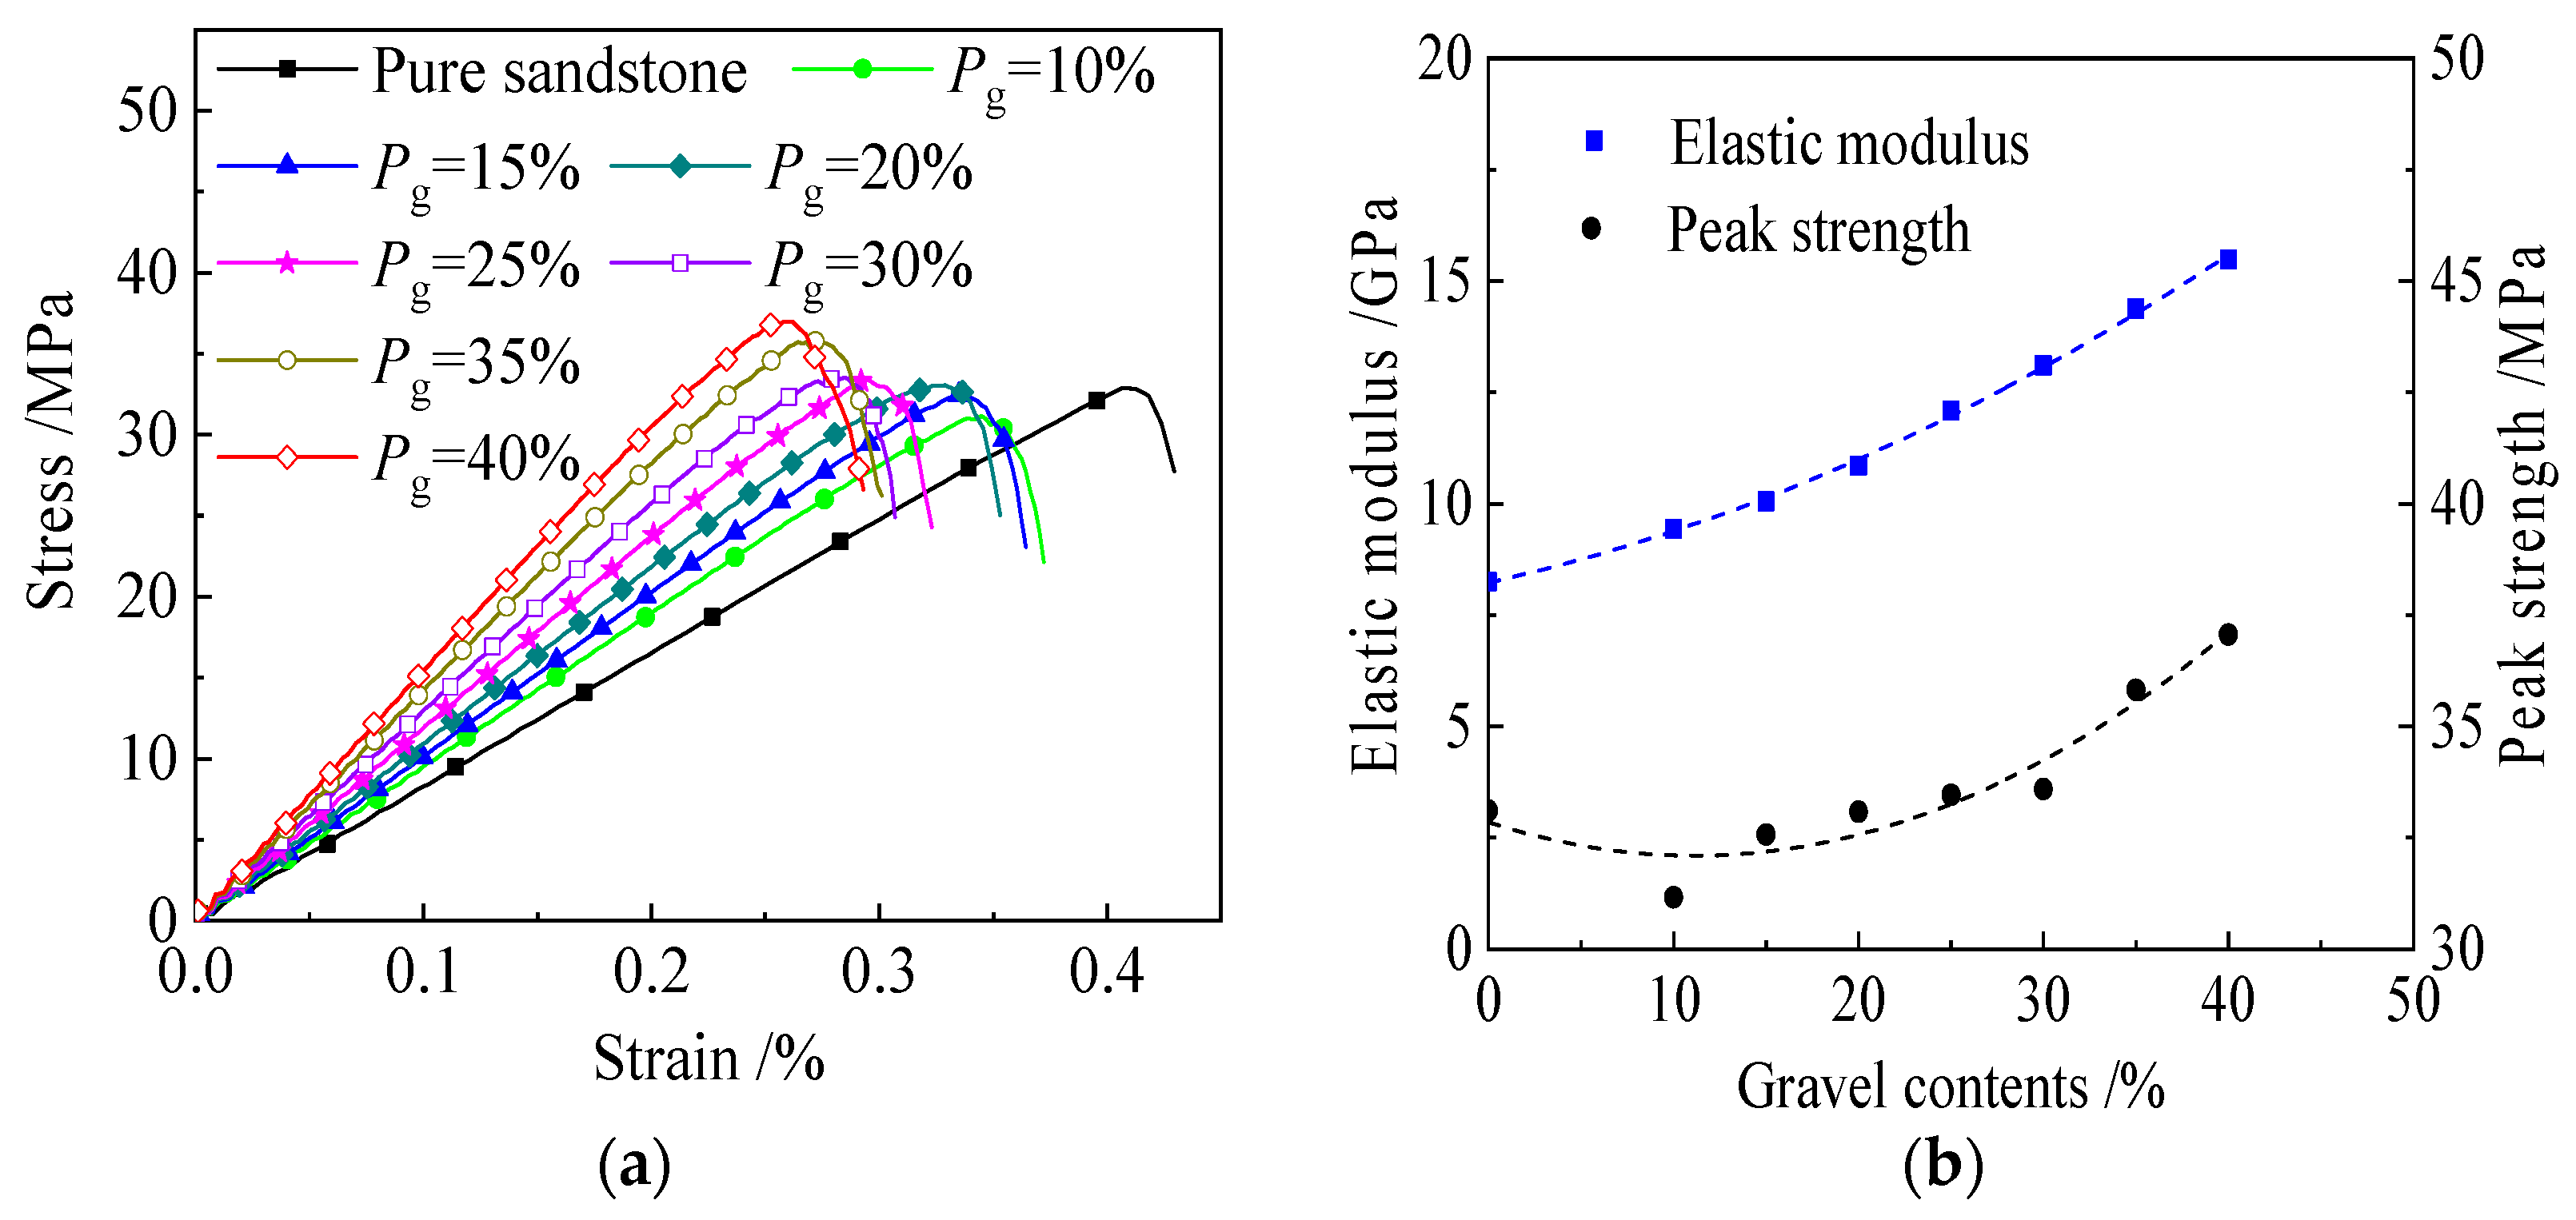
The uniaxial compression stress–strain curves of the rock samples with different gravel contents are shown in Figure 8a, and the change curves of the macro-mechanical parameters are shown in Figure 8b. The simulation results show that the elastic modulus of pure sandstone is the lowest. With an increase in gravel content in the rock models, the elastic modulus of the rock samples increases linearly, while the peak strength of the rock samples decreases slowly at first and then increases gradually. The UCS test results conducted on the pebbled sandstone model established in this paper show that the gravel content in the rock increases from 0 to 40%, the elastic modulus of the rock increases by 87.86%, and the peak strength of the rock increases by 12.41%, indicating that a rise in the gravel content has a greater impact on the elastic modulus of the rock samples compared to the peak strength.
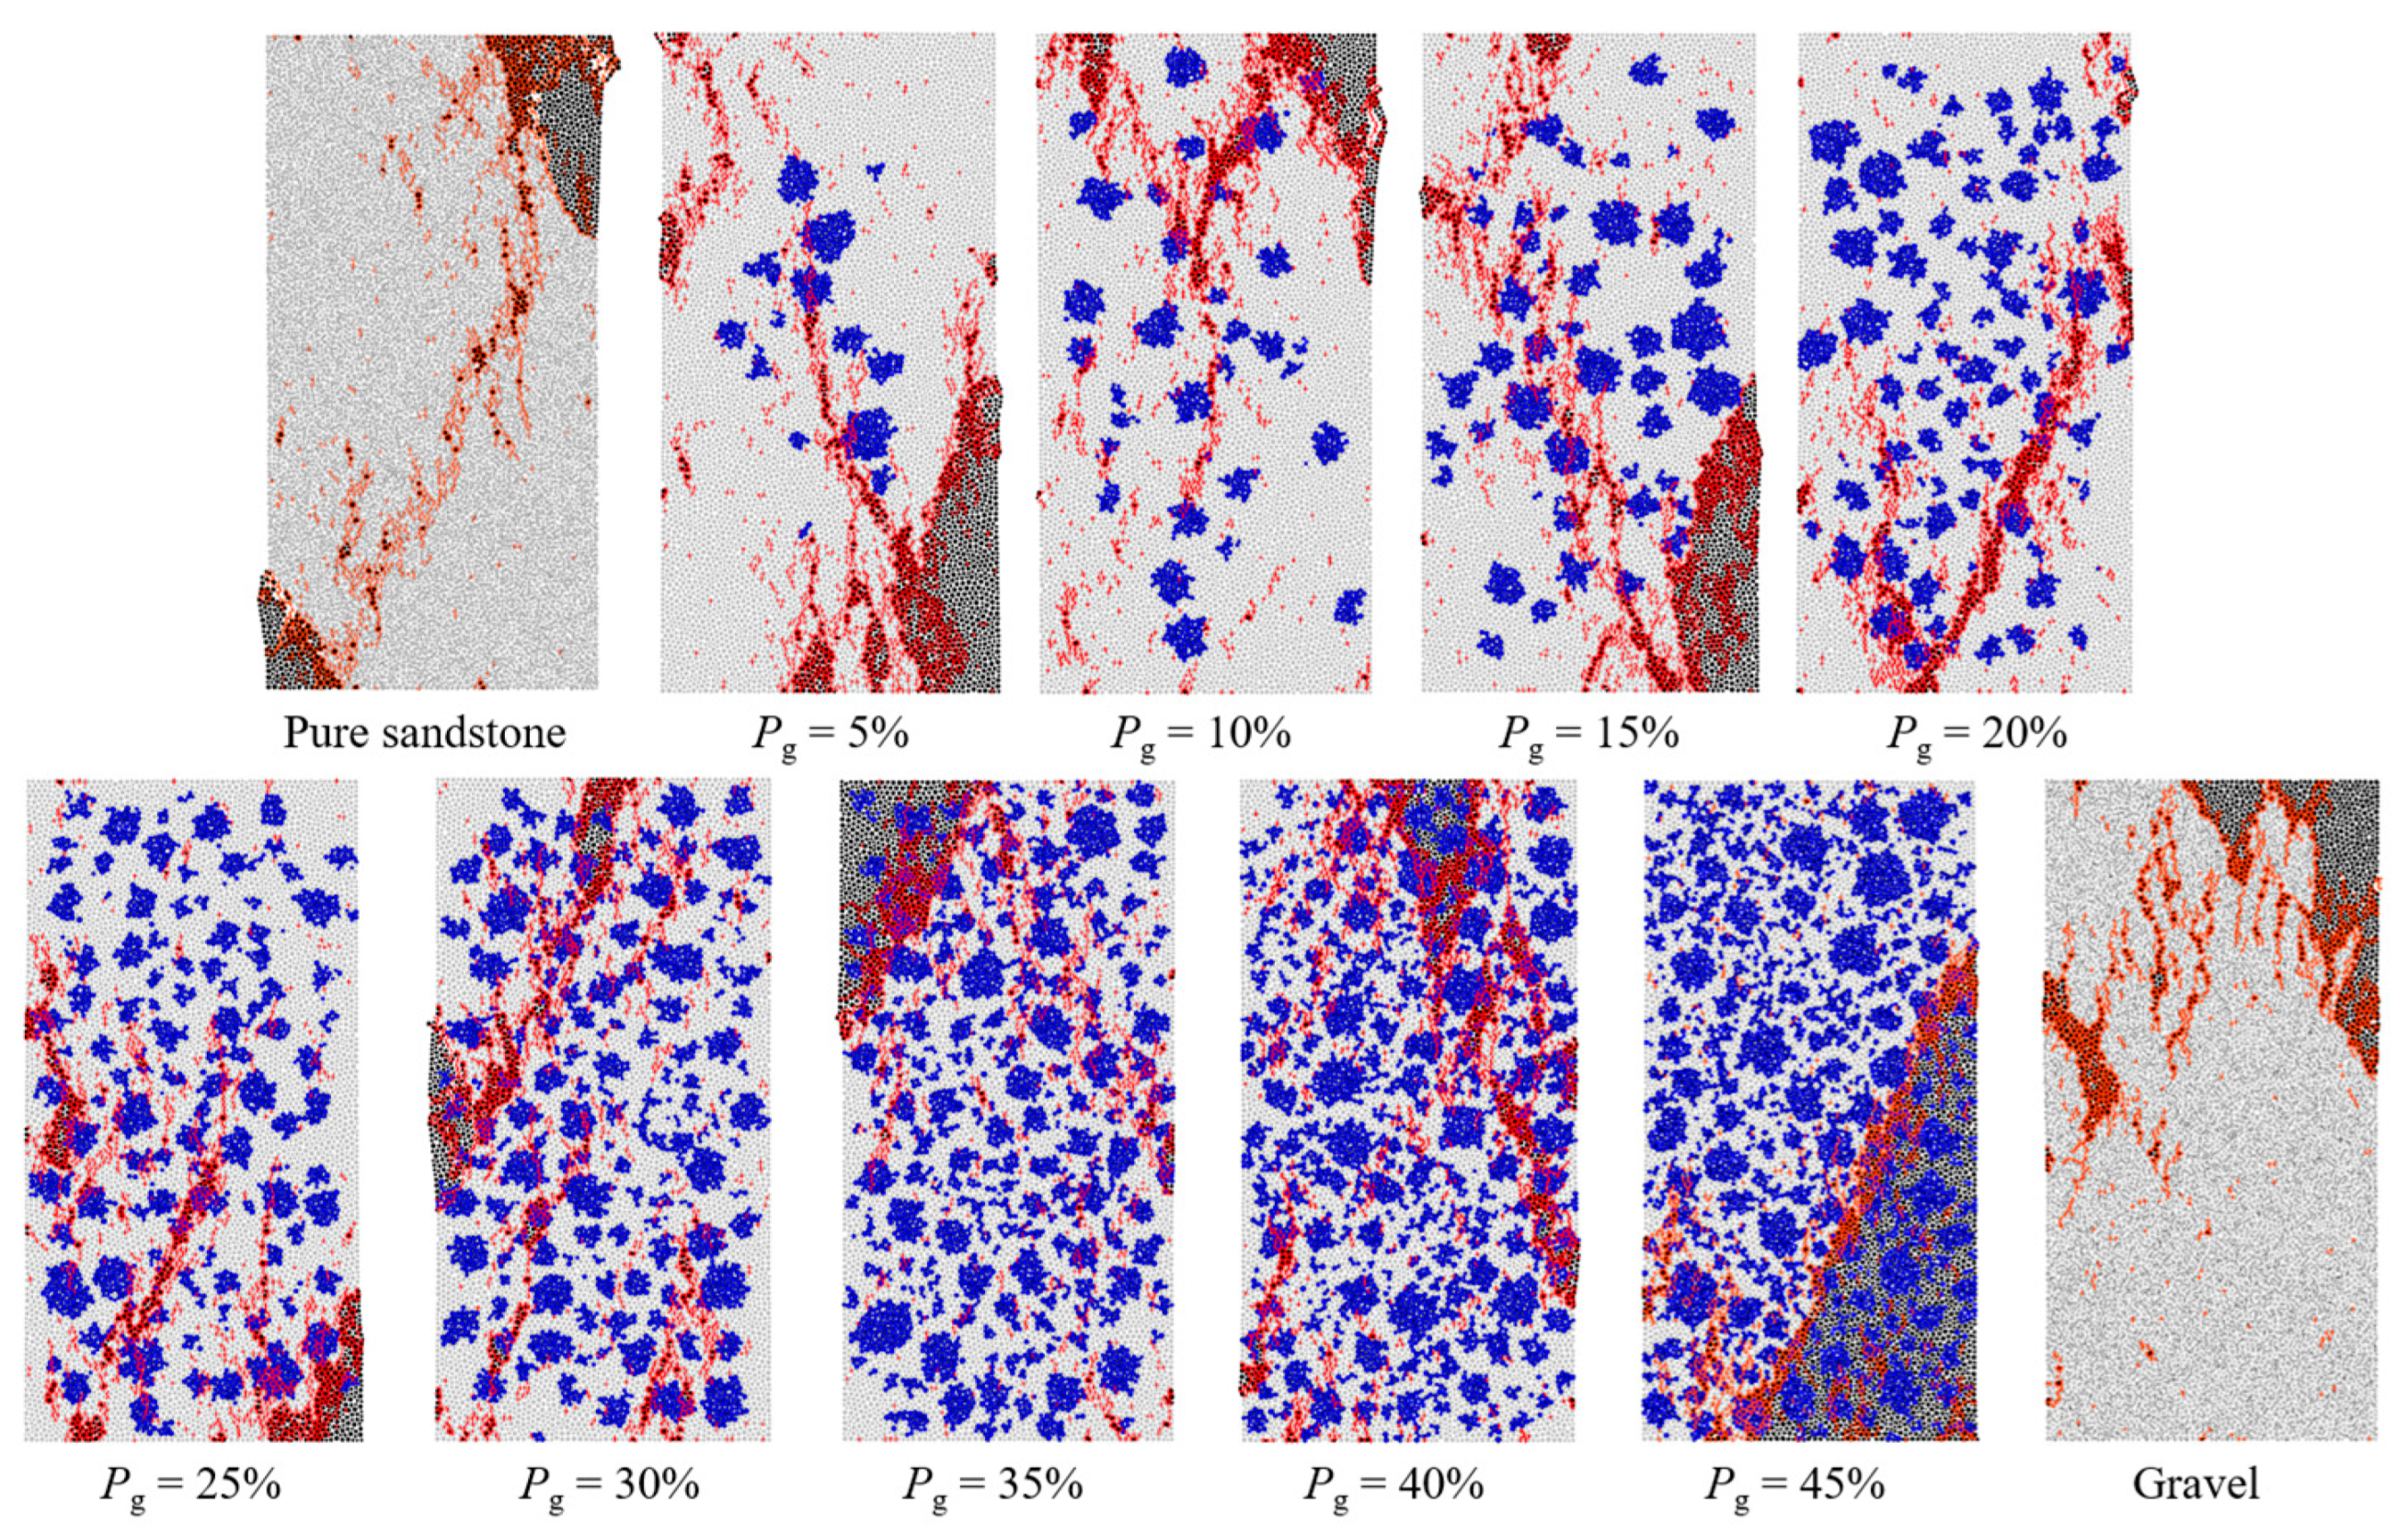
The fracture characteristics of the simulated rock samples are shown in Figure 9. The gray part and the black part in the figure represent the split rock fragments; the blue part represents the gravels; and the broken red lines indicate the crack distribution. These characteristics are in good agreement with the experimental results and the numerical simulation results of previous researchers [34,42]. The figure shows that the distribution of gravel has a significant impact on the formation and propagation of cracks. Cracks pass through gravel, bypass gravel, and cut off after encountering gravel. In addition, the elastic modulus of the rock is greatly increased due to gravel packing, which leads to an increase in rock brittleness. The number of cracks in the final wreck tends to increase.

4. Simulation of PDC Cutting Pebbled Sandstone

4.1. Loading Model of PDC Cutter

The rotary table or top drive transmits torque to the bit through the drill pipe and drill collar while drilling. At the same time, part of the gravity of the drill collar also acts on the bit so that the bit can cut and break rocks. In the previous modeling process of rock breaking using PDC single-tooth cutting, the cutting speed of the PDC cutter is set to be uniform, and the cutting depth of the cutter in the cutting process is fixed. However, for PDC bits, the penetration of the cutter in the process of rock breaking is mainly controlled by the vertical load acting on them. In the process of movement, due to the great slenderness ratio of the drill string, the torsional stiffness of the cutter on the cutting plane becomes smaller, and the cutting speed is not fixed, which will cause fluctuations and stick–slip.
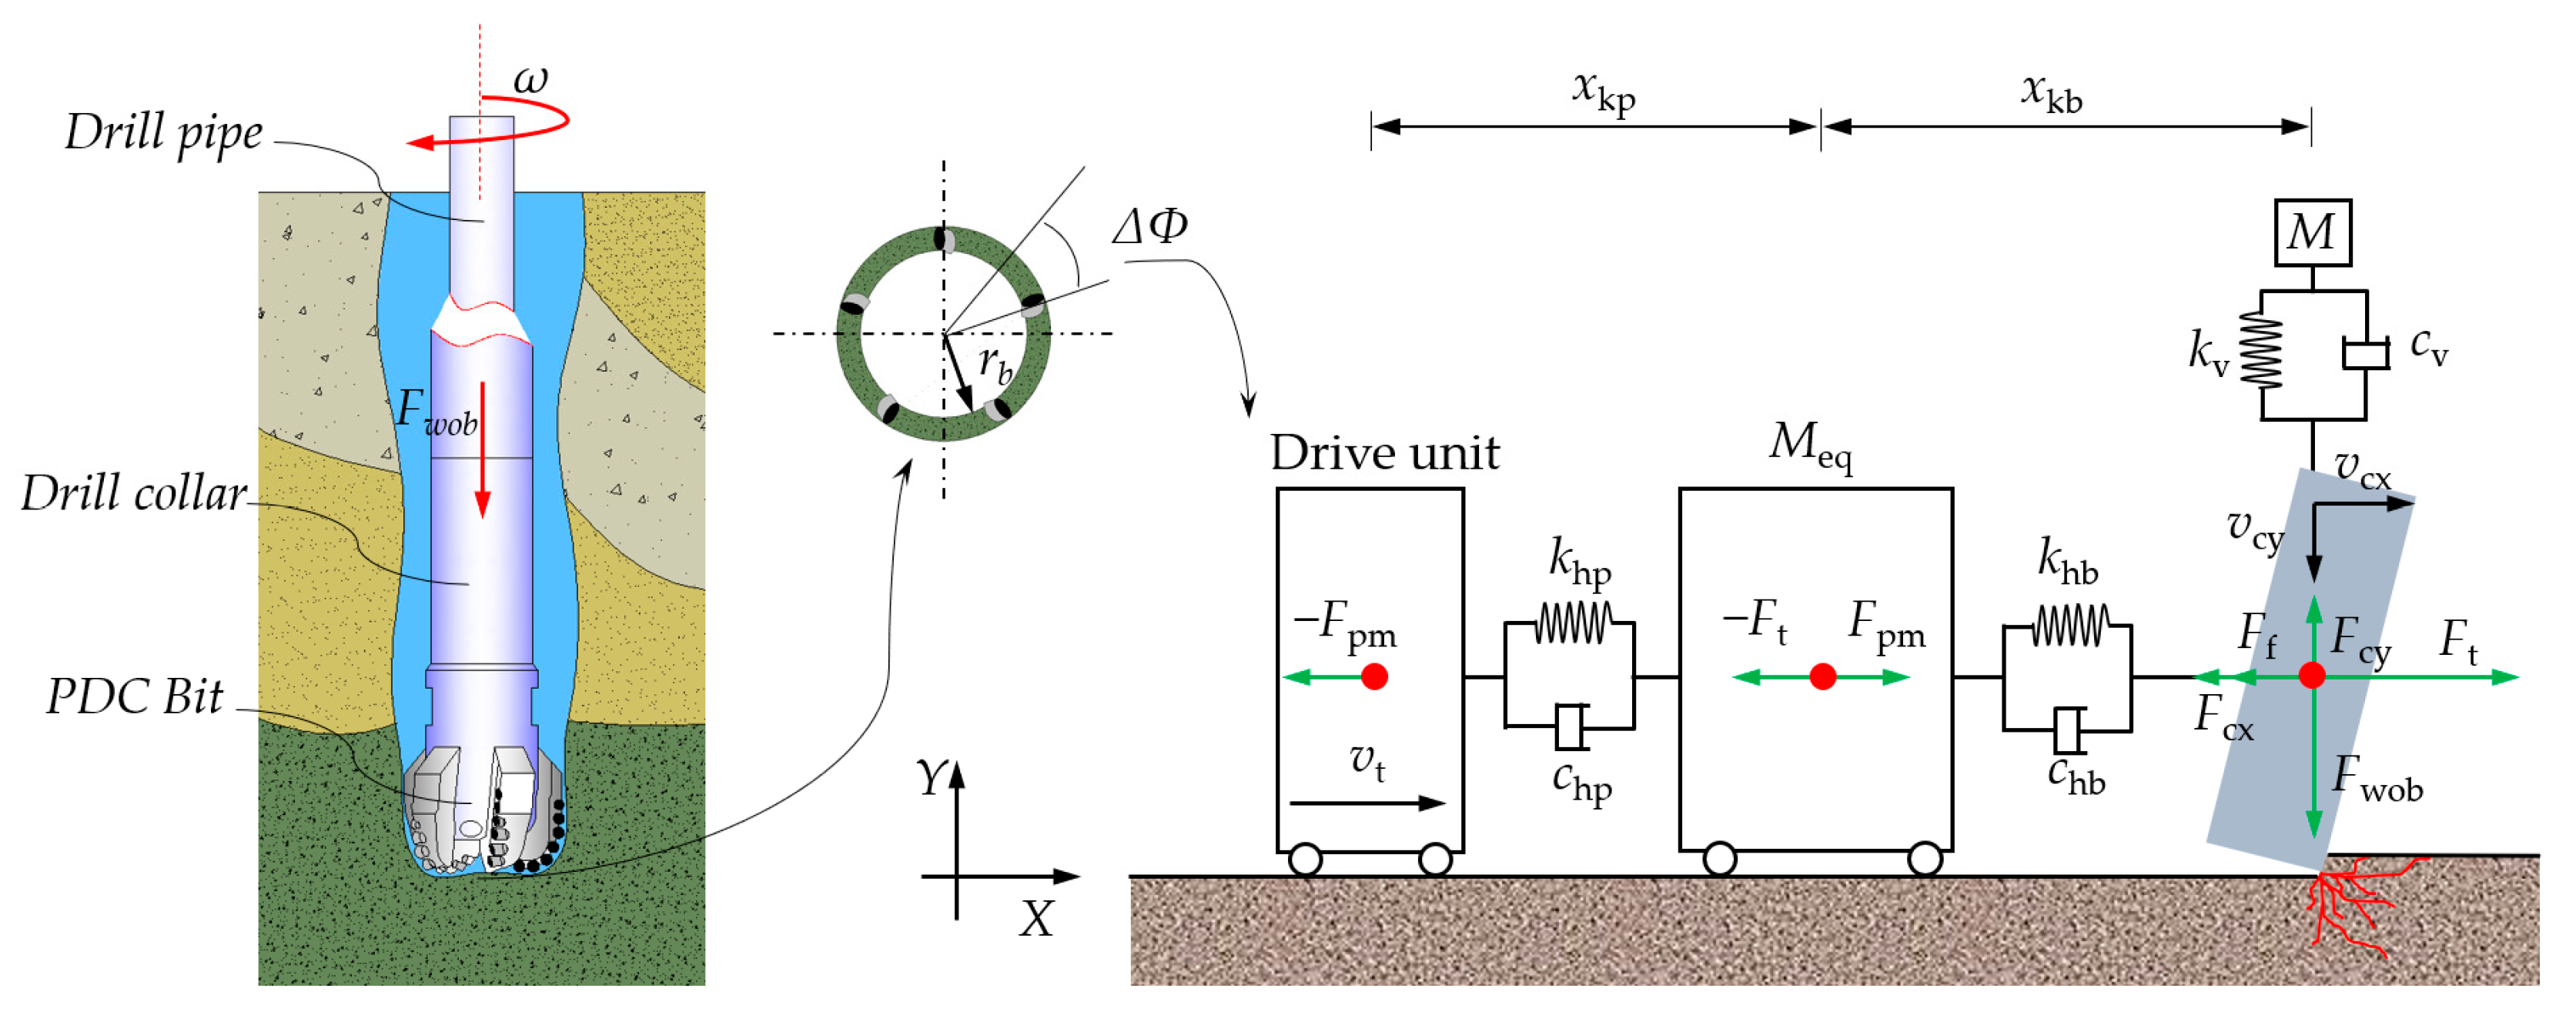
The force state of the PDC bit and the cutter during drilling is shown in Figure 10. When the drill bit rotation angle ΔΦ is small enough, the movement of the cutter can be approximately regarded as a linear movement. In the rock-breaking process, it receives the support force Fn from the rock, the force Fwob of weight on the bit, the friction force Ff, and the cutting-resistance forces Fcx and Fcy of the rock to the cutter. Ft refers to the thrust formed by the top drive torque transmitted to the bit along the drill string when the top drive rotates. Under the action of Ft, the cutter breaks the rock at the speed of vcx and vcy. In the process of rock cutting, because torsional vibration always exists, the speed of the cutter is not uniform. Therefore, the spring–mass unit is considered in the model to simulate the process of the loading torque on the bit by the top drive through the drill string.
Based on the above analysis, a rock cutting model is established in this paper. In Figure 10, xkp and xkb, respectively, represent the initial length of the simulated spring; vt represents the system driving speed; vm represents the movement speed of the mass unit; vcy and vcx represent the vertical speed and the horizontal speed of the cutter, respectively; and Meq represents the mass unit. This model can simulate the vibration of the cutter, especially the formation and development of stick–slip vibration, and is used to study the vibration suppression method and its impact on the cutter. Since stick–slip vibration is the main reason for the damage to drill components, the control model is simplified, ignoring the elasticity and damping in the vertical direction. In order to facilitate the comparison test, the proportional coefficient is defined. The expression form is shown in Equation (11), and the model parameters are shown in Table 3.
{ α = m pdc M eq β = k hp k hb γ = c hp c hb
Here, α, β, and γ are the dimensionless proportional coefficients; mpdc is the mass of the PDC cutter, in kg; Meq is the mass of the mass element, in kg; khp and khb represent the elastic coefficients of the first and second spring damping systems, respectively, in N·m−1; and chp and chb represent the damping coefficients of the first- and second-stage spring damping systems, respectively, in N·s·m−1.
In addition, the effect of Stribeck is considered in the friction calculation, that is, in the process of low-speed movement, the friction coefficient decreases with an increase in the relative speed between the contact surfaces [43,44]. The friction model expression is shown in Equation (12):
μ = μ d + ( μ s μ d ) e ( | Δ v | V r ) 2
where the friction coefficient between the research objects is μ; the static friction coefficient is μs, and for the contact between the rock and the cutter, μs = 0.82 [9]; the dynamic friction coefficient is μd, where μd = μs·Vs, Vs is the proportional coefficient, and in this paper, Vs = 0.7; ∆v is the relative velocity between the contact objects, in m·s−1; and Vr represents the characteristic parameter, with Vr = 0.2 m·s−1.

4.2. Physical Model

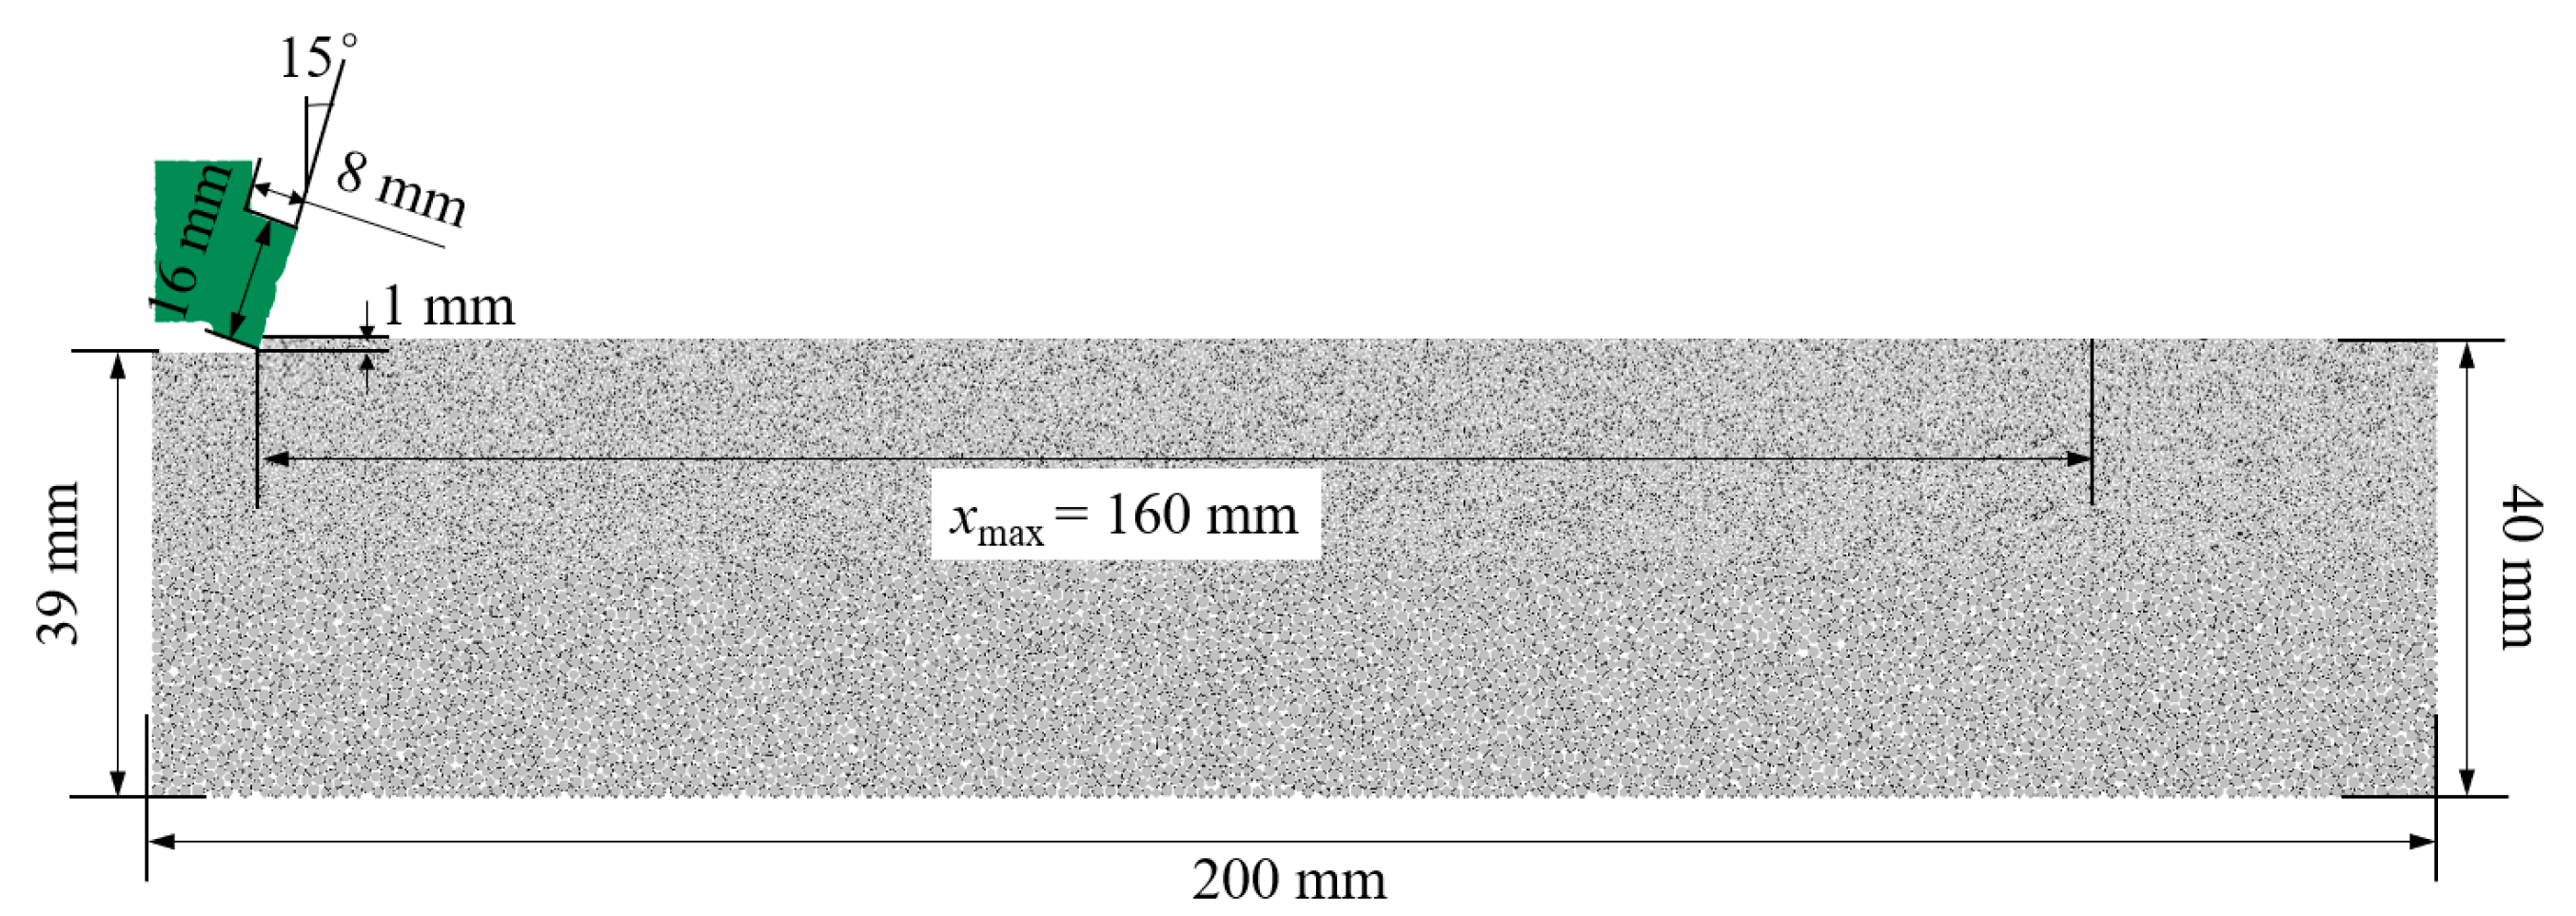
As shown in Figure 11, a 2D DEM rock cutting model is established, and the PDC cutter is modeled by particle clusters. The density of the cutter is 3200 kg/m3, the diameter is 16 mm, the thickness is 8 mm, and the cutting angle is 15°. The length of the rock sample is 200 mm, and the height is 40 mm. For the convenience of calculation, the initial cutting depth is set as 1 mm, and the maximum cutting displacement of the cutter is 160 mm. The verification process of the model has been elaborated in previous studies [45].
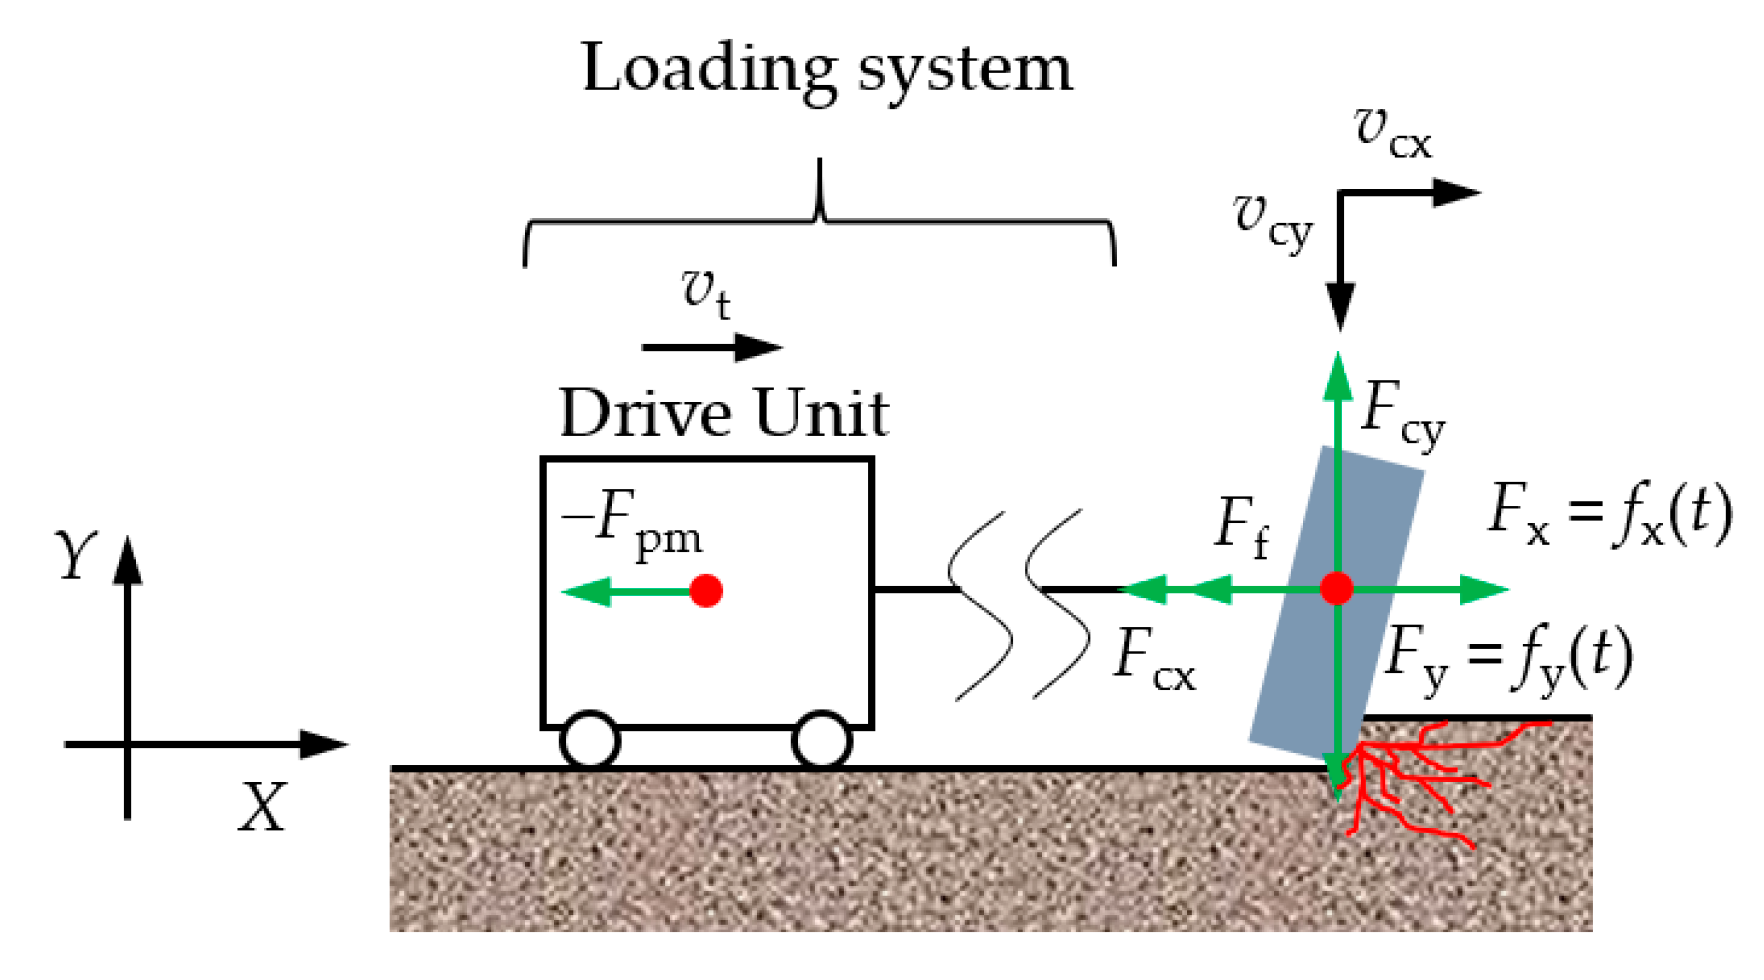
In order to study the rock-breaking performance and vibration characteristics of the cutter when the vertical impact and torsional impact act on the cutter at the same time, the impact loads are set in both the horizontal and vertical directions of the cutter, as shown in Figure 12. Assuming that the impact load changes in a sinusoidal form, the vertical load of the cutter is Fy = fy(t), and the horizontal load is Fx = fy(t). It is also assumed that the impact frequency and phase of the horizontal impact load and the vertical impact load are the same. Since different loading angles have obvious influences on rock failure [46], the proportional coefficient qv of the axial impact amplitude and Fwob and the proportional coefficient qh of the torsional impact amplitude and Fwob are defined, respectively. See Equation (13) for the expression.
{ F x = F t + q h F wob 2 [ 1 + sin ( 2 π f t ) ] F y = F wob + q v F wob 2 [ 1 + sin ( 2 π f t ) ]
where Fx and Fy are, respectively, the horizontal thrust and vertical compression on the cutter, in N; Ft is the thrust of the mass unit to the cutter, in N; qh and qv are proportional coefficients, in %; f is the impact load frequency, in Hz; and t is the action time of the impact load, in s.

4.3. Numerical Simulation

The rock-cutting simulations are carried out on a pebbled sandstone with 40% gravel content, the Fwob is set to 2 kN, the driving speed is set to 1 m/s, and the impact frequency is assumed to be 200 Hz. The pebbled sandstone cutting is calculated under different impact amplitude proportional coefficients qh and qv. All parameters of the test set are summarized in Table 4. The impact load parameters are specified with regard to the performance parameters of the multi-dimensional impactor.
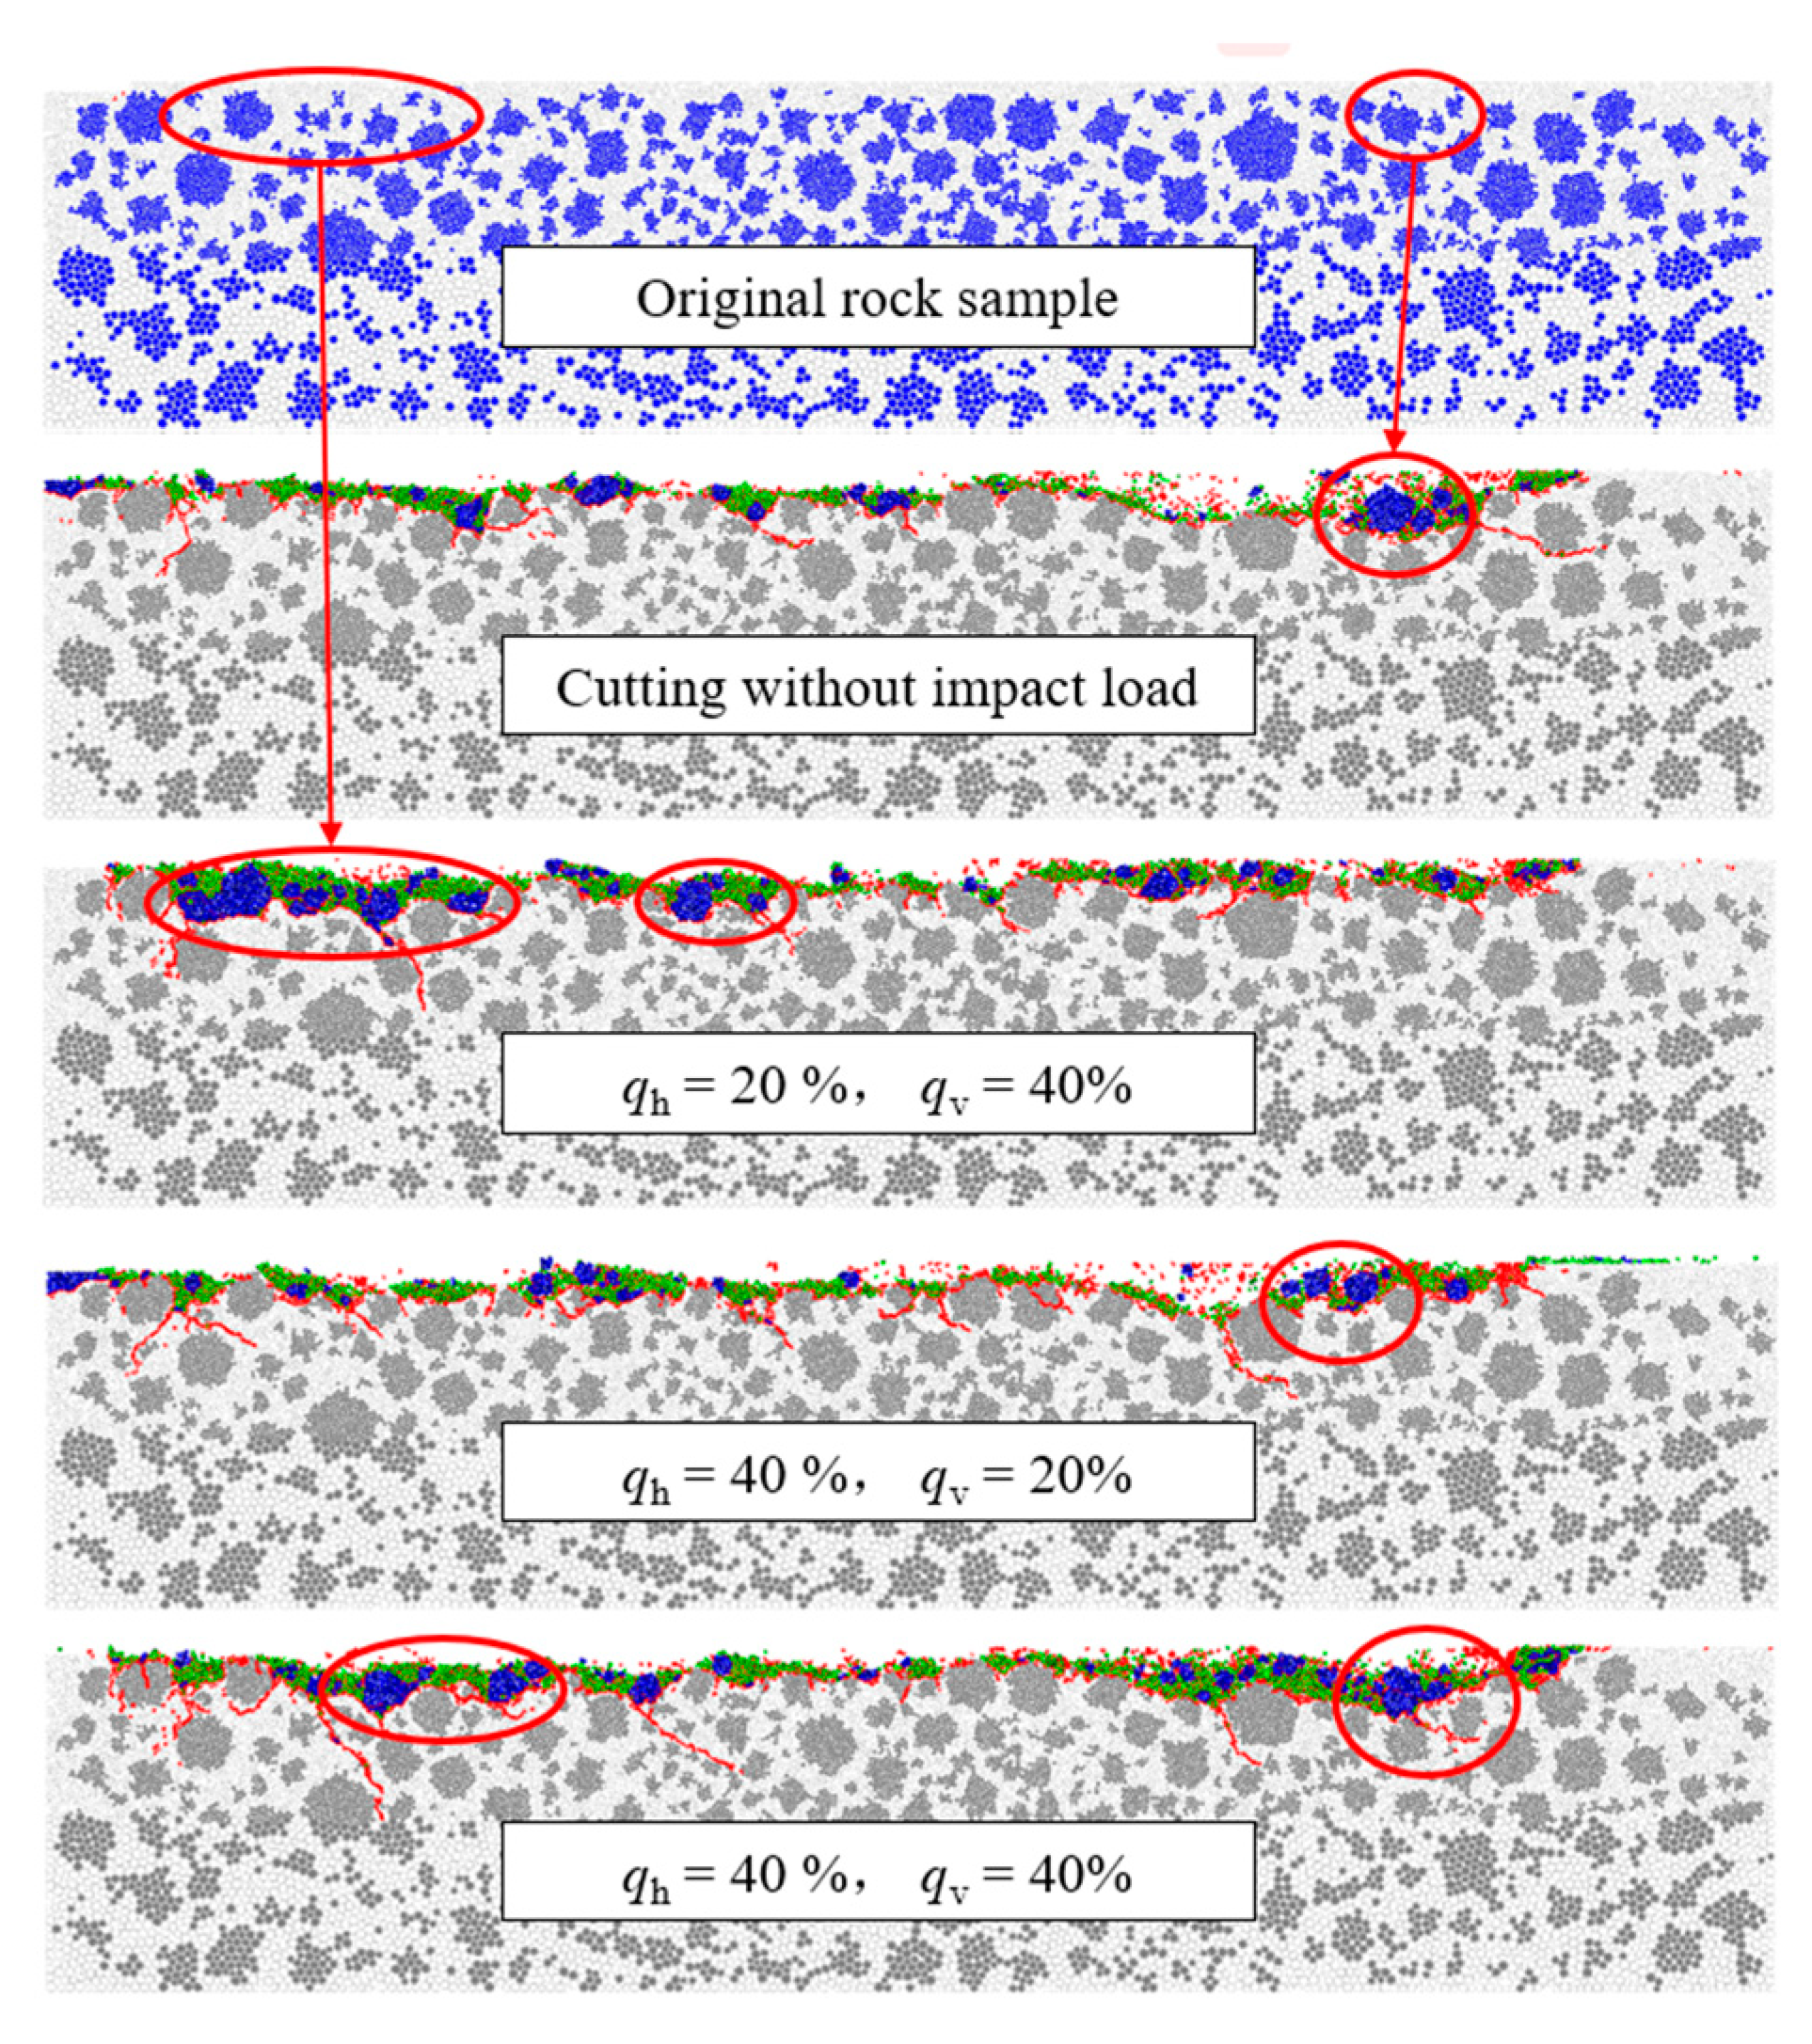
The comparison of the cutting and crushing states of the rock under static and impact loads is shown in Figure 13, where the broken red lines indicate the cracks and the colored blocks indicate the rock-crushing blocks. The broken state figure shows that multiple cracks extending to the interior of the rock are generated when the rock is cut under the impact load. The formation of such cracks is helpful for subsequent cutters to break the rock continually. Different from homogeneous rocks, more gravel is stripped as a whole during the cutting process of pebbled sandstone, as outlined in Figure 13. In particular, the case of T-2 has the largest number of stripped gravels. After the vertical impact amplitude and the horizontal impact amplitude are increased simultaneously, the largest number of cracks extending to the interior of the rock are generated in the case of T-4.
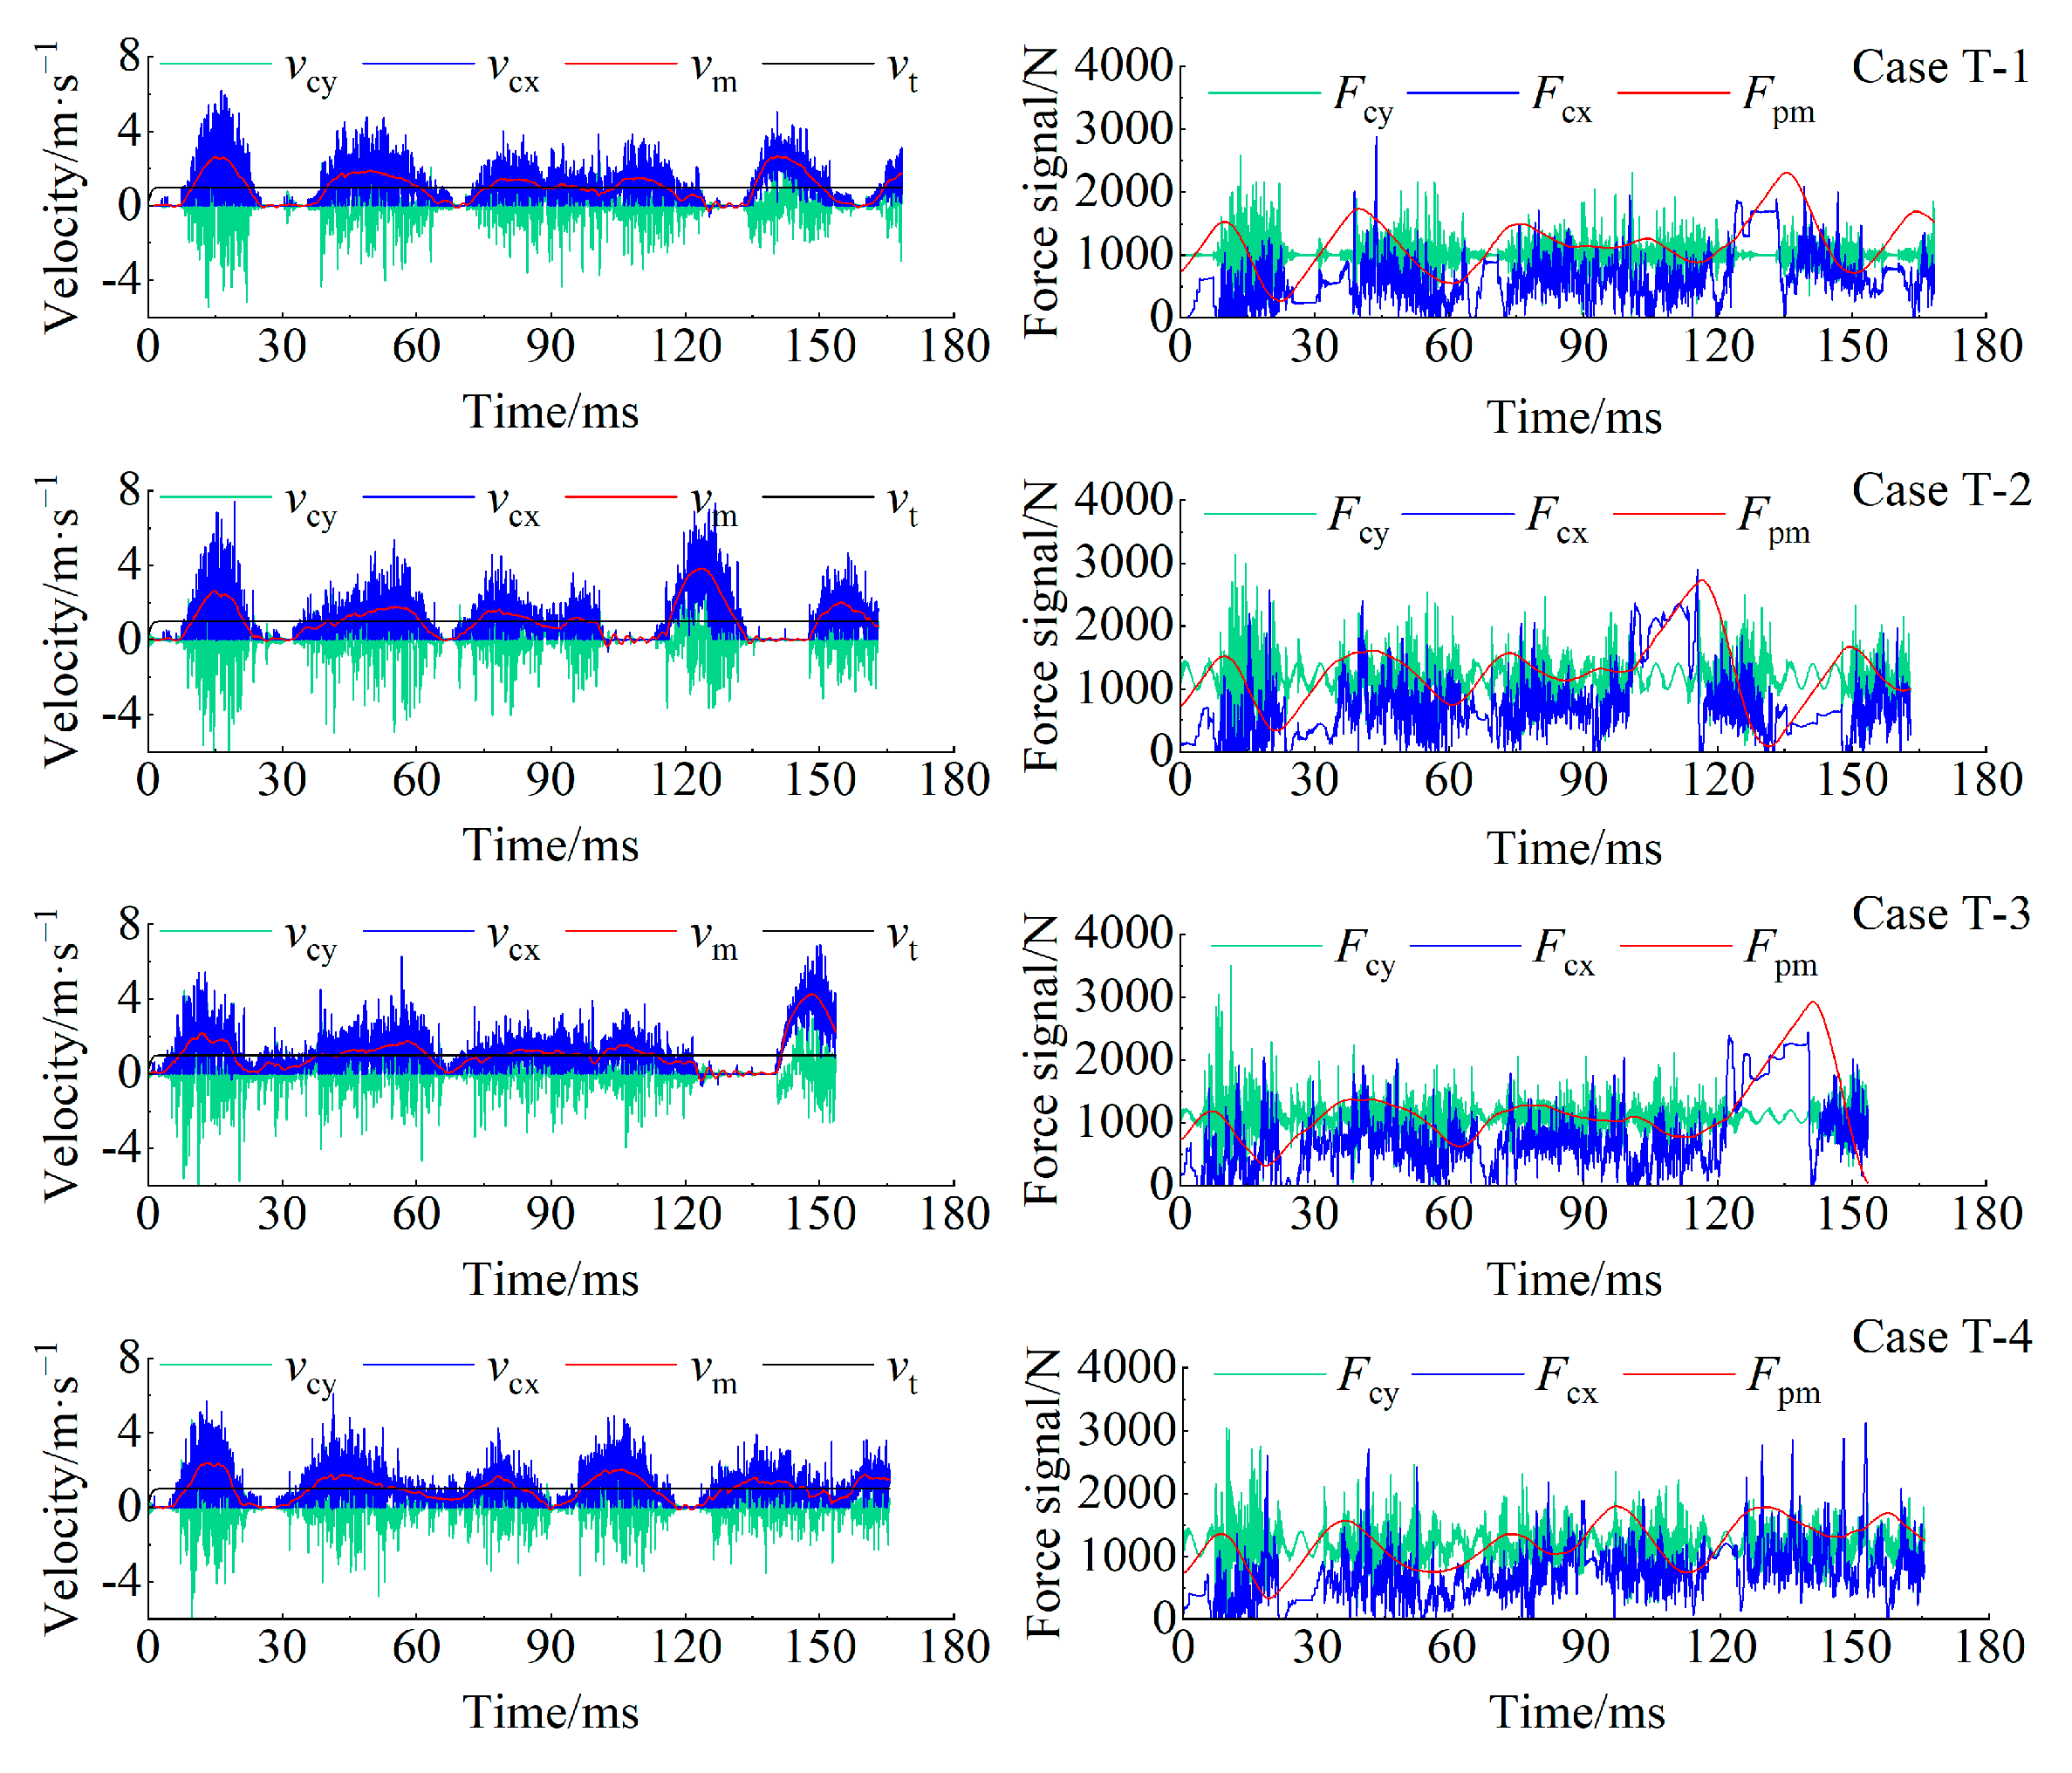
The velocity and force signal simulation results of each component of the cutter loading model are shown in Figure 14. When the cutter breaks the pebbled sandstone, the velocity fluctuation range is significant, and there are data points of vm = 0 and vcx = 0 in each simulation case. That is, the cutter has stick–slip vibration in varying degrees during rock breaking. The stick–slip vibration of drag bits has been widely investigated in theoretical calculations and field tests [47]. The results from the simulated tests in this study are in agreement with Richard et al. [48] (2007) and Germay et al. [49] (2009). In the field, this phenomenon is reflected in the torsional vibration of the drill string caused by top drive’s startup [50]. However, in the range of the simulation parameters, the case of T-4, with the highest amplitude of composite impact load, has the lowest stick–slip degree, and the fluctuation of the driving thrust on the mass unit is relatively minimal.
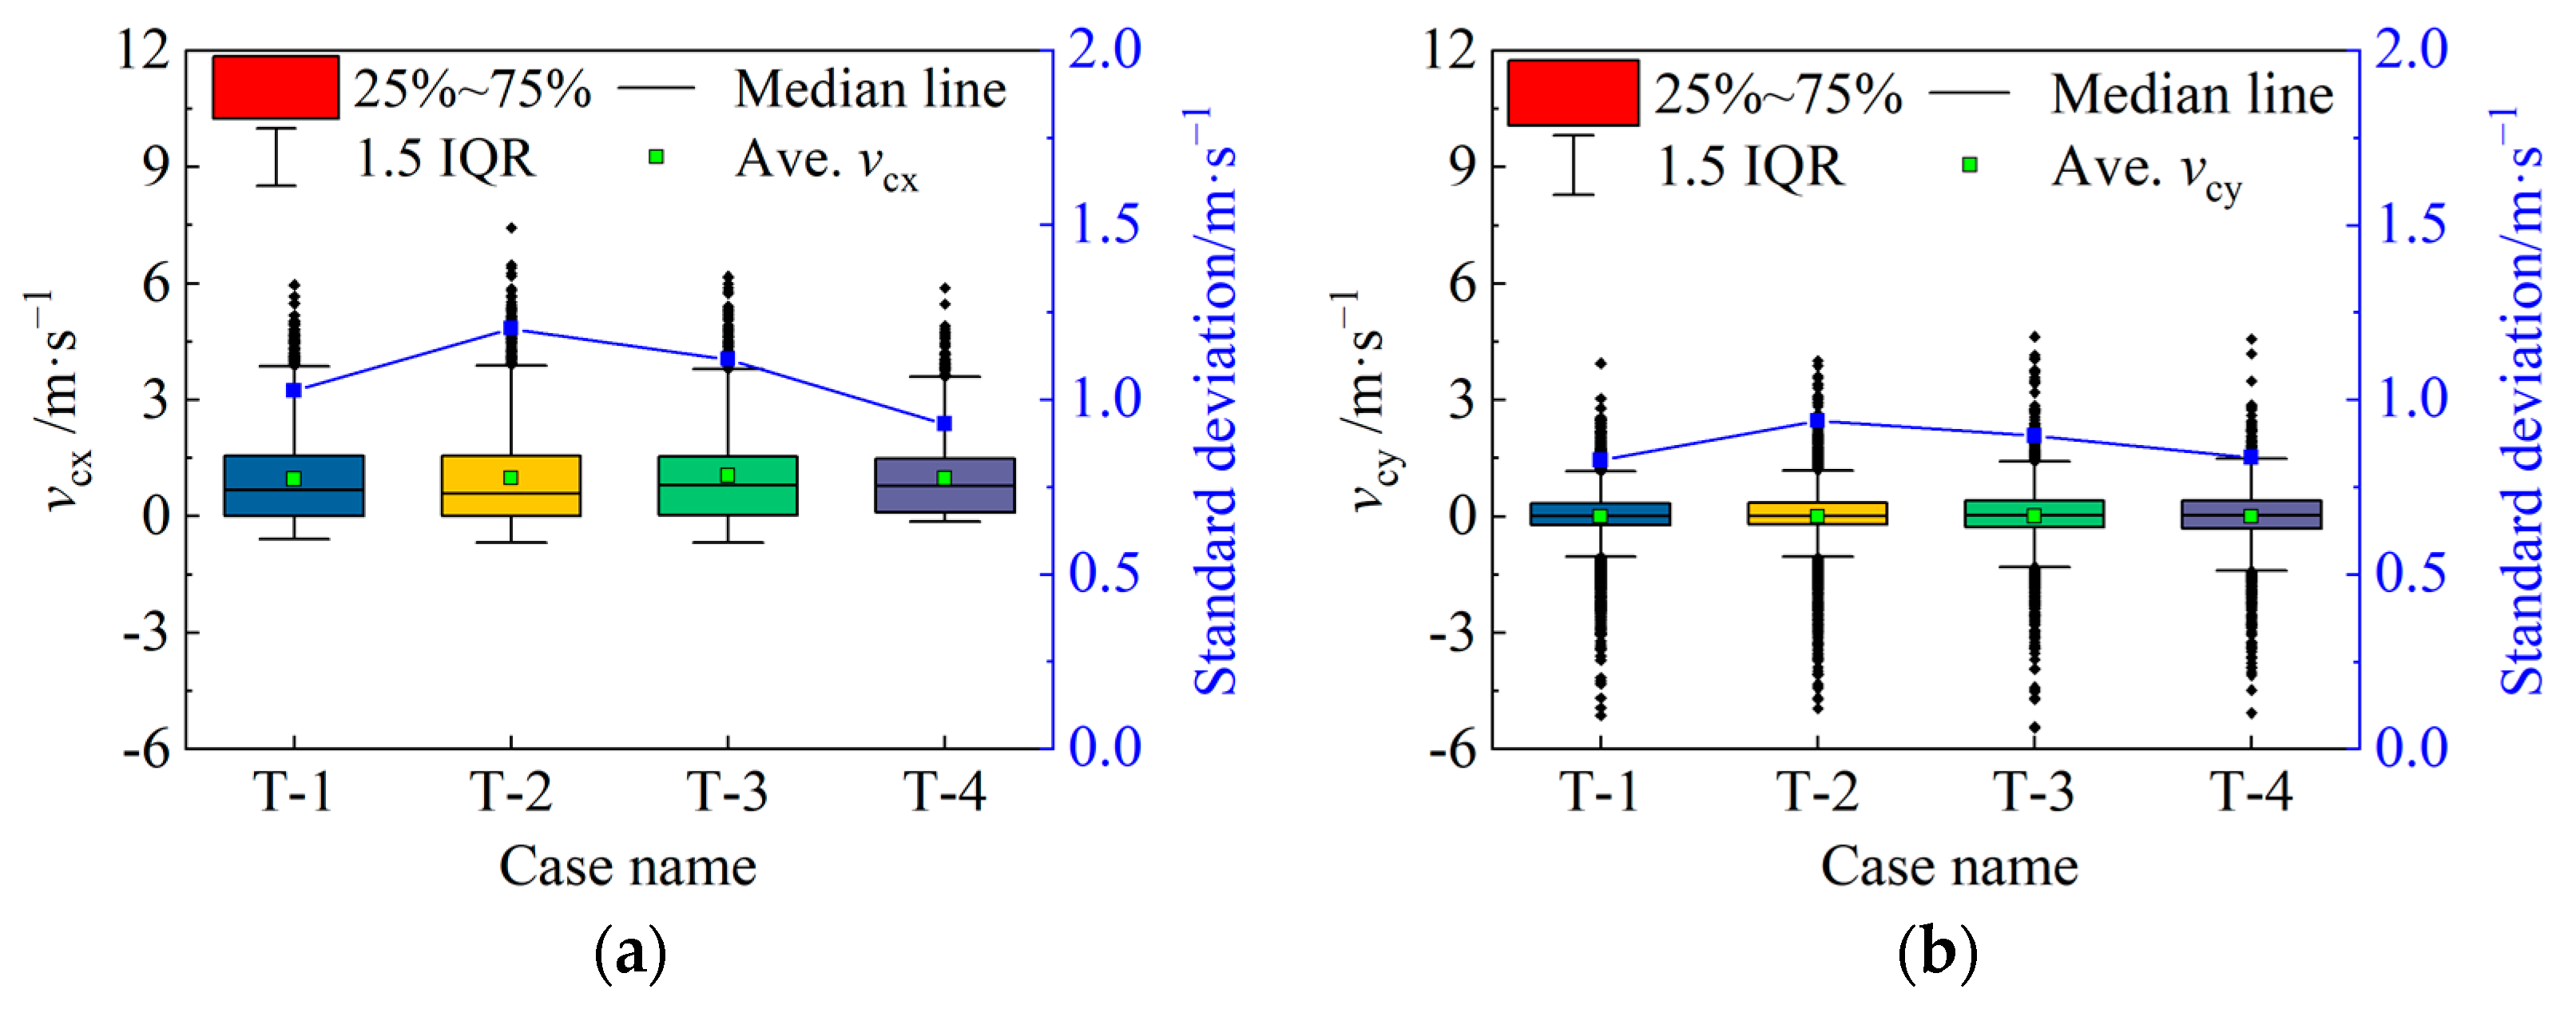
The boxplot and standard deviation analysis of the horizontal and vertical velocities of the PDC cutter are shown in Figure 15. The fluctuation in the cutting velocity and force on the cutter tends to increase at first and then decrease. Increasing the amplitude of the vertical impact load alone may lead to an intensification of the cutting vibration. The analytical results of the case of T-4 show that, within the range of the simulation parameters, increasing the amplitude of impact load in the horizontal and vertical directions to qh = qv = 40% at the same time can effectively alleviate the fluctuation in the cutter velocities. At this point, the peak value of each parameter is relatively small, so it can be presumed that the cutting vibration and stick–slip are effectively suppressed in this case. According to the rock-breaking specific energy and average cutting depth illustrated in Figure 16, compared to increasing the vertical impact amplitude, a reduction in cutting stick–slip and rock-breaking MSE (mechanical specific energy) can be achieved by increasing the horizontal impact amplitude, and the cutting depth is also significantly increased.

5. Field Test of Composite Impactor

5.1. Structure Introduction

The structure diagram of the composite impactor is shown in Figure 17. The main components of this impactor are the upper sub, pulse nozzle, shell, load transmission rod, and lower sub. A periodic fluid pulsation is generated when the drilling fluid flow in the Helmholtz cavity I and II of the impactor [51,52]. The fluid pulsation acts on the upper end-face of the load transmission rod to form the composite impact. The composite impactor is connected to the bit while drilling, which can simultaneously exert axial impact and torsional impact on the bit.
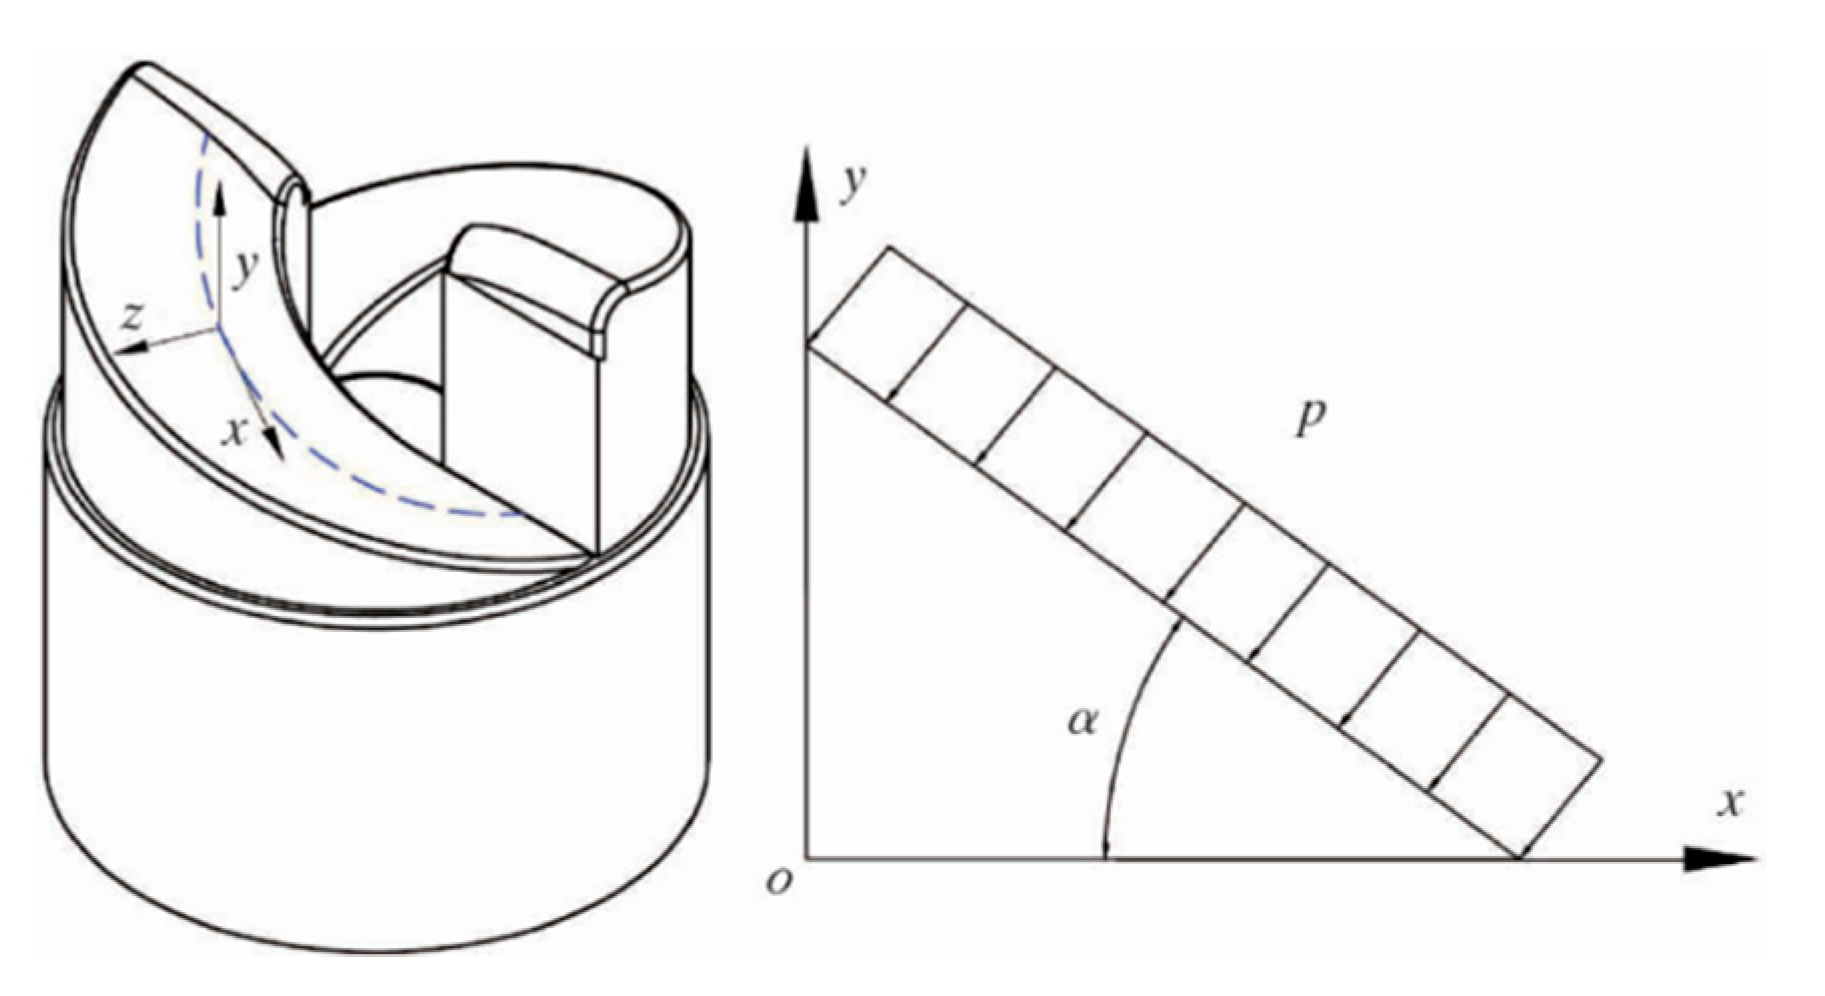
The impact amplitude of the composite impactor can be tuned by selecting Helmholtz cavities and nozzles of different sizes. The distribution ratio of the axial impact component and the torsional impact component can be modified by changing the spiral angle of the upper end-face of the load transmission rod, as shown in Figure 18. At present, there are three types of load transmission rod with helix angles of 10°, 50°, and 70°. According to the conclusions obtained from the simulation study in Section 4, a composite impactor with a large torsional impact component and an impact angle α = 70° was selected for the field test in order to reduce the axial vibration and stick–slip of the bit when drilling encounters the gravel layer, and the detailed performance parameters of the impactor are shown in Table 5.

5.2. Field Drilling Test

A field test was carried out in shallow formations in Well T1 to verify the vibration control effect of the impactor. The Well T1 is a straight well, and the test drilling layer is a shallow pebbled sandstone formation. The formation restricts the enhancement of drilling parameters and has a negative effect on the use of downhole tools. Therefore, this application aims to reduce the severe vibration of the bit, restrain the severe fluctuation of bit weight and torque, and maintain the stability of the bit and the drill string.
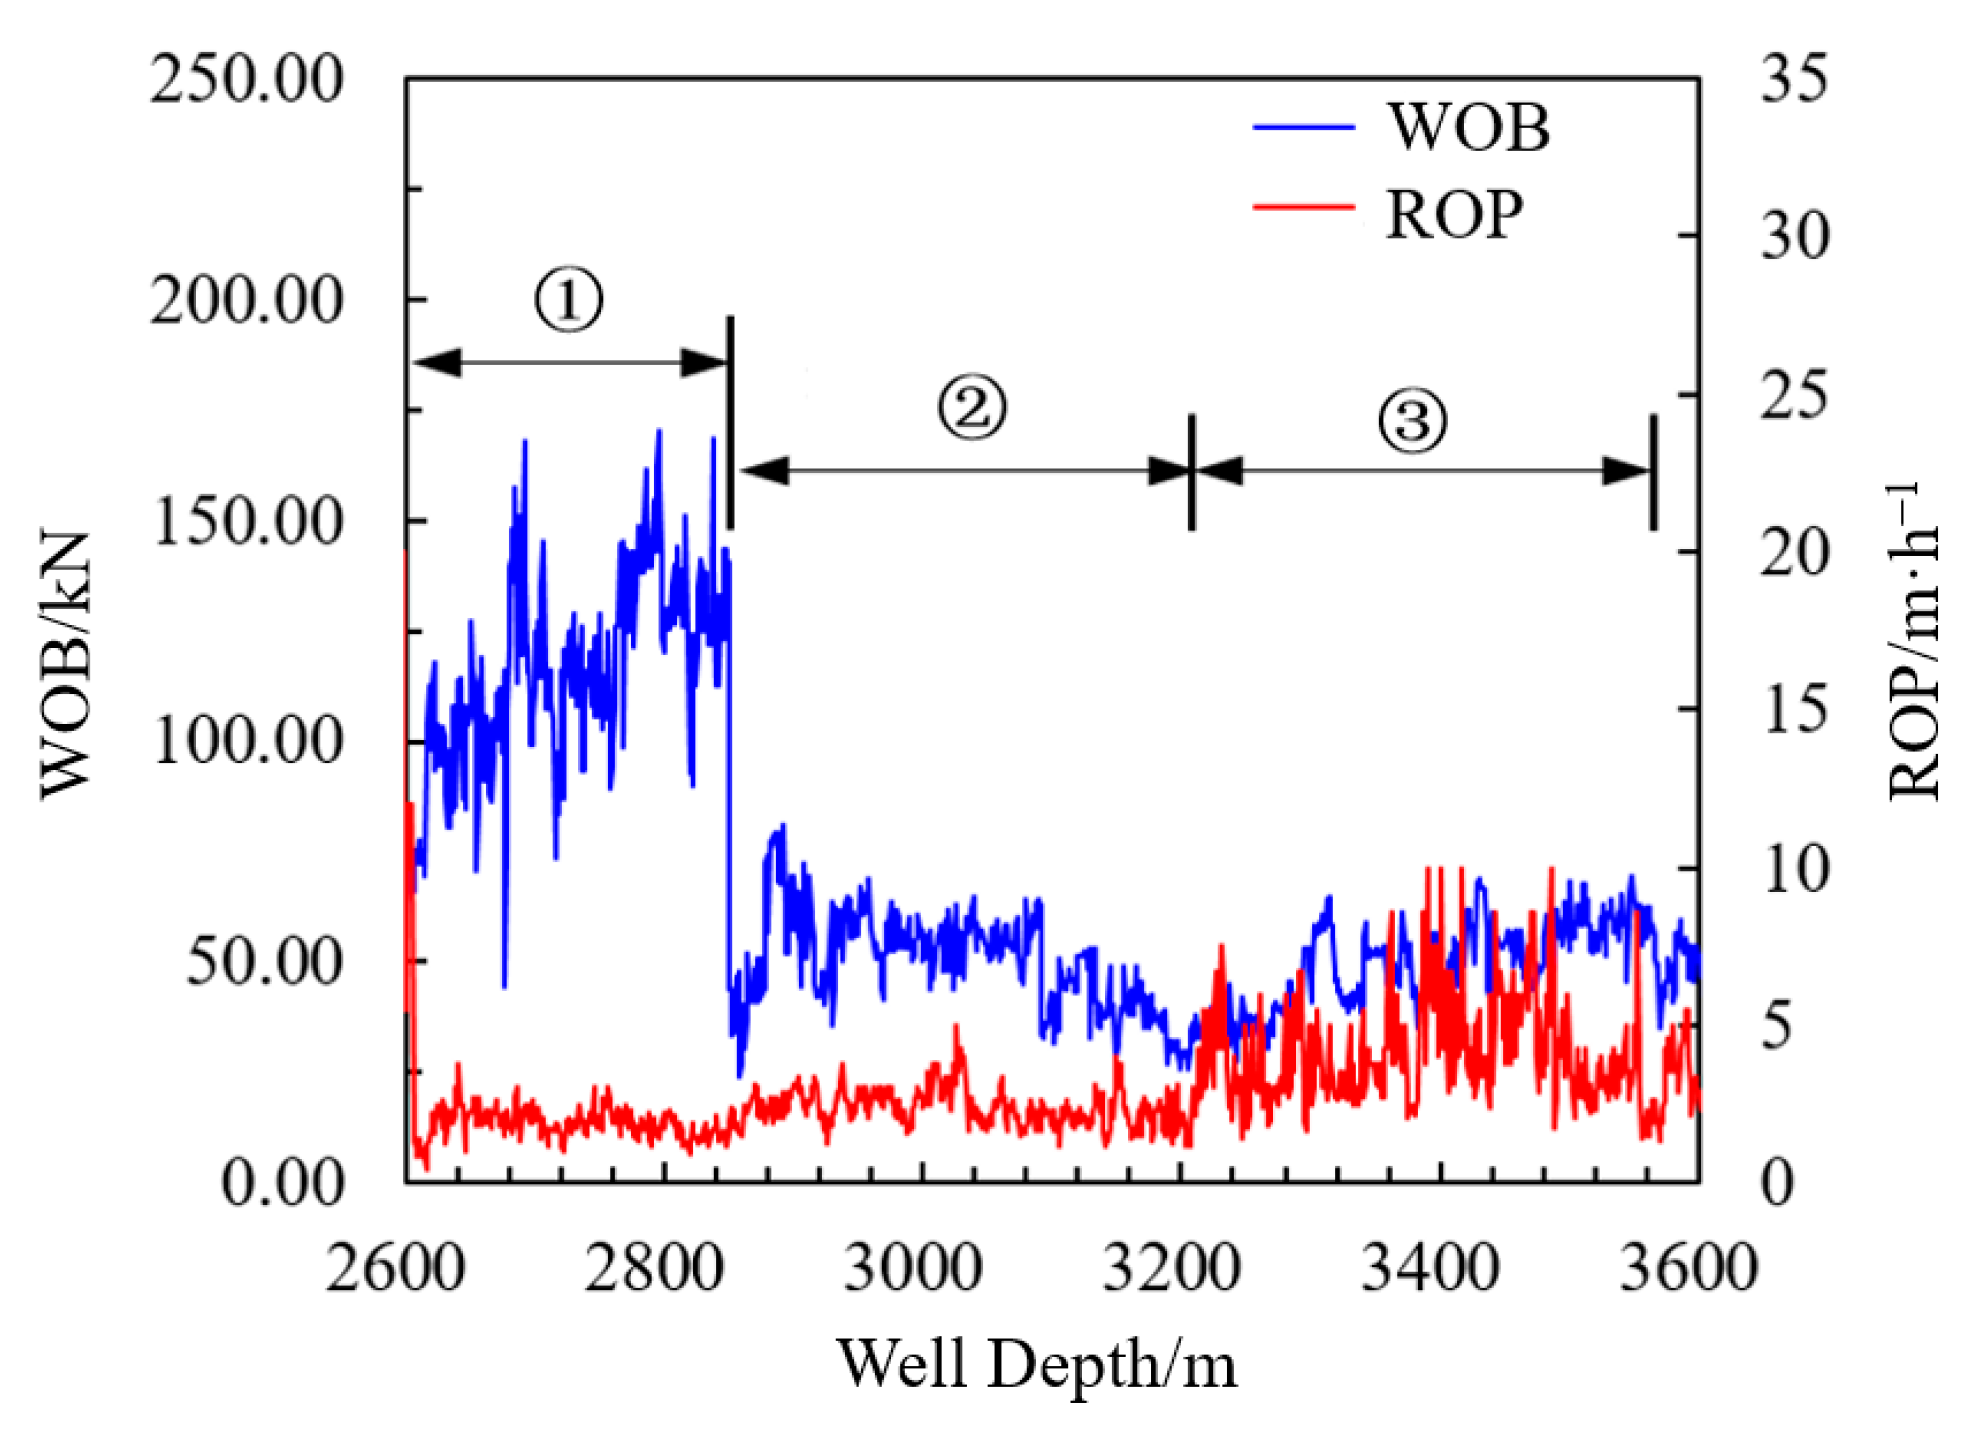
Before the test section, the well section ① was drilled to 2850 m using a conventional double-stabilizer BHA. Due to the severe drill string vibrations caused by the pebbled sandstone, a turbodrill was selected to continue drilling to 3207 m of section ②. The ROP (rate of penetration) remained at a low level while drilling the well section ① and section ②. Therefore, in order to verify the damping capacity of the composite impactor and protect the downhole instruments, the drilling test of the composite impactor was carried out in this well section. The test well section ③ was 3207–3569 m, the total footage of the impactor was 362 m, and the pure drilling time of logging was 103.12 h. The recorded WOB signal and ROP are shown in Figure 19.
The test results are shown in Table 6, and the standard deviation is used to evaluate the fluctuation amplitude of the bit vibration. The data evaluation demonstrates that the volatility of the WOB in the test section of the composite impactor is similar to that of the section drilled with the turbine, both with lower vibration than the section drilled with a conventional drill string assembly. Compared to the conventional drilling section, the average WOB of the well section drilled by composite impactor is reduced by 57.13%, the standard deviation of the WOB is reduced by 57.29%, and the average ROP is increased by 98.31% and 56% compared to the conventional and turbine drilled sections, respectively. These results show that the composite impactor that can simultaneously generate axial and torsional impacts has the ability to suppress drilling vibration and improve ROP.

6. Conclusions

This paper proposes a heterogeneous rock modeling method based on the discrete element theory and presents a rock-breaking model for a single PDC cutter. Using the proposed methods, the mechanisms and characteristics of cutting a heterogeneous gravel-bearing rock under a compound impact load are simulated and studied. Finally, field tests of the composite impactor in a gravel-bearing formation are carried out. The main conclusions for this paper are as follows:
The random regular polygon filling method is a simple and feasible modeling method for heterogeneous rocks, which can simulate and analyze the crack growth, crushing state, and strength characteristics of heterogeneous rocks, such as gravel-bearing and hole-bearing rocks, by changing the distribution law of polygon, the geometric size, and the filling material parameters. The results show that the peak strength of the rock samples decreases slowly at first and then increases with an increase in the gravel content in the rock model. Compared to the peak strength, the increase in gravel content has a greater impact on the elastic modulus of the rock samples.
In the cutting process with a compound impact load, a higher horizontal impact amplitude coefficient (qh = 40%) has a more obvious effect on alleviating the vibration induced by the PDC cutting gravel-bearing rock. The field tests show that the composite impactor can remarkably reduce the vibration level in the gravel-bearing formation. The average WOB is reduced by 57.13%, the standard deviation of the WOB is reduced by 57.29%, and the average ROP is increased by 98.31%, compared to a conventional double-stabilizer BHA.
Improving the rock-breaking efficiency and the working life of PDC bits has always been the goal pursued by drilling engineering researchers. Optimizing the amplitude–frequency characteristics and the component ratio of the combined impact load plays a critical role in improving the ROP and suppressing bit vibration. In the future, the development of higher-performance composite impact tools and bits will be an important research direction to further improve drilling efficiency. For example, tools that automatically adjust the impact parameters will allow rapid adaptive drilling in different formations. Furthermore, with the mutual exchange and integration of multi-disciplines, it will become an important direction to carry out research on transformative rock-breaking methods when mechanical rock-breaking methods gradually reach their limit.

Author Contributions

Conceptualization, H.N.; methodology, validation, investigation, writing—review and editing, H.Z.; resources, software, B.H. and S.L.; data curation, Z.W.; writing—original draft preparation, S.L. and H.Z.; visualization, Y.W. and G.C.; supervision, H.Y.; project administration, H.N.; funding acquisition, H.N. and L.F. All authors have read and agreed to the published version of the manuscript.

Funding

This research was funded by the CNPC Scientific Research and Technology Development Project (Grant No. 2021DJ4202, 2021DJ2003) and the Science and Technology Major Project of the CNPC (No. ZD2019-183-005).

Institutional Review Board Statement

Not applicable.

Informed Consent Statement

Not applicable.

Data Availability Statement

The data used to support the findings of this study are available from the corresponding author upon request.

Acknowledgments

This research received financial support from the CNPC Scientific Research and Technology Development Project (Grant No. 2021DJ4202, 2021DJ2003) and the Science and Technology Major Project of the CNPC (No. ZD2019-183-005).

Conflicts of Interest

The authors declare no conflict of interest.

References

  1. Wang, P.; Ni, H.; Wang, R.; Li, Z. Modulating downhole cuttings via a pulsed jet for efficient drilling-tool development and field testing. J. Nat. Gas Sci. Eng. 2015, 27, 1287–1295. [Google Scholar] [CrossRef]
  2. Detournay, E.; Richard, T.; Shepherd, M. Drilling response of drag bits: Theory and experiment. Int. J. Rock Mech. Min. Sci. 2008, 45, 1347–1360. [Google Scholar] [CrossRef]
  3. Glowka, D.A. Use of single-cutter data in the analysis of PDC bit designs: Part 1-development of a PDC cutting force model. J. Pet. Technol. 1989, 41, 797–849. [Google Scholar] [CrossRef]
  4. Wojtanowicz, A.; Kuru, E. Mathematical modeling of PDC bit drilling process based on a single-cutter mechanics. J. Energy Resour. Technol. 1993, 115, 247–256. [Google Scholar] [CrossRef]
  5. Mishnaevsky, L.L., Jr. Physical mechanisms of hard rock fragmentation under mechanical loading: A review. Int. J. Rock Mech. Min. Sci. Geomech. Abstr. 1995, 32, 763–766. [Google Scholar] [CrossRef]
  6. Black, A.D.; Walker, B.H.; Tibbitts, G.A.; Sandstrom, J.L. PDC Bit Performance for Rotary, Mud Motor, and Turbine Drilling Applications. SPE Drill. Eng. 1986, 1, 409–416. [Google Scholar] [CrossRef]
  7. Slnor, A.; Warren, T. SPE Annual Technical Conference and Exhibition. In Drag Bit Wear Model; Society of Petroleum Engineers: Dallas, TX, USA, 1987. [Google Scholar]
  8. Warren, T.; Sinor, A. Drag-bit performance modeling. SPE Drill. Eng. 1989, 4, 119–127. [Google Scholar] [CrossRef]
  9. Detournay, E.; Defourny, P. International journal of rock mechanics and mining sciences & geomechanics abstracts. In A Phenomenological Model for the Drilling Action of Drag Bits; Elsevier: Amsterdam, The Netherlands, 1992; pp. 13–23. [Google Scholar]
  10. Nandakumar, K.; Wiercigroch, M. Stability analysis of a state dependent delayed, coupled two DOF model of drill-string vibration. J. Sound Vib. 2013, 332, 2575–2592. [Google Scholar] [CrossRef]
  11. Chiaia, B. Fracture mechanisms induced in a brittle material by a hard cutting indenter. Int. J. Solids Struct. 2001, 38, 7747–7768. [Google Scholar] [CrossRef]
  12. Liu, H.Y.; Kou, S.Q.; Lindqvist, P.A.; Tang, C.A. Numerical simulation of the rock fragmentation process induced by indenters. Int. J. Rock Mech. Min. Sci. 2002, 39, 491–505. [Google Scholar] [CrossRef]
  13. Bilgesu, I.; Sunal, O.; Tulu, I.; Heasley, K. The 42nd US Rock Mechanics Symposium (USRMS). In Modeling Rock and Drill Cutter Behavior; American Rock Mechanics Association: San Francisco, CA, USA, 2008. [Google Scholar]
  14. Jalali, S.M.E.; Naghadehi, M.Z. An analytical pre-feasibility study to generate rotary-percussive concept in hard rock TBMs. J. Geol. Min. Res. 2009, 1, 140–148. [Google Scholar]
  15. Tulu, I.; Heasley, K. 43rd US Rock Mechanics Symposium & 4th US-Canada Rock Mechanics Symposium. In Calibration of 3D Cutter-Rock Model with Single Cutter Tests; American Rock Mechanics Association: Asheville, NC, USA, 2009. [Google Scholar]
  16. Mendoza, J.; Gamwo, I.; Zhang, W.; Lin, J. 44th US Rock Mechanics Symposium and 5th US-Canada Rock Mechanics Symposium. In Discrete Element Modeling of Rock Cutting Using Crushable Particles; American Rock Mechanics Association: Salt Lake City, UT, USA, 2010. [Google Scholar]
  17. Jaime, M.C. Numerical Modeling of Rock Cutting and Its Associated Fragmentation Process Using the Finite Element Method. Ph.D. Thesis, University of Pittsburgh, Pittsburgh, PA, USA, 2011. [Google Scholar]
  18. Jaime, M.C.; Zhou, Y.; Lin, J.-S.; Gamwo, I.K. Finite element modeling of rock cutting and its fragmentation process. Int. J. Rock Mech. Min. Sci. 2015, 80, 137–146. [Google Scholar] [CrossRef] [Green Version]
  19. Menezes, P.L. Influence of rock mechanical properties and rake angle on the formation of rock fragments during cutting operation. Int. J. Adv. Manuf. Technol. 2017, 90, 127–139. [Google Scholar] [CrossRef]
  20. Cao, L.; Sun, J.; Zhang, B.; Lu, N.; Xu, Y. Sensitivity analysis of the temperature profile changing law in the production string of a high-pressure high-temperature gas well considering the coupling relation among the gas flow friction, gas properties, temperature, and pressure. Front. Phys. 2022, 10, 1112. [Google Scholar] [CrossRef]
  21. Zhong, R.; Miska, S.; Yu, M.; Meng, M.; Ozbayoglu, E.; Takach, N. Experimental investigation of fracture-based wellbore strengthening using a large-scale true triaxial cell. J. Pet. Sci. Eng. 2019, 178, 691–699. [Google Scholar] [CrossRef]
  22. Galkin, V.I.; Martyushev, D.A.; Ponomareva, I.N.; Chernykh, I.A. Developing features of the near-bottomhole zones in productive formations at fields with high gas saturation of formation oil. J. Min. Inst. 2021, 249, 386–392. [Google Scholar] [CrossRef]
  23. Saksala, T. Numerical study of the influence of hydrostatic and confining pressure on percussive drilling of hard rock. Comput. Geotech. 2016, 76, 120–128. [Google Scholar] [CrossRef]
  24. Guarin, P.L.; Arnold, H.E.; Harpst, W.E.; Davis, E.E. Rotary Percussion Drilling. In Drilling and Production Practice; American Petroleum Institute: New York, NY, USA, 1949; p. 11. [Google Scholar]
  25. Melamed, Y.; Kiselev, A.; Gelfgat, M.; Dreesen, D.; Blacic, J. Hydraulic hammer drilling technology: Developments and capabilities. J. Energy Resour. Technol. 1999, 122, 1–7. [Google Scholar] [CrossRef]
  26. Liu, S.; Ni, H.; Zhang, H.; Wang, Y.; Xie, H. Numerical study on optimal impact angle of a single PDC cutter in impact rock cutting. Energy Rep. 2021, 7, 4172–4183. [Google Scholar] [CrossRef]
  27. Akbari, B.; Butt, S.; Munaswamy, K.; Arvani, F. 45th US Rock Mechanics/Geomechanics Symposium. In Dynamic Single PDC Cutter Rock Drilling Modeling and Simulations Focusing on Rate of Penetration Using Distinct Element Method; American Rock Mechanics Association: San Francisco, CA, USA, 2011. [Google Scholar]
  28. Xiong, C.; Huang, Z.; Shi, H.; Shi, X.; Zhang, B.; Chalaturnyk, R. Experimental Investigation into Mixed Tool Cutting of Granite with Stinger PDC Cutters and Conventional PDC Cutters. Rock Mech. Rock Eng. 2021, 55, 813–835. [Google Scholar] [CrossRef]
  29. Dong, G.; Chen, P. 3D Numerical Simulation and Experiment Validation of Dynamic Damage Characteristics of Anisotropic Shale for Percussive-Rotary Drilling with a Full-Scale PDC Bit. Energies 2018, 11, 1326. [Google Scholar] [CrossRef] [Green Version]
  30. Xi, Y.; Wang, W.; Fan, L.; Zha, C.; Li, J.; Liu, G. Experimental and numerical investigations on rock-breaking mechanism of rotary percussion drilling with a single PDC cutter. J. Pet. Sci. Eng. 2021, 208, 109227. [Google Scholar] [CrossRef]
  31. Tian, K.; Detournay, E. Influence of PDC bit cutter layout on stick–slip vibrations of deep drilling systems. J. Pet. Sci. Eng. 2021, 206, 109005. [Google Scholar] [CrossRef]
  32. Song, H.; Shi, H.; Ji, Z.; Wu, X.; Li, G.; Zhao, H.; Wang, G.; Liu, Y.; Hou, X. The percussive process and energy transfer efficiency of percussive drilling with consideration of rock damage. Int. J. Rock Mech. Min. Sci. 2019, 119, 1–12. [Google Scholar] [CrossRef]
  33. Liu, S.; Ni, H.; Jin, Y.; Zhang, H.; Wang, Y.; Huang, B.; Hou, W. Experimental study on drilling efficiency with compound axial and torsional impact load. J. Pet. Sci. Eng. 2022, 219, 111060. [Google Scholar] [CrossRef]
  34. Wang, W.; Liu, G.; Li, J.; Zha, C.; Lian, W. Numerical simulation study on rock-breaking process and mechanism of compound impact drilling. Energy Rep. 2021, 7, 3137–3148. [Google Scholar] [CrossRef]
  35. He, X.; Xu, C. Discrete element modelling of rock cutting: From ductile to brittle transition. Int. J. Numer. Anal. Methods Geomech. 2015, 39, 1331–1351. [Google Scholar] [CrossRef]
  36. He, Q.; Zhu, L.; Li, Y.; Li, D.; Zhang, B. Simulating hydraulic fracture re-orientation in heterogeneous rocks with an improved discrete element method. Rock Mech. Rock Eng. 2021, 54, 2859–2879. [Google Scholar] [CrossRef]
  37. Cundall, P.A.; Strack, O.D.L. A discrete numerical model for granular assemblies. Geotechnique 1979, 29, 47–65. [Google Scholar] [CrossRef]
  38. Potyondy, D.O.; Cundall, P.A. A bonded-particle model for rock. Int. J. Rock Mech. Min. Sci. 2004, 41, 1329–1364. [Google Scholar] [CrossRef]
  39. Potyondy, D.O. The bonded-particle model as a tool for rock mechanics research and application: Current trends and future directions. Geosyst. Eng. 2015, 18, 1–28. [Google Scholar] [CrossRef]
  40. Itasca Consulting Group. PFC (Particle Flowcodein 2 and 3 Dimensions), Version 5.0 [User’s Manual]; ICG. Inc.: Minneapolis, MN, USA, 2016. [Google Scholar]
  41. Richard, T.; Dagrain, F.; Poyol, E.; Detournay, E. Rock strength determination from scratch tests. Eng. Geol. 2012, 147–148, 91–100. [Google Scholar] [CrossRef]
  42. Wei, J.; Liao, H.; Wang, H.; Chen, J.; Li, N.; Liang, H.; Liu, C.; Zhang, D.; Teng, Z. Experimental investigation on the dynamic tensile characteristics of conglomerate based on 3D SHPB system. J. Pet. Sci. Eng. 2022, 213, 110350. [Google Scholar] [CrossRef]
  43. Saha, A.; Wiercigroch, M.; Jankowski, K.; Wahi, P.; Stefański, A. Investigation of two different friction models from the perspective of friction-induced vibrations. Tribol. Int. 2015, 90, 185–197. [Google Scholar] [CrossRef]
  44. Saha, A.; Wahi, P.; Wiercigroch, M.; Stefański, A. A modified LuGre friction model for an accurate prediction of friction force in the pure sliding regime. Int. J. Non-Linear Mech. 2016, 80, 122–131. [Google Scholar] [CrossRef]
  45. Zhang, H.; Ni, H.; Wang, Z.; Huang, B.; Liu, S.; Xu, X.; Liu, C. Discrete element modeling and simulation study on cutting rock behavior under spring-mass-damper system loading. J. Pet. Sci. Eng. 2022, 209, 109872. [Google Scholar] [CrossRef]
  46. He, Q.; Li, Y.; Li, D.; Zhang, C. Microcrack fracturing of coal specimens under quasi-static combined compression-shear loading. J. Rock Mech. Geotech. Eng. 2020, 12, 1014–1026. [Google Scholar] [CrossRef]
  47. Kyllingstad, A.; Halsey, G.W. SPE Annual Technical Conference and Exhibition, Dallas. In A Study of Slip/stick Motion of the Bit, SPE 16659; Society of Petroleum Engineers: Dallas, TX, USA, 1987. [Google Scholar]
  48. Richard, T.; Germay, C.; Detournay, E. A simplified model to explore the root cause of stick-slip vibrations in drilling systems with drag bits. J. Sound Vib. 2007, 305, 432–456. [Google Scholar] [CrossRef]
  49. Germay, C.; Denoël, V.; Detournay, E. Multiple Mode Analysis of the Self-Excited Vibrations of Rotary Drilling Systems. J. Sound Vib. 2009, 325, 362–381. [Google Scholar] [CrossRef] [Green Version]
  50. Brett, J.F. The genesis of torsional drillstring vibrations. SPE Drill. Eng. 1992, 7, 168–174. [Google Scholar] [CrossRef]
  51. Liu, S.; Ni, H.; Wang, X.; Wang, Y.; Wang, P. IADC/SPE Asia Pacific Drilling Technology Conference and Exhibition. In Rock-Breaking Mechanism Study of Axial and Torsional Impact Hammer and Its Application in Deep Wells; Society of Petroleum Engineers: Bangkok, Thailand, 2018. [Google Scholar]
  52. Zhang, H.; Ni, H.; Liu, S.; Huang, B.; Liang, H. An Axial and Torsional Percussion Hammer with Considerable Potential to Increase the Drilling Speed of High-Temperature Geothermal Wells. In IOP Conference Series: Earth and Environmental Science; IOP Publishing: Wuhan, China, 2020; p. 012131. [Google Scholar]
Figure 1. The assembly modeling of rock pore, fracture, and rubble using the DEM.
Processes 11 00671 g001
Figure 2. Diagram for the contact detected in a 2D particle flow model.
Processes 11 00671 g002
Figure 3. Kinematics of contact with relative rotation and motion of piece surfaces.
Processes 11 00671 g003
Figure 4. Sketch of the bound contact model.
Processes 11 00671 g004
Figure 5. Contact rheological components (a) of the linear parallel-bond model (b) and the linear contact model (c).
Processes 11 00671 g005
Figure 7. Pebbly sandstone samples with different gravel contents.
Processes 11 00671 g007
Figure 8. Simulated UCS tests results of DEM pebbled sandstone samples, (a) strain–stress plot and (b) trend analysis of rock Elastic Modulus and peak strength.
Processes 11 00671 g008
Figure 9. Failure results of the DEM rock samples after the simulated UCS tests.
Processes 11 00671 g009
Figure 10. Schematic of the load state of the PDC bit and the cutter during drilling.
Processes 11 00671 g010
Figure 11. The PDC cutter and rock sample geometry.
Processes 11 00671 g011
Figure 12. Schematic of the load state of the PDC cutter under vertical and horizontal impact loading.
Processes 11 00671 g012
Figure 13. Broken state of the rock samples under different impact loading.
Processes 11 00671 g013
Figure 14. Simulation results of velocity and force signals.
Processes 11 00671 g014
Figure 15. Analytical results of (a) cutter horizontal velocity signals and (b) cutter vertical velocity signals.
Processes 11 00671 g015
Figure 16. Statistical results of MSE and average cutting depth.
Processes 11 00671 g016
Figure 17. Schematic of the composite impactor. 1—upper sub; 2—nozzle; 3—shell; 4—load transmission rod; 5—lower sub; I, and II—Helmholtz cavity.
Processes 11 00671 g017
Figure 18. Schematic diagram of impact spiral surface.
Processes 11 00671 g018
Figure 19. Comparison of WOB and ROP in the applied well interval.
Processes 11 00671 g019
Table 1. Comparison of mechanical parameters between the rock samples and the DEM rock model.
Rock SamplesCompressive Strength/MPaElastic Modulus/GPaPoisson’s Ratio
Sandstone33.108.250.33
Sandstone model32.978.240.32
Gravel203.4570.470.177
Gravel model206.9570.410.177
Table 2. Material parameters of the DEM pebbled sandstone models.
Rock CompositionRock MatrixGravel
Particle density/(kg/cm3)20002650
Effective modulus/GPa4.3333.82
Normal-to-shear stiffness ratio1.501.58
Bonding effective modulus/GPa4.3333.82
Bond normal-to-shear stiffness ratio1.501.58
Tensile strength/MPa9.9867.20
Cohesion/MPa11.9678.33
Friction angle/°3225
Friction coefficient0.650.65
Table 3. Parameter values used for spring-mass-damping system.
ParametersValueParametersValue
vt (m·s−1)1khb (N·m−1)1 × 10⁹
xmax (m)0.16chp (N·m·s−1)5 × 10⁴
xkp (m)10α0.005
xkb (m)10β0.01
Fwob (N)200γ0.001
Table 4. Parameters of the simulated test set.
Caseqh/%qv/%
T-100
T-22040
T-34020
T-44040
Table 5. Key parameters of the composite impactor.
ParametersValue
Diameter/mm245
Spiral angle α/°70
Number of spiral faces5
Pressure/MPa2
Axial load/kN24
Torsional load/N·m3479
Table 6. Comparison of field test results of different drilling methods.
Drilling MethodConventionalTurbine DrillComposite Impactor
Test section/m2612–28502850–32073207–3569
WOB/kN115.2749.9549.42
Standard deviation of WOB/kN22.9711.219.81
ROP/(m/h)1.772.253.51
ROP enhancement rate/%/27.1298.31
Disclaimer/Publisher’s Note: The statements, opinions and data contained in all publications are solely those of the individual author(s) and contributor(s) and not of MDPI and/or the editor(s). MDPI and/or the editor(s) disclaim responsibility for any injury to people or property resulting from any ideas, methods, instructions or products referred to in the content.