Abstract
The cement industry is an important industrial entity responsible for implementing carbon emission reduction targets. Considering the carbon trading and green certificate trading mechanisms, this paper presents a multi-stage planning approach for the constructed Cement-Industrial Integrated Energy System (Cement-IIES). Carbon reduction technologies represented by low-temperature waste heat recovery, as well as phased changes in economic and technical parameters, are considered in the model. The case study shows that the proposed method not only optimizes the design economy of the Cement-IIES but also achieves a substantial carbon emission reduction in the cement production process and energy supply system. Compared with the traditional single-stage planning, the proposed method improves the system’s economic efficiency by 13.88% and flexibly adapts to changes in policies such as “coal reform”, green certificate trading and carbon quotas. The low-temperature waste heat recovery technology helps the system energy utilization efficiency in the two stages increase by 0.45% and 0.86%, respectively, whilst oxygen-enriched combustion and carbon capture technologies can reduce the total carbon emissions by about 83%. In addition, the negative carbon emission effect of biomass gives the system access to annual benefits of CNY 3.10 × 10⁷ and CNY 7.89 × 10⁷ in the two stages, respectively.
1. Introduction
1.1. Motivation
Electricity and heat, industry and transport sectors are important entities responsible for global carbon emissions. According to the International Energy Agency (IEA), the carbon emissions of the global industry sector in 2022 reach 9.15 Gton, accounting for 24.86% of the total [1]. To this end, China [2], the United States [3], the United Kingdom [4], Germany [5] and other countries have formulated industrial low-carbon action plans, including energy efficiency improvement plans, decarbonization roadmaps and environmental protection laws.
Meanwhile, low-carbon energy technologies that can improve the sustainability, autonomy and security of energy systems have been extensively studied, thus providing a theoretical and technical basis for the action plans. Ref. [6] systematically sorted out the research directions and achievements supporting the sustainable development of energy systems from the two dimensions of technological and social. Specifically, new forms of energy utilization (typically hydrogen energy) [7], carbon abatement technology [8], distributed energy autonomous methods [9] and top-to-bottom energy policies [10] are all hot topics. In addition, refs. [11,12,13] and other studies tried to explore the market regulation potential in guiding renewable energy utilization and low-carbon energy consumption behavior.
It should be noted that carbon emissions in industry sectors come from energy use and industrial processes. Therefore, it is necessary to explore specialized and customized carbon reduction paths in combination with the production processes and energy demand of various industrial sectors.
1.2. Literature Review
The current research on the Industrial Integrated Energy System (IIES) focuses on exploring energy efficiency improvement means and low-carbon economic operation mode from the perspectives of technical and economic analysis, planning, simulation and operation optimization [14,15].
In terms of technical and economic analysis, scholars have attempted to evaluate the performance of IIES under new forms of energy utilization and energy system structures. To satisfy the economy and emission reduction needs of typical iron and steel parks, ref. [16] analyzed the benefits of building a “green power-hydrogen-industry” coupled energy system under different hydrogen energy substitution speed scenarios. Ref. [17] considered the interaction between the multi-energy system and the production process of process industry users and summarized the means of flexible control of the system from two aspects: direct regulation of cogeneration units and electrical equipment, and indirect regulation of non-electrical equipment. Authors of [18] proposed a national-level tool capable of modeling complex energy systems in the power, heat, transport and industry sectors, which could calculate the hourly carbon emission information of each sector. Based on the input of energy material information, the possibility of Kazakhstan in terms of transitioning to a 100% renewable energy system by 2050 was validated.
The planning and simulation research on IIES formulates planning and design schemes for industrial parks or enterprises and uses methods including simulation tools to evaluate the optimality of the schemes. Ref. [19] considered the environmental externality costs of coal, wind and solar power in the capacity allocation and operation optimization of the IES in industrial parks. The impact of environmental externality costs on the planning results was validated through a case study. In the hybrid energy system proposed in [20], hydrogen produced from nuclear/renewable energy is combined with coal to produce fuel gas and chemical raw materials. For coal-intensive countries such as China and the United States, compared with coal gasification to produce syngas, the proposed hybrid energy system can significantly reduce carbon emissions. Ref. [21] combined two energy analysis tools, discrete event simulation (DES) and energy system optimization (ESO), to provide the best operation mode for an iron foundry. To help an IES project in Zhejiang, China, realize the optimization of system planning and design, an evaluation method based on modified fuzzy integrals and prospect theory was proposed in [22].
To better coordinate the management of energy equipment in the IIES, many scholars have carried out operation optimization research to tap the system potential of flexible adjustment [23]. Authors of [24] incorporated electricity, heating and cooling demands into generalized demand-side resources, and established a demand response strategy and optimization model for the IIES. Power companies, CCHP and industrial users could interact through demand-side resources, and their economic costs of energy consumption were all significantly reduced. Ref. [25] built a demand response model for IIES considering the ladder carbon trading mechanism, which utilized the carbon reduction and demand response potential of industrial users in smart parks. To realize the flexible and economic dispatch of the industrial park-type regional IES, ref. [26] proposed an energy management strategy for energy cascade utilization, in which the partial load ratio is considered in the segmental linear model of the gas turbine, and the thermal energy is divided into high-, middle- and low-grade. The reinforcement learning method was applied to the multi-energy flow scheduling of the IIES in [27], and the collaborative management of multiple energy storage, renewable energy generation, energy conversion and energy trading was realized.
It can be seen that the existing research has made great attempts to tap the energy-saving and emission-reduction potential of IIES with high energy demand and tightly coupled multi-energy utilization. However, the actual production process of the industry to which a certain IIES belongs is seldom considered, and what differentiates IIES from residential and commercial IES is the interaction between multi-energy systems and production processes in IIES. Therefore, it is necessary to carry out targeted research in combination with specific industrial processes. In this paper, the cement industry with high energy consumption and high carbon emissions is selected as the research object.
As the third largest source of greenhouse gas emissions after power and the steel industry, the cement industry should undertake the task of reducing carbon emissions from now on. Specifically, 561 to 622 kg of carbon dioxide is emitted per ton of cement produced [28]. In 2022, the world’s total cement production reaches 4.1 billion tons, and China’s cement production accounts for 51.66% of the total, ranking first in the world [29]. At present, coal is still the main energy consumption of cement production in China. Coal combustion and limestone calcination produce 95% of the total carbon emissions [30].
Nowadays, the mainstream recognized carbon emission reduction methods for the cement industry include [31,32,33]: replacing cement with other additives (reducing cement demand in construction, water conservancy and other scenarios); improving the thermal efficiency of cement production; oxygen-enriched combustion; replacing fossil fuels; electrification of cement kilns; carbon capture and storage (CCS) technology. In [34], a cement kiln waste heat utilization poly generation system with integrated carbon capture was proposed, and the expensive carbon capture technology was subsidized with the system’s electricity, heat and cold energy sales revenue. Ref. [35] carried out a coupling study on oxygen-enriched combustion technology and XDL energy-saving calcination technology, and the experiment confirmed that oxygen-enriched combustion technology can promote coal saving and flue gas emission reduction in cement clinker production.
The emergence of the carbon market and green certificate transactions have enriched the connotation of energy and production raw material consumption in the cement industry. By the end of 2021, a total of 33 carbon emission trading markets have been put into operation in the world, including countries or regions such as the European Union, North America, South Korea and China. Regarding carbon emission trading and carbon price formulation, each carbon market determines the carbon market participation mechanism, taxation scope and pricing method based on the needs of the country [36,37]. To solve the problem of renewable energy consumption, countries including the United States, Australia and the United Kingdom have successively launched quota-based green certificate trading systems to convert clean-energy subsidies from government behavior to market behavior [38]. In addition, some scholars have gradually paid attention to the research on the electricity-carbon-green certificate joint market [39]. In the context of carbon and green certificate trading, the cement industry is bound to pursue efficient and clean energy system structures, as well as planning and operation methods.
1.3. Contribution
In the above context, this paper analyzes the production process of the cement industry, constructs the basic structure of Cement-IIES and proposes a multi-stage planning method. The specific contributions are as follows.
- (1)
- Combined with the flow of multi-energy and raw materials of the actual cement production line, a Cement-IIES model that comprehensively considers multiple carbon reduction technologies is built. Carbon reduction technologies include low-temperature waste heat recovery, oxygen-enriched combustion, carbon capture, hydrogen/oxygen production, energy storage and fuel/technology substitution.
- (2)
- Considering carbon and green certificate trading, a multi-stage flexible planning method for Cement-IIES is proposed. The phased changes in technical and economic parameters are taken into account, such as energy equipment cost and efficiency and external energy/carbon/green certificate prices.
- (3)
- The effectiveness of the proposed method is verified based on a cement industrial park on the southeast coast of China. Comparative analysis reveals the adaptability of the multi-stage planning method to policies such as “coal reform”, green certificate trading and carbon quotas, as well as the comprehensive benefits of various carbon reduction technologies.
1.4. Organization
The rest of the paper is organized as follows. Section 2 builds the mathematical model of equipment and technology in Cement-IIES; Section 3 proposes a multi-stage planning method, including specific expressions of objective functions and constraints. Section 4 is a case study, and the discussion is given in Section 5. Section 6 presents the conclusion.
2. Cement-IIES Modeling
The power requirement of a cement factory varies depending on the heat treatment process in use, which can be divided into dry production and wet production according to the method to prepare the raw material [40]. This paper focuses on using the dry process with rapid heat transfer and high heating efficiency for cement production. Taking into account the energy demand and carbon emission during the cement production process, a Cement Industry Integrated Energy System (Cement-IIES) is proposed and its structure is shown in Figure 1.
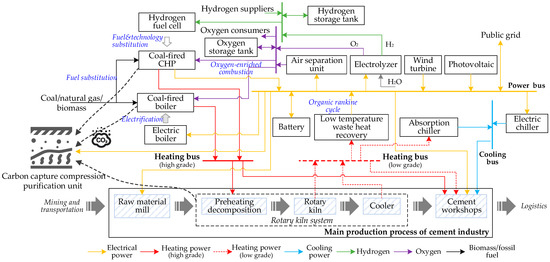
Figure 1.
Structure of Cement Industry Integrated Energy System (Cement-IIES).
As shown in Figure 1, the cement production line mainly composes of raw material collection and transportation, raw material preparation and homogenization, clinker calcination, clinker cooling and cement grinding and packaging [28]. The carbon dioxide emitted during the cement production process mainly comes from the limestone calcination process. More specifically, the limestone calcination for producing quicklime contributes to 55–70% of the total carbon emission. It is worth noting that the high-temperature calcination process needs to burn fuel, which can emit 25–40% of carbon dioxide. The calcined clinker needs to be rapidly cooled by a cooler before entering the cement workshop to complete the grinding and packaging processes. Eventually, the product is transported to storage facilities or downstream entities.
In this paper, the load demand mainly comes from the raw material mill, rotary kiln system and cement workshops. The rotary kiln system composes of three sessions including preheating decomposition, rotary kiln and cooler. The internal structure and material energy flow will be described in Section 2.8. The load of the cement unit is mainly attributed to the circulating water pump room, the conveying machinery of the joint storage and the dust collector of the packaging machine in the packaging unit. In addition, a Cement-IIES also needs to provide the energy for lighting, heating/hot water and cooling of each working unit, living area and office area.
In the proposed Cement-IIES, the energy production equipment includes Combined Heating and Power (CHP) plant, Fired Boiler (FB) and renewable generation units such as Wind Turbine (WT) and Photovoltaic (PV). For the energy conversion equipment, the Electrolyzer (ELZ), Hydrogen Fuel Cell (HFC), Electric Boiler (EB), Electric Chiller (EC), Absorption Chiller (AC) and Air Separation Unit (ASU) are used. To provide energy storage capability, equipment including Battery (BT), Hydrogen Storage Tank (HST) and Oxygen Storage Tank (OST) are deployed. To promote tiered energy utilization and reduce carbon emissions, various technologies such as low-temperature waste heat power generation, oxyfuel combustion and carbon capture are also considered in the proposed Cement-IIES.
The detailed mathematical models of the technology and equipment employed in the Cement-IIES are presented in the following sections.
2.1. Wind Turbine
The output of a Wind Turbine (WT) is affected by factors such as blade radius, wind speed and energy conversion efficiency [41]. In stage w of a typical day d at time t, the predicted WT output can be calculated using (1).
where represents the number of WTs installed in stage k (k ≤ w); is the energy conversion efficiency of the WT whilst is the air density (kg/m3); denotes the radius (m) of the WT blades and indicates the wind speed at stage w of a typical day d at time t.
2.2. Photovoltaic
The output of Photovoltaic (PV) is affected by factors including radiation intensity, panel area and inclination and energy conversion efficiency. Equation (2) illustrates how the predicted output is derived [41].
where is the installed PV area (m2) in stage k (k ≤ w) and indicates the radiation intensity (kW/m2) in stage w of a typical day d at time t; denotes the inclination angle (°) of the PV panel whilst and represents the energy conversion efficiency of MPPT and PV component, respectively.
2.3. Electrolyzer
An Electrolyzer (ELZ) uses water and electricity to produce hydrogen and oxygen [42]. The relationship between the hydrogen generated by the ELZ and the input power is shown in (3) and the ratio of the flow rate between hydrogen and oxygen is presented in (4).
where and represent the flow rate (m3/h) of the oxygen and hydrogen produced by the ELZ, respectively; indicates the calorific value of hydrogen (kWh/m3); is the ratio coefficient of the hydrogen-oxygen production. In theory, electrolyzing 1 L water can produce 1234.7 L (111 g) hydrogen and 622 L (889 g) oxygen under standard atmospheric pressure.
2.4. Combined Heating and Power Unit
Combined Heating and Power (CHP) units in the cement industry mainly use coal as fuel, which is called coal-fired CHP. Technologies applying alternative fuels to reduce the use of coal or increase the efficiency of coal combustion are gaining attention in various industries including the cement industry. The use of alternative fuels can save the requirement of primary fossil resources and reduce carbon emissions whilst maintaining the same level of energy consumption for clinker production. In the Cement-IIES proposed in this paper, natural gas and biomass can be used as alternative fuels and the associated system is referred to as natural gas-Fired CHP (ng-fired CHP) and biomass-Fired CHP (bio-fired CHP). Assuming that all three types of CHP units are operating in the heat-constant power mode, there will be differences in the thermoelectric efficiency [43]. The electric power and heating power output can be obtained using (5) and (6), respectively.
where , and represent the output power (MW) of the three types of CHP units in stage w of a typical day d at time t; , and show the power generation efficiency of the three types of CHP units; indicates the calorific value (kWh/m3) of the natural gas whilst the calorific value (MWh/ton) of coal and biomass fuel is denoted by and , respectively; is the input flow rate (m3/h) of the natural gas to the ng-fired CHP; and represent the fuel input volume (ton/h) of coal and biomass to the coal-fired CHP and bio-fired CHP, respectively; the output heat power (MW) of the three types of CHP units is indicated by , and , respectively. Last but not least, , and is the heat-to-power ratios of the three types of CHP units, respectively.
The electric power output of the CHP unit is also constrained by the ramping capability as specified in (7).
where , and represent the installed capacity (MW) of the three types of CHP units in stage k (k ≤ w); , and is the maximum ramping capability (MW/h) of the three types of CHP units, respectively.
2.5. Fired Boiler
Similar to the CHP unit, the Fired Boiler (FB) can also use a variety of fuels including coal, natural gas and biomass and these can be categorized as coal-fired FB, ng-fired FB and bio-fired FB [44]. The output heating power of these FBs can be calculated using Equation (8).
where , and denote the output electric power (MW) of the three types of FBs in stage w of a typical day d at time t, respectively; , and are the energy conversion efficiency of the three types of FBs, respectively. The input flow rate (m3/h) of the natural gas to the ng-fired CHP is represented by whilst the input volume (ton/h) of coal and biomass fuel to the coal-fired FB and bio-fired FB is shown by and , respectively.
2.6. Hydrogen Fuel Cell
The Hydrogen Fuel Cell (HFC) uses hydrogen as fuel to achieve combined heat and power generation and its power generation efficiency is higher than that of the aforementioned three types of CHP units [45]. The model of the electric heating power output of an HFC is similar to that of a CHP unit, which can be defined using Equations (9)–(11).
where and is the output electric power and heating power (MW) of the HFC in stage w of a typical day d at time t whilst and represent the power generation efficiency and heat-to-electricity ratio of the HFC, respectively; is the input flow rate (m3/h) of hydrogen to the HFC.
2.7. Energy Storage Equipment
The energy storage equipment deployed in Cement-IIES includes the Oxygen Storage Tank (OST), Hydrogen Storage Tank (HST) and Battery (BT). The mathematical models of the three types of energy storage are similar and the main differences are the storage medium and charging/discharging capabilities. Model details of the OST are illustrated in (12)–(14) [46].
2.7.1. Constraint for Energy Storage State
The gas storage state of the OST at each time interval needs to satisfy the upper and lower limit of the gas tank, which is generally expressed as the product of the limit coefficient and the installed capacity. This can be shown in (12).
where and indicate the minimum and maximum coefficients, respectively; the installed capacity (m3) of the OST in stage k (k ≤ w) is denoted by .
It can be observed from (13) that the value of is related to the gas storage state at the previous time interval and the charging and discharging state at the current moment in stage w of a typical day d at time t. To ensure that the scheduling instructions can be executed periodically, the value of is fixed at the initial time and end time of each typical day.
where indicates the self-loss coefficient of the OST gas storage; and represents the gas inflating and deflating rate (m3/h) in stage w of a typical day d at time t, respectively; the charge and discharge efficiency of the OST is denoted by and , respectively.
2.7.2. Constraints for Inflation and Deflation Flow and Electric Power
The inflation and deflation behavior of the OST also needs to satisfy the constraints specified in (14).
where and represent the inflation and deflation ratio of the OST, reflecting the relationship between the inflation and deflation flow rate and the OST capacity; and are binary variables which place a restriction that the OST cannot inflate and deflate at the same time.
2.8. Power Generation Device Using Low-Temperature Waste Heat
The cement rotary kiln system is the core of cement production and its internal material balance and heat balance relationship is illustrated in Figure 2 [47].
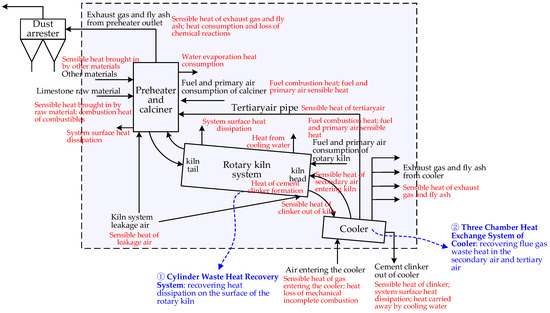
Figure 2.
Internal Material Balance and Heat Balance of Cement Rotary Kiln System.
During the calcination process of the clinker within the rotary kiln, the surface temperature of the cylinder body can reach approximately 240–350 °C and this amount of the low-temperature waste heat will be dissipated in the air if not utilized.
Meanwhile, the temperature of the cement clinker produced from the kiln head can reach 1450 °C and it needs to enter the cooler to be cooled down to about 100 °C by cold air. The waste heat from the clinker can heat the cold air to 500–900 °C with considerable recycling potential. The existing three-chamber heat exchange system of the cooler already utilizes the waste heat of the clinker to heat the secondary air entering the kiln and the tertiary air entering the furnace, which minimizes the fuel consumption of the rotary kiln system. However, there is still 200–250 °C low-temperature flue gas waste heat in the secondary air and tertiary air that can be reused.
As a result, the waste heat utilization of the cement rotary kiln considered in this paper mainly focuses on the waste heat recovery from the Cylinder Waste Heat Recovery System (CWHC) and the Three Chamber Heat Exchange System of Cooler (TCHE).
2.8.1. Cylinder Waste Heat Recovery System
Taking the cement production line with a daily output of 5000 tons in the existing cement factory as an example [48], the amount of reusable heating power can be calculated using Equation (15) when the CWHC adopts convective heat transfer and radiation heat transfer.
where represents the convective heat transfer coefficient in W/(m2·K) whilst indicates the difference between the average surface temperature of the cylinder and the ambient temperature K. The surface area (m2) of the cylinder is illustrated by .
2.8.2. Three-Chamber Heat Exchange System of Cooler
The amount of heating power that can be recovered from the secondary air and tertiary air by TCHE is calculated using (16).
where shows the constant pressure-heat ratio (kJ/(kg·K)) of the flue gas whilst represents the density (kg/m3) of the flue gas. is the flow rate (m3/h) of flue gas during the waste heat recovery and is the temperature difference (K) before and after the flue gas recovery.
2.8.3. Heat Balance during Low-Temperature Waste Heat Recovery
Part of the low-temperature waste heat recovered by CWHC and TCHE can be used for power generation when applying the Organic Rankine Cycle (ORC) technology. Similarly, part of the input heat for the Absorption Chiller (AC) can also be used to supply the heating and hot water demand of cement units, office buildings and dormitory areas. The deficit in demand for heating and domestic hot water can be covered by high-grade heating energy. Equation (17) indicates the heat balance relationship during the low-temperature waste heat recovery, which can also be referred to as the low-grade heating bus balance.
where is the output electric power (MW) of the ORC system and is the power generation efficiency of the ORC system; denotes the output cooling power (MW) of the AC whilst is the energy efficiency coefficient of the AC; indicates the low-grade heat demand (MW) that needs to be met during the production and living activities (referred to “non-core activities”) other than the limestone calcination.
2.9. Oxygen-Enriched Combustion and Carbon Capture Technologies
Major carbon capture technologies include pre-combustion capture technology, post-combustion capture technology and oxygen-enriched combustion technology. The oxygen-enriched combustion technology has gained popularity because of its high carbon capture rate and low investment cost [35]. Its working principle is to replace the air within the combustion chamber with a mixture of oxygen and circulating CO2 flow to generate a highly concentrated CO2 flow (unchanged total amount with improved purity), which is easier to be captured by the carbon capture Compression Purification Unit (CPU) [49].
Carbon capturing is a costly process and cement kilns typically cannot provide all the required energy. It is a common practice to provide the energy for carbon capture in cement factories from coal-fired power plants or by burning natural gas after adding waste heat boilers [34,50]. In this paper, there are multiple approaches to meet the energy demand of the CPU including the utilization of three types of CHP units and FB, as well as the low-temperature waste heat recovery of the rotary kiln system, which can effectively reduce the CPU’s dependence on expensive external energy.
2.9.1. Power Demand of CPU
The power demand of the CPU varies depending on the source of the carbon emission. , and represent the power demand of CPU for capturing carbon from limestone calcination, CHP unit and FB and can be derived using Equation (18).
where represents the energy (MWh/ton) required by the CPU to capture one unit of CO2 whilst reflects the carbon capture level of the CPU for limestone calcination; , and show the carbon capture levels of the CPU for three types of CHP units and , and indicate that of the CPU for three types of FB; denotes the carbon emission intensity (ton/ton) during the limestone calcination. The carbon emission intensity (ton/MWh) of the three types of CHP units are denoted as , and whilst the intensity (ton/MWh) of the three types of FB are represented by , and .
It should be noted that the carbon dioxide produced from biomass fuel does not need to specifically proceed. When considering carbon capture in this paper, it is equivalent that the bio-fired CHP and bio-fired FB will produce “negative carbon emission” and can obtain a reward for carbon reduction.
2.9.2. Constraints for CPU Carbon Capture Level
In the CPU model established in this paper, it is assumed that the upper limit of the CPU’s carbon capture level for the CHP unit and GB relies on whether the CHP unit and GB use oxygen-enriched combustion. Binary variables and are introduced to indicate whether the CHP unit and GB are in the oxygen-enriched combustion state. The expression (19) defines the relevant constraints.
where is the maximum carbon capture level of the CPU for limestone calcination; and represent the maximum carbon capture level of the CPU for the CHP unit with and without oxygen-enriched combustion. Similarly, and indicate the maximum carbon capture level of the CPU for the FB with and without oxygen-enriched combustion.
2.9.3. Net Carbon Emission of Limestone Calcination, CHP Units and FB
When the oxygen-enriched combustion and carbon capture are considered, the net carbon emissions of the limestone calcination, CHP units and FB can be calculated using (20).
where , and denote the net carbon emissions of the limestone calcination, CHP units and FB; is the “negative carbon emission” of biomass fuel because of carbon capture.
2.9.4. Oxygen Requirement for Oxygen-Enriched Combustion
The relationship between the amount of oxygen consumed by the CHP unit and FB when they are in an oxygen-enriched combustion state and the associated output power is shown in (21) [51].
where and represent the amount of oxygen required (m3/MWh) to output unit power when the CHP unit and FB are in the oxygen-enriched combustion state.
3. Problem Formulation
After establishing the model of Cement-IIES in Section 2, this section builds a multi-stage planning model for the Cement-IIES including the objective function and constraints.
3.1. Objective Function
The system planning aims to minimize the expenditure in the entire planning cycle. As shown in (22), the expenditure includes initial equipment technology investment cost at each stage, power grid electricity exchange cost, fuel purchase cost, oxygen selling income, system equipment operation and maintenance cost, renewable energy curtailment and heat reduction penalty cost, carbon trading cost/gain and green certificate cost/gain.
where indicates the number of planning stages in the planning cycle and represents the number of years involved in each stage; is the number of typical days being considered for each year whilst is the number of days for each typical day group; r is the discount rate.
In what follows, the mathematical expressions for each cost/income in Equation (22) are described in detail in Section 3.1.1, Section 3.1.2, Section 3.1.3, Section 3.1.4, Section 3.1.5, Section 3.1.6, Section 3.1.7, Section 3.1.8, Section 3.1.9.
3.1.1. Investment Cost
The investment cost can be further divided according to the type of equipment, as shown in (23).
where the investment cost of WT and PV is indicated by and and they can be calculated by (24) and (25), respectively. The investment cost of other equipment can be derived using (26).
where denotes the unit investment cost of the equipment in stage w and the unit can be CNY/MW, CNY/MWh or CNY/m3 depending on the equipment type.
Except for , the other costs are related to a typical day which will be described in the following sections.
3.1.2. Power Grid Electricity Exchange Cost
The power grid electricity exchange cost consists of two parts including the electricity purchase fee and electricity sale revenue.
where and represent the power (MW) purchased and sold in stage w of a typical day d at time t. The price (CNY/MWh) of purchasing and selling electricity is represented by and , respectively.
3.1.3. Cost of Purchasing Various Types of Fuel
The purchase cost of fuel includes that for natural gas, coal, biomass fuel and hydrogen and can be calculated using Equation (28).
where is the amount (m3/h) of hydrogen purchased for the system; the purchase price (CNY/m3) of natural gas and hydrogen is denoted by and . For the purchase price (MWh/ton) of coal and biomass fuel, they are represented by and .
3.1.4. Cost of Selling Oxygen
The income of oxygen selling can be calculated using Equation (29).
where is the amount (m3/h) of selling oxygen from the system; the selling price (CNY/m3) of oxygen is denoted by .
3.1.5. Operation and Maintenance Cost of Equipment
The operation and maintenance cost of the system is shown in (30).
where is the unit operation and maintenance cost of the equipment and the unit can be CNY/MWh or CNY/m3 depending on the type of equipment.
3.1.6. Penalty Fee for Renewable Energy Curtailment
There will be a cost for curtailing wind and solar energy as calculated in (31).
where and indicate the unit penalty fee (CNY/MWh) for wind and solar curtailment.
3.1.7. Penalty Fee for Heating Supply Reduction
If the total heat supply exceeds the heat demand of the system, a penalty fee needs to be paid to reduce the heat supply, as shown in (32):
where indicates the unit penalty fee (CNY/MWh) to reduce the heat supply; is the total heat demand (MW) of non-core activities; the high-grade heat demand (MW) of non-core activities is denoted by .
3.1.8. Carbon Trading Cost/Gain
The operating mechanism of the carbon market can be summarized into four parts: total amount setting, allowance allocation, trading and penalty for breach of contract [52]. Among them, the setting of the total amount, the allocation of carbon allowance and the filing of certified emission reductions are mainly completed in the primary market, and the transactions of carbon allowance and certified emission reductions are mainly carried out in the secondary market.
In this paper, the baseline method is adopted to determine the carbon allowance of the generator set in Cement-IIES. When the amount of carbon emission exceeds the free carbon allowance, expense needs to be paid and it can be calculated by (33) [53].
where is the carbon emission factor (ton/MWh) of the external power grid power in stage w whilst and represents the carbon allowance (ton/h) of the ng-fired CHP and coal-fired CHP, respectively.
The carbon allowance is calculated using (34).
where is the power supply reference value (ton/MWh) of the gas-fired unit and () is the heat supply correction coefficient of the gas-fired unit; represents the heat supply reference value (ton/GJ) of the gas-fired unit whilst indicates the power supply reference value (ton/MWh) of the coal-fired unit. The correction coefficient of the cooling mode of the coal-fired unit can be denoted as and will take the value 1; () is the correction coefficient of the heat supply of the coal-fired unit and is the correction coefficient of the output of the coal-fired unit whose value is 1; indicates the heat supply reference value (ton /GJ) of the coal-fired unit.
It is worth noting that, in China, there is no carbon allowance for pure heating facilities without power generation capability such as FB. In addition, the planning work for Cement-IIES in this paper does not consider dynamic carbon trading, but only sets the carbon price according to the current situation of China’s carbon trading market.
3.1.9. Green Certificate Cost/Gain
Green certificate is a certificate issued by the national energy authority to renewable energy power generators, which proves that the generator has generated a portion of its electricity from renewable sources [54]. The green certificate mechanism is a supporting measure to ensure the effective implementation of the Renewable Portfolio Standard (RPS), and the purpose of implementing the RPS and green certificate trading mechanisms is to gradually transition renewable energy generation from government subsidies to market-based subsidies.
When the weight of the renewable energy power consumption is lower than the required value, the entity which is responsible to consume renewables can purchase green certificates from the market to compensate for the deficit. By contrast, the green certificate can be sold to earn a profit if the weight of the renewable consumption is higher than the target value [39]. Equation (35) shows how the green certificate cost and gain are derived.
where is the conversion coefficient of power-heat supply of CHP; represents the required value for the weight of renewable energy consumption in stage w whilst denotes the price (CNY/MWh) of the green certificate.
3.2. Constraints
3.2.1. Balance of Multi-Energy Flow Buses
There are power, heat, cooling, hydrogen and oxygen buses in the system.
- (1)
- Power Bus
The power bus balance is shown in (36).
where represents the output heating power (MW) of the EB with indicating the energy conversion efficiency of the EB. is the output cooling power (MW) of the EC with denoting the energy efficiency coefficient of EC. The amount of oxygen (m3/h) produced by the ASU is represented by whilst is the energy (MWh/m3) required for ASU oxygen production. indicates the power demand (MW) of non-core activities.
- (2)
- Heating Bus
In addition to the low-grade heating bus balance defined in (17), the system also needs to satisfy the high-grade heating bus balance constraints, as shown in (37).
where indicates the heat demand (MW) during the limestone calcination process; is the heat demand (MWh/ton) to calcine limestone; denotes the amount (ton/h) of cement produced; represents the proportional coefficient between the amount of limestone calcined and the amount of cement produced and the typical value is 1.31.
The high-grade and low-grade heat demands of non-core activities also need to satisfy the conditions specified in the expression (38).
where shows the requirement for the minimum proportion of high-grade heat demand within the total heat demand.
- (3)
- Cooling Bus
The cold energy demand of the system is provided by both the EC and AC and the constraint for cooling bus balance is illustrated by (39).
where is the cold energy demand (MW) of non-core activities.
- (4)
- Oxygen Bus
From (40), the oxygen is supplied by the ELZ and ASU and consumed by the CHP unit, the FB where oxygen-enriched combustion occurs and the oxygen trading with external systems. It is also worth noting that the OST participates in the peak-shaving and valley-filling of the oxygen bus.
where is the volume (m3/h) of oxygen being sold.
- (5)
- Hydrogen Bus
The balance of the hydrogen bus is depicted by (41).
where is the amount (m3/h) of hydrogen purchased from the hydrogen suppliers.
3.2.2. Constraint for Equipment Installed Capacity
The installed capacity of the WT and PV in each stage also needs to meet the upper and lower capacity limit, as shown in (42) and (43), whilst other equipment needs to satisfy the constraints defined in (44).
where and represent the maximum construction area (m2) of the WT and PV in stage w, respectively. is the maximum installed capacity of the equipment in stage w and the unit can be CNY/MW, CNY/MWh or CNY/m3 depending on the equipment type.
3.2.3. Constraint for Equipment Operating State
The actual electric power used by the WT and PV should be less than the associated predicted values, as shown in expression (45) and (46). The electrical output or heating output of other equipment needs to meet the constraints defined in (47).
where and represent the minimum and maximum values of the proportional coefficients between the equipment output and capacity.
3.2.4. Constraint for Grid Power Exchange
Electricity will be purchased from the external grid when there is an insufficient power supply in the system. By contrast, the system will sell electricity when there is excess power. The electricity exchange needs to satisfy the constraints shown in (48).
where and denote the minimum and maximum amount (MW) of purchased electricity in stage w. and represent the minimum and maximum amount (MW) of sold electricity. and are binary variables which are used to indicate that the system cannot simultaneously purchase and sell electricity.
3.2.5. Constraint for Fuel Purchase and Selling
The amount of purchased and sold natural gas, coal, biomass fuel, hydrogen and oxygen need to satisfy the constraints specified in (49).
where and show the minimum and maximum amount (m3/h) of natural gas being purchased in stage w. The minimum and maximum purchased amount (ton/h) of coal in stage w is represented by and . and depict the minimum and maximum purchased amount (ton/h) of biomass fuel in stage w whilst and denote the minimum and maximum volume (m3/h) of hydrogen purchased in stage w. The minimum and maximum volume (m3/h) of oxygen sold in stage w is and .
4. Case Study
Considering the current production situation of the cement factory production line, the planning of Cement-IIES is carried out in an industrial park in the southeast coastal area of China. Figure 3a shows the production characteristics of typical days in the spring-autumn transition season, summer and winter. In addition to the core production activities, the characteristics of the electric heating and cooling demand of the cement workshops, office buildings and dormitory areas are presented in Figure 3b–d. On the summer typical day in Figure 3b, the electric load is dominant while the heating load is at its trough throughout the year. When it comes to the winter typical day in Figure 3c, the system’s heating load other than the lime production line exceeds the cooling load because of low temperature. The load characteristics of spring/autumn typical days in Figure 3d are between summer and winter typical days.
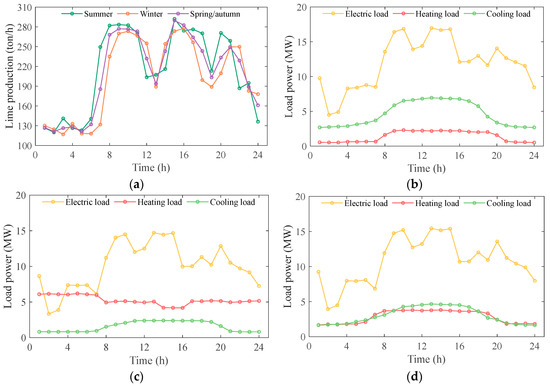
Figure 3.
Characteristics of Cement Production and Seasonal Load of Cement Factory: (a) Cement Production; (b) Summer Load; (c) Winter Load; (d) Transition Season Load (Spring–Autumn).
4.1. Case Design
The planning cycle of the cement factory energy system is 20 years and it is intended to expand the production line to increase cement production in the later stage of the planning cycle. The multi-stage planning model proposed in this paper is applied to conduct multi-stage flexible planning research on the cement factory with a planning cycle divided into two stages and each stage is 10 years long. In the planning model, the influence of various technical, economic, political and environmental factors is considered when setting the parameters. More specifically, these factors include the resource characteristics of the area, the policy environment for carbon trading and green certificate trading, the efficiency of energy production, cost changes, price trends of external energy market transactions and constraints such as available construction area.
To evaluate the performance of the proposed planning method, four sub-cases are compared. Case 1 is configured as the base case and uses the phased implementation method which is the modeling and planning method proposed in this paper. For Case 2, the traditional single-stage planning method (i.e., one-step-reach) is applied without considering the phased changes in the load and complex parameters. Different from Case 1, Case 3 does not consider the recycling of low-grade waste heat from the rotary kiln system whilst Case 4 does not involve the use of oxygen-enriched combustion and carbon capture technologies. The parameter configuration of the test system can be seen in Appendix A.
4.2. Comparison of Case Results
The case study is run on a desktop computer with an i7-9700KF processor and 32 GB memory. The program is written in Matlab R2022a and solved by Yalmip + Gurobi (Version 9.5.1). Table 1 shows the results of Cases 1–4.

Table 1.
Comparison of Case Results: Cost and Benefit.
In terms of economy, the total cost of Case 1 in the entire planning cycle is lower than that of the other three cases and accounts for 86.12% of the cost of Case 2, 98.16% of the cost of Case 3 and 83.02% of the cost of Case 4. Case 2 does not consider the development of energy equipment technology, the available area for renewable energy construction and the energy demand of cement factories in various stages, resulting in excess requirements for traditional energy equipment in the early stage of planning and insufficient utilization of renewable resources including WT and PV in the later stage. Meanwhile, carbon capture reduces the cost of the carbon emission and increases income via the “negative carbon emission” of biomass fuel. Furthermore, the reuse of low-temperature waste heat reduces the system’s reliance on the external energy source. All of the aforementioned factors improve the economic performance of the system.
From the perspective of environmental protection, Case 1 has the lowest amount of total carbon emission from limestone calcination, fossil fuel use and electricity consumption because the carbon emitted from the combustion of coal and natural gas is captured and stored by the CPU. Compared with Case 4, the carbon emission of Case 1 is approximately 17% of that in Case 4. In addition, there are gains of CNY 3.10 × 10⁷ and CNY 7.89 × 10⁷ from the “negative carbon emission” of biomass fuel after using oxygen-enriched combustion and carbon capture.
Concerning energy efficiency, the energy utilization efficiency of Case 1, Case 3 and Case 4 in the second stage is higher than that in the first stage due to the improvement in the energy conversion efficiency of the WT, PV, ELZ, HFC and other equipment. It can be observed that the energy efficiency of Case 2 where single-stage planning is applied is not the lowest and the energy efficiency ratio in both stages of Case 4 is higher than that of Case 1. This is because the cost of oxygen storage and energy loss during carbon capture can slightly lower the system’s energy efficiency even though the oxygen-enriched combustion and carbon capture technologies deployed in Case 1 and Case 3 can significantly improve the environmental performance of the system. Moreover, the energy efficiency ratios of the two stages in Case 1 are higher by 0.45% and 0.86% compared to Case 3 because of the reuse and utilization of low-grade waste heat from the rotary kiln system.
4.3. Capacity and Investment Costs of Equipment in Various Stages
The results of Case 1 will be comprehensively analyzed in the following sections. The installed equipment capacity is shown in Figure 4 whilst the investment cost proportion for the two stages is presented in Figure 5. It should be noted that the meanings of the upper and lower case abbreviations for the equipment or technologies in Figure 4 and Figure 5 are given in the Nomenclature.
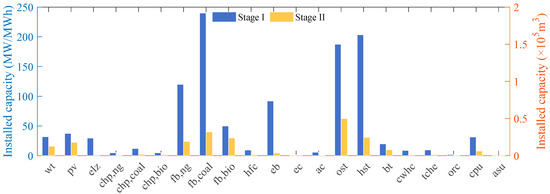
Figure 4.
Installed Capacity of Equipment in Two Stages of Case 1.
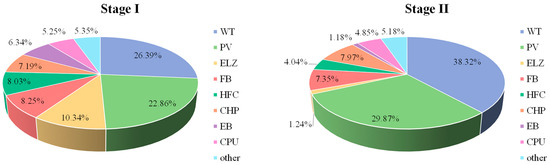
Figure 5.
Proportion of Equipment Investment Cost in Two Stages of Case 1.
Since cement production requires a massive amount of heat energy, the installed capacity of the FB and EB used to provide the heat load of calcination is significantly higher than other energy-producing and consuming equipment. In the first stage, the eight types of equipment with the highest investment cost proportion are the WT, PV, ELZ, FB, HFC, CHP, EB and CPU. In the second stage, the ranking slightly changes but the renewable units, FB and CHP still account for the major portion of the cost.
The total installed capacity of WT and PV is 69.5 MW and 38.5 MW. Due to the high construction and maintenance cost of new energy units, WT and PV account for 49.25% of the total investment in the first phase and reaches 68.19% in the second stage.
CHP has installed a capacity of 22 MW and 5.4 MW in two stages, accounting for 7.19% and 7.97% of the total investment. Although the installed capacity of the bio-fired CHP is not large, it accounted for 6.02% of the total investment in the second stage due to its relatively high investment cost (around 6.3 times coal-fired CHP and 3.7 times ng-fired CHP).
The total investment in FB accounted for 8.25% and 7.35% in the first and second stages, respectively. The coal-fired FB in the first stage has 240 MW capacity and accounts for 4.06% of the investment. Limited by the “coal reform” policy, the newly installed capacity of the bio-fired FB in the second stage exceeds that of the coal-fired FB, which accounts for 2.78% of the total investment.
The EB can perform as an alternative source of heat and its installed capacity is 91.99 MW and 4.71 MW in the first and second stages, respectively. The corresponding investment cost accounts for 6.34% and 1.18%, and the EB achieves partial electrification replacement of FB.
The CPU can significantly reduce carbon emission during limestone calcination and fuel combustion and its investment cost accounts for 5.25% of the total cost in the first stage and 4.85% in the second stage.
Compared with the heat demand for limestone calcination, the demand for heat and cold energy in the non-core activities of the industrial park is relatively low. Therefore, the installed capacity and investment proportion of the AC and EC equipment are relatively small.
4.4. System Operation Analysis
In the previous subsections, the overall configuration results of planning schemes for Cement-IIES have been presented and compared. This section focuses on the detailed operation status of Cement-IIES in Case 4, which adopts the proposed modeling and planning method. To be specific, multi-energy flow balance, key equipment operation output and combustion and carbon capture state are analyzed in sequence.
4.4.1. Multi-Energy Flow Balance
The system energy demand at terminals and the energy flow balance are shown in Figure 6. The energy flow relationship of electricity, high-grade heating, low-grade heating and cooling is given in Figure 6a–d, respectively.
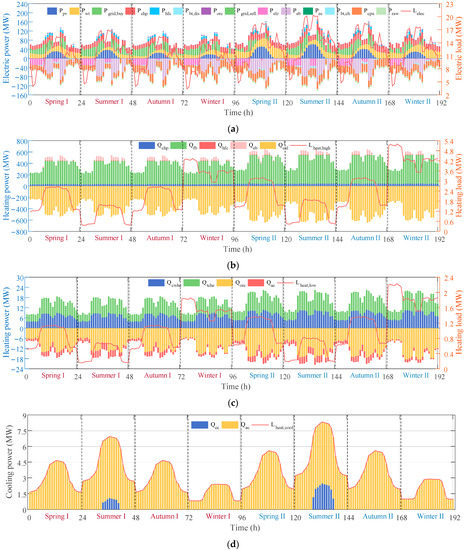
Figure 6.
Multi-Energy Flow Bus Balance in Two Stages of Case 1: (a) Electrical Power; (b) High-Grade Heat Demand; (c) Low-Grade Heat Demand; (d) Cooling Energy.
As shown in Figure 6a, the power of the system is mainly provided by the renewable units, purchased electricity and CHP unit whilst most of the power is consumed by the EB, ELZ and CPU. It can be observed that the system will have two power demand peaks on different typical days, which is mainly affected by the output state of the EB. To fill the peak power demand, the BT will switch to the discharging state and the HFC will generate full power during the peak hours. The peak of electrical load for non-core activities occurs between 8:00 and 16:00, which coincides with the peak output of WT and PV. Hence, there is no large amount of renewable energy available to be used by the ELZ to produce hydrogen and oxygen in this period.
The high-grade heating energy in the cement industrial park is mainly used for limestone calcination and simultaneously satisfies the high-grade heating demand of non-core activities. The low-grade heating energy is mainly used for low-temperature waste heat power generation and meets the low-grade heating demand of non-core activities. In the case study, the high-grade heat demand of non-core activities accounts for at least 70% of the total heat demand. Based on Figure 6b, most of the high-grade heating energy is consumed by limestone calcination, accounting for approximately 99.45% of the total high-grade heating energy demand. This high-grade heating energy is mainly supplied by the FB with the CHP, EB and HFC used as the supplementary heating providers.
By contrast, the low-grade heating demand of the system is covered by the low-temperature waste heat recovered from the rotary kiln system, as shown in Figure 6c. It can be seen that the surplus low-temperature waste heat is used to drive ORC power generation and supply AC refrigeration.
In Figure 6d, the cooling energy demand of the system is mainly provided by the AC and EC acts as the supplementary source for the cooling demand peak on a typical summer day.
4.4.2. Operation Output of Key Equipment
Based on the energy flow balance analysis in Section 4.4.1, Figure 7 and Figure 8 further illustrate the output of the CHP and FB. More specifically, the coal-fired CHP and bio-fired CHP keep generating at full power and this is because the CHP discussed in this paper operates in the heat-constant power mode which means the heat-to-power ratio of the coal-fired CHP ( in Equation (6)) and bio-fired CHP ( in Equation (6)) is higher than that of the ng-fired CHP ( in Equation (6)). To satisfy the high heat demand, the former two CHPs have a higher priority to generate than the ng-fired CHP.
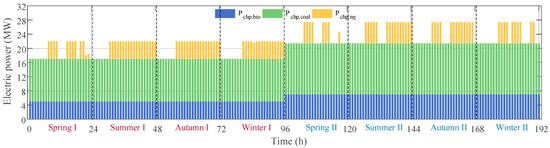
Figure 7.
CHP Output in Two Stages of Case 1.
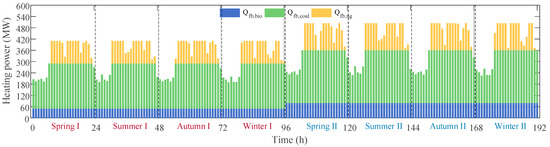
Figure 8.
FB Output in Two Stages of Case 1.
Regarding FB, the heating efficiency of bio-fired FB ( in Equation (8)) can reach 0.9 which is higher than 0.6 for coal-fired FB ( in Equation (8)). In addition, biomass fuel can be used in conjunction with CPU to achieve “negative carbon emission” so that carbon trading subsidies can be obtained. Consequently, the bio-fired FB has the highest output priority and it typically keeps generating at full power.
Figure 9 depicts the relationship between the supply and demand of hydrogen and oxygen relationship, as well as the operating status of the HST and OST.
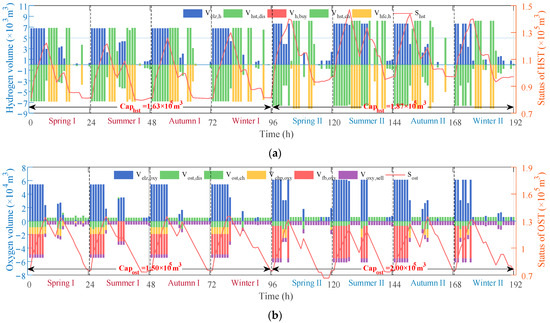
Figure 9.
Relationship between Oxygen/hydrogen Input and Output in Two Stages of Case 1: (a) Hydrogen; (b) Oxygen.
Figure 9a presents the relationship between oxygen input and output in two stages of Case 1. It can be seen that the HST installed capacity in the first stage is 1.63 × 10⁵ m3 and it is expanded to 1.87 × 10⁵ m3 in the second stage. The HST is mainly used to store the hydrogen produced by the ELZ during the low power demand period and supply hydrogen when the HFC is dispatched to shave the peak demand. In addition, the hydrogen supply in the system is sufficient, so there is no need to purchase additional hydrogen from external suppliers.
Concerning the OST, the installed capacity in the first stage is 1.50 × 10⁵ m3, which is expanded to 2.00 × 10⁵ m3 in the second stage, as shown in Figure 9b. The oxygen discussed in this paper is the by-product when the ELZ electrolyzes water to produce hydrogen and can satisfy the oxygen demand of the CHP and FB to achieve oxygen-enriched combustion. The relationship between the oxygen input and output in Figure 9b is more complex than that of hydrogen, where most of the oxygen is injected into the FB and CHP. Due to the high market price of oxygen, the system keeps selling 5 × 10³ m3/h and 6 × 10³ m3/h of oxygen to external parties in the first and second stages, respectively. It is worth noting that the OST has a relatively weak capability for peak-shaving and valley-filling because of limited construction capacity.
4.4.3. State of Oxygen-Enriched Combustion and Carbon Capture
Since the oxygen-enriched combustion and carbon capture technologies have a significant influence on the system’s environmental performance, this subsection analyzes their operation status in detail. The hourly carbon emission and capture during the limestone calcination process on each typical day are shown in Figure 10. The dark blue part of the stacked histogram represents the amount of carbon emission from the limestone calcination process after applying the carbon capture technology whilst the light blue session indicates the amount of reduced carbon emissions by using carbon capture technology. A large portion of CO2 is produced during the limestone calcination process with the carbon emission peaking at 118.11 ton/h and 136.81 ton/h in the first and second stages, respectively. In certain cement production peak periods in the first stage, the capture level of CPU is 0 but it typically can reach the highest value of 98% during other peak periods. In the second stage, the installed capacity of the CPU is further expanded and 98% of the carbon emissions are captured most of the time.
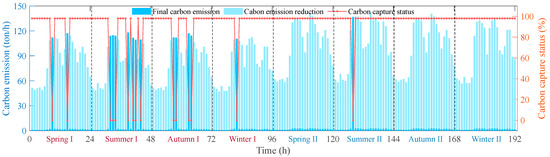
Figure 10.
Carbon Emission and Capture during Limestone Calcination in Two Stages of Case 1.
The application of oxygen-enriched combustion in the CHP and FB can affect the upper limit for the carbon capture level of the CPU. More specifically, the carbon capture level can reach 98% if oxygen-enriched combustion is employed. Otherwise, the upper limit of the carbon capture level will be 90%. The state of oxygen-enriched combustion and carbon capture of the three types of CHP and FB under the aforementioned condition is shown in Figure 11. When the carbon capture level is higher than the red dotted line (90%), it means the CHP/FB has implemented oxygen-enriched combustion.
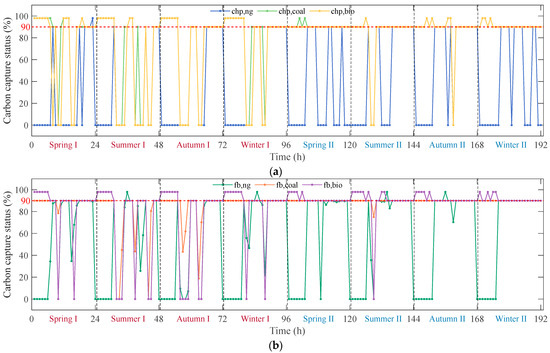
Figure 11.
State of Oxygen-Enriched Combustion and Carbon Capture of CHP and FB in Two Stages of Case 1: (a) CHP; (b) FB.
The CHP in Figure 11a and FB in Figure 11b operate in the oxygen-rich combustion state mostly at night, that is, 0:00–6:00. In this period, the green power is abundant while the power load is low, so the surplus renewable generation can be used to drive the ELZ and produce hydrogen and oxygen. The oxygen is then supplied to the CHP and FB to support oxygen-rich combustion. This finding is consistent with the trends shown in Figure 6a and Figure 9b.
Comparing Figure 10 with Figure 11, it can be observed that the moment when CHP and FB are in the state of oxygen-enriched combustion misalign with the moment when the carbon capture level of limestone calcination reaches the upper limit. This is because of the upper limit on the total amount of carbon that can be captured by the CPU.
This paper also considers the “negative carbon emission” effect of biomass fuel, and the carbon emission of bio-fired CHP and bio-fired FB after carbon capture is illustrated in Figure 12.
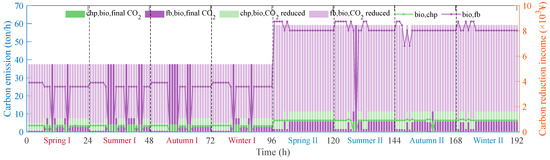
Figure 12.
“Negative Carbon Emission” Effect of Biomass Fuel Equipment in Two Stages of Case 1.
In Figure 12, the dark green and dark purple parts of the stacked histogram represent the carbon emission from the bio-fired CHP and bio-fired FB when carbon capture technology is applied whilst the light green and light purple session indicates the amount of reduced carbon emission by using carbon capture technology. It can be seen that the maximum income of 4.41 × 10³ CNY/h and 9.66 × 10³ CNY/h can be obtained in the first and second stages if carbon capture is implemented on biomass fuel equipment. With the potential economic benefits of “negative carbon emission” from biomass fuels, among the three types of CHP and FB, bio-fired CHP and bio-fired FB are optimized to operate more in the oxygen-rich combustion state, so as to achieve a higher level of carbon capture, which can also be found in Figure 11.
5. Discussion
This paper effectively addressed the lack of IIES planning methods that combine specific industrial processes. Taking the cement industry as an example, we focus on the massive carbon emissions caused by lime calcination and skillfully couple the production process with the multi-energy system to convert low-temperature waste heat dissipated in the air into useful energy for production and living needs. Especially, the integration of oxygen-enriched combustion and carbon capture technology can help cement plants improve their environmental performance at the source of carbon emissions.
In addition to the comprehensive utilization of carbon reduction technologies, the multi-stage planning method proposed in this paper can overcome the inflexibility issue of traditional single-stage planning, and help the cement industry achieve optimal performance in terms of environmental protection, economic efficiency and energy efficiency, which have been validated in the above case study.
Although a series of valuable qualitative and quantitative findings have been obtained, there are still some shortcomings or areas for further research.
From a technical perspective, the impact of oxygen-enriched combustion on generation set operating conditions outside of carbon emissions, especially the emissions characteristics of SO2 and NOx, has not been considered. In addition, the next step in dealing with CO2 after the compression and purification by the CPU has not been fully explored. If underground storage is considered, issues such as requirements on geological conditions and transportation, as well as impacts on the surrounding environment need to be analyzed.
The planning approach and method proposed in this paper can be applied to other energy-intensive and carbon-intensive industries. In China, although pilot carbon markets in some regions have covered some industrial and transportation sectors, the national carbon market currently only includes the power generation sector, and the carbon allowance in this paper only considers power generation units. If heating systems, cement and other industries’ production processes can be included in the national carbon market in the future, the planning model in this paper can be further improved.
Due to the long-term nature of planning issues, the carbon trading and green certificate trading mechanisms and prices are relatively simple in this paper, with fixed carbon prices and green certificate prices at specific stages. It will be meaningful to further conduct research on real-time or intra-day optimal operation strategies for Cement-IIES and analyze the system’s potential of flexibly adjusting to the dynamic carbon price and green certificate price. In particular, it is meaningful to analyze the sensitivity of low-carbon energy technologies to incentive signals such as carbon price, green certificate price and external system flexibility requirements.
6. Conclusions
This paper focuses on the modeling and multi-stage planning of the Cement-IIES with high energy consumption and carbon emission. Combined with the energy flow and material flow of the actual cement production line, a Cement-IIES considering multiple carbon reduction technologies including low-temperature waste heat recovery, oxygen-enriched combustion, carbon capture, hydrogen and oxygen production using electrolysis, energy storage and fuel/technology substitution is proposed. Furthermore, a multi-stage flexible planning method for the Cement-IIES with consideration of green certificate trading and carbon trading is proposed by examining the periodic changes in technical and economic parameters. The case study demonstrates that the economic efficiency of the proposed planning method improves by 13.88% when compared with the traditional single-stage planning method. Meanwhile, it can flexibly adapt to changes in various policies including the “coal reform”, green certificate trading and carbon allowance and thus allocate reasonable investment in equipment in different stages. The application of low-temperature waste heat recovery technology can increase the system energy efficiency ratio by 0.45% and 0.86% in the first and second stages whilst the oxygen-enriched combustion and carbon capture technology can reduce the total carbon emission of the system by approximately 83%. In addition, the “negative carbon emission” effect of the biomass fuel equipment can help the system earn 3.10 × 10⁷ CNY/year and 7.89 × 10⁷ CNY/year in the first and second stages, respectively. In addition, the limitations of this work and our future research directions are discussed.
Author Contributions
Conceptualization, Z.G. and S.Z.; methodology, Z.G. and S.Z.; software, Z.G.; validation, S.Z.; writing—original draft preparation, Z.G. All authors have read and agreed to the published version of the manuscript.
Funding
This research was funded by the National Natural Science Foundation of China with grant number 52177076.
Institutional Review Board Statement
Not applicable.
Informed Consent Statement
Not applicable.
Data Availability Statement
The data presented in this study are available on request from the corresponding author. The data are not publicly available due to privacy.
Conflicts of Interest
The authors declare no conflict of interest.
Nomenclature
| WT, wt | Wind turbine |
| PV, pv | Photovoltaic |
| ELZ, elz | Electrolyzer |
| CHP, chp | Combined heat and power |
| FB, fb | Fired boiler |
| HFC, hfc | Hydrogen fuel cell |
| EB, eb | Electric boiler |
| EC, ec | Electric chiller |
| AC, ac | Absorption chiller |
| OST, ost | Oxygen storage tank |
| HST, hst | Hydrogen storage tank |
| BT, bt | Battery |
| CWHC, cwhc | Cylinder waste heat recovery system |
| TCHE, tche | Three chamber heat exchange system of cooler |
| ORC, orc | Organic rankine cycle |
| CPU, cpu | Compression purification unit |
| ASU, asu | Air separation unit |
Appendix A
Table A1.
Values of fixed technical and economical parameters in Case study.
Table A1.
Values of fixed technical and economical parameters in Case study.
| No. | Name | Value (Stage I/Stage II) | Unit | No. | Name | Value (Stage I/Stage II) | Unit |
|---|---|---|---|---|---|---|---|
| 1 | 0.55/0.572 | - | 45 | 0.748 | kg/m3 | ||
| 2 | 1.23 | kg/m3 | 46 | 387,000/464,400 | m3/h | ||
| 3 | 40 | m | 47 | 0.12 | - | ||
| 4 | 23 | ° | 48 | 1.5 | - | ||
| 5 | 0.75 | - | 49 | 0.0893 | MWh/ton | ||
| 6 | 0.16/0.1664 | - | 50 | 0.4043 | ton/ton | ||
| 7 | 0.64/0.672 | - | 51 | 0.3904 | ton/MWh | ||
| 8 | 8.01 | - | 52 | 1.08 | ton/MWh | ||
| 9 | 2.792 | kWh/m3 | 53 | 0.864 | ton/MWh | ||
| 10 | 9.886 | kWh/m3 | 54 | 0.234 | ton/MWh | ||
| 11 | 8.141 | MWh/ton | 55 | 0.83 | ton/MWh | ||
| 12 | 4.652 | MWh/ton | 56 | 0.664 | ton/MWh | ||
| 13 | 0.45 | - | 57 | 0.98 | - | ||
| 14 | 0.3 | - | 58 | 0.98 | - | ||
| 15 | 0.3 | - | 59 | 0.9 | - | ||
| 16 | 0.8 | - | 60 | 0.98 | - | ||
| 17 | 1.9 | - | 61 | 0.98 | - | ||
| 18 | 1.7 | - | 62 | 600 | m3/MWh | ||
| 19 | 100% | - | 63 | 600 | m3/MWh | ||
| 20 | 100% | - | 64 | 0.3901/0.3121 | ton/MWh | ||
| 21 | 100% | - | 65 | 0.0557/0.0446 | ton/GJ | ||
| 22 | 0.9 | - | 66 | 0.8729/0.6983 | ton/MWh | ||
| 23 | 0.6 | - | 67 | 0.1104/0.0883 | ton/GJ | ||
| 24 | 0.9 | - | 68 | 1 | - | ||
| 25 | 0.5/0.52 | - | 69 | 1 | - | ||
| 26 | 0.65 | - | 70 | 0.95 | |||
| 27 | 100% | - | 71 | 5 | |||
| 28 | 0.075 | - | 72 | 3.03 × 10⁻⁴ | MWh/m3 | ||
| 29 | 0.9 | - | 73 | 0.5810/0.5229 | ton/MWh | ||
| 30 | 0.001 | - | 74 | 0.3 | |||
| 31 | 0.95 | - | 75 | 0.18/0.252 | |||
| 32 | 0.95 | - | 76 | 100/140 | CNY/MWh | ||
| 33 | 0.08 | h−1 | 77 | 1.4162 | MWh/ton | ||
| 34 | 0.08 | h−1 | 78 | 1.31 | |||
| 35 | 0.075 | - | 79 | 0.7 | |||
| 36 | 0.9 | - | 80 | 300/360 | CNY/MWh | ||
| 37 | 0.001 | - | 81 | 3.5/4.2 | CNY/m3 | ||
| 38 | 0.95 | - | 82 | 6.5/5.2 | CNY/m3 | ||
| 39 | 0.95 | - | 83 | 734/954 | MWh/ton | ||
| 40 | 0.042 | h−1 | 84 | 900/1080 | MWh/ton | ||
| 41 | 0.042 | h−1 | 85 | 0.682 | CNY/m3 | ||
| 42 | 23.44 | W/(m2·K) | 86 | 40 | CNY/MWh | ||
| 43 | 1006/1207.2 | m2 | 87 | 40 | CNY/MWh | ||
| 44 | 1.097 | kJ/(kg·K) | 88 | 50 | CNY/MWh |
Table A2.
Values of time-varying electricity purchasing price in Case study.
Table A2.
Values of time-varying electricity purchasing price in Case study.
| Time | |
|---|---|
| 0:00–1:00 | 0.0259 |
| 1:00–2:00 | 0.0259 |
| 2:00–3:00 | 0.0259 |
| 3:00–4:00 | 0.0259 |
| 4:00–5:00 | 0.0259 |
| 5:00–6:00 | 0.0259 |
| 6:00–7:00 | 0.0259 |
| 7:00–8:00 | 0.0259 |
| 8:00–9:00 | 0.1035 |
| 9:00–10:00 | 0.1035 |
| 10:00–11:00 | 0.1035 |
| 11:00–12:00 | 0.1035 |
| 12:00–13:00 | 0.0607 |
| 13:00–14:00 | 0.0607 |
| 14:00–15:00 | 0.0607 |
| 15:00–16:00 | 0.0607 |
| 16:00–17:00 | 0.0607 |
| 17:00–18:00 | 0.1035 |
| 18:00–19:00 | 0.1035 |
| 19:00–20:00 | 0.1035 |
| 20:00–21:00 | 0.1035 |
| 21:00–22:00 | 0.0607 |
| 22:00–23:00 | 0.0607 |
| 23:00–24:00 | 0.0607 |
Table A3.
Values of time-varying wind speed and radiation intensity in Case study.
Table A3.
Values of time-varying wind speed and radiation intensity in Case study.
| Time | (m/s) | (kW/m2) | ||||||
|---|---|---|---|---|---|---|---|---|
| Spring | Summer | Autumn | Winter | Spring | Summer | Autumn | Winter | |
| 0:00–1:00 | 5.54 | 4.50 | 4.58 | 5.17 | 0.000 | 0.000 | 0.000 | 0.000 |
| 1:00–2:00 | 5.38 | 4.33 | 4.42 | 5.00 | 0.000 | 0.000 | 0.000 | 0.000 |
| 2:00–3:00 | 5.23 | 4.17 | 4.25 | 4.83 | 0.000 | 0.000 | 0.000 | 0.000 |
| 3:00–4:00 | 5.15 | 4.08 | 4.17 | 4.75 | 0.000 | 0.000 | 0.000 | 0.000 |
| 4:00–5:00 | 5.08 | 4.00 | 4.08 | 4.67 | 0.000 | 0.006 | 0.000 | 0.000 |
| 5:00–6:00 | 5.00 | 3.92 | 4.00 | 4.58 | 0.015 | 0.018 | 0.012 | 0.000 |
| 6:00–7:00 | 4.96 | 3.88 | 3.96 | 4.54 | 0.045 | 0.054 | 0.036 | 0.026 |
| 7:00–8:00 | 4.92 | 3.83 | 3.92 | 4.50 | 0.113 | 0.135 | 0.091 | 0.065 |
| 8:00–9:00 | 4.92 | 3.83 | 3.92 | 4.50 | 0.279 | 0.334 | 0.224 | 0.160 |
| 9:00–10:00 | 4.92 | 3.83 | 3.92 | 4.50 | 0.430 | 0.515 | 0.345 | 0.246 |
| 10:00–11:00 | 5.08 | 4.00 | 4.08 | 4.67 | 0.528 | 0.632 | 0.424 | 0.302 |
| 11:00–12:00 | 5.23 | 4.17 | 4.25 | 4.83 | 0.559 | 0.668 | 0.448 | 0.320 |
| 12:00–13:00 | 5.46 | 4.42 | 4.50 | 5.08 | 0.566 | 0.677 | 0.454 | 0.324 |
| 13:00–14:00 | 5.69 | 4.67 | 4.75 | 5.33 | 0.551 | 0.659 | 0.442 | 0.315 |
| 14:00–15:00 | 5.85 | 4.83 | 4.92 | 5.50 | 0.476 | 0.569 | 0.381 | 0.272 |
| 15:00–16:00 | 6.00 | 5.00 | 5.08 | 5.67 | 0.340 | 0.406 | 0.272 | 0.194 |
| 16:00–17:00 | 6.08 | 5.08 | 5.17 | 5.75 | 0.189 | 0.226 | 0.151 | 0.108 |
| 17:00–18:00 | 6.15 | 5.17 | 5.25 | 5.83 | 0.068 | 0.081 | 0.054 | 0.000 |
| 18:00–19:00 | 6.08 | 5.08 | 5.17 | 5.75 | 0.000 | 0.018 | 0.000 | 0.000 |
| 19:00–20:00 | 6.00 | 5.00 | 5.08 | 5.67 | 0.000 | 0.000 | 0.000 | 0.000 |
| 20:00–21:00 | 5.85 | 4.83 | 4.92 | 5.50 | 0.000 | 0.000 | 0.000 | 0.000 |
| 21:00–22:00 | 5.77 | 4.75 | 4.83 | 5.42 | 0.000 | 0.000 | 0.000 | 0.000 |
| 22:00–23:00 | 5.62 | 4.58 | 4.67 | 5.25 | 0.000 | 0.000 | 0.000 | 0.000 |
| 23:00–24:00 | 5.54 | 4.50 | 4.58 | 5.17 | 0.000 | 0.000 | 0.000 | 0.000 |
Table A4.
Values of time-varying parameters related to low-temperature waste heat in Case study.
Table A4.
Values of time-varying parameters related to low-temperature waste heat in Case study.
| Time | (°C) | (°C) | ||||||
|---|---|---|---|---|---|---|---|---|
| Spring | Summer | Autumn | Winter | Spring | Summer | Autumn | Winter | |
| 0:00–1:00 | 166.79 | 164.81 | 166.79 | 178.16 | 48.28 | 47.71 | 48.28 | 51.57 |
| 1:00–2:00 | 159.01 | 156.13 | 159.01 | 170.36 | 46.03 | 45.19 | 46.03 | 49.31 |
| 2:00–3:00 | 165.77 | 183.42 | 165.77 | 160.04 | 47.99 | 53.10 | 47.99 | 46.33 |
| 3:00–4:00 | 168.33 | 164.44 | 168.33 | 181.98 | 48.73 | 47.60 | 48.73 | 52.68 |
| 4:00–5:00 | 158.40 | 160.19 | 158.40 | 161.67 | 45.85 | 46.37 | 45.85 | 46.80 |
| 5:00–6:00 | 173.23 | 182.68 | 173.23 | 161.45 | 50.15 | 52.88 | 50.15 | 46.74 |
| 6:00–7:00 | 243.41 | 324.56 | 243.41 | 180.42 | 70.46 | 93.95 | 70.46 | 52.23 |
| 7:00–8:00 | 351.45 | 366.82 | 351.45 | 321.39 | 101.74 | 106.19 | 101.74 | 93.03 |
| 8:00–9:00 | 363.29 | 368.73 | 363.29 | 369.29 | 105.16 | 106.74 | 105.16 | 106.90 |
| 9:00–10:00 | 363.02 | 367.44 | 363.02 | 373.95 | 105.08 | 106.36 | 105.08 | 108.25 |
| 10:00–11:00 | 358.35 | 352.11 | 358.35 | 364.56 | 103.73 | 101.93 | 103.73 | 105.53 |
| 11:00–12:00 | 304.05 | 264.79 | 304.05 | 348.73 | 88.01 | 76.65 | 88.01 | 100.95 |
| 12:00–13:00 | 254.10 | 269.66 | 254.10 | 258.86 | 73.55 | 78.06 | 73.55 | 74.93 |
| 13:00–14:00 | 318.94 | 281.13 | 318.94 | 347.69 | 92.32 | 81.38 | 92.32 | 100.65 |
| 14:00–15:00 | 380.00 | 380.00 | 380.00 | 374.23 | 110.00 | 110.00 | 110.00 | 108.33 |
| 15:00–16:00 | 370.63 | 356.78 | 370.63 | 380.00 | 107.29 | 103.28 | 107.29 | 110.00 |
| 16:00–17:00 | 346.41 | 359.37 | 346.41 | 350.92 | 100.28 | 104.03 | 100.28 | 101.58 |
| 17:00–18:00 | 319.27 | 351.46 | 319.27 | 272.66 | 92.42 | 101.74 | 92.42 | 78.93 |
| 18:00–19:00 | 266.60 | 277.46 | 266.60 | 258.64 | 77.17 | 80.32 | 77.17 | 74.87 |
| 19:00–20:00 | 306.11 | 352.27 | 306.11 | 286.71 | 88.61 | 101.97 | 88.61 | 83.00 |
| 20:00–21:00 | 326.79 | 336.70 | 326.79 | 341.46 | 94.60 | 97.47 | 94.60 | 98.84 |
| 21:00–22:00 | 300.21 | 242.98 | 300.21 | 341.82 | 86.90 | 70.34 | 86.90 | 98.95 |
| 22:00–23:00 | 247.84 | 253.51 | 247.84 | 250.19 | 71.74 | 73.38 | 71.74 | 72.42 |
| 23:00–24:00 | 211.29 | 177.25 | 211.29 | 243.42 | 61.16 | 51.31 | 61.16 | 70.47 |
References
- International Energy Agency. CO2 Emissions in 2022; International Energy Agency: Paris, France, 2023. [Google Scholar]
- Ministry of Industry and Information Technology. Notice of the Ministry of Industry and Information Technology and Other Six Departments on the Issuance of Industrial Energy Efficiency Improvement Action Plan. 2022. Available online: http://www.gov.cn/zhengce/zhengceku/2022-06/29/content_5698410.htm (accessed on 23 June 2022).
- Office of Energy Efficiency & Renewable Energy. DOE Industrial Decarbonization Roadmap. 2022. Available online: https://www.energy.gov/eere/doe-industrial-decarbonization-roadmap (accessed on 23 February 2023).
- Department for Business, Energy and Industrial Energy. Industrial Decarbonisation Strategy. 2021. Available online: https://www.gov.uk/government/publications/industrial-decarbonisation-strategy (accessed on 1 April 2021).
- Engel, H.; Helmcke, S.; Heuss, R.; Hieronimus, S. Net-Zero Germany: Chances and Challenges on the Path to Climate Neutrality by 2045. 2021. Available online: https://www.mckinsey.com/capabilities/sustainability/our-insights/net-zero-germany-chances-and-challenges-on-the-path-to-climate-neutrality-by-2045 (accessed on 19 October 2021).
- Kyriakopoulos, G.L. Should Low Carbon Energy Technologies Be Envisaged in the Context of Sustainable Energy Systems? Academic Press: Cambridge, MA, USA, 2021; pp. 357–389. [Google Scholar]
- Kovač, A.; Paranos, M.; Marciuš, D. Hydrogen in energy transition: A review. Int. J. Hydrogen Energy 2021, 46, 10016–10035. [Google Scholar] [CrossRef]
- Mikulčić, H.; Skov, I.R.; Dominković, D.F.; Alwi, S.R.W.; Manan, Z.A.; Tan, R.; Duić, N.; Mohamad, S.N.H.; Wang, X. Flexible Carbon Capture and Utilization technologies in future energy systems and the utilization pathways of captured CO2. Renew. Sustain. Energy Rev. 2019, 114, 109338. [Google Scholar] [CrossRef]
- Weinand, J.M.; Scheller, F.; McKenna, R. Reviewing energy system modelling of decentralized energy autonomy. Energy 2020, 203, 117817. [Google Scholar] [CrossRef]
- Kabeyi, M.J.B.; Olanrewaju, O.A. Sustainable Energy Transition for Renewable and Low Carbon Grid Electricity Generation and Supply. Front. Energy Res. 2022, 9, 1032. [Google Scholar] [CrossRef]
- Drosos, D.; Kyriakopoulos, G.L.; Arabatzis, G.; Tsotsolas, N. Evaluating Customer Satisfaction in Energy Markets Using a Multicriteria Method: The Case of Electricity Market in Greece. Sustainability 2020, 12, 3862. [Google Scholar] [CrossRef]
- Van den Bergh, J.; Botzen, W. Low-carbon transition is improbable without carbon pricing. Proc. Natl. Acad. Sci. USA 2020, 117, 23219–23220. [Google Scholar] [CrossRef]
- Guo, H.; Chen, Q.; Xia, Q.; Kang, C. Modeling Strategic Behaviors of Renewable Energy with Joint Consideration on Energy and Tradable Green Certificate Markets. IEEE Trans. Power Syst. 2020, 35, 1898–1910. [Google Scholar] [CrossRef]
- Liang, Z.; Zhangyi, L.; Wei, P.; Hao, X.; Rui, S.; Jun, H.; Xuefeng, L. Tie-line power control method for an industrial park based on integrated demand response. Electr. Power Eng. Technol. 2021, 40, 106–113. [Google Scholar]
- Yue, Q.; Shuai, L.; Hai, L.; Enbo, L.; Wei, G.; Wennan, Z. Flexibility of Integrated Energy System: Basic Connotation, Mathematical Model and Research Framework. Autom. Electr. Power Syst. 2022, 46, 16–43. [Google Scholar]
- Pengcheng, Z.; Jian, X.; Yuanzhang, S.; Deping, K.; Siyang, L. Low-carbon development mode for energy system of iron and steel park driven by hydrogen energy. Autom. Electr. Power Syst. 2022, 46, 10–20. [Google Scholar]
- Xiandong, X.; Wenliang, S.; Yunfan, C.; Xiaodan, Y.; Hongjie, J. A perspective on electricity flexibility of integrated energy systems in processing industries. J. Tianjin Univ. Sci. Technol. 2021, 54, 1212–1220. [Google Scholar]
- Bogdanov, D.; Gulagi, A.; Fasihi, M.; Breyer, C. Full energy sector transition towards 100% renewable energy supply: Integrating power, heat, transport and industry sectors including desalination. Appl. Energy 2021, 283, 116273. [Google Scholar] [CrossRef]
- Sun, J.; Ruze, N.; Zhang, J.; Shi, J.; Shen, B. Capacity planning and optimization for integrated energy system in industrial park considering environmental externalities. Renew. Energy 2021, 167, 56–65. [Google Scholar] [CrossRef]
- Chen, Q.; Lv, M.; Gu, Y.; Yang, X.; Tang, Z.; Sun, Y.; Jiang, M. Hybrid Energy System for a Coal-Based Chemical Industry. Joule 2018, 2, 607–620. [Google Scholar] [CrossRef]
- Mardan, N.; Klahr, R. Combining optimisation and simulation in an energy systems analysis of a Swedish iron foundry. Energy 2012, 44, 410–419. [Google Scholar] [CrossRef]
- Yuan, J.; Li, Y.; Luo, X.; Zhang, Z.; Ruan, Y.; Zhou, Q. A new hybrid multi-criteria decision-making approach for developing integrated energy systems in industrial parks. J. Clean. Prod. 2020, 270, 122119. [Google Scholar] [CrossRef]
- Siyun, Y.; Chen, W.; Dengji, Z. Optimization of integrated electricity and gas system considering hydrogen-natural-gas mixture transportation. Electr. Power Eng. Technol. 2021, 40, 10–16+49. [Google Scholar]
- Jiang, Z.; Hao, R.; Ai, Q.; Yu, Z.; Xiao, F. Extended multi-energy demand response scheme for industrial integrated energy system. IET Gener. Transm. Distrib. 2018, 12, 3186–3192. [Google Scholar] [CrossRef]
- Aidong, Z.; Yuhang, Z.; Sipeng, H.; Jia, N.; Lianghua, N. Comprehensive demand response strategy of industrial users in the park considering the stepped carbon trading mechanism. High Volt. Eng. 2022, 48, 4352–4363. [Google Scholar]
- Zhu, X.; Yang, J.; Pan, X.; Li, G.; Rao, Y. Regional integrated energy system energy management in an industrial park considering energy stepped utilization. Energy 2020, 201, 117589. [Google Scholar] [CrossRef]
- Xu, Z.; Han, G.; Liu, L.; Martinez-Garcia, M.; Wang, Z. Multi-Energy Scheduling of an Industrial Integrated Energy System by Reinforcement Learning-Based Differential Evolution. IEEE Trans. Green Commun. Netw. 2021, 5, 1077–1090. [Google Scholar] [CrossRef]
- Fennell, P.S.; Davis, S.J.; Mohammed, A. Decarbonizing cement production. Joule 2021, 5, 1305–1311. [Google Scholar] [CrossRef]
- Statista. Cement Production Worldwide from 1995 to 2022. 2023. Available online: https://www.statista.com/statistics/1087115/global-cement-production-volume/#:~:text=Feb%203%2C%202023,industry%20has%20grown%20since%20then (accessed on 23 January 2023).
- Woetzel, J.; Xu, H.; Wang, X.; Liao, X. China Accelerates towards Carbon Neutrality: Pathways to Carbon Reduction in the Cement Industry; McKinsey&Company: Atlanta, GA, USA, 2021. [Google Scholar]
- Rissman, J.; Bataille, C.; Masanet, E.; Aden, N.; Morrow, W.R.; Zhou, N.; Elliott, N.; Dell, R.; Heeren, N.; Huckestein, B.; et al. Technologies and policies to decarbonize global industry: Review and assessment of mitigation drivers through 2070. Appl. Energy 2020, 266, 114848. [Google Scholar] [CrossRef]
- Ali, M.B.; Saidur, R.; Hossain, M.S. A review on emission analysis in cement industries. Renew. Sustain. Energy Rev. 2011, 15, 2252–2261. [Google Scholar] [CrossRef]
- Madlool, N.A.; Saidur, R.; Rahim, N.A.; Kamalisarvestani, M. An overview of energy savings measures for cement industries. Renew. Sustain. Energy Rev. 2013, 19, 18–29. [Google Scholar] [CrossRef]
- Decao, X.; Xiantao, L.; Nan, L.; Yihan, W.; Heng, C.; Peiyuan, P. Performance analysis of waste heat deep utilization of cement plant based on carbon dioxide capture. Clean Coal Technol. 2023, 1–18. [Google Scholar]
- Yonghua, D. Theoretical and Experimental Study on Oxygen Enriched Combustion Technology in Cement Industry; Xi’an University of Architecture and Technology: Xi’an, China, 2015. [Google Scholar]
- Teixidó, J.; Verde, S.F.; Nicolli, F. The impact of the EU Emissions Trading System on low-carbon technological change: The empirical evidence. Ecol. Econ. 2019, 164, 106347. [Google Scholar] [CrossRef]
- Wang, H.; Chen, Z.; Wu, X.; Nie, X. Can a carbon trading system promote the transformation of a low-carbon economy under the framework of the porter hypothesis?—Empirical analysis based on the PSM-DID method. Energy Policy 2019, 129, 930–938. [Google Scholar] [CrossRef]
- Li, X.; Wang, W.; Wang, H.; Wu, J.; Fan, X.; Xu, Q. Dynamic environmental economic dispatch of hybrid renewable energy systems based on tradable green certificates. Energy 2020, 193, 116699. [Google Scholar] [CrossRef]
- Yu, X.; Dong, Z.; Zhou, D.; Sang, X.; Chang, C.T.; Huang, X. Integration of tradable green certificates trading and carbon emissions trading: How will Chinese power industry do? J. Clean. Prod. 2021, 279, 123485. [Google Scholar] [CrossRef]
- Moya, J.A.; Boulamanti, A. Production Costs from Energy-Intensive Industries in the EU and Third Countries; The European Commission: Brussels, Belgium, 2016. [Google Scholar]
- Qiu, Y.; Zhou, S.; Gu, W.; Ding, S.; Han, G.; Zhang, K.; Lv, H. Multi-stage flexible planning of regional electricity-HCNG-integrated energy system considering gas pipeline retrofit and expansion. IET Renew. Power Gener. 2022, 16, 3339–3367. [Google Scholar] [CrossRef]
- Marocco, P.; Ferrero, D.; Martelli, E.; Santarelli, M.; Lanzini, A. An MILP approach for the optimal design of renewable battery-hydrogen energy systems for off-grid insular communities. Energy Convers. Manag. 2021, 245, 114564. [Google Scholar] [CrossRef]
- He, T.; Cao, Y.; Si, F. Thermodynamic analysis and optimization of a compressed carbon dioxide energy storage system coupled with a combined heating and power unit. Energy Convers. Manag. 2023, 277, 116618. [Google Scholar] [CrossRef]
- Zhang, Y.; Hao, J.; Ge, Z.; Zhang, F.; Du, X. Optimal clean heating mode of the integrated electricity and heat energy system considering the comprehensive energy-carbon price. Energy 2021, 231, 120919. [Google Scholar] [CrossRef]
- Samy, M.M.; Mosaad, M.I.; Barakat, S. Optimal economic study of hybrid PV-wind-fuel cell system integrated to unreliable electric utility using hybrid search optimization technique. Int. J. Hydrogen Energy 2021, 46, 11217–11231. [Google Scholar] [CrossRef]
- Hemmati, M.; Mirzaei, M.A.; Abapour, M.; Zare, K.; Mohammadi-Ivatloo, B.; Mehrjerdi, H.; Marzband, M. Economic-environmental analysis of combined heat and power-based reconfigurable microgrid integrated with multiple energy storage and demand response program. Sustain. Cities Soc. 2021, 69, 102790. [Google Scholar] [CrossRef]
- GB/T 26281-2021; Methods for the Calculation of Heat Balance, Heat Efficiency and Comprehensive Energy Consumption of Cement Rotary Kiln. State Administration for Market Regulation; Standardization Administration of the People’s Republic of China: Beijing, China, 2021.
- Fan, Y.; Liu, E.; Pan, J.; Qiao, J.; Li, W.; Zhang, W.; Liu, C. Waste heat recovery and utilization system of cement clinker production line and energy saving analysis. Energy Conserv. 2020, 39, 101–103. [Google Scholar]
- Laribi, S.; Dubois, L.; De Weireld, G.; Thomas, D. Study of the post-combustion CO2 capture process by absorption-regeneration using amine solvents applied to cement plant flue gases with high CO2 contents. Int. J. Greenh. Gas Control 2019, 90, 102799. [Google Scholar] [CrossRef]
- Yihan, W. Integration and Optimization of Deep Waste Heat Utilization Systems in Cement Plants Based on System Coupling and Carbon Dioxide Capture; North China Electric Power University: Beijing, China, 2022. [Google Scholar]
- Yang, C.; Peng, Z.; Wuzhi, Z.; Zheng, W.; Peng, Z.; Yuting, Z. Low-carbon economic dispatch of electro-gas-thermal integrated energy system based on oxy-combustion technology. Proc. CSEE 2021, 41, 592–608. [Google Scholar]
- Liu, X.; Zhou, X.; Zhu, B.; He, K.; Wang, P. Measuring the maturity of carbon market in China: An entropy-based TOPSIS approach. J. Clean. Prod. 2019, 229, 94–103. [Google Scholar] [CrossRef]
- Chun, Q.; Zhanfeng, Y.; Yi, F.; Jianhu, Y. Optimal operation of hybrid energy storage integrated micro-energy network considering carbon quote. Electr. Power Eng. Technol. 2022, 41, 119–127. [Google Scholar]
- Zhao, L.; Hongzhi, L.; Weijie, Z.; Xin, S.; Xin, L.; Yunrui, L. Collaborative operation optimization of cross-border integrated energy system considering joint trading of carbon and green certificates. Electr. Power Autom. Equip. 2023. [Google Scholar]


Disclaimer/Publisher’s Note: The statements, opinions and data contained in all publications are solely those of the individual author(s) and contributor(s) and not of MDPI and/or the editor(s). MDPI and/or the editor(s) disclaim responsibility for any injury to people or property resulting from any ideas, methods, instructions or products referred to in the content. |
© 2023 by the authors. Licensee MDPI, Basel, Switzerland. This article is an open access article distributed under the terms and conditions of the Creative Commons Attribution (CC BY) license (https://creativecommons.org/licenses/by/4.0/).