Abstract
The scope of this work is to improve the SAW process understanding and present an improved description of the SAW process in terms of gas-slag-metal reactions with alloy powder and Al powder additions. The scope does not include the materials properties of the weld metal. The latter may easily be optimised in the future by changing the weld metal chemistry once the process reactions of different element powders in SAW are understood. Aluminium as de-oxidiser element was applied to SAW to lower the oxygen partial pressure in the process. The results show the Al-Ni-Cr-Co-Cu alloyed weld metal total oxygen content was reduced to 257 ppm O, compared to the base case weld metal at 499 ppm O, made with the same flux and no metal powder additions. Thus, the aluminium that was added as a de-oxidiser element to the SAW process effectively lowered the original flux-induced partial oxygen pressure, both in the arc cavity and at the interface of the molten flux–weld pool phases. This partial oxygen pressure lowering effect of Al also prevents oxidation of Cr, preventing loss of Cr to the slag. Carbon steel was alloyed to 3.9% Al, 4.8% Ni, 4.9% Cr, 4.8% Co, 4.7% Cu at 62% Al yield, 76% Ni yield, 77% Cr yield, 75% Co yield, 74% Cu yield. SEM (scanning electron microscope) work on the three-dimensional (3D) post-weld slag sample show dome cavities with 3D rounded structures embedded in the dome cavity walls, as well as shards and nano-strands on the dome cavity walls. The 3D structures indicate vapour formation and re-condensation of oxy-fluorides. The novel application of the EERZ (effective equilibrium reaction zone) model simulates the mass transfer effects in the SAW process. This model is novel because it is the first model used to calculate the gas-slag-metal phase chemistry changes in SAW as a function of welding time. The novel SAW process modification of adding Al de-oxidiser powder with alloying element powders of the unique combination of Co-Cr-Co-Ni-Al was successfully applied. The results confirm that the gas phase and its reactions must be included in the interpretation and modelling of SAW process metallurgy.
Keywords:
pyrometallurgy; metal powder; nickel; cobalt; chromium; copper; partial oxygen pressure; aluminium; de-oxidiser; welding; time; mass transfer; slag; EERZ 1. Introduction
Submerged arc welding (SAW) is used to join thick steel plates because it is a high heat-input welding process [1]. The SAW process is also applied in cladding and in hard-facing operations in which a layer of overlay material is welded onto the underlying substrate material [2]. The fundamental aspects of SAW process metallurgy remain the same, despite these different SAW process applications. The SAW deposition rate can be improved significantly by adding metal powders to the process since only up to 20% of the arc energy is used to melt the weld wire [3,4,5,6]. The added metal powder may be in the form of iron metal, ferro-alloys, or pre-alloyed powders [3,4,7]. A significant disadvantage of using pre-alloyed materials is that the manufacturing process is a time consuming process. From a technical point of view the main disadvantage of using pre-alloyed consumables in the form of solid weld wires or pre-alloyed powders is that these formulations cannot closely match all desired alloy compositions. A more efficient use of metal powders is to apply unconstrained metal powders in SAW to alloy the weld metal, so removing the expense and time of manufacturing pre-alloyed powders. Here, as in the authors’ previous similar works the terminology of “unconstrained metal powders” refers to non-alloyed metal powders which are not constrained in tubular wire, such as flux cored and metal-cored wire. In a series of studies by the authors, various combinations of metal powders with Al as a de-oxidiser element were applied in SAW [8,9,10,11,12,13,14,15,16,17,18]. The aluminium powder added as de-oxidiser element lowers the partial oxygen pressure at the interface of the molten flux–weld pool phases. In addition, this aluminium de-oxidiser element also lowers the oxygen partial pressure in the arc cavity [8,9,16,17,18].
These studies illustrated that the added aluminium powder controls the weld metal total ppm O in the alloying of the weld metal with titanium-containing unconstrained metal powder formulations [10,11,14] and with chromium-containing unconstrained metal powder formulations [12,13,14,16,17,18]. The importance of controlling the weld metal total ppm O is to ensure high impact toughness of the steel. The aim band of weld metal total ppm O in carbon steel is typically 200–500 ppm O [19]. Oxygen potential control due to aluminium powder additions improves the element yield from the alloying metal powder to the weld metal. This effect is due to the prevention of oxidation of the alloying metal powders, especially the oxidation of high oxygen affinity metals such as chromium and titanium. These elements are not easily transferred across the arc under typical SAW process metallurgical conditions because these elements are easily oxidised, especially in the arc [20].
Many studies contributed to the current understanding of the functioning of the SAW process. Specifically, the determining factors in controlling the weld metal total ppm O. Precise experimental work proofed that the weld metal total ppm O is set by the flux chemistry because the oxides in the flux decompose in the arc plasma to release oxygen in the arc cavity [21,22]. The welding consumables industry uses the empirical relationship of flux basicity vs. weld metal total ppm as a development and selection guideline. This empirical relationship was developed by Tuliani et al. [23]. The flux basicity (BI) is calculated as in Equation (1) by applying mass% values. The empirical data plot shows that the weld metal total ppm O is constant at a value of 250 ppm O for BI values larger than 1.5 [23].
Attaining the relatively low weld metal ppm O value of 250 ppm O, when using an oxide-based flux, is achieved due to the addition of CaF2 which dilutes the oxides in the flux formulation. Additionally, the added CaF2, or other fluoride compounds in the flux, form fluoride gas species in the arc cavity which results in a lowered partial oxygen pressure in the arc cavity [22,24]. The target weld metal total ppm O values of 200–500 ppm O are much lower than the initial oxygen quantity in the weld pool. The latter ppm O value has been shown to be much higher from detailed experimental works, at 2000–3000 ppm O [25,26]. Although most process studies ignored the role of the gas phase in SAW, it is well-accepted that slag–metal equilibrium is not attained in the SAW process [27]. Recent detailed studies measured the real-time gas phase composition and physical phenomena in the SAW arc cavity [28]. The gas phase analyses confirmed that the dominant elements measured in the arc cavity is flux chemistry dependent [1,28]. For example, the elements Ca, Mg, Na, Mn, O, F, and K were analysed in the arc cavity gas phase since these are mainly the elements in the flux formulation. The elements Cl, Fe, and H were also analysed, of which H is typically sourced from moisture in the flux and Fe picked up from Fe vaporised from the steel plate and weld wire [1,28]. Therefore, the flux chemistry sets the gas phase speciation in the arc cavity. From the above discussion it is clear that the gas phase in the SAW arc cavity is an important reaction zone that should be taken into account in the interpretation and modelling of process effects.
Aluminium is typically avoided as an addition into SAW because it is easily oxidised and may form slag or excessive quantities of oxides in the weld metal. The resultant effect is that the weld metal total ppm O is too high and inferior materials properties are obtained. High levels of Al are applied in steel formulations of low-density/high-entropy steels and low-density stainless steels [29,30]. It follows that the effective application of aluminium in the SAW process can enable the use of SAW in manufacturing based on higher aluminium content steels, especially the use of Al in combination with different alloying elements.
Previous studies illustrated that gas–slag–metal equilibrium calculations are required to accurately calculate the weld metal total ppm O quantity for a particular flux formulation, and that slag–metal equilibrium calculations are insufficient [31,32]. Therefore, the importance of the gas phase in these calculations is clear. The gas-slag-metal equilibrium was also applied to better understand the effect of Al de-oxidiser in SAW [9,16,17,18]. However, the latter calculations only included the flux and metal powders and did not calculate the weld metal composition. Furthermore, when the gas–slag–metal equilibrium model was applied, to simulate the overall SAW process with metal powder additions, the calculation results produced weld metal analyses much different to the analysed weld metal. This observation confirmed that the mass transfer effects in metal powder alloying elements transfer are required as part of the calculations to simulate the SAW process accurately. In this work a timed thermodynamic model is applied in the format of an EERZ (effective equilibrium reaction zone) model to simulate mass transfer effects in the SAW process with unconstrained metal powders applied.
The authors conducted several studies on aluminium-assisted alloying of the weld metal in SAW with the elements of Co and Ni included in unconstrained metal powder formulations of Al-Co, Al-Co-Cr, Al-Ni, Al-Ni-Cr, Al-Co-Cr-Cu, and Al-Ni-Cr-Cu [8,9,15,16,17,18]. Here, the unique Co-Cr-Al-Cu-Ni metal powders combination is applied to the SAW process, with Al as the de-oxidiser element. The objective of this study is to clarify the gas formation behaviour in SAW, with the addition of Co-Cr-Al-Cu-Ni metal powders, through both SEM (scanning electron microscope) work and the application of a timed thermodynamic simulation model (EERZ model). This model provides the gas-slag-metal phase chemistry changes with time for the model inputs based on the welding mass balance results. The SEM work on the three-dimensional (3D) post-weld slag sample provides confirmation of gas formation and re-condensation features. Therefore, the scope of this work is to improve the SAW process understanding and present an improved description of the SAW process in terms of gas-slag-metal reactions with alloy powder and Al powder additions. The scope does not include the materials properties of the weld metal. The latter may easily be optimised in future by changing the weld metal chemistry once the process reactions of different element powders in SAW are understood.
2. Materials and Methods
The experimental details of the welding tests, the sampling of the weld metal for chemical analyses, and the chemical analyses methods used were described in detail elsewhere since a series of welds with different metal powder addition combinations were made under the same welding conditions [10,15,33]. A short description of the main particulars of the welding tests is made below in Section 2.1.
2.1. Welding Tests
The welding tests were made in the format of bead-on-plate weld runs. The weld bead length was approximately 260 mm made onto 12 mm thick carbon steel plate. Welding parameters were 500 A, 28 V at 42 cm/min. These input welding parameters translate to a heat input of 2.0 kJ/mm. The polarity used in the welding tests was set to DCEP (direct current electrode positive), and the weld wire used was 3.2 mm in diameter [15,33].
Figure 1 displays the weld metal cross-sections in photograph format, namely the base case (BC) weld metal and the MP12 weld metal. The cross sections were etched with 2% Nital solution to reveal the weld metal bead boundary in the base plate, not the microstructures.
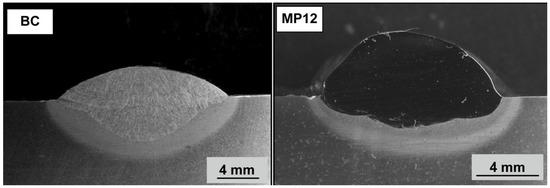
Figure 1.
Photograph of BC and MP12 weld metal cross-sections.
The base case weld was made in absence of metal powder additions. The MP12 weld metal cross section was made with the Co-Cr-Al-Cu-Ni metal powder additions of 7 g each. The commercial suppliers of the metal powders, and the metal powder purity levels are as follows: Al (99.7% Al) and Co (99.9% Co) from Sigma-Aldrich, Cu (99.8% Cu), and Ni (99.5% Ni) from GoodFellow, and Cr (99.0% Cr) from Alfa Aesar.
3. Results
3.1. Weld Metal Chemistry
The BC weld metal and the MP12 weld metal compositions are summarised in Table 1. The weld metal at the centre of the weld geometry was analysed per area as marked in Figure 2 and the analyses are displayed in Table 2. The analyses confirm that alloying of the weld metal from the added metal powders of Co, Cr, Al, Cu, and Ni occurred during the welding process. Details of the SEM (scanning electron microscope) equipment used for EDS (energy dispersive X-ray spectroscopy) analyses were described previously [15].

Table 1.
Weld metal chemistry (mass%).
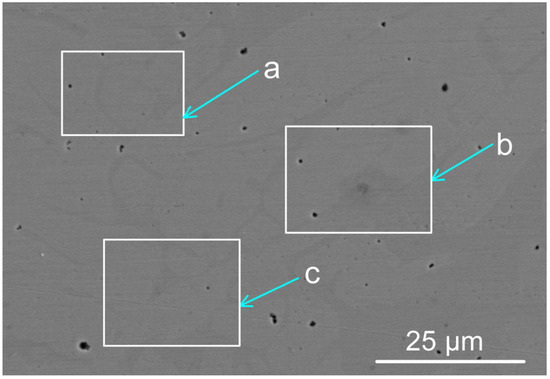
Figure 2.
Backscattered electron micrograph of MP12 weld metal (see Table 2 for the analyses per marked areas a, b, and c) (×3090).
Table 2.
SEM-EDS analyses of marked areas in Figure 2 (mass%).
The increase in %Si and %Mn in the MP12 weld metal, as compared to the base case weld metal, confirms that extra additions of these elements were made to the MP12 weld metal. The reason is that the aluminium de-oxidiser reduced part of the MnO and SiO2 from the slag via aluminothermic reduction to add manganese and silicon to the weld metal. These exothermic reduction reactions, as displayed in Equations (2) and (3), release additional heat into the weld pool.
This exothermic effect was also identified by the authors in previously reported studies on aluminium-assisted alloying of weld metal in SAW with titanium-containing unconstrained metal powder formulations [10,11,14] and chromium-containing unconstrained metal powder formulations [12,13,14,16,17,18].
Similarly, the exothermic reduction of FeO and CrO in the slag by the added Al de-oxidiser element should also be considered, see Equations (4) and (5). The exothermic reduction of FeO in the slag by the added Al de-oxidiser element powder was confirmed in previous similar works. Additionally, these works confirmed that the slag FeO content is associated with the level of the oxygen potential at the weld pool–slag interface [34,35]. Similar to FeO aluminothermic reduction, chromium oxide can be reduced by aluminium via Equation (5) [12].
( ): liquid.
3.2. Mass Balance
The mass balance was performed across the weld run to quantify the yield of the metal powder elements of Al, Ni, Cr, Co, and Cu. The mass balance measurements and calculation procedure are the same as described in detail in previous works [8,13,14,15,16,17,18]. Table 3 summarises the calculation results. The %yield is calculated as a percentage of the 7 g of Al or Ni or Cr or Co or Cu added to the weld run. Translation of the wire and metal powder mass values in Table 3 to deposition rate values indicates that the deposition rate for the MP12 weld is 7.1 kg/h, compared to 5.2 kg/h for the base case weld. Therefore, an increase of 36% was achieved with the addition of unconstrained metal powders at the same applied welding parameter settings.
Table 3.
Mass balance masses and percentage yield calculation results for Al, Ni, Cr, Co, Cu.
3.3. Exothermic Heat from Aluminothermic Reduction Reactions
Alumina is formed as the oxide product in the reactions displayed as Equations (2) and (3). Several previous studies confirmed that the alumina so formed is easily absorbed into the molten flux (slag) because the alumina-forming reactions occurred at the molten flux–weld pool interface [10,12,35]. The same calculation methods that were reported in similar previous studies were applied in this work to quantify the exothermic heat generated from the aluminothermic reduction of MnO and SiO2 according to Equations (2) and (3), [13,14,15,16,17,18]. The calculation results in Table 4 show that exothermic heat from the reactions displayed in Equations (2) and (3) was sufficiently large to increase the weld metal temperature by 58 °C.
Table 4.
Calculated exothermic heat added to the weld pool via reactions (2) and (3).
The weld metal total ppm O content as displayed in Table 1 is set firstly by the quantity of oxygen entering the weld pool from the arc cavity, and secondly by the formation and removal of oxide inclusions from the weld pool. The extent to which the inclusions may float out to the molten slag–weld pool interface is set by the weld pool solidification time [36]. The melting temperature range of the weld pool is determined by the weld pool chemistry because the solidus and liquidus temperature of an alloy is chemistry dependent. Therefore, the solidification time for a particular weld pool mass will change as the weld pool chemistry is modified by alloying. This effect is simulated in the cooling curves displayed in Figure 3 for the BC and MP12 weld metal compositions from Table 1.
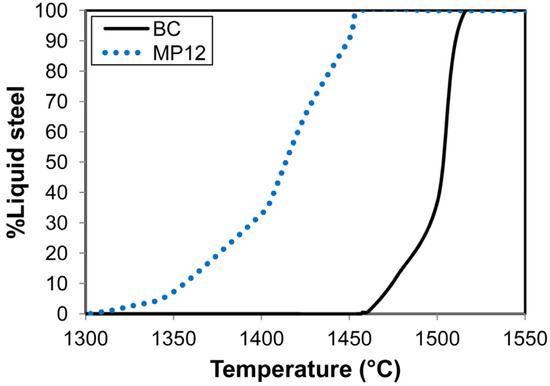
Figure 3.
Calculated solidification curves for MP12 and BC weld metal compositions.
These curves only show the mass percentage liquid steel over time, and not the solid phases, because this study is on the SAW process and not the materials properties of the weld metal. The liquidus temperatures as displayed in Figure 3 are approximately 1500 °C for the BC weld metal and 1456 °C for the MP12 weld metal. The difference in the weld metal solidus temperatures is higher. The expectation is that, for the same weld pool mass, the MP12 weld pool will take more time to solidify than the BC weld pool. The consequence is that the oxide inclusions in the MP12 weld pool have more time to float out to the molten slag–weld pool to be subsequently absorbed into the covering slag layer.
3.4. Speciation and Distribution of the Alloying Elements in Post-Weld Slag
Here, as in the authors’ recent similar studies, the methods of SEM (scanning electron microscope) imaging and EDS (energy dispersive X-ray spectroscopy) analyses were applied to the 3D post-weld slags [9,17,18,35]. The prior studies confirmed the presence of three-dimensional (3D) structures in the post-weld slags, and showed that these structures formed from vaporisation and re-condensation of oxy-fluorides [9,17,18,35]. In this study, similar 3D structures were observed in the dome cavities within the post-weld slag. Figure 4 shows the low magnification BSE (backscattered electron image) image of a large dome cavity with 3D structures embedded in the dome walls. The blocked dome wall areas in Figure 4 are shown at larger magnifications in Figure 5a, Figure 6a, Figure 7a and Figure 8a.
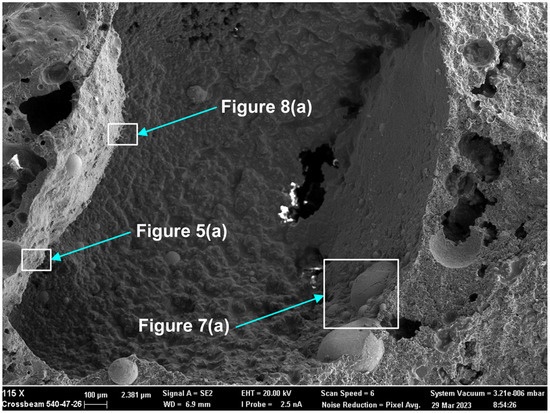
Rounded 3D structures of approximately 10 µm are present in the wall face as shown in Figure 5a. The wall matrix phase consists of Al-Mg-Ca-Si-Na-K-Ti-Fe-Mn oxy-fluoride as indicated in the EDS maps of this field of view (FOV) in Figure 5b. The rounded 3D structures’ compositions are concentrated in Mn-Fe oxy-fluoride as shown in Figure 5b, with the alloying elements of Ni, Co, Cr, and Cu also contained in lower percentages. The enlarged rounded structure in the blocked area in Figure 5a is shown in Figure 6a, and its EDS maps are shown in Figure 6b. The average EDS analyses of the FOV in Figure 5a and Figure 6a, are summarised in Table 5. Comparison of the analyses indicates differences in the average chemical compositions of the cavity wall and the rounded 3D structure, indicating less F and higher concentrations of Mn, Fe, and Co in the rounded 3D structure. As an indication of the SEM analysis quality, the maximum standard deviation value (σ) per element for the analyses reported in Table 5 is displayed in the last row of Table 5. The distribution of elements in the 3D rounded structure in Figure 6a is in the form of rosettes of less than 1 µm in diameter, containing Al-O-Mg-F-Si-Na. The rosettes are embedded in a matrix of Al-O-Mg-F-Si-Na-Cu-Na-Mn-Fe-Cr-Co. There appears to be no Ca present in the 3D rounded structure, whilst K and P appears diffuse throughout the structure.
Figure 7a shows the BSE (backscattered electron image) image in the right-side wall of the dome in Figure 4, at (659×). One large, rounded 3D structure is seen at the centre of the image, with several smaller satellite rounded 3D structures of approximately 20 µm diameter embedded in the surrounding matrix phase. According to the EDS maps in Figure 7b, the matrix phase is made of Al-Mg-Ca-Si-Na-K oxy-fluoride, as seen in the lower right corner of the image. The larger rounded 3D structure consists of Al-Mg-Si-Na-K-Ti-Ni-Mn-Fe-Cr-Co oxy-fluoride, thus containing the alloying elements of Ni, Cr and Co. The elements Ti and Cu are concentrated in the partially shown rounded 3D structure shown at the bottom of the image in Figure 7a, concentrated within the Mn-Fe oxy-fluoride in this structure. The average analyses of the FOV in Figure 7a, see Table 5, is similar to that of the FOV in Figure 5a.
The presence of alloying elements in the 3D structures are in agreement with previous similar measurements in post-weld slags from SAW formed by addition of unconstrained metal powders and confirms the vaporisation of Co, Cr, Cu, and Ni from the added metal powders [9,17,18,35]. Figure 8a shows an oxy-fluoride shard, of 2 µm cross-section size, formed at the surface of the dome wall, as marked in Figure 4. The EDS maps in Figure 8b indicate that the shard consists of Al-Ca-Si-Na-K-Mn-Fe-Na-P-Ti-Co-Cu-Ni oxy-fluoride. The Co, Cu, and Ni content of the shard appears to be very small as indicated by the faint outlines in Figure 8b. The average FOV analysis of Figure 8 and Figure 5, the cavity wall, are similar. This is expected since the shard area covers a much smaller part of Figure 8 FOV and the cavity wall covers most of Figure 8 FOV area.
Nano-scale 3D oxy-fluoride structures, similar to those previously identified in the SAW post-weld slags, were also observed in the dome cavities inside this slag as shown in Figure 9. The nano-strands in Figure 9 likely formed from re-condensation from the gas phase [9,17,18,35]. The nano-strands are too fine to resolve in the EDS analyses. The average analysis of the FOV as displayed of Figure 9 is shown in Table 5 and indicates a similar composition to the cavity wall matrix phase in Figure 5a as Al-Mg-Ca-Si-Na-K-Ti-Fe-Mn oxy-fluoride with higher Fe and Ti content.

Figure 5.
(a) Backscattered electron image at (2390×) magnification 3D structures in the dome wall of MP12 post-weld slag; (b) EDS maps of the FOV (field of view) in Figure 5a.
Figure 5.
(a) Backscattered electron image at (2390×) magnification 3D structures in the dome wall of MP12 post-weld slag; (b) EDS maps of the FOV (field of view) in Figure 5a.


Figure 6.
(a) Backscattered electron image at (19,130×) magnification of 3D structure as marked in Figure 5a; (b) EDS maps of the FOV (field of view) in Figure 6a.


Figure 7.
(a) Backscattered electron image at (659×) magnification of 3D structures in the dome wall of MP12 post-weld slag as indicated in Figure 4; (b) EDS maps of the FOV (field of view) in Figure 7a.


Figure 8.
(a) Backscattered electron image at (5490×) magnification, showing shard protruding from dome wall at the position marked in Figure 4; (b) EDS maps of the FOV (field of view) in Figure 8a.


Figure 9.
Backscattered electron image of nano-strands (see arrows) in dome structure: (29,080×).
Figure 9.
Backscattered electron image of nano-strands (see arrows) in dome structure: (29,080×).

4. Discussion
The gas–slag–metal equilibrium model by Coetsee et al. [31] confirmed that the gas phase must be included in modelling to accurately calculate the weld metal total ppm O resulting from SAW with different flux formulations, and that slag-metal equilibrium calculations are insufficient [31,32]. In the current study, similar to the authors’ previous studies, Al de-oxidiser powder and alloying metal powders were added as unconstrained powders into the SAW process. The results are in agreement with the prior main conclusion that Al de-oxidiser controls the weld metal total ppm O [8,9,10,11,12,13,14,15,16,17,18]. The de-oxidiser role of Al is to lower the partial oxygen pressure () at the weld pool-slag interface. Thermochemical calculations in the form of the gas–slag–metal powder equilibrium at the temperature of 2500 °C, representing the arc-cavity temperature, confirmed that Al(g) is also present in the arc cavity and can lower the oxygen partial pressure in the arc cavity [9,15,16,17,18]. This conclusion is in agreement with conclusive previous work that evidenced the transfer of aluminium from the flux via the gas phase in the arc cavity, into the weld metal [24]. However, the gas–slag–metal powder equilibrium calculations for 2500 °C, with Al and alloy powders included, did not calculate the weld metal composition since only the gas formation behaviour of the flux and added metal powders was investigated [9,15,16,17,18]. Furthermore, when the gas–slag–metal equilibrium model was applied, to simulate the overall SAW process with metal powder additions, the calculation results produced weld metal analyses much different to the analysed weld metal. This observation confirmed that the mass transfer effects in metal powder alloying element transfer to the weld pool are required as part of the calculations to simulate the SAW process accurately.
Improved insight into the role of gas phase reactions in the overall SAW process, especially with the addition of Al de-oxidiser with metal powders, is possible by incorporation of kinetics (time steps) into thermochemical calculations. In the following sections an EERZ (effective equilibrium reaction zone) model is applied to investigate the most likely phase chemistry changes occurring with time in the application of the unique combination of Co-Cr-Co-Ni-Al unconstrained metal powders in the SAW process.
4.1. EERZ (Effective Equilibrium Reaction Zone) Model
4.1.1. Model Background
Several studies utilised EERZ models in the kinetic modelling of steelmaking processes such as the RH (Ruhrstahl Heraeus) process and LF (ladle furnace) [37,38]. As explained by Van Ende et al. [37], in the EERZ model, all the phases within the “effective” reaction zone located next to the reaction interface are assumed to attain equilibrium, beyond only equilibrium at the reaction interface. This approach allows for the use of an effective reaction volume instead of mass-transfer coefficients [37]. Here, the SAW process is modelled by the EERZ model according to the flow diagram in Figure 10, using the temperature of 2500 °C. This temperature is applied because the initial gas phase reactions which set the weld metal oxygen levels takes place in the arc cavity which was reported to be at temperatures of 2000 to 2500 °C [39,40].
The thermochemistry calculations are performed in the Equilib module of the FactSage 7.3 thermochemical software [41]. Macro script is used to iterate the equilibrium calculations in each of the reactor units (R1 to R4) in Figure 10 for each time step and to interface with the spreadsheet-based input-output file. Application of FactSage in the calculation of the EERZ model is well described elsewhere [37,38].

Figure 10.
Timed thermodynamic model (EERZ) flow diagram applied in SAW process simulation.
Figure 10.
Timed thermodynamic model (EERZ) flow diagram applied in SAW process simulation.

4.1.2. Model Inputs
The model input masses were taken from the experimental measurements made from the MP12 weld in terms of the mass of added metal powders, mass weld wire added to the weld, mass of base plate steel melted into the weld and the post-weld slag mass representing the flux mass input to the model. These masses were scaled to three seconds of welding time since the total weld pool solidification time was previously calculated to be four seconds at the applied welding parameters (welding heat input) [31]. The weld run mass values are shown in Table 6 with the weld wire and base plate values taken from the mass balance calculated values Table 3.
Table 6.
Weld run values applied as model inputs.
Because of the high uncertainty in the factors such as the reaction area, mass transfer coefficients, and boundary layer thickness, especially when the gas phase is involved, the following approach was followed in setting the kinetic factors values (the percentage metal, slag, and gas feeding into reactor 1 (R1) in Figure 10). The base kinetic factors for the slag phase and gas phase were scaled relative to that of the metal phase since the diffusivity values of the elements in liquid iron are known. The diffusivities of elements in liquid iron are well known to be in the range of 10−5 to 10−4 cm2/s [42]. Ionic diffusivities of Si4+ and O2− in silicate slags are in the order of 4 × 10⁻⁷ to 1 × 10⁻⁶ cm2/s [42]. Therefore, the metal phase diffusivity values are at least ten times that of the ions in the slag, as previously applied in an EERZ model for the LF [43]. The gas phase diffusivity coefficient is orders of magnitude larger than that of the metal phase at 10 cm2/s, as a lower-end value [44]. Since the boundary layer thickness and the reaction area between phases are unknown, the model was iterated with the kinetic factors scaled to the metal kinetic factor values to reach the same total ppm O in the metal phase as that measured in the analysed weld metal. Since air is the main source of N in SAW, the quantity of air participating in the SAW reactions was added into the model by adjusting the air input quantity to match the ppm N to 50 ppm N, close to the analysed value in the weld metal analysis of 44 ppm N in Table 7 shown in Section 4.1.3 below.
4.1.3. Model Results and Discussion
The comparison of the model calculated weld metal composition in Table 7 to the analysed weld metal composition from Table 1 shows that the values are reasonably close. The added metal powder values (Al, Ni, Cr, Cu, Co) in the model calculations are higher than the analysed values and the opposite holds for the Si and Mn values. The important aspect is that the model accurately simulates the de-oxidiser effect of Al in lowering the weld metal total ppm O to 257 ppm O at the time endpoint.
Table 7.
Timed model (EERZ) calculated weld metal composition vs. analysed MP12 weld metal (mass%).
Table 7.
Timed model (EERZ) calculated weld metal composition vs. analysed MP12 weld metal (mass%).
| %C | %Si | %Mn | %O | %N | %Al | %P | %S | %Ni | %Cr | %Cu | %Co | %Fe | |
|---|---|---|---|---|---|---|---|---|---|---|---|---|---|
| Model | 0.068 | 0.292 | 0.882 | 0.0257 | 0.0044 | 5.165 | 0.009 | 0.011 | 5.849 | 5.844 | 5.708 | 5.855 | 70.25 |
| MP12 | 0.097 | 0.697 | 1.340 | 0.0257 | 0.0050 | 3.940 | 0.021 | 0.008 | 4.817 | 4.890 | 4.673 | 4.750 | 74.69 |
The graphs in Figure 11a,b summarise the metal phase composition vs. time. Similarly, the slag phase composition is displayed in Figure 12a,b, and the gas phase composition in Figure 13a,b. The de-oxidiser role of Al is seen from the decrease in %Al in the metal phase and the attendant increase of Al2O3 in the slag. Additionally, of importance is the presence of Al(g) in the gas phase which serves as a path of control in the arc cavity, but also as a route of Al loss from the process. The model calculations show AlF(g) and Mg(g) as the two major gas components. The Mg(g) will also have an oxygen partial pressure lowering effect in the gas phase since it is a high oxygen affinity metal.
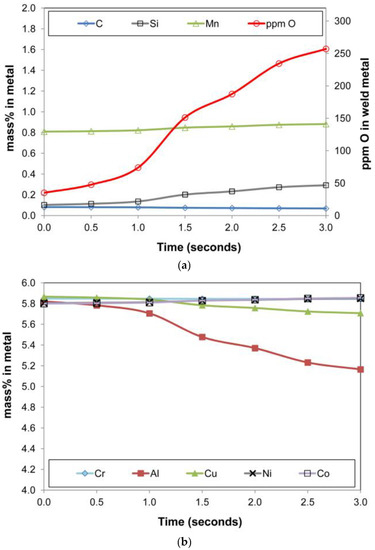
Figure 11.
(a). Timed thermodynamic model (EERZ) calculation results: ppm O, %C, %Mn, %Si in metal vs. Time. (b). Timed thermodynamic model (EERZ) calculation results: %Cr, %Al, %Cu, %Ni, %Co in metal vs. Time.
The metal phase %Cu in Figure 11b decreased over time, in line with the vaporisation of copper as shown in the gas phase chemistry in Figure 13a. The presence of both Cu(g) and Na(g) in the gas phase in Figure 13 is in agreement with the specific association of copper and sodium in the oxy-fluoride condensation patterns observed on the surface of 3D spherical structures of 2 µm diameter in the Al-Co-Cr-Cu metal powder addition weld [18]. The vaporisation of chromium is shown in Figure 13b, although the effect on the metal phase composition is limited. The model prediction for nickel and cobalt vaporisation is low since less than 0.5% of these elements are reflected in the gas composition. High concentrations of metal phase elements in the gas phase are Fe, Mn, and Si as SiO(g). The model predicted values of %Si and %Mn in the metal phase are lower than the analysed values. Therefore, the model may need refinement on the Mn and Si mass transfer effects since there appears to be too much SiO(g) and Mn(g) formation in the model calculation.
The fluoride compounds in the slag phase are displayed in Figure 12b. Although the input fluoride is CaF2 only, the slag solution model in FactSage redistributes the fluoride ions between different cations.

Figure 12.
(a). Timed thermodynamic model (EERZ) calculation results: main slag oxide components vs. Time. (b). Timed thermodynamic model (EERZ) calculation results: slag phase fluoride components vs. Time.
Figure 12.
(a). Timed thermodynamic model (EERZ) calculation results: main slag oxide components vs. Time. (b). Timed thermodynamic model (EERZ) calculation results: slag phase fluoride components vs. Time.

It is seen that the MgF2 in the slag decreased over time. This MgF2, which may also first vaporise into the gas phase, forms MgF(g) and releases of F− to form other fluorides in the gas phase. It is well known that the post-weld slag FeO content correlates with the weld metal total ppm O under conventional SAW conditions [27,35]. Interestingly, the model calculations do not show much change in the slag %FeO which is maintained at a low level of 0.95% FeO. This observation accords with the de-oxidiser effect of Al in setting the system .
The calculated gas phase composition contains large quantities of Fe(g) and Mn(g). This agrees with the EDS analyses of the Fe and Mn rich oxy-fluoride 3D structures in Figure 5 and Figure 7.

Figure 13.
(a). Timed thermodynamic model (EERZ) calculation results: gas phase main components vs. Time. (b). Timed thermodynamic model (EERZ) calculation results: gas phase minor components vs. Time.
Figure 13.
(a). Timed thermodynamic model (EERZ) calculation results: gas phase main components vs. Time. (b). Timed thermodynamic model (EERZ) calculation results: gas phase minor components vs. Time.

The effect of aluminium as a de-oxidiser element in the SAW process is better gauged by comparison of the weld metal total ppm O of 257 to the values of oxygen solubility in iron. The latter values were calculated from the literature reported equations, as translated to equivalent values by using equations from the same reference [42]. The EERZ model calculated values can be seen in Figure 14 and are in the range of log() of −5.6 to −6.3, similar to the log() values for 2000 °C to 2200 °C in Table 8. However, the ppm O values in Table 8, the soluble ppm O in iron, are much higher than the weld metal ppm O analysed (257 ppm O). Therefore, the simple slag-metal equilibrium is not applicable in the overall SAW process. The timed thermodynamic model in the form of an EERZ model provides a more accurate process description of SAW, especially with the addition of large quantities of aluminium as de-oxidiser element and its gas phase reaction behaviour. The following section highlights the role of aluminium as de-oxidiser element in the SAW process, especially the gas phase reactions involving Al.
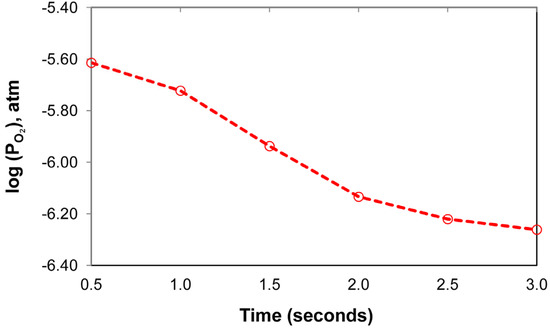
Figure 14.
Timed thermodynamic model (EERZ) calculated partial oxygen pressure vs. Time.
Table 8.
Oxygen solubility in Fe vs. Temperature.
4.2. SAW Process Metallurgy Reaction Flow Diagram for Al, Ni, Cr, Co, and Cu Metal Powder Additions
The SAW process metallurgy reaction flow diagram in Figure 15 is the combined diagram from of the diagrams published for the Al-Ni-Cr-Cu and the Al-Co-Cr-Cu unconstrained metal powder formulations [17,18]. The process understanding represented in Figure 15 accords with the timed thermodynamic model (EERZ) outputs discussed in Section 4.1.3. The reaction steps of A to E represent the accepted understanding of the transfer of oxygen from the molten flux (slag) to the weld pool [22,25,26,27,31,45].
Aluminium as de-oxidiser element in the application of unconstrained metal powders in the SAW process has the effect of lowering the oxygen potential prevailing at the molten flux–weld pool interface, and in the arc-cavity [8,9,15,16,17,18]. The aluminothermic reduction of MnO and SiO2 takes place and releases exothermic heat into the weld pool as shown in Section 3.3. Similarly, Al can reduce FeO and CrO as well. Chromium is a high oxygen affinity element and may therefore easily oxidise via E2 in Figure 15. The excess Al added to the SAW process can dissolve directly into the weld pool via reaction H. The initial low melting temperature alloy pool formed from melting of the added unconstrained metal powders is represented as reaction step Q. This effect of forming an initial low melting temperature alloy containing Cu and Al was identified in a previous study on the application of Cu-Cr-Al unconstrained metal powders to the SAW process [13].
The authors’ prior thermodynamic analysis of the relevant fluoride based simplified single gas phase reactions indicated that the reaction of F2(g) with metal vapour is favoured (reactions similar to K1–K3 in Figure 15), [8,9,15]. The source of F2 gas is the dissociation of CaF2(g), according to reaction L. Dissociation of CaF2(g) in the arc plasma appears possible, so releasing F2 gas into the arc cavity. This effect was confirmed from real-time gas phase composition analyses which measured the presence of Ca and F in the arc cavity gas phase when a CaF2 based flux was used in SAW test runs [1,28].

Figure 15.
SAW process metallurgy reaction flow diagram for Al, Ni, Cr, Co, and Cu powder additions.
Figure 15.
SAW process metallurgy reaction flow diagram for Al, Ni, Cr, Co, and Cu powder additions.

Furthermore, the formation of AlF(g), AlF2(g), and AlF3(g) is thermodynamically most favoured [15]. The implication is that the less stable gas compounds such as CrF3(g) and CoF2(g) are easily transformed to metal vapour via reaction with Al(g) as displayed as reactions M1-M3 in Figure 15. Vaporisation of the added metal powders may occur at the arc plasma–weld pool interface, as indicated in reactions I1 to I4 for Cu, Cr, Co, and Ni. The metal powders may also be vaporised before being dissolved into the initial alloy pool or into the weld pool as indicated by the dotted lines linking the steps of J, N, O, P, and H to the arc plasma cavity.
In conclusion, it is seen that this work confirms the vaporisation and re-condensation of oxy-fluorides as analysed by SEM-EDS. The oxy-fluorides contain the metal powders added in an unconstrained format to the SAW process. The presented timed thermodynamic model in the form of an EERZ model explains how aluminium added as de-oxidiser element lowers the system’s partial oxygen pressure to control the weld metal total ppm O to low values.
5. Conclusions
The novel application of the EERZ (effective equilibrium reaction zone) model simulates mass transfer effects in the SAW process. This model is novel because it is the first model used to calculate the gas-slag-metal phase chemistry changes in SAW as a function of welding time. The novel SAW process modification of adding Al de-oxidiser powder with alloying element powders of the unique combination of Co-Cr-Co-Ni-Al was successfully applied. The results confirm that the gas phase and its reactions must be included in the interpretation and modelling of SAW process metallurgy. Detailed points of conclusion from this work are:
- The combination of Al, Ni, Cr, Co, and Cu unconstrained metal powders were successfully applied in SAW to alloy carbon steel weld metal whilst controlling the total weld metal ppm O at an acceptable level.
- Nano-scale 3D oxy-fluoride structures were identified in the dome cavity of the 3D slag sample, indicating that the vaporisation and re-condensation of oxy-fluorides occurred. These oxy-fluorides also contained the elements of Co, Cr, Ni, and Cu which were added to the SAW process as unconstrained metal alloying powders.
- The EERZ (effective equilibrium reaction zone) model was developed to simulate the mass transfer effects in the SAW process. This model was successfully applied to calculate the gas-slag-metal phase chemistry changes with welding time at the arc cavity temperature of 2500 °C.
- The EERZ (effective equilibrium reaction zone) model can calculate the weld metal total ppm O accurately.
- The added unconstrained metal powders increased the deposition rate value to 7.1 kg/h, compared to 5.2 kg/h for the base case weld, representing an increase of 36% in deposition rate for the same applied welding parameters.
Author Contributions
F.D.B. as inventor conceptualised the work; F.D.B. and T.C. executed the experiments together, and interpreted the data together, and prepared the manuscript together. All authors have read and agreed to the published version of the manuscript.
Funding
This research was funded in part by the University of Pretoria.
Data Availability Statement
The data sets presented in this study are available upon reasonable request to the corresponding author, as indicated on the first page.
Conflicts of Interest
The authors declare no conflict of interest. The funders had no role in the design of the study; in the collection, analyses, or interpretation of data; in the writing of the manuscript, or in the decision to publish the results.
References
- Sengupta, V.; Havrylov, D.; Mendex, P.F. Physical phenomena in the weld zone of submerged arc welding—A Review. Weld. J. 2019, 98, 283–313. [Google Scholar]
- O’Brien, A. Welding Handbook—Materials and Applications, Part 1, 9th ed.; American Welding Society (AWS): Miami, FL, USA, 2011; Volume 4. [Google Scholar]
- Bong, W.L. System and Method for Metal Powder Welding. U.S. Patent 8,946,582 B1, 18 October 2016. [Google Scholar]
- Bailey, N. Submerged Arc Welding ferritic steels with alloyed metal powder. Weld. J. 1991, 70, 187–206. [Google Scholar]
- Nand, S.; Singh, P.K. Effect of addition of metal powder on deposition rate, mechanical properties, and metallographic property of weld joints during Submerged Arc Welding process. J. Mach. Form. Technol. 2015, 6, 159–168. [Google Scholar]
- Tušek, J.; Suban, M. High-productivity multiple-wire Submerged-Arc Welding and cladding with metal-powder addition. J. Mater. Process. Technol. 2003, 133, 207–213. [Google Scholar] [CrossRef]
- Hallén, H.; Johansson, K.-E. Use of a Metal Powder for Surface Coating by Submerged Arc Welding. U.S. Patent 6331688 B1, 18 December 2001. [Google Scholar]
- Coetsee, T.; De Bruin, F. Aluminium Assisted Nickel Alloying in Submerged Arc Welding of Carbon Steel: Application of Unconstrained Metal Powders. Appl. Sci. 2022, 12, 5392. [Google Scholar] [CrossRef]
- Coetsee, T.; De Bruin, F. Modification of Flux Oxygen Behaviour via Co-Cr-Al Unconstrained Metal Powder Additions in Submerged Arc Welding: Gas Phase Thermodynamics and 3D Slag SEM Evidence. Processes 2022, 10, 2452. [Google Scholar] [CrossRef]
- Coetsee, T.; De Bruin, F.J. Improved titanium transfer in Submerged Arc Welding of carbon steel through aluminium addition. Miner. Process. Extr. Metall. Rev. 2021, 43, 771–774. [Google Scholar] [CrossRef]
- Coetsee, T.; De Bruin, F. Application of Copper as Stabiliser in Aluminium Assisted Transfer of Titanium in Submerged Arc Welding of Carbon Steel. Processes 2021, 9, 1763. [Google Scholar] [CrossRef]
- Coetsee, T.; De Bruin, F.J. Reactions at the molten flux-weld pool interface in submerged arc welding. High Temp. Mater. Process. 2021, 40, 421–427. [Google Scholar] [CrossRef]
- Coetsee, T.; De Bruin, F. Chemical Interaction of Cr-Al-Cu Metal Powders in Aluminum-Assisted Transfer of Chromium in Submerged Arc Welding of Carbon Steel. Processes 2022, 10, 296. [Google Scholar] [CrossRef]
- Coetsee, T.; De Bruin, F. Aluminium-Assisted Alloying of Carbon Steel in Submerged Arc Welding: Application of Al-Cr-Ti-Cu Unconstrained Metal Powders. Processes 2022, 10, 452. [Google Scholar] [CrossRef]
- Coetsee, T.; De Bruin, F. Application of Unconstrained Cobalt and Aluminium Metal Powders in the Alloying of Carbon Steel in Submerged Arc Welding: Thermodynamic Analysis of Gas Reactions. Appl. Sci. 2022, 12, 8472. [Google Scholar] [CrossRef]
- Coetsee, T.; De Bruin, F. Aluminium-Assisted Alloying of Carbon Steel in Submerged Arc Welding with Al-Cr-Ni Unconstrained Metal Powders: Thermodynamic Interpretation of Gas Reactions. Processes 2022, 10, 2265. [Google Scholar] [CrossRef]
- Coetsee, T.; De Bruin, F. Chemical Behaviour of Copper in the Application of Unconstrained Cr-Ni-Al-Cu Metal Powders in Submerged Arc Welding: Gas Phase Thermodynamics and 3D Slag SEM Evidence. Processes 2023, 11, 351. [Google Scholar] [CrossRef]
- Coetsee, T.; De Bruin, F. Gas Formation of Cobalt and Copper in the Application of Unconstrained Co-Cr-Al-Cu Metal Powders in Submerged Arc Welding: Gas Phase Thermodynamics and 3D Slag SEM Evidence. Processes 2023, 11, 1116. [Google Scholar] [CrossRef]
- Dallam, C.B.; Liu, S.; Olson, D.L. Flux composition dependence of microstructure and toughness of submerged arc HSLA weldments. Weld. J. 1985, 64, 140–152. [Google Scholar]
- O’Brien, A. Welding Handbook—Welding Processes, Part 1, 9th ed.; American Welding Society (AWS): Miami, FL, USA, 1994; Volume 2. [Google Scholar]
- Eagar, T.W. Sources of weld metal oxygen contamination during submerged arc welding. Weld. J. 1978, 57, 76–80. [Google Scholar]
- Chai, C.S.; Eagar, T.W. Slag metal reactions in binary CaF2-metal oxide welding fluxes. Weld. J. 1982, 61, 229–232. [Google Scholar]
- Tuliani, S.S.; Boniszewski, T.; Eaton, N.F. Notch toughness of commercial submerged arc weld metal. Weld. Met. Fabr. 1969, 37, 327–339. [Google Scholar]
- Lau, T.; Weatherly, G.C.; Mc Lean, A. Gas/Metal/Slag reactions in Submerged Arc Welding using CaO-Al2O3 based fluxes. Weld. J. 1986, 65, 31–38. [Google Scholar]
- Polar, A.; Indacochea, J.E.; Blander, M. Electrochemically generated oxygen contamination in submerged arc welding. Weld. J. 1990, 69, 68–74. [Google Scholar]
- Lau, T.; Weatherly, G.C.; Mc Lean, A. The sources of oxygen and nitrogen contamination in submerged arc welding using CaO-Al2O3 based fluxes. Weld. J. 1985, 64, 343–347. [Google Scholar]
- Mitra, U.; Eagar, T.W. Slag metal reactions during submerged arc welding of alloy steels. Metall. Trans. B 1984, 15, 217–227. [Google Scholar] [CrossRef]
- Gött, G.; Gericke, A.; Henkel, K.-M.; Uhrlandt, D. Optical and spectroscopic study of a submerged arc welding cavern. Weld. J. 2016, 95, 491–499. [Google Scholar]
- Raabe, D.; Tasan, C.C.; Springer, H.; Bausch, M. From high-entropy alloys to high-entropy steels. Steel Res. Int. 2015, 86, 1127–1138. [Google Scholar] [CrossRef]
- Moon, J.; Ha, H.-Y.; Kim, K.-W.; Park, S.-J.; Lee, T.-H.; Kim, S.-D.; Jang, J.H.; Jo, H.-H.; Hong, H.-U.; Lee, B.H.; et al. A new class of lightweight, stainless steels with ultra-high strength and large ductility. Sci. Rep. 2020, 10, 12140. [Google Scholar] [CrossRef]
- Coetsee, T.; Mostert, R.J.; Pistorius, P.G.H.; Pistorius, P.C. The effect of flux chemistry on element transfer in Submerged Arc Welding: Application of thermochemical modelling. Mater. Res. Technol. 2021, 11, 2021–2036. [Google Scholar] [CrossRef]
- Coetsee, T.; De Bruin, F. A Review of the Thermochemical Behaviour of Fluxes in Submerged Arc Welding: Modelling of Gas Phase Reactions. Processes 2023, 11, 658. [Google Scholar] [CrossRef]
- Coetsee, T. Phase chemistry of Submerged Arc Welding (SAW) fluoride based slags. Mater. Res. Technol. 2020, 9, 9766–9776. [Google Scholar] [CrossRef]
- Coetsee, T.; De Bruin, F. In Situ Modification of CaF2-SiO2-Al2O3-MgO Flux Applied in the Aluminium-Assisted Transfer of Titanium in the Submerged Arc Welding of Carbon Steel: Process Mineralogy and Thermochemical Analysis. Minerals 2022, 12, 604. [Google Scholar] [CrossRef]
- Coetsee, T.; De Bruin, F. Insight into the Chemical Behaviour of Chromium in CaF2-SiO2-Al2O3-MgO Flux Applied in Aluminium-Assisted Alloying of Carbon Steel in Submerged Arc Welding. Minerals 2022, 12, 1397. [Google Scholar] [CrossRef]
- Kluken, A.O.; Grong, Ø. Mechanisms of inclusion formation in Al-Ti-Si-Mn deoxidized steel weld metals. Metall. Trans. A 1989, 20, 1335–1349. [Google Scholar] [CrossRef]
- Van Ende, M.-A.; Kim, Y.-M.; Cho, M.-K.; Jung, I.-H. A kinetic model for the Ruhrstahl Heraeus (RH) degassing process. Metall. Trans. B 2011, 42, 477–489. [Google Scholar] [CrossRef]
- Piva, S.P.T.; Kumar, D.; Pistorius, P.C. Modeling manganese silicate inclusion composition changes during ladle treatment using FactSage macros. Metall. Trans. B 2017, 48, 37–45. [Google Scholar] [CrossRef]
- Chai, C.S.; Eagar, T.W. Slag-metal equilibrium during submerged arc welding. Metall. Trans. B 1981, 12, 539–547. [Google Scholar] [CrossRef]
- Mitra, U.; Eagar, T.W. Slag-metal reactions during welding: Part I. Evaluation and reassessment of existing theories. Metall. Trans. B 1991, 22, 65–71. [Google Scholar] [CrossRef]
- Bale, C.W.; Bélisle, E.; Chartrand, P.; Decterov, S.; Eriksson, G.; Gheribi, A.E.; Hack, K.; Jung, I.-H.; Kang, Y.-B.; Melançon, J.; et al. Reprint of: FactSage thermochemical software and databases, 2010–2016. Calphad 2016, 55, 1–19. [Google Scholar] [CrossRef]
- Turkdogan, E.T. Fundamentals of Steelmaking; The Institute of Materials: Cambridge, UK, 1996. [Google Scholar]
- You, D.; Michelic, S.K.; Bernhard, C. Modeling of Ladle Refining Process Considering Mixing and Chemical Reaction. Steel Res. Int. 2020, 91, 2000045. [Google Scholar] [CrossRef]
- Poirier, D.R.; Geiger, G.H. Transport Phenomena in Materials Processing; TMS: Warrendale, PA, USA, 1994. [Google Scholar]
- Mitra, U.; Eagar, T.W. Slag-metal reactions during welding: Part II. Theory. Metall. Trans. B 1991, 22, 73–81. [Google Scholar] [CrossRef]


Disclaimer/Publisher’s Note: The statements, opinions and data contained in all publications are solely those of the individual author(s) and contributor(s) and not of MDPI and/or the editor(s). MDPI and/or the editor(s) disclaim responsibility for any injury to people or property resulting from any ideas, methods, instructions or products referred to in the content. |
© 2023 by the authors. Licensee MDPI, Basel, Switzerland. This article is an open access article distributed under the terms and conditions of the Creative Commons Attribution (CC BY) license (https://creativecommons.org/licenses/by/4.0/).