Article

Molecular Insight into the Occurrence Characteristics of Deep Oil with Associated Gas Methane and the Displacement Resistance in Water Flooding in Nano-Pore Throat

1
College of Science, China University of Petroleum, Qingdao 266580, China
2
School of Geosciences, China University of Petroleum, Qingdao 266580, China
3
School of Materials Science and Engineering, China University of Petroleum, Qingdao 266580, China
*
Author to whom correspondence should be addressed.
Processes 2023, 11(9), 2529; https://doi.org/10.3390/pr11092529
Submission received: 14 July 2023 / Revised: 17 August 2023 / Accepted: 21 August 2023 / Published: 23 August 2023
(This article belongs to the Special Issue Advances in Enhancing Unconventional Oil/Gas Recovery)

Abstract

:
In deep oil reservoirs, the existence of associated gas generally has a crucial impact on crude oil properties and flow performance. In this work, adopting molecular dynamic simulation, we studied the occurrence characteristics of oil with associate gas methane (the molar ratio of methane to oil rm/o were 1/4, 2/3, 3/2, and 4/1) in nano-pore throat and the displacement behavior of oil and methane in the water flooding process. Simulation results indicated: (1) an increasing replacement of the adsorption-status oil by methane as the methane content increased; (2) the oil and methane displacement efficiency was enhanced as the methane content increased in the water displacement oil and gas process; (3) the threshold displacement pressure gradually decreases as the methane content increases. The microscopic characteristics of the occurrence features and displacement performance of crude oil with associated methane in nano-pore throat were discussed in detail, and the underlying mechanism was discussed at the length concerning the interaction between different components. Our work provides an in-depth understanding of the occurrence characteristics and flow resistance of oil with associated gas in deep oil reservoirs.

1. Introduction

In recent years, with the increasing scarcity of conventional oil and gas resources, unconventional oil and gas have received extensive attention [1,2,3]. The exploration practice in recent years has proved that there are rich oil and gas resources in the deep layer of the basin under the current main series of exploration [4,5,6]. Deep oil and gas reservoirs have been found to exist all over the world. More than 1000 oil and gas fields have been discovered within deep reservoirs globally, which have huge storage content [7]. In deep oil and gas reservoirs, subsurface natural gas is mainly composed of hydrocarbon gases and several kinds of nonhydrocarbon gases [8,9]. Hydrocarbon gases, which are the most common compounds in natural gases, can be generated at all stages of organic matter thermal maturation processes.
The occurrence state characteristics of oil and gas in deep reservoirs are an important basis for enhanced oil recovery, which can provide basic data and theoretical reference for the evaluation of reservoir reserves, recoverable capacity, and the optimization of development plans [10,11]. Some studies have found that the occurrence states of deep oil and gas in the reservoir are mainly found in two forms: the free state of bulk phase in natural pores and fractures and the adsorbed oil and gas on the surface of minerals [12,13]. The proportion of oil and gas, the porosity and permeability characteristics of the reservoir, etc., affect the migration of oil and gas and the development of deep oil and gas. In terms of the occurrence characteristics of oil and gas in nano-pores, previous researchers have carried out a lot of experimental and theoretical research and achieved many valuable results. Zhao et al. measured the adsorption isotherms of methane, ethane, propane, n-butane, iso-butane, and carbon dioxide for two kinds of shales and the kerogens isolated from the two shales. They found that the adsorption of n-butane was one order of magnitude higher than that of methane (0.2 MPa and 35–65 °C) [14]. Rezlerova et al. employed Monte Carlo and molecular dynamic simulation to simulate the adsorption, self-, collective, and transport diffusivities of methane, ethane, propane, and carbon dioxide in shale kerogen micropores and mesopores [15]. The simulation results showed that the total adsorption increases with increasing pressure and decreases with increasing temperature as the pressure drives the fluid molecules into the micropores and mesopores. In the micropores, methane displays the highest adsorption, followed by ethane and propane. Wu et al. studied the wettability impact on nanoconfined methane adsorption behavior in organic-rich and inorganic-rich nano-pores [16]. They obtained the relationship between solid–methane interactions and the surface contact angle and found that the adsorption capacity in organic-rich shale is 1.72 times that in inorganic-rich shale.
The occurrence characteristics of oil and gas in nano-pores significantly affect the fluidity of oil and gas reservoirs. The intermolecular interactions and the interactions between the molecules and the pore surface could alter the fluid properties such as critical properties, phase behavior, solubility, viscosity, and interfacial tension among them because the pore surface available per unit volume increases [17,18,19,20,21]. Zhang Jun et al. employed molecular dynamics simulation to study the interfacial tension of oil/methane/water systems [22]. They found that the interface tension (IFT) decreased as the methane mole fraction increased. When liquid or gas flows through nano-pores, the adsorption phenomenon is very important and has a significant influence on flow enhancement [23,24,25]. Wang et al. studied the methane flow character as fast methane transport through different types of nano-pore [26]. Their research results showed that nanoscale flow patterns strongly depend on the adsorbed layers–solid interactions and the nature of the substrate surface. Xiong et al. investigated the displacement behavior of nanoslit oil by injected gases (CO2, CH4, N2, and C3H8) [27]. They found that the dissolubility of gas, the adsorption strength of oil, and the detachment capability of injected gas play crucial roles in displacement performance. Zhang et al. investigated the transport of an oil/gas mixture droplet through the aqueous nano-pore [28]. They concluded that the dissolution of methane in the oil droplet reduces the oil–water interfacial tension and increases the diffusivity of oil, the merged methane inside the oil droplet reduces the oil conformation energy and promotes oil deformation, and methane reduces the oil–pore interaction and decreases the resistance as the oil droplet passes through the pore throat.
Although previous researchers have conducted lots of theoretical and experimental studies on the occurrence and fluidity of oil and gas in nano-pores, the microscopic occurrence and flow characteristics of deep oil and gas reservoirs and the complex interaction among oil, gas, and rock are still not clear, especially in the oil and gas displacement process. In this paper, using molecular dynamics simulation, the occurrence characteristics and fluidity characteristics in water injection were used to explore the process of deep oil and gas in nano-pores. The mixture fluid of octane and methane (the molar ratio of gas to oil were 1/4, 2/3, 3/2, and 4/1) was selected to simulate oil and gas in deep oil and gas reservoirs. The adsorption characteristics of oil and methane on the rock surface have been intensively studied. Further, the flow characteristics and the flow resistance in the water displacement oil and gas process were investigated. The density distribution of oil and methane, microscopic dynamic behavior, interaction between molecules, migration behavior, oil and gas displacement efficiency, and the threshold displacement pressure of oil and gas were analyzed. Our work provides an in-depth understanding of the occurrence characteristics and flow resistance of oil with associated gas in deep oil and gas reservoirs, and provides a valuable reference for the storage and the exploration and development of deep oil and gas.

2. Simulation Model and Method

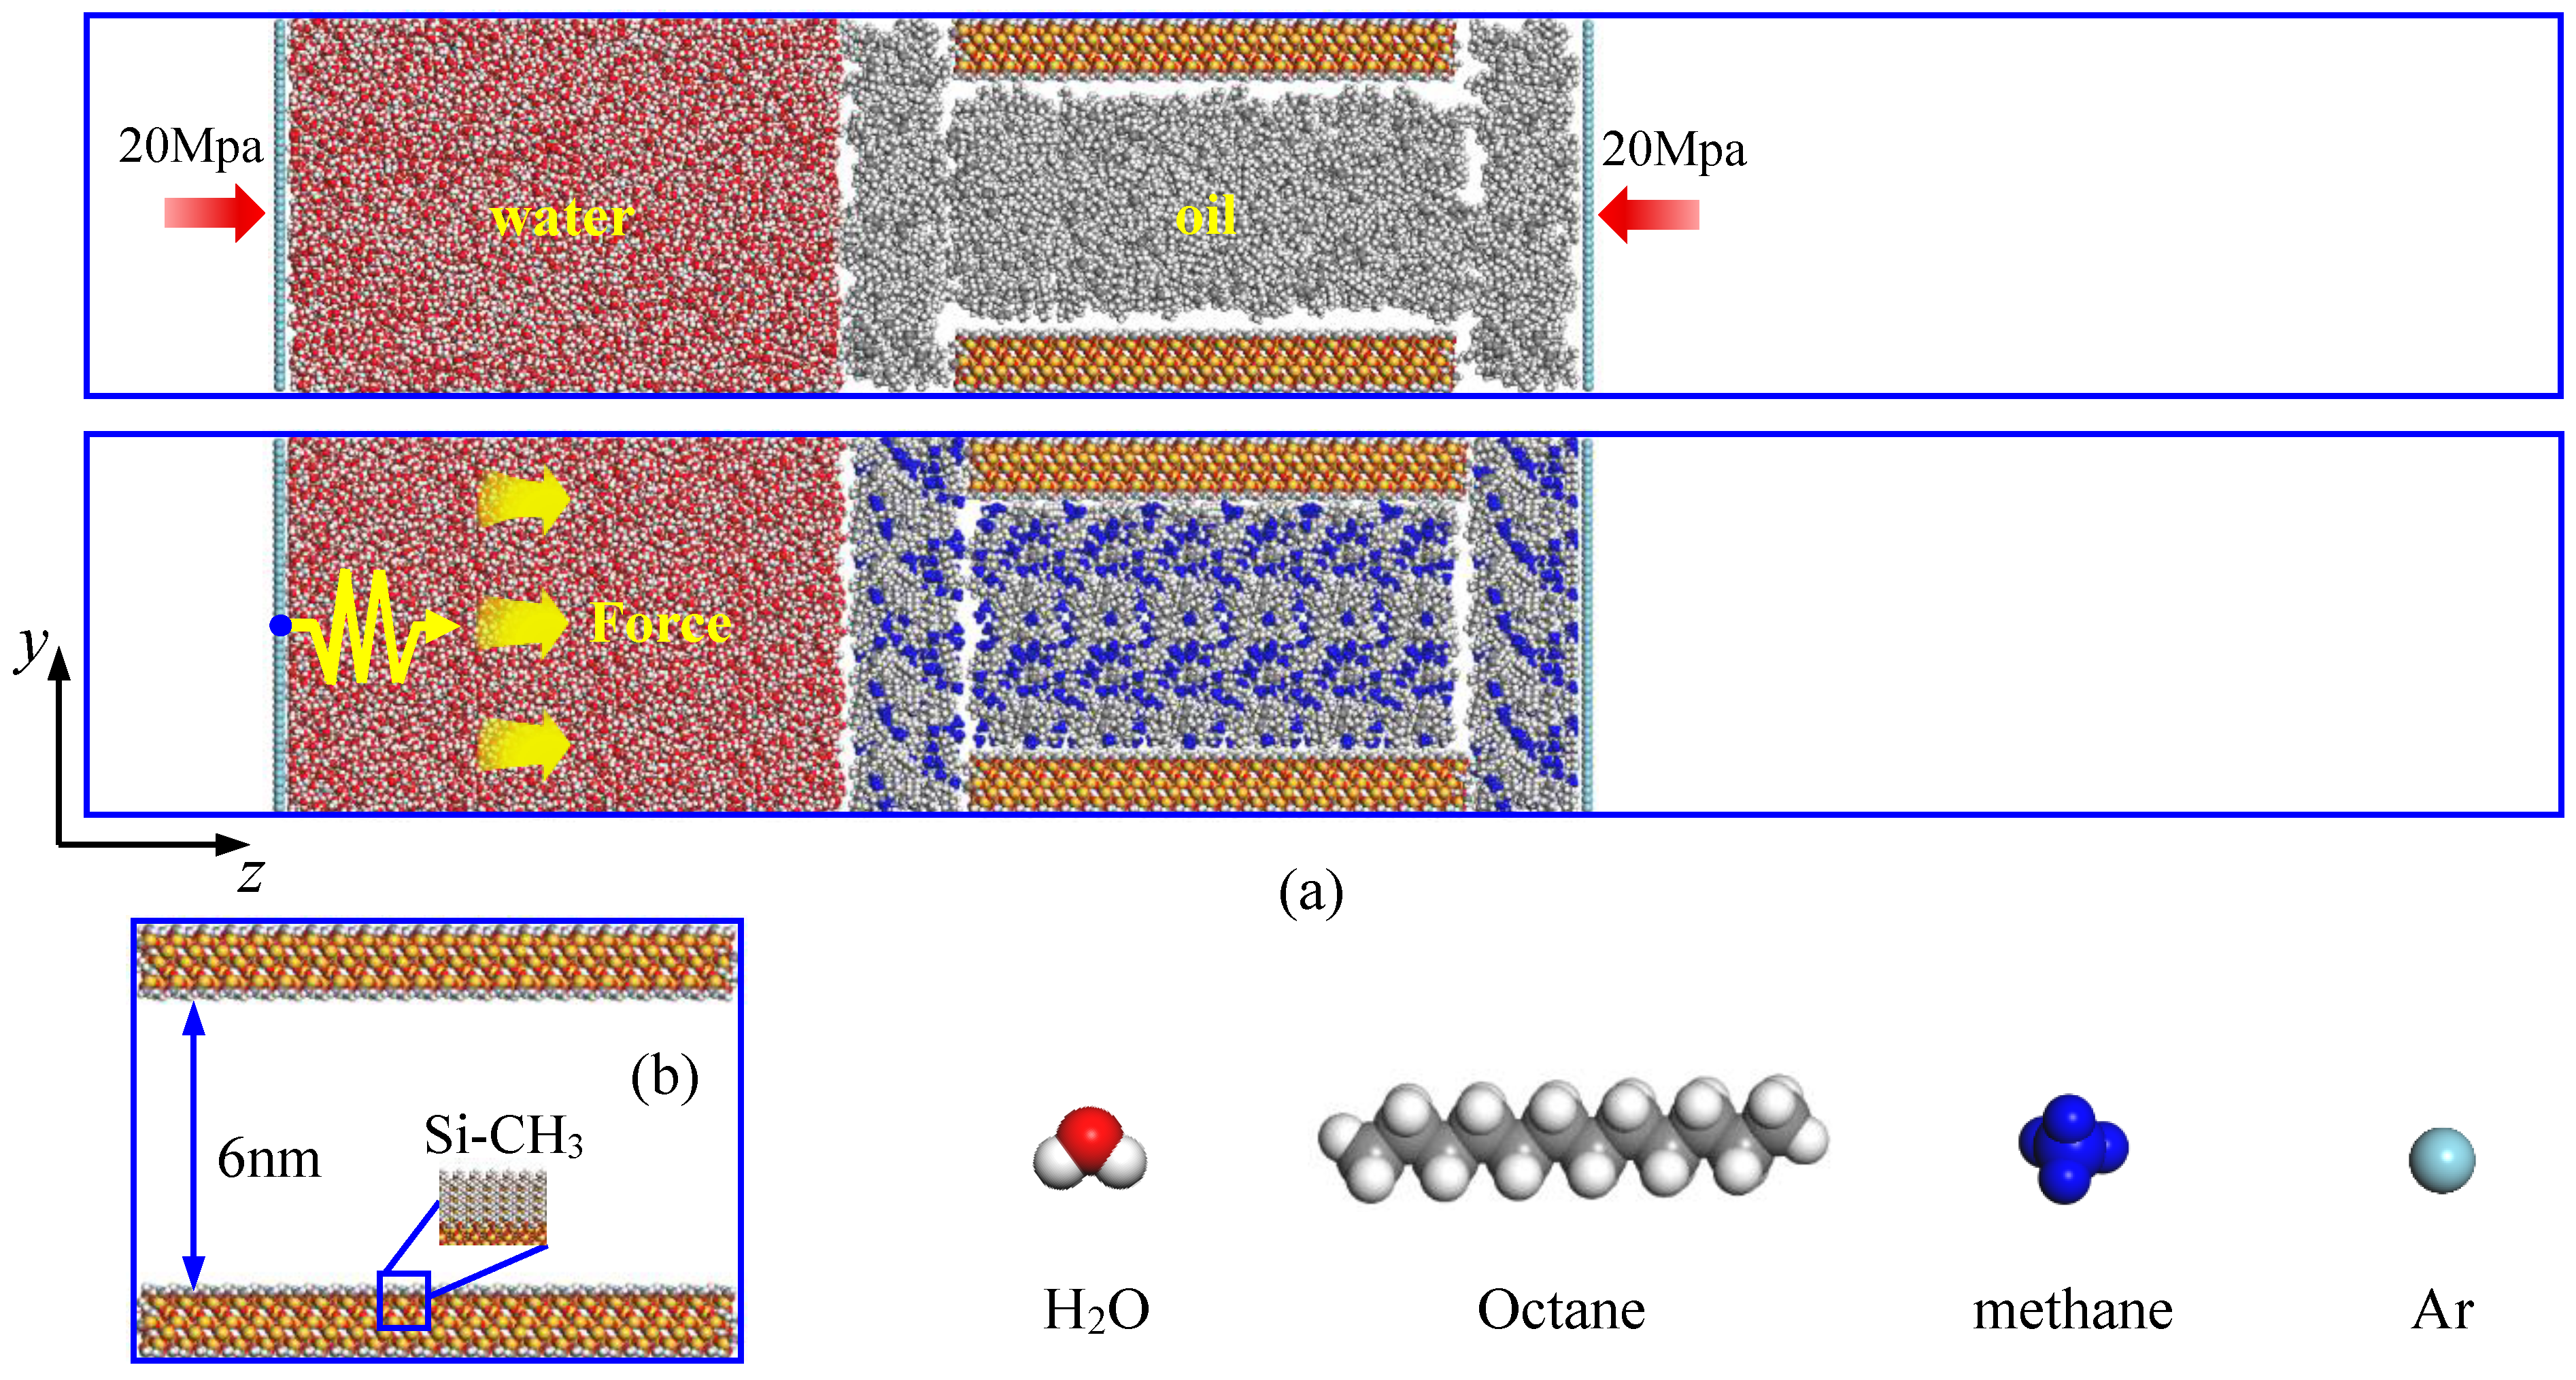
2.1. Simulation Models

According to previous research [21,27,28,29,30], quartz is often used to represent the inorganic surface of oil reservoirs. Here, we construct a quartz nano-pore throat with a diameter of 6 nm. The silica surface is generated by cleaving the α-quartz along the (0 0 1) crystallographic orientation. Then, the surface is methylated with methyl and forms a hydrophobic surface (Figure 1b) [31]. The dimensions of the silica slab are 2.46 × 1.4 × 11.8 nm3 (XYZ). Octane is used to represent oil since deep oil is mainly light oil. The mixture fluid of octane and methane molecules (the molar ratio of methane to oil rm/o are 1/4, 2/3, 3/2, and 4/1) are confined within the quartz nano-pore. A mixture fluid of octane and methane with a thickness of 2 nm is placed to the left and side of the nano-pore throat, respectively. The molecule number of oil and methane can be obtained based on the density of the mixture fluid of octane and methane during construct models. The density and molecule numbers of octane and methane in different mixture fluids of octane and methane systems can be found in Table 1 (the density of the mixture fluid of octane and methane are from the NIST-REFPROP database [32]). Then, the water phase is placed to the left side of the nano-pore throat with a length of 10 nm along the z-axis. Additionally, two Argon sheets are placed on the left side of the water phase and the right side of the oil phase, respectively, defined as rigid bodies in the simulation. Vacuum areas with sizes of 3 nm and 27.2 nm are placed on the left and right sides of the model to eliminate the effects of periodic boundary conditions on the interactions between fluids. To compare, the octane/water/silica system is also built. The final dimension of the simulated boxes for different models is 2.46 × 8.8 × 53.0 nm3 (XYZ). The initial model of water/oil is shown in Figure 1a, and the initial model of the water/oil/methane nano-pore throat system at the molar ratio of methane to oil rm/o = 3/2 is also shown in Figure 1a as an example. Other models can be found in Supplementary Materials (Figure S1). A temperature of 353 K and a pressure of 20 MPa are selected in our simulation.

2.2. Force Fields

The simple point-charge SPC/E model [33] describes the water molecules, which is the most extensive force field for water molecules [22,28]. The consistent valence force field (CVFF) [34] is used for silica, and previous researchers have proved that the CVFF force field could successfully describe hydrophobic quartz surfaces [35]. The optimized potentials for liquid simulations all-atom (OPLS-AA) force field [36] is applied for octane and methane, which has been successfully applied to simulate alkane [22,26,27,28]. For the bonded potential, it includes bond stretching, angular bending, and dihedral angle torsion. The non-bonding interactions between molecules include short-range van der Waals (vdW) and long-range electrostatic interaction. The vdW and electrostatic interactions are represented by Lennard-Jones 12-6 and Coulombic potentials, respectively, as shown in Equation (1).
V n o n b o n d = ε i j σ i j r i j 12 σ i j r i j 6 + q i q j 4 π ε 0 r i j ,
where ε i j and σ i j are the potential well depth and collision diameter, and r i j is the distance between atoms i and j. q i represents the charge of atom i, and ε 0 = 8.8542 × 10⁻¹² C2 N−1 m−2 is the permittivity of the vacuum. The detailed interaction parameters of oil, methane, water, and quartz are listed in Table S1 in the Supplementary Materials.

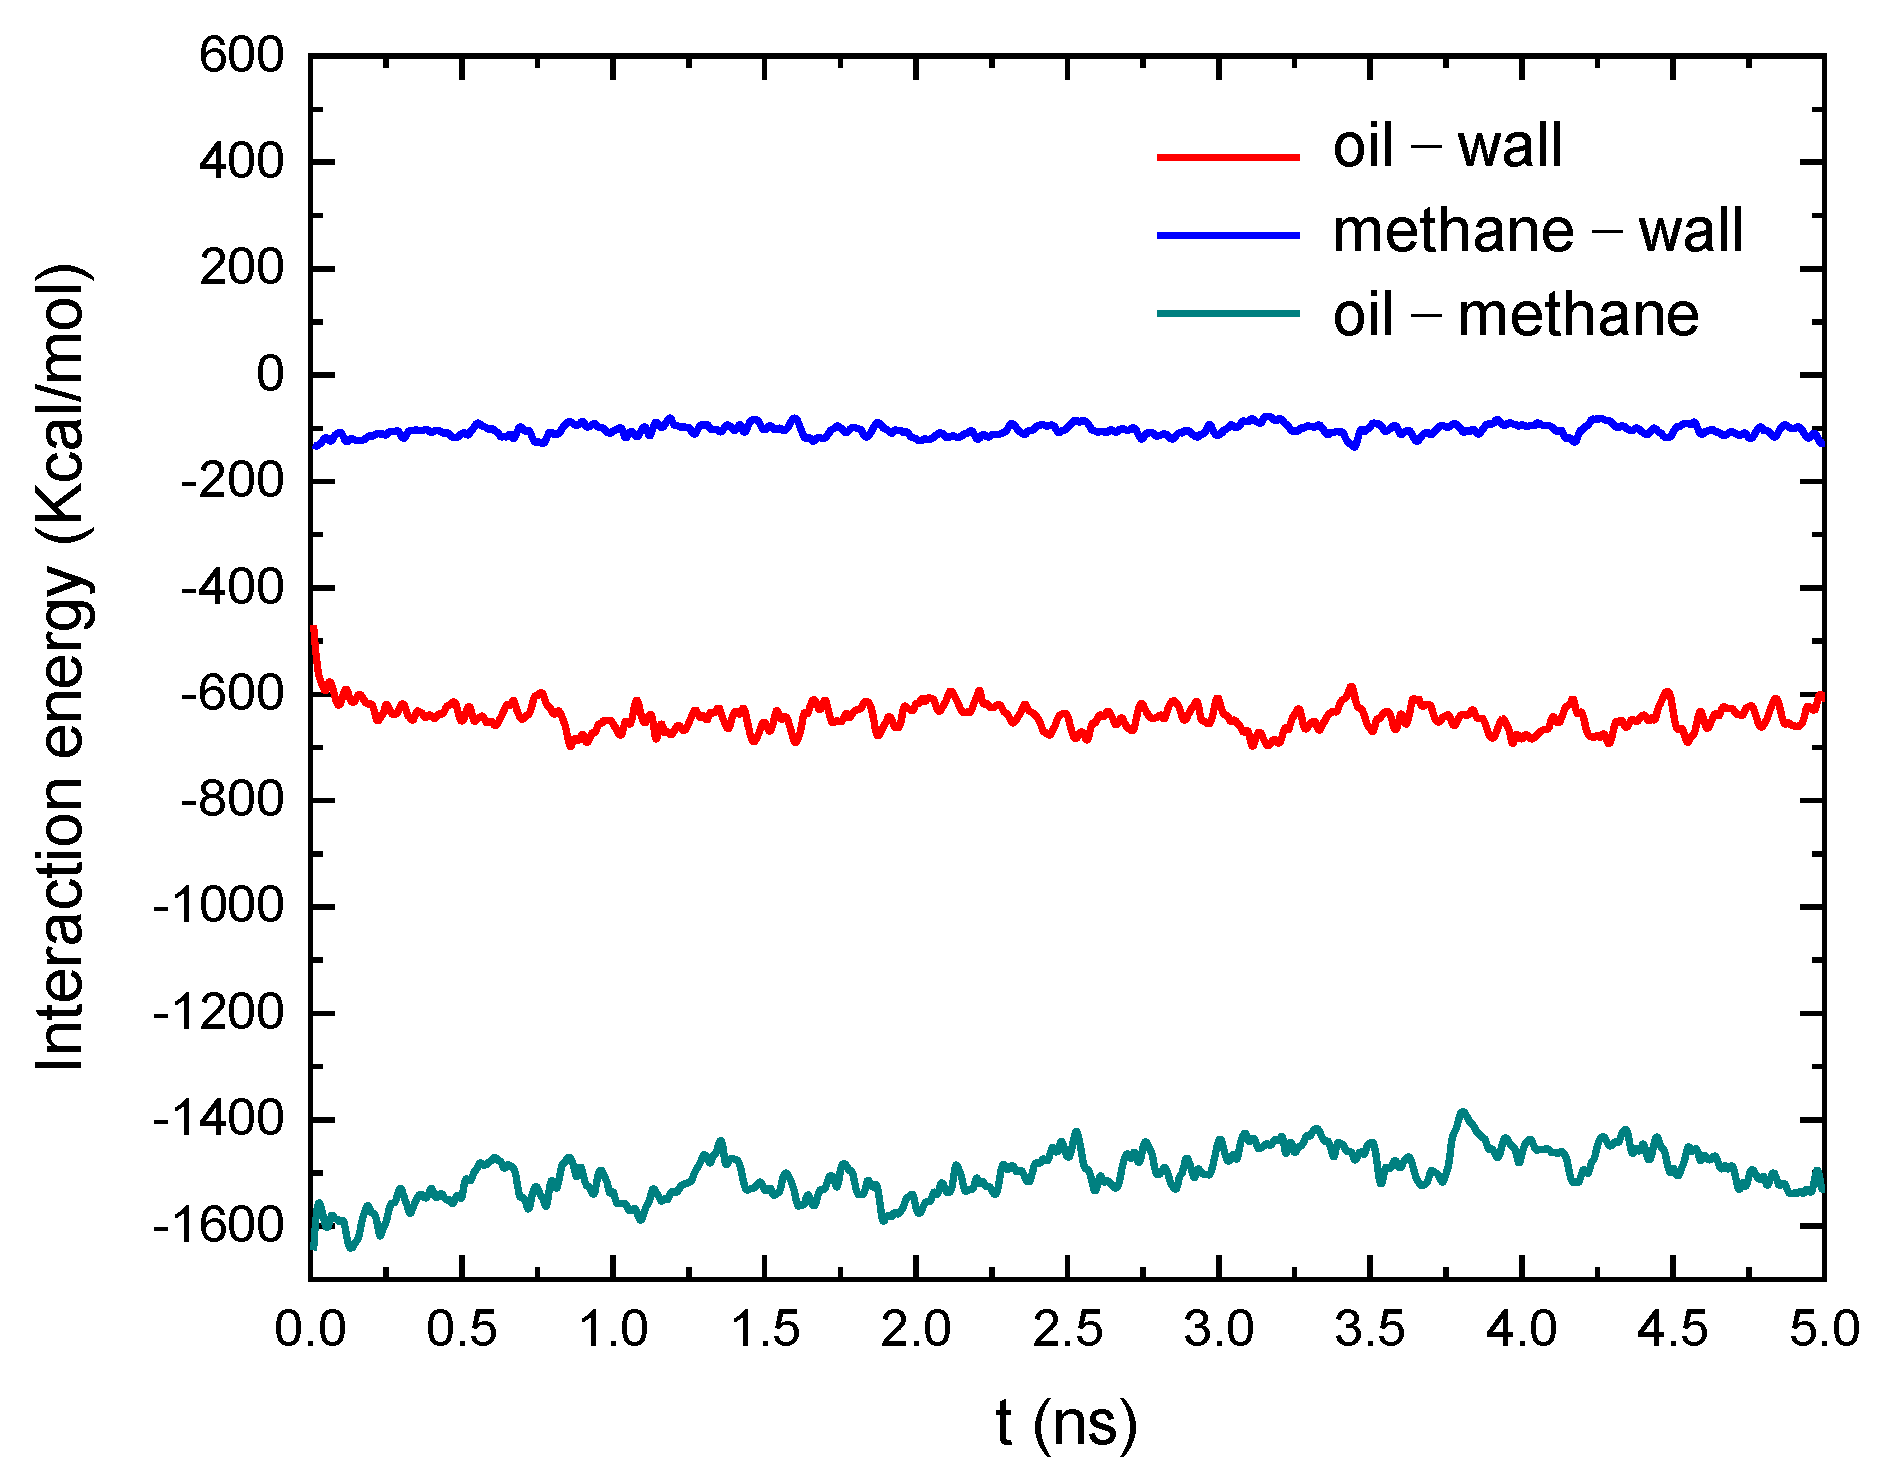
2.3. Equilibrium Molecular Dynamics (EMD)

All MD simulations are performed with the LAMMPS package [37]. The three-dimensional periodic boundary condition is applied with a cutoff radius of 10 Å and a time step of 1 fs. The Nosé–Hoover thermostat [38] controls the temperature during all the above MD simulations. The long-range electrostatic interactions are calculated by the particle–particle–particle-mesh (PPPM) method [39]. First, the initial configuration is optimized using the steepest descent method. Then, a 5 ns equilibrium molecular dynamics (EMD) simulation under the NVT ensemble at 353 K and 20 MPa is conducted on each nano-pore throat system with the quartz surfaces and water are fixed until the system reaches equilibrium. The constant pressure 20 MPa is applied in opposite directions of the corresponding forces to the two Argon sheets to control the fluid pressure. All the dynamic trajectories and snapshots of the interfacial configurations are rendered using VMD (Visual molecular dynamics) software [40]. After the EMD simulation of oil and methane, a 2 ns EMD simulation is conducted to each nano-pore throat system with the quartz surfaces, oil and methane fixed until the water phase reaches equilibrium.

2.4. Steered Molecular Dynamics (SMD)

The steered molecular dynamics (SMD) simulation is performed by exerting a spring-pulling force onto the COM (center of mass) of the left Argon sheet along the positive direction of the z-axis to mimic the process of water displacement oil and gas in the nano-pore throat [41,42]. The spring force is expressed as:
F = K Z 0 + υ t Z C O M ,
where F is the spring pulling force; K is the spring constant, which is 0.001 Kcal mol−1 nm−2 in the simulation; Z0 is the initial COM position of the left Argon sheet in the Z-axis direction; υ is a constant velocity along the Z-axis direction, which is 0.001 nm·ps−1 in the simulation; t is the simulation time; Zcom is the real-time position of the left Argon sheet COM along the Z-axis direction. The position at ( Z 0 + υ t ) is a reference point, which moves along the Z-axis at a constant speed. Each system experiences a 10 ns SMD simulation, and all other simulation details are identical to those in the EMD simulation. The applied spring force is shown schematically in Figure 1a.

3. Results and Discussion

3.1. Microstates and Distribution of the Oil and Methane in the Quartz Slits

The final EMD configurations of water/oil/methane nano-pore throat systems are shown in Figure 2a–e. The molar ratio of methane to oil rm/o is (a) 0, (b) 1/4, (c) 2/3, (d) 3/2, and (e) 4/1, respectively. It can be seen from the EMD configurations that as the methane content increases, methane molecules tend to cluster together, which is not obvious at rm/o = 1/4 and rm/o = 2/3. However, when rm/o increases to 3/2 and 4/1, methane molecules cluster together significantly. At rm/o = 4/1, the aggregation of the methane molecules even forms a gas channel within the nano-pore throat, which indicates that compared to methane, oil molecules are more likely to adsorb on the rock surface, while methane molecules tend to aggregate in the center of the nano-pore throat. The adsorption behavior of methane and octane is ascribed to the adsorption propensity of n-alkanes with more carbon atoms per molecule; therefore, the vicinity of the solid walls is preferentially adsorbed by longer alkanes [43,44]. In addition, as the methane content increases, the overall volume of the oil and gas mixing area increases, which is due to the swelling effect of the gas.
To quantitatively analyze the occurrence status of formation oil and methane under different formation methane saturations, the density distribution profiles of oil and methane along the nano-pore throat width were calculated, as shown in Figure 2f,g. It can be seen from the figures that both for oil and methane, the density profiles show adsorption peaks near the nano-pore throat surface. The interval of the adsorption peak of oil molecules is larger than that of methane molecules due to the difference in the molecular size of oil and methane. The adsorption peaks of oil molecules appear in the region of 1.5–3 nm and 6–7.5 nm, and the free-state zone of oil molecules is in the region of 3–6 nm. The adsorption peaks of methane molecules appear in the region of 1.5–2.4 nm and 6.6–7.5 nm, and the free-state zone of methane molecules is in the region of 2.4–6.6 nm. The adsorption zone of oil and methane is consistent with previous research [20,45,46,47]. It can be seen from Figure 2f that with the increase in methane content, the density of oil molecules shows a downward trend. When the methane content was low (rm/o = 1/4 and 2/3), we found that the amplitude of the first adsorption peak (near the rock surface) was almost the same with the pure oil system, which indicates that oil molecules tend to adsorb near the nano-pore throat surface, and have reached saturation adsorption at rm/o = 2/3. From Figure 2g, it can be seen that as the content of methane molecules increases, the density of methane molecules gradually increases. The first adsorption peaks near the nano-pore throat surface increase when the methane content increases from rm/o = 1/4 to 2/3. When the methane content increases to rm/o = 3/2 and 4/1, the amplitude of the first adsorption peaks shows no more changes. The amplitudes of the first methane adsorption peaks of rm/o = 3/2 and 4/1 are almost equal, i.e., the adsorption of methane on the nano-pore throat surface reaches saturation at methane content rm/o = 3/2.
From the above analysis, oil or methane occurrence status could be divided into two types. One is free-status molecules, which locate the internal nano-pore throat. The other is adsorption-status molecules, which are adsorbed on the nano-pore throat surface and located near the surface. Among them, the free-status molecules could be easily replaced by a displacement agent, while adsorption-status molecules interact more with the rock surface, making it difficult to be displaced out of the reservoir. To provide a clearer description of the adsorption-status molecules of oil and methane, we calculated the atom numbers of adsorbed oil (1.5–3 nm and 6–7.5 nm) and methane (1.5–2.4 nm and 6.6–7.5 nm), as shown in Figure 3. It can be seen that as the methane content increases and the oil content decreases, the number of adsorbed oil atoms gradually decreases, and the number of adsorbed methane atoms gradually increases. These phenomena indicate that although oil molecules tend to adsorb on the rock surface, some adsorbed oil molecules are replaced by methane when the methane content increases, i.e., when the methane content increases, in addition to forming clusters or gas channels in the center of the pores, the adsorbed methane molecules on the rock surface also increase. Previous studies by Moh et al. in their research of decane extraction from nano-pores by CH4 also showed that when methane molecules are mixed with decane molecules in nano-pores, a large amount of adsorbed oil molecules would be replaced by methane molecules [20].
To obtain a deep understanding of the competitive adsorption of oil and methane mentioned above, we calculate the interaction energy between the oil and rock surface, methane and rock surface, and the interaction energy between oil and methane along with simulation time, as shown in Figure 4. It can be seen from the figure that the methane and rock surface has weak interaction, the oil and rock surface has strong interaction, and methane and oil have a very strong interaction. Therefore, less adsorbed oil and more adsorbed methane are beneficial for displacement by the injected liquid. From the above analysis, it can be inferred that in the next water flooding process, the displacement rate D of oil and methane would follow Drm/o=4/1 > Drm/o=3/2 > Drm/o=2/3 > Drm/o=1/4 > Drm/o=0.

3.2. Water Displacement Oil and Gas Process in Nano-Pore Throat

In Section 3.1, we analyzed the occurrence state of the pure oil, mixture fluid of oil and methane (rm/o = 1/4, 2/3, 3/2, and 4/1) in the quartz nano-pore throat. When oil and methane coexist in the nano-pore throat, the content of methane and oil affects the occurrence state of free-status and adsorption-status of oil or methane, which results in different displacement rates of oil and methane for different rm/o systems in the water injection process. Therefore, in this section, we further investigate the flow behavior of oil and methane in the water flooding process of these systems to determine the influence of the content of oil and methane on the water displacement oil and methane process in the nano-pore throat.

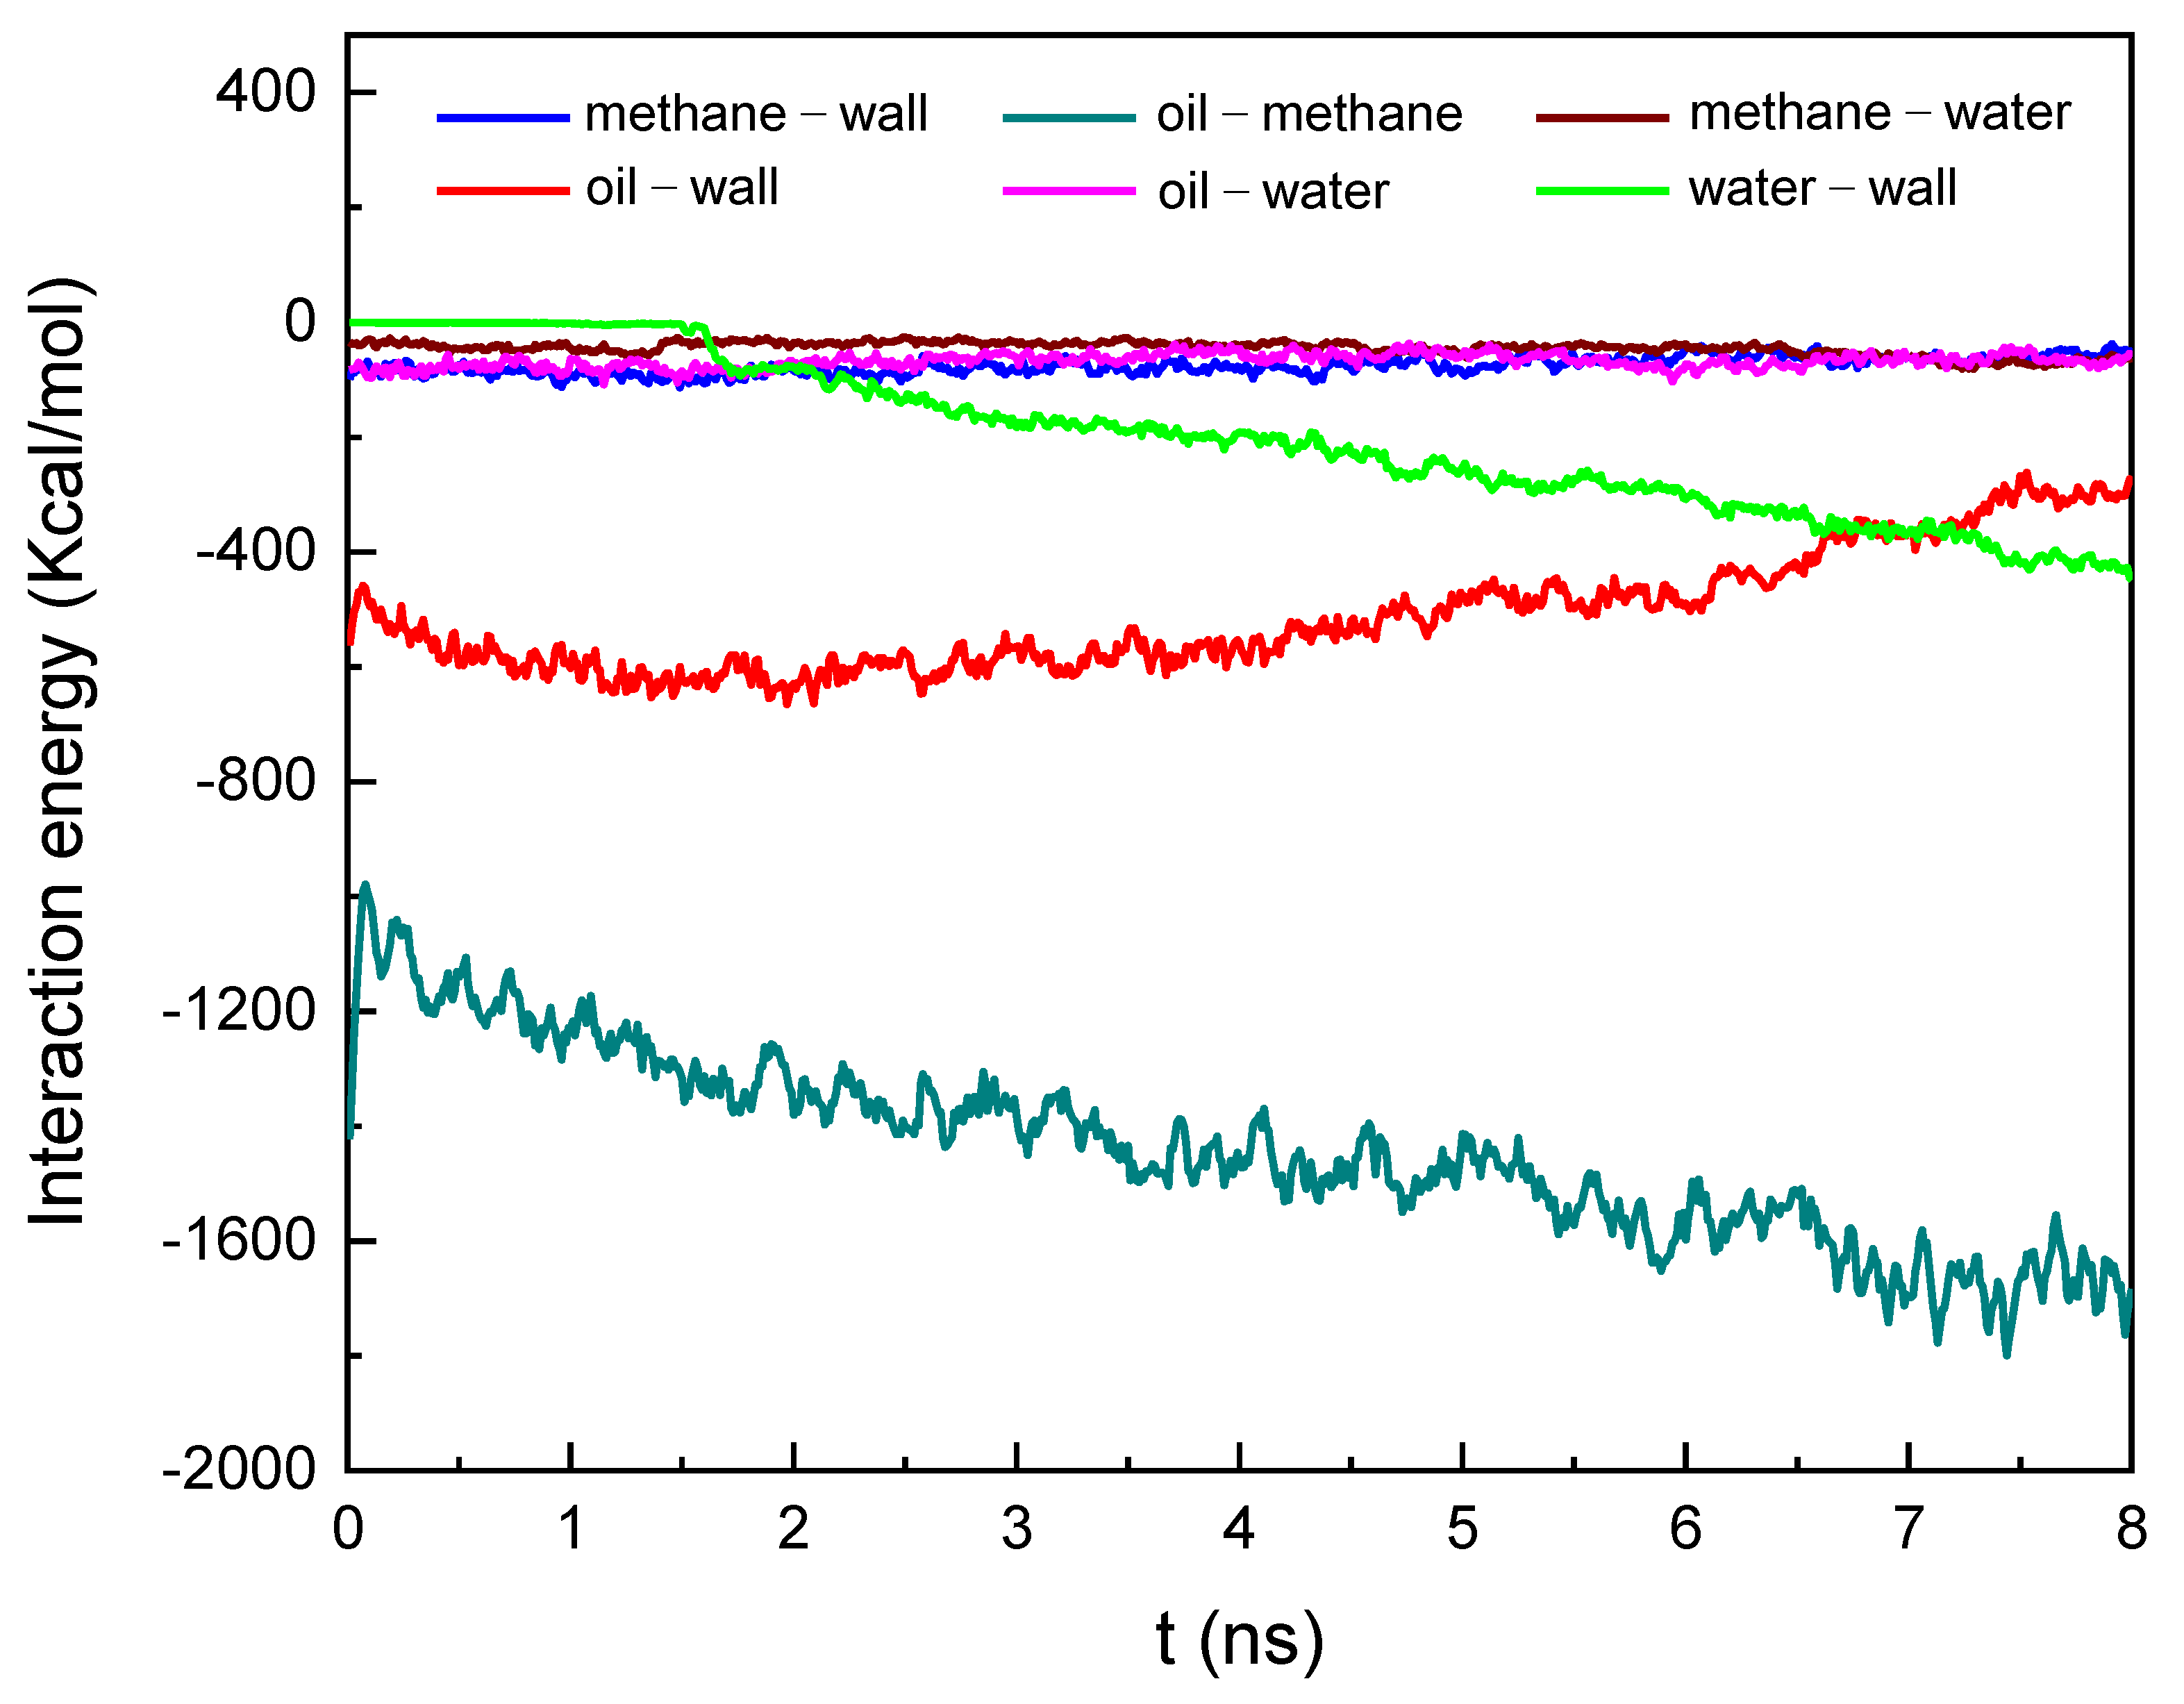
3.2.1. Water Displacement Oil and Gas Process

Figure 5 shows the dynamic process of the water displacement oil and gas process at 2 ns, 4 ns, 6 ns, and 8 ns for pure oil and rm/o = 1/4, 2/3, 3/2, and 4/1 systems. It can be seen that with the simulation processes, under spring pulling force on the left Argon sheet, the water moved forward along the z-axis and gradually entered the nano-pore throat. As a result, oil or methane were gradually pulled out of the nano-pore throat. Comparing the water displacement oil and methane process of different methane content systems, it can be seen that at the same simulation time, the front of the water tends towards larger z-coordinates as the methane content increases (oil content decreases), which indicates a gradual decrease in resistance and gradual increase in displacement rate with the increase of rm/o. This is consistent with our previous analysis in Section 3.1. The rapid self-diffusion of methane and oil molecules as the methane content increase have also been reported by Moh et al. in their research of decane molecules extraction from nano-pores by CH4 [20]. In addition, the clusters of methane molecules and the gas channel at the center of the pore throat (rm/o = 3/2 and 4/1) are beneficial for faster expulsion of methane from the nano-pore throat. Therefore, it can be seen via the simulation process that numerous methane molecules quickly pass through the nano-pore throat and form larger gas clusters on the right side at rm/o = 3/2 and 4/1.
To further reveal the displacement process of free-status and adsorption-status oil and methane during water displacement, we calculated the density distribution of oil and methane in the z-direction and y-direction. The density profiles of oil and methane at rm/o = 3/2 are shown in Figure 6 as an example. Figure 6a,b shows the density distribution of oil and methane along the z-direction at 2 ns, 4 ns, 6 ns, and 8 ns, respectively. The position of the nano-pore throat is at approximately z = 18–29.8 nm. It can be seen that with the simulation process, both oil and methane move forward along the z-axis, indicating that oil and methane are gradually being displacement out of the nano-pore throat by water. In Figure 6a, at 2 ns, oil has an appreciable density distribution within the nano-pore throat, and there is a deep valley appears between z = 32–35 nm on the right side of the nano-pore throat, indicating a small density distribution of oil in this region. In Figure 6b, it can be seen that the methane density distribution on the right side of the nano-pore throat is greater than that in the nano-pore throat, and there is a large peak in the region z = 32–35 nm at 2 ns, i.e., a large amount of methane molecules aggregates in this region. These phenomena show that methane could be more easily displaced out of the nano-pore throat than oil. Along with the simulation time, as the oil is gradually pulled out of the nano-pore throat, the density of oil gradually increases in the region z = 32–35 nm, indicating that the expelled oil has filled this area.
Figure 6c shows the density distribution of oil along y-axis at 2 ns, 4 ns, 6 ns, and 8 ns at rm/o = 3/2. The density profiles of oil and methane of other systems along the y-axis can be found in Supplementary Materials (Figure S2). It can be seen that the amplitude of the first adsorption oil peaks near the rock surface (1.7 nm and 7.2 nm) is almost the same at 2 ns, 4 ns, and 6 ns, and they are decreased at 8 ns, yet the adsorption peaks in the region 2–3 nm and 6–7 nm gradually decrease with time. These phenomena indicate that in the water displacement process, the oil molecules adsorbed on the rock surface are not easy to be stripped, and the oil molecules away from the rock surface are easier to be pulled out, which could be ascribed to the strong interaction between oil and rock surface and very strong interaction between oil and free-status methane in the center of the nano-pore throat (Figure 7). Therefore, the oil molecules away from the rock surface could be driven out of the nano-pore throat along with the free-status oil and methane molecules. Figure 6d shows the density distribution of methane molecules along the y-axis at 2 ns, 4 ns, 6 ns, and 8 ns, respectively. The peaks near 1.7 nm and 7.2 nm represent the methane molecules adsorbed on the rock surface. It can be seen that their amplitude gradually decreases with time. The second adsorption peaks near 2.2 nm and 6.7 nm represent the methane molecules adsorbed on the oil and methane near the rock surface, which reach the highest at 4 ns and then decrease gradually with the simulation process. These phenomena indicate that in the water displacement process, methane molecules adsorbed on the rock surface could be more easily stripped off the rock surface than the second adsorbed layer of methane molecules. The above behavior of methane molecules could be ascribed to the weak interaction between methane and the rock surface and the strong interaction between oil and methane (Figure 7). Therefore, for these adsorption methane molecules, methane molecules depart from the rock surface first, then they are adsorbed on the near rock surface oil and methane, and these methane molecules could be pulled out of the nano-pore throat along with the free-status oil and methane.

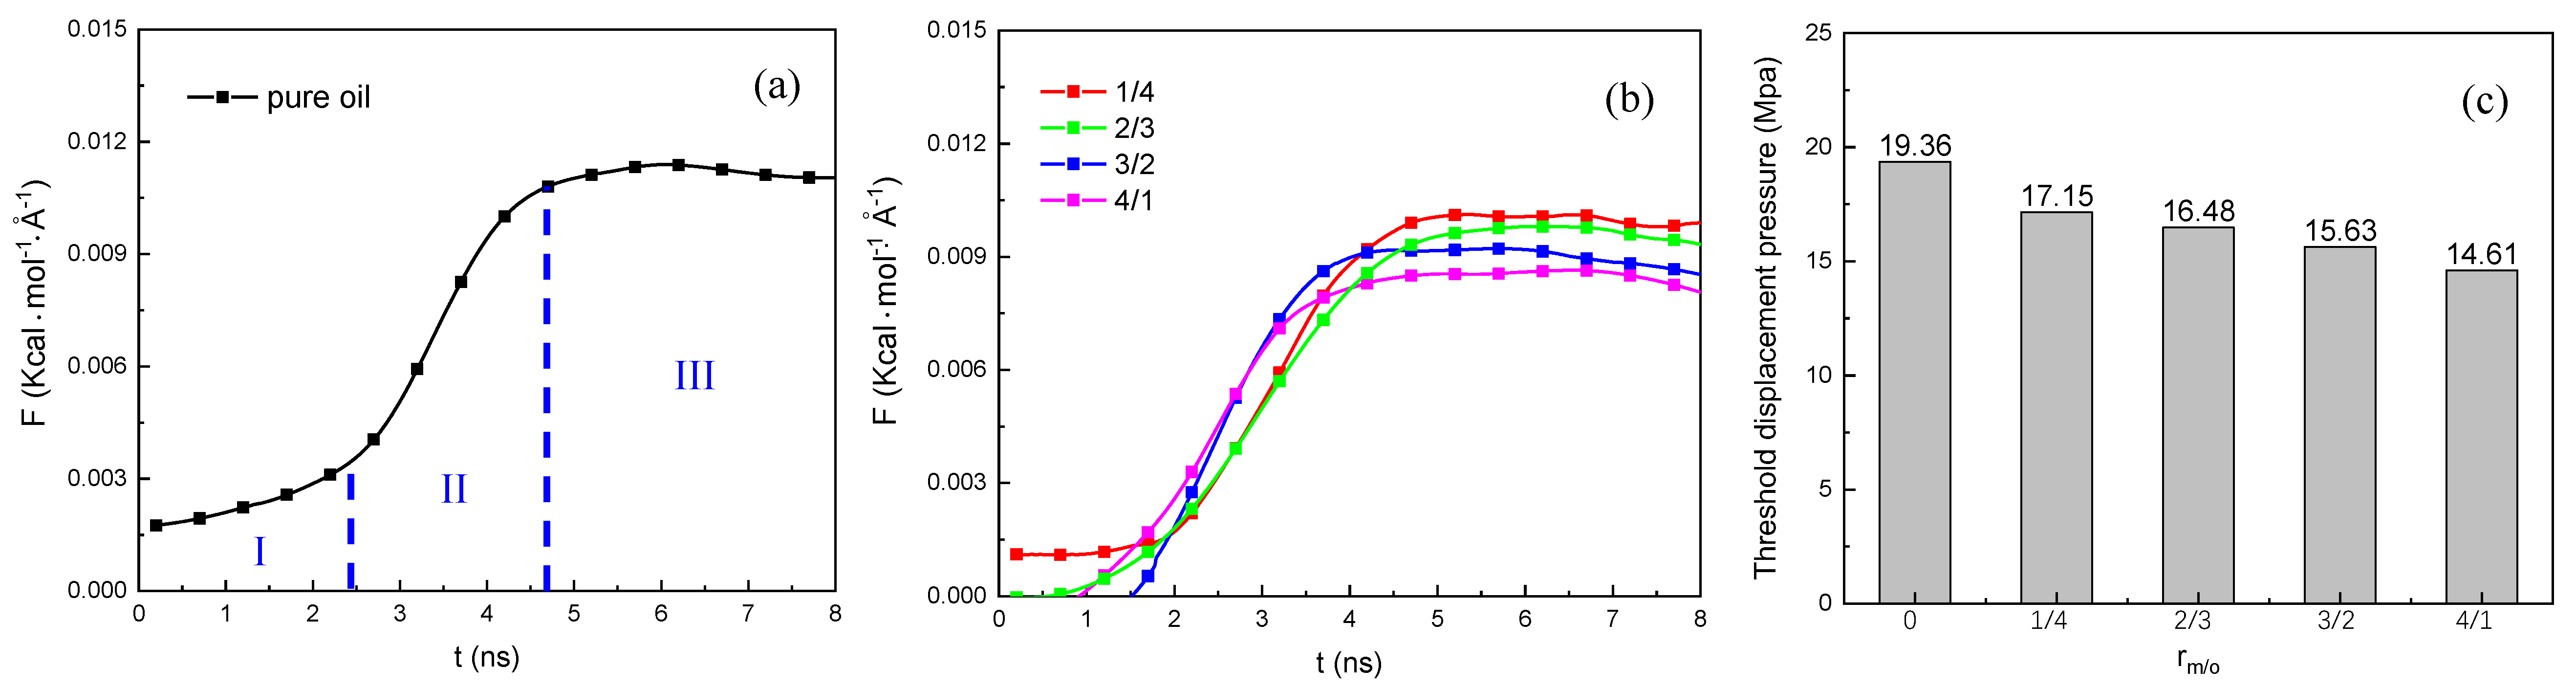
3.2.2. The Threshold Displacement Pressure

In the water injection process, an important parameter is the threshold displacement pressure. The threshold displacement pressure is crucial to quantify the pressure required for fluids being transported into the capillary [48]. In order to investigate the effect of the content ratio of methane and oil on the threshold displacement pressure during the water displacement oil process, we calculated the pulling force (exert on the left Argon sheet) as a function of simulation time, as displayed in Figure 8a,b. Additionally, the evaluable threshold displacement pressure for different rm/o systems is shown in Figure 8c. The pressure conversion equation and conversion parameters can be found in Supplementary Materials (Table S2).
In 1923, Bosanquet [49] thought that in the capillary action of fluids flowing through a nano-pore, the contributions of inertial drag and viscous resistance counteracted the capillary pressure. Oyarzua et al. [50] used the Bosanquet model of capillarity to describe the nanoscale imbibition of water through a nano-pore. In their study, the capillary filling kinetics underwent three stages: the beginning of the imbibition (inviscid stage), the capillary filling stage (inertial drag and viscous resistance both exit stage), and the purely viscous regime (no inertial drag stage). The three stages concluded by Oyarzua et al. [50] can also be seen in Figure 8a,b. In Figure 8a,b, it can be seen that the water displacement pure oil or oil and methane process has gone through three stages. From Figure 8a, in stage I, the pulling force increases slowly. In this stage, water molecules gradually approach the nano-pore throat under the pressure of the left Argon sheet. Since the pulling force is small during this stage, we could conclude that, in this stage, the resistance is small. In stage II, water molecules begin to charge into the nano-pore throat. The pulling force increases quickly and finally reaches a turning point at 4.7 ns, which indicates a difficult entrance of water into the nano-pore throat. In stage III, the pulling force almost maintains a constant value, indicating a steady propel of water molecules. In this stage, resistance is counteracted by the pulling force, i.e., when the pulling force in the water displacement oil and gas process is greater than this pulling force value, oil and gas could be driven out from the reservoirs. So this pulling force value in stage III could be considered the threshold displacement force and be used to evaluate the threshold displacement pressure in oil and gas recovery. Comparing Figure 8a,b, it can be seen that as the methane content increases and the oil content decreases, the experience time for stage I and II decrease gradually, indicating that the displacement rate gradually accelerates as the methane content increases. In addition, the threshold displacement pressure gradually decreases with the increase in methane content. The threshold displacement pressure is 19.36, 17.15, 16.48, 15.63, and 14.61 MPa when rm/o = 0, 1/4, 2/3, 3/2, and 4/1, respectively (Figure 8c). Similar research results have been reported by Zhang et al. in their research of the migration of octane/methane mixture droplets from a wide area into a nano-pore throat [28]. They also found the threshold pulling force was decreased with the increasing methane molar fraction.
As mentioned above, when water enters into the nano-pore throat from the wide area (stage II), there is big resistance which causes the pulling force to continue to increase until it reaches the threshold displacement force. According to Oyarzua et al. [50], in this stage, the inertial drag resistance and viscous resistance both exist, and the Jamin effect plays an important role [51,52]. The shrunk droplet diameter causes an additional pressure difference, hindering the droplet transport. The Jamin effect could be represented by the following equation:
Δ P = 2 γ ( 1 R 1 1 R 2 ) ,
where Δ P is the pressure difference of water charging into the pore throat, and γ is the IFT of the oil–water. R1 and R2 refer to the radii of water on the outer side and the inner side of the pore throat, respectively. The schematic diagram of the Jamin effect can be seen in Figure S3. In our simulation, R1  R2. Therefore, Δ P < 0, which means the pressure caused by the Jamin effect hinders the water phase charging into the nano-pore throat. Since Δ P is proportional to the oil–water interfacial tension γ, we calculated the oil–water interfacial tension of pure oil and different rm/o oil and methane systems, as shown in Figure 9. The IFT of pure oil–water is 48.1 mN/m, consistent with previous experiments and calculations [28,52]. It can be seen that as the methane content increases and the oil content decreases, the IFT gradually decreases, which is consistent with the research results of Zhang et al. [28]. Therefore, from Equation (3), as the methane content increases and the oil content decreases, the corresponding Jamin effect gradually weakens, which is the reason why the threshold displacement pressure follows Prm/o=0 > Prm/o=1/4 > Prm/o=2/3 > Prm/o=3/2 > Prm/o=4/1. The calculation method for interfacial tension is shown in Figure S4.
In addition, the fluidity of oil and gas will change with the methane content. In stage II and III, as Oyarzua et al. [50] reported, viscous resistance plays an important role. Zhang et al. found that the viscosity of oil gradually decreases with the increase of methane content [28]; that is, the fluidity of oil and methane increases with increasing methane content. Therefore, oil and methane in a high methane-content system are more easily displaced by water.

3.2.3. The Displacement Rate of Oil and Gas

In order to intuitively demonstrate the effect of the content ratio of oil and methane on the oil and gas displacement efficiency, we calculated the atom number of water in the nano-pore throat, as shown in Figure 10. In Figure 10, the atom numbers of water in the nano-pore throat first experience a period of time equal to zero, which indicates that water has not yet entered the nano-pore throat. Then, the atom numbers of water in the nano-pore throat gradually increase, indicating that water molecules begin to enter the nano-pore throat and drive oil and methane out of the nano-pore throat. It can be seen from Figure 10 that it takes a shorter time for water to enter into the nano-pore throat when the methane content increases. And the atom number N of water in the nano-pore throat follows Nrm/o=4/1 > Nrm/o=3/2 > Nrm/o=2/3 > Nrm/o=4/1 > Nrm/o=0 at the same simulation time, indicating the displacement efficiency of oil and gas increases with the increase of methane content.
To explain the mechanisms of accelerating the oil and gas displacement process in water flooding as the methane content increases, we calculated the atom number of the adsorbed oil and methane along with the simulation time for different rm/o systems, as shown in Figure 11a,b. The adsorption region of oil and methane could be delimited based on the adsorption peak interval in Figure 2 and Figure 6. It can be seen in Figure 11a,b that the atom number of adsorbed oil decreases with the increasing content of methane, and the atom number of adsorbed methane increases with the increasing content of methane. As mentioned in Section 3.2.1 and Figure 7, since the interaction between oil and rock surface is strong and the interaction between the methane and rock surface is weak, a decrease in adsorbed oil and an increase in adsorbed methane is beneficial for the detachment of adsorbed oil and methane. Therefore, the larger the rm/o, the greater the displacement rate of oil and methane.

4. Conclusions

In this work, adopting molecular dynamic simulation, we studied the occurrence characteristics of oil with associated gas methane in the nano-pore throat and the displacement behavior of oil and methane in the water flooding process. Simulation results showed that:
(1).
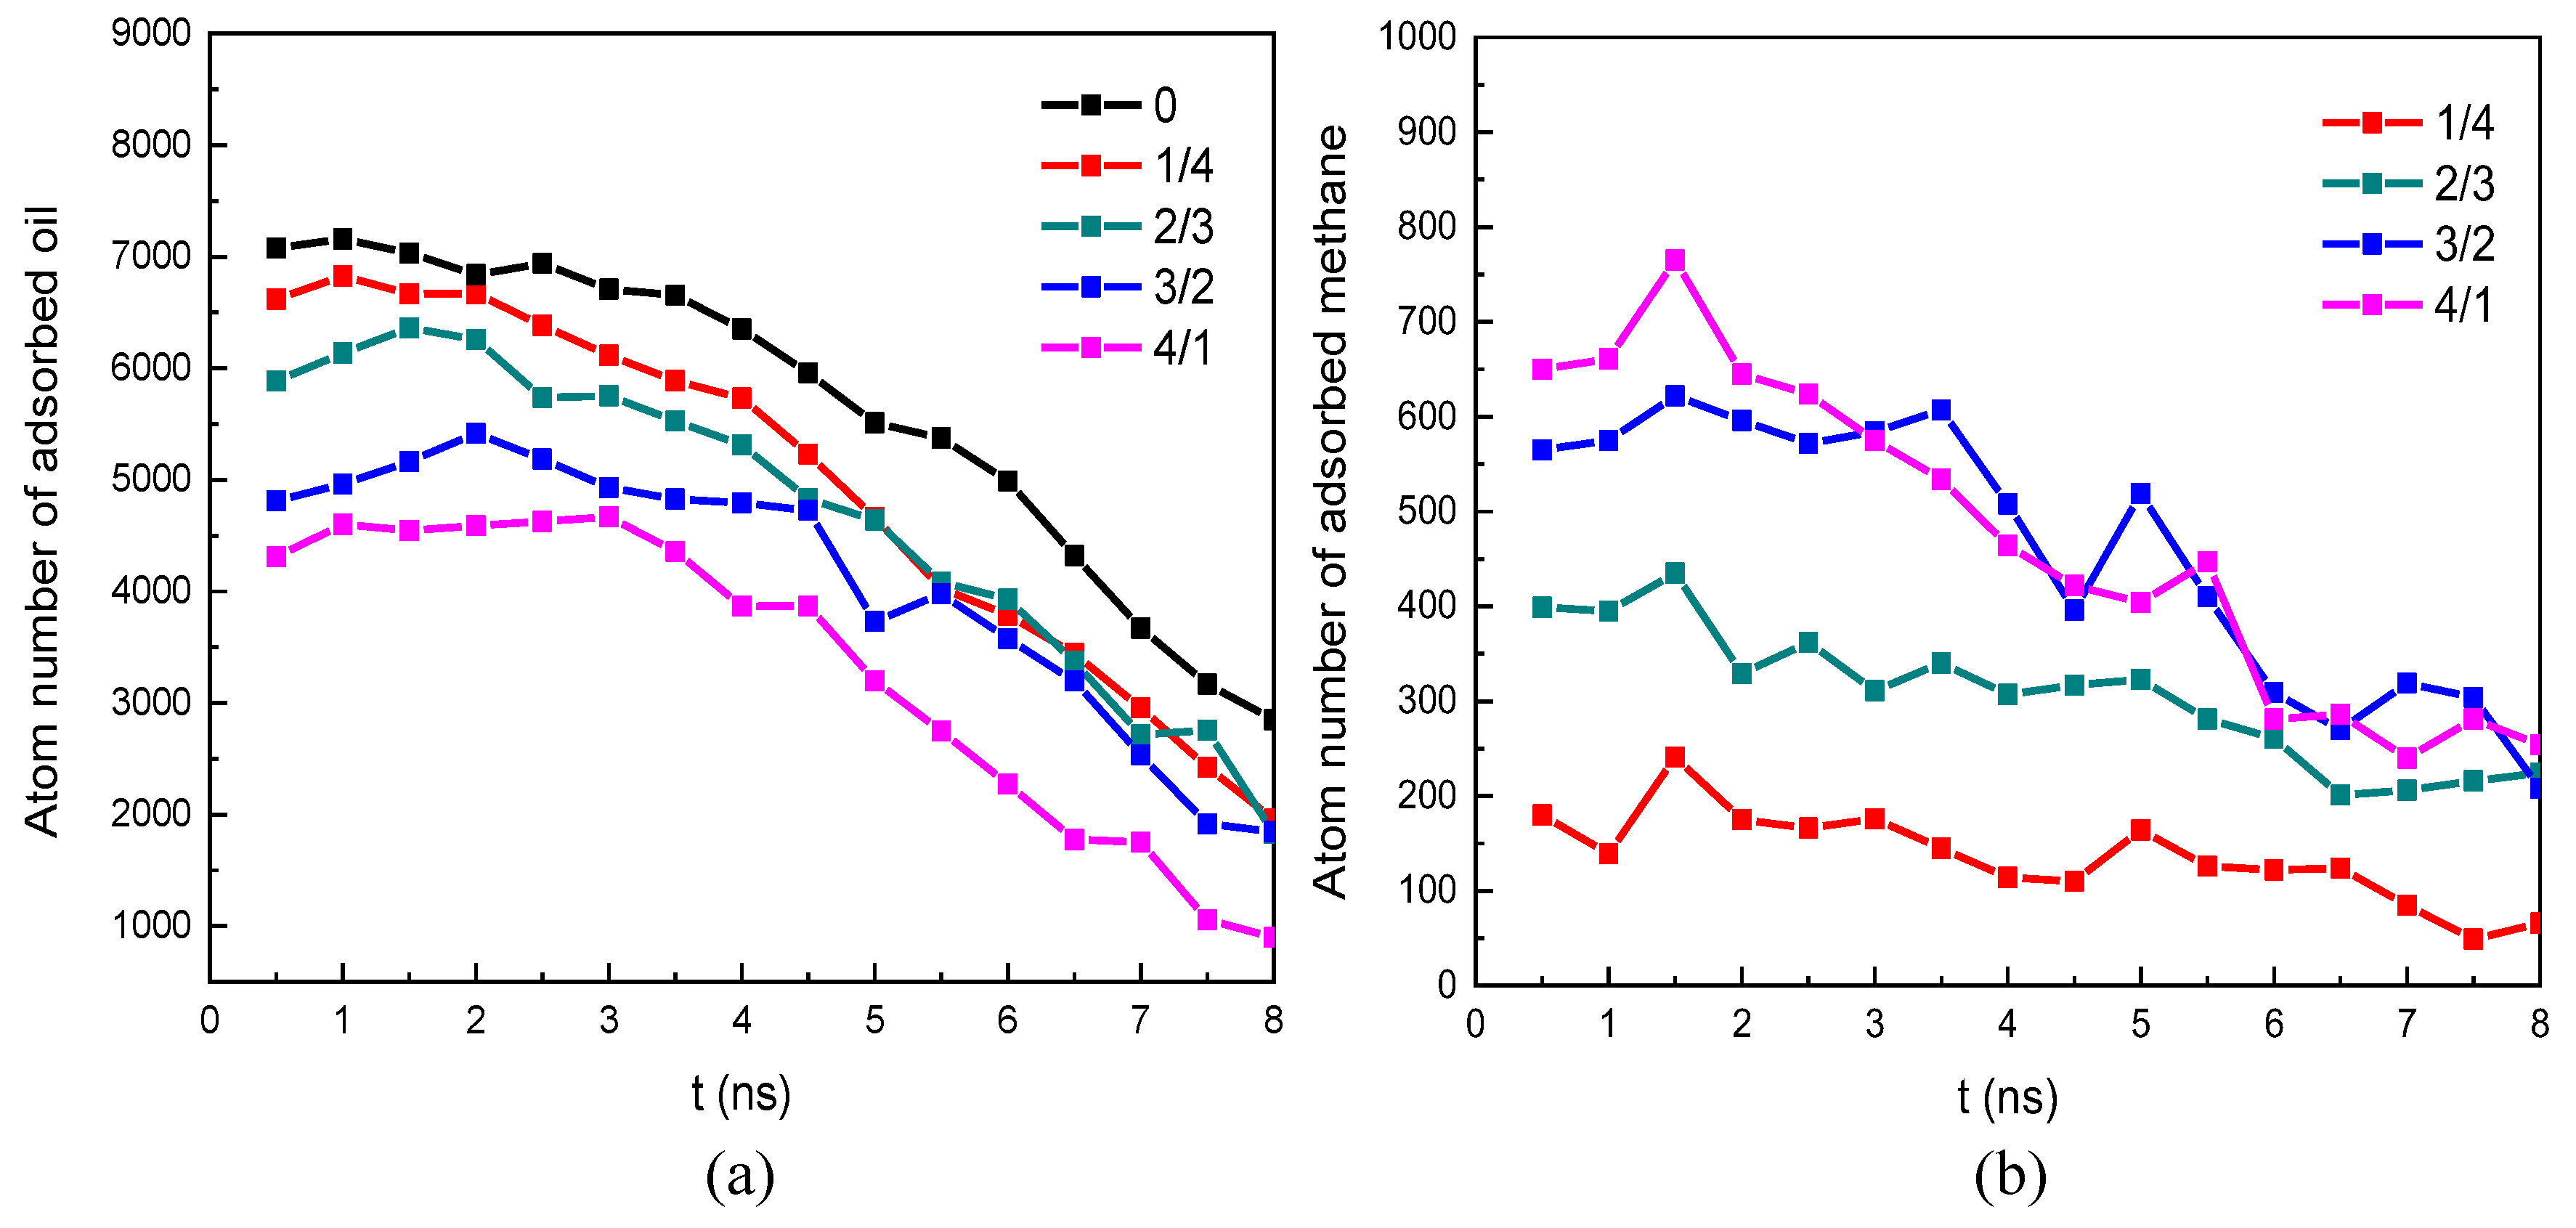
The occurrence characteristics of oil with associated gas methane in the nano-pore throat indicated that there were two occurrence statuses of oil and methane: free status located within the nano-pore throat and adsorption status on the rock surface. We found methane molecules tend to cluster together and form a free status. Compared to methane, oil molecules were more likely to adsorb on the rock surface. We also found that the adsorption-status oil molecules gradually decrease and the adsorption-status methane molecules gradually increase as the methane content increases, which would be beneficial to improving oil and methane displacement efficiency in the water flooding process.
(2).
In the water displacement oil and gas process, the trajectory of the displacement process and the atom number of water in the nano-pore throat showed that the oil and methane displacement efficiency was enhanced as the methane content increased, which could be ascribed to a decreasing amount of adsorbed oil and an increasing amount of adsorbed methane as the methane content increased. In addition, we found that the threshold displacement pressure in the displacement process gradually decreased as the methane content increased as follows: Prm/o=0 > Prm/o=1/4 > Prm/o=2/3 > Prm/o=3/2 > Prm/o=4/1, which could be ascribed to the decrease of the oil/water IFT and the oil viscosity as the methane content increases.
Our work provides an in-depth understanding of the occurrence characteristics and flow resistance of oil with associated gas in deep oil reservoirs, which may help to promote the storage and development of deep oil and gas and provide valuable references to optimize oil and gas extraction processes. Due to limitations in computational power, our research can only be conducted on the size of nano-pores. However, there are many micron-scale or larger-size pores in the oil and gas reservoir. In addition to this, the impact of heterogeneity in oil and gas reservoirs on the displacement process was not considered in this work. Relevant in-depth research is expected to be conducted from the perspective of seepage mechanics.

Supplementary Materials

The following supporting information can be downloaded at: https://www.mdpi.com/article/10.3390/pr11092529/s1, Table S1. Force field parameters for octane, methane, water and quartz. Table S2. Conversion parameters of threshold displacement pressure. Figure S1. The initial model of water/oil/methane nano-pore throat systems. Figure S2. The density profiles of oil and methane along y axis in water displacement oil and methane process. Figure S3. Schematic diagram of Jamin effect (Reference [52]). Figure S4. Snapshot of MD simulation of oil-water interfacial tension. (References [53,54,55] are cited in the Supplementary Materials).

Author Contributions

Conceptualization, L.Z. and Y.Y.; methodology, L.Z., W.W. and Y.Y.; validation, C.Z., J.Z. and Y.L.; formal analysis, L.Z. and Y.Y.; investigation, C.Z., L.Z. and Y.Y.; data curation, C.Z. and L.Z.; writing—original draft preparation, L.Z.; writing—review and editing, L.Z. and Y.Y.; visualization, L.Z., C.Z. and J.Z.; funding acquisition, L.Z., W.W. and Y.Y. All authors have read and agreed to the published version of the manuscript.

Funding

This work was financially supported by the Natural Science Foundation of Shandong Province (ZR2022ME138) and the National Natural Science Foundations of China (52073305, 42272145).

Conflicts of Interest

The authors declare no conflict of interest.

References

  1. Jiao, F.Z. Re-recognition of “unconventional” in unconventional oil and gas. Petrol. Explor. Dev. 2019, 46, 847–855. [Google Scholar] [CrossRef]
  2. Tian, Y.X.; Qi, Y.M.; Chen, S.J.; Han, H.J.; Wang, H.Y.; Gong, X.Z.; Zhang, M.; Jiang, X.D.; Chen, Y.G. Recombination of hydrogen bonds clipping interfacial film effectively for dehydrated tight oil. Sep. Purif. Technol. 2023, 319, 124093. [Google Scholar] [CrossRef]
  3. Lior, N. Exergy, Energy, and Gas Flow Analysis of Hydrofractured Shale Gas Extraction. J. Energy Resour. Technol. 2016, 138, 061601. [Google Scholar] [CrossRef]
  4. Liu, C.Y.; Huang, L.; Zhang, D.D.; Zhao, J.F.; Deng, Y.; Guo, P.; Huang, Y.J.; Wang, J.Q. Genetic causes of oil-rich and oil-poor reservoirs: Implications from two Cenozoic basins in the eastern North China Craton. Sci. China Earth Sci. 2018, 61, 1910–1931. [Google Scholar] [CrossRef]
  5. You, X.L.; Wu, S.N.; Xu, F. The characteristics and main control factors of hydrocarbon accumulation of ultra-deep marine carbonates in the Tarim Basin, Nw China—A review. Carpath. J. Earth Environ. 2018, 13, 135–146. [Google Scholar] [CrossRef]
  6. Nurbekova, R.; Smirnova, N.; Goncharev, I.; Sachsenhofer, R.F.; Hazlett, R.; Smirnov, G.; Yensepbayev, T.; Mametov, S.; Fustic, M. High-quality source rocks in an underexplored basin: The upper Carboniferous-Permian succession in the Zaysan Basin (Kazakhstan). Int. J. Coal. Geol. 2023, 272, 104254. [Google Scholar] [CrossRef]
  7. Zhu, G.Y.; Zou, C.N.; Yang, H.J.; Wang, K.; Zheng, D.M.; Zhu, Y.F.; Wang, Y. Hydrocarbon accumulation mechanisms and industrial exploration depth of large-area fracture-cavity carbonates in the Tarim Basin, western China. J. Petrol. Sci. Eng. 2015, 133, 889–907. [Google Scholar] [CrossRef]
  8. Sutton, R.P. Fundamental PVT Calculations for Associated and Gas/Condensate Natural-Gas Systems. SPE Res. Eval. Eng. 2007, 10, 270–284. [Google Scholar] [CrossRef]
  9. Tao, K.; Cao, J.; Chen, X.; Nueraili, Z.; Hu, W. Deep hydrocarbons in the northwestern Junggar Basin (NW China): Geochemistry, origin, and implications for the oil vs gas generation potential of post-mature saline lacustrine source rocks. Mar. Petrol. Geol. 2019, 109, 623–640. [Google Scholar] [CrossRef]
  10. Su, Y.L.; Zhang, X.; Li, L.; Hao, Y.M.; Zhan, S.Y.; Wang, W.D.; Wu, Z.Y.; Zhang, W.J. Experimental study on microscopic mechanisms and displacement efficiency of N-2 flooding in deep-buried clastic reservoirs. J. Petrol. Sci. Eng. 2022, 208, 109789. [Google Scholar] [CrossRef]
  11. Zhu, G.Y.; Zhang, Z.Y.; Zhou, X.X.; Yan, L.; Sun, C.H.; Zhao, B. Preservation of Ultradeep Liquid Oil and Its Exploration Limit. Energy Fuels 2018, 32, 11165–11176. [Google Scholar] [CrossRef]
  12. Zhang, P.F.; Lu, S.F.; Li, J.Q.; Chang, X.C.; Lin, Z.Z.; Chen, G.; Li, J.J.; Liu, J.Z.; Tian, S.S. Evaluating microdistribution of adsorbed and free oil in a lacustrine shale using nuclear magnetic resonance: A theoretical and experimental study. J. Petrol. Sci. Eng. 2022, 212, 110208. [Google Scholar] [CrossRef]
  13. Li, J.; Wu, Q.Z.; Jin, W.J.; Lu, J.; Nan, Z.Y. Logging evaluation of free-gas saturation and volume content in Wufeng-Longmaxi organic-rich shales in the Upper Yangtze Platform, China. Mar. Petrol. Geol. 2019, 100, 530–539. [Google Scholar] [CrossRef]
  14. Zhao, H.J.; Lai, Z.P.; Firoozabadi, A. Sorption Hysteresis of Light Hydrocarbons and Carbon Dioxide in Shale and Kerogen. Sci. Rep. 2017, 7, 16209. [Google Scholar] [CrossRef] [PubMed]
  15. Rezlerová, E.; Jain, S.K.; Lísal, M. Adsorption, Diffusion, and Transport of C1 to C3 Alkanes and Carbon Dioxide in Dual-Porosity Kerogens: Insights from Molecular Simulations. Energy Fuels 2023, 37, 492–508. [Google Scholar] [CrossRef]
  16. Wu, S.; Luo, W.N.; Fang, S.D.; Sun, Z.; Yan, S.H.; Li, Y.H. Wettability Impact on Nanoconfined Methane Adsorption Behavior: A Simplified Local Density Investigation. Energy Fuels 2022, 36, 14204–14219. [Google Scholar] [CrossRef]
  17. Devegowda, D.; Sapmanee, K.; Civan, F.; Sigal, R. Phase Behavior of Gas Condensates in Shales Due to Pore Proximity Effects: Implications for Transport, Reserves and Well Productivity. In Proceedings of the SPE Annual Technical Conference and Exhibition, San Antonio, TX, USA, 8–10 October 2012. [Google Scholar] [CrossRef]
  18. Beal, C. The viscosity of air, water, natural gas, crude oil and its associated gases at oil field temperatures and pressures. Trans. AIME 1946, 165, 94–115. [Google Scholar] [CrossRef]
  19. Jennings, H.Y., Jr.; Newman, G.H. The effect of temperature and pressure on the interfacial tension of water against methanenormal decane mixtures. SPEJ Soc. Pet. Eng. J. 1971, 11, 171–175. [Google Scholar] [CrossRef]
  20. Moh, D.Y.; Zhang, H.W.; Sun, S.Y.; Qiao, R. Molecular anatomy and macroscopic behavior of oil extraction from nanopores by CO2 and CH4. Fuel 2022, 324, 124662. [Google Scholar] [CrossRef]
  21. Fang, T.M.; Li, S.J.; Zhang, Y.N.; Su, Y.L.; Yan, Y.G.; Zhang, J. How the oil recovery in deep oil reservoirs is affected by injected gas types: A molecular dynamics simulation study. Chem. Eng. Sci. 2021, 231, 116286. [Google Scholar] [CrossRef]
  22. Zhang, J.; Dong, Z.H.; Wang, M.H.; Yan, Y.G. Effects of the Methane Content on the Water−Oil Interface: Insights from the Molecular Level. Energy Fuels 2017, 31, 7026–7032. [Google Scholar] [CrossRef]
  23. Wu, K.; Chen, Z.; Li, J.; Li, X.; Xu, J.; Dong, X. Wettability effect on nanoconfined water flow. Proc. Natl. Acad. Sci. USA 2017, 114, 3358–3363. [Google Scholar] [CrossRef]
  24. Akkutlu, I.Y.; Fathi, E. Multiscale gas transport in shales with local kerogen heterogeneities. SPE J. 2012, 17, 1002–1011. [Google Scholar] [CrossRef]
  25. Yang, T.; Li, X.; Zhang, D. Quantitative dynamic analysis of gas desorption contribution to production in shale gas reservoirs. J. Unconv. Oil Gas Resour. 2015, 9, 18–30. [Google Scholar] [CrossRef]
  26. Wang, S.; Feng, Q.H.; Javadpour, F.; Yang, Y.B. Breakdown of Fast Mass Transport of Methane through Calcite Nanopores. J. Phys. Chem. C 2016, 120, 14260–14269. [Google Scholar] [CrossRef]
  27. Xiong, C.M.; Li, S.J.; Ding, B.; Geng, X.F.; Zhang, J.; Yan, Y.G. Molecular insight into the oil displacement mechanism of gas flooding in deep oil reservoir. Chem. Phys. Lett. 2021, 783, 139044. [Google Scholar] [CrossRef]
  28. Zhang, Y.N.; Fang, T.M.; Ding, B.; Wang, W.D.; Yan, Y.G.; Li, Z.; Guo, W.Y.; Zhang, J. Migration of oil/methane mixture in shale inorganic nano-pore throat: A molecular dynamics simulation study. J. Petrol. Sci. Eng. 2020, 187, 106784. [Google Scholar] [CrossRef]
  29. Wang, S.; Javadpour, F.; Feng, Q.H. Molecular dynamics simulations of oil transport through inorganic nanopores in shale. Fuel 2016, 171, 74–86. [Google Scholar] [CrossRef]
  30. Liang, S.X.; Fang, T.M.; Xiong, W.; Ding, B.; Yan, Y.G.; Zhang, J. Oil detachment by modified nanoparticles: A molecular dynamics simulation study. Comput. Mater. Sci. 2019, 170, 109177. [Google Scholar] [CrossRef]
  31. Qin, Y.; Yang, X.N.; Zhu, Y.F.; Ping, J.L. Molecular Dynamics Simulation of Interaction between Supercritical CO2 Fluid and Modified Silica Surfaces. J. Phys. Chem. C 2008, 112, 12815–12824. [Google Scholar] [CrossRef]
  32. Lavoie, R.G.; Ouellet, M.; Hamelin, J.; Benard, P. Numerical Implementation of the Multicomponent Potential Theory of Adsorption in Python Using the NIST Refprop Database. Commun. Comput. Phys. 2018, 23, 1602–1625. [Google Scholar] [CrossRef]
  33. Berendsen, H.J.C.; Grigera, J.R.; Straatsma, T.P. The missing term in effective pair potentials. J. Phys. Chem. 1987, 91, 6269–6271. [Google Scholar] [CrossRef]
  34. Dauber-Osguthorpe, P.; Roberts, V.A.; Osguthorpe, D.J.; Wolff, J.; Genest, M.; Hagler, A.T. Structure and energetics of ligand binding to proteins: Escherichia coli dihydrofolate reductase-trimethoprim, a drug-receptor system. Proteins Struct. Funct. Genet. 1988, 4, 31–47. [Google Scholar] [CrossRef] [PubMed]
  35. Forte, G.; Grassi, A.; Marletta, G. Molecular Modeling of Oligopeptide Adsorption onto Functionalized Quartz Surfaces. J. Phys. Chem. B 2007, 111, 11237–11243. [Google Scholar] [CrossRef]
  36. Jorgensen, W.L.; Maxwell, D.S.; Tirado-Rives, J. Development and testing of the OPLS all-atom force field on conformational energetics and properties of organic liquids. J. Am. Chem. Soc. 1996, 118, 11225–11236. [Google Scholar] [CrossRef]
  37. Plimpton, S. Fast parallel algorithms for short-range molecular dynamics. J. Comput. Phys. 1995, 117, 1–19. [Google Scholar] [CrossRef]
  38. Nosé, S. A molecular dynamics method for simulations in the canonical ensemble. Mol. Phys. 1984, 52, 255–268. [Google Scholar] [CrossRef]
  39. Hockney, R.W.; Eastwood, J.W. Computer Simulation Using Particles; CRC Press: Boca Raton, FL, USA, 1988. [Google Scholar] [CrossRef]
  40. Humphrey, W.; Dalke, A.; Schulten, K. VMD: Visual molecular dynamics. J. Mol. Graph. Model. 1996, 14, 33–38. [Google Scholar] [CrossRef]
  41. Izrailev, S.; Stepaniants, S.; Isralewitz, B.; Kosztin, D.; Lu, H.; Molnar, F.; Wriggers, W.; Schulten, K. Steered Molecular Dynamics. Computational Molecular Dynamics: Challenges, Methods, Ideas; Springer: Berlin/Heidelberg, Germany, 1999; pp. 39–65. [Google Scholar]
  42. Chen, W.; Foster, A.S.; Alava, M.J.; Laurson, L. Stick-slip control in nanoscale boundary lubrication by surface wettability. Phys. Rev. Lett. 2015, 114, 095502. [Google Scholar] [CrossRef]
  43. Castro, M.A.; Clarke, S.M.; Inaba, A.; Arnold, T.; Thomas, R.K. Competitive adsorption of simple linear alkane mixtures onto graphite. J. Phys. Chem. B 1998, 102, 10528–10534. [Google Scholar] [CrossRef]
  44. Harrison, A.; Cracknell, R.F.; Krueger-Venus, J.; Sarkisov, L. Branched versus linear alkane adsorption in carbonaceous slit pores. Adsorption 2014, 20, 427–437. [Google Scholar] [CrossRef]
  45. Dong, H.; Zhu, Q.Y.; Wang, L.; Yue, X.K.; Fang, H.X.; Wang, Z.J.; Liu, S.Y.; Wei, S.X.; Lu, X.Q. Effects of Shale Pore Size and Connectivity on scCO2 Enhanced Oil Recovery: A Molecular Dynamics Simulation Investigation. Langmuir 2023, 39, 6287–6299. [Google Scholar] [CrossRef] [PubMed]
  46. Sui, H.G.; Zhang, F.Y.; Wang, Z.Q.; Wang, D.S.; Wang, Y.D. Molecular simulations of oil adsorption and transport behavior in inorganic shale. J. Mol. Liq. 2020, 305, 112745. [Google Scholar] [CrossRef]
  47. Hao, X.S.; Jia, Z.H.; Zhang, L.L.; Wang, X.; Zhang, J.; Zhou, L.X.; Yan, Y.G. Molecular Insight into the Methane Occurrence inside a Shale Nanochannel with Formation Water. Energy Fuel 2023, 37, 1207–1215. [Google Scholar] [CrossRef]
  48. Wang, X.; Zhang, Z.; Zhang, J.; He, J. Insight into the pressure-induced displacement mechanism for selecting efficient nanofluids in various capillaries. Environ. Sci. Nano 2020, 7, 2785. [Google Scholar] [CrossRef]
  49. Bosanquet, C.H. On the flow of liquids into capillary tubes. Philos. Mag. Ser. 6 1923, 45, 525–531. [Google Scholar] [CrossRef]
  50. Oyarzua, E.; Walther, J.H.; Mejia, A.; Zambrano, H.A. Early regimes of water capillary flow in slit silica nanochannels. Phys. Chem. Chem. Phys. 2015, 17, 14731–14739. [Google Scholar] [CrossRef]
  51. Smith, W.O.; Crane, M.D. The Jamin effect in cylindrical tubes. J. Am. Chem. Soc. 1930, 52, 1345–1349. [Google Scholar] [CrossRef]
  52. Liang, M.; Yang, S.; Miao, T.; Yu, B. Minimum applied pressure for a drop through an abruptly constricted capillary. Microfluid. Nanofluidics 2015, 19, 1–8. [Google Scholar] [CrossRef]
  53. Jang, S.S.; Lin, S.T.; Maiti, P.K.; Blanco, M.; Goddard, W.A.; Shuler, P.; Tang, Y.C. Molecular Dynamics Study of a Surfactant-Mediated Decane-Water Interface: Effect of Molecular Architecture of Alkyl Benzene Sulfonate. J. Phys. Chem. B 2004, 108, 12130–12140. [Google Scholar] [CrossRef]
  54. Ndao, M.; Goujon, F.; Ghoufi, A.; Patrice, M. Coarse-grained modeling of the oil-water-surfactant interface through the local definition of the pressure tensor and interfacial tension. Theor. Chem. Acc. 2017, 136, 21. [Google Scholar] [CrossRef]
  55. Kunieda, M.; Nakaoka, K.; Liang, Y.; Miranda, C.; Ueda, A.; Takahashi, S.; Okabe, H.; Matsuoka, T. Self-Accumulation of Aromatics at the Oil-Water Interface through Weak Hydrogen Bonding. J. Am. Chem. Soc. 2010, 132, 18281–18286. [Google Scholar] [CrossRef] [PubMed]
Figure 1. (a) The initial model of water/oil and water/oil/methane (the molar ratio of methane to oil rm/o is 3/2) nano-pore throat system; (b) hydrophobic quartz surface and nano-pore throat.
Processes 11 02529 g001
Figure 2. (ae) The oil and methane EMD configurations of water/oil/methane nano-pore throat systems. The molar ratio of methane to oil rm/o is (a) 0, (b) 1/4, (c) 2/3, (d) 3/2, and (e) 4/1. (f) The density distribution of oil and (g) the density distribution of methane along y-axis for different rm/o systems.
Processes 11 02529 g002
Figure 3. The atom number of adsorbed (a) oil and (b) methane for different rm/o systems.
Processes 11 02529 g003
Figure 4. The interaction energy between rock surface, methane, and oil in the equilibrium molecular dynamics process.
Processes 11 02529 g004
Figure 5. The dynamic process of water displacement oil and methane process at 2 ns, 4 ns, 6 ns, and 8 ns for different rm/o systems.
Processes 11 02529 g005
Figure 6. The density distribution of oil and methane along the z-axis and y-axis for rm/o = 3/2 system. (a,c) Oil density; (b,d) methane density.
Processes 11 02529 g006
Figure 7. The interaction energy between different components in water displacement oil and methane process.
Processes 11 02529 g007
Figure 8. Pulling force as a function of simulation time for (a) pure oil system and (b) different rm/o systems; (c) the threshold displacement pressure for different rm/o systems.
Processes 11 02529 g008
Figure 9. The oil–water interfacial tension (IFT) of different rm/o systems.
Processes 11 02529 g009
Figure 10. Atom number of water in the nano-pore throat for different rm/o systems in the water displacement oil and methane process.
Processes 11 02529 g010
Figure 11. Atom number of adsorbed (a) oil and (b) methane in the nano-pore throat for different rm/o systems in water displacement oil and methane process.
Processes 11 02529 g011
Table 1. The density and molecule numbers of the mixture fluid of octane and methane used in our models (353 K, 20 MPa).
Molar Ratio of Methane to OilDensity a (g/cm3)Octane NumberMethane Number
00.6767880
1/40.624768192
2/30.581690460
3/20.520600900
4/10.5194611844
a The density of the mixture fluid of octane and methane is from the NIST-REFPROP database [32].
Disclaimer/Publisher’s Note: The statements, opinions and data contained in all publications are solely those of the individual author(s) and contributor(s) and not of MDPI and/or the editor(s). MDPI and/or the editor(s) disclaim responsibility for any injury to people or property resulting from any ideas, methods, instructions or products referred to in the content.

