Abstract
In order to avoid potential personnel and financial losses, the evaluation of pre-drilling safety is of great importance in oil and gas exploration and development. This paper presents a method of evaluating pre-drilling safety through combining the Analytic Hierarchy Process (AHP) with the Alternating Condition Expectation (ACE) method. An indicator system with a 9-3-1 structure was established, incorporating various unrestricted variables to describe the technical factor. Additionally, nine membership functions and weights were determined in order to build the AHP model by connecting the independent variables in the basic layer to dependent variables in the middle layer. Four transformed functions were also formulated to construct the ACE model by linking the middle variables to the pre-drilling safety value in the final layer. A total of 28 sets of on-site drilling data from three oilfields were collected for the establishment and verification of the AHP-ACE model. Average absolute error (AAE) and average absolute relative error (AARE) of the model to predict the training data are 0.03 and 4.29%, respectively, whereas the AAE and AARE for verification samples are 0.03 and 4.51%, respectively. The sensitivity ranking of the three potential variables is as follows: human factor exhibits the highest degree of sensitivity, followed by natural factor and technical factor, in descending order. The AHP-ACE model for pre-drilling safety assessment faces limitations in universal applicability and scope, particularly in real-time drilling activities. However, its potential for improvement lies in integrating insights from past operations and expanding the dataset to enhance accuracy and broaden safety assessment coverage. This method is not limited by blocks, which is of great significance to ensure drilling safety.
1. Introduction
Drilling engineering is very important for the development of underground fluid resources, such as oil, natural gas and gas hydrates, and is a systemic engineering consisting of a long process, complex technology and multiple procedures. As oil and gas exploration expands to unconventional and more complicated areas, such as shale gas, shale oil, deep coal mines and hot dry rocks, the risk of drilling safety accidents is on the rise [1,2]. If such accidents occur, they may result in serious losses, including personal injury, economic losses and environmental pollution [3,4]. Thus, it is paramount to evaluate the pre-drilling safety level, identify unsafe factors, prevent accidents and ensure the effective development of underground resources [5].
Drilling-related underlying accidents, such as blowouts, lost circulation, sticking, fish and wellbore instability, can be attributed to several causes, including unexpected geologic variances, improperly executed procedures and unadaptable equipment [5,6,7,8]. To evaluate drilling safety, two steps are usually employed. Firstly, samples are acquired, and an indicator system is constructed. Secondly, a safety evaluation model is established, and risk is evaluated. Numerous scholars have conducted research into specific drilling risk assessment. Mirderikvand et al. [9] proposed a well barrier indicator system, which identifies policymaking, operational, personal and mechanical factors, to evaluate the probability of blowout accidents using a DANP method. Caia et al. [10] estimated the occurrence probability of blowout events by combining Dynamic Event Trees and Decision Trees. Liang et al. [11] proposed a fuzzy multi-level algorithm based on a Support Vector Regression Machine (SVR) for predicting drilling leakage events by taking into account 12 influencing factors. The occurrence probability of leakage events was further evaluated by establishing an integrated Decision Making Trial and Evaluation Laboratory (DEMATEL)-Bayesian Network (BN) method [12,13]. The other petroleum drilling risk assessments such as equipment risk, managed safety accident and operating safety events were studied by establishing indicator systems and evaluation methods [14,15,16,17].
Drilling safety accidents are not merely a sequence of isolated safety events, but rather a complex and systemic process. On the one hand, a certain type of safety accident may be caused by a variety of factors, such as abnormal pressure fluctuations, intricate geological structures or improper implementation of operations. On the other hand, an unforeseen event may lead to a number of drilling accidents, for instance, improper operation of the drilling rig may result in equipment damage, personnel injury, kicks or leakage. The key to reducing drilling accidents lies in the formulation of a standardized and reasonable drilling plan and workflow. A comprehensive evaluation of drilling safety is the foundation for creating an effective drilling plan. To this end, several approaches have been utilized to evaluate the pre-drilling safety level, including Analytic Hierarchy Process (AHP), Fuzzy Evaluation, Rough Set Theory, Artificial Neural Network (ANN), Bayesian Network, Machine Learning and Deep-Learning Method [3,4,7,18,19,20,21,22]. Of these methods, AHP is the basis for constructing an indicator system and is used to connect directly observed factors (e.g., formation type, temperature and pressure) to a pre-drilling safety level. However, the single AHP method requires a priori assumption of the function forms (membership function) relating observed variables and drilling safety. The improper use of membership functions between the independent and dependent variables may yield incorrect evaluation of the drilling safety level. Therefore, the AHP method combined with a data-driven model is usually used to evaluate the drilling safety level. The alternating condition expectation (ACE) method is a typical data-driven method for multivariate nonparametric regression and has been used widely since it was proposed in 1985 [23,24,25,26]. In our previous study [27], an AHP-ACE model with a 12-4-1 structure was established to quantitatively estimate the drilling safety. However, the indicator system of the previous model was established on the basis of one certain oilfield, which contains several restricted variables, including bit pressure, drilling rate and drilling fluid density. It is widely acknowledged that the optimal values of those restricted variables are different with in oil fields, resulting in an unapplicable utilization of the previous AHP-ACE model in other oilfields. In order to broaden the application of the AHP-ACE method to estimate the pre-drilling safety level, the indicator system will be further optimized.
In this paper, several restricted variables (e.g., drilling optimization number and geological orientation number) are adopted to establish the indicator system and an improved the AHP-ACE model with a 9-3-1 structure is established to quantitatively evaluate the drilling safety. Firstly, the basis of the AHP-ACE method is introduced. Then, the AHP-ACE model is established on the basis of 22 groups of data collected from three oil fields. Finally, the validity and the defects of the proposed model are discussed.
2. Methodology
This section primarily introduces the indicator system of the safety prediction model, presents the principles of the Analytic Hierarchy Process (AHP) and Aggregate Constraint Evaluation (ACE) models and organizes and analyzes the data collected from three oil-fields.
2.1. Indicator System and AHP Method
The Analytic Hierarchy Process (AHP) is a systemic analytical method that integrates qualitative analysis and quantitative calculations to derive index weights for multi-layered and multifaceted evaluation problems. This methodology enables the transformation of complex and qualitative issues into quantifiable parameters. The AHP method primarily involves three main steps: identification of independent variables or key control factors, construction of a discriminant matrix, and determination of weights and membership functions. It has been widely used to build relationship between independent and dependent variables since firstly proposed by Satty [27,28]. Therefore, it is selected to establish relationship between the observed variables and the potential variables of the indicator system for pre-drilling safety evaluation. The framework of the indicator system is shown in Figure 1. It indicates that the basic layer variables consist of nine observed parameters including A1-stratum type, A2-stratum pressure, A3-stratum temperature, A4-sulfurous gas, B5-adjacent well number, B6-drilling optimization, B7-geological orientation, C8-safe construction and C9-annual training. In comparison to the previously published research in the literature [27], the restrained variables (e.g., bit pressure, drilling rate and drilling fluid density) are swapped out for unrestrained variables (e.g., adjacent well number, B6-drilling optimization, B7-geological orientation). These unrestrained variables have a consistent impact on the pre-drilling safety level. As an example, the value of the drilling orientation denotes the number of times the geological oriented technology has been applied by the drilling contractor before drilling the target well. The higher the drilling orientation value, the better the drilling safety can be assured, a principle which is applicable to different oil fields.
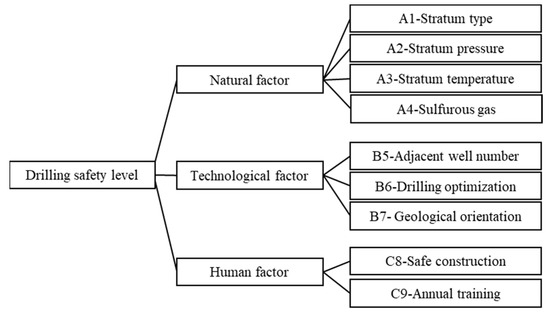
Figure 1.
The structure of the indicator system for drilling safety assessment.
The second layer variables contain three potential factors, including natural factor, technological factor and human factor. The weight and membership function of each observed variable is determined by using the AHP method. The principle of the AHP method has been presented in detail in our previous study [27].
2.2. ACE Method
When the relationship between the independent variable and the dependent variable is nonlinear and unknown in real space, those independent and dependent variables can be transformed into a virtual space according to the ACE method, and where those two types of variables form a linear relationship, their relationship in real space can be determined by several inverse transformations.
The key to the ACE method is to transform the variables in the actual space into a virtual space, at which a linear regression between the pseudo-dependent and independent variables is produced [24]. The formulation of the ACE model can be expressed as:
where and are the functions of pseudo-independent and dependent variables, respectively. is a constant value, and ε is an error. m represents the number of independent parameters.
In the ACE model, the primary problem of relating dependent variable with independent variables is transformed to establish several functions and . The optimization aim is to minimize the variance of a linear regression between the pseudo dependent and independent variables [24,26]. The is formulated as:
With the constraints: E[θ2(y)] = 1, E[θ(y)] = E[φ1(x1)] = ··· =E[φn(xn)] = 0.
In order to minimize the variance ε2(·), a series of minimizations of univariate function are conducted followed as:
The optimal transformations and generated from Equations (3) and (4) are referred to and , which can be expressed as:
where ε* is the error in the virtual space and hypothetically follow a normal distribution with zero mean.
2.3. AHP-ACE Model
The AHP method is simple for analyzing independent parameters and constructing an indicator system. However, this method depends on empirical formulas, and the prediction accuracy is poor. The ACE method is a data-driven model which can improve the prediction accuracy of the model. Therefore, the AHP-ACE method is adopted in this research.
The general architecture of the AHP-ACE model consists of three data layers and two mathematical model layers, as shown in Figure 2. The basic data layer contains nine directly observed variables. These variables are determined according to the drilling practices and expert experience. A survey table has been sent to six experienced experts and the most relevant variables related to drilling safety have been identified. Compared with 12 observed variables in the previous study [27], the basic data layer in this paper only contains nine observed variables, where four variables are unchanged, and the remaining seven variables are replaced by five new ones. The middle data layer is consisted of three potential variables, including the nature factor, technical factor, and human factor. Those potential variables are related to the corresponding parameters in the basic data layer by weights and membership functions. The final data layer is reflected to the pre-drilling safety value. Values of the pre-drilling safety are normalized in the range from 0 to 1, which are divided into four stages according to the frequency of the four types of safety events occurred in drilling engineering. (i) In the region in which safety value ranges from 0 to 0.1, the drilling safety is associated with high dangerous. (ii) In the region in which safety value ranges from 0.1 to 0.5, the drilling safety is associated with danger. (iii) In the region in which safety value ranges from 0.5 to 0.9, the drilling safety is associated with moderate safe. (iv) The remaining stage is associated with safe. The safety value is related to the three middle variables by using the ACE model.
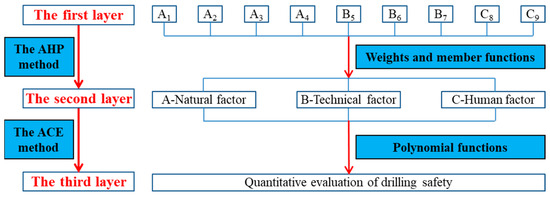
Figure 2.
Schematic diagram of the AHP-ACE model.
2.4. Data Acquirement and Processing
2.4.1. Data Collection
The co-related data of drilling safety are collected from three oil fields, XJ oilfield, XN oilfield, and TH oilfield, respectively. The data are used for building and verifying the AHP-ACE model. A total of 28 groups of data including 9 types of basic variables and the corresponding safety level are obtained, as shown in Table 1. The symbols from A1 to C9 in Table 1 correspond to different basic variables as shown in Figure 1. According to Table 1, the collected data are related to multiple stratum types, including Carbonate rock, Mud shale and Sandy conglomerate. Each column denotes distinct variables associated with these reservoirs, such as pressure, temperature, presence of sulfurous gas, adjacent well number, drilling optimization, geological orientation, safe construction parameters, annual training parameters, and safety levels. The range of each variable’s values varies across the columns, reflecting the diverse characteristics and conditions observed within the reservoirs. Values of the variables from A1 to B5 are determined on the basis of the history data of the adjacent wells. According to unreported material about the requirements of the safety assessment form for oil and gas extraction enterprises in China, the four safety levels are classified using the following rules:

Table 1.
Original data of safety index.
- High dangerous: this implies extreme danger of drilling operations, with potential occurrences such as blowouts and leakage of toxic gases (hydrogen sulfide) that can result in major safety accidents;
- Dangerous: this implies that the drilling conditions are hazardous with a substantial probability of accidents and a high risk of personnel injuries;
- Moderate safe: this indicates that the drilling conditions are acceptable, but with certain indicators leading to a heightened risk of accidents, which are still manageable and typically result in minor incidents but no casualties;
- Safe: this indicates that the drilling construction is in good condition with a very low probability of downhole accidents and a minimal potential risk of personnel casualties.
2.4.2. Data Processing
Due to differences in the original database from A1 to C9, the data shown in Table 1 are normalization to ensure accuracy of the AHP-ACE model. The process of normalization is to find suitable member-functions to correlate input variables with values ranging from 0 to 1. The closer the drilling safety value is close to 1, the safer the pre-drilling. On the contrary, the closer the drilling safety value is to 0, the more dangerous the pre-drilling. The member-functions of the nine observed variables and the drilling safety level are established on the basis of the related literature and knowledge of experienced experts, and are described in detail as follows [18,27]:
- A1—Stratum type: According to the statistical results of actual formation drilling, the carbonate rock is mostly fracture-cave formations and is prone to drilling accidents, such as leakage junk and sticking. Shale and sand conglomerate drillings are relatively safe compared with carbonate drillings. In general, the leakage occurs much more easily in the sand conglomerate than in the mud shale. Therefore, the output values corresponding to carbonate, sandy conglomerate and shale are 0.4, 0.7, 0.9, respectively. The member-function for different types of stratum is described as:
- A2—Stratum pressure: When formation pressure is less than 25 MPa, it is corresponding to a controllable safe drilling. When formation pressure is greater than 75 MPa, it will cause well kick, well collapse and other drilling accidents, and increase the risk of drilling engineering. When the pressure is larger than 100 MPa, the drilling safety is much more uncontrollable. Therefore, the form of formation pressure membership function is as follows:
- A3—Stratum temperature: When the formation temperature is greater than the specified value (105 °C is used), the life of downhole tools will be shortened and the risk of drilling engineering will be increased. The formation temperature membership function can be represented by a half-trapezoidal distribution, which is in the form of:
- A4—Sulfurous gas: When the sulfurous gas exceeds a certain value, the risk of drilling engineering will increase. The membership function of sulfurous gas (gas content, mg/L) is similar to that of temperature, which is described as:
- B5—Adjacent well;
- B6—Drilling optimization;
- B7—Geological orientation;With the adjacent well number, drilling optimization and geological orientation number increasing, the drilling safety level will increase, and there exists a threshold number (10 in this paper). Therefore, the membership functions of adjacent well, drilling optimization, and geological orientation are the same, and can be written as:
- C8—Safe construction; the membership function of safe construction is:
- C9—Annual training; the membership function of annual training is:
- Drilling safety value; The pre-drilling safety value is divided into four stages, [0.9, 1], [0.5, 0.9], [0.1, 0.5], and [0, 0.1], respectively. The corresponding pre-drilling safety level of each stage is introduced in Section 2.3.
On the basis of the above member functions and the scored law of the safety level, the original data in Table 1 can be transformed into a normalized form, as shown in Table 2. The transformed law of the nine independent variables is followed as:
Table 2.
Normalized data of safety index.
3. Results
This section mainly introduces the established AHP-ACE model. First, weights of the nine observed parameters and values of the three middle variables are determined. Then, the ACE model is established to evaluate the drilling safety level on the basis of the three potential variables.
3.1. Weight Determination
According to the AHP method, weights of the observed factors from A1 to A4 are 0.15, 0.06, 0.06, 0.73, respectively, as shown in Table 3. Since the observed variables from B5 to B7 have the same impact on the technological factor, the discrimination matrix of the technical factor is a third order unit matrix. The three variables from B5 to B7 have an identical weight, which is calculated as 0.33. Similarly, the discrimination matrix of the human factor is a two order unit matrix, and the weight of the variables C8 and C9 is the same as 0.5. The consistency test indicates that the consistency ratio of the natural discrimination matrix is less than 0.1, and the consistency indicator CI of technical and human factors is 0, which demonstrates the validity of the proposed AHP model.
Table 3.
Discrimination matrix and weights of the nature variables.
3.2. Establishment of the AHP Model
The AHP model is established based on the weight and the membership function of each observed variable. Then, the normalized data of the nine basic parameters are related to three normalized middle variables, as shown in Table 4.
Table 4.
Values of for potential variables.
3.3. Establishment of the ACE Model
In the ACE model, the three middle factors shown in Table 4 are selected as independent variables and the pre-drilling safety value is considered to be a dependent variable. The total 28 group samples are divided into two parts: a training dataset and a verification dataset. The training dataset including 22 group samples is used to generate the ACE regression model, and the verification dataset consisted of the remaining 6 group samples is used to test and verify the accuracy of the regression.
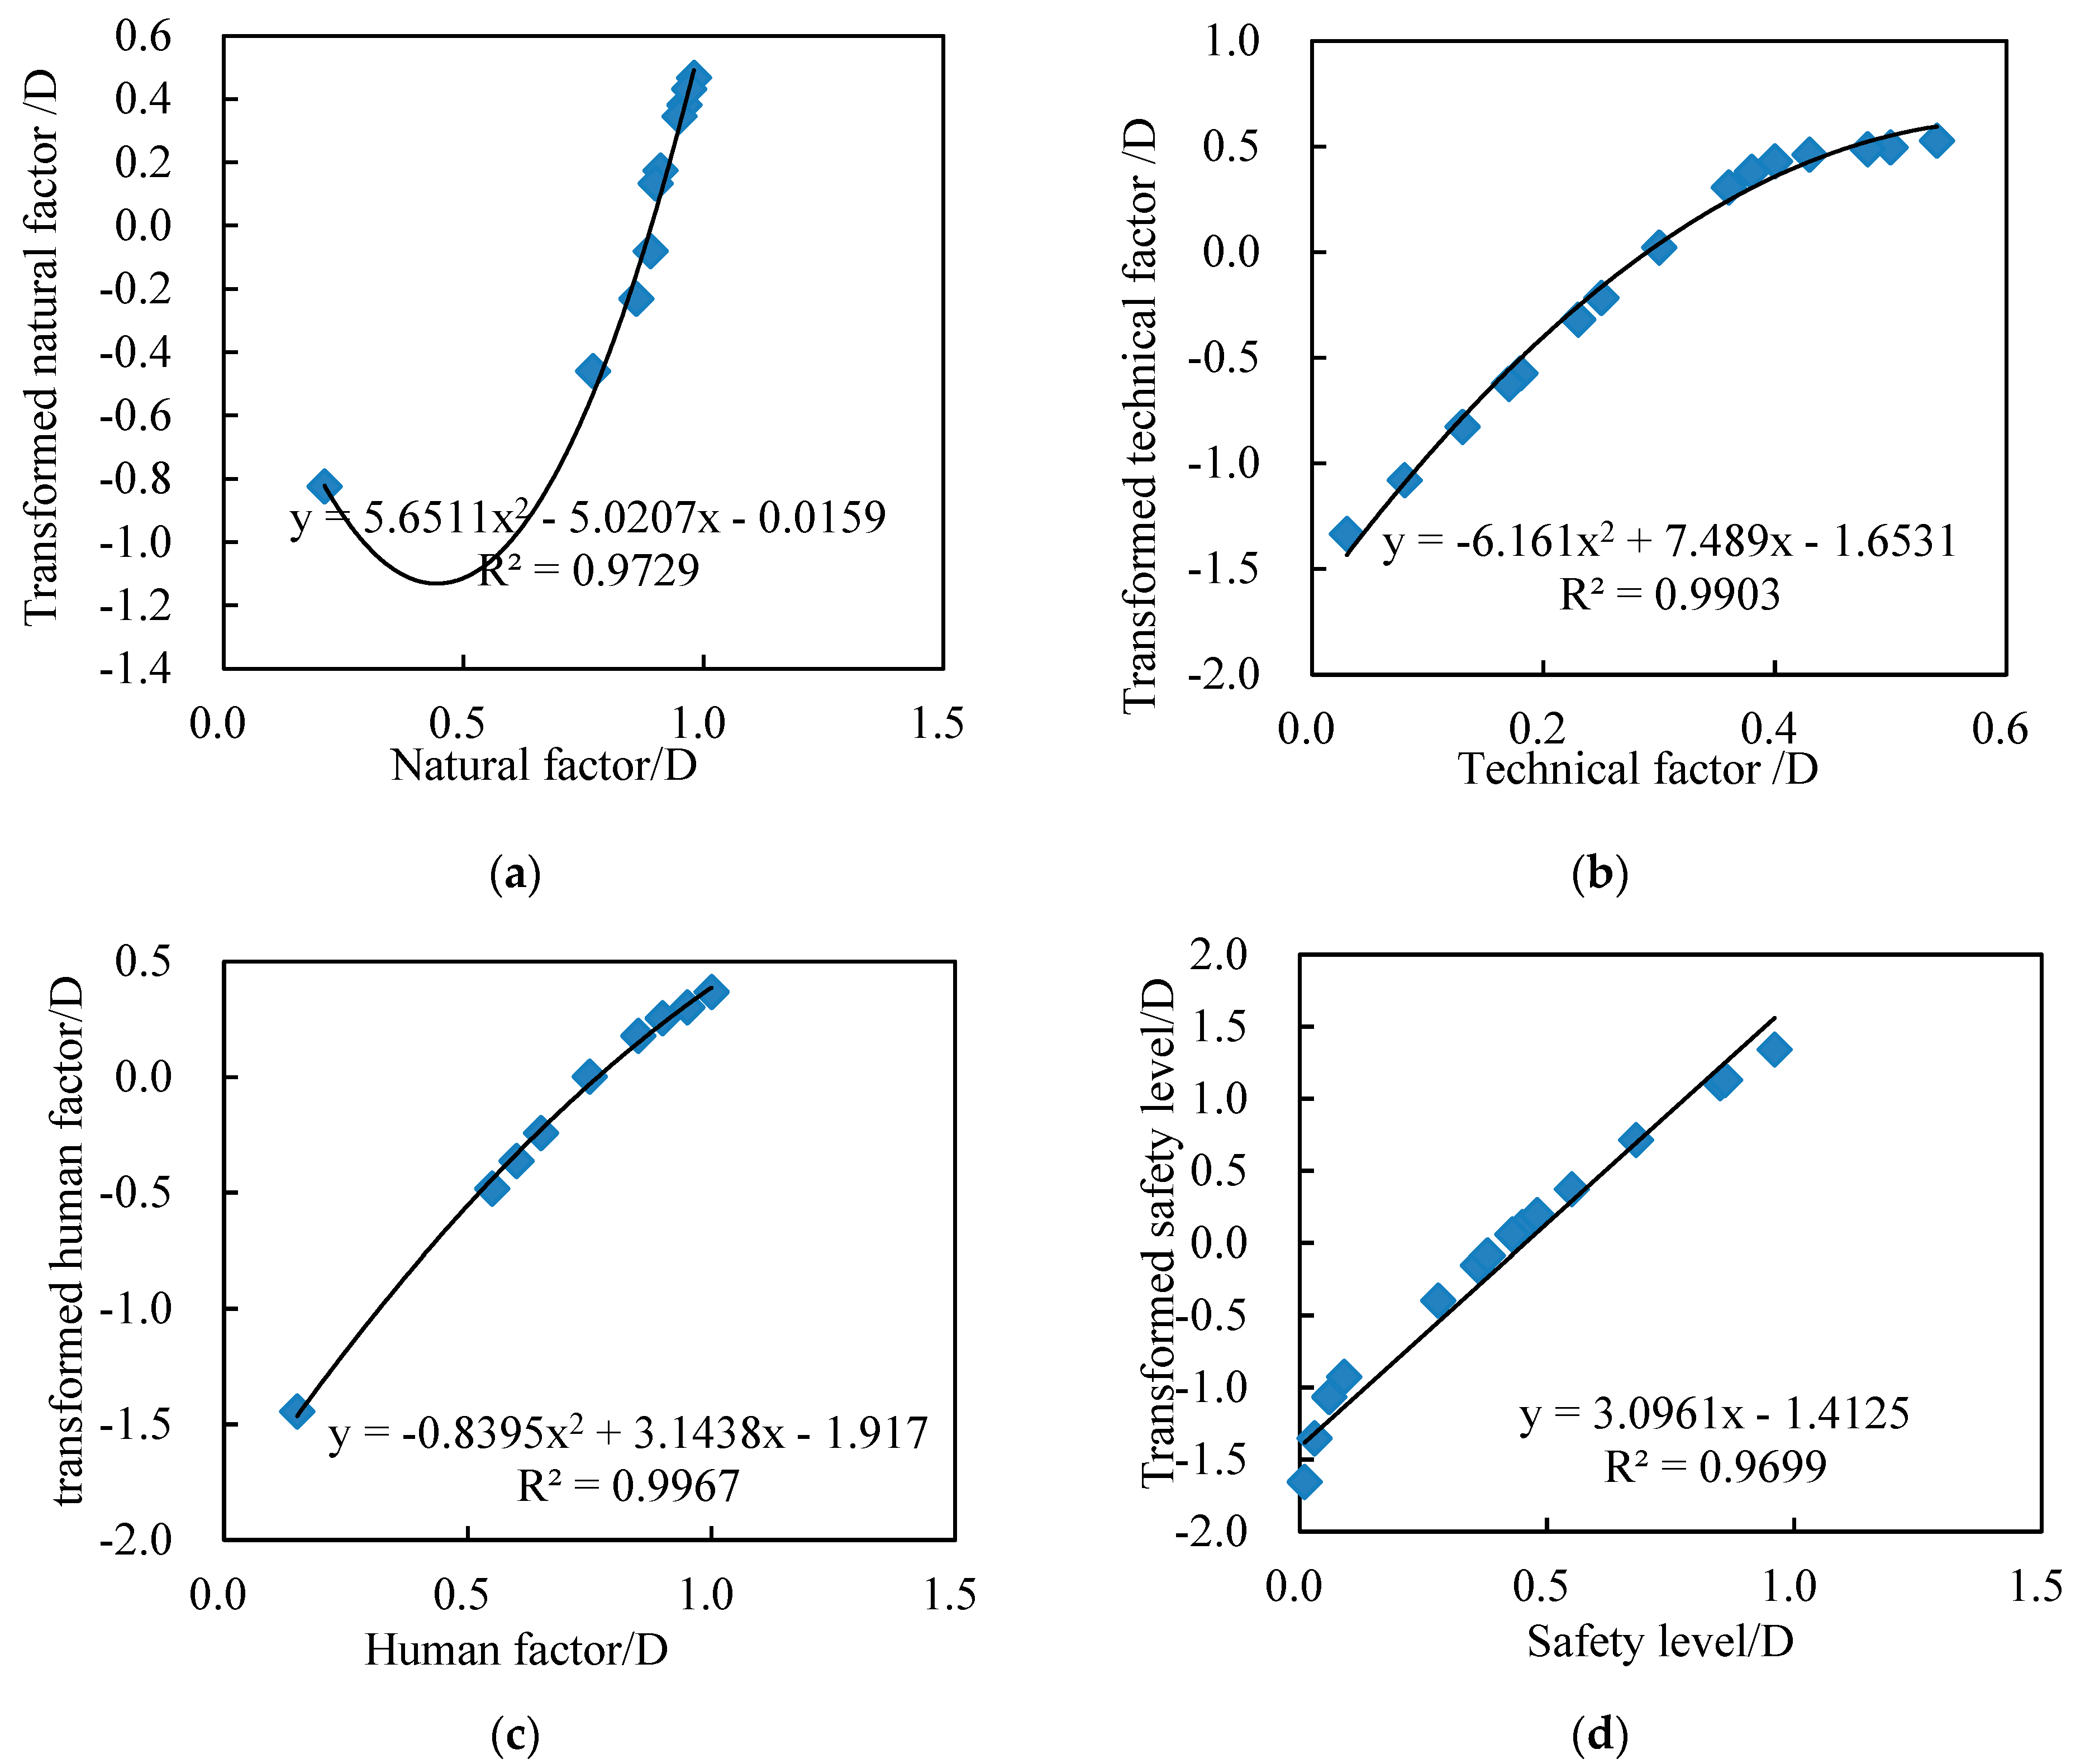
The software named GRACE1.0 [29] is used to build the regression between the pre-drilling safety value and the input variables (natural factor, technological factor, and human factor). The optimal transformation of the dependent variable is corresponding to a linear regression, as plotted in Figure 3d.
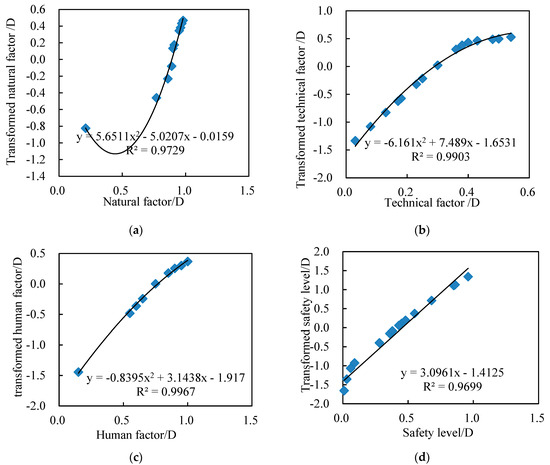
Figure 3.
Optimal transforms of the independent and dependent variables. (a) Transformation of natural factor; (b) transformation of technical factor; (c) transformation of human factor; (d) transformation of safety level.
The optimal transformations of the independent variables are in different fashions and can be fitted with polynomial functions as shown in Figure 3a–c. This indicates that the regressions of the three independent variables can be reflected by cubic polynomial expression with a universal form as:
where bk is the coefficient of optimal transformation function, which is shown in Figure 3.
It is noted that the lowest accuracy of the polynomial regressions in Figure 3 is R2 = 0.97, exceeding the threshold of 0.95. Therefore, the proposed polynomial regressions are reasonable to describe the optimal transformations of the three independent variables.
According to the above discussion, the regression of the dependent variable (Safety level, SL) can be formulated as:
Substituting Equations (1) and (13) into Equation (14), we can obtain a regression prediction model of SL with an inverse transformation of Equation (14) into actual space, the safety level SL is expressed as:
where Mk is the order of the polynomial for the kth variable, and c(i,k) is the coefficient of the ith term of the kth variable, which can be determined by the optimal regressions shown in Figure 3. D is the constant term, which covers the constant terms of all polynomials.
4. Discussion
This section mainly discusses the prediction accuracy, sensitivity, and optimization direction of the proposed AHP-ACE model.
4.1. Prediction Accuracy
The accuracy of the AHP-ACE model is described using the Average Absolute Error (AAE) and Average Absolute Relative Error (AARE). The formulae for the two errors are as follows:
where and are the ith SL value obtained from actual field and model, respectively; represents the total number of calculated points.
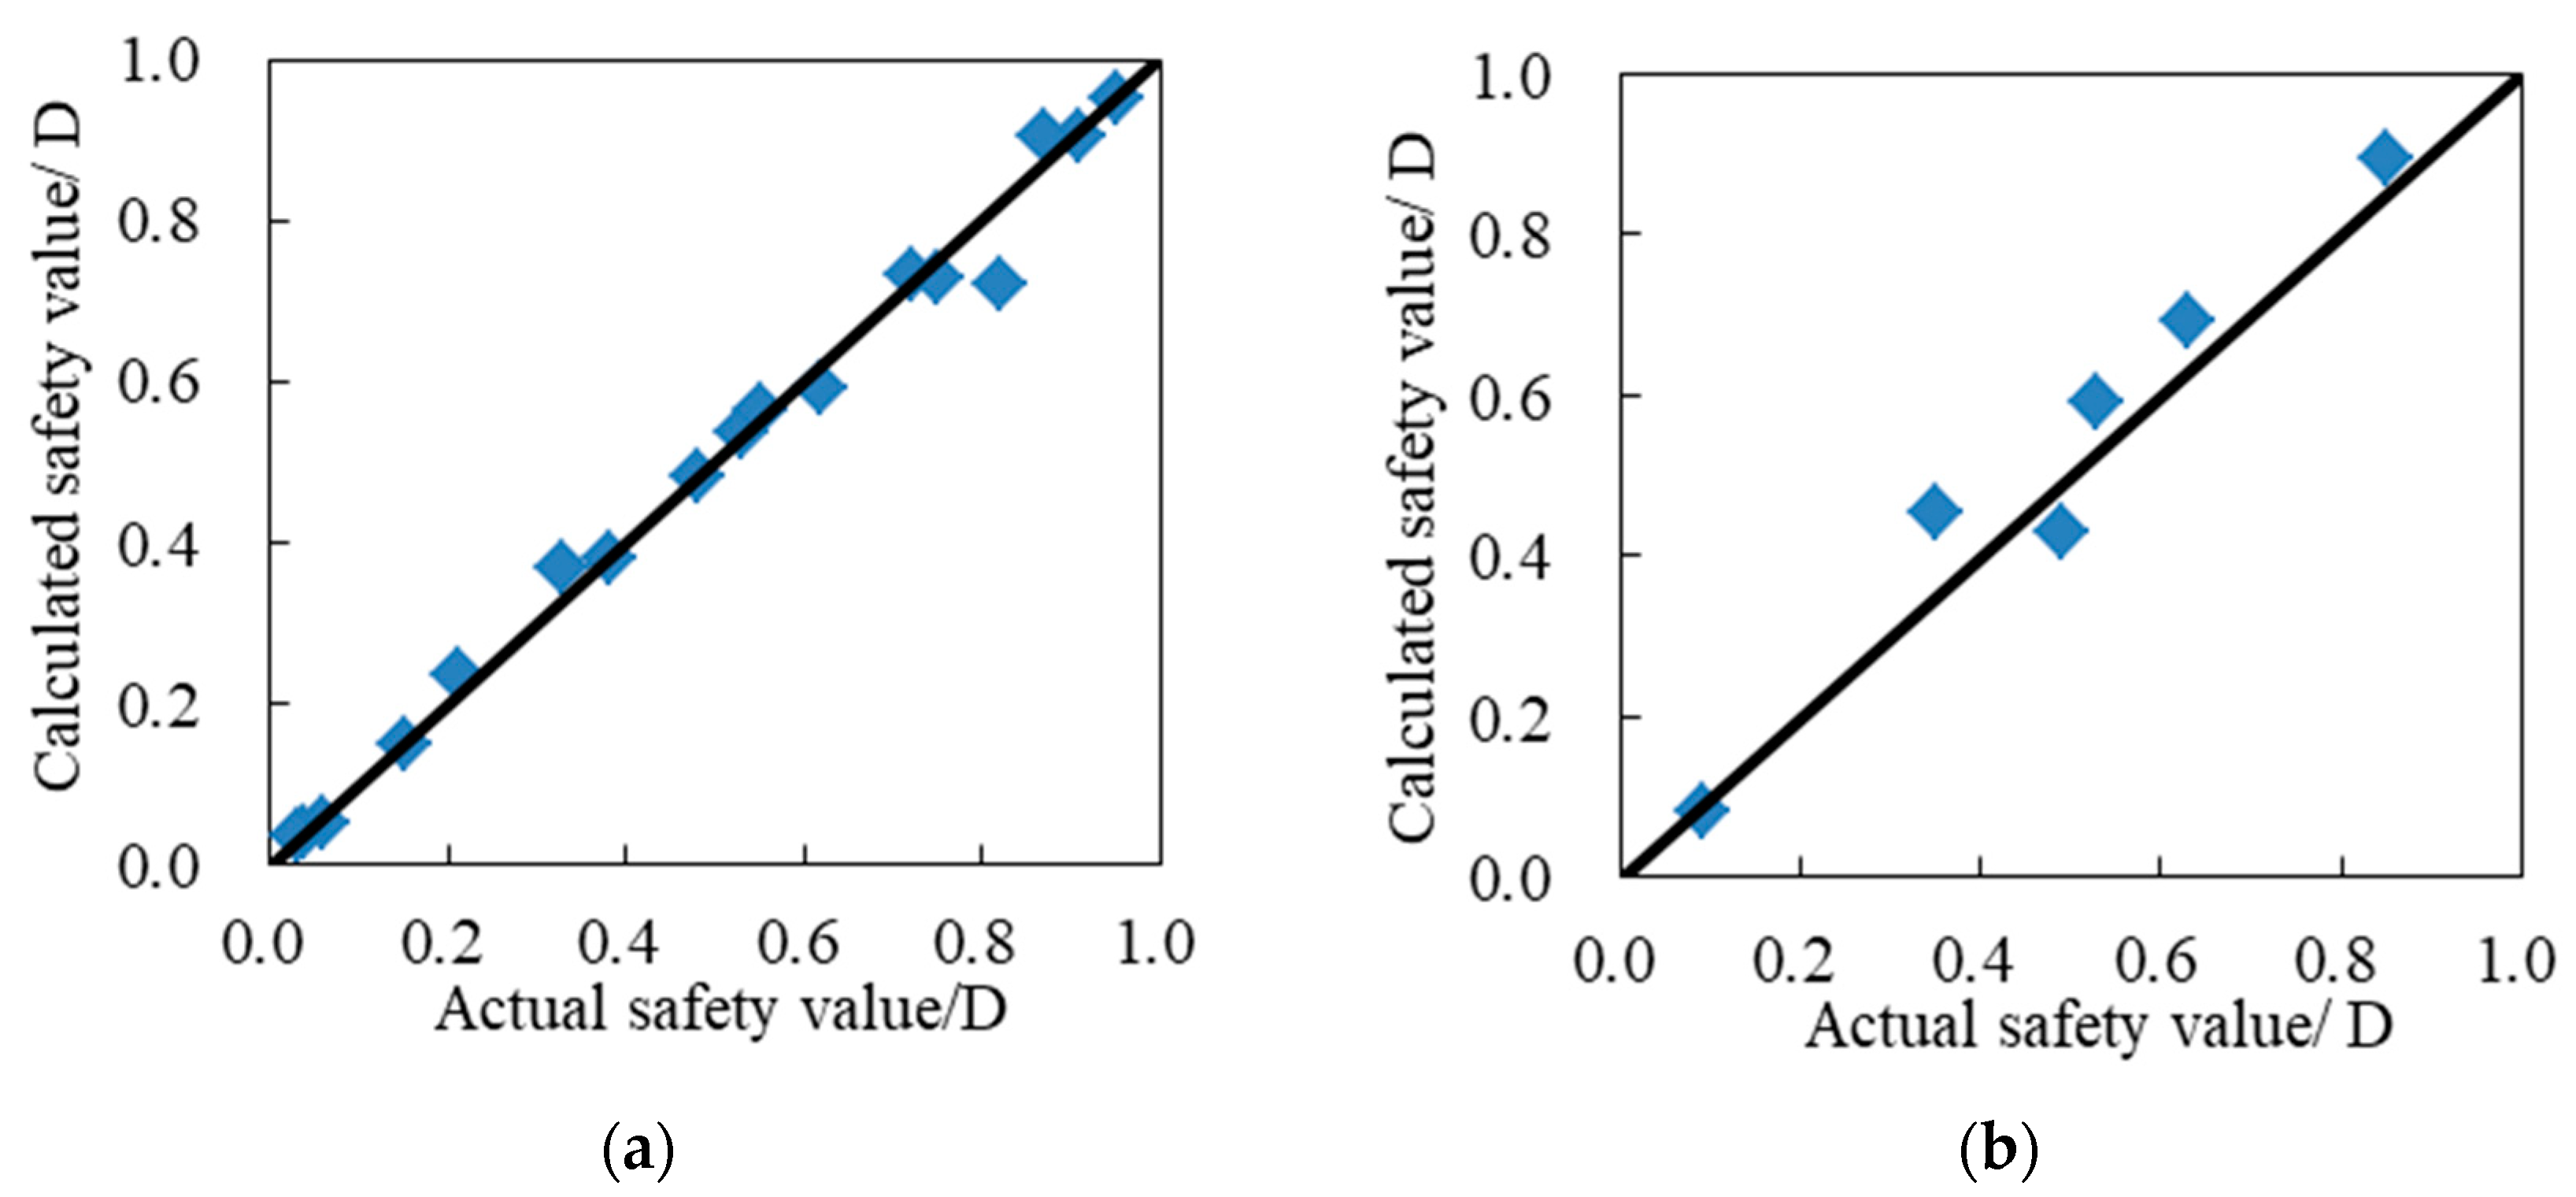
The relationship between the actual and calculated SL values is shown in Figure 4. It indicates that calculated value vs. actual value curve is similar to the 45 degree line.
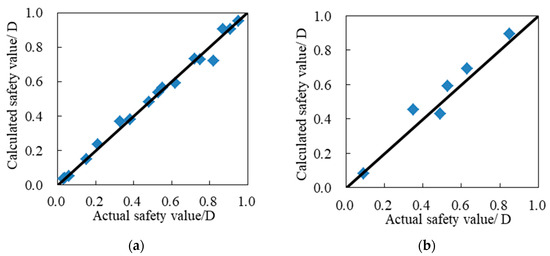
Figure 4.
Curve of actual safety value vs. calculated safety value. (a) Actual safety value vs. calculated safety value of training set; (b) actual safety value vs. calculated safety value of verification set.
The proposed model exhibits an average absolute error (AAE) [25,29,30] of 0.03 for both predicting the training and verification samples. Additionally, the average absolute relative error (AARE) [25,29,30] is 4.29% and 4.51%, respectively. Therefore, it is evidenced that the proposed AHP-ACE method is valid to evaluate the pre-drilling safety. In engineering practice, it is conventionally deemed acceptable for model predictions to exhibit a relative error below 5% [25].
4.2. Sensitivity Analysis
Values of potential variables in the range from 0 to 1 can have a direct impact on the safety level. A score of 1 denotes full value for the observed factors corresponding to the potential variable, while 0 represents the lowest score value. When 0.5 is chosen as the value for the three potential variables, the drilling safety value calculated by the ACE model proposed in this paper is 0, resulting in a safety grade of “High dangerous”, indicating that the safety of the drilling site cannot be assured when the values of the three potential variables are set to the intermediate value of 0.5.
Table 5 presents three groups of potential variable assignments and their corresponding drilling safety grade values. With technical and human values set at 1 (full score) and natural value at 0, the calculated safety grade of the well is 0.64, indicating that the safety of the drilling project can be ensured by improving the technical level and standardizing the operation behavior of the construction personnel. When natural and human values are 1 and technical value is 0, the safety grade is 0.91, which is classified as “safe”. This indicates that safe drilling can be achieved with minimal downhole complexity and a skilled construction team, without the need for advanced technology. Conversely, with natural and technical values set at 1 and human value at 0, the safety grade is 0.09, indicating a “High dangerous” level. This is in line with the actual situation of the drilling site, where improper operation by personnel can cause drilling accidents, and even lead to casualties in extreme cases.
Table 5.
Data for sensitivity analysis.
Analytically, it is evident that the human factor has the greatest impact on drilling safety, while the natural factor is more influential than the technical factor. Therefore, the order of sensitivity of the three potential variables from high to low is human factor > natural factor > technical factor.
4.3. Model Improvement
The AHP-ACE model, as established in this study, is employed for pre-drilling safety assessment. However, the proposed specific two-step approach may lack universal applicability for safety risk assessment across all drilling scenarios. The safety evaluation scope of real-time drilling, cementing, and completion activities is not encompassed within the model. It is crucial to acknowledge that a substantial reservoir of insights is available from preceding drilling operations, and it is imperative to integrate these lessons when conducting safety performance assessments. If the basic data of each stage of drilling are collected, the corresponding safety evaluation indicator system and model can be established to predicate the safety of each stage of the drilling process.
In addition, the model was constructed using 28 sets of field drilling sample data. While the dataset is comprehensive in terms of safety levels, the amount of samples is limited, which may impede the model’s accuracy. Therefore, if more sample data can be gathered in the future, it is recommended to re-examine and analyze the nonlinear regression model, then select the optimal regression model to build a new model in order to enhance the prediction accuracy and extend the prediction range.
5. Conclusions
The proposed AHP-ACE method is established to evaluate the pre-drilling safety level. The main observations are summarized as follows:
- (1)
- The AHP-ACE model with a 9-3-1 structure has been established, taking into account unrestricted variables, allowing its application in different oil fields;
- (2)
- The AHP model is composed of a series of membership functions and weights, which are employed to link the nine variables of the basic layer with the three potential variables of the middle layer. Additionally, the ACE model consists of a compilation of third-order polynomials, which are utilized to associate the three potential variables to the drilling safety values;
- (3)
- The average absolute error (AAE) and the average absolute relative error (AARE) of the model to predict the training data are 0.03 and 4.29%, respectively, whereas the AAE and AARE of the model for verification samples are 0.03 and 4.51%, respectively;
- (4)
- The sensitivity of the three middle variables, in descending order, is human factor > natural factor > technical factor;
- (5)
- The indicator system constructed in this paper is utilized for pre-drilling safety evaluation. If an index system is created for each stage of the drilling process, then a series of models can be established, enabling the safety of each stage of drilling to be forecasted;
- (6)
- In the future, it is recommended to analyze and update the nonlinear regression model with more valid sample data to obtain a more accurate model.
Author Contributions
Conceptualization, K.F. and H.Y.; methodology, K.F. and H.Y.; software, K.F. and C.W.; validation, K.F. and H.Y.; formal analysis, S.H., H.D., D.C. and H.L.; data curation, S.H., H.D., D.C. and H.L.; writing—original draft preparation, K.F. and W.S.; writing—review and editing, S.S.; visualization, J.H.; supervision, K.F.; project administration, K.F. and H.Y.; funding acquisition, K.F. and H.Y. All authors have read and agreed to the published version of the manuscript.
Funding
We are grateful for the important support from National Natural Science Foundation of China (No. 42202323), National Key R&D Program of China (No. 2022YFE0129900), National Natural Science Foundation of China (No. 52174026, NO. 52374037), and CNPC Innovation Found (No. 2021DQ02-0206).
Data Availability Statement
The data presented in this study are available within the article.
Conflicts of Interest
Authors Kunkun Fan, Shugang Hou, Huanfu Du, and Dong Chen are employed by the Sinopec Matrix Company. Author Hai Lin is employed by Western Drilling Downhole Company. Author Jia He is employed by the Tuha Oilfield Company. The remaining authors declare that the research was conducted in the absence of any commercial or financial relationships that could be construed as a potential conflict of interest. The authors declare that this study received funding from CNPC Innovation Found. The funder was not involved in the study design, collection, analysis, interpretation of data, the writing of this article or the decision to submit it for publication.
References
- Liu, Z.; Luo, R.; Yang, Z.; Wang, L.; Wang, L. Research and Practice of Risk Early Warning Technology for Lost Circulation with Drilling under the Conditions of Geological Engineering Information Fusion: The Example of the Yuanba Area. Processes 2022, 10, 2516. [Google Scholar] [CrossRef]
- Xiong, D.; Wang, C.; Wang, P.; Ding, H.; Yang, J.; Qin, Y.J. Study on Environment-Friendly Disposal and Utilization of Oil-Based Drilling Cuttings Solidified Body of Shale Gas. Constr. Build. Mater. 2022, 327, 127043. [Google Scholar] [CrossRef]
- Magana-Mora, A.; Affleck, M.; Ibrahim, M.; Makowski, G.; Kapoor, H.; Otalvora, W.C.; Jamea, M.A.; Umairin, I.S.; Zhan, G.; Gooneratne, C.P. Well Control Space Out: A Deep-Learning Approach for the Optimization of Drilling Safety Operations. IEEE Access 2021, 9, 76479–76492. [Google Scholar] [CrossRef]
- Abimbola, M.; Khan, F.; Khakzad, N.; Butt, S. Safety and Risk Analysis of Managed Pressure Drilling Operation Using Bayesian Network. Saf. Sci. 2015, 76, 133–144. [Google Scholar] [CrossRef]
- Todd, B.; Reese, M.; Brown, S. Operationalizing Upstream Process Safety for Drilling Operations by Adopting an Integrated Risk Assessment Approach. In Proceedings of the SPE/IATMI Asia Pacific Oil & Gas Conference and Exhibition, Bali, Indonesia, 29–31 October 2019. [Google Scholar]
- Visser, R.C. Offshore Accidents, Regulations and Industry Standards. In Proceedings of the SPE Western North American Region Meeting, Anchorage, AK, USA, 7–11 May 2011; Volume 2011, pp. 59–67. [Google Scholar]
- Antipova, K.; Klyuchnikov, N.; Zaytsev, A.; Gurina, E.; Romanenkova, E.; Koroteev, D. Data-Driven Model for the Drilling Accidents Prediction. In Proceedings of the SPE Annual Technical Conference and Exhibition, Calgary, AB, Canada, 30 September–2 October 2019. [Google Scholar]
- Gurina, E.; Klyuchnikov, N.; Zaytsev, A.; Romanenkova, E.; Antipova, K.; Simon, I.; Makarov, V.; Koroteev, D. Application of Machine Learning to Accidents Detection at Directional Drilling. J. Pet. Sci. Eng. 2020, 184, 106519. [Google Scholar] [CrossRef]
- Mirderikvand, H.; Razavian, F.; Nakhaee, A.; Moradi Ghiasabadi, B.; Gholamnia, R. A Barrier Risk-Based Evaluation Model for Drilling Blowouts. J. Loss Prev. Process Ind. 2022, 74, 104624. [Google Scholar] [CrossRef]
- Caia, A.; Di-Lullo, A.G.; De-Ghetto, G.; Guadagnini, A. Probabilistic Analysis of Risk and Mitigation of Deepwater Well Blowouts and Oil Spills. Stoch. Environ. Res. Risk Assess. 2018, 32, 2647–2666. [Google Scholar] [CrossRef]
- Liang, H.; Zou, J.; Li, Z.; Khan, M.J.; Lu, Y. Dynamic Evaluation of Drilling Leakage Risk Based on Fuzzy Theory and PSO-SVR Algorithm. Future Gener. Comput. Syst. 2019, 95, 454–466. [Google Scholar] [CrossRef]
- Abimbola, M.; Khan, F.; Khakzad, N. Dynamic Safety Risk Analysis of Offshore Drilling. J. Loss Prev. Process Ind. 2014, 30, 74–85. [Google Scholar] [CrossRef]
- Meng, X.; Chen, G.; Zhu, G.; Zhu, Y. Dynamic Quantitative Risk Assessment of Accidents Induced by Leakage on Offshore Platforms Using DEMATEL-BN. Int. J. Nav. Archit. Ocean. Eng. 2019, 11, 22–32. [Google Scholar] [CrossRef]
- Zhang, L.; Wu, S.; Zheng, W.; Fan, J. A Dynamic and Quantitative Risk Assessment Method with Uncertainties for Offshore Managed Pressure Drilling Phases. Saf. Sci. 2018, 104, 39–54. [Google Scholar] [CrossRef]
- Pranesh, V.; Palanichamy, K.; Saidat, O.; Peter, N. Lack of Dynamic Leadership Skills and Human Failure Contribution Analysis to Manage Risk in Deep Water Horizon Oil Platform. Saf. Sci. 2017, 92, 85–93. [Google Scholar] [CrossRef]
- Li, W.; Zhang, L.; Liang, W. An Accident Causation Analysis and Taxonomy (ACAT) Model of Complex Industrial System from Both System Safety and Control Theory Perspectives. Saf. Sci. 2017, 92, 94–103. [Google Scholar] [CrossRef]
- Deyab, S.M.; Taleb-berrouane, M.; Khan, F.; Yang, M. Failure Analysis of the Offshore Process Component Considering Causation Dependence. Process Saf. Environ. Prot. 2018, 113, 220–232. [Google Scholar] [CrossRef]
- Zhao, X.; Qu, Z.; Zhao, H.; Fan, H. Safety Evaluation of Oil Drilling Rig System by the Extension Theory and Analytic Hierarchy Process. In Proceedings of the International Petroleum and Petrochemical Technology Conference, Xi’an, China, 27–29 March 2019. [Google Scholar]
- Li, J.; Li, K.; Wang, B. An Evaluation Model of Drilling Safety Based on Combined Rough Set and Neural Network. J. Southwes Pet. Univ. 2017, 39, 120–128. (In Chinese) [Google Scholar]
- Zhang, G.; Qiu, C.; Li, X. Assessment Model of Special Equipment Based on F-AHP and ANN. In Proceedings of the Fourth International Conference on Natural Computation, Jinan, China, 18–20 October 2008. [Google Scholar]
- Duan, Y. Risk Evaluation Method of Drilling Operation in Gas Well Containing H2S Based on Multifactor Fuzzy Identification and Quantitative Calculation. J. Saf. Sci. Technol. 2017, 13, 145–154. (In Chinese) [Google Scholar]
- Zheng, D.; Turhan, C.; Wang, N. Prioritizing Wells for Repurposing or Permanent Abandonment Based on Generalized Well Integrity Risk Analysis. In Proceedings of the IADC/SPE International Drilling Conference and Exhibition, Galveston, TX, USA, 5–7 March 2024. [Google Scholar]
- Breiman, L.; Friedman, J.H. Estimating Optimal Transformations for Multiple Regression and Correlation. J. Am. Stat. Assoc. 1985, 80, 580–598. [Google Scholar] [CrossRef]
- Wang, D.; Murphy, M. Estimating Optimal Transformations for Multiple Regression Using the ACE Algorithm. J. Data Sci. 2004, 2, 329–346. [Google Scholar] [CrossRef]
- Feng, Q.; Zhang, J.; Zhang, X. The Use of Alternating Conditional Expectation to Predict Methane Sorption Capacity on Coal. Int. J. Coal Geol. 2014, 121, 137–147. [Google Scholar] [CrossRef]
- Li, Z.; Wang, S.; Li, S. Accurate Determination of the CO2–Brine Interfacial Tension Using Graphical Alternating Conditional Expectation. Energy Fuels 2013, 1, 625–635. [Google Scholar] [CrossRef]
- Fan, K.; Wang, F.; Wang, C.; Chen, Z. Quantitative Safety Evaluation of Drilling Engineering by Combining Analytic Hierarchy Process with Alternating Condition Expectation. EDP Sci. 2021, 303, 01038. [Google Scholar]
- Satty, T. The Analytic Hierarchy Process; McGraw-Hill: New York, NY, USA, 1980. [Google Scholar]
- Fan, K.; Dong, M.; Elsworth, D.; Li, Y.; Yin, C.; Li, Y. A Dynamic-Pulse Pseudo-Pressure Method to Determine Shale Matrix Permeability at Representative Reservoir Conditions. Int. J. Coal Geol. 2018, 193, 61–72. [Google Scholar] [CrossRef]
- Fan, K.; Sun, R.; Elsworth, D.; Dong, M.; Li, Y.; Yin, C.; Li, Y.; Chen, Z.; Wang, C. Radial Permeability Measurements for Shale Using Variable Pressure Gradients. Acta Geol. Sin. 2020, 94, 269–279. [Google Scholar] [CrossRef]


Disclaimer/Publisher’s Note: The statements, opinions and data contained in all publications are solely those of the individual author(s) and contributor(s) and not of MDPI and/or the editor(s). MDPI and/or the editor(s) disclaim responsibility for any injury to people or property resulting from any ideas, methods, instructions or products referred to in the content. |
© 2024 by the authors. Licensee MDPI, Basel, Switzerland. This article is an open access article distributed under the terms and conditions of the Creative Commons Attribution (CC BY) license (https://creativecommons.org/licenses/by/4.0/).