


Impact of Blade Modifications on the Performance of a Darrieus Wind Turbine

Department of Mechanical Engineering, University of Bursa Uludag, Gorukle, Bursa 16059, Turkey
Processes 2024, 12(4), 732; https://doi.org/10.3390/pr12040732
Submission received: 15 March 2024
/
Revised: 28 March 2024
/
Accepted: 2 April 2024
/
Published: 4 April 2024
(This article belongs to the Special Issue Advances in Wind Turbine Energy Conversion Systems)
Abstract
:Vertical axis wind turbines (VAWTs) are gaining increasing significance in the realm of renewable energy. One notable advantage they possess is their ability to operate efficiently in diverse wind conditions, including low-speed and turbulent winds, which are often prevalent in urban areas. In this study, dimples and pitch angles into the rotor blades are used to enhance the aerodynamic performance of a straight-bladed Darrieus turbine. To simulate the turbine’s rotation under transient conditions, computational fluid dynamics calculations are conducted in a two-dimensional setting. The unsteady Navier–Stokes equations are solved, and the k-ω SST turbulence model is employed to represent turbulent flow. The results of the simulation demonstrate that the application of a circular dimple on the pressure side of the blades, positioned at 0.25 of the chord length with a diameter of 0.08 chord length, leads to a 5.18% increase in the power coefficient at λ = 2.7, in comparison to a turbine with plain airfoils. Moreover, when an airfoil with both a dimple and a + 1° pitch angle is utilized, the turbine’s performance at λ = 2.7 improved by 7.17% compared to a plain airfoil, and by 1.8% compared to a dimpled airfoil without a pitch angle. Additionally, the impact of a double dimple on both the pressure and suction sides of the airfoil on turbine performance was investigated. It was discovered that the double-dimpled airfoil exhibited lower performance in comparison to a plain airfoil. The study showed that the utilization of both dimples and pitch angles for airfoils of a Darrieus turbine blade increases the power generated by the turbine.
1. Introduction
Wind energy conversion systems offer a sustainable and environmentally friendly solution for electricity production, serving as an alternative to fossil fuels. These systems, commonly referred to as wind turbines, demonstrate a higher level of eco-friendliness compared to traditional energy production methods. Wind turbines can be classified into two main types: horizontal axis wind turbines (HAWT) and vertical axis wind turbines (VAWT). HAWTs rotate on a parallel axis to the ground, whereas VAWTs rotate on a vertical axis relative to the ground [1]. HAWTs, with their high MW capacities and efficiency values, are widely prevalent and play a significant role in global energy production. On the other hand, VAWTs were the initial wind energy conversion systems developed by humans in Persia over 2000 years ago, primarily used for milling grain. It was not until the late 19th century that HAWTs underwent substantial advancements and improvements [2]. VAWTs offer several key advantages. Firstly, their compact size allows for installation in areas with limited space availability. Additionally, their cost-effectiveness makes them an attractive option for those seeking affordable wind energy solutions. Moreover, the simplicity of their design facilitates easy installation and maintenance processes. Furthermore, the positioning of all mechanical and electronic components at ground level enhances accessibility for repairs and inspections. Another significant advantage is their ability to operate efficiently regardless of the wind direction, providing versatility in deployment. VAWTs exhibit several disadvantages that hinder their performance. One significant drawback is their low efficiency in converting wind energy into usable power. Compared to other wind turbine designs, VAWTs are less effective in harnessing the available wind resources. Moreover, VAWTs encounter difficulties with self-starting, requiring external assistance to initiate rotation and generate electricity. Another concern is the resonance problem caused by oscillation, which can adversely affect the overall stability and functionality of the turbine. Lastly, VAWTs are susceptible to higher shaft bending moments, which can lead to structural issues and potential damage. These limitations underscore the need for further advancements in VAWT technology to overcome these challenges [3]. There exist numerous variations of VAWTs, with the most prevalent being the Savonius and Darrieus turbines. Despite VAWTs predating HAWTs, research efforts dedicated to VAWTs have been comparatively fewer than those focused on HAWTs. However, in recent years, there has been a noticeable surge in studies about Darrieus wind turbines [4].
Several research studies have been carried out to analyze the aerodynamic capabilities of Darrieus VAWTs. These investigations have focused on examining the effects of blade and rotor geometries, aspect ratio, solidity, and tip speed ratio (TSR) parameters on the performance of VAWTs. The analysis has been conducted through experimental or numerical approaches, and in some cases a combination of both methods.
To increase the power output of VAWTs, there are several methods, such as using augmentation devices (unidirectional inlet flow and omnidirectional inlet flow), innovative designs, blade modifications, and Building Integrated Wind Turbines (BIWT). Blade modifications consist of slatted blades, a slotted airfoil, an opening near the trailing edge, blade cavities, inner blades, and twisted blades. Improvements in the aerodynamic performance of modified VAWTs were discussed in detail by Karmakar and Chattopadhyay [5]. The wind tunnel experiment involved testing an H-type Darrieus wind turbine with three blades. This particular turbine had a diameter of 2.5 m and a height of 3 m. The blade airfoil used was NACA0015, with a chord length of 0.4 m. The results of the experiment indicated that the turbine required a minimum wind speed of 6 m/s to generate power. Its rated power of 3.5 kW was achieved at a wind speed of 14 m/s. Furthermore, a maximum power coefficient of 0.3 was obtained for a TSR of 1.6 [6]. In their study, Kjellin et al. examined another type of Darrieus turbine that was equipped with three straight blades and NACA0021 airfoils. The turbine had specific dimensions, including a radius of 3 m, a chord length of 0.25 m, a blade length of 5 m, and a height of 3 m. The experimental results revealed that this turbine achieved a maximum power coefficient of 0.29 when operated at a TSR of 3.3 [7]. Wind tunnel experiments conducted on a two-bladed H-Darrieus turbine operating under turbulent flow conditions revealed a direct correlation between turbulence and turbine performance. Specifically, it was observed that increasing the rotational speeds led to a decrease in the power coefficient, indicating a reduction in overall efficiency. Additionally, the presence of high vibrations posed challenges in controlling the rotor, further exacerbating the turbine’s performance under turbulent conditions [8]. A recent study focused on evaluating the performance of straight-bladed vertical-axis wind turbines by utilizing inclined blades, commonly referred to as folded blades. The researchers discovered that the most efficient fold angle was 8°. Intriguingly, altering this angle by folding the blades 2° away from the optimal position led to a substantial decline in the power coefficient, with a notable reduction of 62.5% [9]. Symmetrical blades are commonly employed in the majority of H-Darrieus turbines. However, a wind tunnel experiment was conducted to evaluate the performance of an H-Darrieus turbine equipped with asymmetrical blades. The results of the tests indicated that this particular turbine, featuring three blades, was capable of achieving self-start at a wind speed of 3.6 m/s [10].
Computational Fluid Dynamics (CFD) simulations provide cost-effective alternatives to expensive wind tunnel tests to forecast the performance of wind turbines. Numerical experiments were carried out to simulate a VAWT with three straight blades and an NACA 0021 airfoil type. The power coefficient was analyzed with the tip speed ratio (TSR) and the results were compared with experimental data [11]. In their study, McLaren et al. utilized simulations to analyze a VAWT rotor equipped with three blades made from NACA 0015 airfoils. By applying a correction factor at the velocity inlet, the researchers achieved commendable consistency between the obtained results and the experimental data. Moreover, the investigation yielded valuable insights into the wake profiles and thrust forces associated with the rotor [12]. In their study, Mohamed et al. [13] investigated the performance of Darrieus wind turbines. They employed 2-D CFD calculations and examined the impact of 25 different blades. The researchers found that the utilization of the LS (1)-0413 blade profile resulted in a notable enhancement of 16% in turbine performance when compared to a rotor constructed with the NACA 0021 profile. In their investigation, Franchina et al. employed STAR CCM+ to simulate a small-scale vertical-axis wind turbine. The simulations were carried out in both 2D and 3D formats. Notably, the 3D simulations exhibited a higher level of accuracy in comparison to the experimental data, as highlighted in their study [14]. Rezaeiha et al. [15] conducted numerical simulations on a vertical-axis wind turbine, investigating the effects of varying blade pitch angles. The pitch angles were adjusted within the range of −7° to +3°. The simulations revealed a notable increase of 6.6% at a TSR of 4 when the pitch angle was set to −2°. These findings provide valuable insights into the performance optimization of vertical-axis wind turbines. Santos et al. [16] presented another study that aimed to investigate the influence of fixed pitch angle on vertical axis wind turbines. The research focused on analyzing pitch angles of −6° and −10° within the TSR range of 0.7–1.6. The simulation results demonstrated that the −10° pitch angle exhibited superior performance compared to the −6° pitch angle. Ismail and Vijayaraghavan [17] conducted a study on blade modification for the NACA 0015 profile, specifically focusing on the implementation of a dimple and Gurney flap. In their research, they employed a genetic algorithm to determine the optimal geometry for both the dimple and Gurney flap. The results of their investigation demonstrated that the optimized geometry led to improved aerodynamic performance. Zhu et al. [18] conducted a study to examine the impact of various configurations involving dimple and Gurney flap geometries on the NACA 0021 airfoil. The researchers investigated inboard, outboard, double-sided Gurney flap, and dimple Gurney flap geometries across different solidity values. Notably, for a TSR of 3.1 and solidity of 0.25, the outboard dimple Gurney-flap-modified blade exhibited a significant improvement of 17.92% in performance compared to the clean profile. In their study, Rezaeiha et al. [19] introduced an optimal aerodynamic design for vertical-axis wind turbines, focusing on the parameters of solidity and blade numbers. They derived a novel relationship that determined the optimal TSR based on the solidity value. According to Rezaiha et al. [20], the best turbulence models for CFD calculations of VAWTs were k-ω SST models with versions SSTI and TSST. They stated that the other turbulence models were not good enough to reproduce the aerodynamic performance of VAWTs. Akansu et al. [21] conducted numerical analyses to compare the aerodynamic performances of different blade airfoils used in VAWTs. In their study, they used NACA0021, NACA0015, NACA2250, and Clark-Y airfoils. They reported that among all airfoils, NACA0021 showed the best aerodynamic performance. Sumantraa et al. [22] investigated the effect of the pitch angle on a small-scale vertical-axis wind turbine. By using the NACA0015 airfoil and −6°, 0°, and +6° pitch angles, they discovered that the best performance was obtained for the −6° pitch angle blade for every tip speed ratio and wind velocity value.
As seen from the literature survey, there has been no research regarding the application of either dimples or pitch angles on turbine blades to investigate the aerodynamic performance of VAWTs. The present study conducted a numerical investigation to assess the influence of blade modification on the performance of the Darrieus vertical axis turbine. More specifically, the study examined the effects of dimples, dimples with fixed pitch angles, and double-sided dimples. The analysis focused on comparing the power coefficient values and presenting the turbine’s performance for various azimuthal positions of the rotor.
Section 2 commences by discussing the aerodynamics of VAWTs and outlining the methodology for performance calculations. Following this, a detailed explanation of the geometry and numerical calculations is provided in the subsequent part. Section 3 then presents the research findings through the use of figures and graphs. Lastly, Section 4 summarizes the study results and suggests potential improvements for VAWTs.
2. Materials and Methods
2.1. VAWT Aerodynamics
The wind turbine′s actual power output, denoted as P, is determined by converting the total moment M harnessed from the wind.
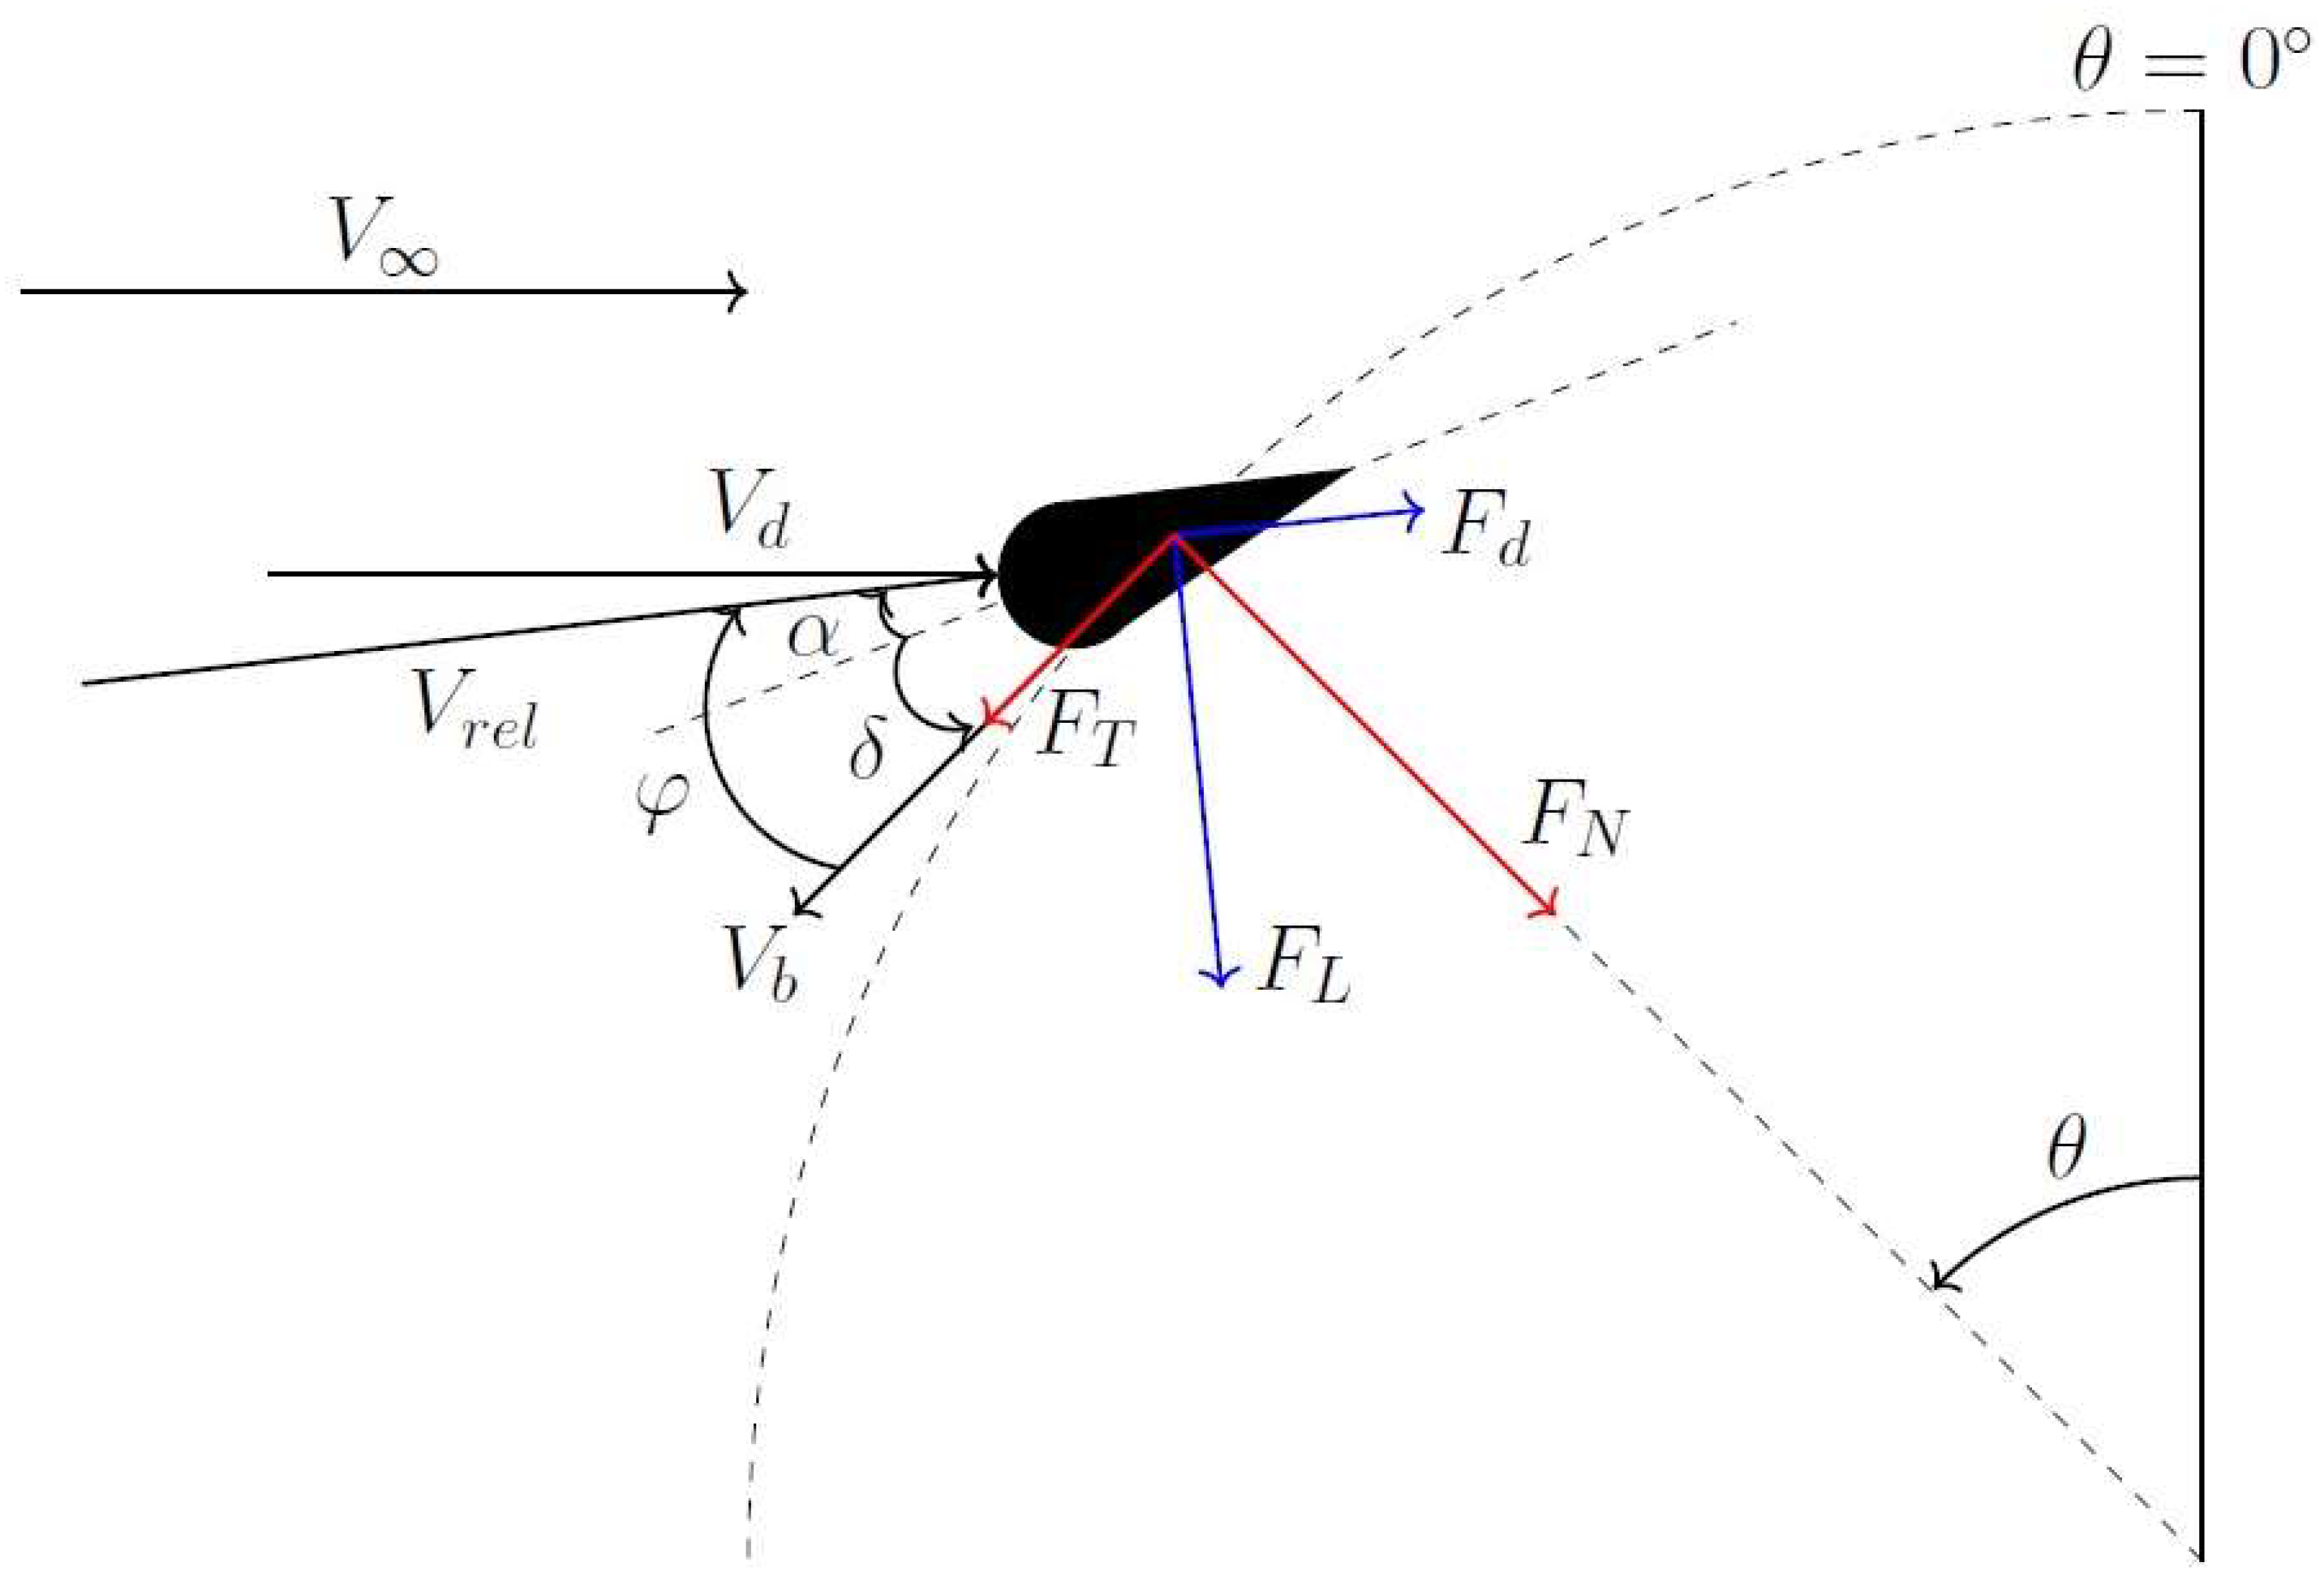
The velocity components and forces exerted on a single blade can be observed in Figure 1, where ω represents the angular velocity of the turbine. By employing the tangential force FT, the total moment can be computed.
The velocity of the blade is influenced by the rotation of the turbine, which in turn affects the forces and velocity components of the resultant velocity vector acting on the blades. The average tangential force (), the number of blades (N), and the radius of the turbine (R) are all factors that contribute to this relationship. Additionally, the azimuth angle (θ) of the blade plays a role in determining the velocity of the blade.
is the unit vector and it is positive in the rotation direction. Relative wind velocity has two components: , the wind flow at the turbine disk, and , the velocity of the blade caused by the turbine rotation.
The angle of relative wind can be calculated with
The angle of attack can be calculated with relative wind angle and the pitch angle .
Tip speed ratio is defined as
Tangential force Ft is expressed as
where is the lift force and is the drag force acting on the blade. They can be calculated with
Cl and Cd are lift and drag coefficients. Power coefficient Cp can be calculated by using moment coefficient Cm.
2.2. Geometry and Numerical Calculations
Numerical calculations were conducted for modifications of a 3-straight-bladed Darrieus turbine. Turbine geometry and the flow characteristics are taken from Castelli et al. [11] and presented in Table 1.
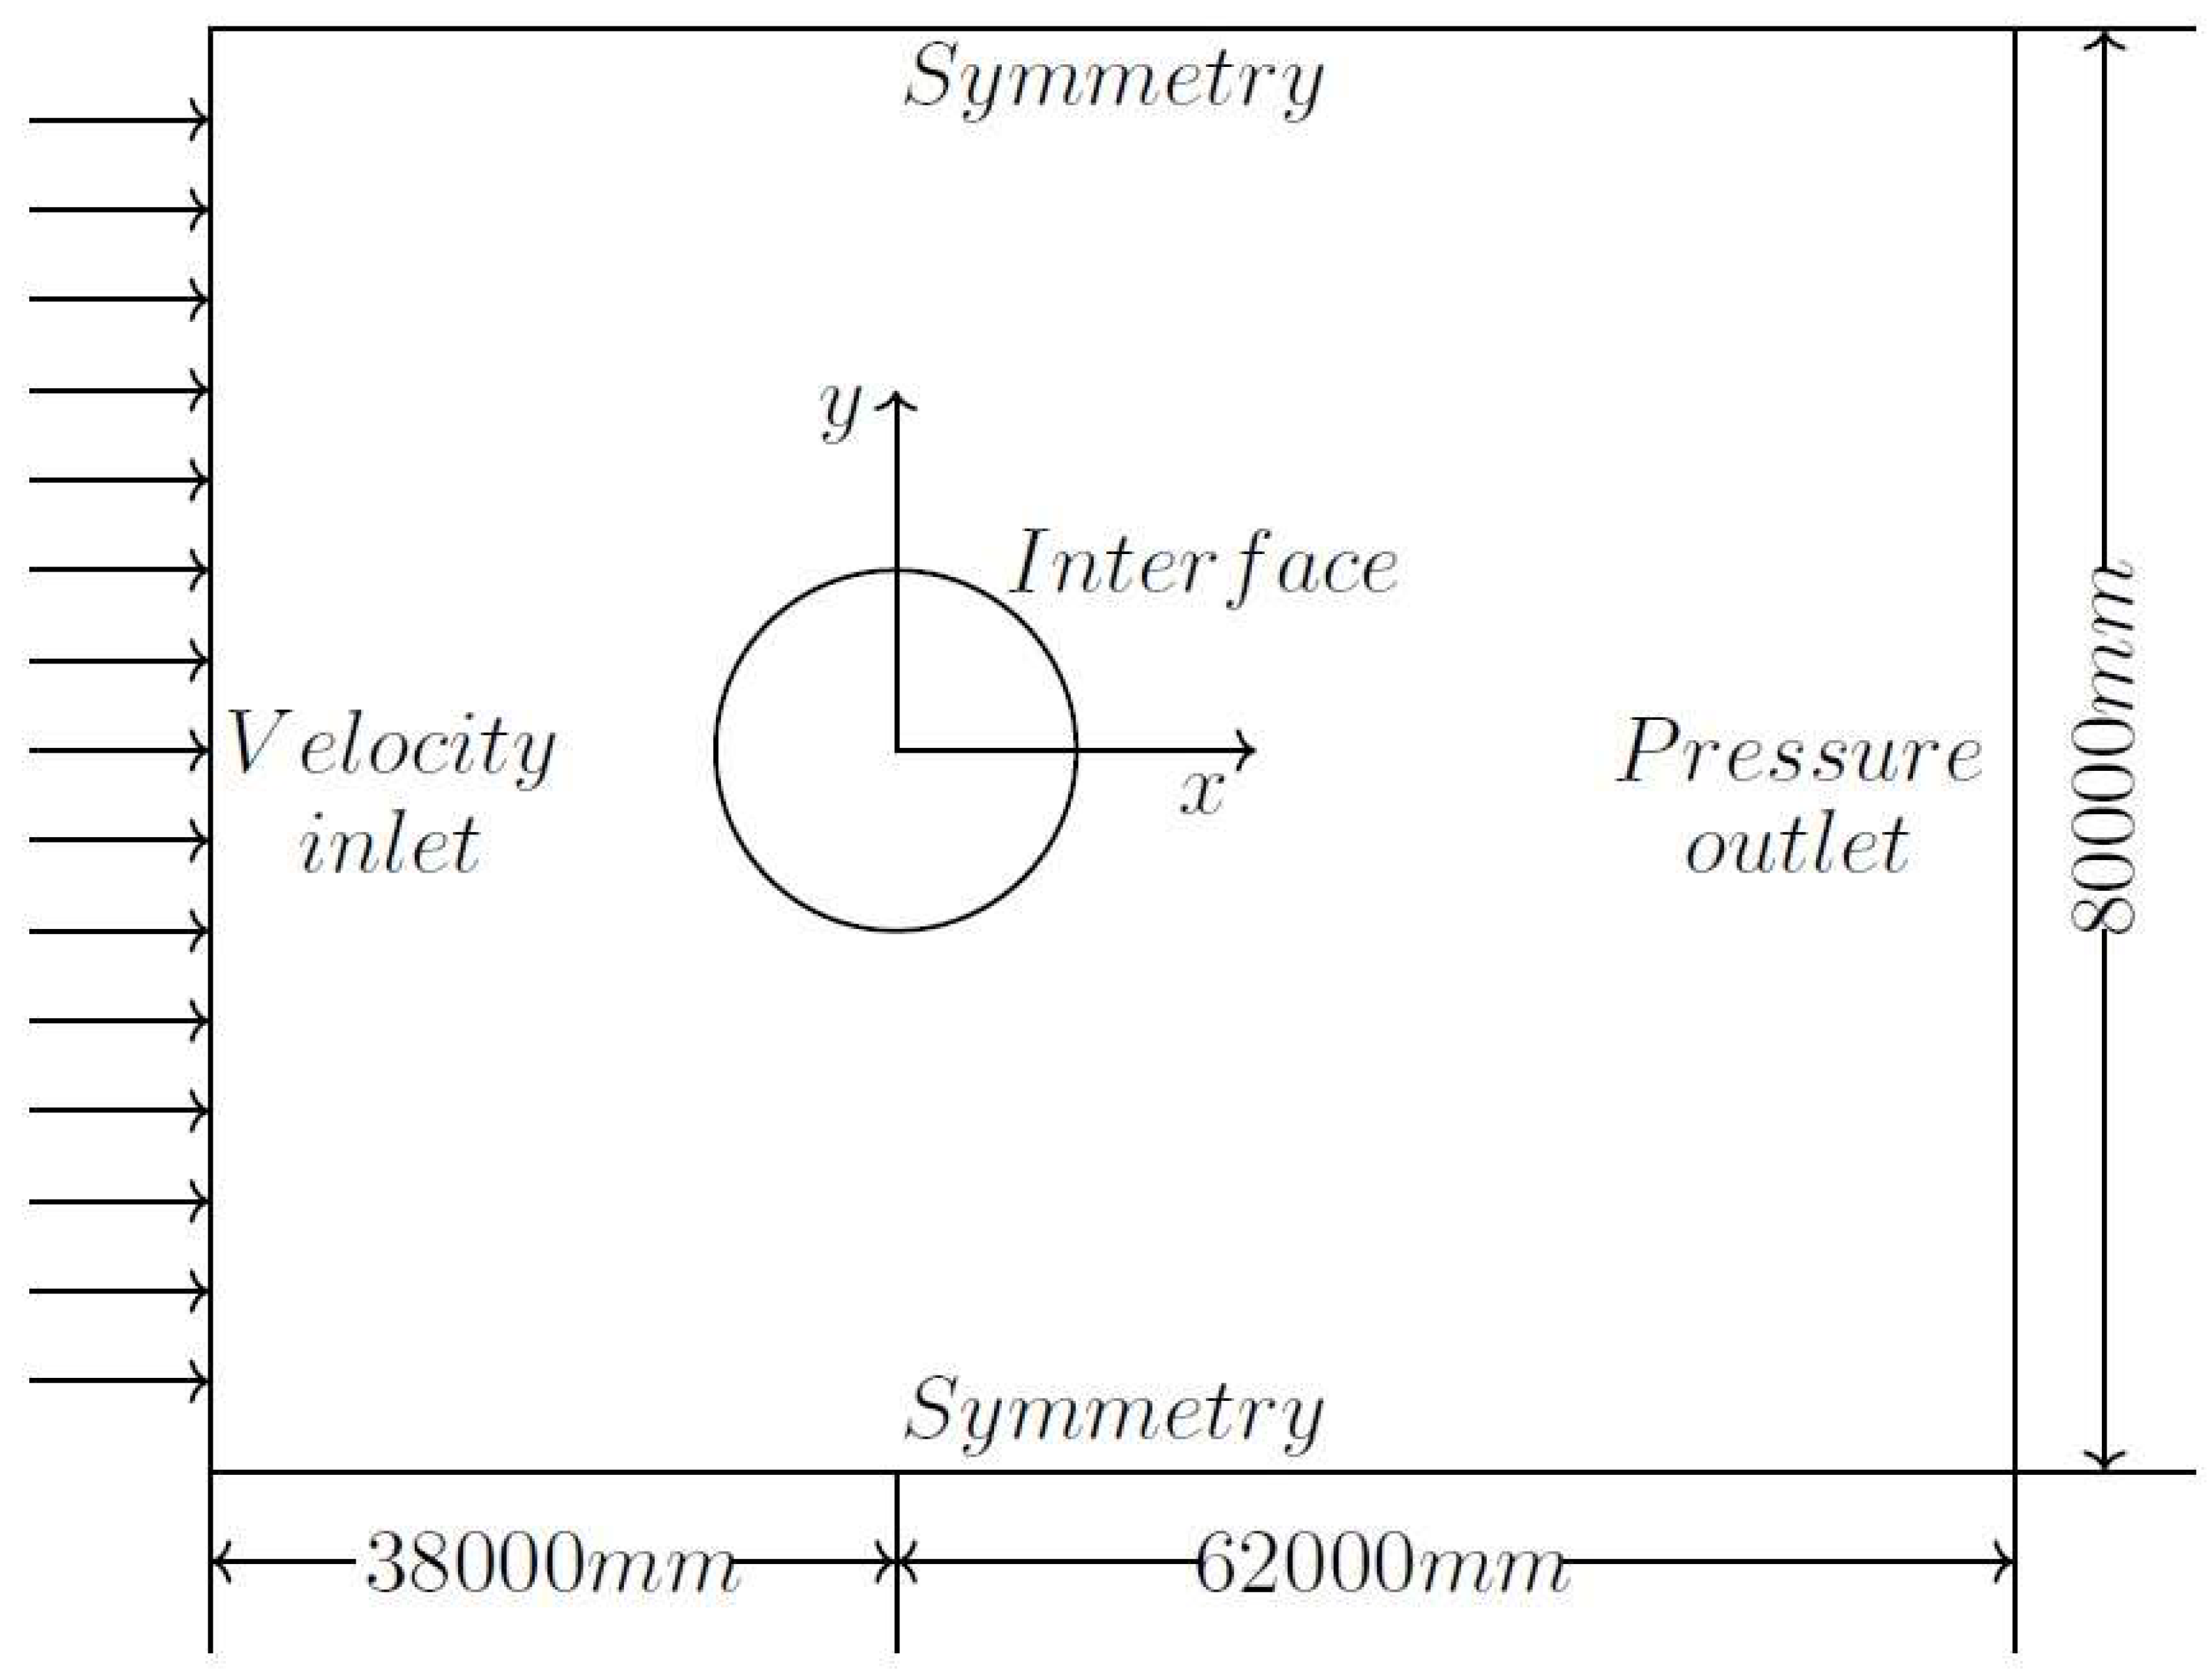
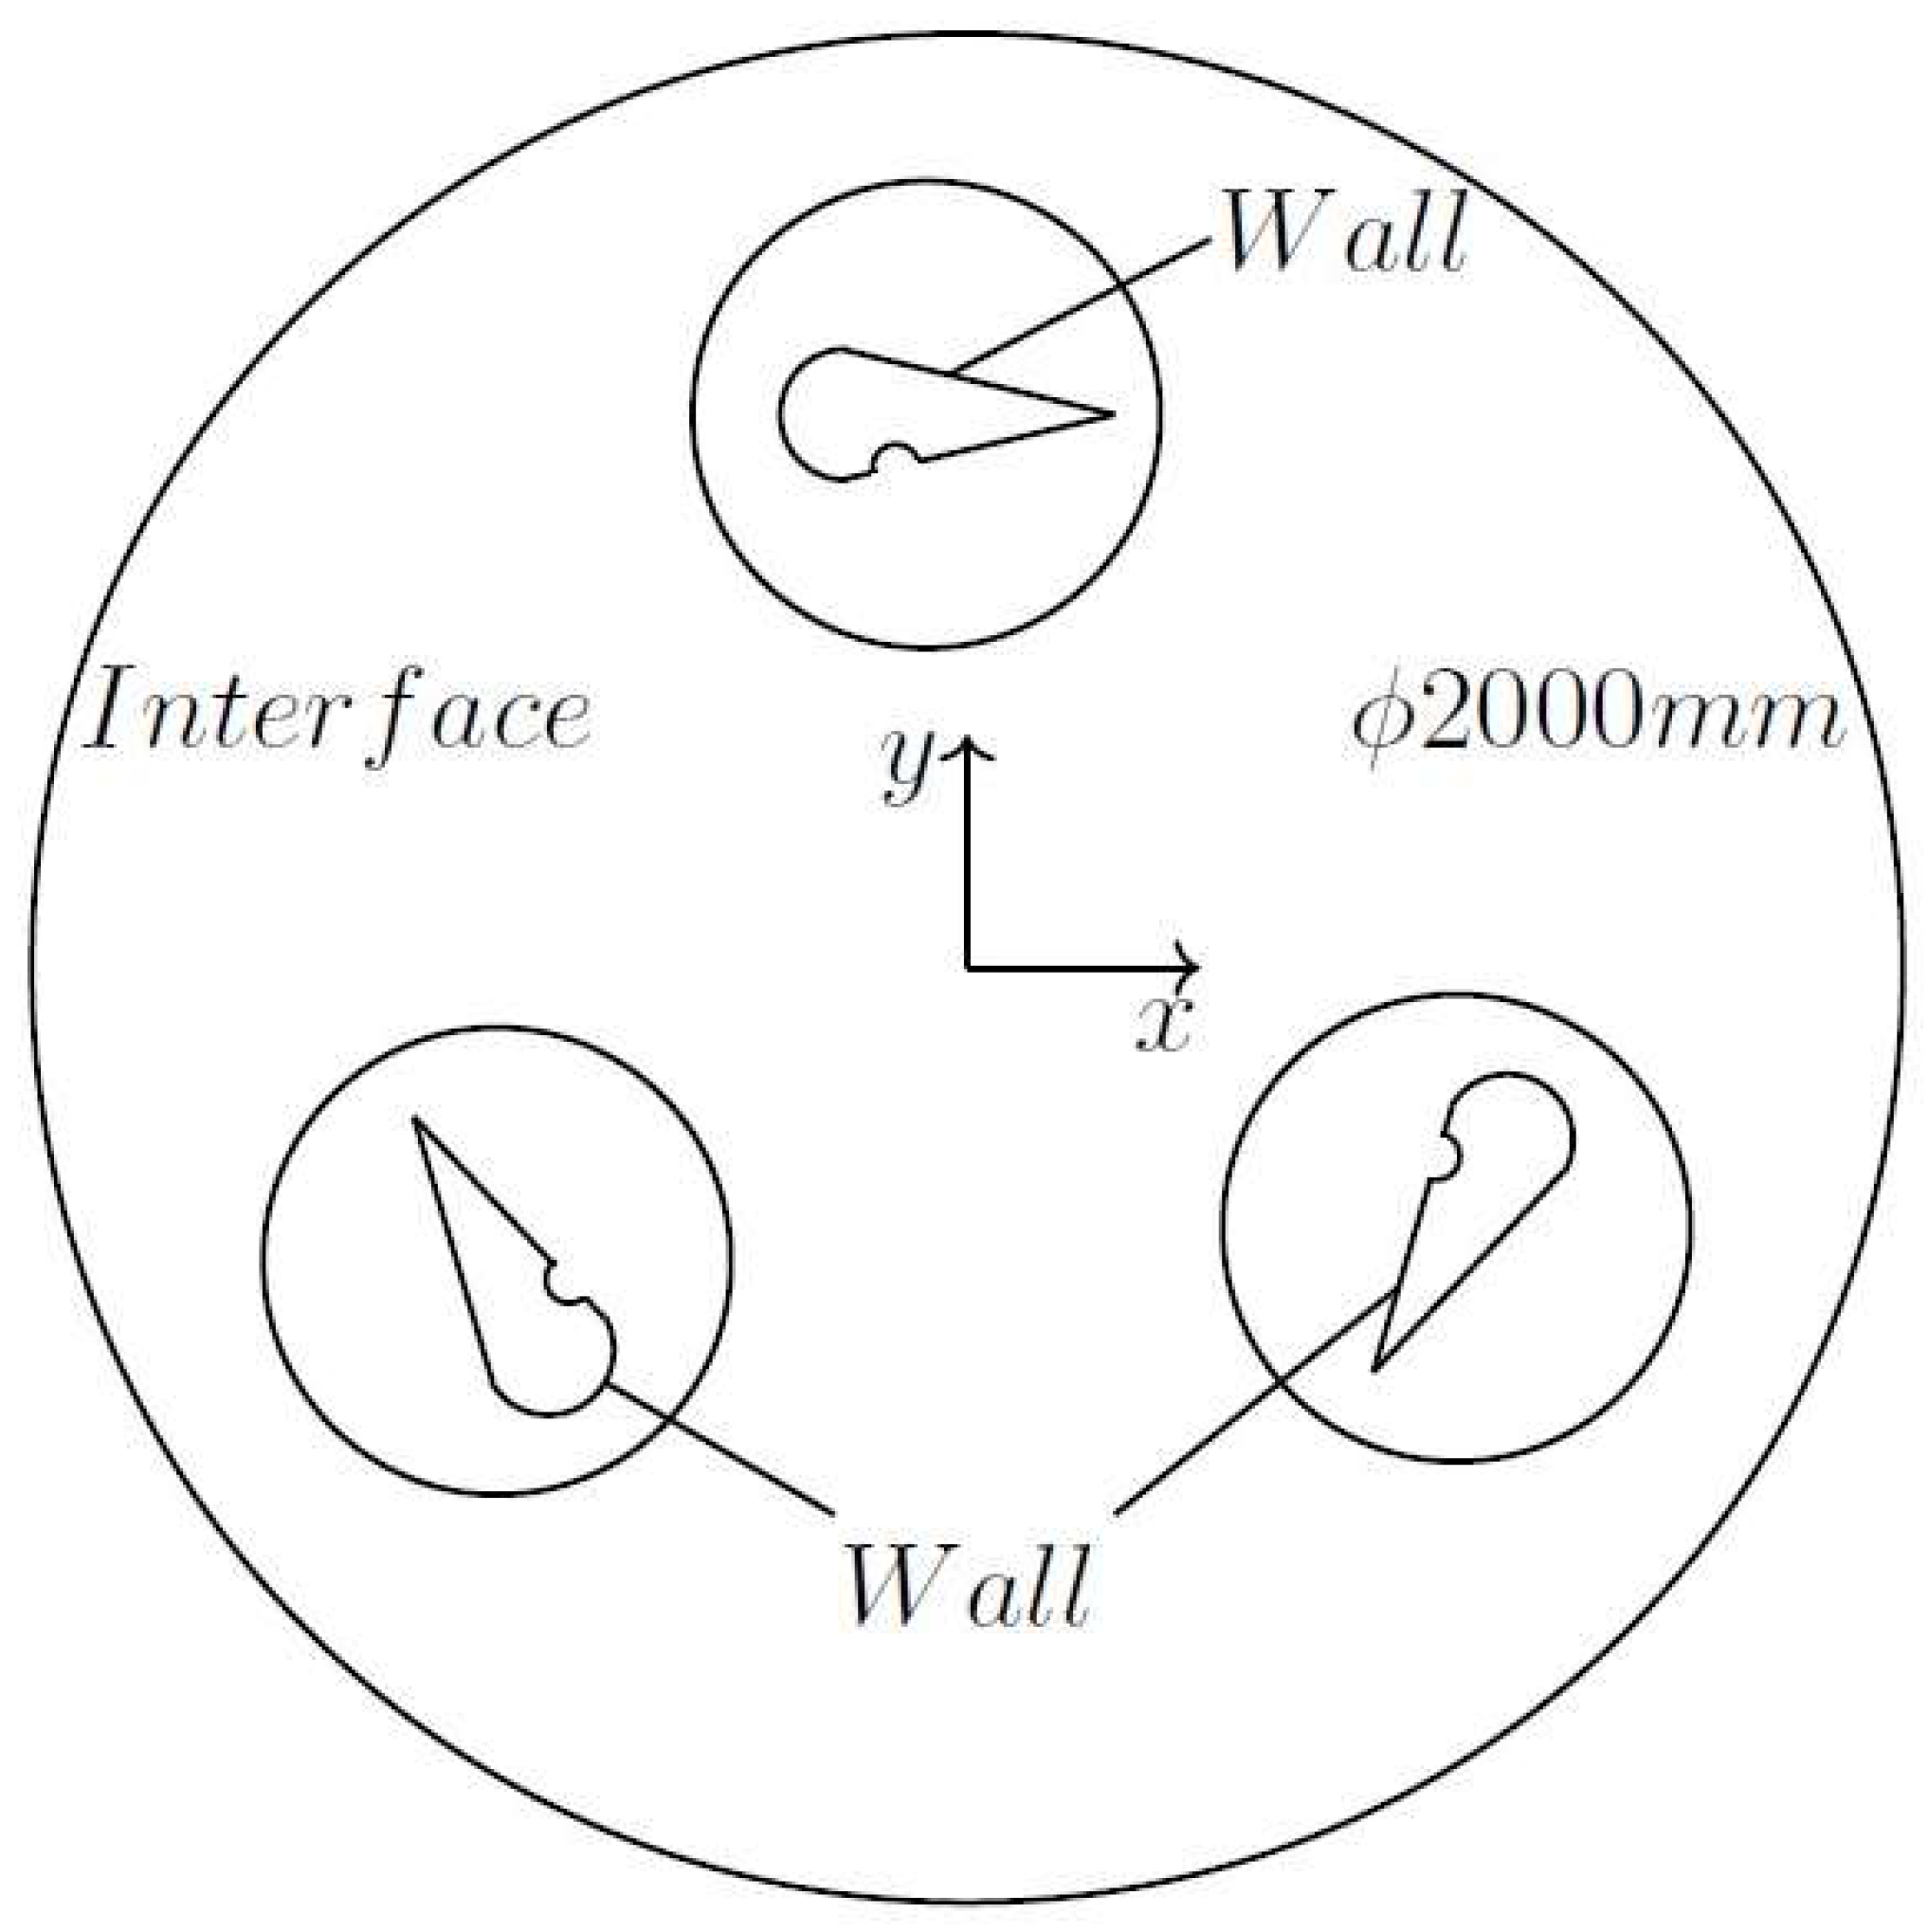
A 2-D computational grid was created to simulate wind flow. The fluid domain consists of two subdomains, the rotating domain and the outer fixed domain. The fluid domain and the rotating domain are presented in Figure 2 and Figure 3, respectively. The turbine was placed in the center of the rotating domain and it was rotated by a certain angular velocity using the sliding mesh approach. The 2D Navier–Stokes equations under transient conditions were solved by using ANSYS Fluent 18.2. The fluid was assumed to be incompressible air with constant thermophysical properties (ρ = 1.225 kg/m³, μ = 1.789 × 10⁻⁵ kg/ms). The k-ω SST turbulence model was used. Inlet velocity was taken as 9 m/s, and the outlet pressure was taken as 0 Pa; since the flow is in the open domain, the remaining walls were set as symmetrical boundaries. The time step was taken for 1° rotation of the turbine and each simulation was calculated for ten complete revolutions.
The airfoil modification consists of dimple and the angle of attack for the upcoming flow. The dimple geometries are presented in Table 2. The chord length is the distance between the trailing edge and the point where the chord intersects the leading edge. Table 3 presents the dimple modifications that were used in numerical simulations.
2.3. Grid Independency Study
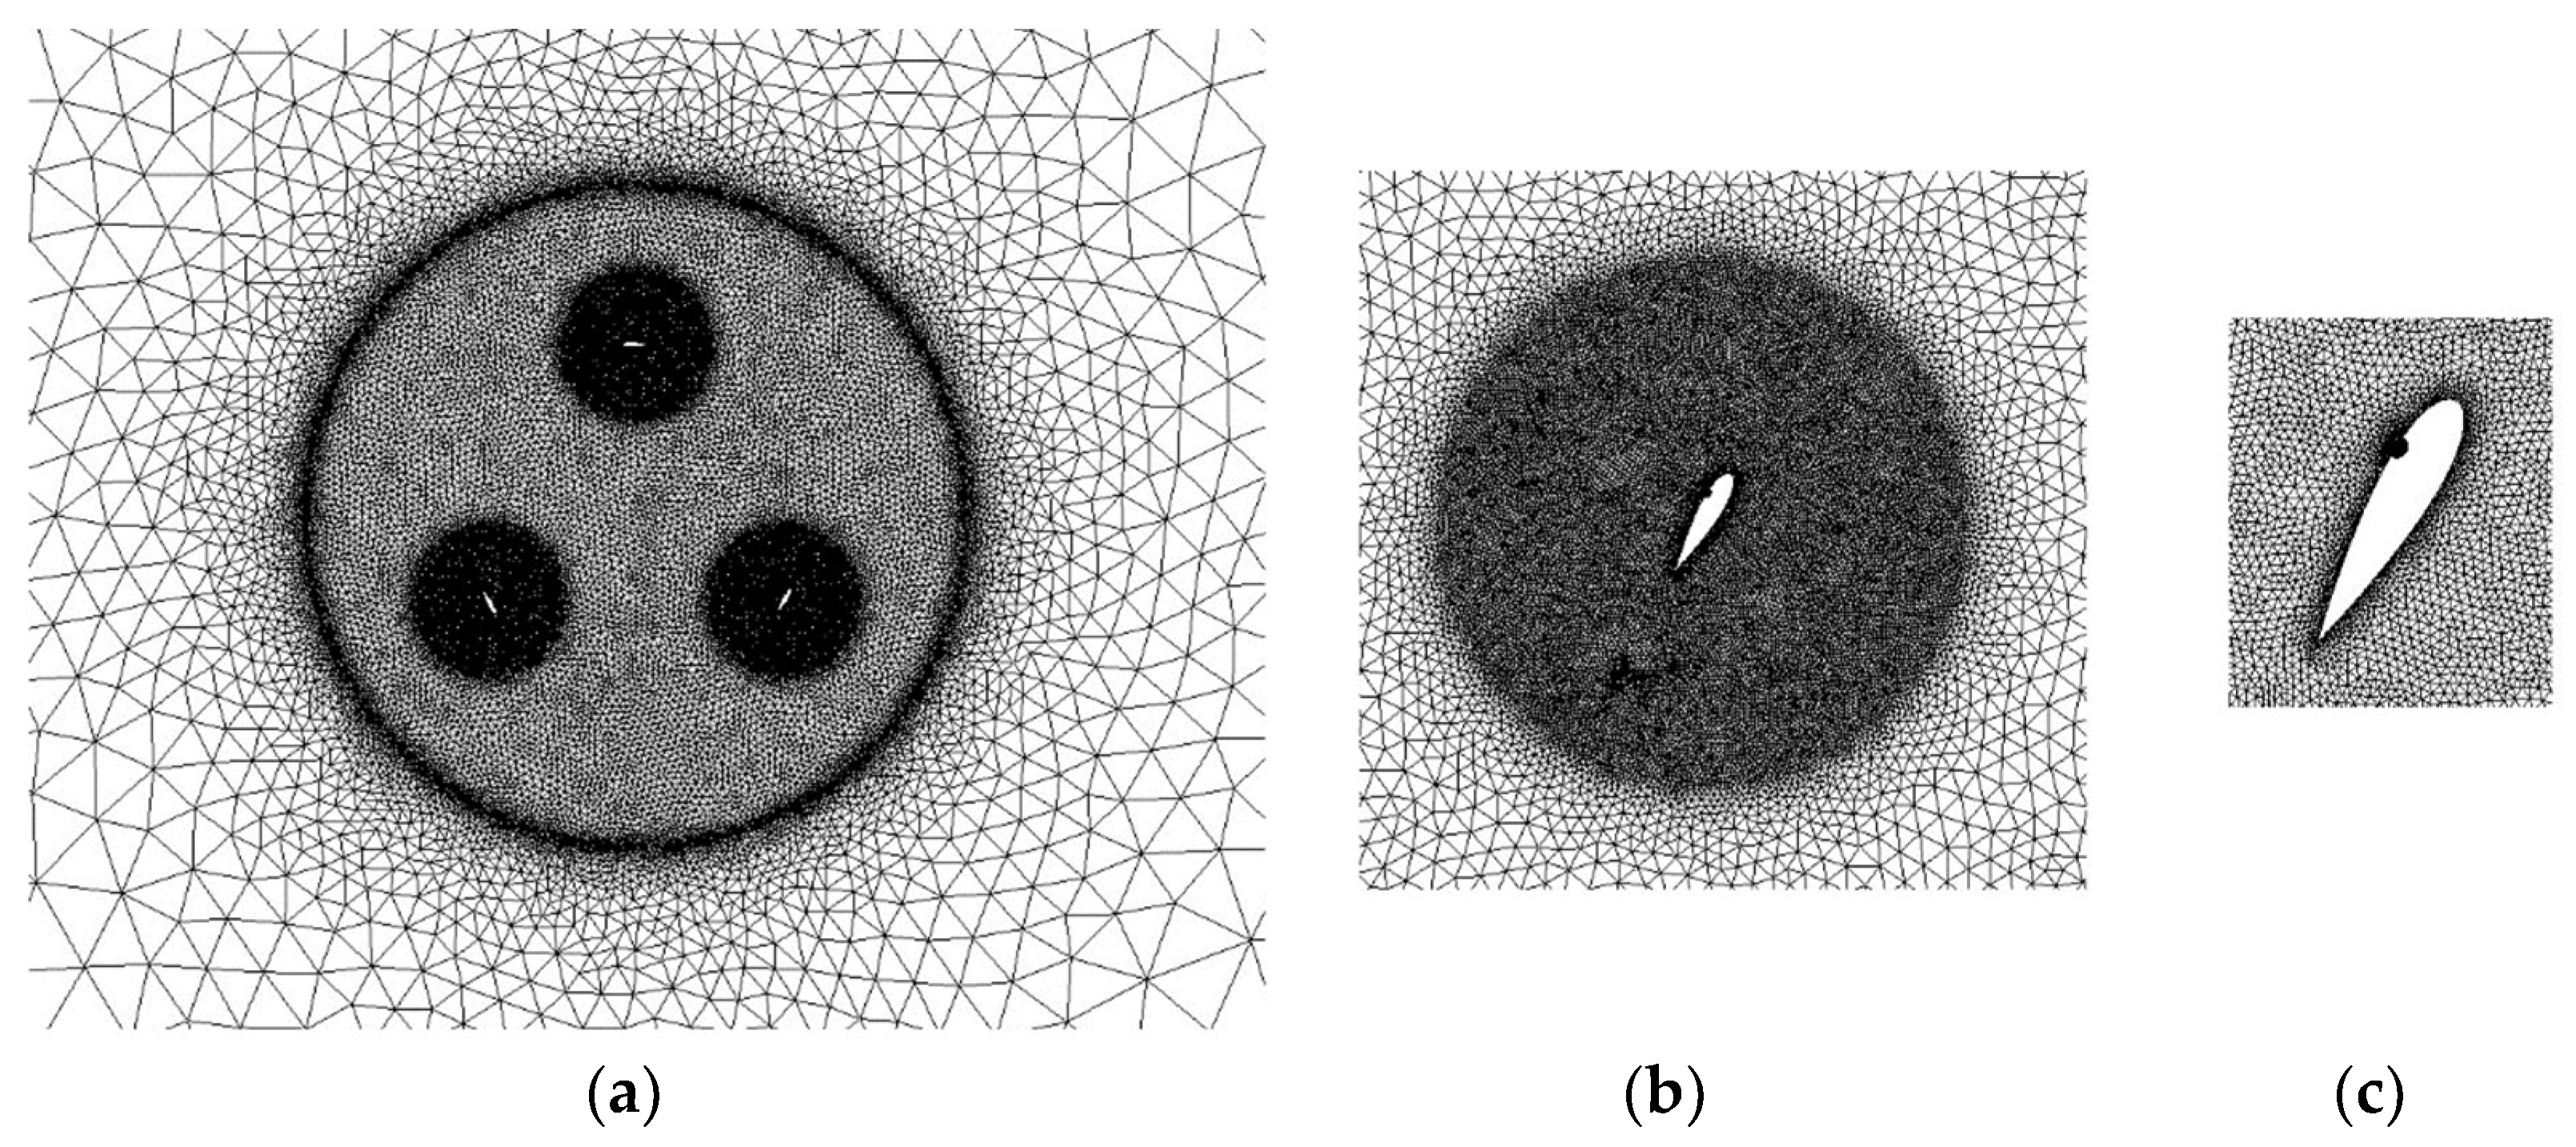
Grid independence calculations were made for four grid sizes. Moment coefficient values of the turbine with plane airfoil at TSR = 2 were calculated for these four grid models, and the obtained results are shown in Table 4. As seen from Table 4, grid independence was achieved for the grid with 629,840 elements since the Cm values did not change significantly. To reduce the computational time, the results in this study are presented for the grid with 629,480 elements. The average and the maximum skewness of the mesh were 0.063 and 0.779, respectively. The average and the minimum orthogonal quality of the mesh were 0.961 and 0.341, respectively. According to [24], low orthogonal and high skewness values are not recommended. Therefore, the mesh quality can be regarded as excellent for the problem.
The grid structures of the rotating domain, control circle, and airfoil detail are presented in Figure 4.
3. Results
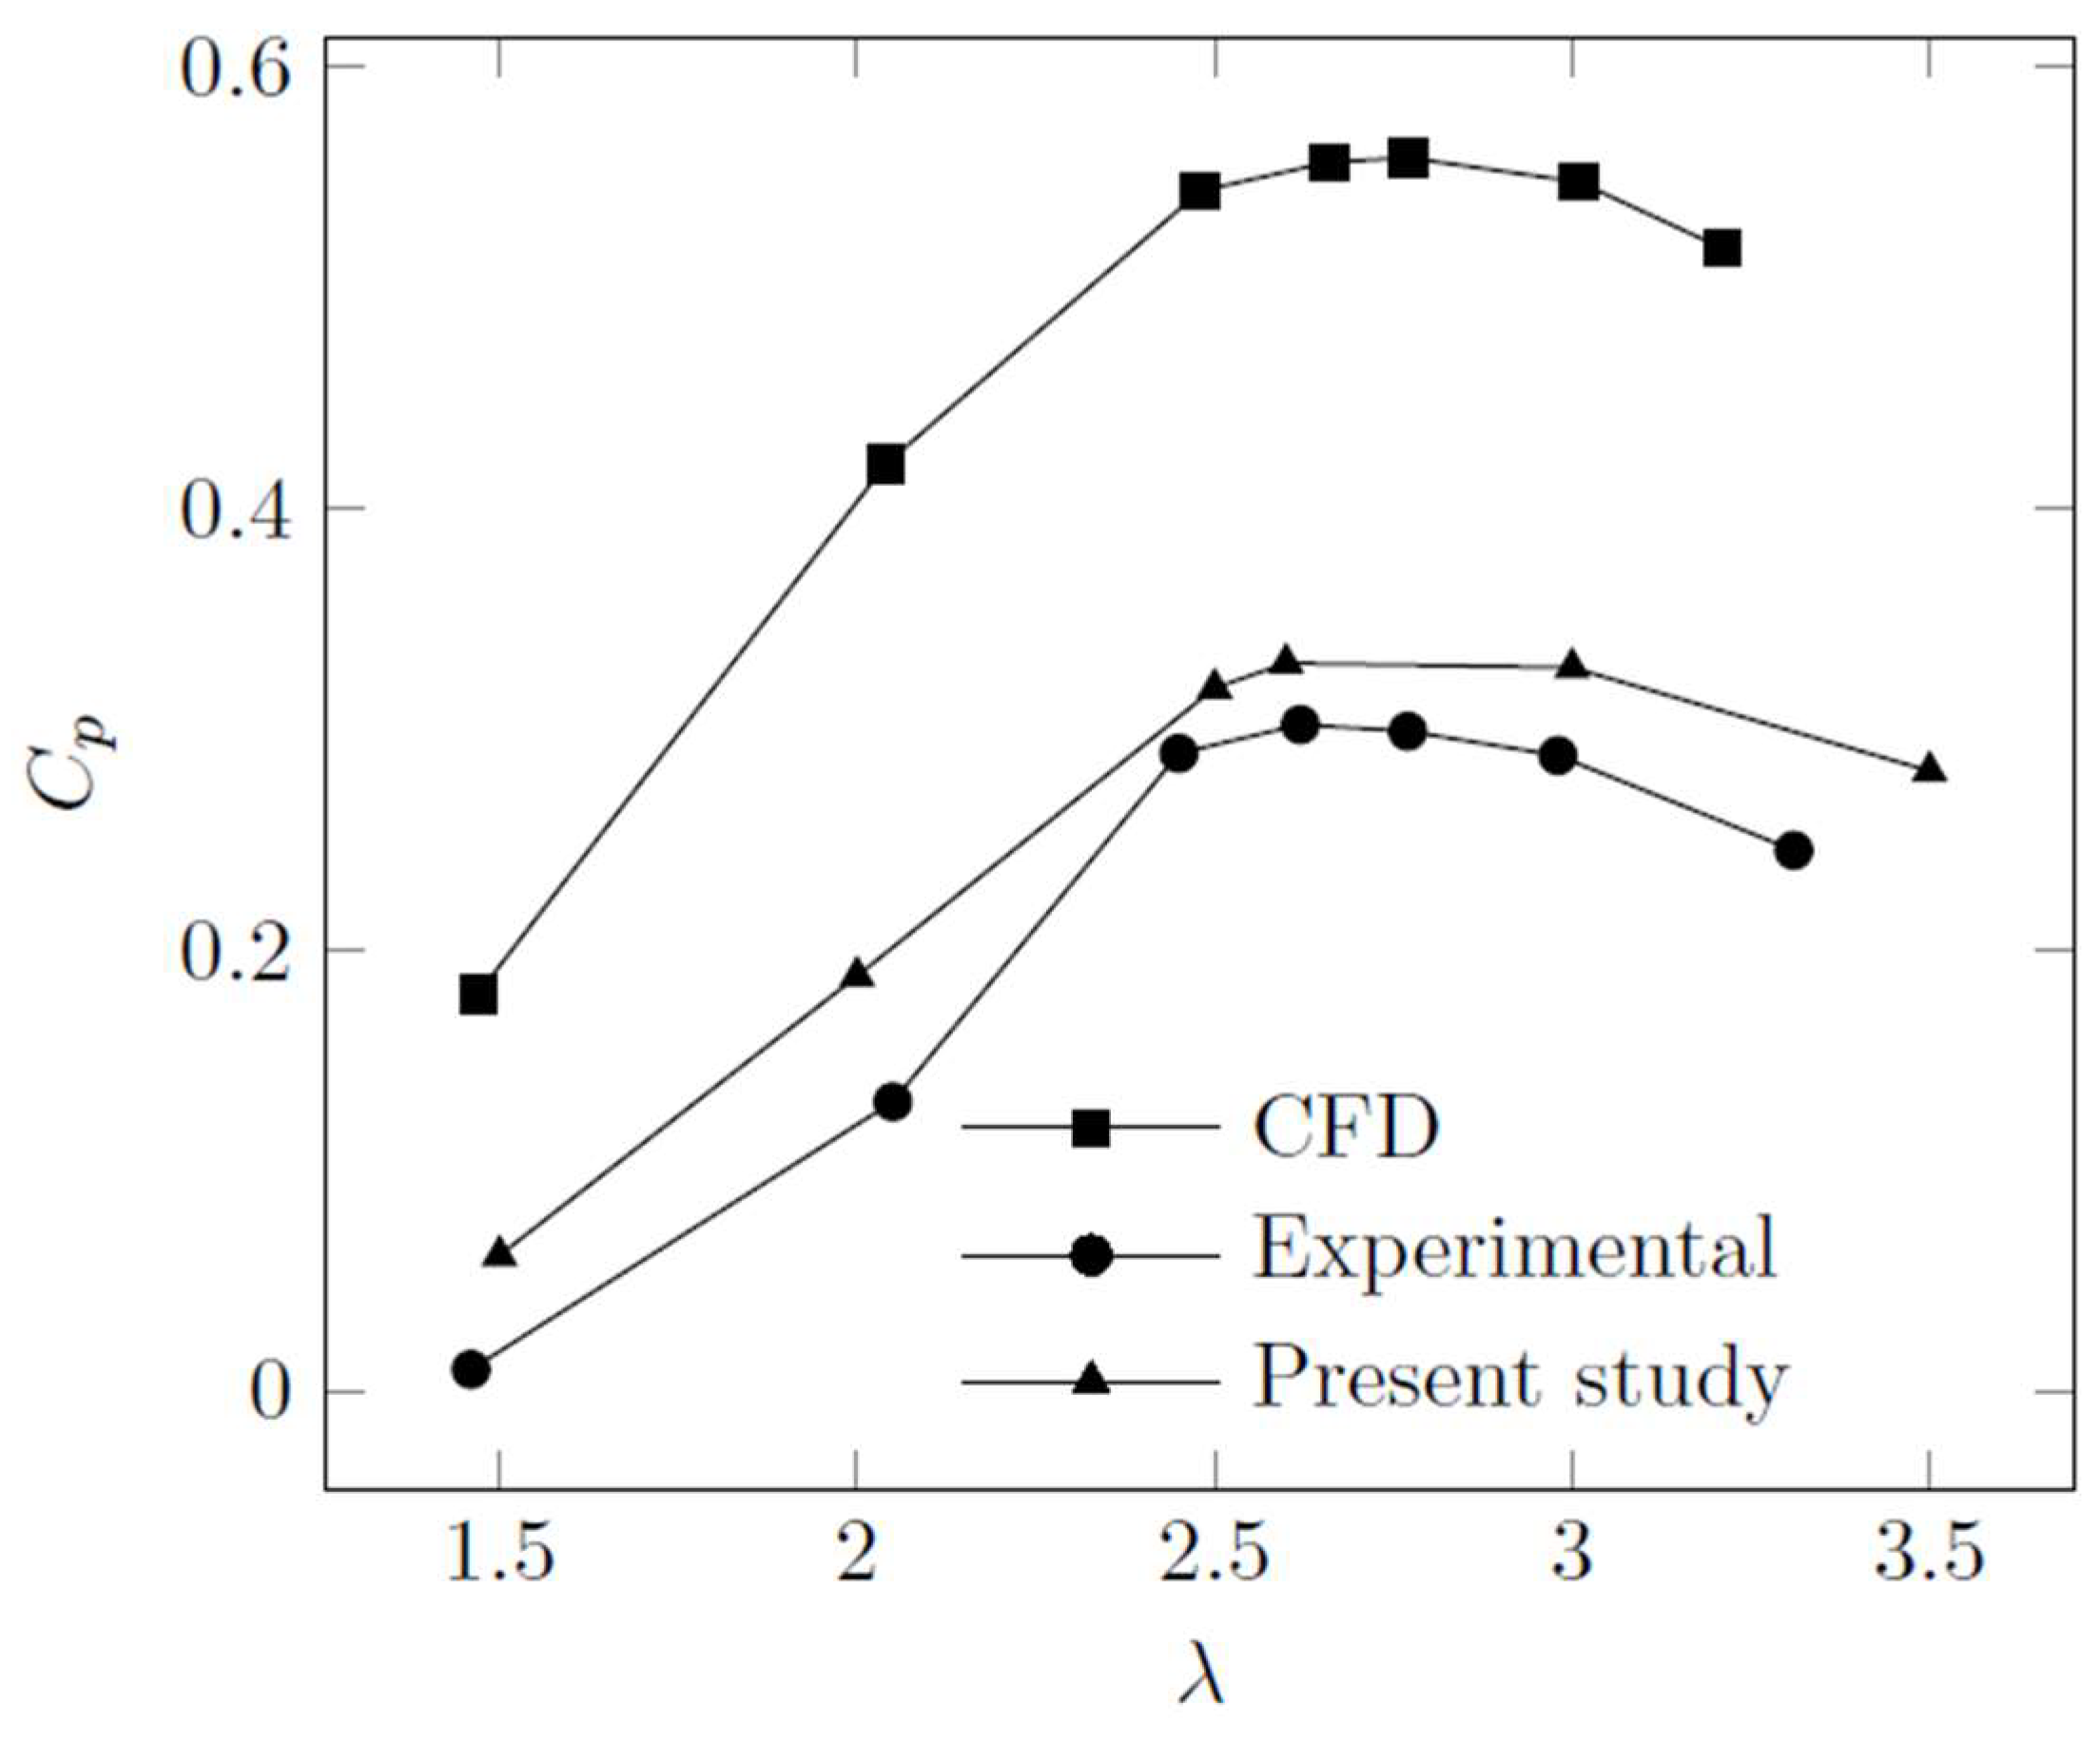
In this study, the power coefficient of the rotor, employing a flat airfoil, was evaluated with the TSR. The obtained results were then compared to the experimental and numerical investigation conducted by Castelli et al. [11]. The graphical representation of the findings can be observed in Figure 5. The graphical analysis demonstrates a strong agreement between the present numerical results and the experimental data. Notably, the maximum power coefficient was achieved at a TSR of 2.6. It is important to note that the power coefficient tends to increase up to a TSR of 2.6, but beyond this point, it starts to decrease.
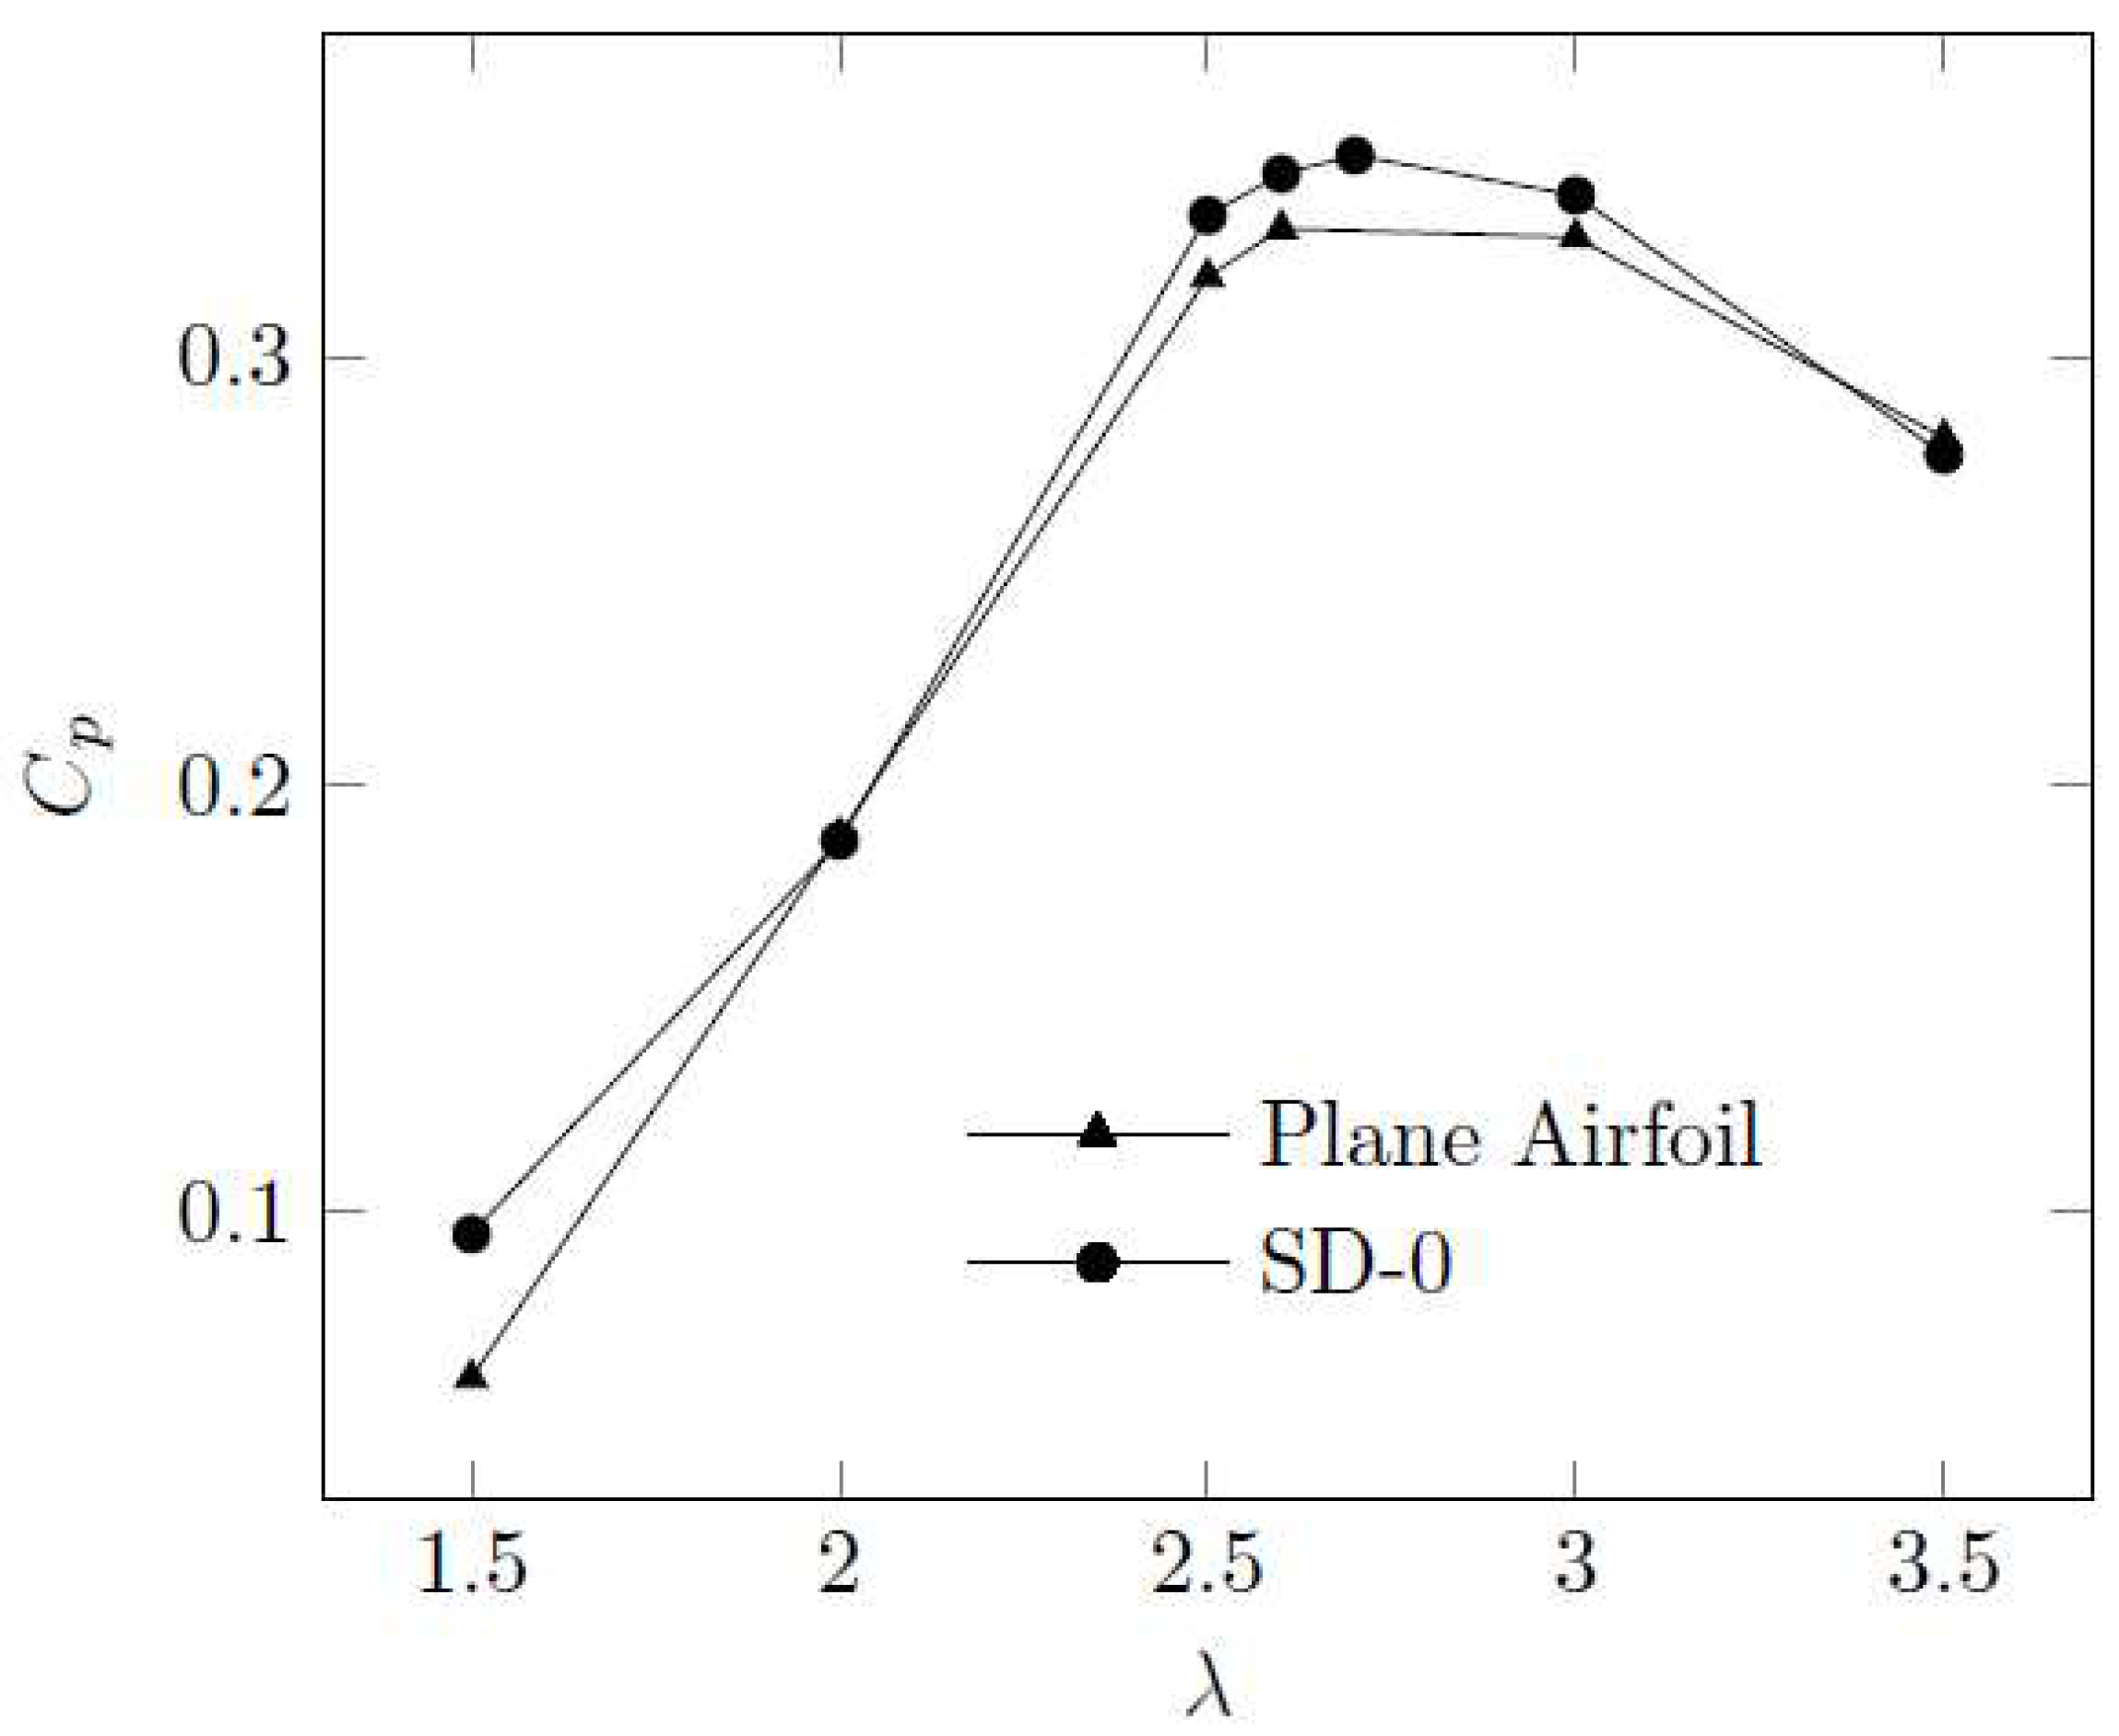
Figure 6 illustrates the comparison of power coefficient values with TSR for a rotor equipped with a plane airfoil and a dimpled airfoil without a pitch angle SD-0. The results indicate that the dimpled airfoil without pitch angle exhibits a higher power coefficient compared to the plane airfoil. Additionally, the maximum power coefficient value of 0.3469 was achieved at a TSR of 2.7.
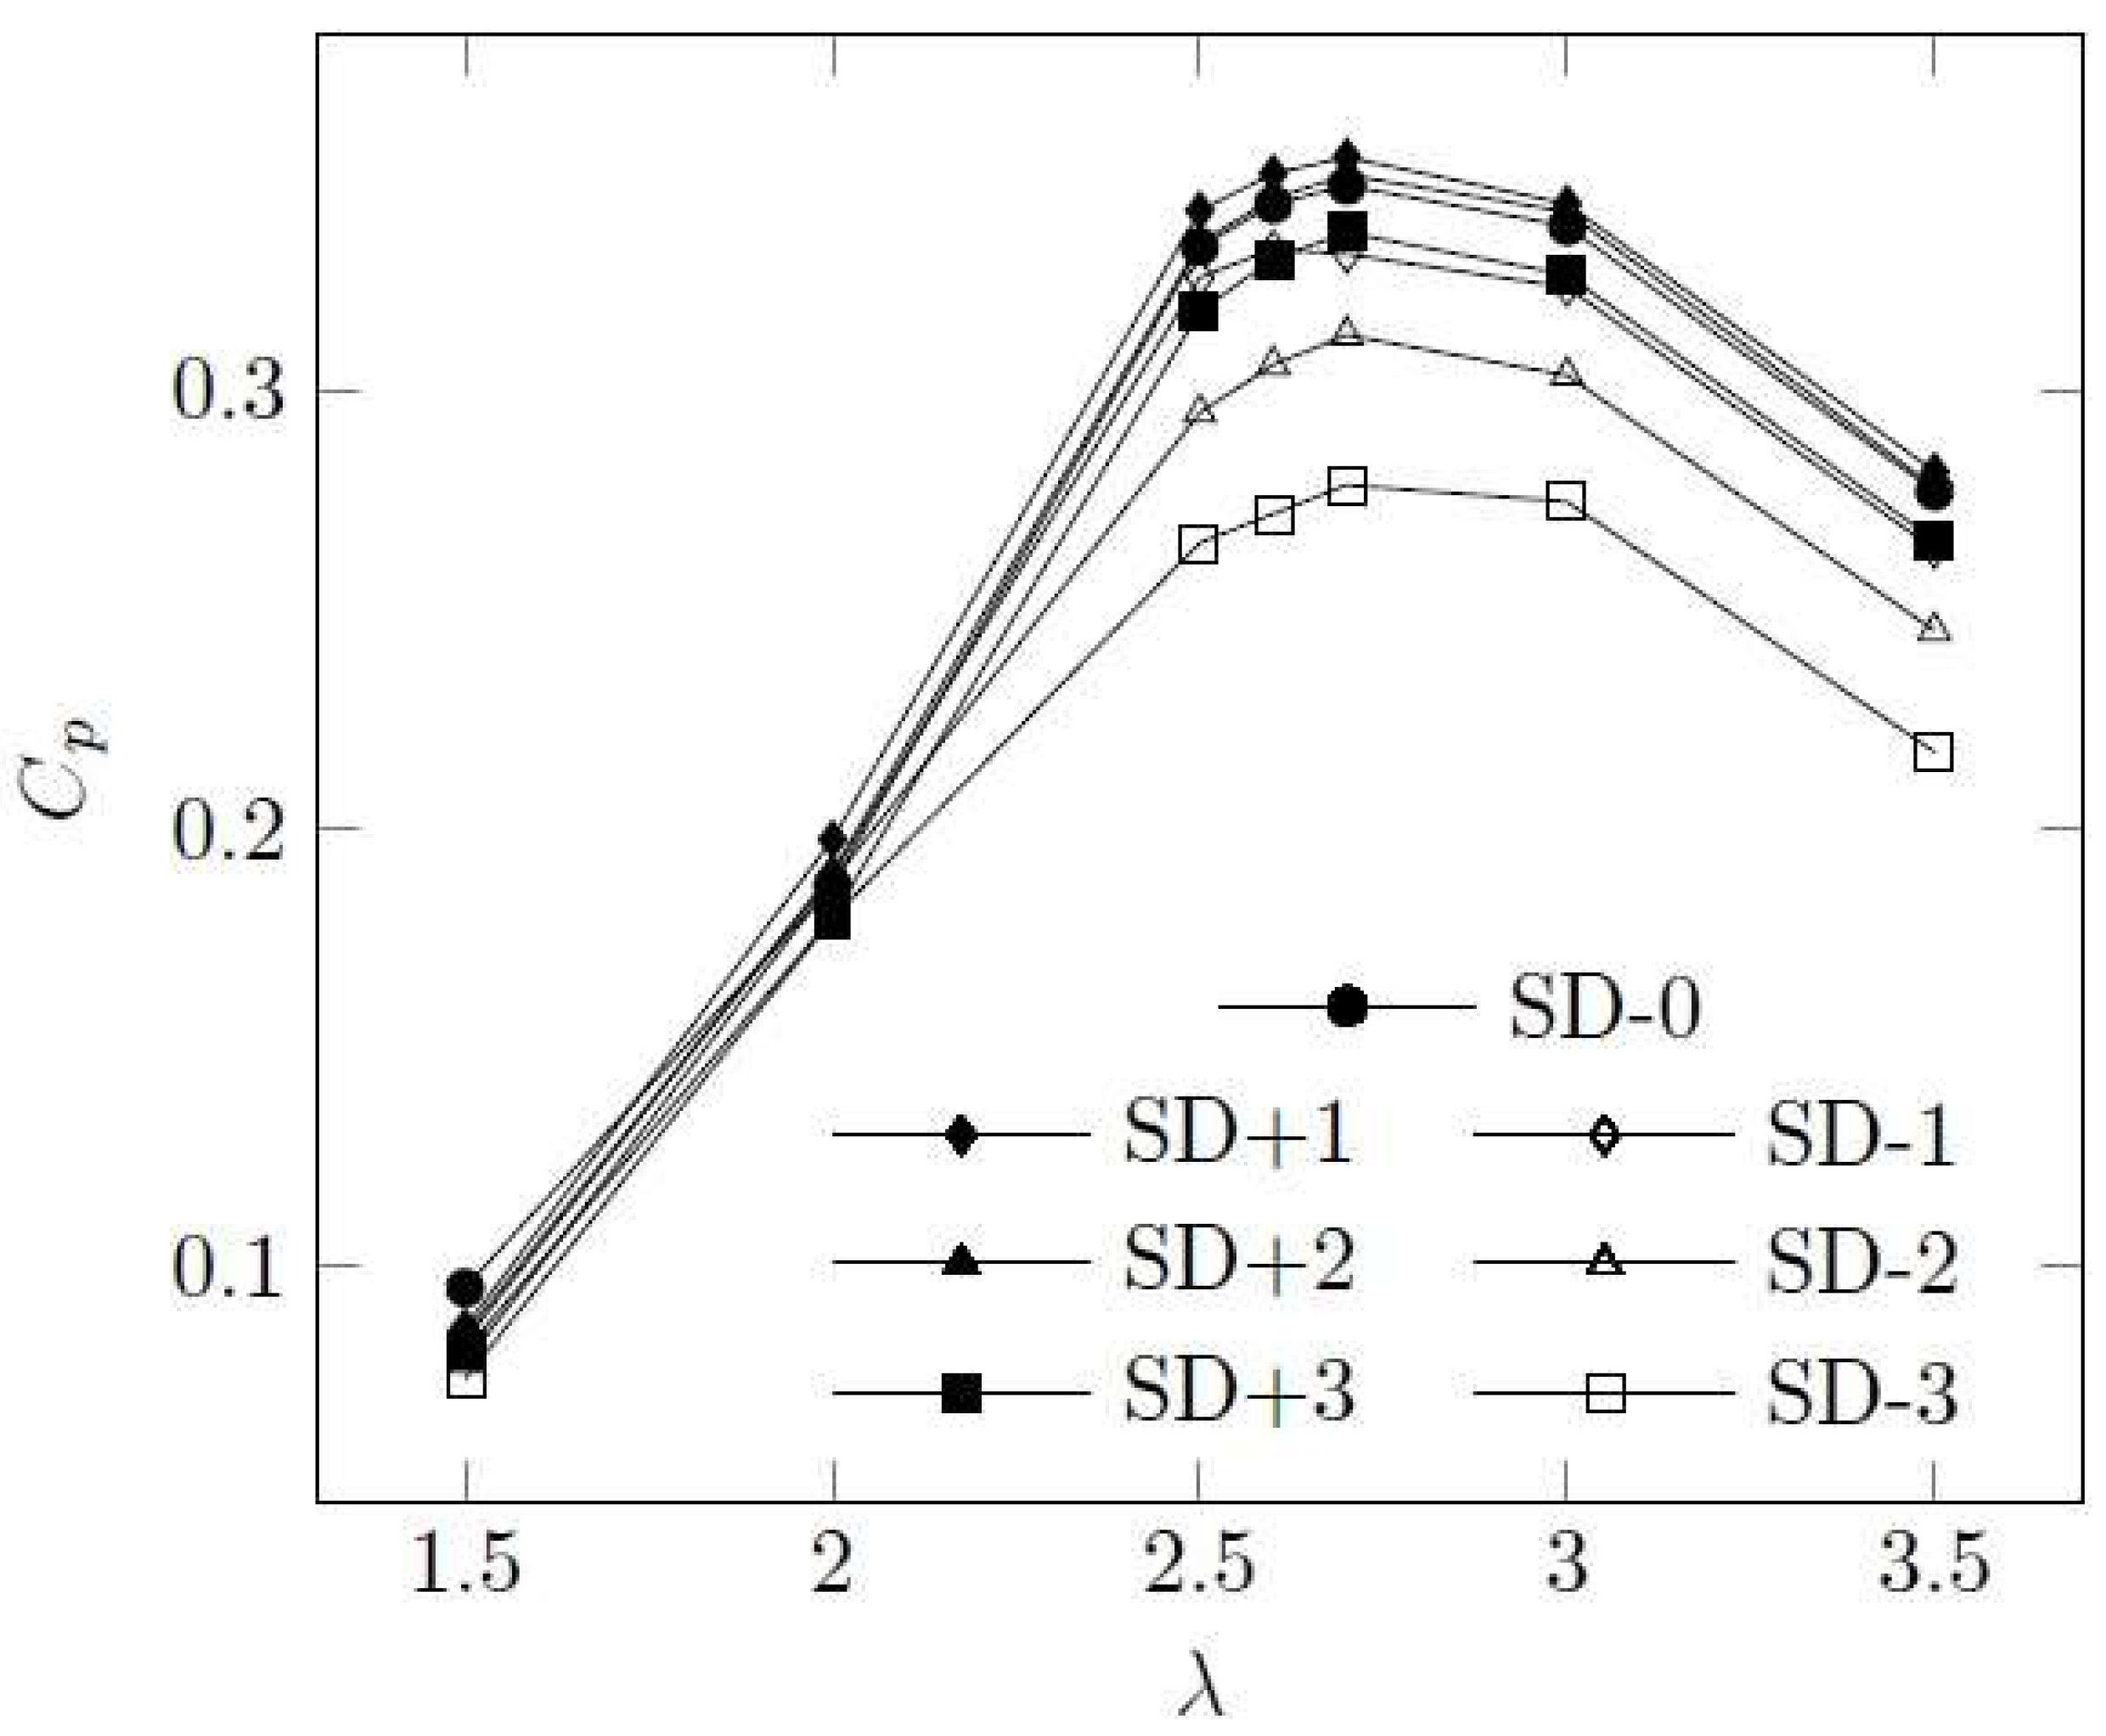
The impact of the pitch angle on the power coefficient of a single dimpled airfoil was examined across a range of pitch angles from −3° to +3°. The power coefficient results for the different pitch angles are graphed in Figure 7. It is evident from Figure 7 that the single dimpled airfoil with a pitch angle of +1° yields the highest power coefficient among all the airfoils. Specifically, for a lift coefficient of 2.7, the SD+1 airfoil achieves a maximum power coefficient of 0.35347. When considering positive pitch angles, the power coefficient values tend to decrease as the pitch angle increases. Similarly, for negative pitch angles, the power coefficient values decrease as the pitch angle decreases.
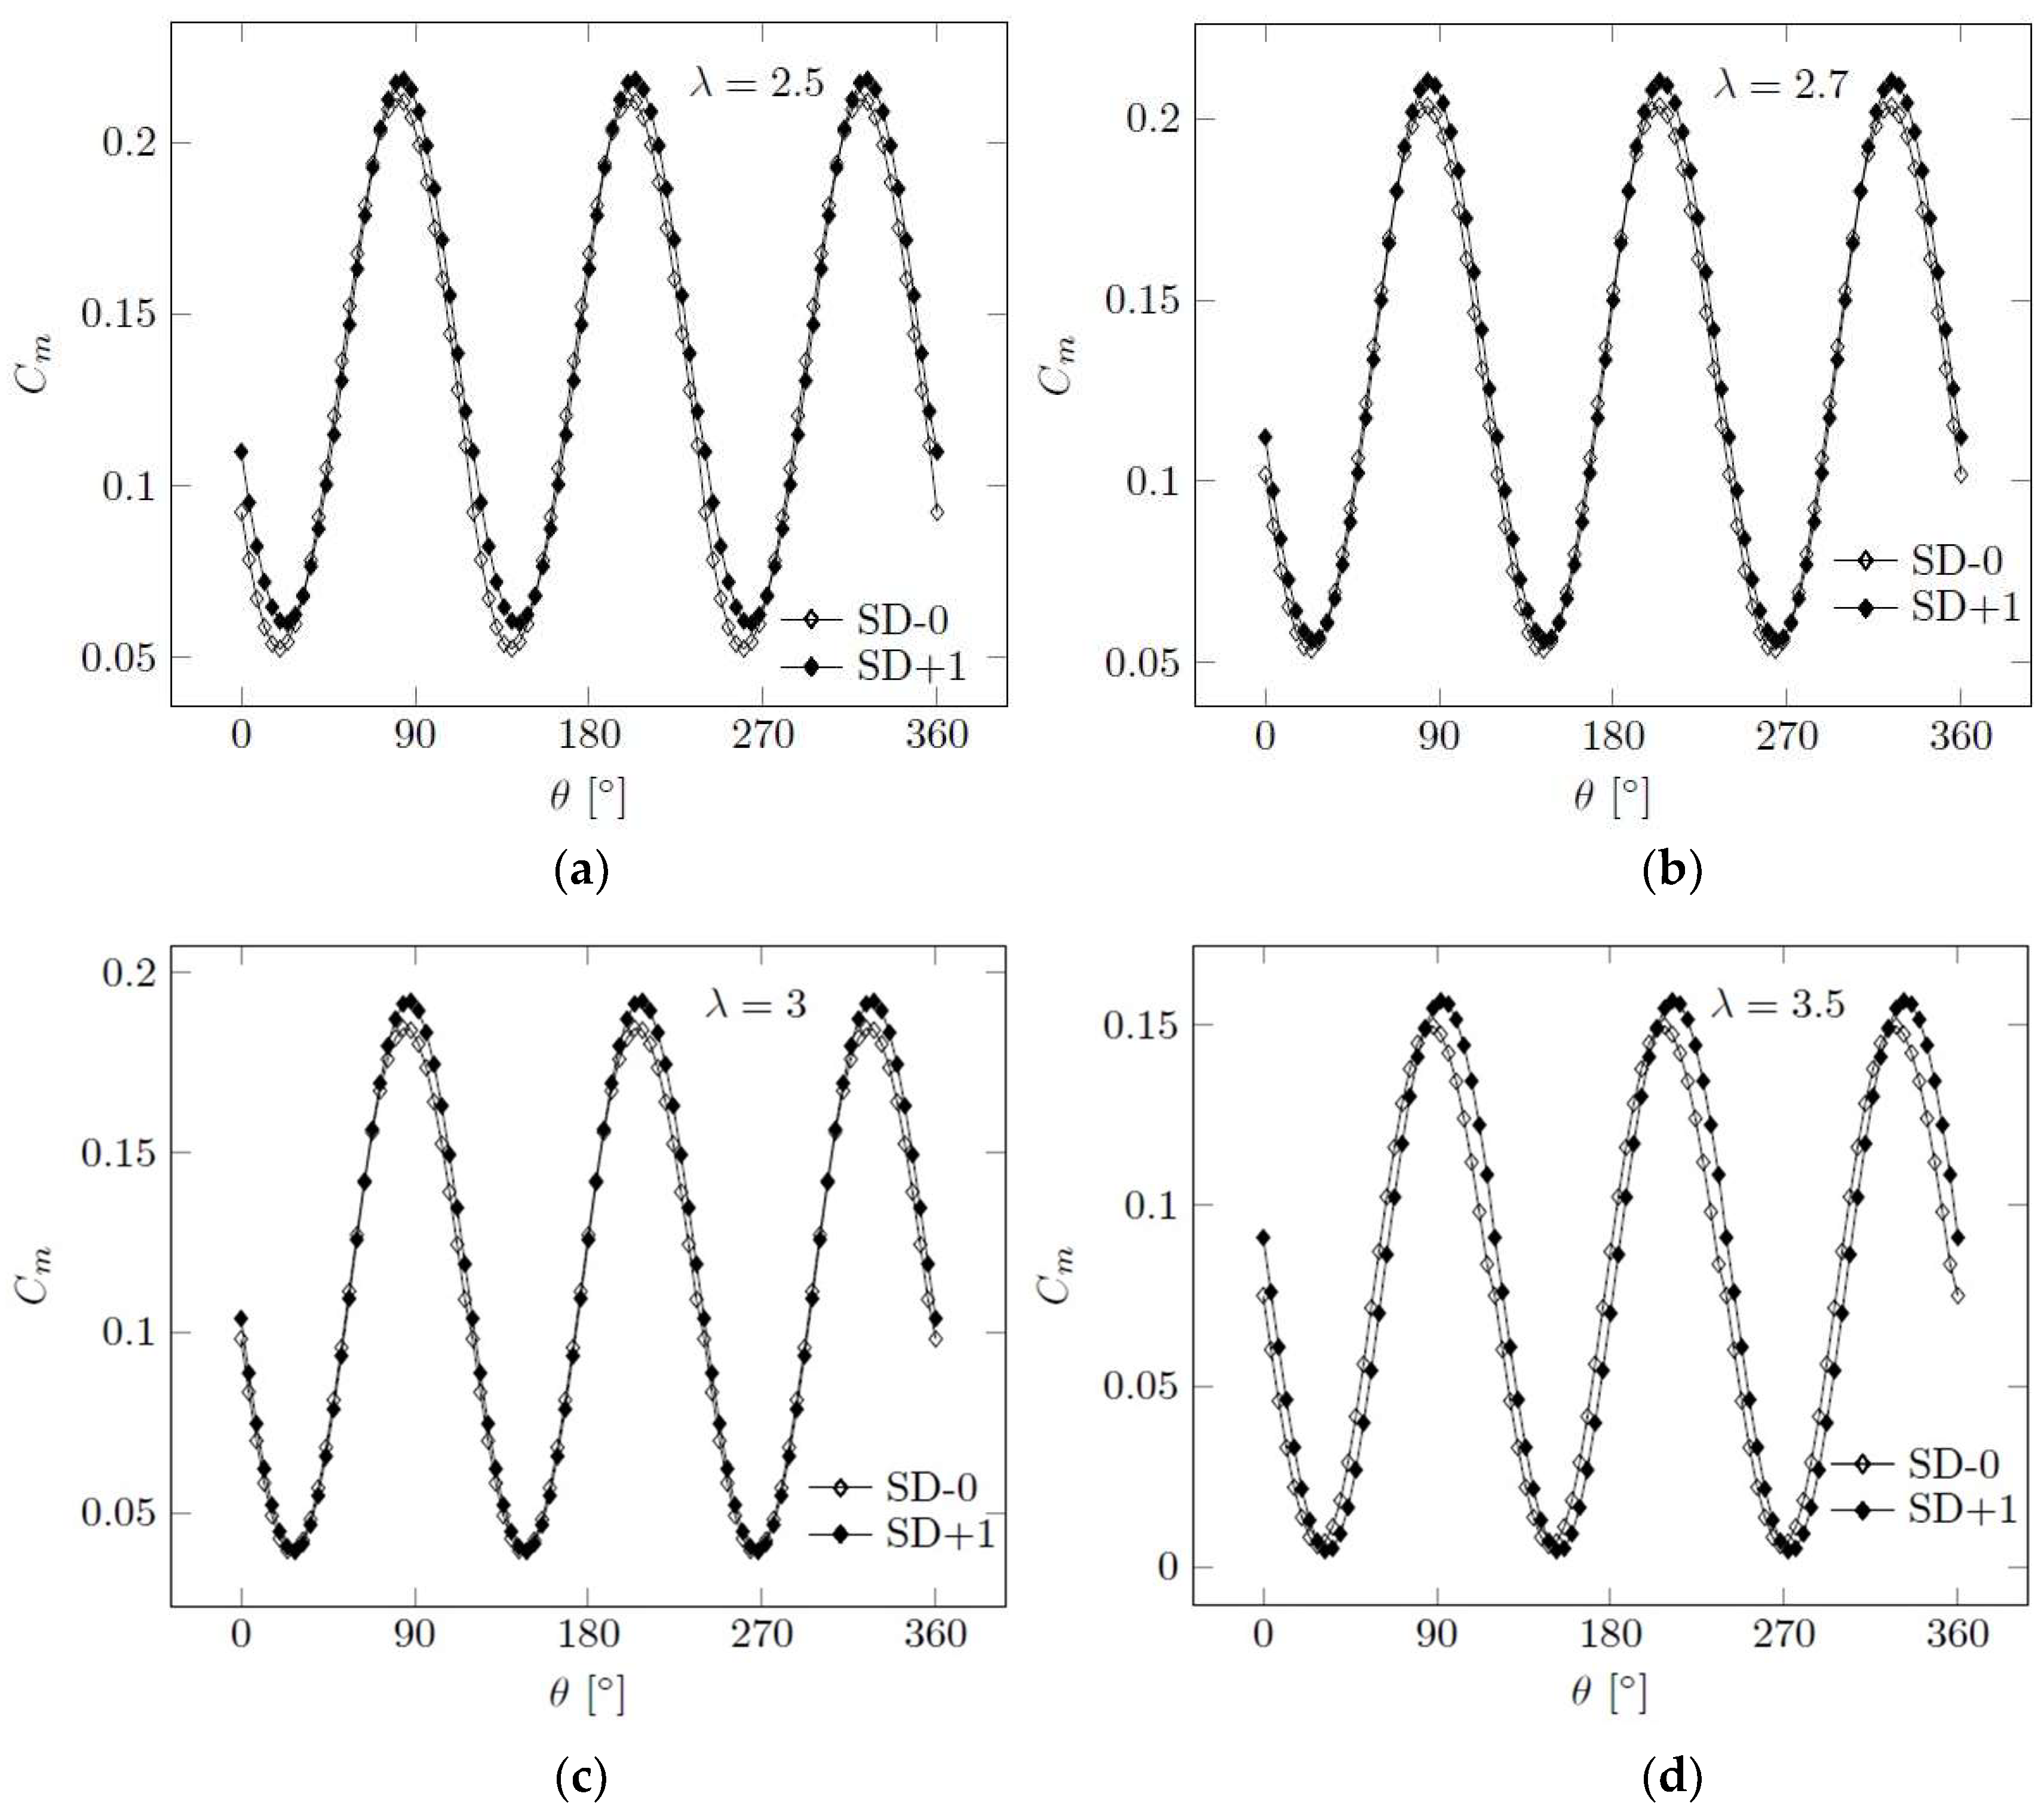
Moment coefficient variations with the azimuthal angle of the rotor for TSR = 2.5–2.7–3–3.5 at the tenth revolution are presented in Figure 8. Maximum moment coefficient values were obtained at θ = 90°–210° and 330° degrees of the rotor. The SD+1 airfoil had higher moment coefficient values than the SD-0 airfoil for the presented TSR range. For TSR = 2.5, the SD+1 airfoil showed less oscillation compared to the SD-0 airfoil. This is due to the relatively smaller vortices that were generated by the blades.
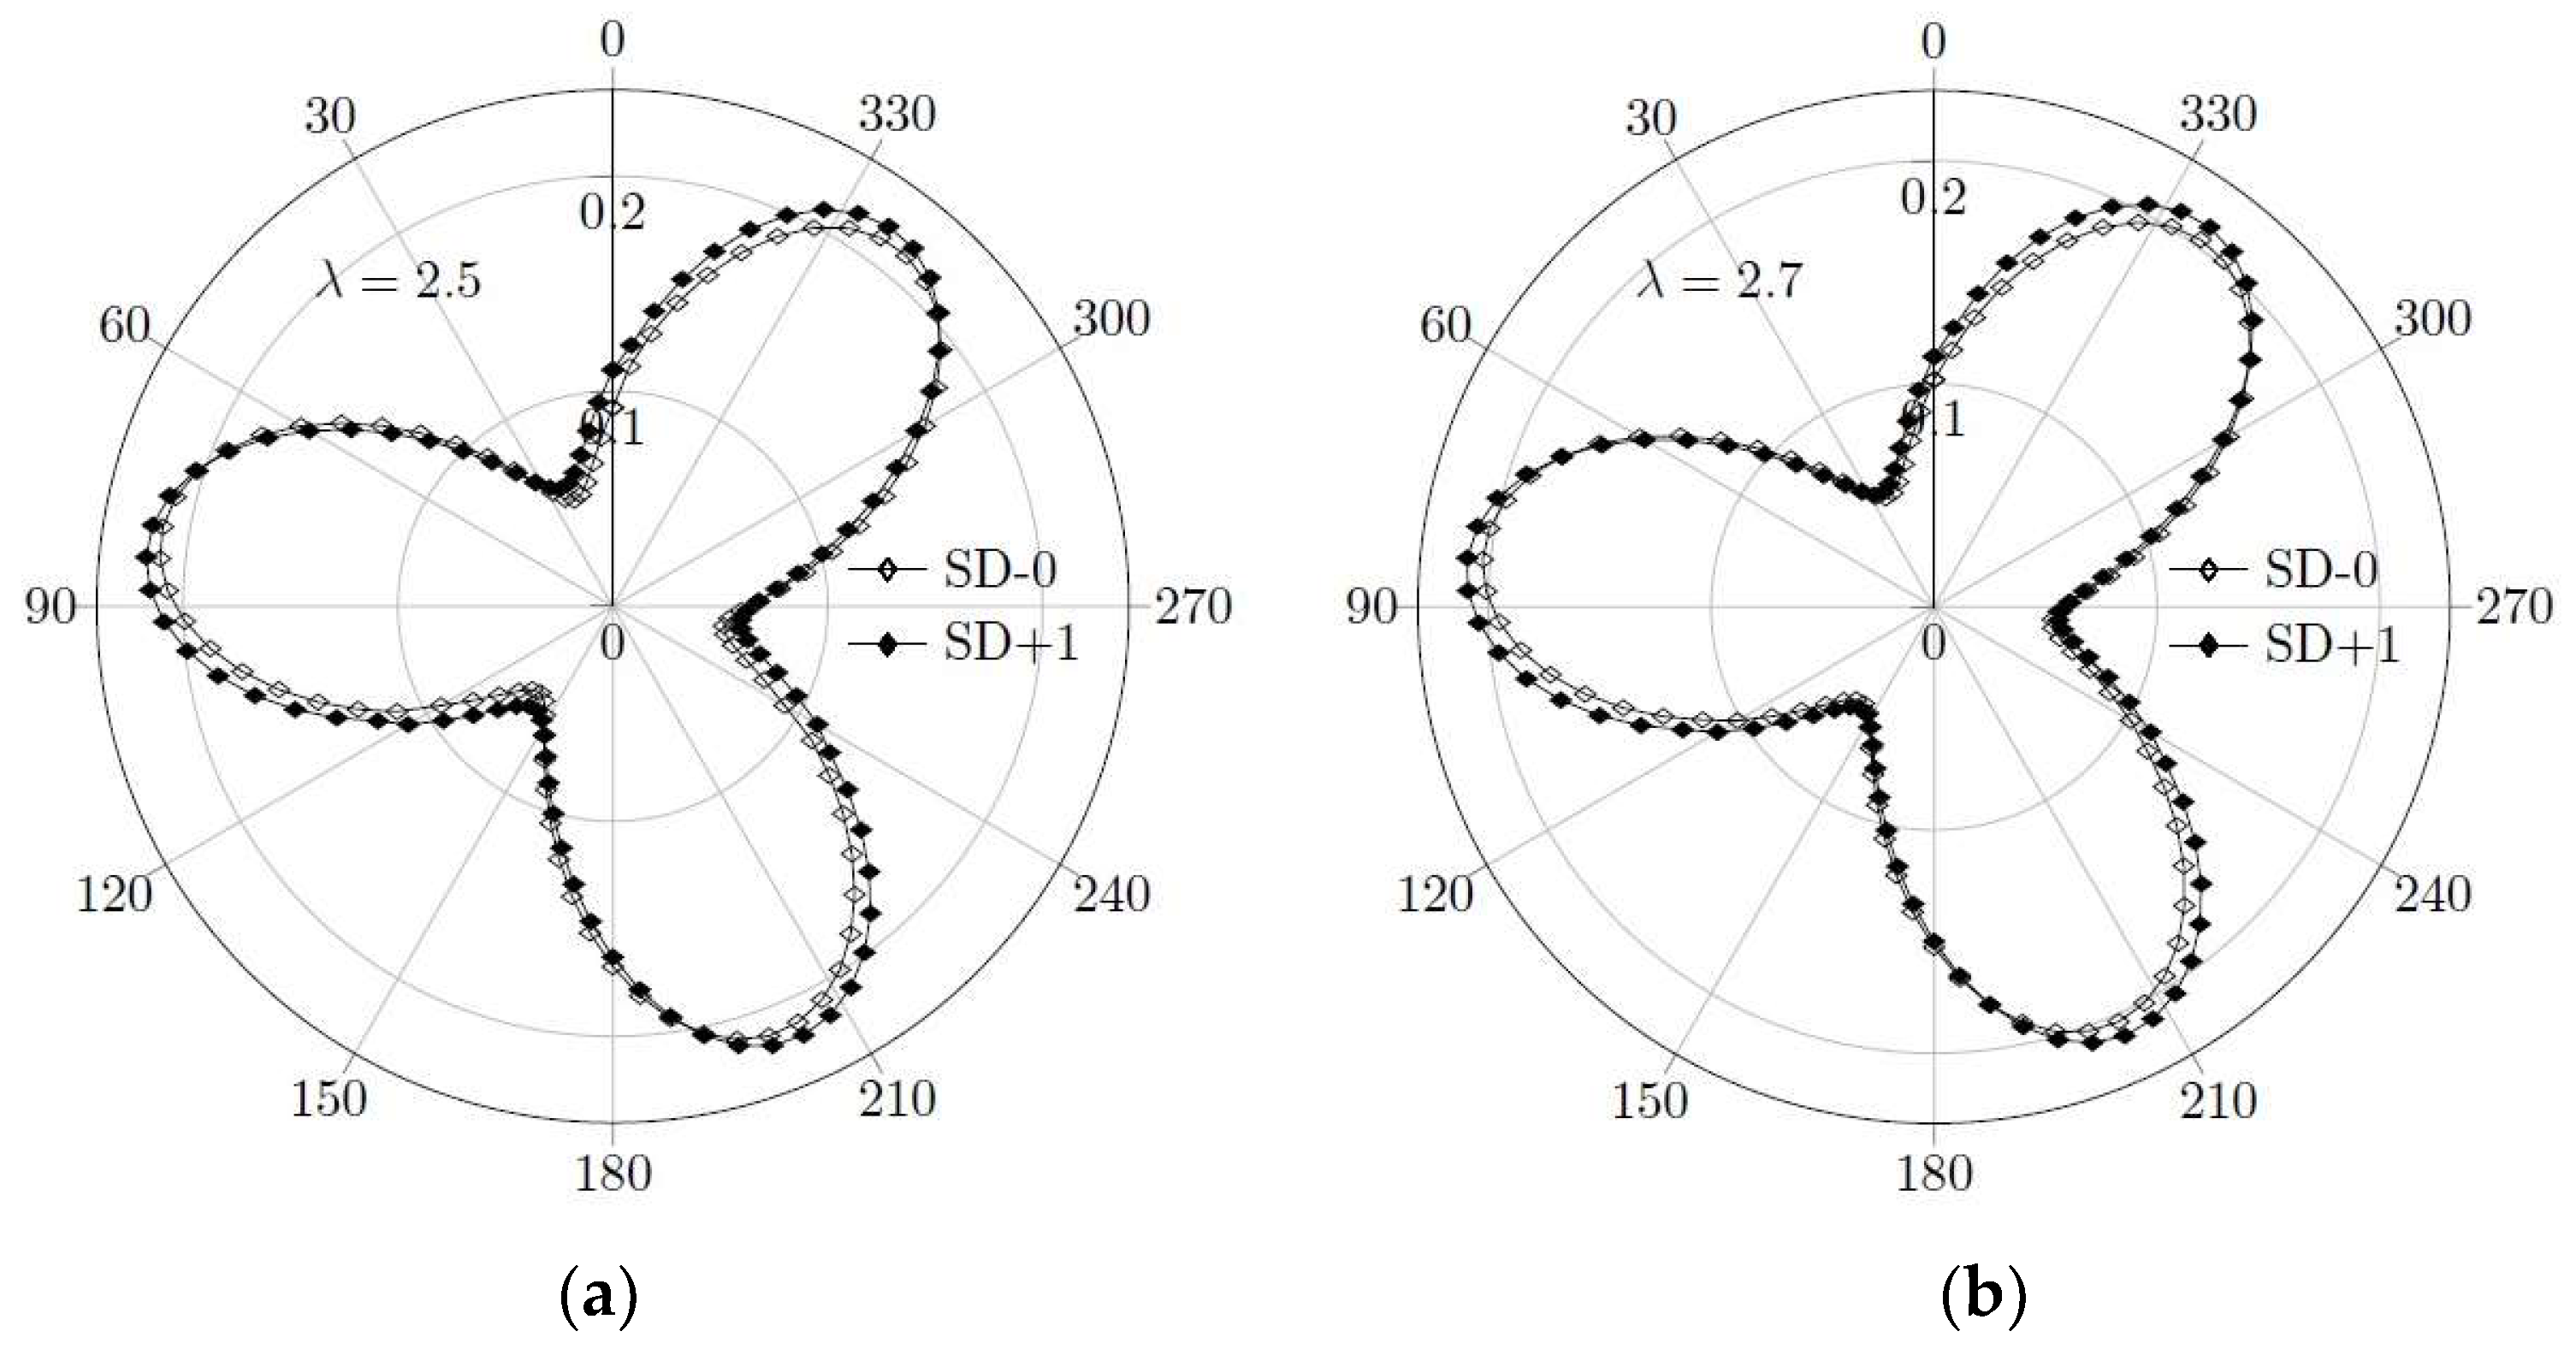
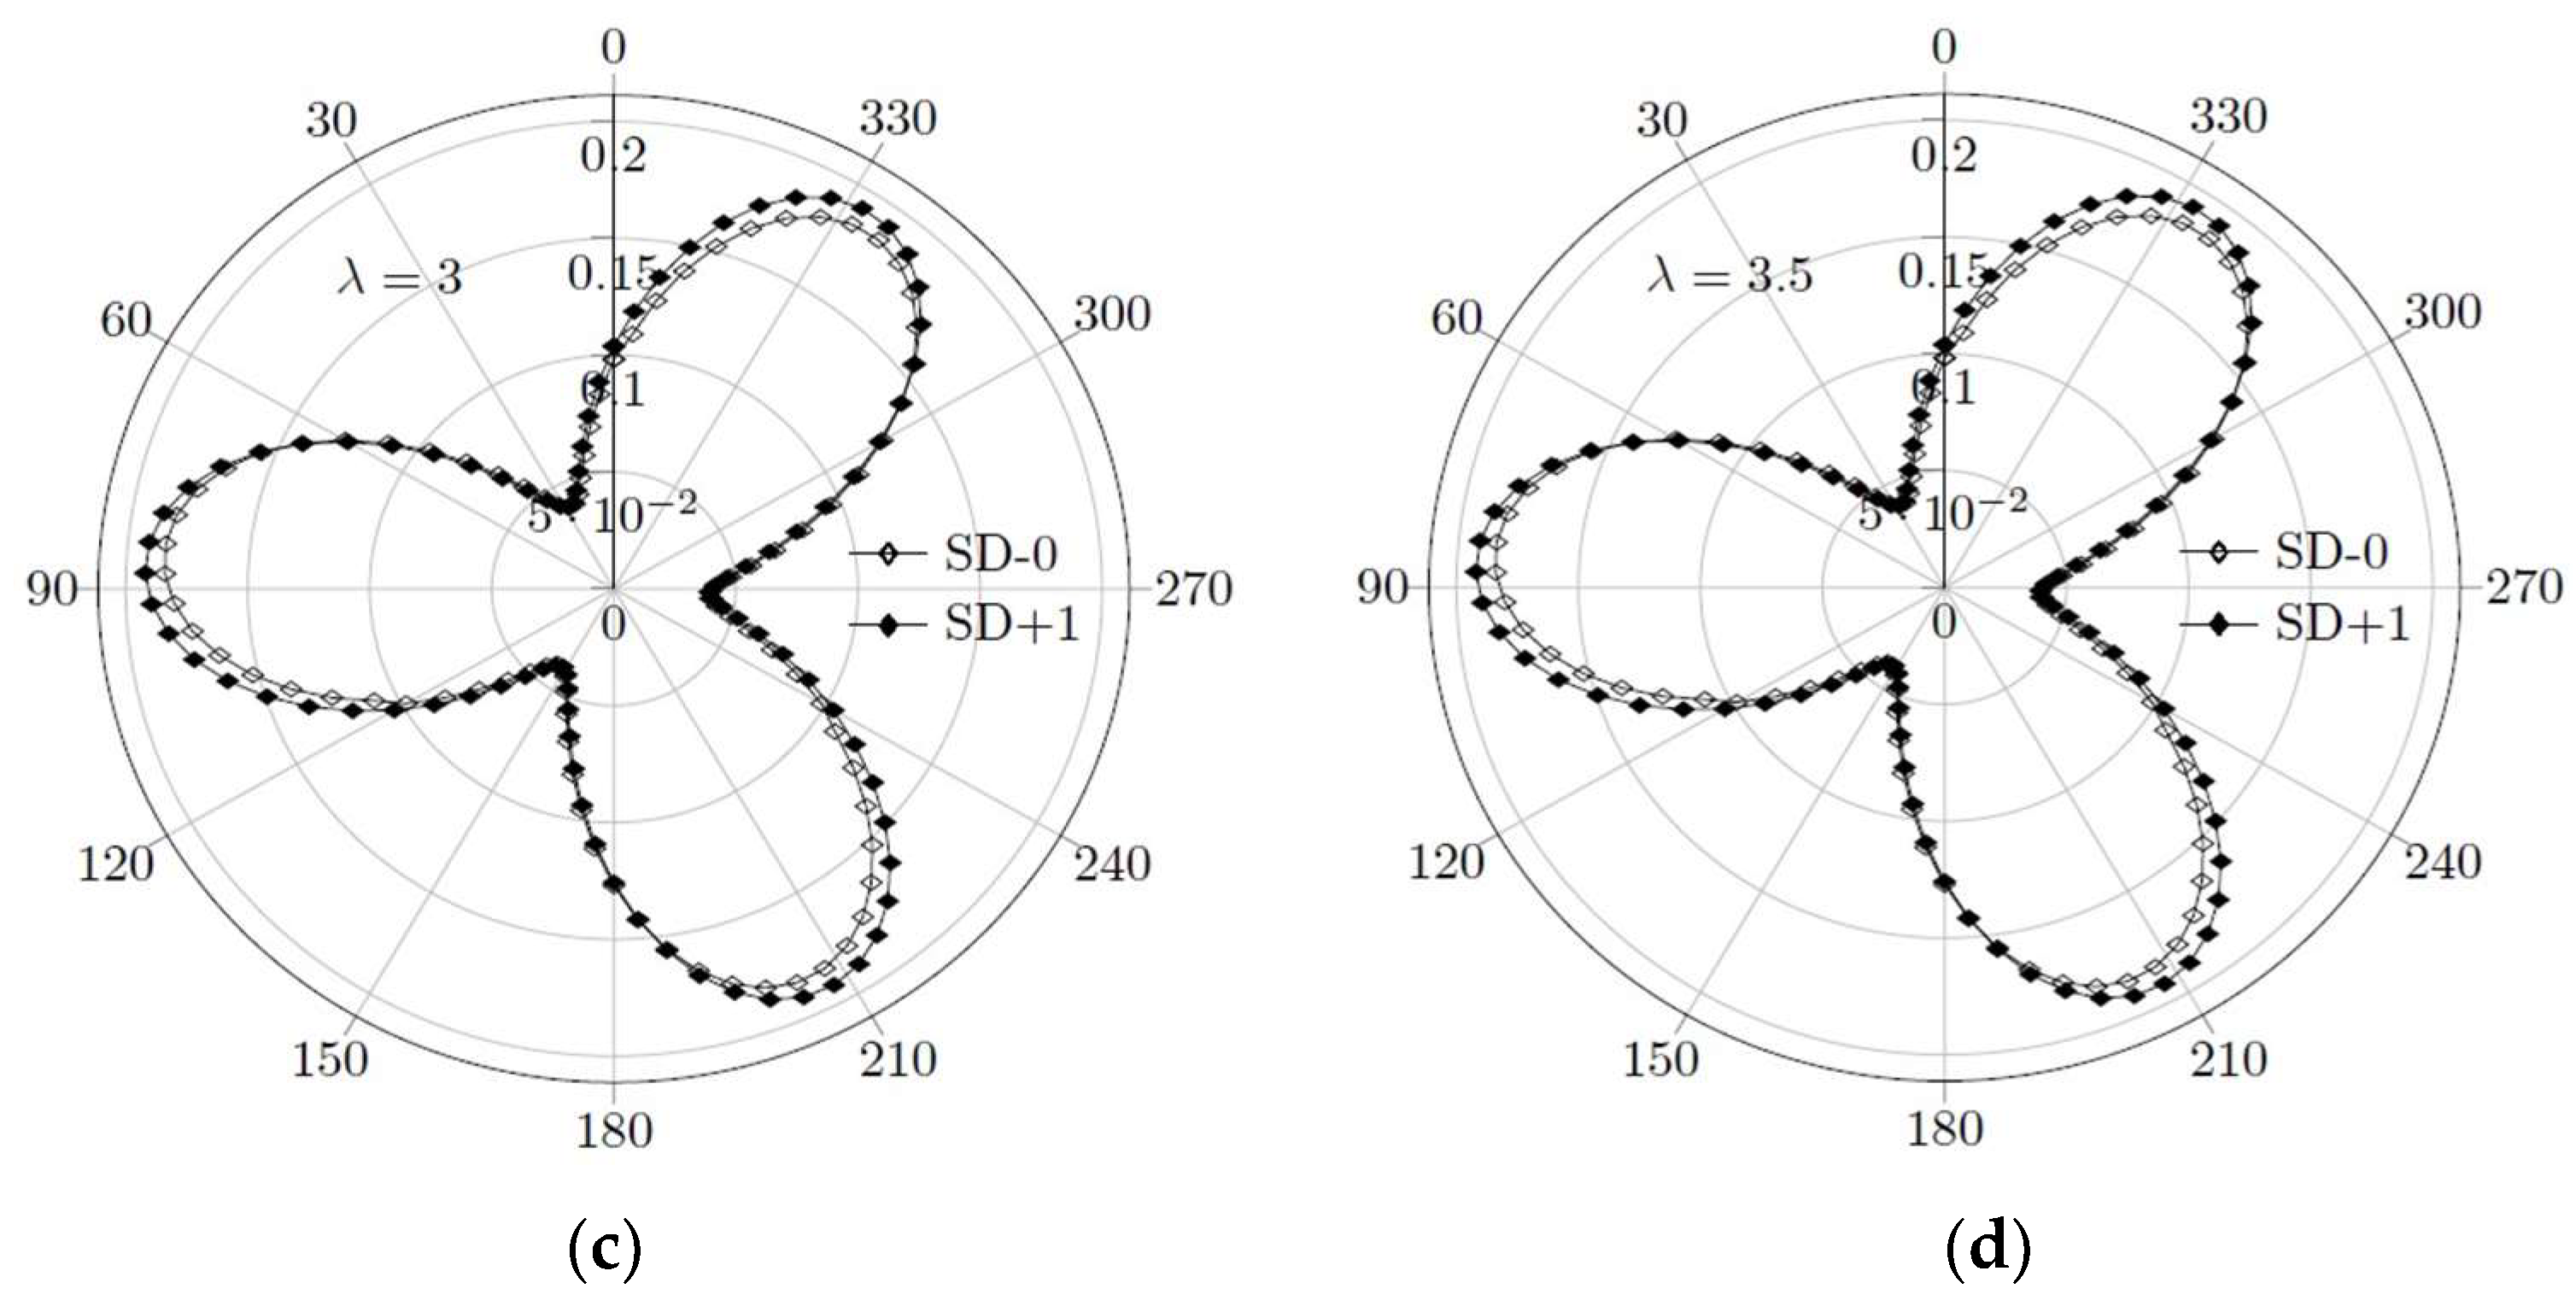
Figure 9 presents a comparison of polar diagrams illustrating the change in moment coefficient for the azimuthal angle of the rotor for SD-0 and SD+1. The SD+1 airfoil outperformed the SD-0 airfoil across all TSR values. The maximum moment coefficient values were observed at the rotor’s azimuthal positions of θ = 90°−210°−330°, while the minimum values occurred around θ = 30°−150°−270°. As the TSR increased, the maximum moment coefficient values also increased until reaching a TSR value of TSR = 2.7. Beyond this threshold, the moment coefficient values tended to decrease. The higher TSR values resulted in increased turbulence and wake formation behind the blades. Consequently, the interaction of the upcoming blades with this turbulent flow led to reduced torque and power generation. The average moment coefficient value for SD+1 at TSR = 2.7 was calculated as 0.1309, whereas for SD-0 it was determined as 0.1285.
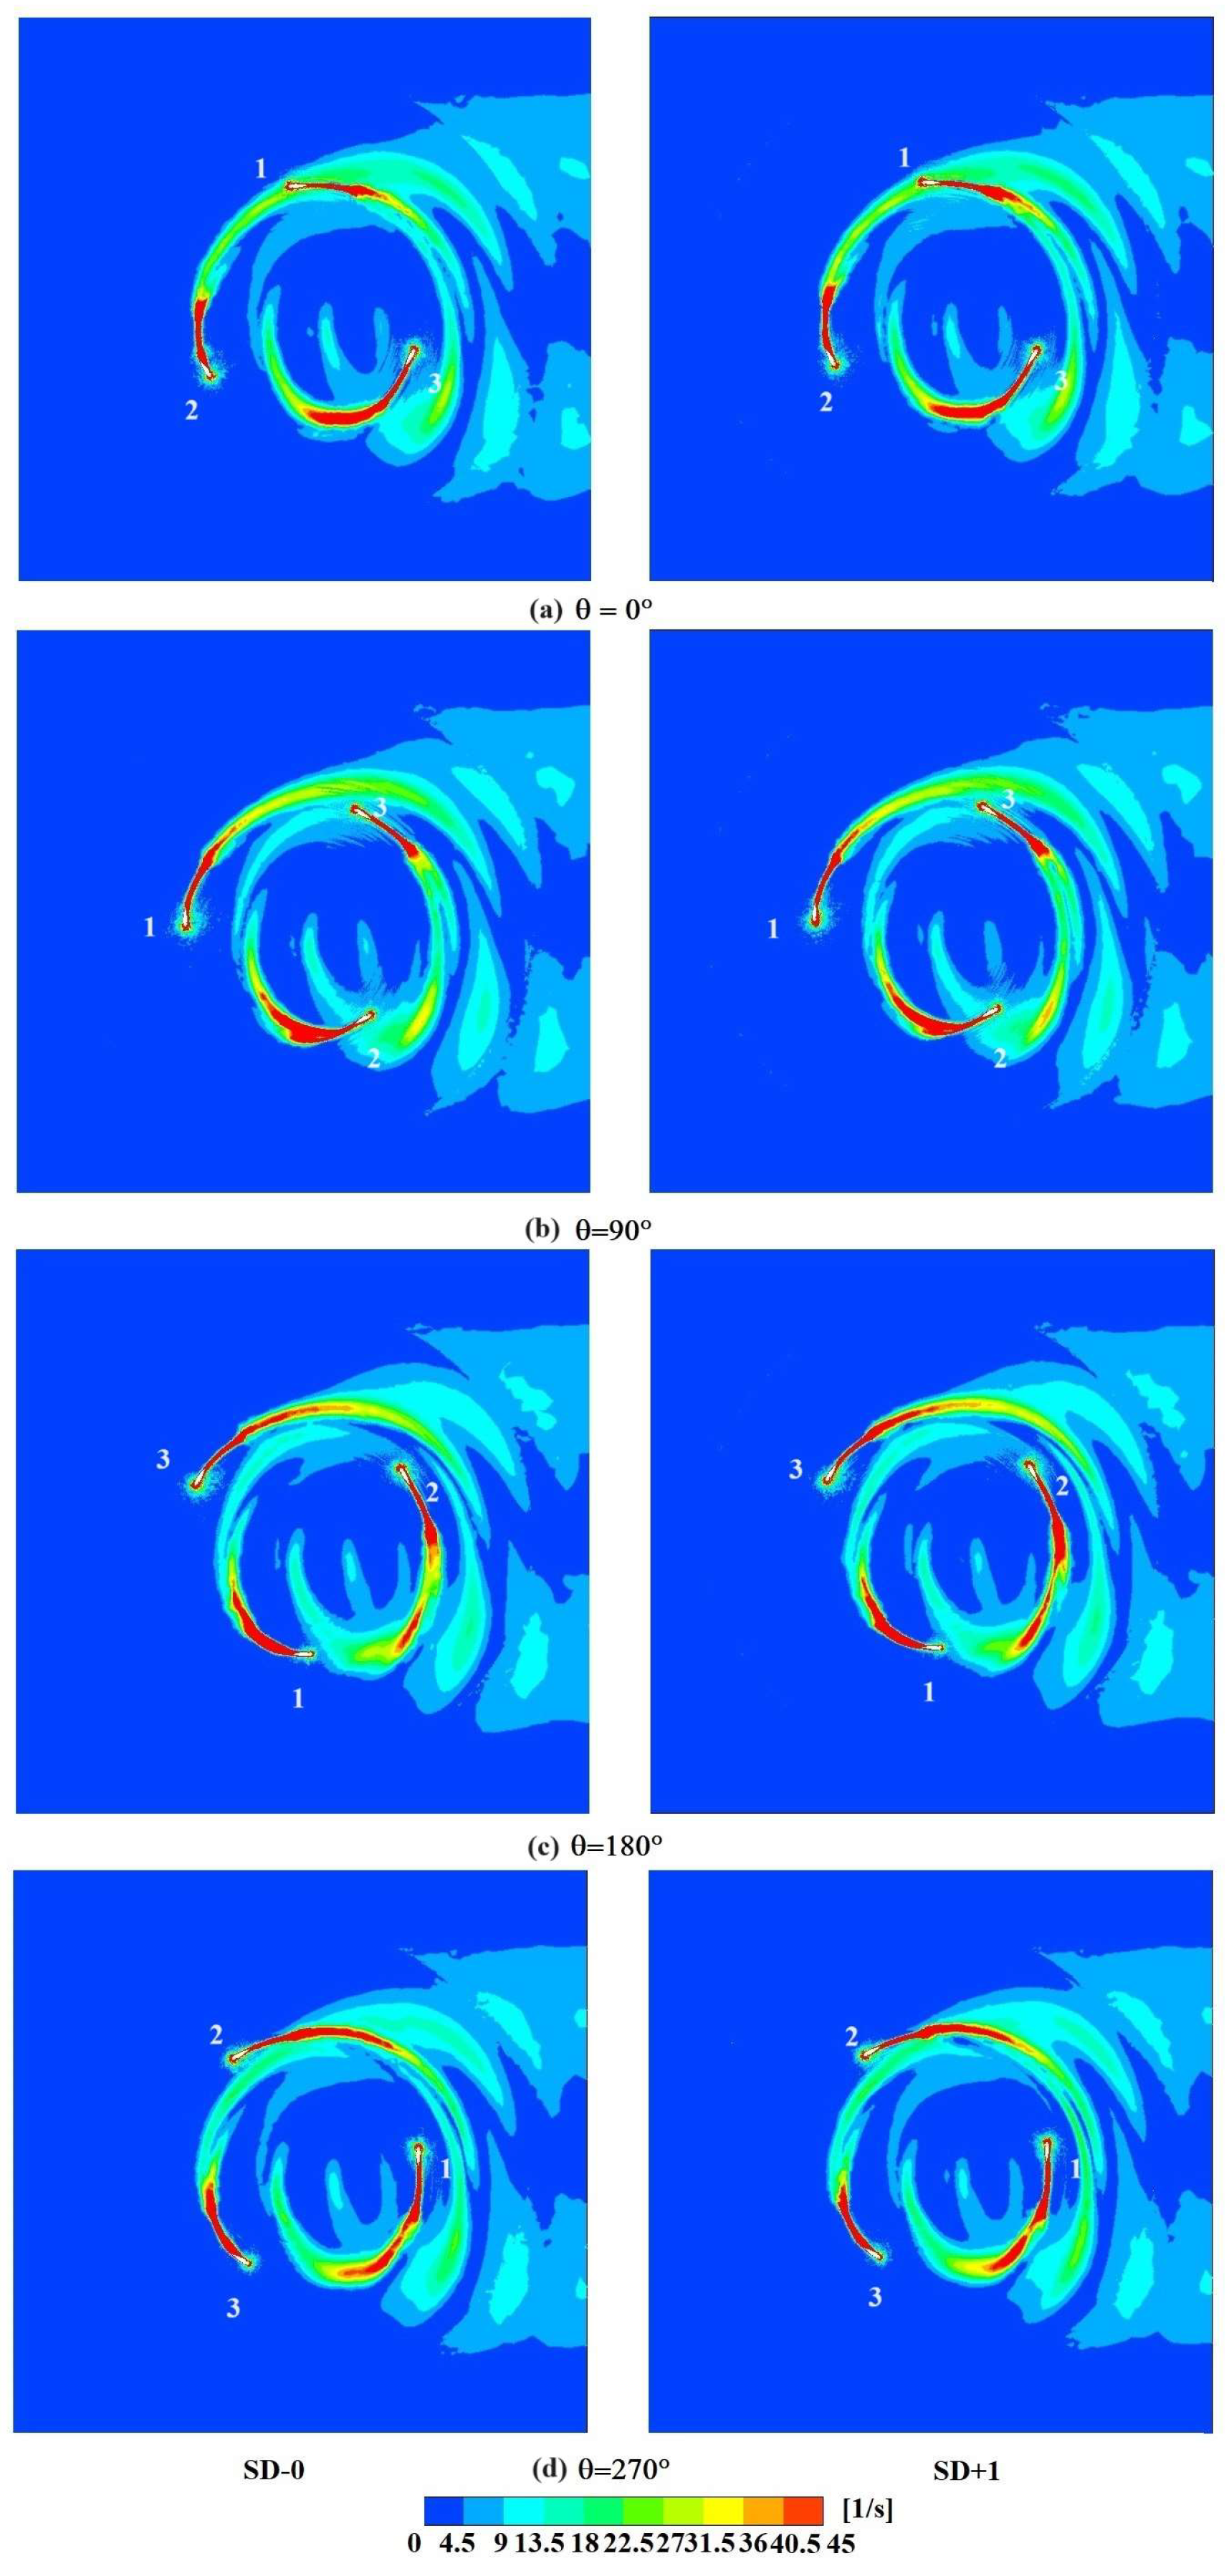
The vorticity formations of SD-0 and SD+1 airfoils, with a 90° interval, for the tenth revolution of the turbine at a TSR of 2.7, are depicted in Figure 10. The rotation of the vortices initiated at θ = 0°, originating from the vortices generated by the preceding blade. As the flow progressed and the rotor reached θ = 90°, it generated maximum torque due to the absence of any disruptive wake or turbulence, resulting in the generation of the maximum vortices by the blade. At θ = 180°, the vortices began detaching from the blade surfaces. By the time the rotor reached θ = 270°, the vortices had completely separated. Upon careful examination of Figure 10, it becomes evident that the vortices separated from the SD+1 airfoil were relatively smaller compared to those from the SD-0 airfoil. These smaller vortices would dissipate with the incoming flow and exert less force and vibration on the rotor components.
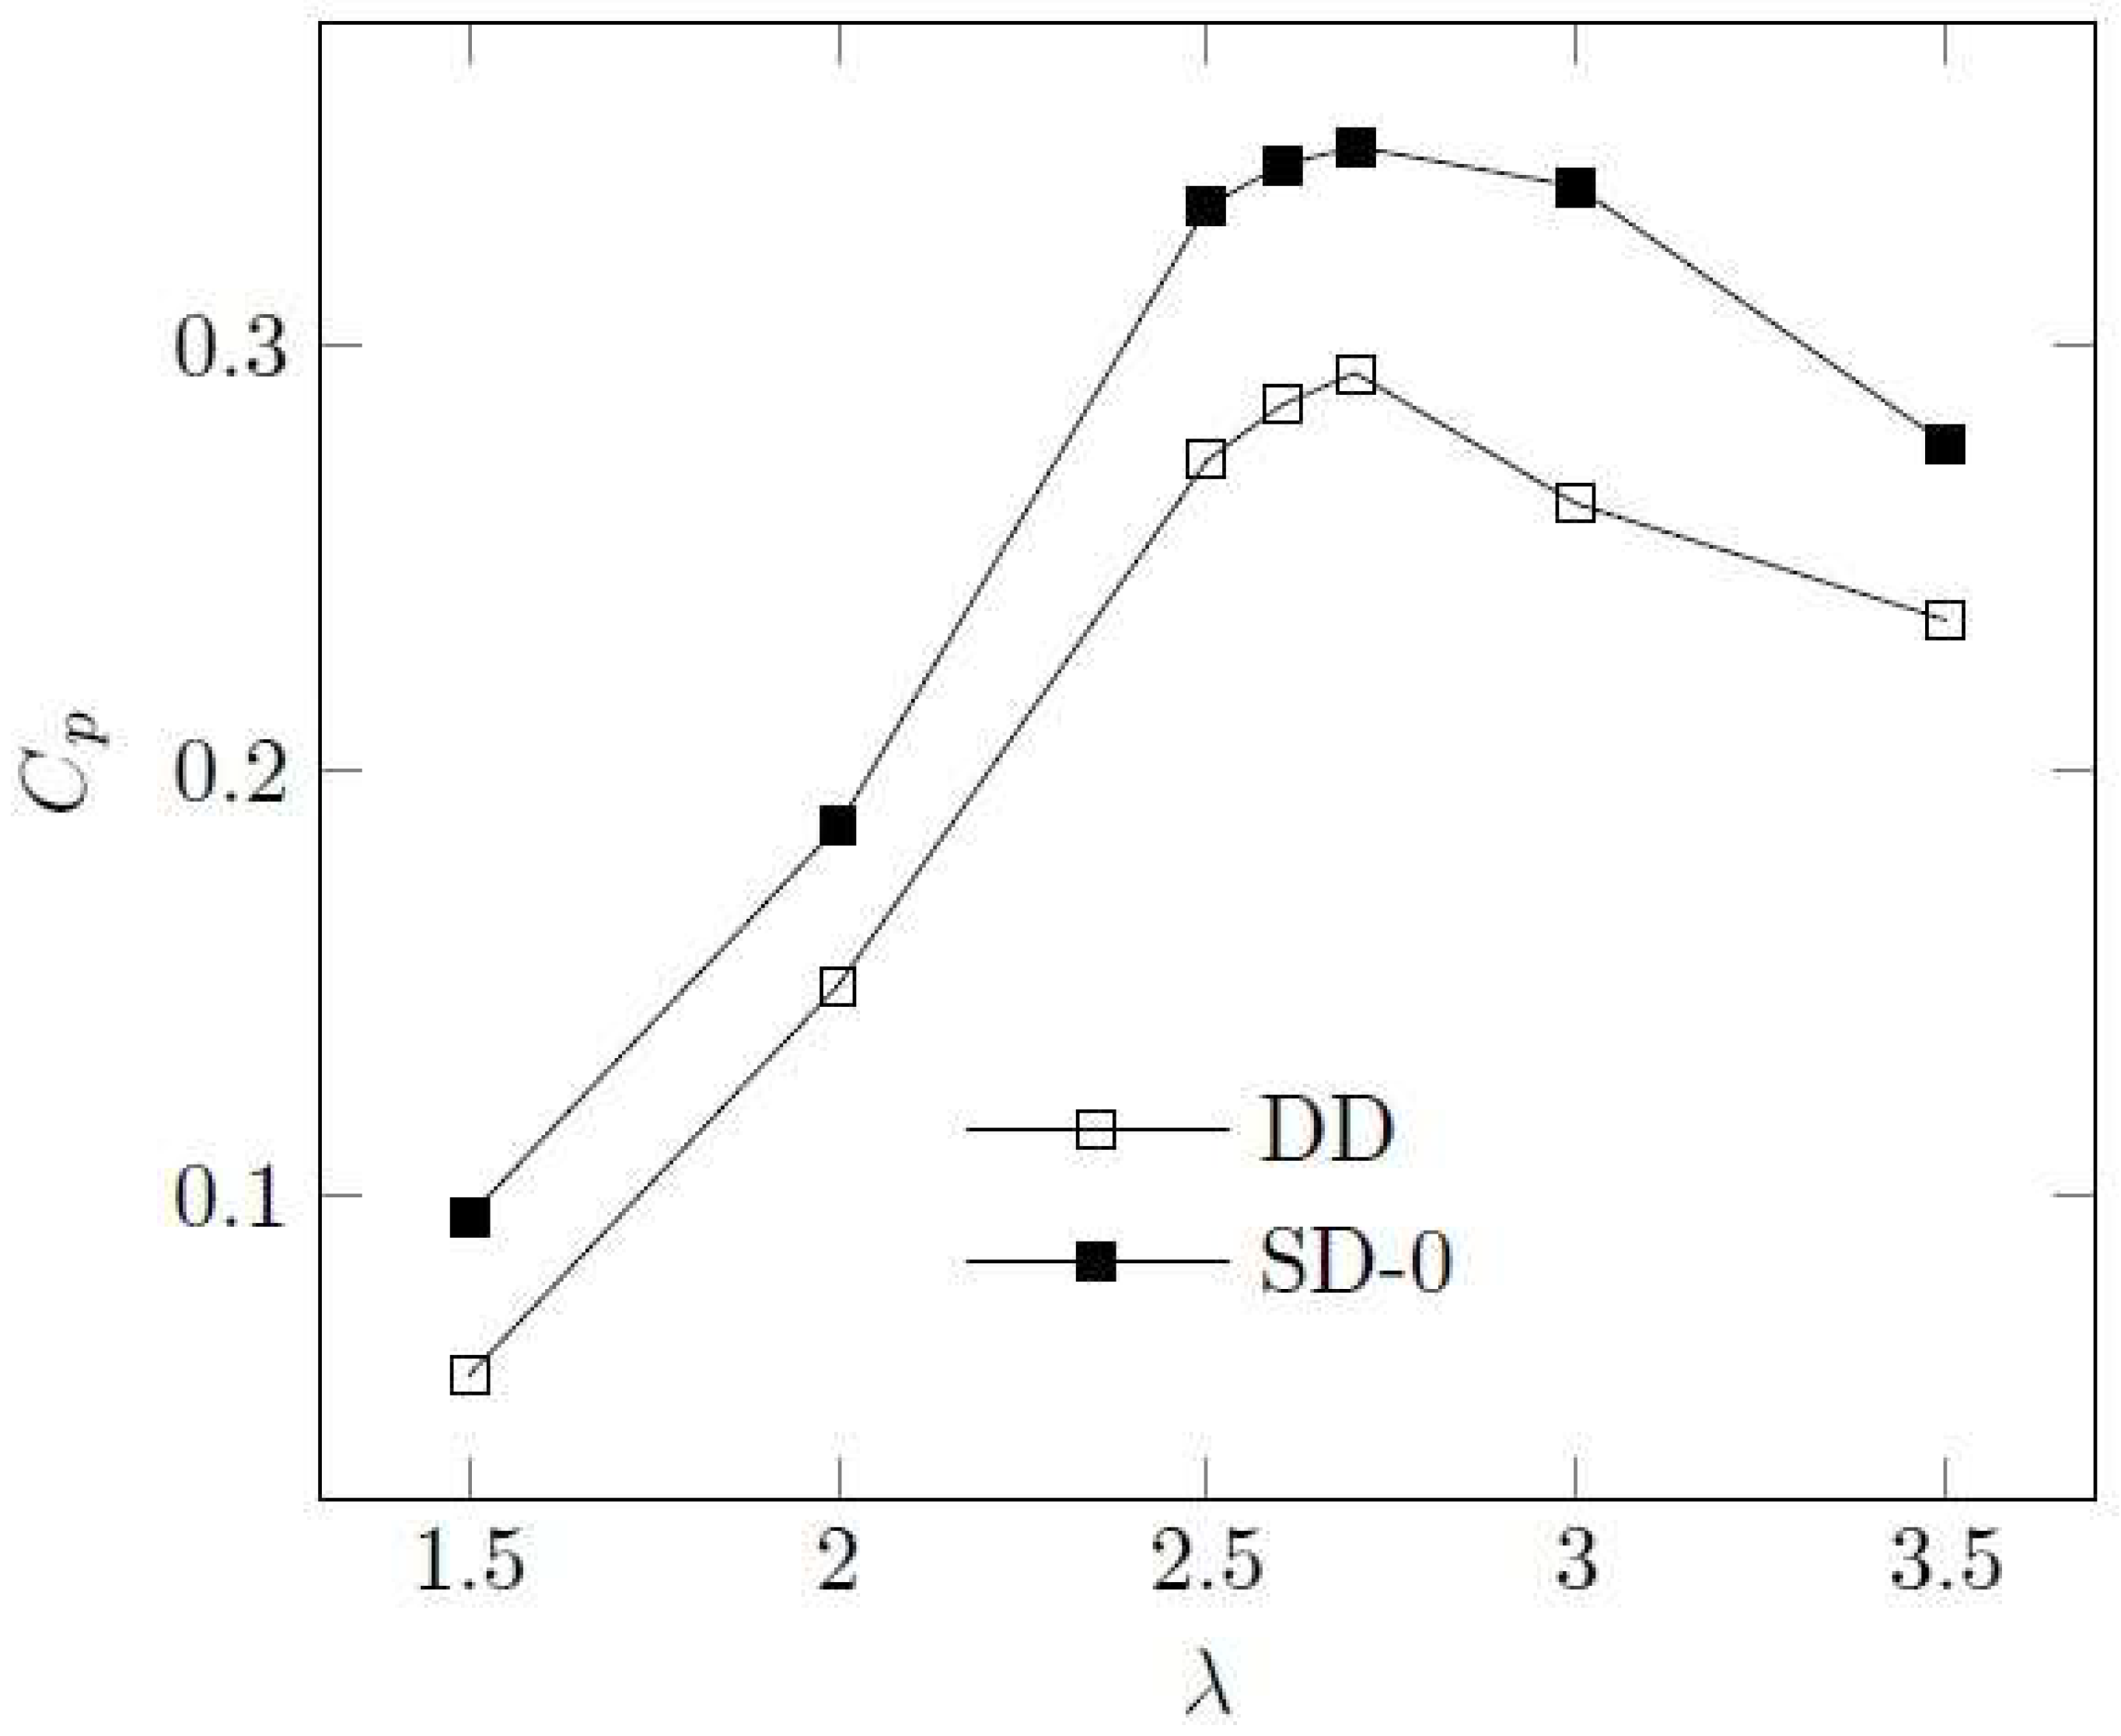
Additionally, the performance of a rotor composed of airfoils with double dimples was investigated. Figure 11 presents a comparison of power coefficients for TSR for SD-0 and DD airfoils. It is worth mentioning that while both airfoil types followed a similar pattern, the DD airfoil consistently exhibited lower performance across all TSR values. The maximum power coefficient attained by the DD airfoil was 0.2937 at TSR = 2.7.
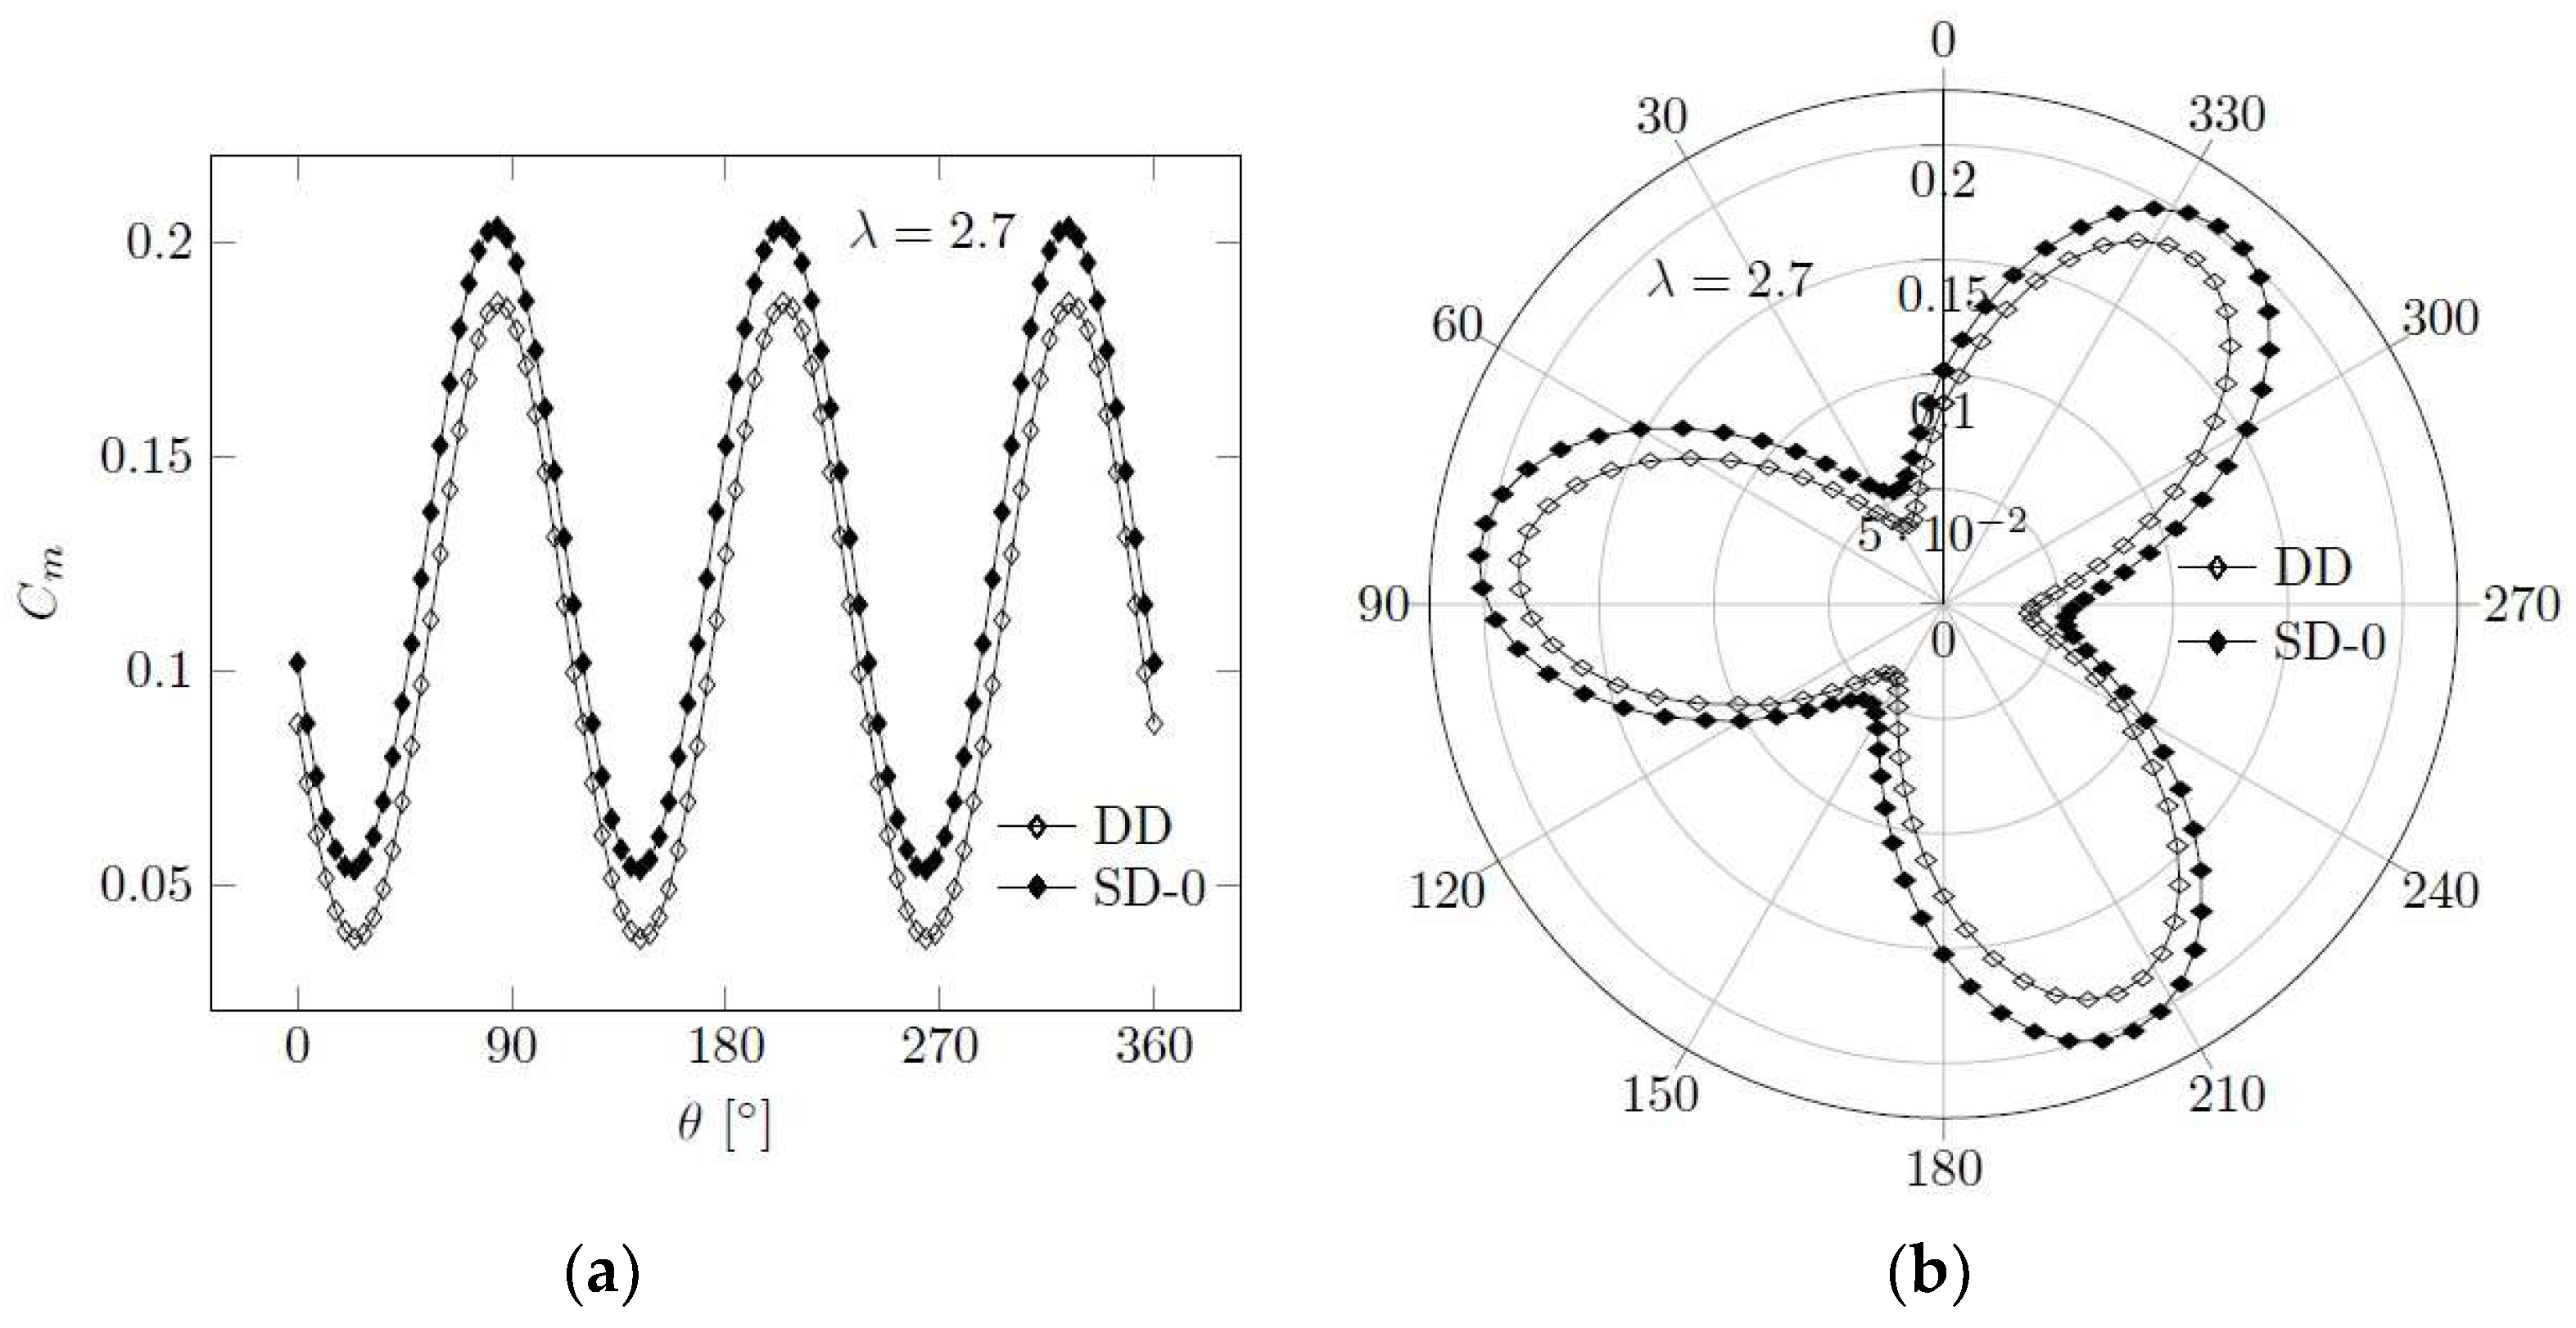
Figure 12 presents a comparison of the moment coefficient variation between SD-0 and DD airfoils at a specific value of TSR =2.7. The DD airfoil exhibited maximum and minimum moment coefficient values of 0.1898 and 0.0343, respectively. On the other hand, the average moment coefficient value for DD was calculated as 0.1088, while the average moment coefficient value for SD-0 was determined to be 0.1285.
4. Conclusions
The objective of this research was to enhance the aerodynamic effectiveness of a straight-bladed Darrieus Vertical Axis Wind Turbine by incorporating a dimpled airfoil with pitch angles. To evaluate the performance, two-dimensional numerical simulations were carried out to ascertain the power coefficient values. Based on the findings of this investigation, the following conclusions can be derived:
- The addition of a circular dimple on the lower side of an airfoil, positioned at 0.25 c with a diameter of 0.08 c, can lead to an enhancement in its aerodynamic efficiency. This modification yields a maximum power coefficient of 0.3469 at a value of TSR = 2.7. In contrast, a standard plane airfoil achieves a maximum power coefficient of 0.3298 at TSR = 2.6. By incorporating this modification, the SD-0 airfoil improves its aerodynamic efficiency by 5.18%.
- The airfoil SD+1 stands out due to its dimples and a positive pitch angle of +1°, showcasing superior performance with a power coefficient of 0.35347. This represents a significant improvement of 7.17% when compared to a standard plane airfoil, and a notable enhancement of 1.8% when compared to the dimpled airfoil SD-0 without a pitch angle.
- An inverse relationship is observed between the pitch angle and the power coefficient values, with a decrease occurring as the angle rises from +1° to 3°.
- A reduction in the pitch angle from −1° to −3° leads to a decrease in the efficiency of the turbine. Among the tested airfoils, the SD-3 exhibited the lowest performance, with a recorded value of 0.2785.
- Furthermore, the investigation delved into the performance evaluation of introducing a second dimple on the upper side of the airfoil, positioned at a pitch angle of 0°. By conducting meticulous calculations, it was deduced that the implementation of a double dimple configuration yielded a reduction in efficiency.
To improve the aerodynamic effectiveness of VAWTs, one can consider examining a range of airfoil variations, encompassing both symmetrical and unsymmetrical designs. Furthermore, the analysis may encompass different dimple configurations, varying quantities of dimples, diverse dimensions of dimples, and distinct placements of these dimples.
Funding
This research received no external funding.
Data Availability Statement
Data are contained within the article.
Conflicts of Interest
The authors declare no conflict of interest.
Nomenclature
| Ablade | Blade area [m²] |
| Cd | Drag coefficient |
| Cl | Lift coefficient |
| Cm | Moment coefficient |
| Cp | Power coefficient |
| Fd | Drag force [N] |
| Fl | Lift force [N] |
| Ft | Tangential force [N] |
| M | Total torque [Nm] |
| N | Number of blades |
| P | Power [W] |
| R | Rotor radius [m] |
| Vb | Blade velocity [m/s] |
| Vd | Velocity at turbine disc [m/s] |
| Vrel | Relative flow velocity [m/s] |
| V∞ | Free stream velocity [m/s] |
| c | Chord length [m] |
| α | Angle of attack |
| δ | Blade pitch angle |
| θ | Blade azimuth angle |
| λ | Tip speed ratio |
| ρ | Air density [kg/m³] |
| Angle of relative flow velocity | |
| ω | Rotational speed [rad/s] |
Acronyms
| HAWT | Horizontal Axis Wind Turbine |
| NACA | National Advisory Committee for Aerodynamics |
| TSR | Tip Speed Ratio |
| VAWT | Vertical Axis Wind Turbine |
References
- Manwell, J.F.; McGowan, J.G.; Rogers, A.L. Wind Energy Explained; Wiley: Hoboken, NJ, USA, 2010. [Google Scholar]
- Tong, W. Wind Power Generation and Wind Turbine Design; WIT Press: Southampton, UK, 2010. [Google Scholar]
- Mohamed, M.H. Performance Investigation of H-Rotor Darrieus Turbine with New Airfoil Shapes. Energy 2012, 47, 522–530. [Google Scholar] [CrossRef]
- Mathew, S. Wind Energy Fundamentals, Resource Analysis and Economics; Springer: Berlin/Heidelberg, Germany, 2006. [Google Scholar]
- Das Karmakar, S.; Chattopadhyay, H. A Review of Augmentation Methods to Enhance the Performance of Vertical Axis Wind Turbine. In Sustainable Energy Technologies and Assessments; Elsevier: Amsterdam, The Netherlands, 2022; Volume 53, p. 102469. [Google Scholar] [CrossRef]
- Bravo, R.; Tullis, S.; Ziada, S. Performance Testing of a Small Vertical-Axis Wind Turbine Performance Testing of a Small Vertical-Axis Wind Turbine. In Proceedings of the 21st Canadian Congress of Applied Mechanics, Toronto, Canada, 3–7 June 2007; pp. 1–3. [Google Scholar]
- Kjellin, J.; Bülow, F.; Eriksson, S.; Deglaire, P.; Leijon, M.; Bernhoff, H. Power Coefficient Measurement on a 12 KW Straight Bladed Vertical Axis Wind Turbine. In Renewable Energy; Elsevier: Amsterdam, The Netherlands, 2011; Volume 36, pp. 3050–3053. [Google Scholar] [CrossRef]
- Molina, A.C.; Bartoli, G.; de Troyer, T. Wind Tunnel Testing of Small Wind Turbines in Turbulent Flows Wind Tunnel Testing of Small Vertical-Axis Wind Turbines in Turbulent Flows. Procedia Eng. 2017, 199, 3176–3181. [Google Scholar] [CrossRef]
- Guo, J.; Zeng, P.; Lei, L. Performance of a Straight-Bladed Vertical Axis Wind Turbine with Inclined Pitch Axes by Wind Tunnel Experiments. Energy 2019, 174, 553–561. [Google Scholar] [CrossRef]
- Lassig, J.; Sosa, J.V.; Jara, U. Wind Tunnel Testing of a Small Wind Turbine Darrieus-H, with Asymmetric Airfoil, for Auto Start. IOSR J. Mech. Civ. Eng. 2016, 13, 63–69. [Google Scholar] [CrossRef]
- Castelli, M.R.; Englaro, A.; Benini, E. The Darrieus Wind Turbine: Proposal for a New Performance Prediction Model Based on CFD. Energy 2011, 36, 4919–4934. [Google Scholar] [CrossRef]
- Mclaren, K.; Tullis, S.; Ziada, S. Computational Fluid Dynamics Simulation of the Aerodynamics of a High Solidity, Small-Scale Vertical Axis Wind Turbine. Wind Energy 2012, 15, 349–361. [Google Scholar] [CrossRef]
- Mohamed, M.H.; Dessoky, A.; Alqurashi, F. Blade Shape Effect on the Behavior of the H-Rotor Darrieus Wind Turbine: Performance Investigation and Force Analysis. Energy 2019, 179, 1217–1234. [Google Scholar] [CrossRef]
- Franchina, N.; Persico, G.; Savini, M. 2D–3D Computations of a Vertical Axis Wind Turbine Flow Field: Modeling Issues and Physical Interpretations. Renew. Energy 2019, 136, 1170–1189. [Google Scholar] [CrossRef]
- Rezaeiha, A.; Kalkman, I.; Blocken, B. Effect of Pitch Angle on Power Performance and Aerodynamics of a Vertical Axis Wind Turbine. Appl. Energy 2017, 197, 132–150. [Google Scholar] [CrossRef]
- Parra-Santos, T.; Uzarraga, C.N.; Regidor-Sanchez, M.; Gallegos, A.; Castro, F. Influence of Fixed Pitch Angle on the Performance of Small Scale H-Darrieus. In Proceedings of the ASME 2016 Fluids Engineering Division Summer Meeting, Washington, DC, USA, 10–14 July 2016; pp. 1–5. [Google Scholar] [CrossRef]
- Ismail, F.; Vijayaraghavan, K. The Effects of Aerofoil Profile Modification on a Vertical Axis Wind Turbine Performance. Energy 2015, 80, 20–31. [Google Scholar] [CrossRef]
- Zhu, H.; Hao, W.; Li, C.; Ding, Q. Journal of Wind Engineering & Industrial Aerodynamics Numerical Study of Effect of Solidity on Vertical Axis Wind Turbine with Gurney Fl Ap. J. Wind Eng. Ind. Aerodyn. 2019, 186, 17–31. [Google Scholar] [CrossRef]
- Rezaeiha, A.; Montazeri, H.; Blocken, B. Towards Optimal Aerodynamic Design of Vertical Axis Wind Turbines: Impact of Solidity and Number of Blades. Energy 2018, 165, 1129–1148. [Google Scholar] [CrossRef]
- Rezaeiha, A.; Montazeri, H.; Blocken, B. On the accuracy of turbulence models for CFD simulations of vertical axis wind turbines. Energy 2019, 180, 838–857. [Google Scholar] [CrossRef]
- Akansu, S.O.; Dagdevir, T.; Kahraman, N. Numerical Investigation of the Effect of Blade Airfoils on a Vertical Axis Wind Turbine. J. Therm. Sci. Technol. 2017, 37, 115–125. [Google Scholar]
- Chandramouli, S.; Premsai, T.P.; Prithviraj, P.; Mugundhan, V.; Velamati, R.K. Numerical Analysis of Effect of Pitch Angle on a Small Scale Vertical Axis Wind Turbine. Int. J. Renew. Energy Res. 2014, 4, 929–935. [Google Scholar]
- Dyachuk, E. Aerodynamics of Vertical Axis Wind Turbines. Development of Simulation Tools and Experiments. Ph.D. Thesis, Uppsala University, Uppsala, Sweden, 2015. [Google Scholar]
- Ansys. ANSYS Meshing User’s Guide; Ansys: Cannonsburg, PA, USA, 2013; Volume 15317, pp. 724–746. [Google Scholar]
Figure 1.
Velocity and force vectors acting on a VAWT blade.

Figure 2.
Dimensions and boundary conditions of the calculation domain.

Figure 3.
Dimensions of the rotating domain.

Figure 4.
Rotating domain (a), control circle (b), and airfoil grids (c).

Figure 5.
Comparison of power coefficient value variation with TSR for experimental and numerical studies [11] and the present study.
Figure 5.
Comparison of power coefficient value variation with TSR for experimental and numerical studies [11] and the present study.

Figure 6.
Comparison of power coefficient value variation for TSR for plane airfoil and single dimpled airfoil without pitch angle.
Figure 6.
Comparison of power coefficient value variation for TSR for plane airfoil and single dimpled airfoil without pitch angle.

Figure 7.
Variation of power coefficient values with TSR for pitch angles in the range of δ = 3° to +3°.
Figure 7.
Variation of power coefficient values with TSR for pitch angles in the range of δ = 3° to +3°.

Figure 8.
Moment coefficient change with the azimuthal angle of the rotor for airfoils SD-0 and SD+1 at TSR = 2.5 (a), TSR = 2.7 (b), TSR = 3 (c), and TSR = 3.5 (d).
Figure 8.
Moment coefficient change with the azimuthal angle of the rotor for airfoils SD-0 and SD+1 at TSR = 2.5 (a), TSR = 2.7 (b), TSR = 3 (c), and TSR = 3.5 (d).

Figure 9.
Polar diagrams of variation of moment coefficient with the azimuthal angle for airfoils SD-0 and SD+1 at TSR = 2.5 (a), TSR = 2.7 (b), TSR = 3 (c), and TSR = 3.5 (d).
Figure 9.
Polar diagrams of variation of moment coefficient with the azimuthal angle for airfoils SD-0 and SD+1 at TSR = 2.5 (a), TSR = 2.7 (b), TSR = 3 (c), and TSR = 3.5 (d).


Figure 10.
Vorticity formation of SD-0 and SD+1 airfoils at TSR = 2.7 with 90° intervals: 0° (a), 90° (b), 180° (c), and 270° (d).
Figure 10.
Vorticity formation of SD-0 and SD+1 airfoils at TSR = 2.7 with 90° intervals: 0° (a), 90° (b), 180° (c), and 270° (d).

Figure 11.
Power coefficient variation with TSR for SD-0 and DD airfoils.

Figure 12.
Moment coefficient changes of SD-0 and DD airfoils with the azimuthal position of the rotor (a) and polar diagram (b) at TSR = 2.7.
Figure 12.
Moment coefficient changes of SD-0 and DD airfoils with the azimuthal position of the rotor (a) and polar diagram (b) at TSR = 2.7.


Table 1.
Turbine characteristics.
| Blade Number | 3 |
| Blade Profile | NACA 0021 |
| Chord Length (m) | 0.0858 |
| Rotor Diameter (m) | 1.03 |
| Rotor Height (m) | 1.46 |
Table 2.
Dimpled airfoil details.
| Airfoil Section | Description | ||
|---|---|---|---|
| Dimple Position | Dimple Diameter | Code | |
 | 0.25 chord length | 0.08 chord length | SD (Single Dimple) |
 | 0.25 chord length | 0.08 chord length | DD (Double Dimple) |
Table 3.
Definition of airfoils used in the study.
| Acronym | Definition |
|---|---|
| SD+3 | Single Dimple with +3° Pitch Angle |
| SD+2 | Single Dimple with +2° Pitch Angle |
| SD+1 | Single Dimple with +1° Pitch Angle |
| SD-0 | Single Dimple with 0° Pitch Angle |
| SD-1 | Single Dimple with −1° Pitch Angle |
| SD-2 | Single Dimple with −2° Pitch Angle |
| SD-3 | Single Dimple with −3° Pitch Angle |
| DD | Double Dimple with 0° Pitch Angle |
Table 4.
Moment coefficient values for different grid sizes.
| Grid Size | Cm |
|---|---|
| 158,234 elements | 0.2380 |
| 301,936 elements | 0.2024 |
| 629,840 elements | 0.1881 |
| 1,258,870 elements | 0.1880 |
Disclaimer/Publisher’s Note: The statements, opinions and data contained in all publications are solely those of the individual author(s) and contributor(s) and not of MDPI and/or the editor(s). MDPI and/or the editor(s) disclaim responsibility for any injury to people or property resulting from any ideas, methods, instructions or products referred to in the content. |
© 2024 by the author. Licensee MDPI, Basel, Switzerland. This article is an open access article distributed under the terms and conditions of the Creative Commons Attribution (CC BY) license (https://creativecommons.org/licenses/by/4.0/).
Share and Cite
MDPI and ACS Style
Korukçu, M.Ö. Impact of Blade Modifications on the Performance of a Darrieus Wind Turbine. Processes 2024, 12, 732. https://doi.org/10.3390/pr12040732
AMA Style
Korukçu MÖ. Impact of Blade Modifications on the Performance of a Darrieus Wind Turbine. Processes. 2024; 12(4):732. https://doi.org/10.3390/pr12040732
Chicago/Turabian StyleKorukçu, M. Özgün. 2024. "Impact of Blade Modifications on the Performance of a Darrieus Wind Turbine" Processes 12, no. 4: 732. https://doi.org/10.3390/pr12040732
Note that from the first issue of 2016, this journal uses article numbers instead of page numbers. See further details here.