Article

Automatic Control of Nucleation and Crystal Growth Using Online Raman Analyzer

1
School of Life & Environmental Sciences, Guilin University of Electronic Technology, Guilin 541004, China
2
Engineering Comprehensive Training Center, Guilin University of Aerospace Technology, Guilin 541004, China
3
Subphotonic (Shenzhen) Technologies Co., Ltd., Nanning 530000, China
4
Guangxi Kelun Pharmaceutical Co., Ltd., Guilin 541004, China
*
Author to whom correspondence should be addressed.
Processes 2024, 12(4), 774; https://doi.org/10.3390/pr12040774
Submission received: 1 March 2024 / Revised: 5 April 2024 / Accepted: 9 April 2024 / Published: 12 April 2024
(This article belongs to the Section Automation Control Systems)

Abstract

:
The accurate determination of crystal formation during crystallization is crucial for obtaining crystal products with consistent quality and quantity. In this study, we aimed to identify the feasibility of using Raman spectroscopy to monitor the crystal growth stage in the crystallization process using cephalosporin intermediate 7-ACT as an example molecule. By observing the changes in the characteristic peak of the 7-ACT crystal (504 cm−1) and the characteristic peak of the solvent acetonitrile (914 cm−1), a correlation between the crystal growth stage and the change in the Raman intensity of the crystal solution was discovered. The determination of the optimal starting time for the crystal growth stage through a Raman analyzer significantly improves the consistency of crystal product quality. This led to a fivefold reduction in the variation in the weight and water content of the final 7-ACT crystal products compared to those obtained via manual control. In addition, our experiments also indicated that Raman monitoring could be more efficient at enabling the chemical synthesis reaction to be completed compared to manual control. Thus, our work demonstrates the potential of Raman spectroscopy in the real-time control of chemical synthesis reactions and crystallization processes.

1. Introduction

Crystallization occurs in two major steps: nucleation and crystal growth. The former is the appearance of a crystalline phase from a supersaturated solvent, while the latter is an increase in the size of particles and leads to a crystal state. An important feature of this step is that loose particles form layers at the crystal’s surface [1,2]. Supersaturation is one of the driving forces of crystallization, which is usually controlled by changing the supersaturation of a solution by adjusting the temperature and pH or adding antisolvents, causing solutes to separate from the solvent in crystal form. In pharmaceutical and chemical production, crystallization is widely used for the separation and purification of target products, playing a key role in controlling product quality by directly affecting purity, moisture content, and yield [3,4,5]. To ensure the consistency of crystal quality and quantity, crystallization processes are required to be well controlled, and antisolvent addition is a common method to initiate nucleation in the pharmaceutical and chemical industries [6,7]. In the nucleation step, a few molecules come together by chance and happen to be arranged in a crystalline grain. These small grain particles are unstable because most molecules are near the surface and do not have the correct number of neighbors, but large enough particles are more stable. According to the Ostwald ripening theory, small particles will dissolve and redeposit onto larger particles. Therefore, in the final stage of crystallization, continuing to culture for a period of time can result in more uniform crystal sizes [8,9].
During the crystallization process, it is crucial to control the supersaturation of the solution to prevent the generation of a large number of crystal nuclei due to excessive supersaturation, thereby ultimately producing many fine crystals. The nucleation stage is the initial step in crystal formation: when solute molecules aggregate into stable, tiny clusters [10]. Once stable crystal nuclei are formed, the growth phase begins, where these nuclei begin to absorb more molecules and develop into larger crystals. Crystal growth is a critical step in the crystallization process, typically occurring after nucleation. This stage can proceed either by adding seed crystals or through the natural formation in a supersaturated solution [11,12,13]. The regulation of crystal growth and properties during crystallization can be achieved through a variety of methods, including the precise control of temperature, temperature oscillations, solvent volatilization, and evaporation–recrystallization techniques [14,15]. In addition, the addition of specific additives, the adjustment of the pH of the solution, the use of mechanical stirring, and the careful design of the cooling rate are all important means of regulation [16,17,18,19]. The inoculation of crystals is also commonly used to promote uniform growth. These techniques, alone or in combination, are effective in controlling the formation, size, shape, and purity of crystals. Currently, in the industrial production process of 7-ACT, the pH value of the solution is changed to a supersaturated state by adding ammonia water to crystallize crystals. Once the crystals nucleate spontaneously, the crystal growth stage is started by stopping the addition of ammonia. However, the initiation of the crystal growth stage mainly relies on the operator’s manual judgment from observing changes in solution turbidity. This method is imprecise, time-consuming, and extremely dependent on the operator’s experience and judgment, which may result in unstable crystal quality. Therefore, it becomes particularly important to develop an automated control process based on the real-time measurement data of crystal properties. This not only improves the quality, consistency, and reliability of crystal production but also reduces reliance on manual operations.
In recent years, various methods have been developed to monitor the crystallization process in real time. Solid–liquid phase transitions can be analyzed using Fourier transform infrared spectroscopy (FTIR) [20,21,22], near-infrared spectroscopy (NIR) [23,24], and Raman spectroscopy [25]. Additionally, focused beam reflectance measurement (FBRM) [26,27], particle vision and measurement (PVM) [28,29], and ultrasonic spectroscopy (US) [30] have been utilized to qualitatively or quantitatively determine crystal properties such as size distribution, external shape, and morphology during crystallization. Ref [31] analyzed batch crystallization using FBRM technology and optimized cooling and seeding conditions. Raman spectroscopy, characterized by its fingerprint spectral features, is attracting more attention. It is a type of inelastic scattering spectroscopy that analyzes molecular composition and structure through frequency shifts caused by incident light, and no sample preparation is required, thus leading to rapid measurements. Raman spectroscopy, with its sharp and selective vibrational bands, is particularly adept at distinguishing changes in the content of substances and crystal structure within the crystalline process system and has been applied to the continuous monitoring of carbamazepine crystallization [32,33]. Hajnalka Pataki [34] used Raman spectroscopy to monitor carbamazepine crystallization by normalizing the spectra to the unit area to eliminate intensity deviations caused by changes in the crystallization medium. These monitoring techniques can estimate the impact of experimental conditions on final product quality, including the choice of solvent or antisolvent, temperature, cooling rate, selection of seed crystals, and pH values [15,35,36,37,38].
Crystal growth involves the growth of crystal grains and a reduction in the solute concentration, which leads to rapid variations in the Raman spectrum of the solution. Thus, Raman spectroscopy can also be applied to monitor the crystal growth stage, which is the focus of this study. Our study investigates the feasibility of Raman spectroscopy to monitor the chemical synthesis of a target product using 7-Amino Ceftriaxone Sodium (7-ACT) as an example, with its crystallization process including nucleation and crystal growth.
7-ACT is an intermediate to produce the β-lactam antibiotic Ceftriaxone Sodium, which is a preferred choice for treating various bacterial infections by inhibiting the synthesis of the walls of bacterial cells [39]. The most common synthetic route for Ceftriaxone Sodium starts with 7-Aminocephalosporanic acid (7-ACA) as the raw material. It first undergoes condensation with thiotriazinone at the C-3 position to form 7-Amino Ceftriaxone Sodium (7-ACT), followed by acylation with (2-Aminothiazole-4-yl) acetic acid at the C-7 position [40]. 7-ACT is crucial in the production process of Ceftriaxone Sodium, and its specific synthesis process involves the reaction of 7-ACA with thiotriazinone in an acetonitrile solvent system, catalyzed by a boron trifluoride acetonitrile complex. After the synthesis of 7-ACT molecules, the crystallization process is used to purify and separate 7-ACT from the solution. First, purified water is added to the solution, and the reaction solution is diluted. Then, the pH of the solution is adjusted by adding an ammonia solution to the solution to supersaturate it and crystallize 7-ACT. Currently, in the 7-ACT production process, determining the start time of the crystal growth stage mainly relies on manual experience, i.e., by observing the turbidity and color changes in the reaction solution, which results in the poor quality and variable quantity of 7-ACT crystal products.
This study explores how an online Raman analyzer was used to monitor and control the synthesis and crystallization of 7-ACT by referring to the manual control of the start and end times of the crystal growth stage. By observing changes in the characteristic peaks of solid crystals and the Raman peaks of the solvent acetonitrile, we identified a correlation between the status of the crystal growth stage and intensity changes in the Raman spectrum of the crystals and solvent. Meanwhile, the Raman scattering technique was also demonstrated to be an ideal tool for monitoring the chemical reaction process, which enables time to be saved when finishing a chemical reaction.

2. Materials and Methods

2.1. Main Reagents

The materials used in this study were all provided by Kelun Pharmaceutical Co., Ltd. (Guangxi, China), and included 7-Aminocephalosporanic acid (7-ACA), thiotriazinone (TTZ), ethylenediaminetetraacetic acid disodium salt (EDTA-2Na), boron trifluoride acetonitrile complex (BF3-CH3CN, solid), acetonitrile solution (99%), ammonia solution (concentration of 11%), and purified water (Type III Water, MΩ.cm ≥ 18).

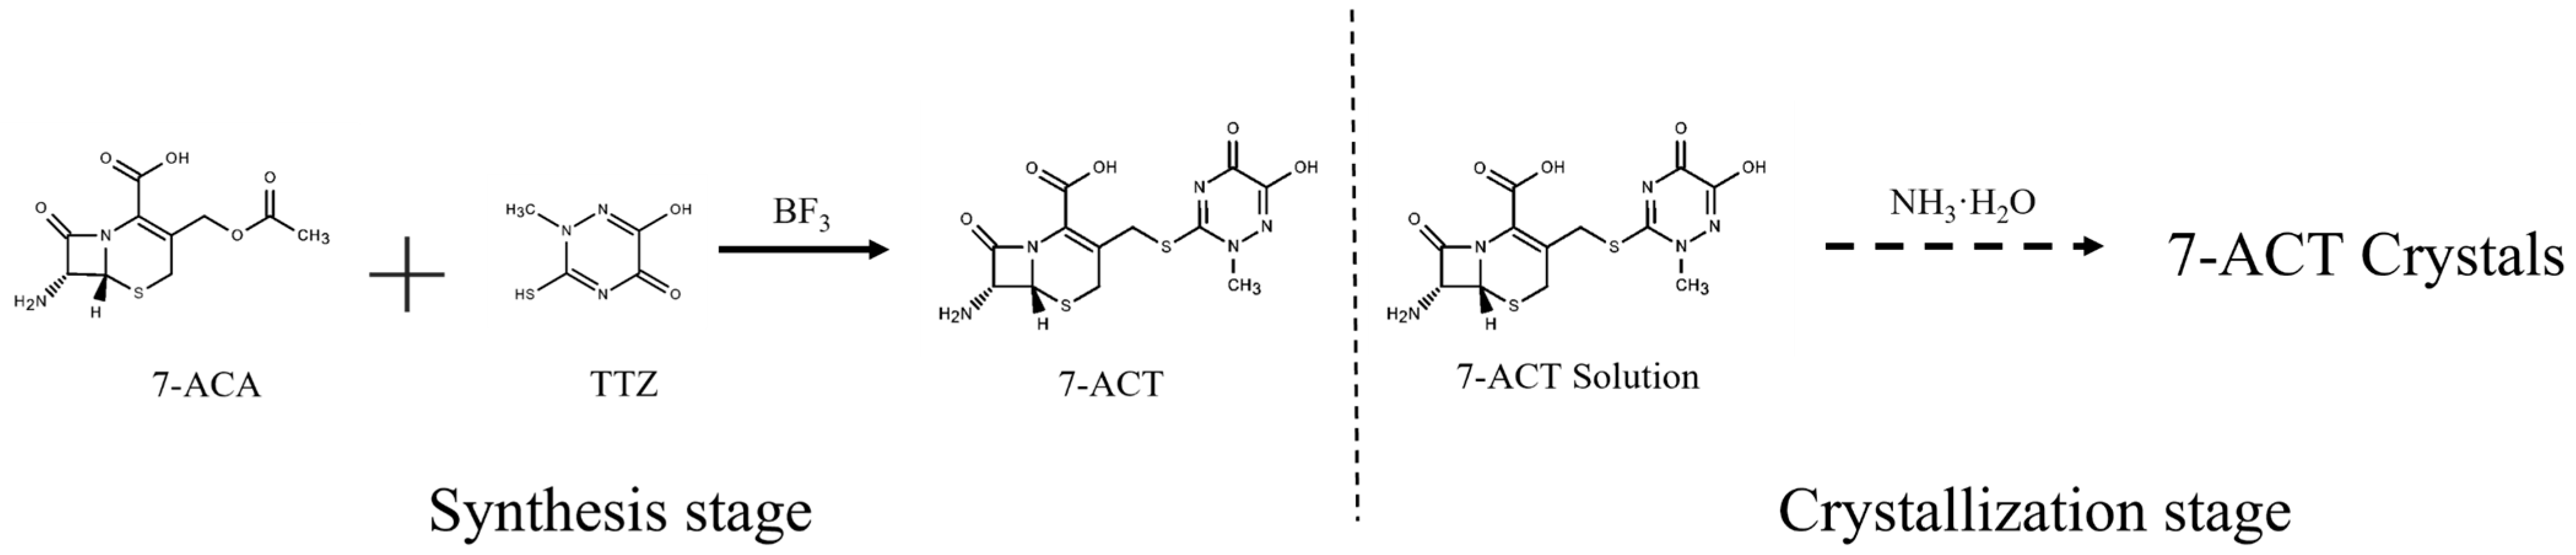
2.2. Synthesis and Crystallization of 7-ACT

As shown in Figure 1, 7-ACT was initially synthesized through a condensation reaction between 7-ACA and Thiotriazinone (TTZ) in an acetonitrile solvent, with BF3 chosen as the catalyst to facilitate the SN2 reaction at the C-3 position of 7-ACA, thereby enhancing reaction efficiency. The synthesized 7-ACT molecule contains both amino and carboxyl groups. When the solution’s pH approaches its isoelectric point, the internal amino and carboxyl groups tend to become electrically neutral, reducing the solubility of 7-ACT molecules. After the synthesis in the previous stage, the pH of the 7-ACT solution is below 0.01. We conducted solubility measurements for 7-ACT across various temperatures and pH levels, with the findings presented in Figures S2 and S3 of the Supplementary Materials. These results indicate that 7-ACT’s solubility is minimal between pH 3 and 4, exhibiting a decrease as the pH increases. Furthermore, solubility is reduced under conditions of low temperature [41]. A current can be gradually added to the solution to increase the pH of the solution and change the supersaturation of the solution to crystallize 7-ACT. The first addition of ammonia solution was paused to prevent the solution from becoming too supersaturated, which could lead to nuclei bursting, resulting in the formation of a large number of fine crystals. The period without the addition of ammonia solution is referred to as the crystal growth stage. The second crystal growth stage phase was aimed at crystal aging, to render the crystal structure more stable and uniform.
The specific operation steps are as follows:
(1)
7-ACT synthesis operation
In a 500 mL flask, 160 mL of acetonitrile was added, and the mixture was maintained at 30 °C with a stirring speed of 120 r/min. Then, 0.08 g of EDTA-2Na was added first, followed by 16 g of 7-ACA, 9.4 g of thiotriazinone, and finally, 24.4 g of boron trifluoride acetonitrile complex, ensuring each component was well mixed before proceeding to the next addition. After all substances were added, the mixture’s stirring was maintained at the set speed and temperature for 30 min to react. Upon the completion of the reaction, a solution of 7-ACT was obtained.
(2)
7-ACT crystallization operation
The 7-ACT solution synthesized in the previous step was transferred into a crystallization reactor, and 100 mL of purified water was added. In general, the solubility of the molecules reduces when their environmental temperature is lower (Figure S3). Therefore, the solution was cooled with an ice–ethanol bath to a temperature of 3 °C, and the stirring speed was set to 160 r/min. At this moment, no crystals had formed. Next, we began to add an ammonia solution (concentration 11%) to the 7-ACT solution at a flow rate of 0.15 mL/min until the color of the 7-ACT solution changed from its transparent state to milky white due to nucleation. At this time, we stopped dropping ammonia, set the stirring speed to 120 r/min, and started the first crystal growth stage. Please note that in our first 6 batches of experiments, the time to stop adding ammonia solution was manually controlled by experienced technicians through visual observation. After 20 min, in order to crystallize more crystals, we continued to add ammonia solution to the mixture until the pH value of the solution reached 3.8 (taking about one hour with a flow rate of 0.15 mL/min) and then started the second stage of crystal growth stage for 30 min.
Finally, we transferred the crystal suspension into a Buchner funnel and proceeded with vacuum filtration. After the filtration was complete, we washed the 7-ACT crystals sequentially with 120 mL of ethanol followed by 120 mL of purified water. The washing operation involved slowly pouring the wash solutions from above into a funnel containing 7-ACT, with the bottom end of the funnel connected to a vacuum filter to expedite the washing process through suction. This step aimed to rinse off impurities, such as organic solvents, mixed with the 7-ACT solids. After washing, we removed the wet 7-ACT powder, weighed it, measured the moisture content using a Karl Fischer titrator, and analyzed the crystal purity via liquid chromatography.

2.3. HPLC Analysis

The purity of the crystals was analyzed using HPLC. The mobile phase consisted of 2.0 g of tetrahexylammonium bromide and 2.0 g of tetrabutylammonium bromide dissolved in 450 mL of acetonitrile. Then, 55 mL of pH 7.0 phosphate-buffered solution and 5 mL of pH 5.0 citrate buffer solution were added to this solution. Water was added to dilute the solution to 1000 mL, which was then membrane-filtered with a 0.45 μm filter and degassed. The flow rate was set at 1.0 mL/min. A 4.6 × 150 mm C18 chromatographic column with 5 μm particles was used. Detection was carried out using a UV absorbance detector at a wavelength of 254 nm. Each injection volume was 20 μL, and the purity of 7-ACT was calculated using the peak area normalization method. Each crystal sample was divided into three equal parts which were measured separately, and their average value was the purity of each crystal sample.

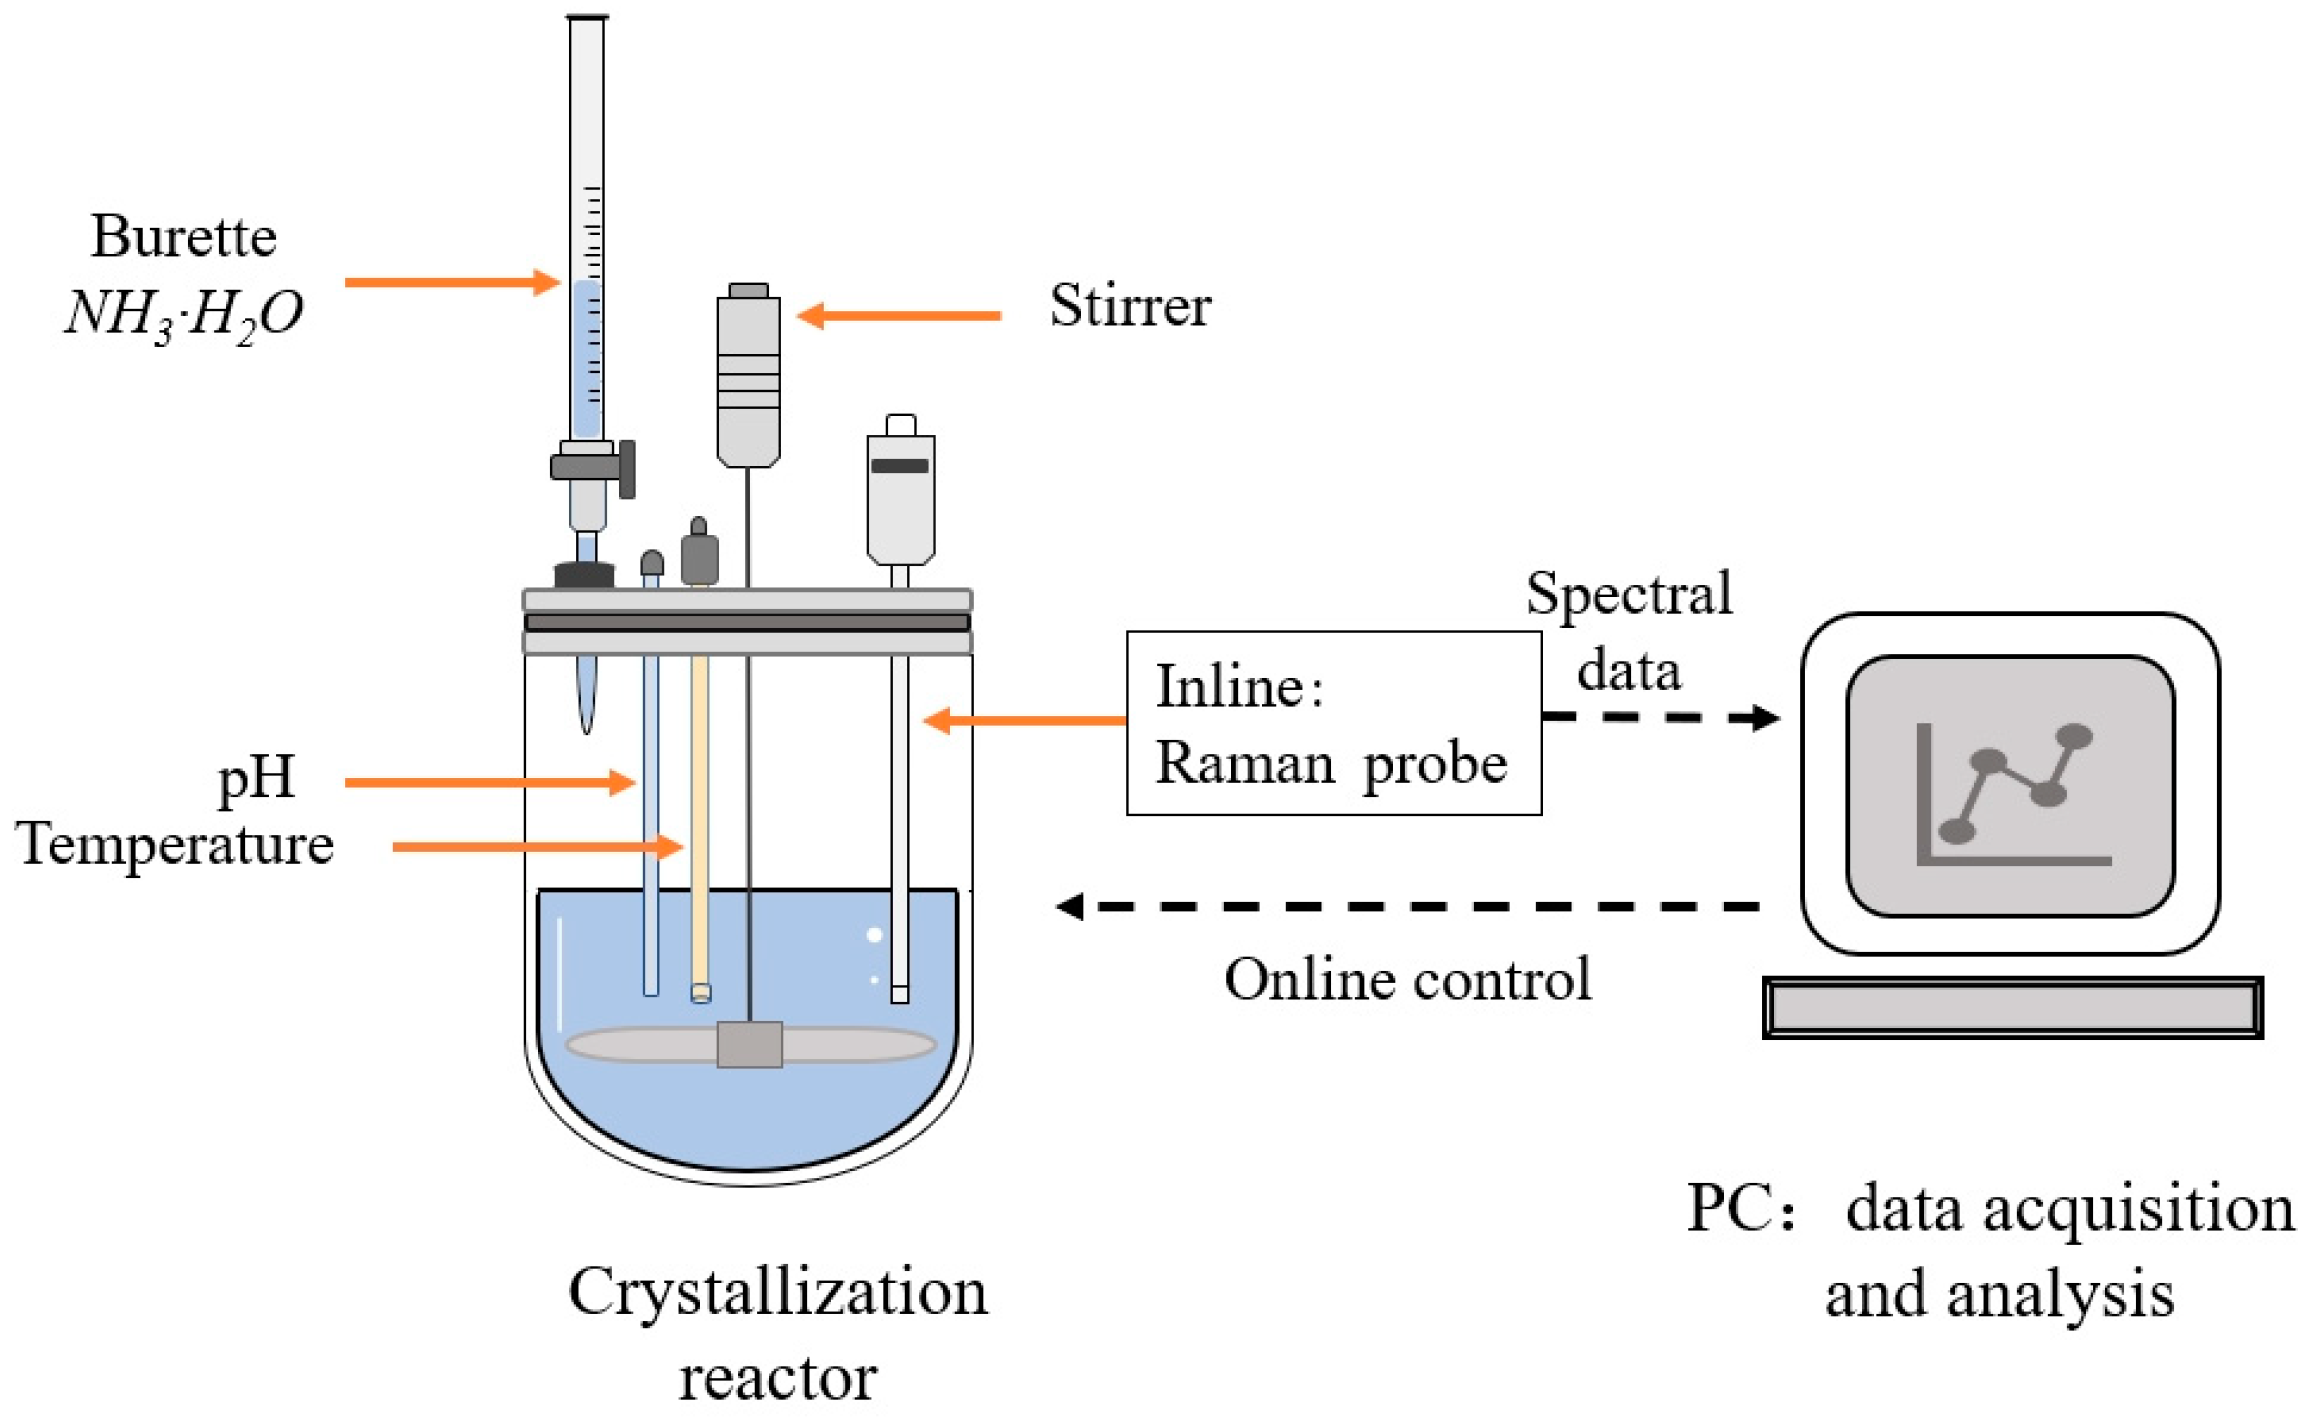
2.4. Online Monitoring with Raman Analyzer

The Raman biochemical analyzer was provided by SubPhotonics (Shenzhen, China) Technology Co., Ltd., and it was equipped with a 785 nm wavelength laser light with an output power of 300 mW to excite samples. Its Raman probe was directly inserted into the reaction solution in the reactor (Figure 2). During the reaction process, real-time Raman spectral signals of the reaction solution were collected with an integration time of 5 s and a sampling interval of 6 s. Due to the light-yellow color of the reaction solution, the Raman spectrum contained background fluorescence, and also interference from cosmic rays [42]. The collected Raman spectra were treated using the SubRaman3.0 software from SubPhotonic Technologies Co., Ltd. (Shenzhen, China) to eliminate interference from cosmic rays and background fluorescence, and were then normalized at the Raman peak of the acetonitrile solvent. Real-time intensity changes in the Raman characteristic peaks of all the chemicals in the solution were monitored through a laptop computer.

3. Results

The Raman monitoring of the mixed solution began at the start of 7-ACT synthesis. As the synthesis reaction progressed into the crystallization stage, the solution gradually became turbid. The presence of crystal particles caused laser scattering and absorption, leading to a reduction in laser intensity reaching the crystals and the attenuation of Raman light emitted from the crystals, thereby reducing the efficiency of Raman spectral signal collection [43]. Therefore, monitoring a solvent with a relatively constant concentration in the solution through the whole reaction and crystallization stages can be used as an internal standard to reveal and correct the interference of solution turbidity on Raman signals. In our study, the Raman signal intensity of acetonitrile in the collected Raman spectra was also affected by scattering from crystal particles and the dilution effect of adding ammonia solution, but the amount of acetonitrile in the system remained constant regardless of the reaction’s progress. Therefore, during the crystallization process, the Raman peak of acetonitrile can be used as an internal standard for normalization to eliminate interference from turbidity caused by crystallization. By observing the intensity changes in the acetonitrile peak and the 7-ACT characteristic peak, the optimal crystallization initiation time can be determined.

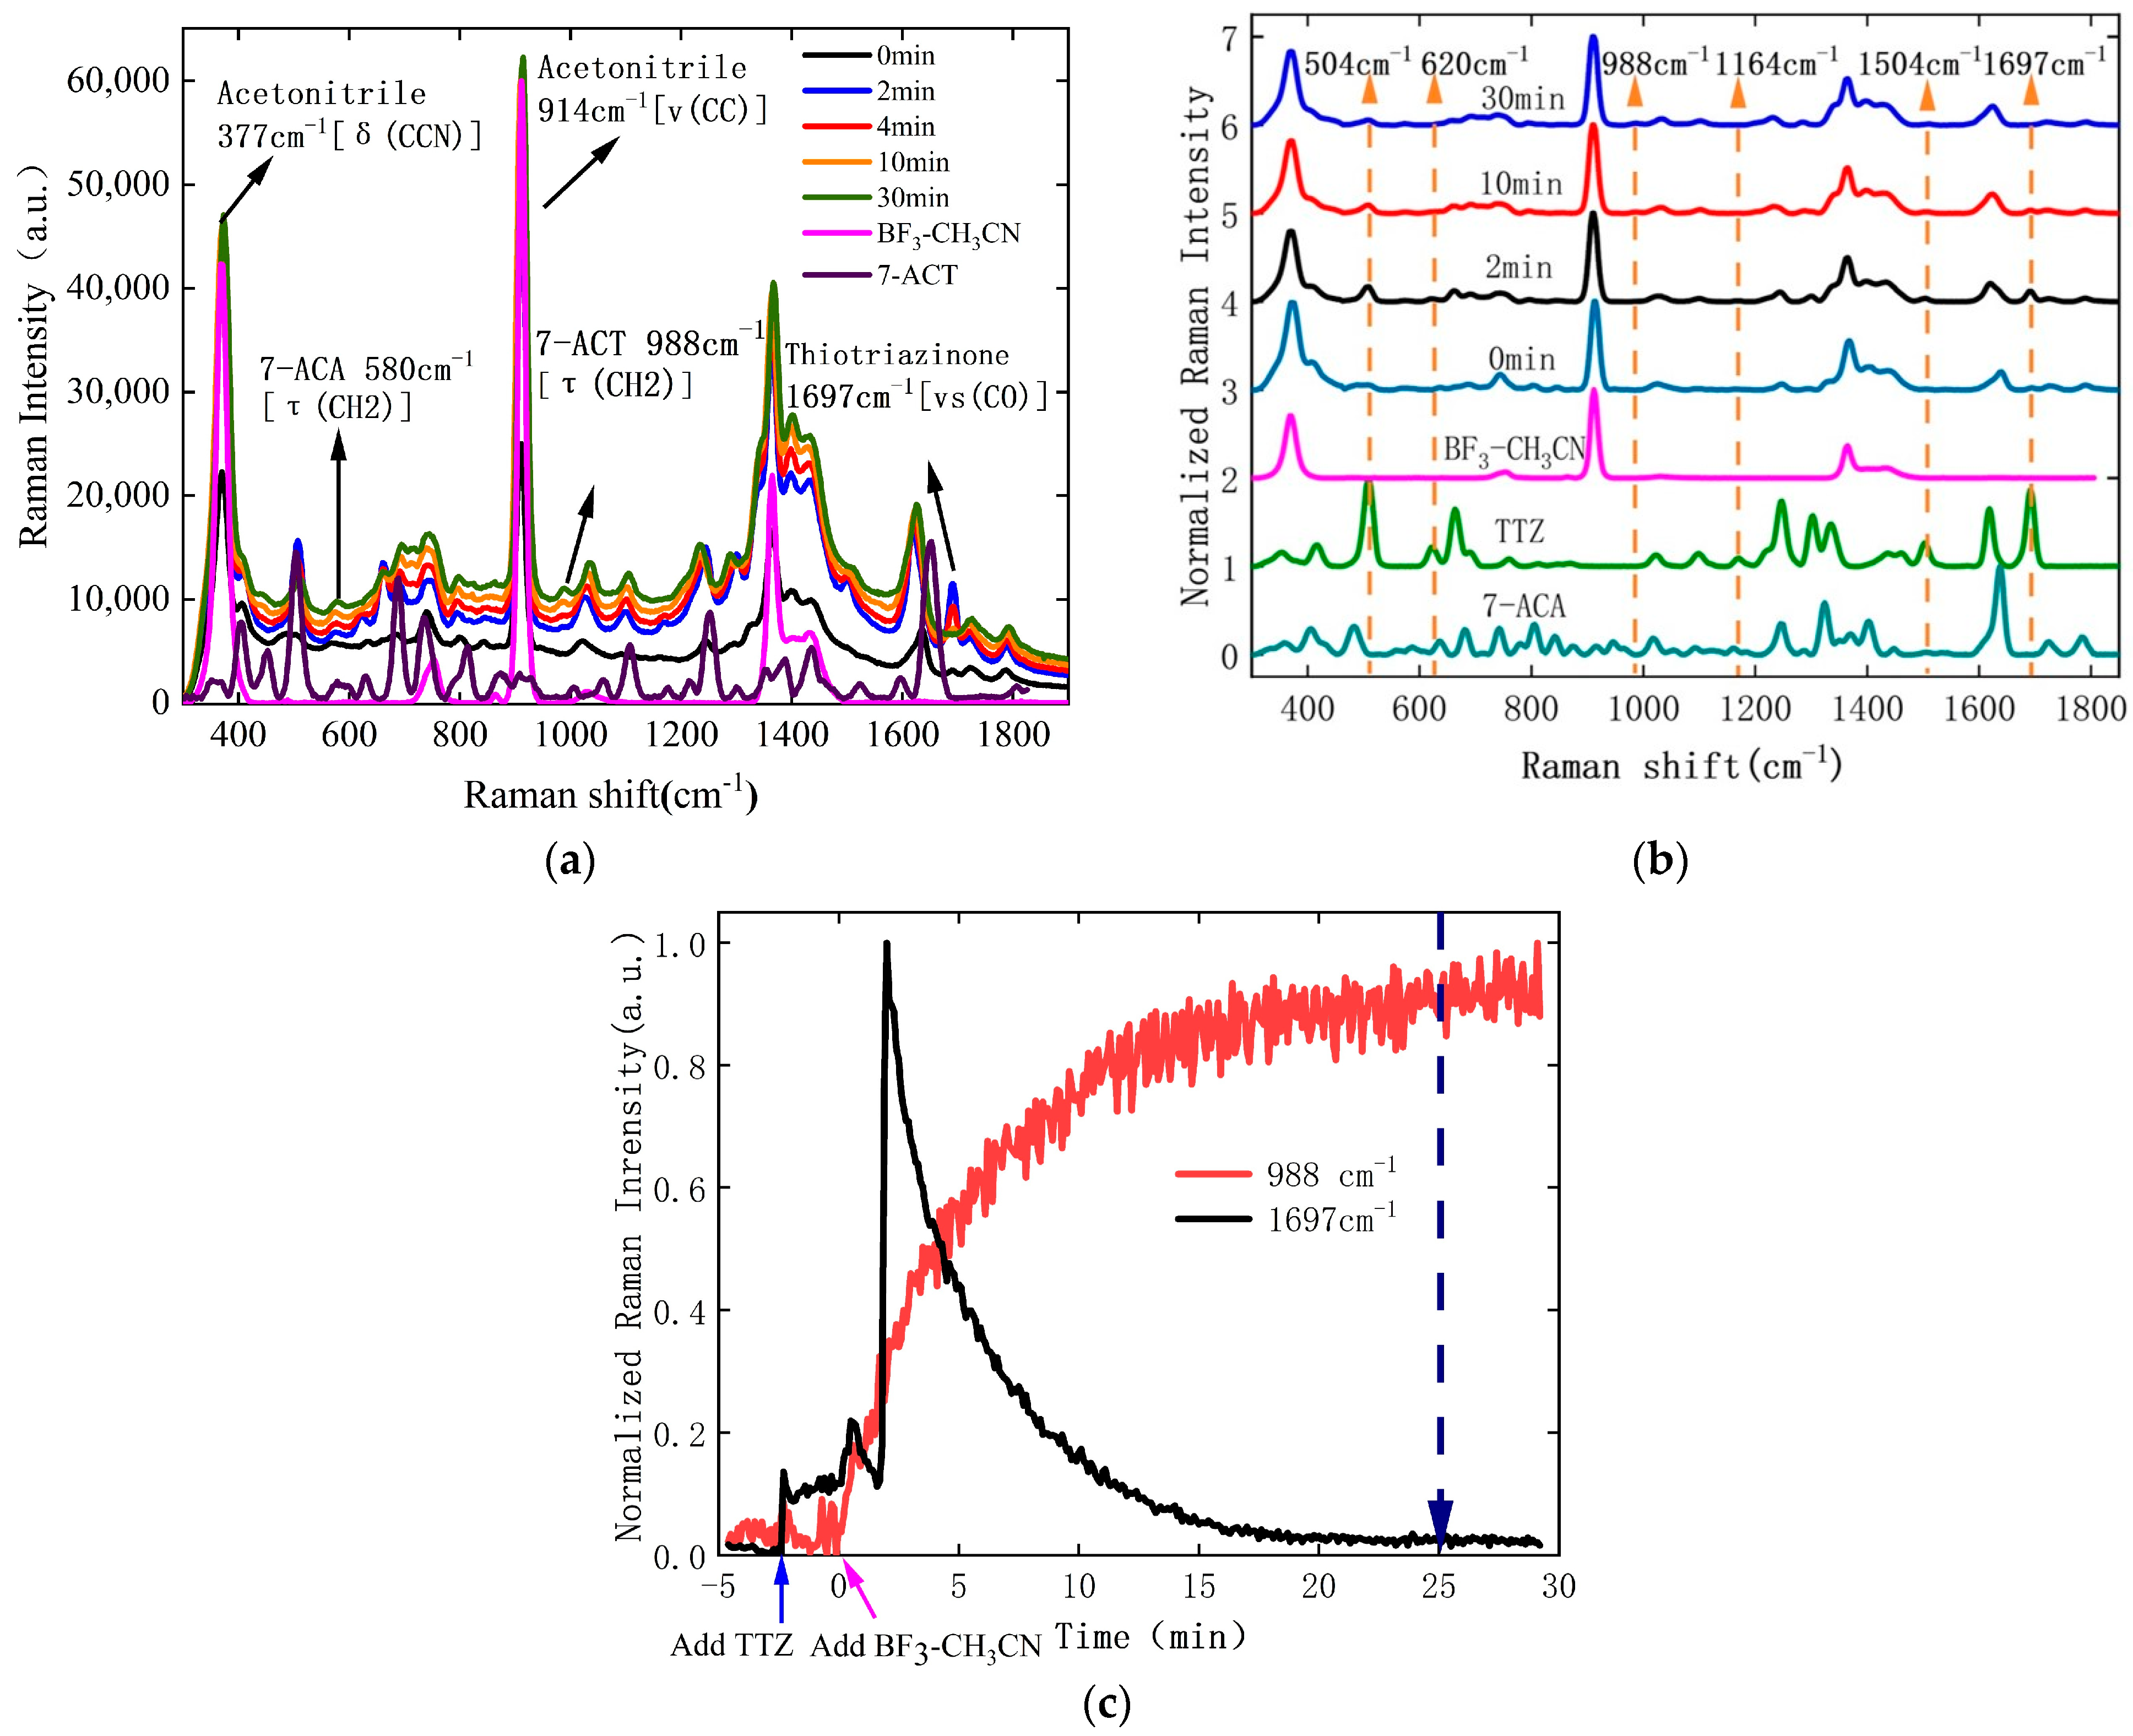
3.1. Monitoring of 7-ACT Synthesis Reaction

Raman spectra corresponding to the synthesis process of 7-ACT are shown in Figure 3a. It can be observed that, before the catalyst boron trifluoride acetonitrile complex was added into the solution, the intensity of the initial Raman signals of the solution shown as the black curve in Figure 3a was lower due to the strong scattering of solid 7-ACA and thiotriazinone particles in the acetonitrile solution because their solubility is very low. After the catalyst was added, the solution became acidic, the solid powders dissolved rapidly, and the condensation reaction began, causing the solution to gradually shift from turbid to clear. This led to the Raman signal strength of acetonitrile in the solution reaching its maximum, as shown by the blue curve in Figure 3a. As the reaction progressed, the color of the solution gradually changed from a light yellow to a bright golden yellow, with a slight increase in the fluorescent background of the Raman spectrum. By comparing the Raman peaks of pure BF3-acetonitrile solution to those of other Raman spectra collected at different times, it can be observed that the Raman peaks of the substances other than BF3-acetonitrile exhibited various degrees of intensity changes throughout the reaction process. The changes in these peak values reflect how the substances in the reaction fluid are transforming. From the curve at the 30 min mark in Figure 3a, the emergence of the 7-ACT peak (988 cm−1) and the decrease in intensity of the thiotriazinone peak (1697 cm−1) can be clearly observed.
For easier observation, the baseline and background fluorescence of the spectra were removed; then, the spectra were normalized using the characteristic peak of acetonitrile at 914 cm−1 [ν (CC)]. Some of the final results corresponding to reaction times of 0 min, 2 min, 10 min, and 30 min are shown in Figure 3b. In addition, the normalized Raman spectra of the thiotriazinone molecule, BF3-acetonitrile, and 7-ACA are also displayed for comparison.
It can be seen that at 0 min, the Raman spectrum contains characteristic signals from 7-ACA, thiotriazinone, and acetonitrile, but they are very weak due to the strong turbidity of the solution. After the addition of the BF3-acetonitrile complex catalyst, significant changes occurred in the solution’s Raman spectra. It can be observed that the Raman peaks at 504 cm−1, 620 cm−1, 1164 cm−1, 1504 cm−1, and 1697 cm−1 are mainly attributed to thiotriazinone molecules, and their intensities gradually decreased with time due to the continuous consumption of the thiotriazinone molecules.
Figure 3c illustrates the change in peak intensity at 1697 cm−1 [νs(CO)] for thiotriazinone and at 988 cm−1 [τ(CH2)] for 7-ACT (Figure 3a) as a function of the reaction time. It is clearer now that following the addition of BF3-CH3CN and the solution becoming clear, the peak intensity of thiotriazinone at 1697 cm−1 sharply increased within the first two minutes. As the synthesis reaction progressed, the thiotriazinone was continuously consumed, causing the intensity of the peak at 1697 cm−1 to gradually decrease to 0, indicating the complete consumption of the thiotriazinone. Moreover, the intensity of the peak at 988 cm−1 gradually increased and ultimately saturated, signifying that the production of the synthesized product 7-ACT ceased with the complete consumption of the thiotriazinone. Hence, Raman spectroscopy can be utilized to monitor the synthesis process of 7-ACT.
It can also be observed that after 25 min of reaction time, the intensity of the peak at 988 cm−1 almost started to saturate, indicating that the reaction was completed 5 min earlier than the usual time set by the technician for routine production. Therefore, employing Raman spectroscopy for the online monitoring of the 7-ACT reaction process makes it possible to precisely determine the complete time of the chemical reaction, which helps save time and reduce costs in the industry production process.

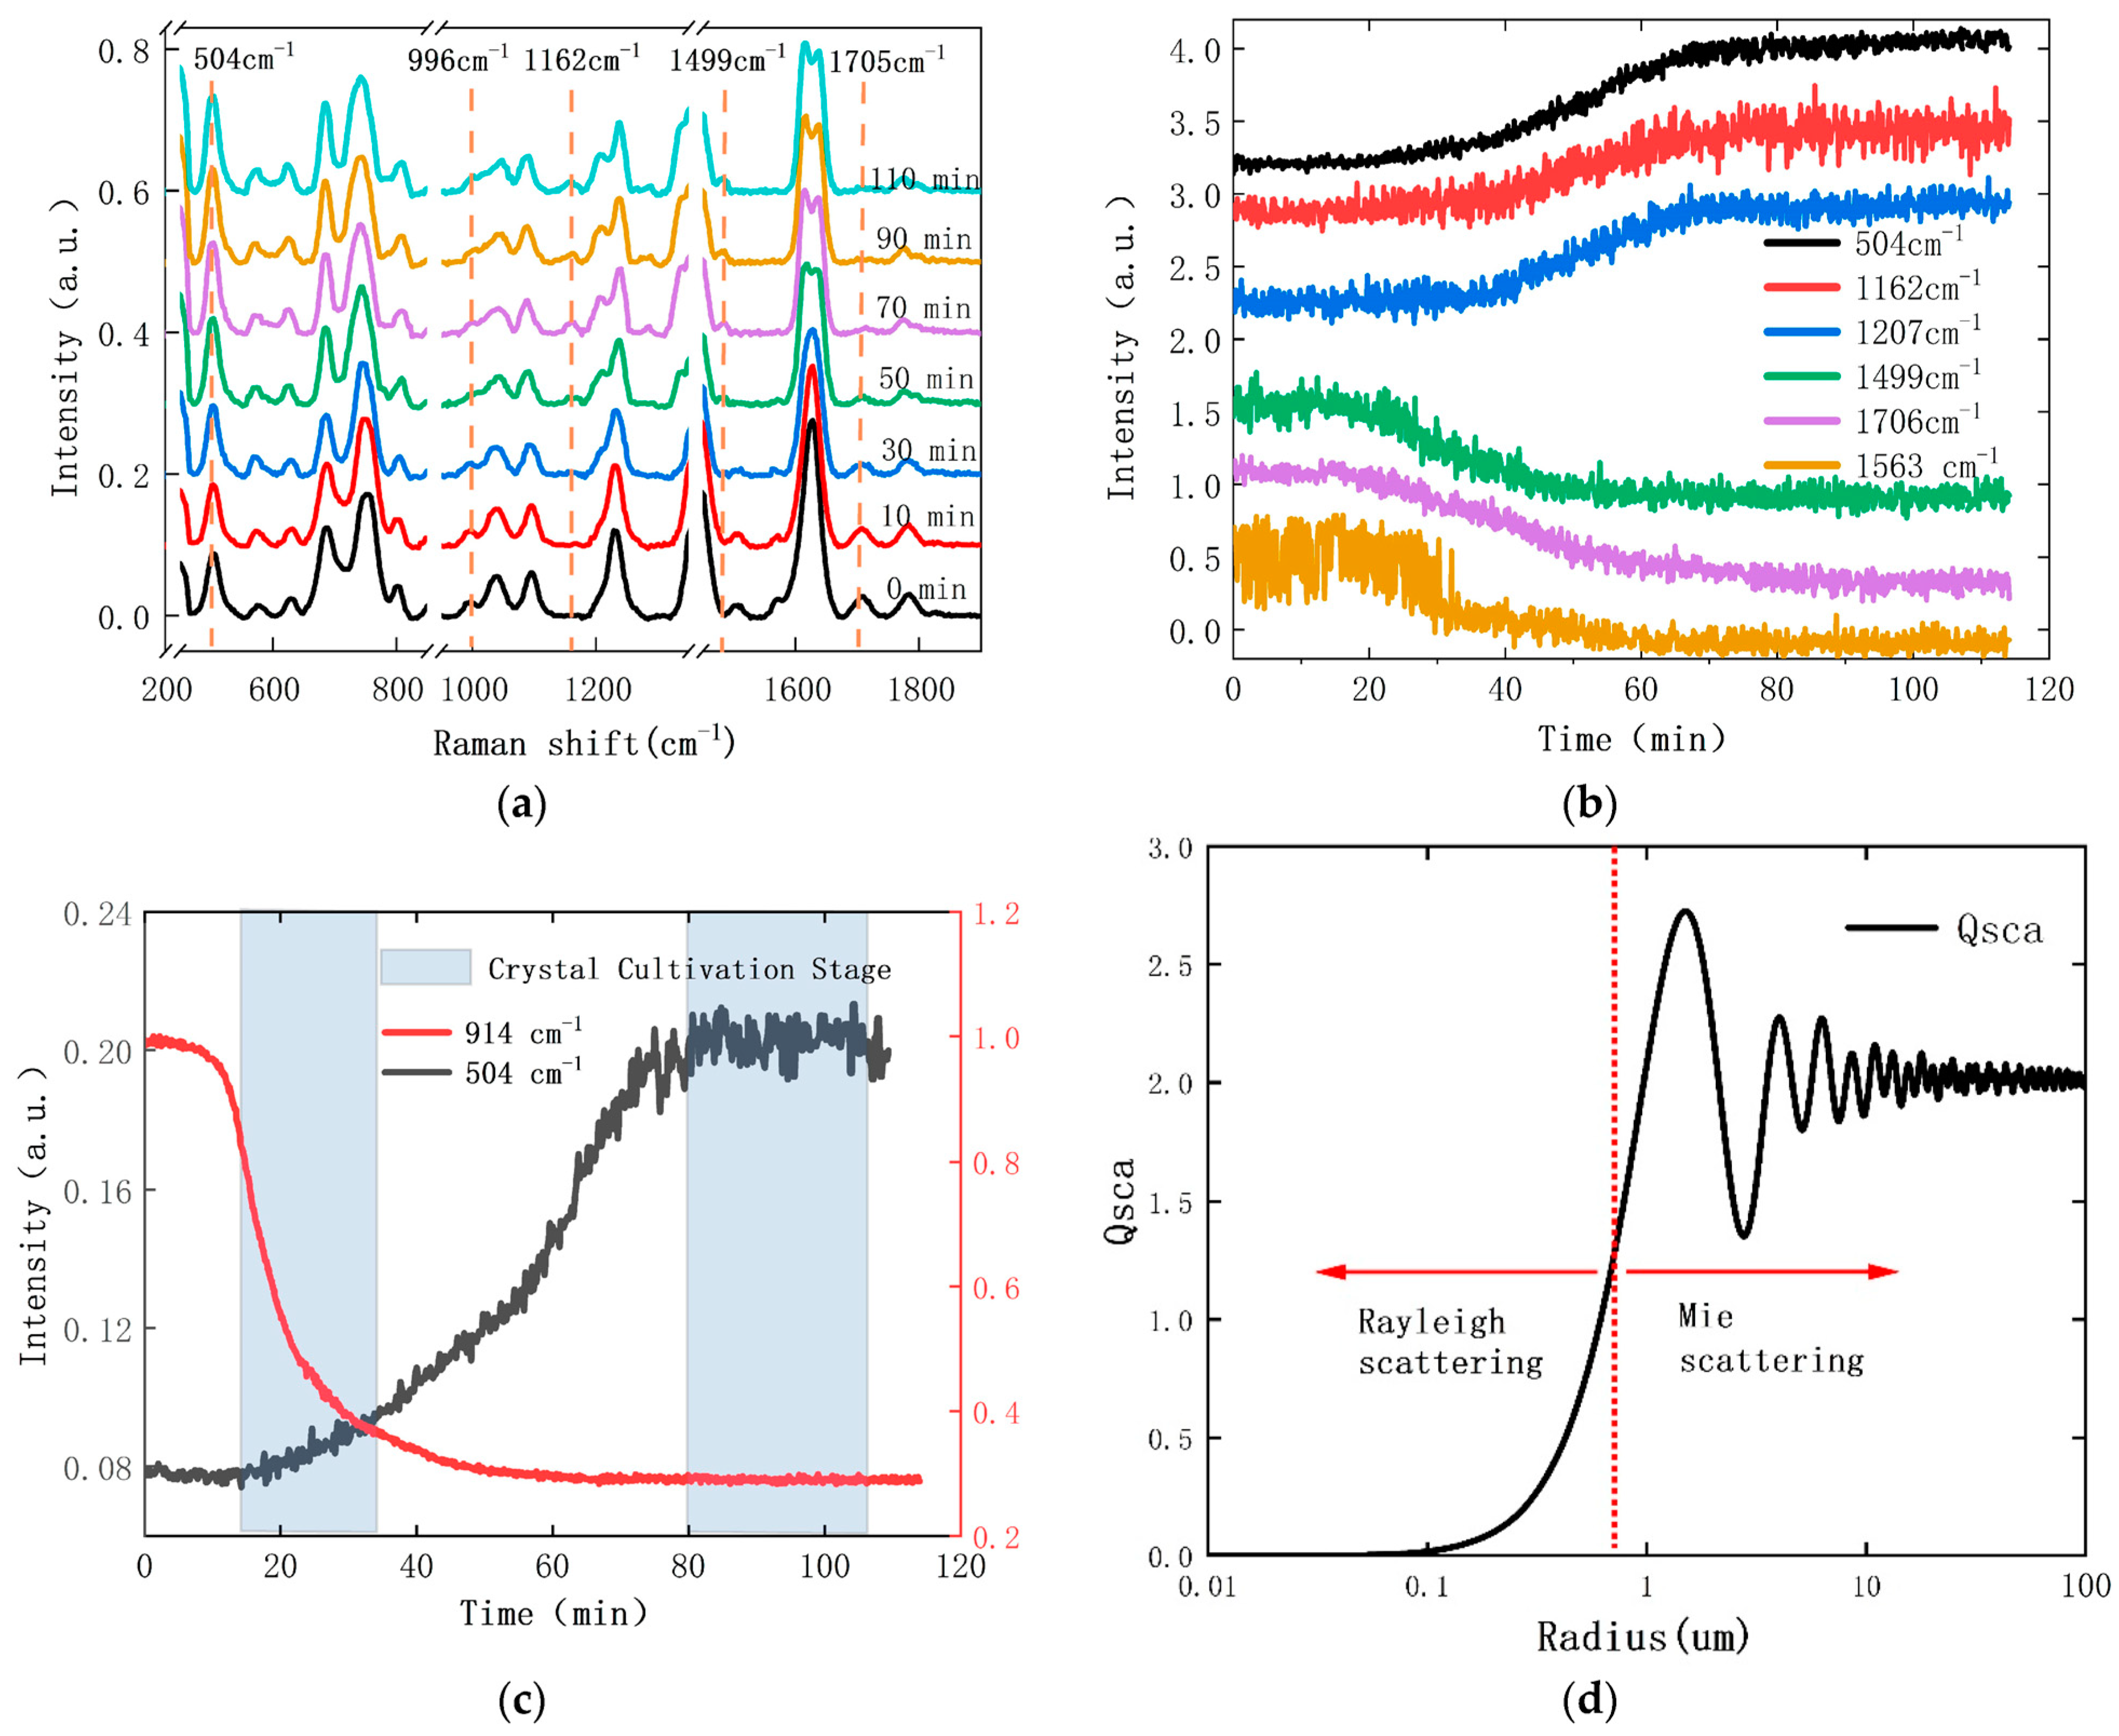
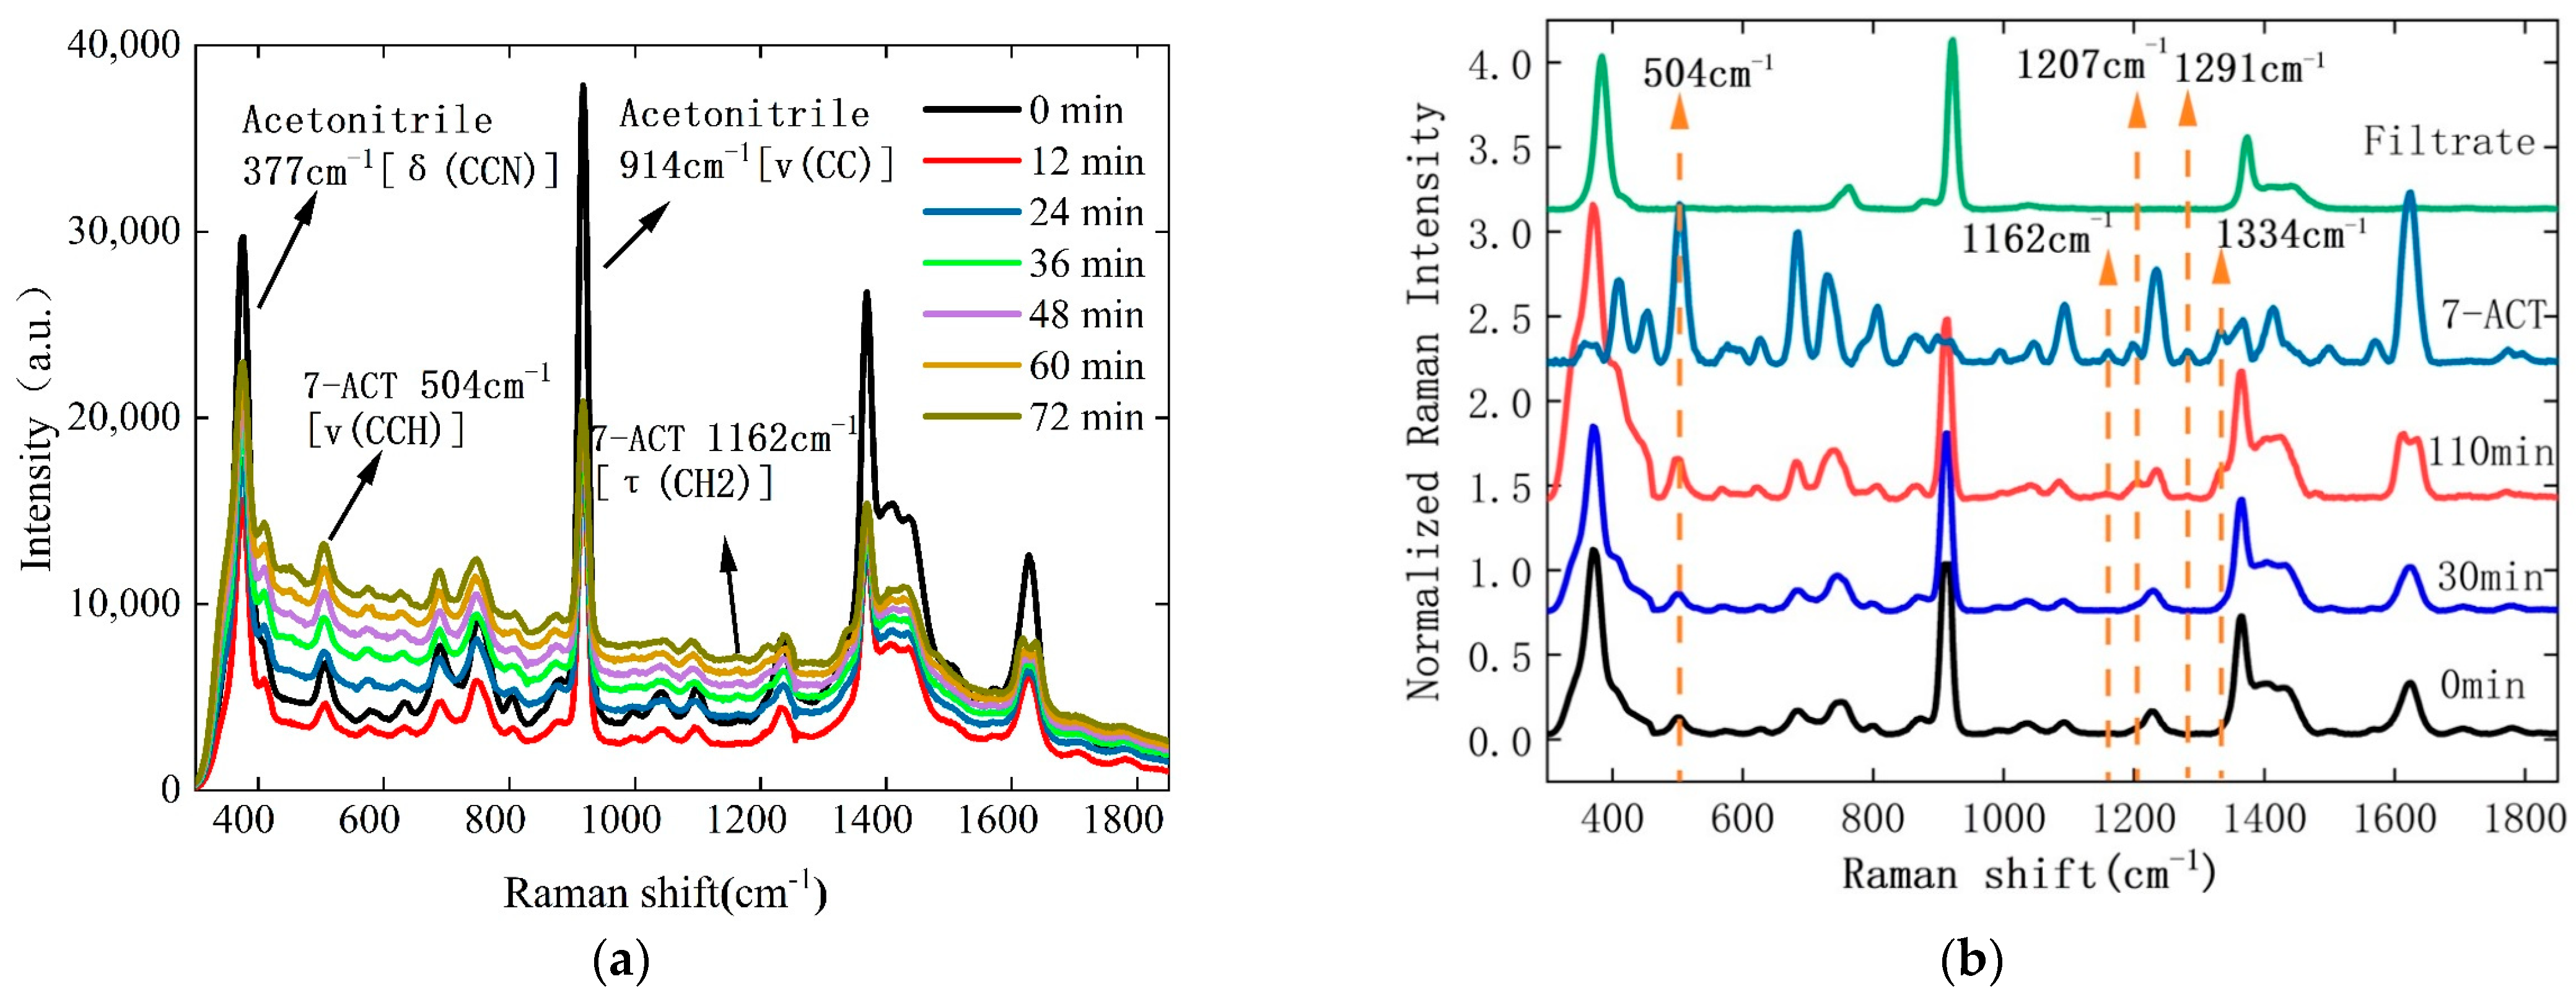
3.2. Monitoring of 7-ACT Crystallization Process

After the synthesis of 7-ACT from 7-ACA, the solution was diluted with pure water, followed by the gradual addition of ammonia solution to increase the pH value of the solution, causing 7-ACT to crystallize due to supersaturation. Continuous Raman signal collection was carried out to monitor the whole crystallization process. It was observed that during the crystallization process, the clear golden-yellow solution turned into a turbid milky white suspension due to crystallized crystals. Figure 4a shows the original Raman spectra of different crystallization times, and some of the characteristic peaks of acetonitrile and 7-ACT are marked. It can be seen that the background fluorescence of this process first decreased and then increased with the increased crystallization time. The above phenomenon is related to two major events of crystallization: nucleation and crystal growth. During the crystallization process, the reaction solution transitions from yellow to colorless in the initial stages, leading to a decrease in the fluorescence background of the Raman spectrum. As solid crystals form, the solution becomes turbid, causing the fluorescence of the Raman spectrum to increase once again.
In order to observe the correlation between the changes in the Raman spectrum and the material changes during the crystallization process more clearly, we removed the baseline and background fluorescence of the original spectrum and then normalized the spectrum using acetonitrile at a characteristic peak of 914 cm−1. The Raman spectra 0 min, 30 min, and 110 min after the start of the crystallization process are shown in Figure 4b. In addition, the normalized Raman spectra of the filtrate and the 7-ACT crystal are also shown in the figure for comparison.
During the crystallization process, 7-ACT molecules form crystals from acetonitrile solvent. Their molecular spatial arrangement changed, resulting in different Raman spectral information. By comparing the Raman spectra of the solid 7-ACT crystals and those of the solutions at different crystallization times, we found that the characteristic Raman signal peaks of solid 7-ACT at 504 cm−1, 1162 cm−1 [τ(CH2)], 1207 cm−1 [δ(CH2)], 1291 cm−1 [νs(CH2)], and 1331 cm−1 [τ(CH3)] gradually appeared, and their intensities increased with time. The intensity of the Raman peak at 504 cm−1 [ν(CCH), ν(CC)] originally existed in the solution and increased more significantly. After the crystallization reaction was complete, the 7-ACT solid was taken out through vacuum filtration, and the Raman spectrum of the filtrate was collected. It can be seen that the Raman peak of 7-ACT disappeared from the filtrate, leaving behind the peaks of the solvent acetonitrile and the catalyst boron trifluoride, including those at 377 cm−1 [δ(CCN)], 755 cm−1 [δ(CCN)], 914 cm−1 [ν(CC)], 1029 cm−1 [ω(CH3)], etc., as shown by the green curve in Figure 4b.
In order to observe the changes in Raman characteristic peaks during the crystallization process more clearly, parts of the Raman spectra were normalized using the acetonitrile peak at 914 cm−1 and are shown in Figure 5a. Since the Raman peaks of acetonitrile are very strong, in order to amplify the Raman signals of other chemicals, the Raman peaks of the acetonitrile at 377 cm−1, 914 cm−1, and 1366 cm−1 have been removed, as shown in Figure 5a. As the crystallization reaction progressed, more 7-ACT crystals crystallized, thereby continuously increasing the intensity of the characteristic peaks of 7-ACT solids at 1162 cm−1, 1207 cm−1, 1291 cm−1, and 1334 cm−1, while the intensity of some characteristic peaks when 7-ACT was dissolved in acetonitrile, such as those at 1499 cm−1 [τ(NH)], 1570 cm−1 [ν(COO-)] and 1705 cm−1 [ν(CO)], gradually decreased. Additionally, the characteristic peak at 504 cm−1 [ν(CCH), ν(CC)] already present in the 7-ACT solution also increased with crystallization time, indicating the number of its corresponding bonds increased in the 7-ACT crystal structures.
The above phenomena suggest that we can select different Raman peaks to represent changes in crystal quantity and crystallographic structure and use them to control the crystallization process. Figure 5b shows the trend of intensity changes for six Raman characteristic peaks in Figure 5a. Due to the continuous precipitation of 7-ACT solids, the concentration of 7-ACT in the solution decreases accordingly. The intensity of the peaks at 504 cm−1, 1162 cm−1, and 1207 cm−1, corresponding to the solid form of 7-ACT, shows an increasing trend. In contrast, the intensity of the peaks produced by 7-ACT dissolved in acetonitrile at 1499 cm−1, 1570 cm−1, and 1705 cm−1 continuously decreases. Since the curves at 1162 cm−1 and 1563 cm−1 had a low signal-to-noise ratio, and the characteristic peaks at 1207 cm−1 overlapped with other characteristic peaks of 7-ACT, we selected the peak at 504 cm−1 with the highest signal-to-noise ratio and the greatest amplitude of intensity change to examine what happened to the 7-ACT crystals during the crystallization process. At the same time, the Raman signals of acetonitrile were only affected by particles formed in the suspension; thus, its characteristic peak at 914 cm−1 was used to examine the impact of scattering on the Raman signals of the chemicals in the solution. Their intensity depending on crystallization time is shown in Figure 5c.
Since acetonitrile does not participate in the reaction and its amount in the solution is constant, at the beginning of the crystallization process corresponding to the nucleation stage, its Raman peak signal almost did not change. However, with the increased number and size of the 7-ACT nuclei, their increased scattering caused a continuous decrease in the intensity of the 914 cm−1 signal reaching the Raman probe as the reaction proceeded. For the same reason, the signal intensity of the 7-ACT characteristic peak at 504 cm−1 remained constant but inversely increased with time until the later stages of crystallization at which the 7-ACT molecules in the solution were completely consumed. The bonds of [ν(CCH), ν(CC)] emitting the 504 cm−1 signal were originally present in the 7-ACT molecules in the solution. As these 7-ACT molecules began to form nuclei and eventually grew into crystalline particles within the solution, the quantity of the bonds emitting the 504 cm−1 signal significantly increased. This increase partially offset the scattering loss of the 504 cm−1 signal.
The crystallization process was accompanied by an increased number and size of the nuclei and subsequent crystals, whose Rayleigh and subsequent Mie scattering directly caused a reduction in the Raman signals at 914 cm−1, shown as the red curve in Figure 5c. We utilized the software MiePlot V4.6 to calculate the scattering efficiency of 7-ACT crystal particles as their size increases, from 10−8 to 10−4 m, with a refractive index of 1.52. The calculations were conducted under the assumption that the crystal particles are spherical, and their absorption is neglected, using a laser source of 785 nm [44,45]. Comparing Figure 5d to the red curve in Figure 5c, we found that the decreasing trend of the intensity of the 914 cm−1 Raman peak showed the same rising trend as the scattering efficiency of the 7-ACT. The size of the nuclei in the nucleation step is very small (less than 100 nm), so their scattering impact on the intensity of the 914 cm−1 Raman peak is negligible. With the continuous addition of the ammonia solution to the solution, the number and size of the nuclei increased, and their scattering caused a higher loss of light, including laser emission and Raman signals, thus leading to a gradual reduction in the intensity of the 914 cm−1 Raman peak. At this moment, we stopped the addition of the ammonia water to avoid a further increase in the nuclei; instead, the nuclei started to rapidly grow into crystals, with some unstable nuclei dissolving in the water and being redeposited into more stable nuclei. This process resulted in a rapid increase in the scattering efficiency, thus causing a rapid reduction in the intensity of the 914 cm−1 Raman peak. Therefore, the starting time of the crystals is supposed to be located in the earlier Rayleigh scattering region, with the number and size of the nuclei more significantly impacting their scattering loss, which seems very reasonable.

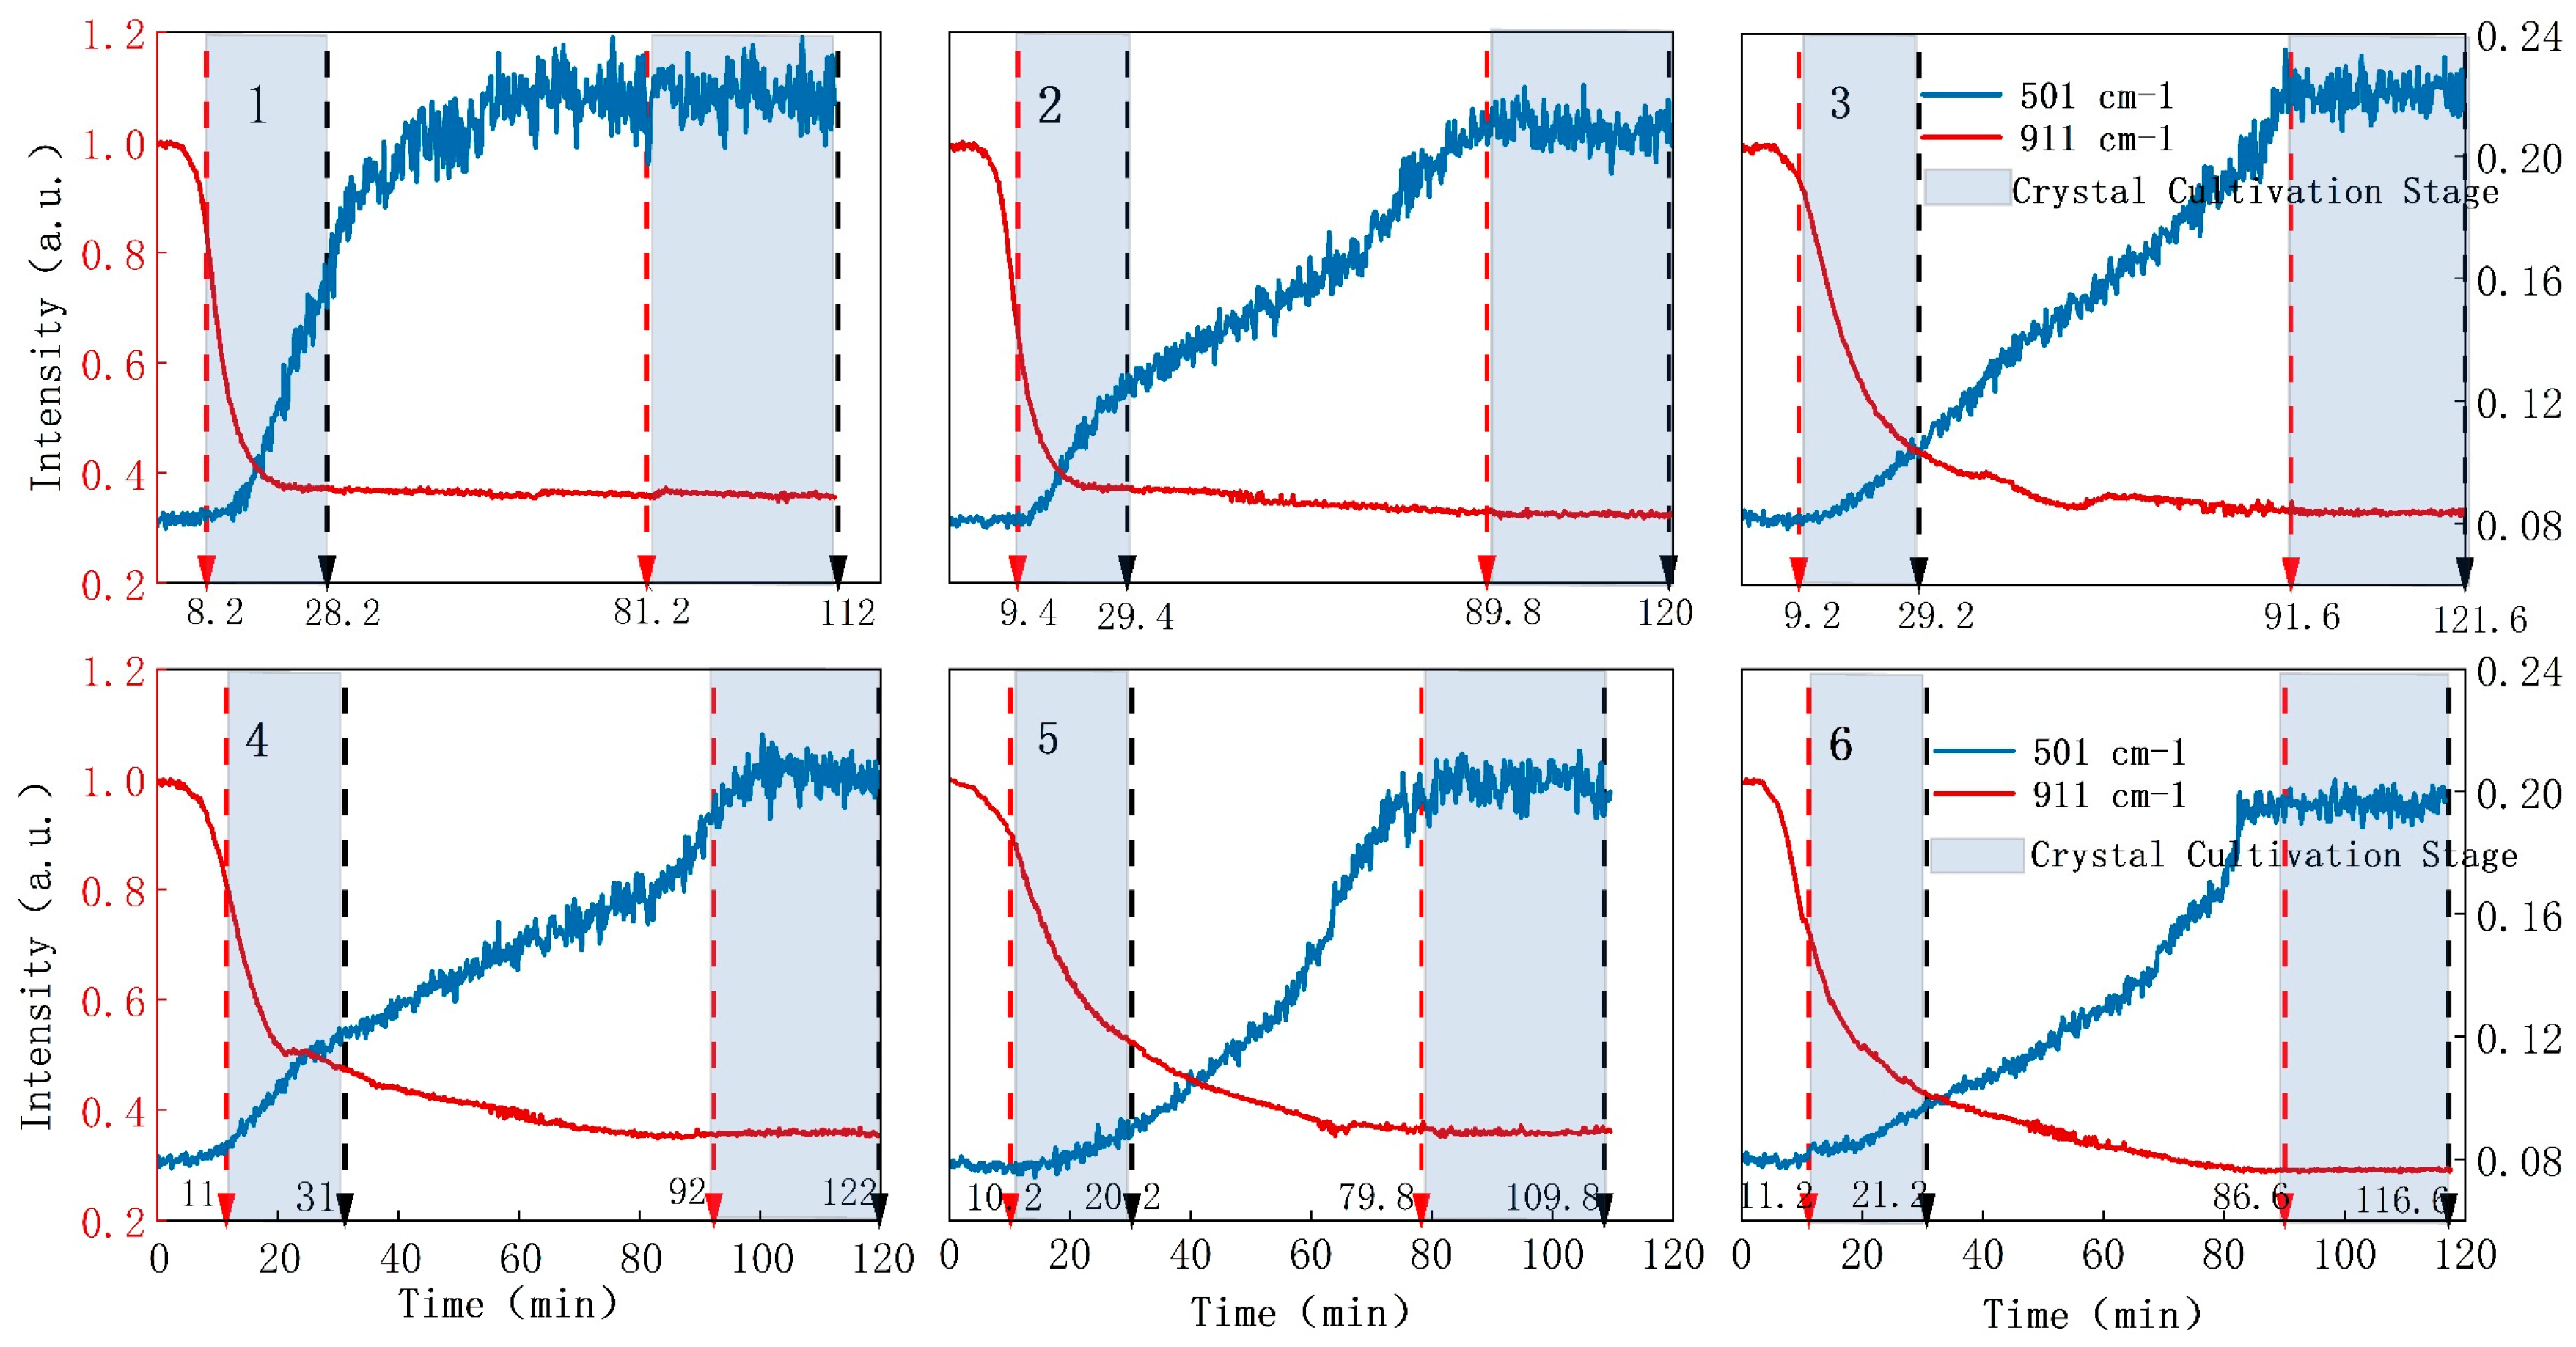
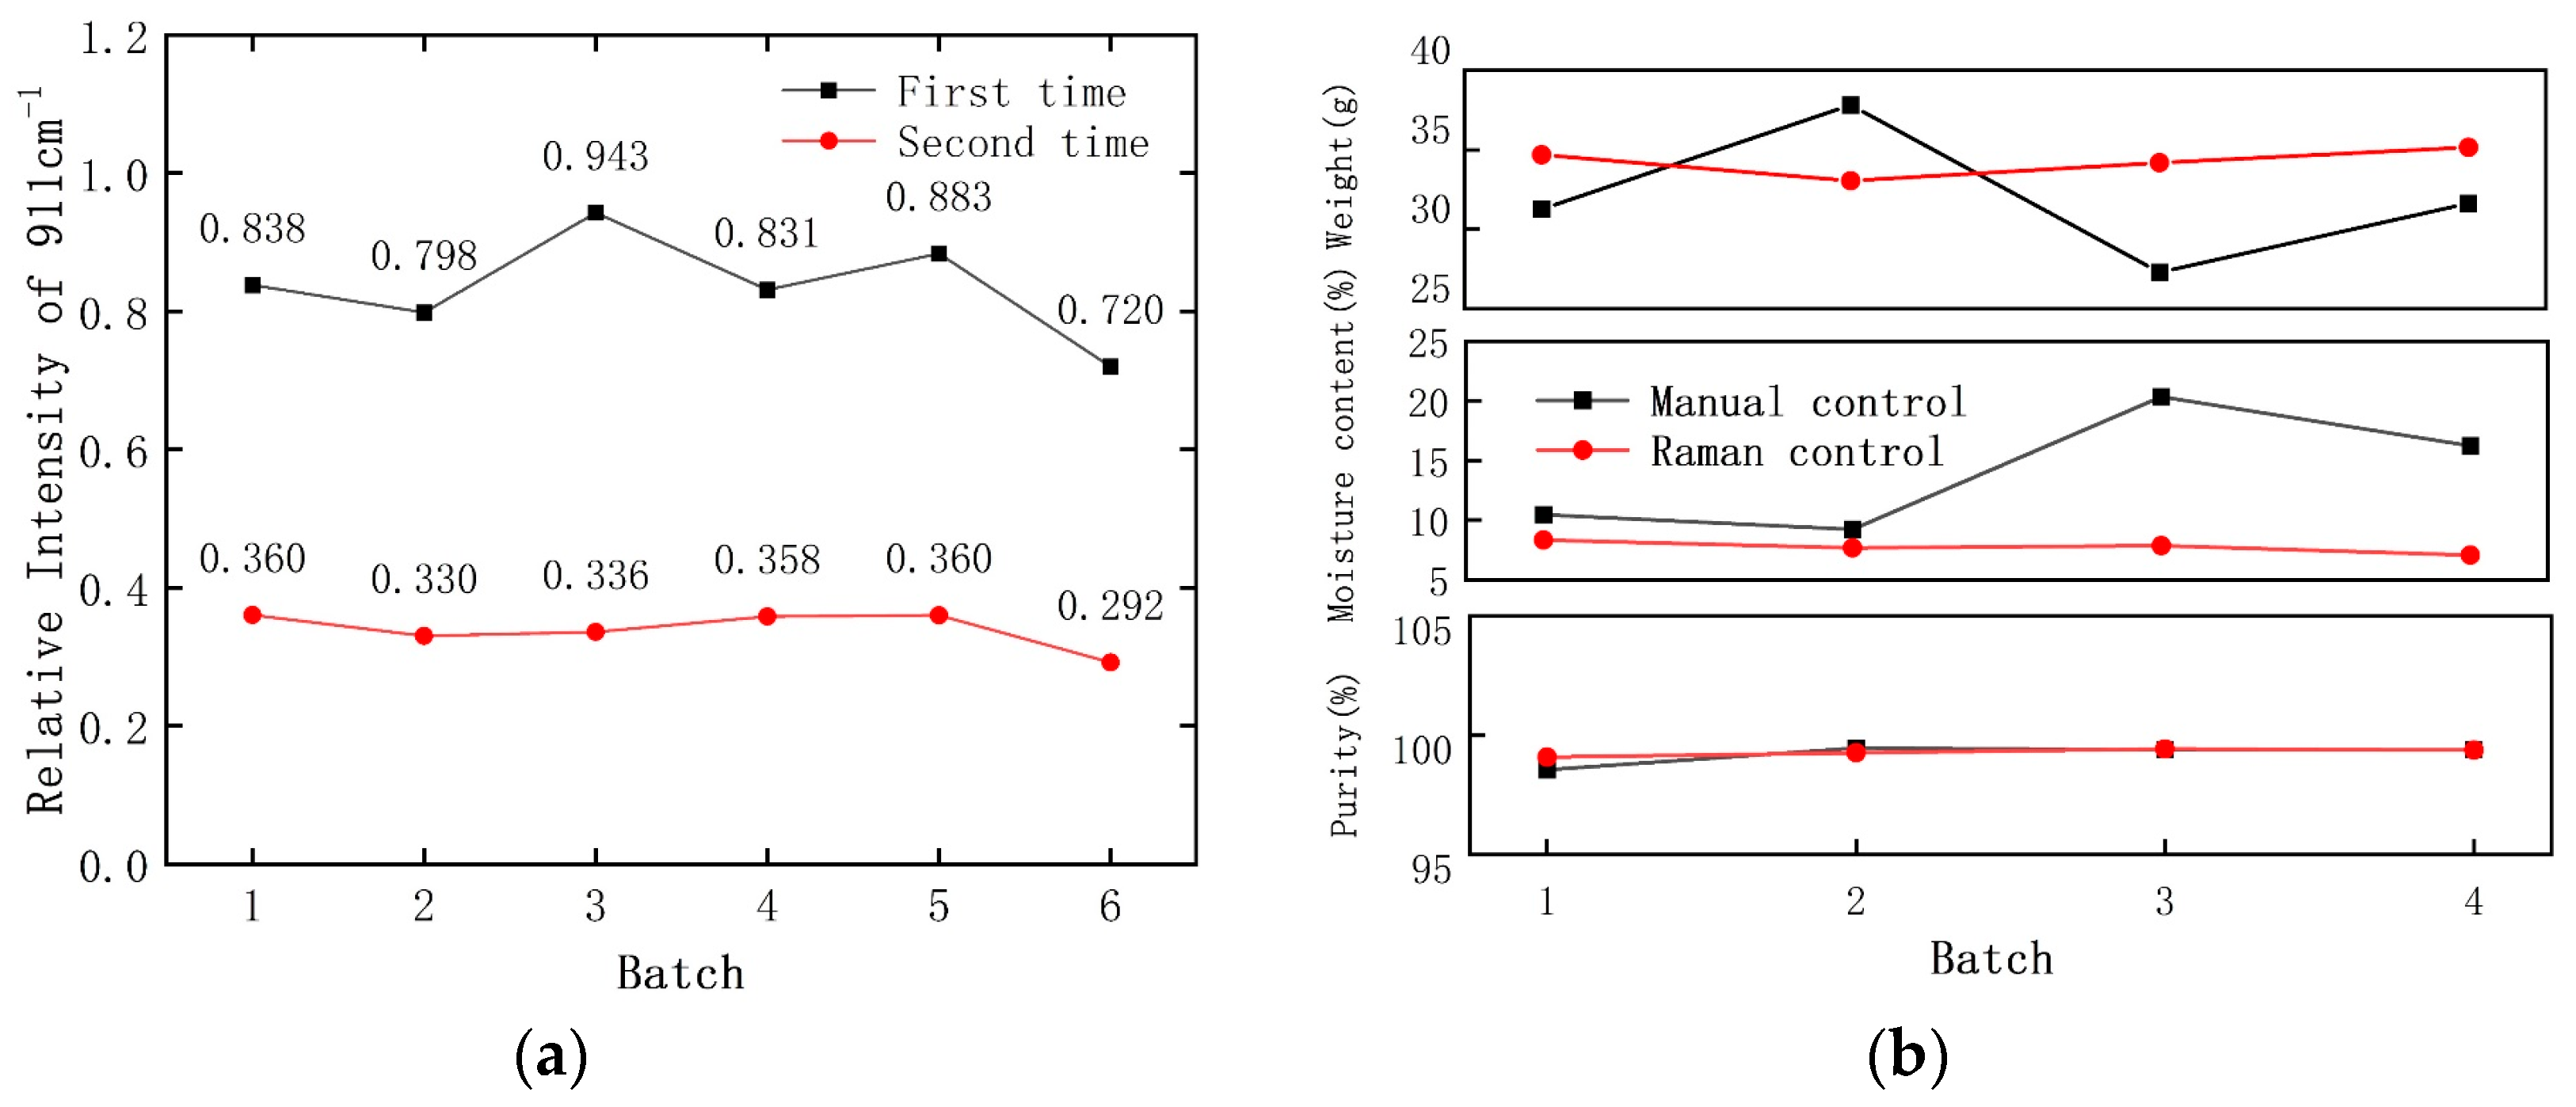
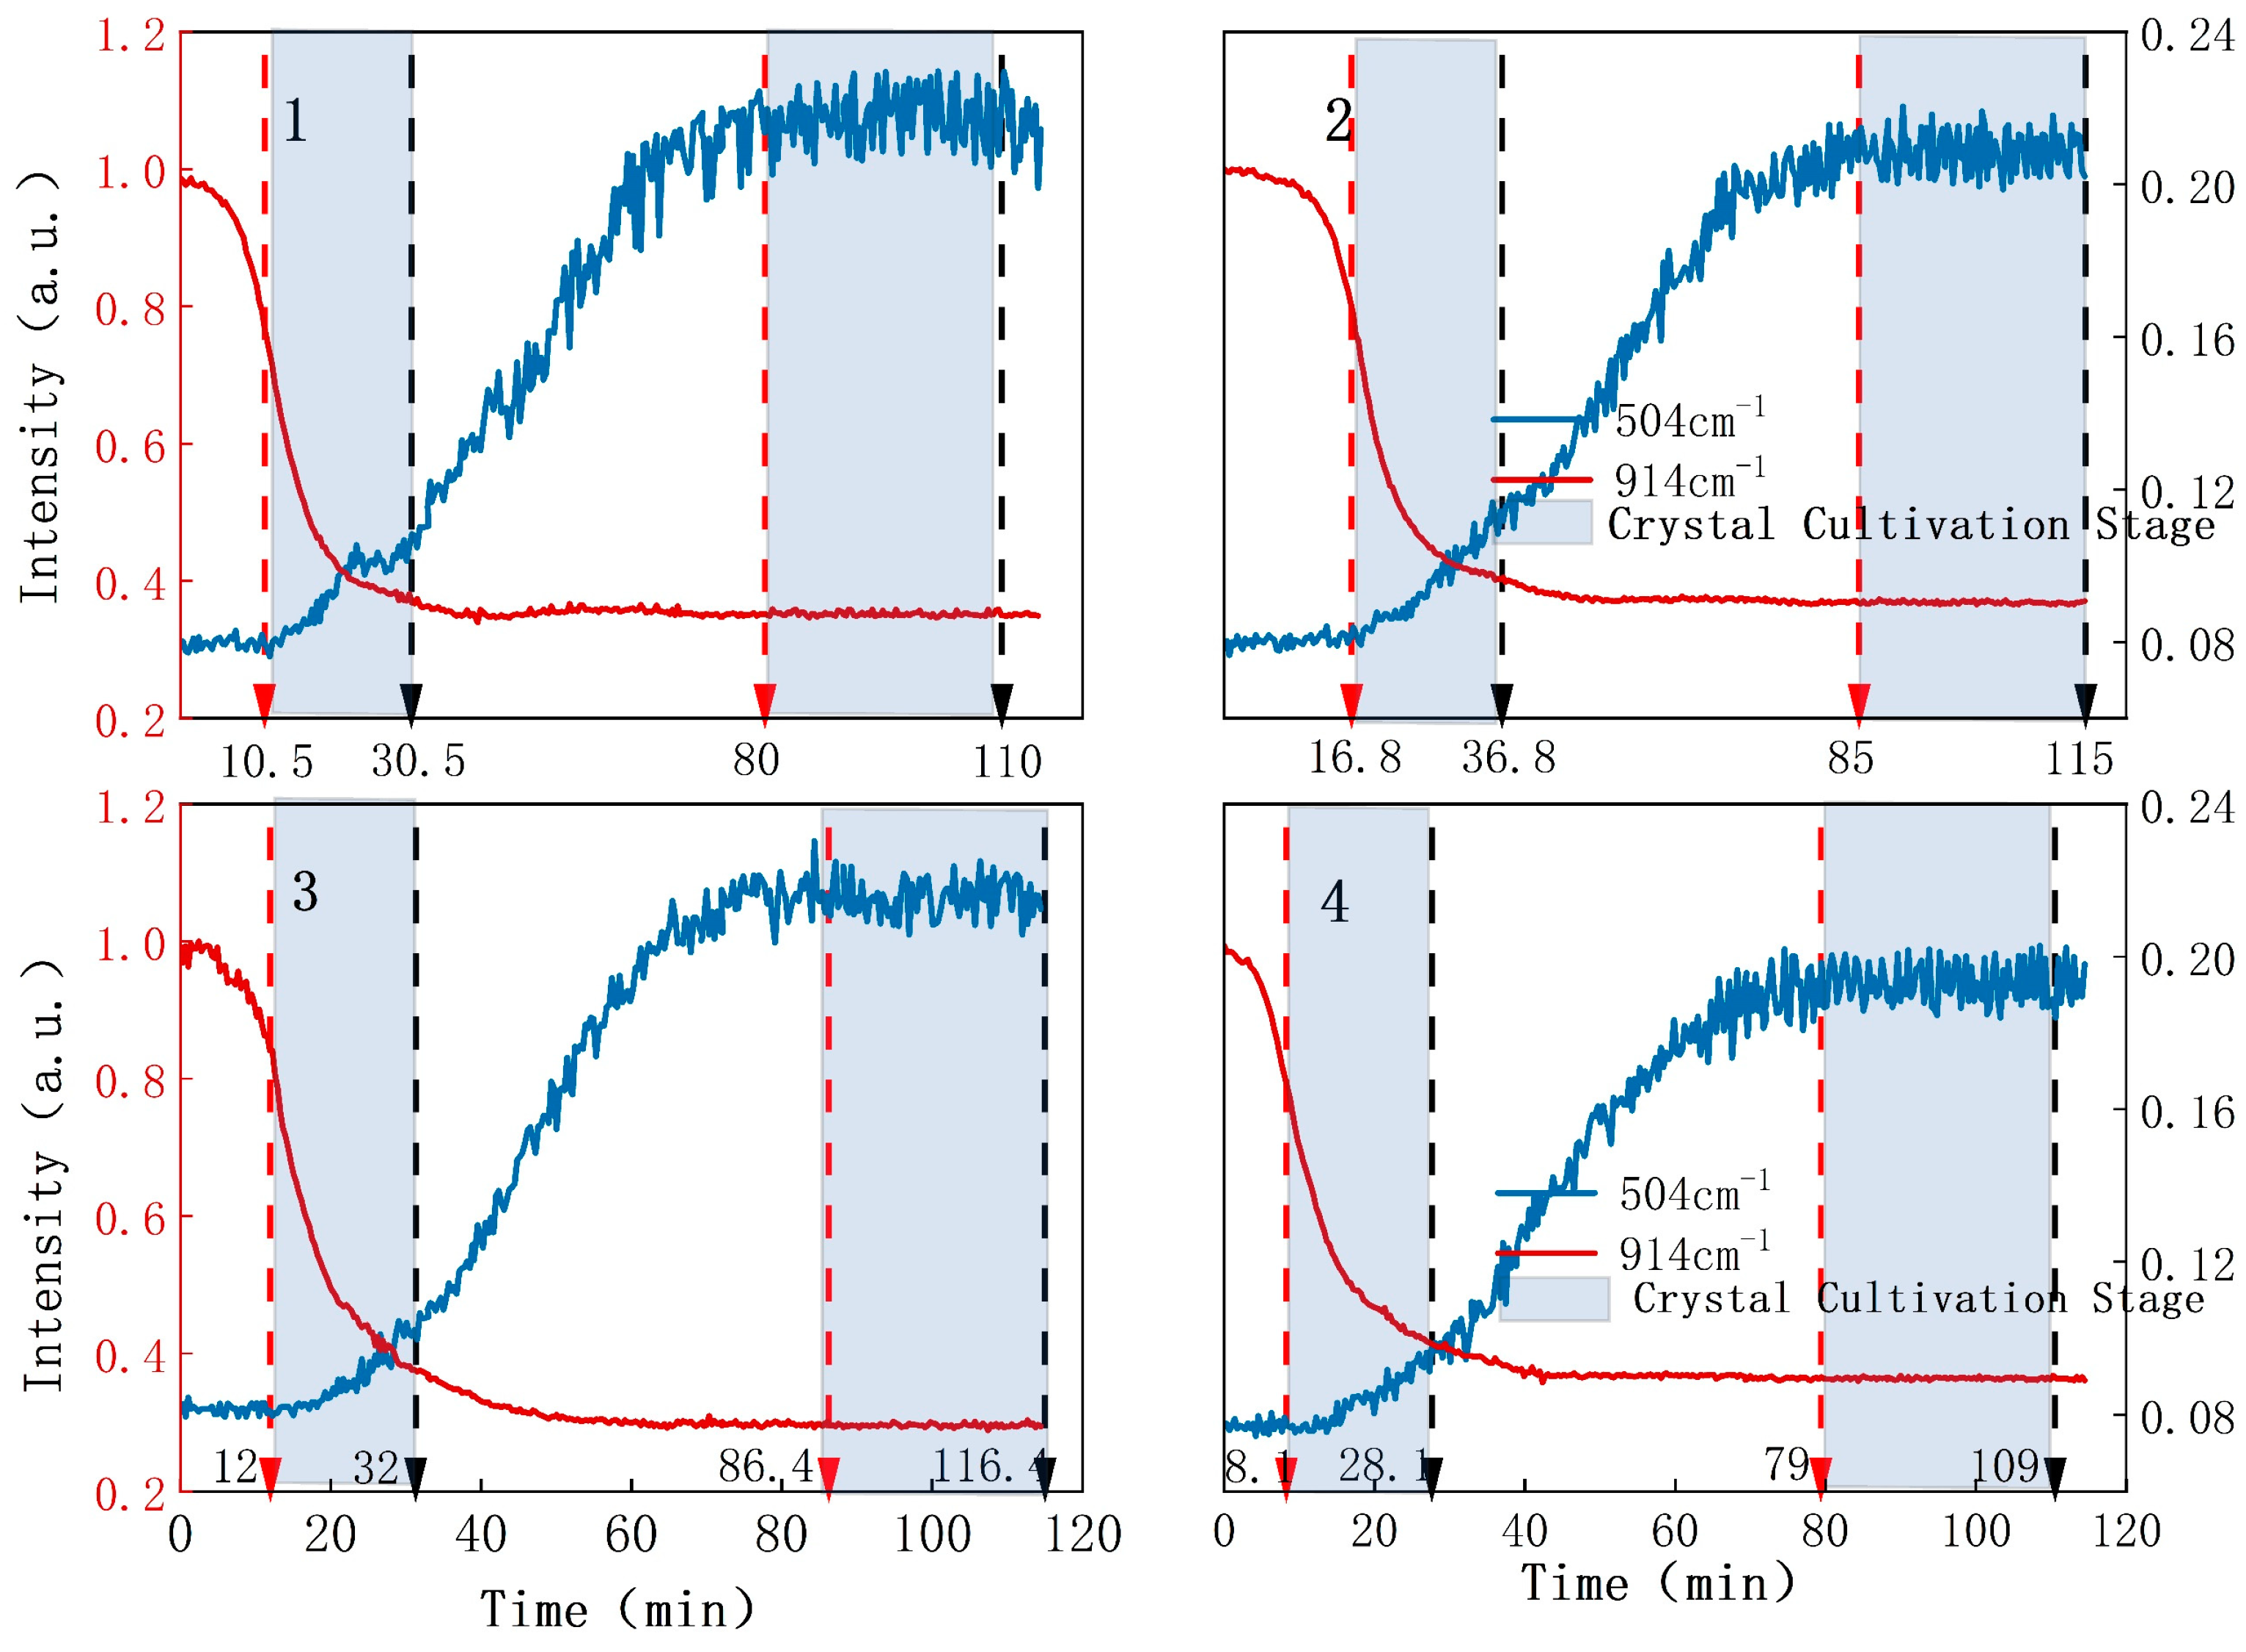
3.3. Control of the Crystallization Process Based on Raman Monitoring

In order to confirm the exact time to start the crystal growth stage (meaning the time to the stop addition of the ammonia water), we first conducted experiments with the processes manually controlled by skilled workers’ personal experience through observing changes in the solution’s turbidity. This method is commonly used in current crystallization processes. A total of six batches of crystallization experiments were conducted, with Raman signals being collected online throughout each experiment. The experimental protocol necessitated two distinct periods of crystal growth. During the crystallization stage, the initial cessation of ammonia solution addition was a strategic measure to prevent the solution from becoming excessively supersaturated. Excessive supersaturation could ultimately result in the formation of numerous small crystalline particles. The termination of subsequent ammonia solution infusion depends on the pH value of the solution being 3.8. A subsequent period of crystal growth was employed to fortify the internal structural integrity of the crystals, concurrently facilitating the homogenization of crystal dimensions.
Figure 6 shows the curves of the normalized intensities of both the acetonitrile peak at 914 cm−1 and the 7-ACT peak at 504 cm−1 throughout the crystallization process for six batches of 7-ACT crystallization experiments, with the starting time of the crystal growth stage marked. It is evident that the start time of the first crystallization step corresponded to the moment when the intensity of the acetonitrile peak at 914 cm−1 began to decrease sharply due to a rapid increase in the number and size of crystalline nuclei. At this moment, the turbidity in the solution that was observable by the human eye also increased sharply, indicating it was time to stop the addition of ammonia water and start crystallization.
During the crystal growth stage, the rate of increase in the number of crystals was slow, while their size increased. When the crystal size approached the wavelength of light (785 nm and above), the light scattering by the particles transitioned from Rayleigh to Mie scattering (Figure 5d), causing further increases in light scattering losses, thus continuing the decline in the intensity of the acetonitrile peak at 914 cm−1. When the number and size of the crystal particles no longer increased, the intensity of the acetonitrile peak at 914 cm−1 stabilized. For the same reason, the trend of the change in the intensity of the 7-ACT crystal peak at 504 cm−1 was opposite to that of the acetonitrile peak at 914 cm−1, starting with slow changes and then accelerating. Since part of its signal was canceled out by the scattering of the crystal particles, the practical rate of increase in the 7-ACT crystal product was higher than the changing trend of the 504 cm−1 peaks shown in these figures.
Figure 6 indicates that the starting times of the crystal growth stage for the six batches of experiments determined by manual experience do not correspond to the same intensity values of the acetonitrile peak at 914 cm−1, which are 0.838, 0.798, 0.943, 0.831, 0.883, and 0.72, respectively (Figure 7a). The weight, water content, and purity of the crystal products obtained from 1–4 batches in Figure 6 are shown as black curves in Figure 7a,b. By observing these black curves, it can be seen that when the intensities of the acetonitrile peak at 914 cm−1 corresponding to the stop time of the addition of the ammonia water are similar, such as in the first and fourth batches of experiments (Figure 7a), the weights of the obtained crystal products are relatively consistent. However, when the intensity of the acetonitrile peak at 914 cm−1 was lower, for example, in the second batch of experiments, indicating that the addition of the ammonia water stopped later, its weight increased, and the corresponding water content of the crystal product was also lower. For the third batch of the experiments, where the intensity of the acetonitrile peak at 914 cm−1 was higher, indicating an earlier start to stop to the addition of the ammonia water, its weight was reduced by 27% relative to the second batch, and the corresponding water content of the crystal product increased by 11%. Therefore, it seems that strong relationships exist between the time when we stopped adding ammonia water into the solution, the Raman intensities of the acetonitrile peak at 914 cm−1 at the time when the addition of ammonia water to the solution was stopped, and both the weight and water content of the 7-ACT crystal products. The above results suggest that the Raman intensities of the acetonitrile peak at 914 cm−1 may be a suitable indicator for when to stop nucleation and start the crystal growth stage.
After the first crystal growth stage, we resumed the addition of ammonia solution to the mixture. During this phase, the 7-ACT molecules in the solution persist in transforming into 7-ACT crystals, leading to a continuous increase in the size of the original particles. It was observed that the Raman intensity at 914 cm−1 decreased very slowly, while the intensity at 504 cm−1 increased more quickly, indicating that the 7-ACT crystals continued to grow at a slower rate compared to the initial period of the second crystal growth stage.
The initiation of the second crystallization stage was determined by adding ammonia solution until the pH reached 3.8. As shown in Figure 6, at the beginning of the second stage of crystal growth, the characteristic peak of 7-ACT at 504 cm−1 rose to a stable value, indicating that the crystals had ceased growing. This was confirmed by the stabilized intensity of the acetonitrile peak at 914 cm−1, suggesting that the number of crystals remained essentially unchanged.
The above analysis thoroughly demonstrates that controlling the timing of the crystal growth stage is feasible by manually observing turbidity changes, but the qualities and quantities of the crystal products are not consistent.
Therefore, we explored the possibility of using Raman techniques to control crystallization, and the start time for the crystal growth stage was determined based on the reduction in the intensity of the acetonitrile peak at 914 cm−1. Four batches of experiments starting from the synthesis of 7-ACT molecules and then crystallization were conducted. When the normalized intensity of the acetonitrile peak at 914 cm−1 was reduced to 0.833, the addition of ammonia water was stopped to start the crystal growth stage for the first time, and then we followed the same steps as above to complete these experiments. Figure 8 shows the variation curves of both the acetonitrile characteristic peak at 914 cm−1 and the 7-ACT characteristic peak at 504 cm−1 for four batches of crystallization processes controlled by Raman monitoring. It can be observed that each curve across all four batches shows high consistency with the peak intensity at 504 cm−1, though it was a little lower in the fourth batch than in the other three batches.
Three parameters (namely, weight, moisture content, and purity) of the four batches of the experiments controlled by Raman monitoring are shown as black lines in Figure 7b. It can be clearly seen that these parameters are almost the same for all four batches, compared to large variations among the four batches of the experiments controlled by visually observing the turbidity of the solution. Therefore, Raman monitoring is an effective way to accurately control crystallization processes and achieve a consistent quality and quantity of crystal products.

4. Conclusions and Discussion

This study used Raman spectroscopy technology to conduct online monitoring of the chemical synthesis and crystallization processes of the cephalosporin intermediate 7-ACT. During the monitoring of the 7-ACT synthesis reaction, we noticed that the characteristic Raman peak of the thiotriazinone at 1697 cm−1 decreased as the reaction progressed, which reflects the consumption of the thiotriazinone. Simultaneously, the characteristic Raman peak of 7-ACT at 988 cm−1 gradually intensified, indicating the formation of 7-ACT. Therefore, the intensity changes of these two characteristic peaks provide a basis for judging the reaction process. In the monitoring of the 7-ACT crystallization process, the control of the crystal growth stage is especially critical. We discovered that the intensity of acetonitrile’s characteristic Raman peak diminishes as the crystals grow, a change attributed to particle scattering. This observation offers a viable alternative to manual assessment for pinpointing the commencement of the initial stage of crystal growth. When the characteristic peak of 7-ACT (504 cm−1) increases and reaches equilibrium during the second crystal growth stage, it indicates that 7-ACT in the solution has completely crystallized. By controlling the crystallization process of 7-ACT through online monitoring technology of Raman spectroscopy, we found that this technology can improve the consistency of the product. In addition, by measuring the Raman spectrum of 7-ACT, we revealed the relationship between its solubility, temperature, and pH. We found that as the pH increases or the temperature decreases, the solubility of 7-ACT increases. These findings demonstrate the effectiveness of Raman spectroscopy technology in monitoring the chemical synthesis and crystallization processes, providing a powerful tool for improving yields and product quality.
Although this technique was explored based on the production of 7-ACT intermediates, it can be used by all crystallization processes. The Raman technology demonstrates the absolute advantage of automatic control, which determines the start and end times of the crystal growth stage by monitoring spectral signal changes related to changes in the number and size of growing crystals. The techniques established in this research can effectively avoid the complexities and risks associated with conventional manual sampling and offline operations, as well as errors produced by visual judgment during the production process. It also possesses the ability to simultaneously analyze changes in multiple components in real time. This technology can achieve timely feedback adjustment and control over the crystallization process. This enhances the efficiency of process control, significantly accelerates the pace of process development, reduces costs, stabilizes product quality, and is expected to be extended to application in large-scale crystallization synthesis reactions and purification analysis processes.

Supplementary Materials

The following supporting information can be downloaded at: https://www.mdpi.com/article/10.3390/pr12040774/s1, Figure S1: (a) Raman spectra of 7-ACT solution at different concentrations; (b) Raman spectroscopy with wave numbers 1500–1850 cm−1 (c) PLS prediction model (Prediction and Reference); Figure S2: (a) Raman spectra of 7-ACT solution at different pH values; (b) Raman spectroscopy with a wavenumber of 1500–1850 cm−1; (c) Solubility curves of 7-ACT in acetonitrile solution at different pH values; (d) Supersaturation curves of 7-ACT in acetonitrile solution at different pH values; Figure S3: The change of solubility with temperature under different pH conditions.

Author Contributions

Conceptualization, A.L. and Y.R.; methodology, A.L. and Y.R.; software, Y.C., K.J. and Z.L.; validation, A.L., B.C. (Boxue Chang) and Y.R.; investigation, A.L., B.C. (Boxue Chang) and J.W.; resources, F.Z., S.O. and Y.R.; data curation, A.L. and Z.L.; writing—original draft preparation, A.L.; writing—review and editing, Y.R.; visualization, A.L. and B.C. (Biao Chen); supervision, Y.R.; funding acquisition, Y.R. All authors have read and agreed to the published version of the manuscript.

Funding

This research was funded by the National Key Research and Development Program of China (2021YFC2101101), China.

Data Availability Statement

The data are contained within the article.

Conflicts of Interest

Author Zhen Li, Yangshun Chen were employed by the company Subphotonic (Shenzhen) Technologies .Author Shiqiang Ou, Fengming Zhang, and Jiaoning Wei were employed by the company Guangxi Kelun Pharma-ceutical Co., Ltd. The remaining authors declare that the research was conducted in the absence of any commercial or financial relationships that could be construed as a potential conflict of interest.

Abbreviations

νStretching
νsSymmetric stretching
νasAsymmetric stretching
ωWagging
δScissoring
τTwisting

References

  1. Sangroniz, L.; Cavallo, D.; Müller, A.J. Self-Nucleation Effects on Polymer Crystallization. Macromolecules 2020, 53, 4581–4604. [Google Scholar] [CrossRef]
  2. Mcginty, J.; Yazdanpanah, N.; Price, C.; ter Horst, J.H.; Sefcik, J. Nucleation and Crystal Growth in Continuous Crystallization; Yazdanpanah, N., Nagy, Z.K., Eds.; The Royal Society of Chemistry: London, UK, 2020; ISBN 978-1-78801-214-0. [Google Scholar]
  3. Paus, R.; Ji, Y. Modeling and predicting the influence of variable factors on dissolution of crystalline pharmaceuticals. Chem. Eng. Sci. 2016, 145, 10–20. [Google Scholar] [CrossRef]
  4. Zhou, L.; Wang, Z.; Zhang, M.; Guo, M.; Xu, S.; Yin, Q. Determination of metastable zone and induction time of analgin for cooling crystallization. Chin. J. Chem. Eng. 2017, 25, 313–318. [Google Scholar] [CrossRef]
  5. Kelton, K.F. Analysis of crystallization kinetics. Mater. Sci. Eng. A 1997, 226–228, 142–150. [Google Scholar] [CrossRef]
  6. Orehek, J.; Teslić, D.; Likozar, B. Continuous Crystallization Processes in Pharmaceutical Manufacturing: A Review. Org. Process Res. Dev. 2021, 25, 16–42. [Google Scholar] [CrossRef]
  7. Shekunov, B.Y.; York, P. Crystallization processes in pharmaceutical technology and drug delivery design. J. Cryst. Growth 2000, 211, 122–136. [Google Scholar] [CrossRef]
  8. Vengrenovich, R.D.; Gudyma, Y.V.; Yarema, S.V. Ostwald ripening under dislocation diffusion. Scr. Mater. 2002, 46, 363–367. [Google Scholar] [CrossRef]
  9. Ohyama, M.; Kudo, S.; Amari, S.; Takiyama, H. Production of crystalline particles with high homogeneity in reaction crystallization by using pH-solubility-profile. J. Ind. Eng. Chem. 2019, 75, 38–43. [Google Scholar] [CrossRef]
  10. Lahiq, A.A.; Alshahrani, S.M. State-of-the-art review on various mathematical approaches towards solving population balanced equations in pharmaceutical crystallization process. Arab. J. Chem. 2023, 16, 104929. [Google Scholar] [CrossRef]
  11. Vedantam, S.; Ranade, V.V. Crystallization: Key thermodynamic, kinetic and hydrodynamic aspects. Sadhana 2013, 38, 1287–1337. [Google Scholar] [CrossRef]
  12. Ito, F.; Suzuki, Y.; Fujimori, J.; Sagawa, T.; Hara, M.; Seki, T.; Yasukuni, R.; Chapelle, M.L.D.L. Direct Visualization of the Two-step Nucleation Model by Fluorescence Color Changes during Evaporative Crystallization from Solution. Sci. Rep. 2016, 6, 22918. [Google Scholar] [CrossRef] [PubMed]
  13. Huang, J.; Wang, H.; Jia, C.; Tang, Y.; Yang, H.; Chen, C.; Gou, K.; Zhou, Y.; Zhang, D.; Liu, S. Advances in Crystallization Regulation and Defect Suppression Strategies for All-inorganic CsPbX3 Perovskite Solar Sells. Prog. Mater. Sci. 2024, 141, 101223. [Google Scholar] [CrossRef]
  14. Abdollahi, J.; Dubljevic, S. Crystal radius and temperature regulation in Czochralski crystallization process. In Proceedings of the 2013 American Control Conference, Washington, DC, USA, 17–19 June 2013. [Google Scholar]
  15. Gao, Z.; Rohani, S.; Gong, J.; Wang, J. Recent Developments in the Crystallization Process: Toward the Pharmaceutical Industry. Engineering 2017, 3, 343–353. [Google Scholar] [CrossRef]
  16. Tavare, N.S. Crystallization Techniques and Phenomena. In Industrial Crystallization: Process Simulation Analysis and Design; Tavare, N.S., Ed.; Springer: Boston, MA, USA, 1995; pp. 465–499. ISBN 978-1-4899-0233-7. [Google Scholar]
  17. Liang, M.; Jin, F.; Liu, R.; Yu, Y.; Su, R.; Wang, L.; Qi, W.; He, Z. Shape evolution and thermal stability of lysozyme crystals: Effect of pH and temperature. Bioprocess. Biosyst. Eng. 2013, 36, 91–99. [Google Scholar] [CrossRef] [PubMed]
  18. Sundaramurthi, P.; Suryanarayanan, R. The Effect of Crystallizing and Non-crystallizing Cosolutes on Succinate Buffer Crystallization and the Consequent pH Shift in Frozen Solutions. Pharm. Res. 2011, 28, 374–385. [Google Scholar] [CrossRef] [PubMed]
  19. Eren, A.; Civati, F.; Ma, W.; Gamekkanda, J.C.; Myerson, A.S. Continuous crystallization and its potential use in drug substance Manufacture: A review. J. Cryst. Growth 2023, 601, 126958. [Google Scholar] [CrossRef]
  20. Chen, Z.; Hay, J.N.; Jenkins, M.J. The kinetics of crystallization of poly (ethylene terephthalate) measured by FTIR spectroscopy. Eur. Polym. J. 2013, 49, 1722–1730. [Google Scholar] [CrossRef]
  21. Lewiner, F.; Klein, J.P.; Puel, F.; Févotte, G. On-line ATR FTIR measurement of supersaturation during solution crystallization processes. Calibration and applications on three solute/solvent systems. Chem. Eng. Sci. 2001, 56, 2069–2084. [Google Scholar] [CrossRef]
  22. Chen, Z.; Hay, J.N.; Jenkins, M.J. FTIR spectroscopic analysis of poly(ethylene terephthalate) on crystallization. Eur. Polym. J. 2012, 48, 1586–1610. [Google Scholar] [CrossRef]
  23. Zhang, F.; Du, K.; Guo, L.; Huo, Y.; He, K.; Shan, B. Progress, problems, and potential of technology for measuring solution concentration in crystallization processes. Measurement 2022, 187, 110328. [Google Scholar] [CrossRef]
  24. Verstraeten, M.; Van Hauwermeiren, D.; Hellings, M.; Hermans, E.; Geens, J.; Vervaet, C.; Nopens, I.; De Beer, T. Model-based NIR spectroscopy implementation for in-line assay monitoring during a pharmaceutical suspension manufacturing process. Int. J. Pharm. 2018, 546, 247–254. [Google Scholar] [CrossRef] [PubMed]
  25. Gao, Y.; Zhang, T.; Ma, Y.; Xue, F.; Gao, Z.; Hou, B.; Gong, J. Application of PAT-based feedback control approaches in pharmaceutical crystallization. Crystals 2021, 11, 221. [Google Scholar] [CrossRef]
  26. Acevedo, D.; Wu, W.; Yang, X.; Pavurala, N.; Mohammad, A.; O’Connor, T.F. Evaluation of focused beam reflectance measurement (FBRM) for monitoring and predicting the crystal size of carbamazepine in crystallization processes. Crystengcomm 2021, 23, 972–985. [Google Scholar] [CrossRef]
  27. Leite, L.C.; Bernardo, A. A New Alternative for Monitoring the Crystallization Process through Artificial Neural Networks and FBRM Signal. 2023. Available online: https://www.researchsquare.com/article/rs-3492230/v1 (accessed on 1 October 2023).
  28. Li, X.; Xu, D.; Yang, J.; Yan, Z.; Luo, T.; Li, X.; Zhang, Z.; Wang, X. Utilization of FBRM and PVM to analyze the effects of different additives on the crystallization of ammonium dihydrogen phosphate. J. Cryst. Growth 2021, 576, 126378. [Google Scholar] [CrossRef]
  29. Salami, H.; Mcdonald, M.A.; Bommarius, A.S.; Rousseau, R.W.; Grover, M.A. In Situ Imaging Combined with Deep Learning for Crystallization Process Monitoring: Application to Cephalexin Production. Org. Process Res. Dev. 2021, 25, 1670–1679. [Google Scholar] [CrossRef]
  30. De Castro, M.L.; Priego-Capote, F. Ultrasound-assisted crystallization (sonocrystallization). Ultrason. Sonochem. 2007, 14, 717–724. [Google Scholar] [CrossRef]
  31. Zhang, D.; Liu, L.; Xu, S.; Du, S.; Dong, W.; Gong, J. Optimization of cooling strategy and seeding by FBRM analysis of batch crystallization. J. Cryst. Growth 2018, 486, 1–9. [Google Scholar] [CrossRef]
  32. Prasad, R.; Gupta, K.M.; Poornachary, S.K.; Dalvi, S.V. Elucidating the Polymorphic Behavior of Curcumin during Antisolvent Crystallization: Insights from Raman Spectroscopy and Molecular Modeling. Cryst. Growth Des. 2020, 20, 6008–6023. [Google Scholar] [CrossRef]
  33. Garbacz, P.; Paukszta, D.; Sikorski, A.; Wesolowski, M. Structural Characterization of Co-Crystals of Chlordiazepoxide with p-Aminobenzoic Acid and Lorazepam with Nicotinamide by DSC, X-ray Diffraction, FTIR and Raman Spectroscopy. Pharmaceutics 2020, 12, 648. [Google Scholar] [CrossRef]
  34. Pataki, H.; Markovits, I.; Vajna, B.; Nagy, Z.K.; Marosi, G. In-Line Monitoring of Carvedilol Crystallization Using Raman Spectroscopy. Cryst. Growth Des. 2012, 12, 5621–5628. [Google Scholar] [CrossRef]
  35. Celik Onar, H.; Ergin, M.F.; Yasa, H. Investigating the Role of Citric Acid as a Natural Acid on the Crystallization of Amoxicillin Trihydrate. Acs Omega 2023, 8, 36344–36354. [Google Scholar] [CrossRef] [PubMed]
  36. Liu, L.; Zhu, L.; Chu, Z.; Tong, Z. Seeded Epitaxial Growth of Crystallizable Polymers Governed by Crystallization Temperatures. Macromolecules 2023, 56, 5984–5992. [Google Scholar] [CrossRef]
  37. Wang, Z.; Sohn, I. A review of in situ observations of crystallization and growth in high temperature oxide melts. Jom 2018, 70, 1210–1219. [Google Scholar] [CrossRef]
  38. Da Trindade, M.T.; Salgado, H.R.N. A critical review of analytical methods for determination of ceftriaxone sodium. Crit. Rev. Anal. Chem. 2018, 48, 95–101. [Google Scholar] [CrossRef] [PubMed]
  39. Owens, H.M.; Dash, A.K. Ceftriaxone sodium: Comprehensive profile. Profiles Drug Subst. Excip. Relat. Methodol. 2003, 30, 21–57. [Google Scholar] [CrossRef]
  40. Gilles, F.; Nesrine, G. On Multiple Nucleation Bursts During Solution Crystallization in Pure and Impure Solvent. Cryst. Growth Des. 2012, 12, 3407–3417. [Google Scholar] [CrossRef]
  41. Wu, D.-X. Technological optimization of preparing 7-ACT, Intermediate of Ceftriaxone sodium. Strait Pharm. J. 2011, 23. [Google Scholar] [CrossRef]
  42. Uckert, K.; Bhartia, R.; Michel, J. A semi-autonomous method to detect cosmic rays in Raman hyperspectral data sets. Appl. Spectrosc. 2019, 73, 1019–1027. [Google Scholar] [CrossRef]
  43. Sinfield, J.V.; Monwuba, C.K. Assessment and correction of turbidity effects on Raman observations of chemicals in aqueous solutions. Appl. Spectrosc. 2014, 68, 1381–1392. [Google Scholar] [CrossRef]
  44. Laven, P. MiePlot (a Computer Program for Scattering of Light from a Sphere Using Mie Theory & the Debye Series). 2011. Available online: http://www.philiplaven.com/mieplot.htm (accessed on 10 September 2023).
  45. Wriedt, T. Mie Theory: A Review. In The Mie Theory: Basics and Applications; Hergert, W., Wriedt, T., Eds.; Springer: Berlin/Heidelberg, Germany, 2012; pp. 53–71. ISBN 978-3-642-28738-1. [Google Scholar]
Figure 1. Schematic diagram of the 7-ACT synthesis route.
Processes 12 00774 g001
Figure 2. Schematic diagram of Raman online monitoring.
Processes 12 00774 g002
Figure 3. (a) Raman spectra of the BF3-CH3CN solution and 7-ACT solid during different moments of the 7-ACT synthesis process. (b) Normalized Raman spectra of the BF3-CH3CN solution, thiotriazinone, and 7-ACA during different moments of the 7-ACT synthesis process. (c) Changes in the intensity of the characteristic peak of 7-ACT at 988 cm−1 and the characteristic peak of thiotriazinone at 1697 cm−1 over time during the reaction.
Processes 12 00774 g003
Figure 4. (a) Raman spectra at different moments during the 7-ACT crystallization process. (b) Normalized Raman spectra of 7-ACT solid and filtrate at different moments during the 7-ACT crystallization process.
Processes 12 00774 g004
Figure 5. (a) Normalized Raman spectra at different moments during the 7-ACT crystallization process. (b) Intensity variation curves of 7-ACT characteristic peaks at 504 cm−1, 1162 cm−1, 1207 cm−1, 1499 cm−1, 1563 cm−1, and 1706 cm−1 during the crystallization process. (c) Intensity variation curves over time of the 7-ACT characteristic peak at 504 cm−1 and the acetonitrile characteristic peak at 914 cm−1 during the crystallization process. (d) Curve of theoretically calculated grain size and scattering coefficient.
Processes 12 00774 g005
Figure 6. Curve of the intensity variation over time for the 7-ACT characteristic peak at 504 cm−1 and the acetonitrile characteristic peak at 914 cm−1 during the crystallization process controlled by manual monitoring (the red arrow indicates the beginning of the crystal growth stage, and the black arrow indicates the end of the crystal growth stage).
Processes 12 00774 g006
Figure 7. (a) Relative intensity values of the acetonitrile peak at 914 cm−1 at the beginning of the first and second crystal growth stages in six batches of manual control experiments. (b) Comparison of the weight, moisture content, and purity parameters of crystal products obtained from each batch of crystallization experiments using manual and Raman control.
Processes 12 00774 g007
Figure 8. Variation curves of the intensity of the 7-ACT characteristic peak at 504 cm−1 and the acetonitrile characteristic peak at 914 cm−1 over time during the crystallization process controlled by online Raman monitoring.
Processes 12 00774 g008
Disclaimer/Publisher’s Note: The statements, opinions and data contained in all publications are solely those of the individual author(s) and contributor(s) and not of MDPI and/or the editor(s). MDPI and/or the editor(s) disclaim responsibility for any injury to people or property resulting from any ideas, methods, instructions or products referred to in the content.

