Article

Completion Performance Evaluation in Multilateral Wells Incorporating Single and Multiple Types of Flow Control Devices Using Grey Wolf Optimizer

1
Institute of GeoEnergy Engineering, Heriot-Watt University, Edinburgh EH14 4AS, UK
2
Department of Process, Energy and Environmental Technology, University of South-Eastern Norway, 3918 Porsgrunn, Norway
*
Author to whom correspondence should be addressed.
Processes 2024, 12(4), 785; https://doi.org/10.3390/pr12040785
Submission received: 19 March 2024 / Revised: 5 April 2024 / Accepted: 9 April 2024 / Published: 13 April 2024

Abstract

:
There has been a tendency in oil and gas industry towards the adoption of multilateral wells (MLWs) with completions that incorporate multiple types of flow control devices (FCDs). In this completion technique, passive inflow control devices (ICDs) or autonomous inflow control devices (AICDs) are positioned within the laterals, while interval control valves (ICVs) are installed at lateral junctions to regulate the overall flow from each lateral. While the outcomes observed in real field applications appear promising, the efficacy of this specific downhole completion combination has yet to undergo comparative testing against alternative completion methods that employ a singular flow control device type. Additionally, the design and current evaluations of such completions are predominantly based on analytical tools that overlook dynamic reservoir behavior, long-term production impacts, and the correlation effects among different devices. In this study, we explore the potential of integrating various types of flow control devices within multilateral wells, employing dynamic optimization process using numerical reservoir simulator while the Grey Wolf Optimizer (GWO) is used as optimization algorithm. The Egg benchmark reservoir model is utilized and developed with two dual-lateral wells. These wells serve as the foundation for implementing and testing 22 distinct completion cases considering single-type and multiple types of flow control devices under reactive and proactive management strategies. This comprehensive investigation aims to shed light on the advantages and limitations of these innovative completion methods in optimizing well and reservoir performance. Our findings revealed that the incorporation of multiple types of FCDs in multilateral well completions significantly enhance well performance and can surpass single-type completions including ICDs or AICDs. However, this enhancement depends on the type of the device implemented inside the lateral and the control strategy that is used to control the ICVs at the lateral junctions. The best performance of multiple-type FCD-based completion was achieved through combining AICDs with reactive ICVs which achieved around 75 million USD profit. This represents 42% and 22% increase in the objective function compared to single-type ICDs and AICDs installations, respectively. The optimal settings for ICD and AICD in individual applications may significantly differ from the optimal settings when combined with ICVs. This highlights a strong correlation between the different devices (control variables), proving that using either a common, simplified analytical, or a standard sequential optimization approach that do not explore this inter-dependence between devices would result in sub-optimal solutions in such completion cases. Notably, the ICV-based completion, where only ICVs are installed with lateral completion, demonstrated superior performance, particularly when ICVs are reactively controlled, resulting in an impressive 80 million USD NPV which represents 53% and 30% increase in the objective function compared to single-type ICDs and AICDs installations, respectively.

1. Introduction

The use of multilateral wells (MLWs) has significantly increased in recent years, largely attributed to their advantages over conventional wells. These multilateral wells enable the creation of multiple branches stemming from a single wellbore, resulting in enhanced access to the reservoir areas with remaining oil reserves, increased production rates, and decreased drilling costs (since less wells are needed to achieve the field target rate). Nevertheless, multilateral wells encounter specific challenges, such as uneven flow due to reservoir heterogeneity and heel-to-toe effect. These challenges can lead to premature breakthroughs of undesirable fluids, ultimately diminishing the well/reservoir performance [1]. To address these issues, FCDs are utilized to manage fluid flow rates from various well zones, maintain consistent pressure profiles along the wellbore branches, and equalize inflow [2].
Essentially, there are three basic types of flow control devices (FCDs): inflow control devices (ICDs), autonomous inflow control devices (AICDs) and interval control valves (ICVs). The ICDs are specifically designed for the purpose of regulating fluid inflow in oil and gas wells. This regulation is accomplished by introducing additional pressure drop. There are two main common types of ICDs: (1) Channel-style ICDs (more viscosity-dependent), relying on friction force generated as the fluid flows through specialized pathways such as Spiral-type ICD, as shown in Figure 1a. (2) Restriction-style ICDs (more density-dependent), relying on restriction force resulting from the fluid’s passage through nozzles or slots such as Nozzle-type ICD, as shown in Figure 1b [3]. It is important to note that ICDs are passive devices, meaning their settings cannot be altered once they are installed in wells. Therefore, ensuring their optimal performance and preventing any adverse impact on well performance requires extensive experience and in-depth knowledge of well and reservoir characteristics.
AICDs on the other hand, offer a more dynamic and flexible performance. These devices have the ability to alter their performance based on fluid properties, allowing them to selectively control the flow of undesired fluids by inducing additional pressure drops after the breakthrough. There are two types of AICDs: (1) fluidic diode AICD (FD-AICD), a more density-sensitive device which operates without any mechanical components and utilizes a unique flow channel design to manage fluid flow, as shown in Figure 1c [9]. (2) rate-controlled production AICD (RCP-AICD) which incorporates a floating disk works under Bernoulli’s principle to control production from a nozzle via floating disk based on the fluid viscosity, as shown in Figure 1d [10]. The RCP-AICD is later developed to autonomous inflow control valve (AICV) which effectively restrict the flow of undesired fluids by diverting around 3% of the AICVs flow through a spiral pilot flow path (Figure 1e) [11].
ICVs, as depicted in Figure 1f, are active surface-controlled devices that enables operators to exercise precise control over individual zones and execute adaptable production management [12]. ICVs can be employed with two distinct reservoir control strategies, namely: reactive and proactive strategies. In the reactive strategy, ICVs are adjusted according to the existing reservoir and well-operating parameters, including factors such as water cut or gas oil ratio [13,14,15,16,17,18,19,20,21,22]. The proactive strategy, on the other hand, aims to optimize long-term objectives by proactively delaying future water/gas breakthroughs and, in general, optimizing the in-reservoir flood fronts [23,24,25,26,27,28,29,30]. A reliable reservoir model (or an ensemble of model realizations) is needed for production forecasting and proactive planning, and therefore reservoir description uncertainties need to be considered accurately in this approach.
To fully maximize the advantages of ICVs, continuous downhole monitoring using permanent downhole gauges (PDGs) is essential for effectively managing these valves to control the flow from different zones or branches. Collected data can then be transmitted via an electrical umbilical, also known as a tubing encased conductor (TEC), to supervisory control and data acquisition (SCADA) system. The operator can then change the ICV settings using telemetry which is ranging from full hydraulics (the most used), electro-hydraulics, and full electric to wireless. Completing multilateral wells with such sophisticated completion system (ICVs, TEC, SCADA and telemetry) becomes prohibitively expensive in terms of both capital expenditure (CAPEX) and ongoing operational expenses (OPEX). Moreover, the system has 10% failure rate after ten years of operating [31]. There are some attempts to reduce the cost associated with ICV-base completions by developing new integrated completion systems such as ManaraTM [32], MultiNodeTM [33] and PulseEightTM [34]. These advanced completion systems offer real-time measurements of pressure, temperature, flow rate, and water content within each production zone. The ManaraTM and MultiNodeTM completion systems use an electric-motor-driven, infinitely variable position interval control valve, and an integrated downhole monitoring package per zone as well as a single control line that minimizes the need for wellhead penetrations aiming at reducing completion cost and enhancing production control. The PulseEightTM completion system employs pressure pulse telemetry to facilitate wireless communication between the downhole monitoring and control system of a well and the surface. While there have been noteworthy advancements in well completion technologies, it is worth noting that the capital and operational expenses linked to these newly integrated completion systems still remain relatively high and the failure rate in real-world scenarios has not been reported. Furthermore, the applications of these technologies are limited to a certain number of production zones, for example, MultiNodeTM is limited to 27 production zones)
One possible way to reduce risk and cost is by integrating various types of flow control devices into multilateral well completion. In this completion type, only a limited number of expensive interval control valves (ICVs), equivalent to the number of well branches, are placed at the lateral junctions. A monitoring package per ICV is installed to monitor and control the flow from each branch. At the same time, multiple passive or autonomous inflow control devices, which are relatively cheaper and have lower risk of failure, are positioned within the lateral branches in compartmented production zones to delay the onset of undesirable fluid breakthrough. This integration serves two primary objectives: (1) reduce capital and operational costs associated with ICVs-based completions by reducing the number of zonal ICVs, TECs, and PDGs. (2) Enhance control over zonal production in comparison to completion scenarios where laterals are kept open hole or completed with just single-type FCDs such as only passive or only autonomous flow control devices. Several successful real-world applications of well completions incorporating multiple types of flow control devices have been reported worldwide e.g., [35,36,37,38,39,40].
Despite the fast-growing adaptation of well completion designs with multiple types of FCDs, there is a lack of comprehensive studies to evaluate and optimize the dynamic performance of this type of completion. This can be due to the complexity of the objective function arising from the large number of inter-depended control parameters by combining various types of flow control devices. This led the industry to adopt a simplified, loosely coupled approach where ICDs or AICDs are designed separately and often in steady-state using analytical tools such as NEToolTM [41], followed by dynamic optimization of ICVs using an optimization algorithm coupled with a reservoir simulator. While this approach reduces computational costs, it overlooks the dynamic reservoir behavior, the long-term impact of combination of devices on production profiles, and the correlation between control variables, leading to suboptimal solutions. In addressing these limitations, our earlier efforts focused on simultaneously optimizing both ICDs and ICVs through a hybrid optimization framework. This initiative aimed to enhance and expedite the optimization process of completion designs in multilateral wells integrating various types of flow control devices [42,43]. Nevertheless, our attention was confined to a specific completion type, specifically those featuring ICDs implemented within laterals and proactive ICVs at lateral junctions.
In this study, the primary objective is to assess the efficiency of having multiple types of flow control devices within well completions in multilateral wells (i.e., interval control valves with passive or autonomous flow control devices) under reactive and proactive control strategies. A comparative analysis is also conducted between these types of well completion and the ones equipped with single-type flow control devices. To accomplish this, we have integrated a dynamic reservoir simulator with the grey wolf optimizer to find the optimal control settings for each completion case and their corresponding net present values. We perform simultaneous dynamic optimization where all control variables (FCDs) are optimized together to account for the interaction effects between all of the devices.

2. Problem Formulation

We aimed to conduct a thorough examination and comparison of all potential completion scenarios, all within the contexts of reactive and proactive reservoir management strategies. A dynamic optimization approach is employed to determine the optimal FCD settings in MLWs for each completion scenario to maximize the net present value (NPV) as the objective function outlined in Equation (1):
J x R N x = n = 1 s j = 1 N p r r o q o , j n r p w q w , j n I w = 1 N I c w i q w i , k n   δ t n 1 + b t n
where x represents the dimensional vector of the decision parameters; s is the number of simulation steps; N p r represents the number of producers, while N I denotes the number of injectors. r o , stands for the crude oil price, r p w represents water handling cost, and c w i denotes the water injection cost, all measured in USD/m3. The variables q o , j n and q w , j n denote the oil and water production rates of well j at time step n in m3/day, while q w i , k n represent the water injection rate of well I w in m3/day. δ t n indicates the duration of the n t h simulation step in days; t n is the simulation time (in years); and b is the annual discount rate. The objective function is evaluated using CMG-IMEX [44], a numerical reservoir simulator. Economic values for NPV calculations are summarized in Table 1.

2.1. Grey Wolf Optimizer

Grey Wolf Optimizer (GWO) is a population-based optimization algorithm, drawing inspiration from the social structure and hunting dynamics observed in the behavior of grey wolves in nature [45]. We choose this optimizer based on its outstanding performance and its successful implementation in addressing optimization challenges within the oil industry. Its successful applications include production optimization under water flooding [46], well placement optimization [47], optimizing passive inflow control devices configurations in CO2 projects [48], optimization of water alternating gas projects (WAG) [49] and fractures detection [50]. Grey wolves, being apex predators, occupy the topmost level of the food chain. They tend to favour group living, with packs typically ranging from 5 to 12 individuals. Within these packs, a clear social dominance hierarchy prevails, guiding interactions among the members. In this hierarchy as shown in Figure 2, four distinct roles are identified: the alpha (α) wolf, commanding the dominant position; the beta (β) wolves, functioning as supportive subordinates to the alpha and potential successors to the alpha role; the delta (δ) wolves, exhibiting submission to both the alpha and beta members; and the omega (ω) wolves, occupying the lowest tier, often considered scapegoats in the pack and having the last opportunity to eat. Grey wolves exhibit a systematic hunting strategy characterized by distinct phases. They begin by tracking, chasing, and gradually approaching their prey. As the pursuit escalates, they employ teamwork to encircle the prey until it ceases movement. The final and decisive phase involves a coordinated attack on the immobilized prey, securing their sustenance.
The social hierarchy and hunting strategies (including encircling prey, hunting, attacking prey and search for prey) of grey wolves are mathematically modelled as follows:

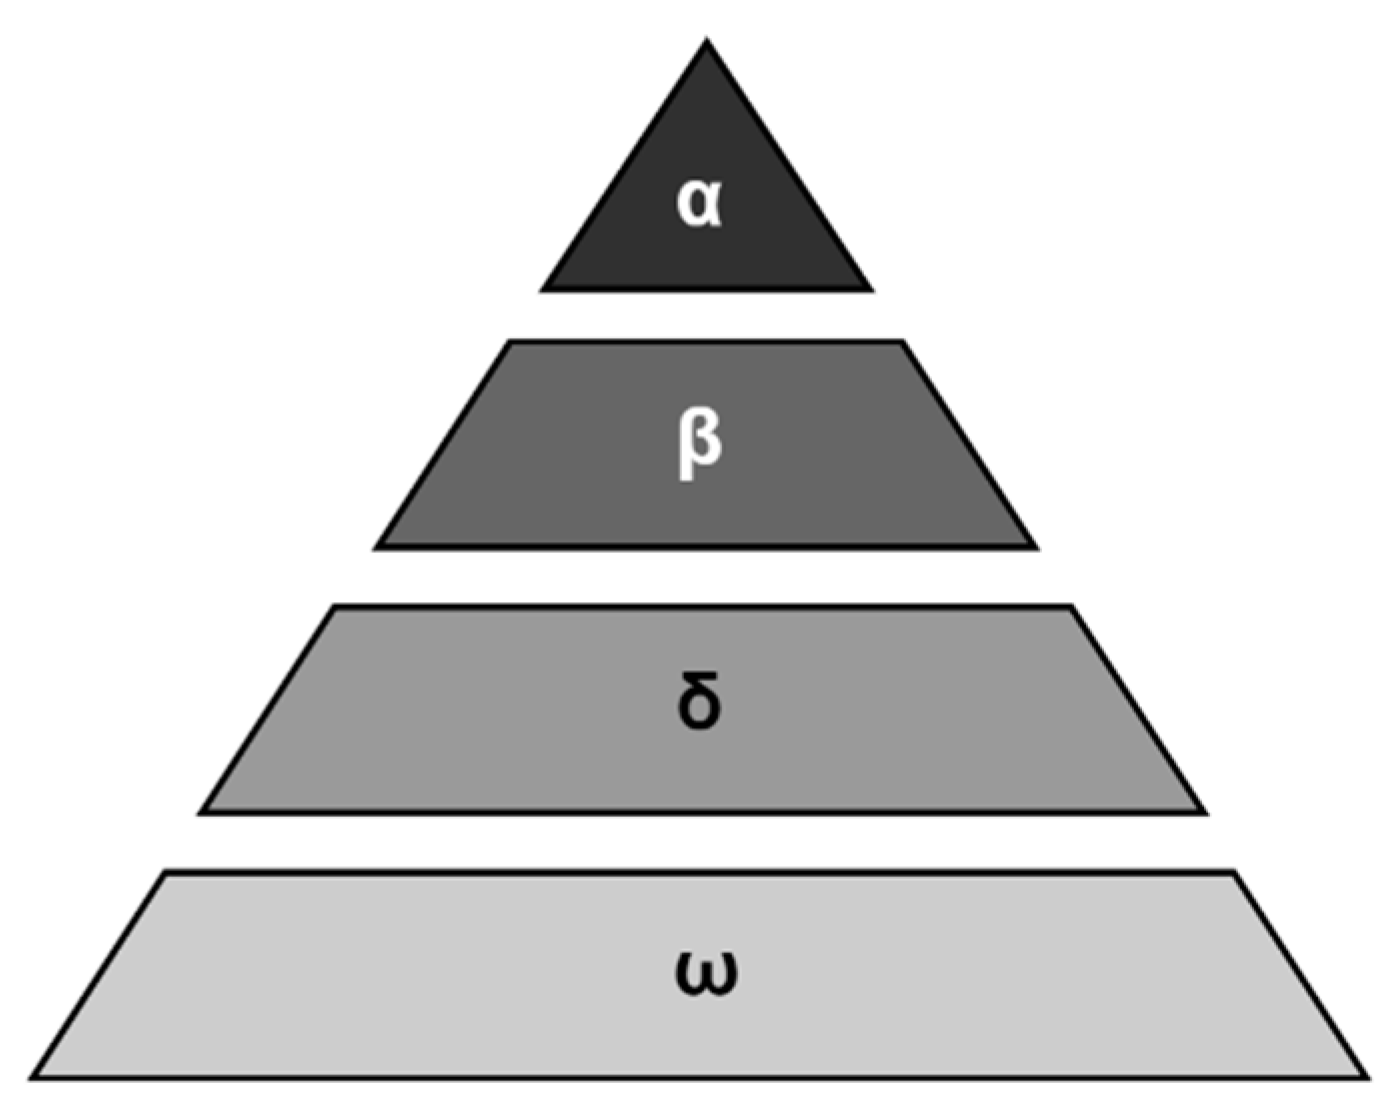
2.1.1. Social Hierarchy

  • The Alpha wolf (α) represents the optimum solution.
  • The Beta wolf (β), representing the second-best solution.
  • The Delta wolf (δ) is the third-best solution.
  • All remaining candidate solutions are designated as Omega wolves (ω).

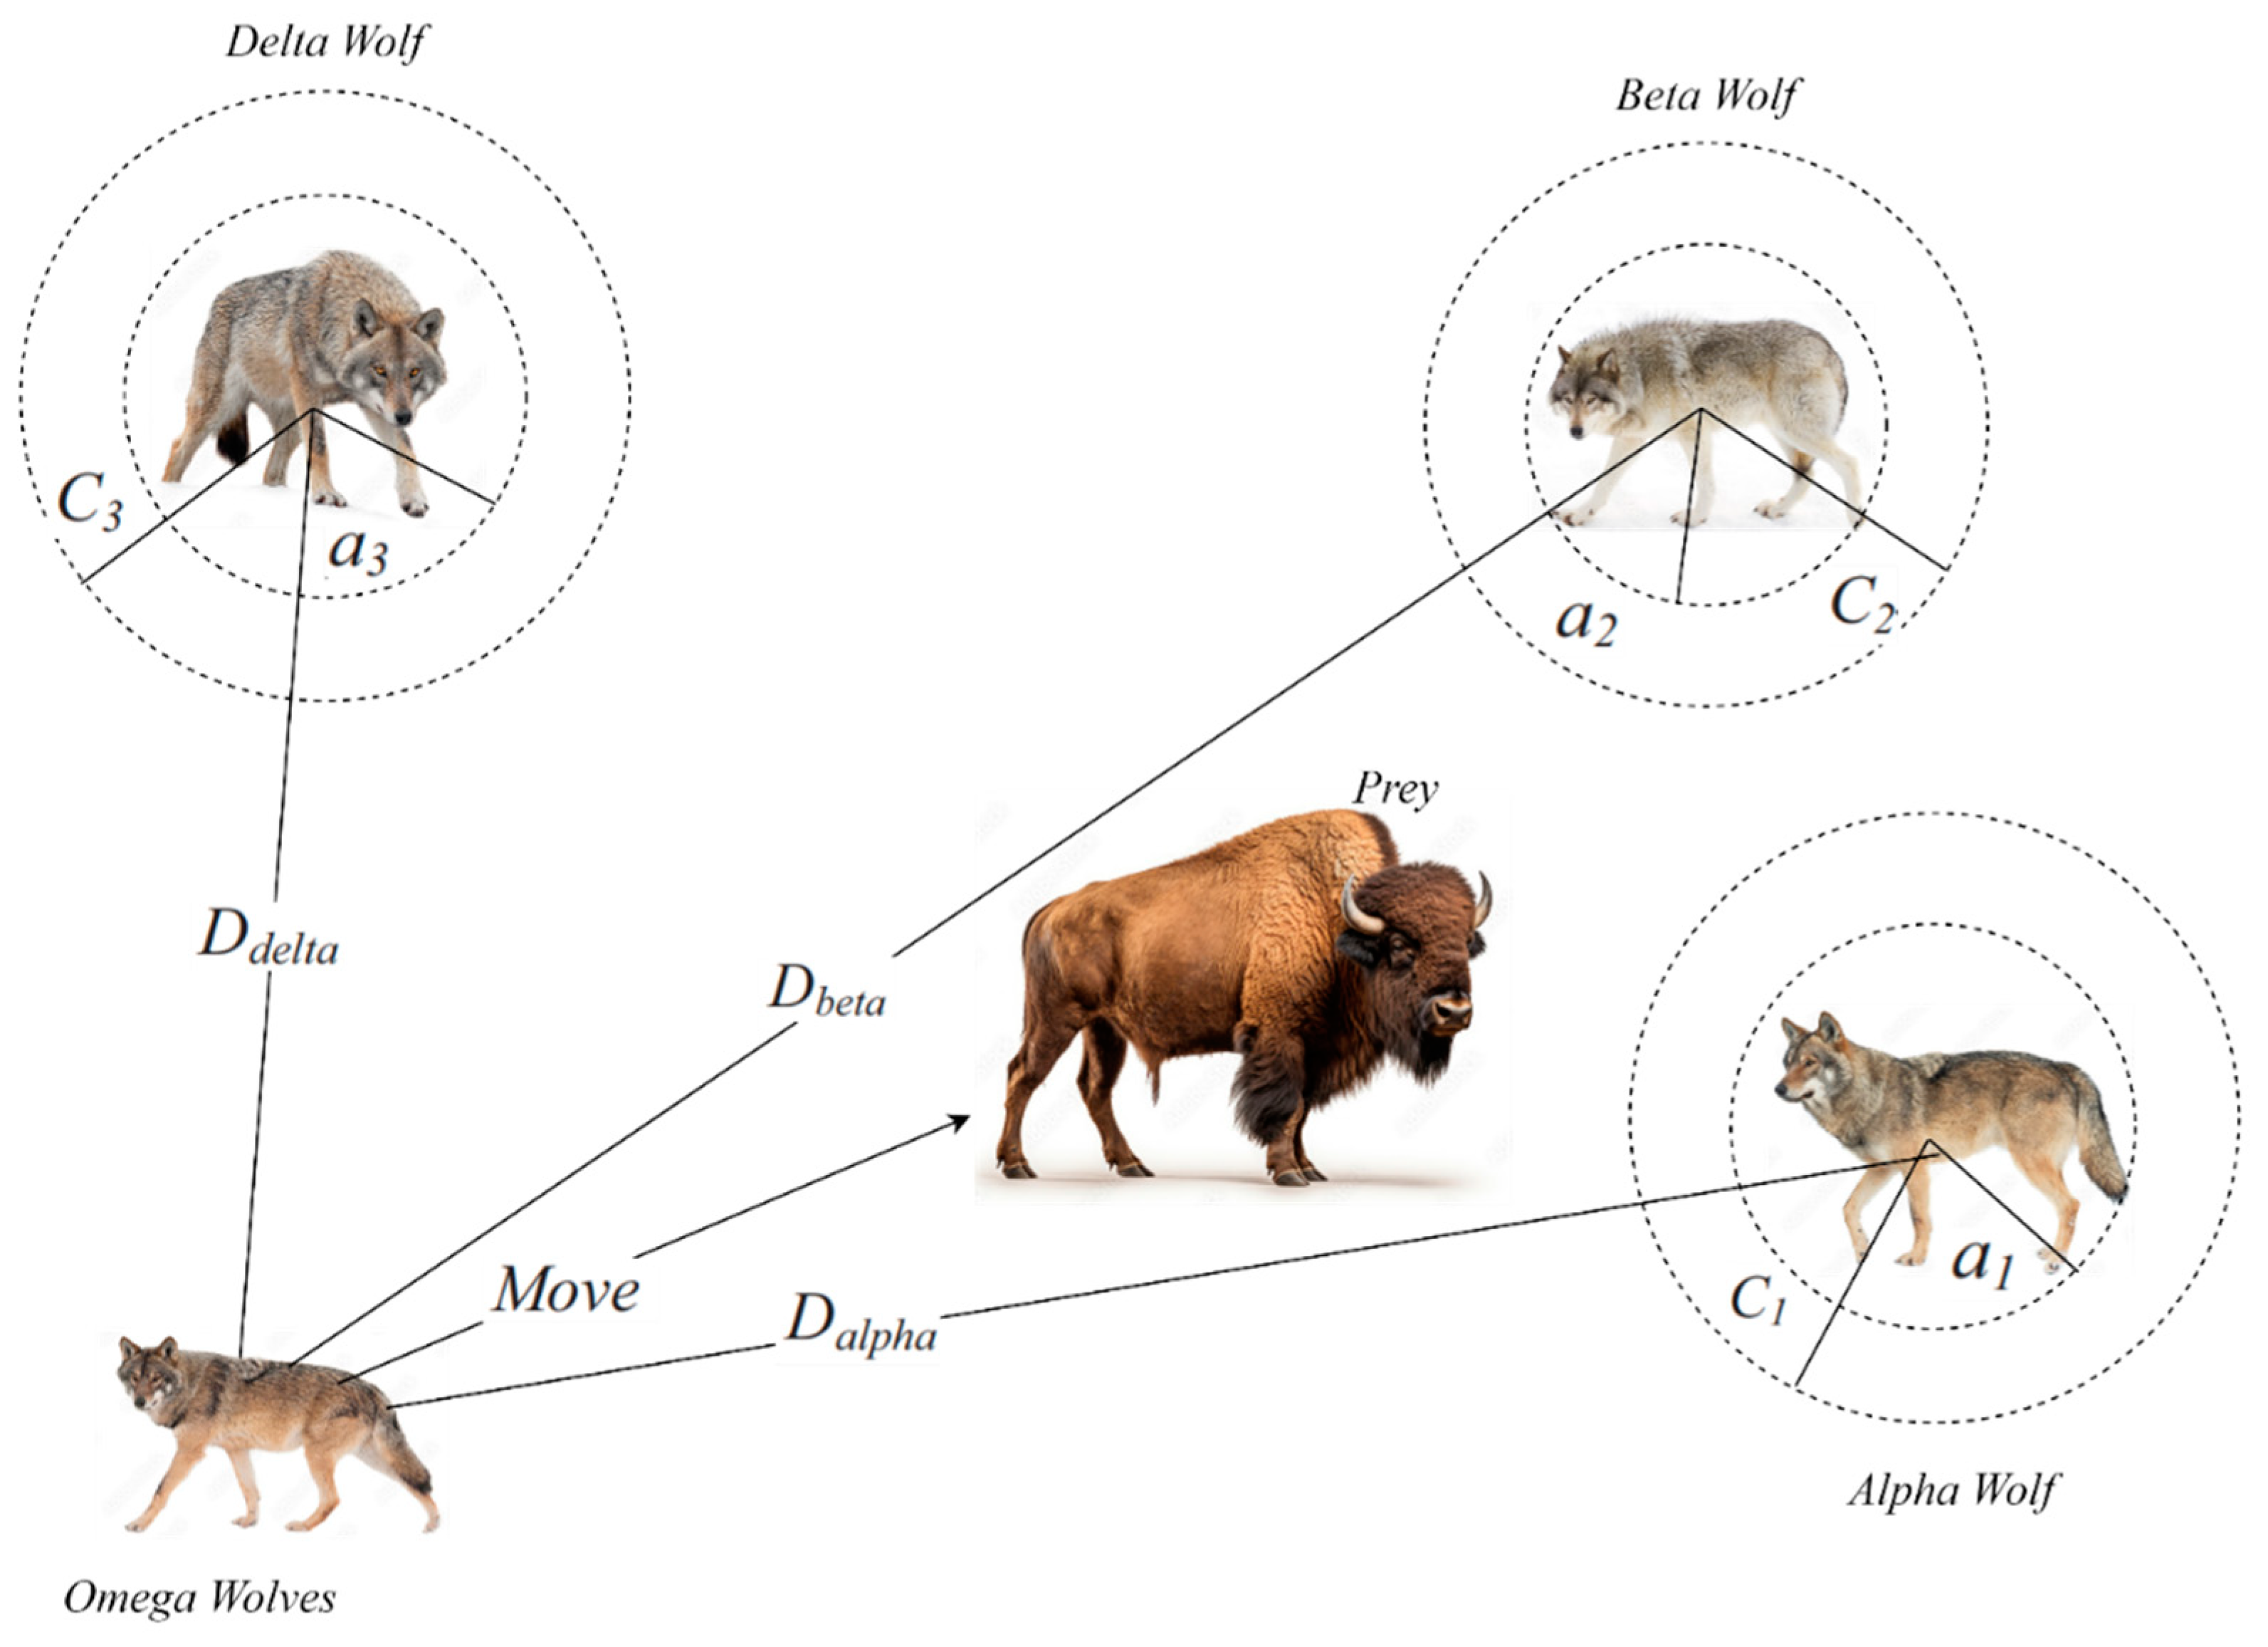
2.1.2. Encircling Prey

The following set of equations are utilized to mathematically model the encircling of a prey.
D = C · X p t X ( t )
X ( t + 1 ) = X p t A · D
where D represents the updated position vector, t is the current iteration, A and C stand for coefficient vectors, X p denotes the prey’s position vector, and X indicates the position vector of a grey wolf. The determination of vectors A and C is carried out through the following calculations:
A = 2 a · r 1 a
C = 2 · r 2
The elements of vector a are progressively decreased in a linear fashion from 2 to 0 throughout the iterations. Additionally, r 1 and r 2 represent random vectors within the range [0, 1].

2.1.3. Hunting

To better emulate the hunting pattern of grey wolves mathematically, it is postulated that the alpha (the best candidate solution), beta, and delta possess more precise knowledge about potential prey locations. Consequently, the top three best solutions acquired thus far are retained, obligating all other search agents, including the omegas, to adjust their positions based on those of the top search agents. The following formulas are suggested for this purpose:
D α = C 1 · X α X ,       D β = C 2 · X β X ,       D δ = C 3 · X δ X
X 1 = X α A 1 · D α ,       X 2 = X β A 2 · D β ,       X 3 = X δ A 3 · D δ ,
X t + 1 = X 1 + X 2 + X 3 3

2.1.4. Attacking Prey (Exploitation)

When the movement of the prey is halted, the hunting process is completed by the grey wolf through the initiation of an attack. To mathematically model this, the value of vector a is decreased. The vector A is a random variable falling within the interval of [−2 a , 2 a ], with the parameter a being reduced from 2 to 0 over the course of iterations. When the absolute value of A is less than 1, the wolves are compelled to engage in exploiting the prey, highlighting an exploitative hunting strategy.

2.1.5. Search for Prey (Exploration)

When the absolute value of A exceeds 1, it compels the grey wolves to move away from the prey, with the hope of discovering a more suitable target (exploration). Another aspect of GWO that promotes exploration is represented by vector C . This vector encompasses random values within the range [0, 2]. When C surpasses 1, it accentuates the attack, while the values of C below 1 de-emphasize the attack, contributing to the exploration aspect of the algorithm.
Figure 3 illustrates how each wolf updates its position in the GWO based on the previous equations. Appendix A shows the pseudocode of the GWO algorithm used in this study.

3. Modelling of Advanced Wells

In this study, the iSegWellTM module in CMG-IMEX is employed to model advanced well completion. using the concept of multi-segmented well (MSW) [51].

3.1. ICV Modelling and Control

The pressure drop through an ICV is determined using Equation (9) modelled using *VALVE *SUBCRIT keyword.
P c o n s t r i c t i o n = 1 2 ρ L i q u i d q L i q u i d A C 2 + ρ g a s q g a s A C 2 × f l o w c o e f f
where ρ L i q u i d and ρ g a s are density of the liquid and gas in kg/m3, respectively; q L i q u i d and q g a s are the volumetric flow rate for liquid and gas in m3/min, respectively. A C is the valve constriction flow area in cm2. f l o w c o e f f is a no-negative dimensionless factor calculated as follows: f l o w c o e f f = 1 A C / A p 2 ; where A p is the cross-section area of the production pipe in cm2. The ICV setting is controlled through the *TS-EQSETTING keyword by assigning a value ranging from 0 to 1 which indicates shut-in and fully open modes for the ICV, respectively. In reactive control of the ICV, the *TRIGGER keyword is employed to activate or adjust the ICV when specific local conditions are met, such as when the water cut exceeds a predefined threshold value. Monitoring the local water cut is achieved through local monitor points implemented via *SGMON-TSPT or *SGMON-WBPT keywords. For proactive control (timely adjustments) of the ICV, the *TS-EQSETTING keyword is reiterated at specific time intervals to indicate changes in the ICV setting.

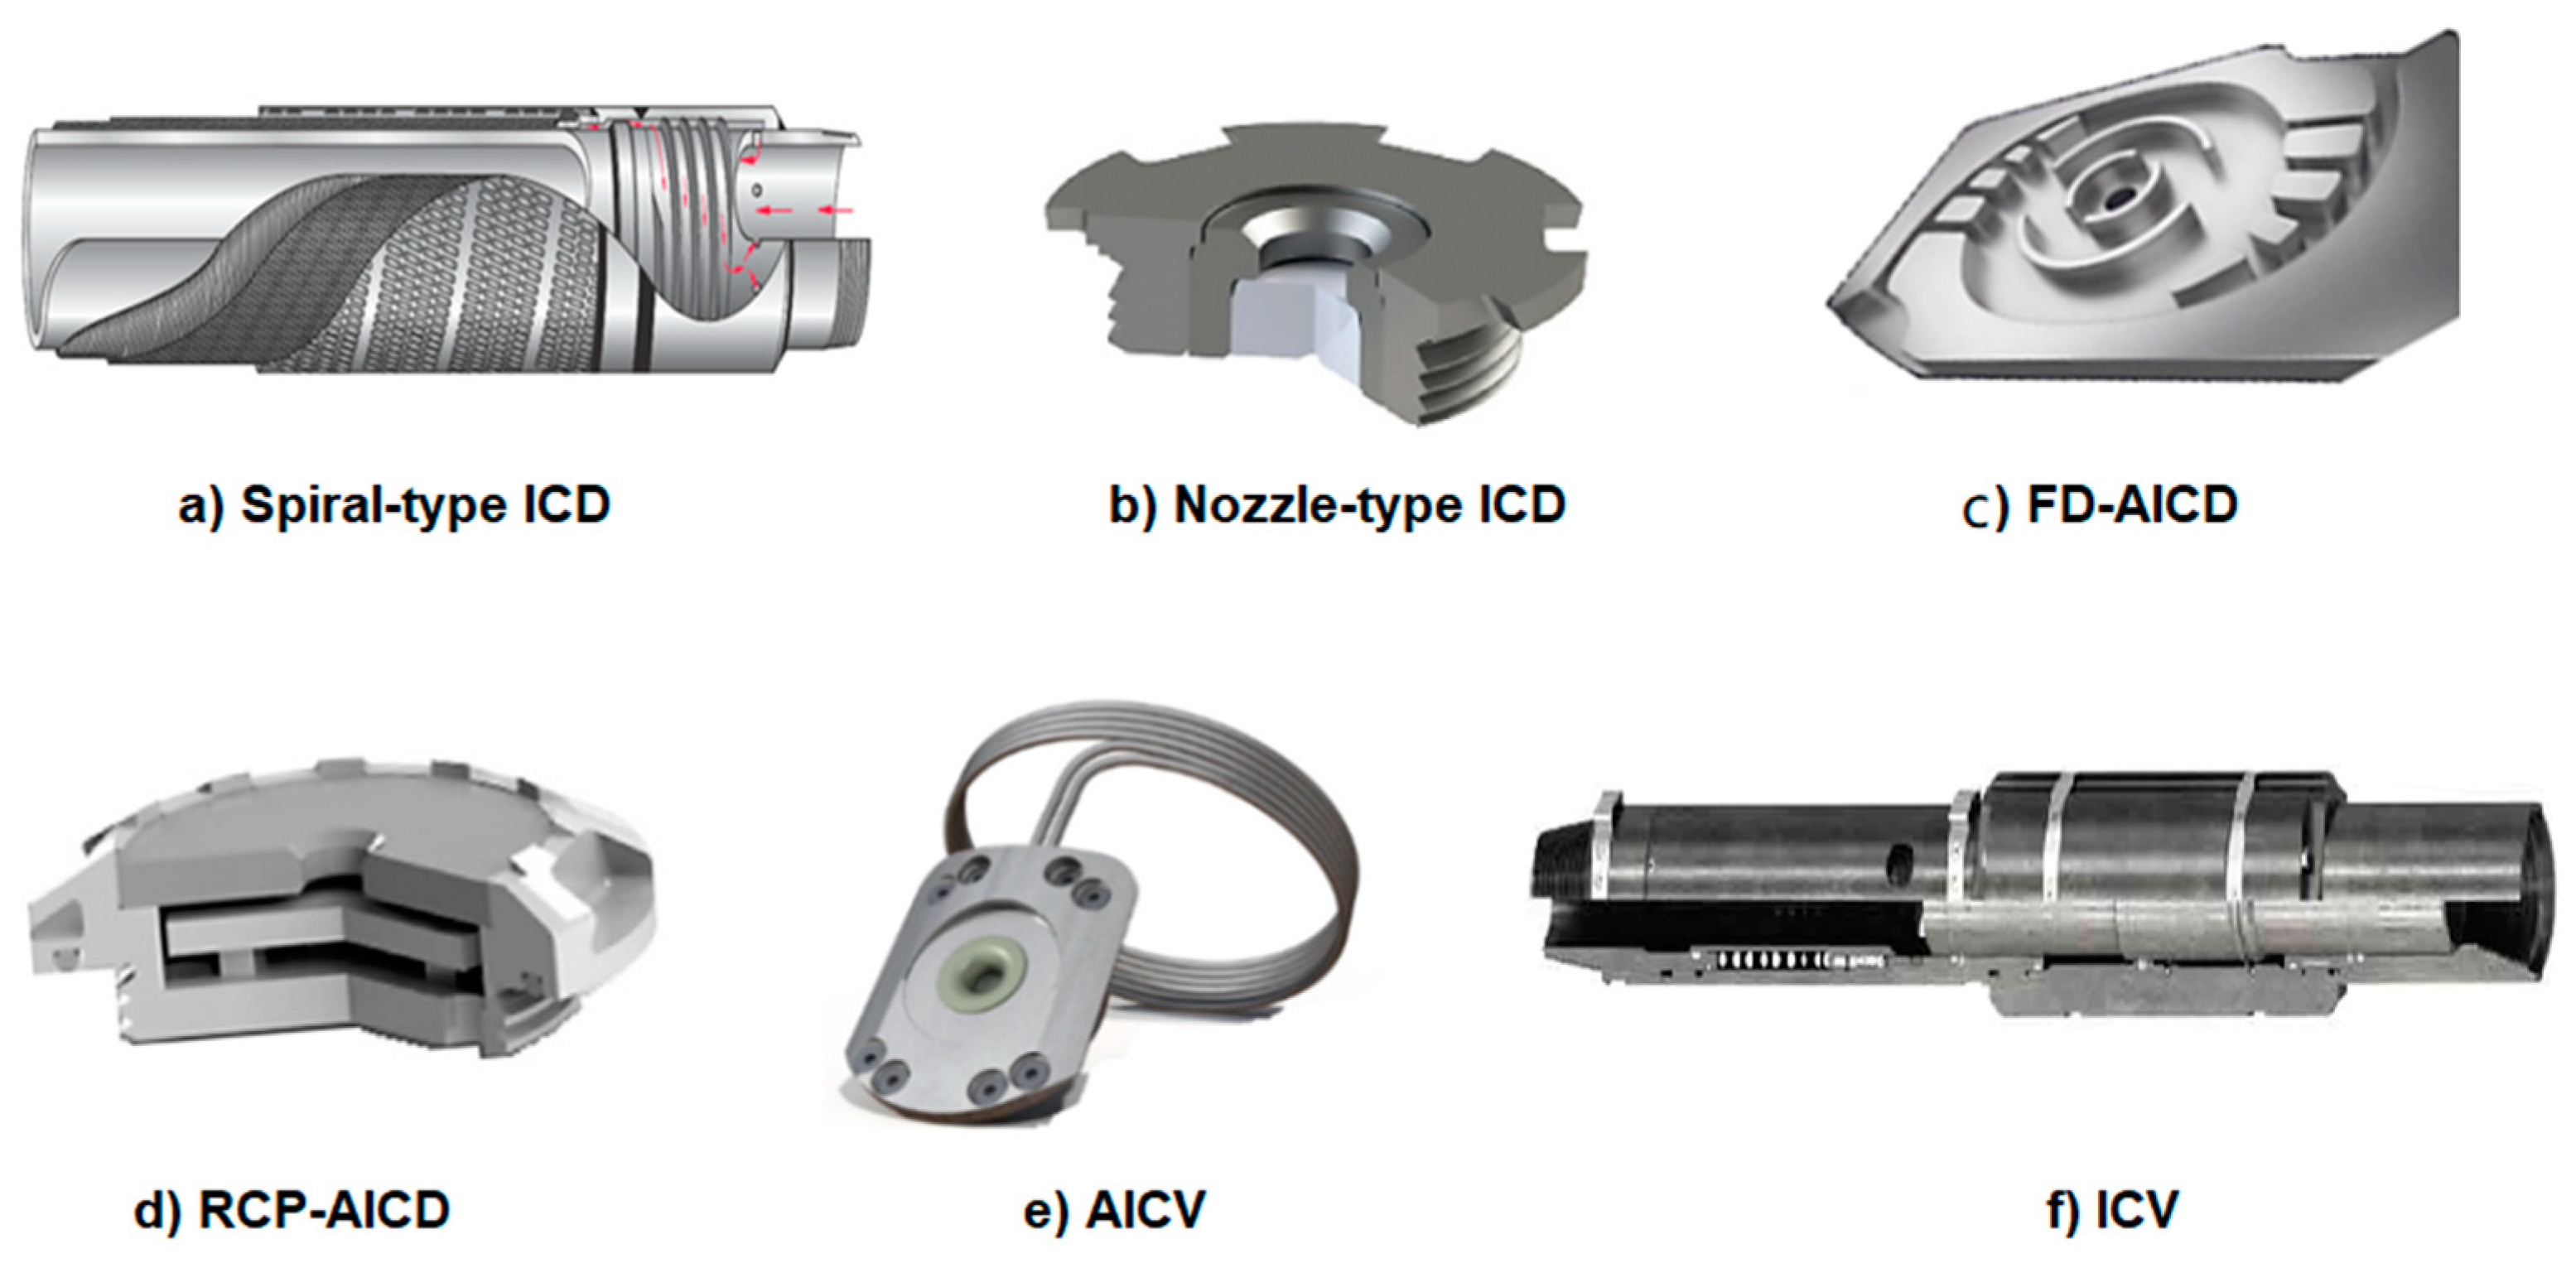
3.2. ICD/AICD Modelling

In iSegWell module, *SPIRAL keyword can be used for pressure drop calculation through passive and autonomous inflow control devices to represent both spiral-ICD and RCP-AICD. The following equation is used to model both devices:
P = ρ m i x m ρ c a l n · μ c a l μ m i x y · a I C D · q t x
where ρ m i x and ρ c a l are density of the mixture and density of the calibration fluid, respectively, in kg/m3. μ c a l and μ m i x are viscosity of the calibrating fluid and viscosity of mixture, respectively, in centipoise. a I C D is the strength of the ICD or AICD device in [kPa/((kg/m3) (mn) (m3/day)x)]. q t is the total volumetric flow rate in (m3/day). x and y are the power value of total fluid rate and the power value of viscosity ratio, respectively. m is the power value of mixture density and n is the power value of calibrating fluid density. The *TS-EQSETTING keyword is used to control both ICDs and AICDs by assigning a value ranging infinitely from 0.01 to 1 reflecting a restrictive FCD and a non-restrictive i.e., ‘fully open’ FCD, respectively.

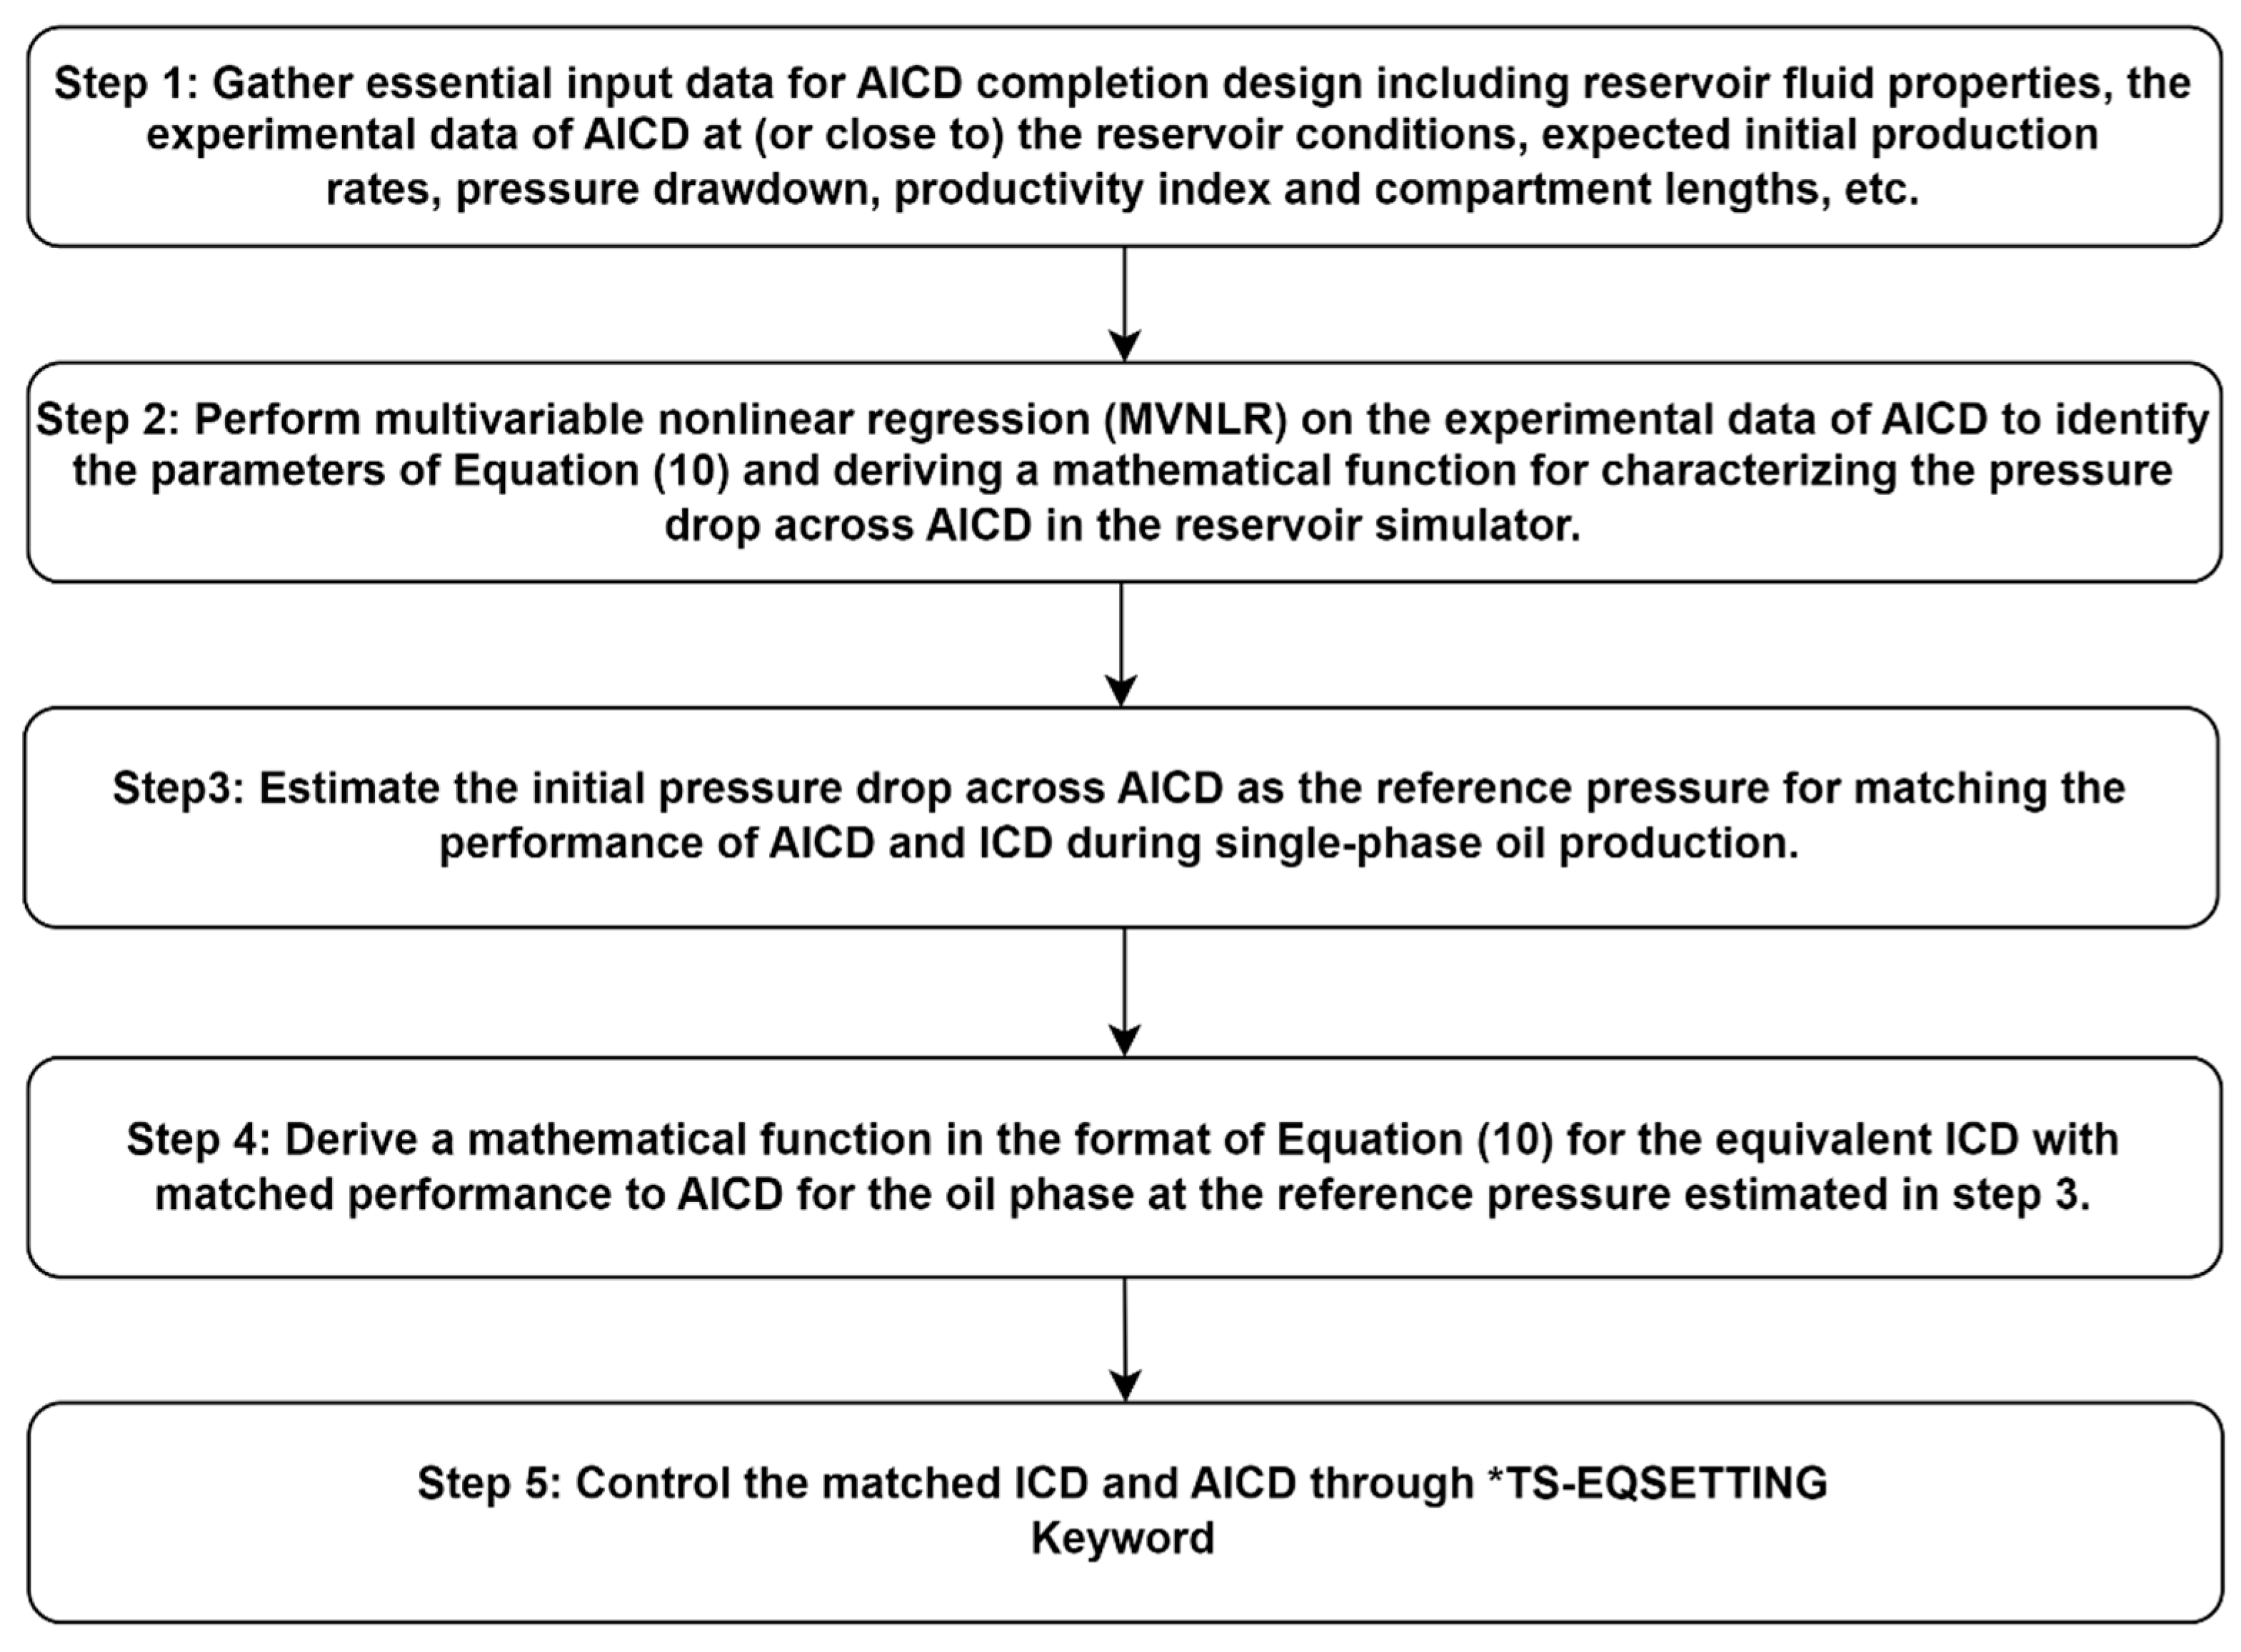
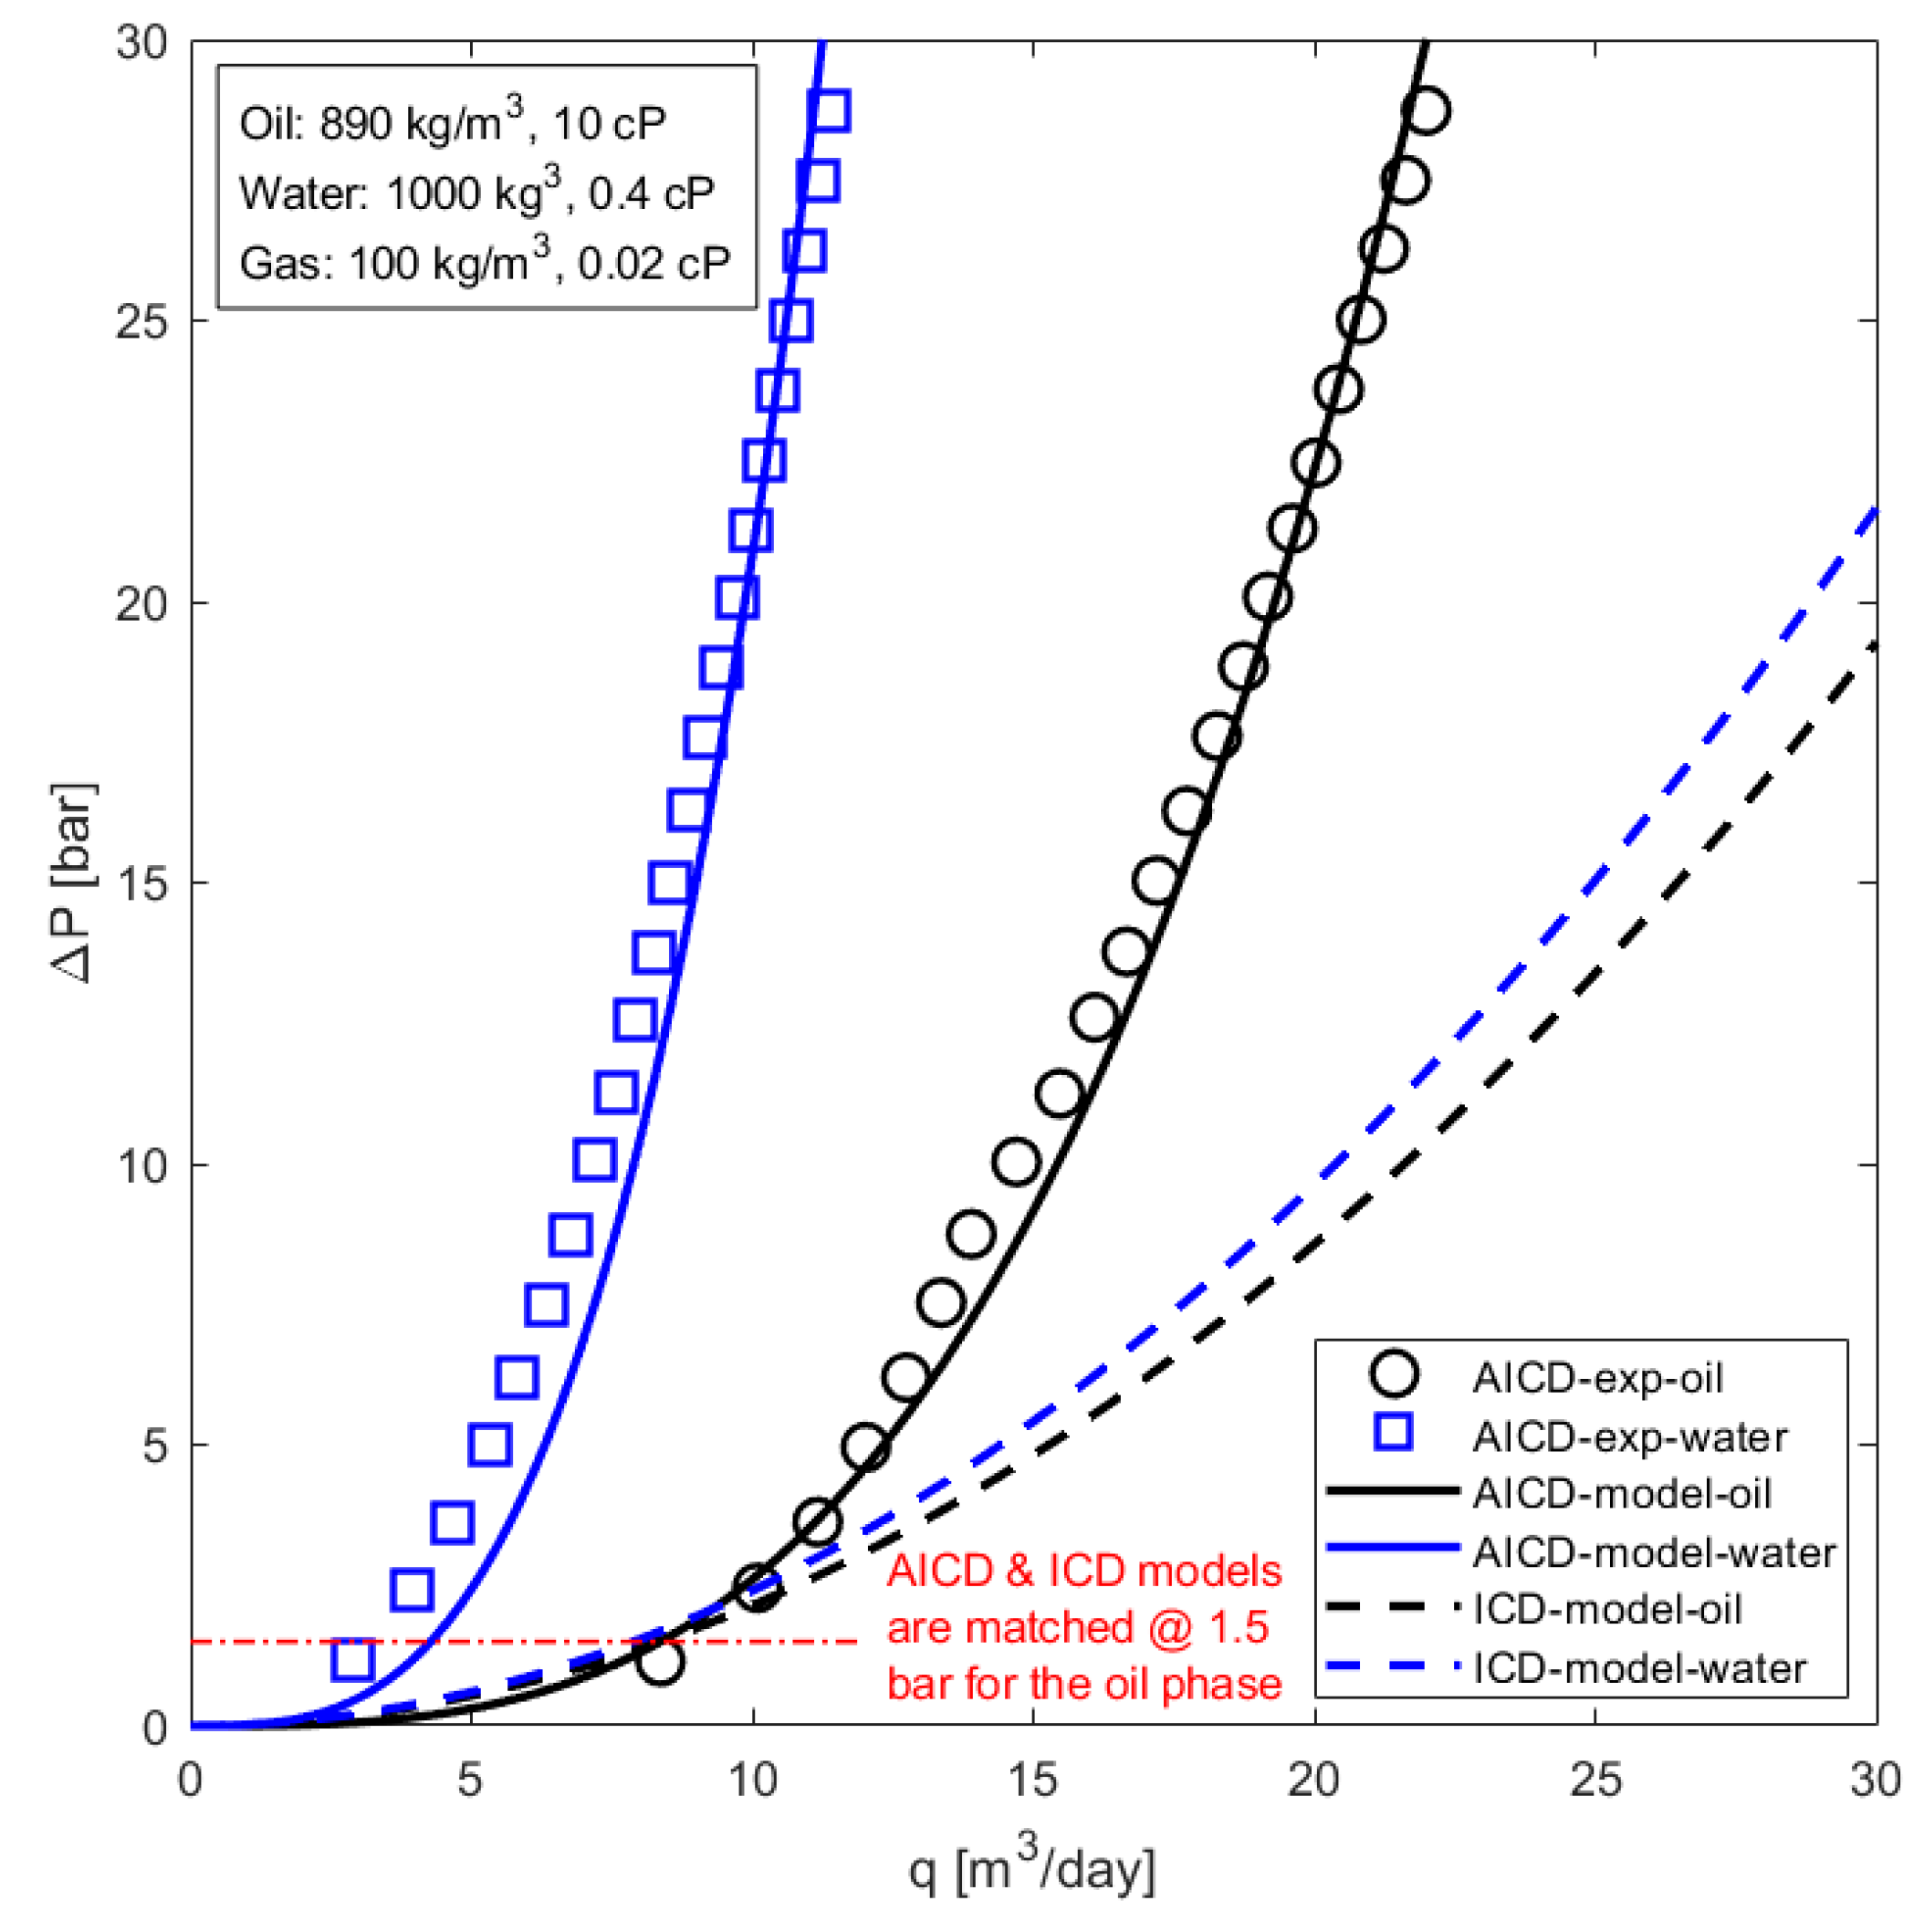
3.3. Matching ICD and AICD Performance before Breakthrough
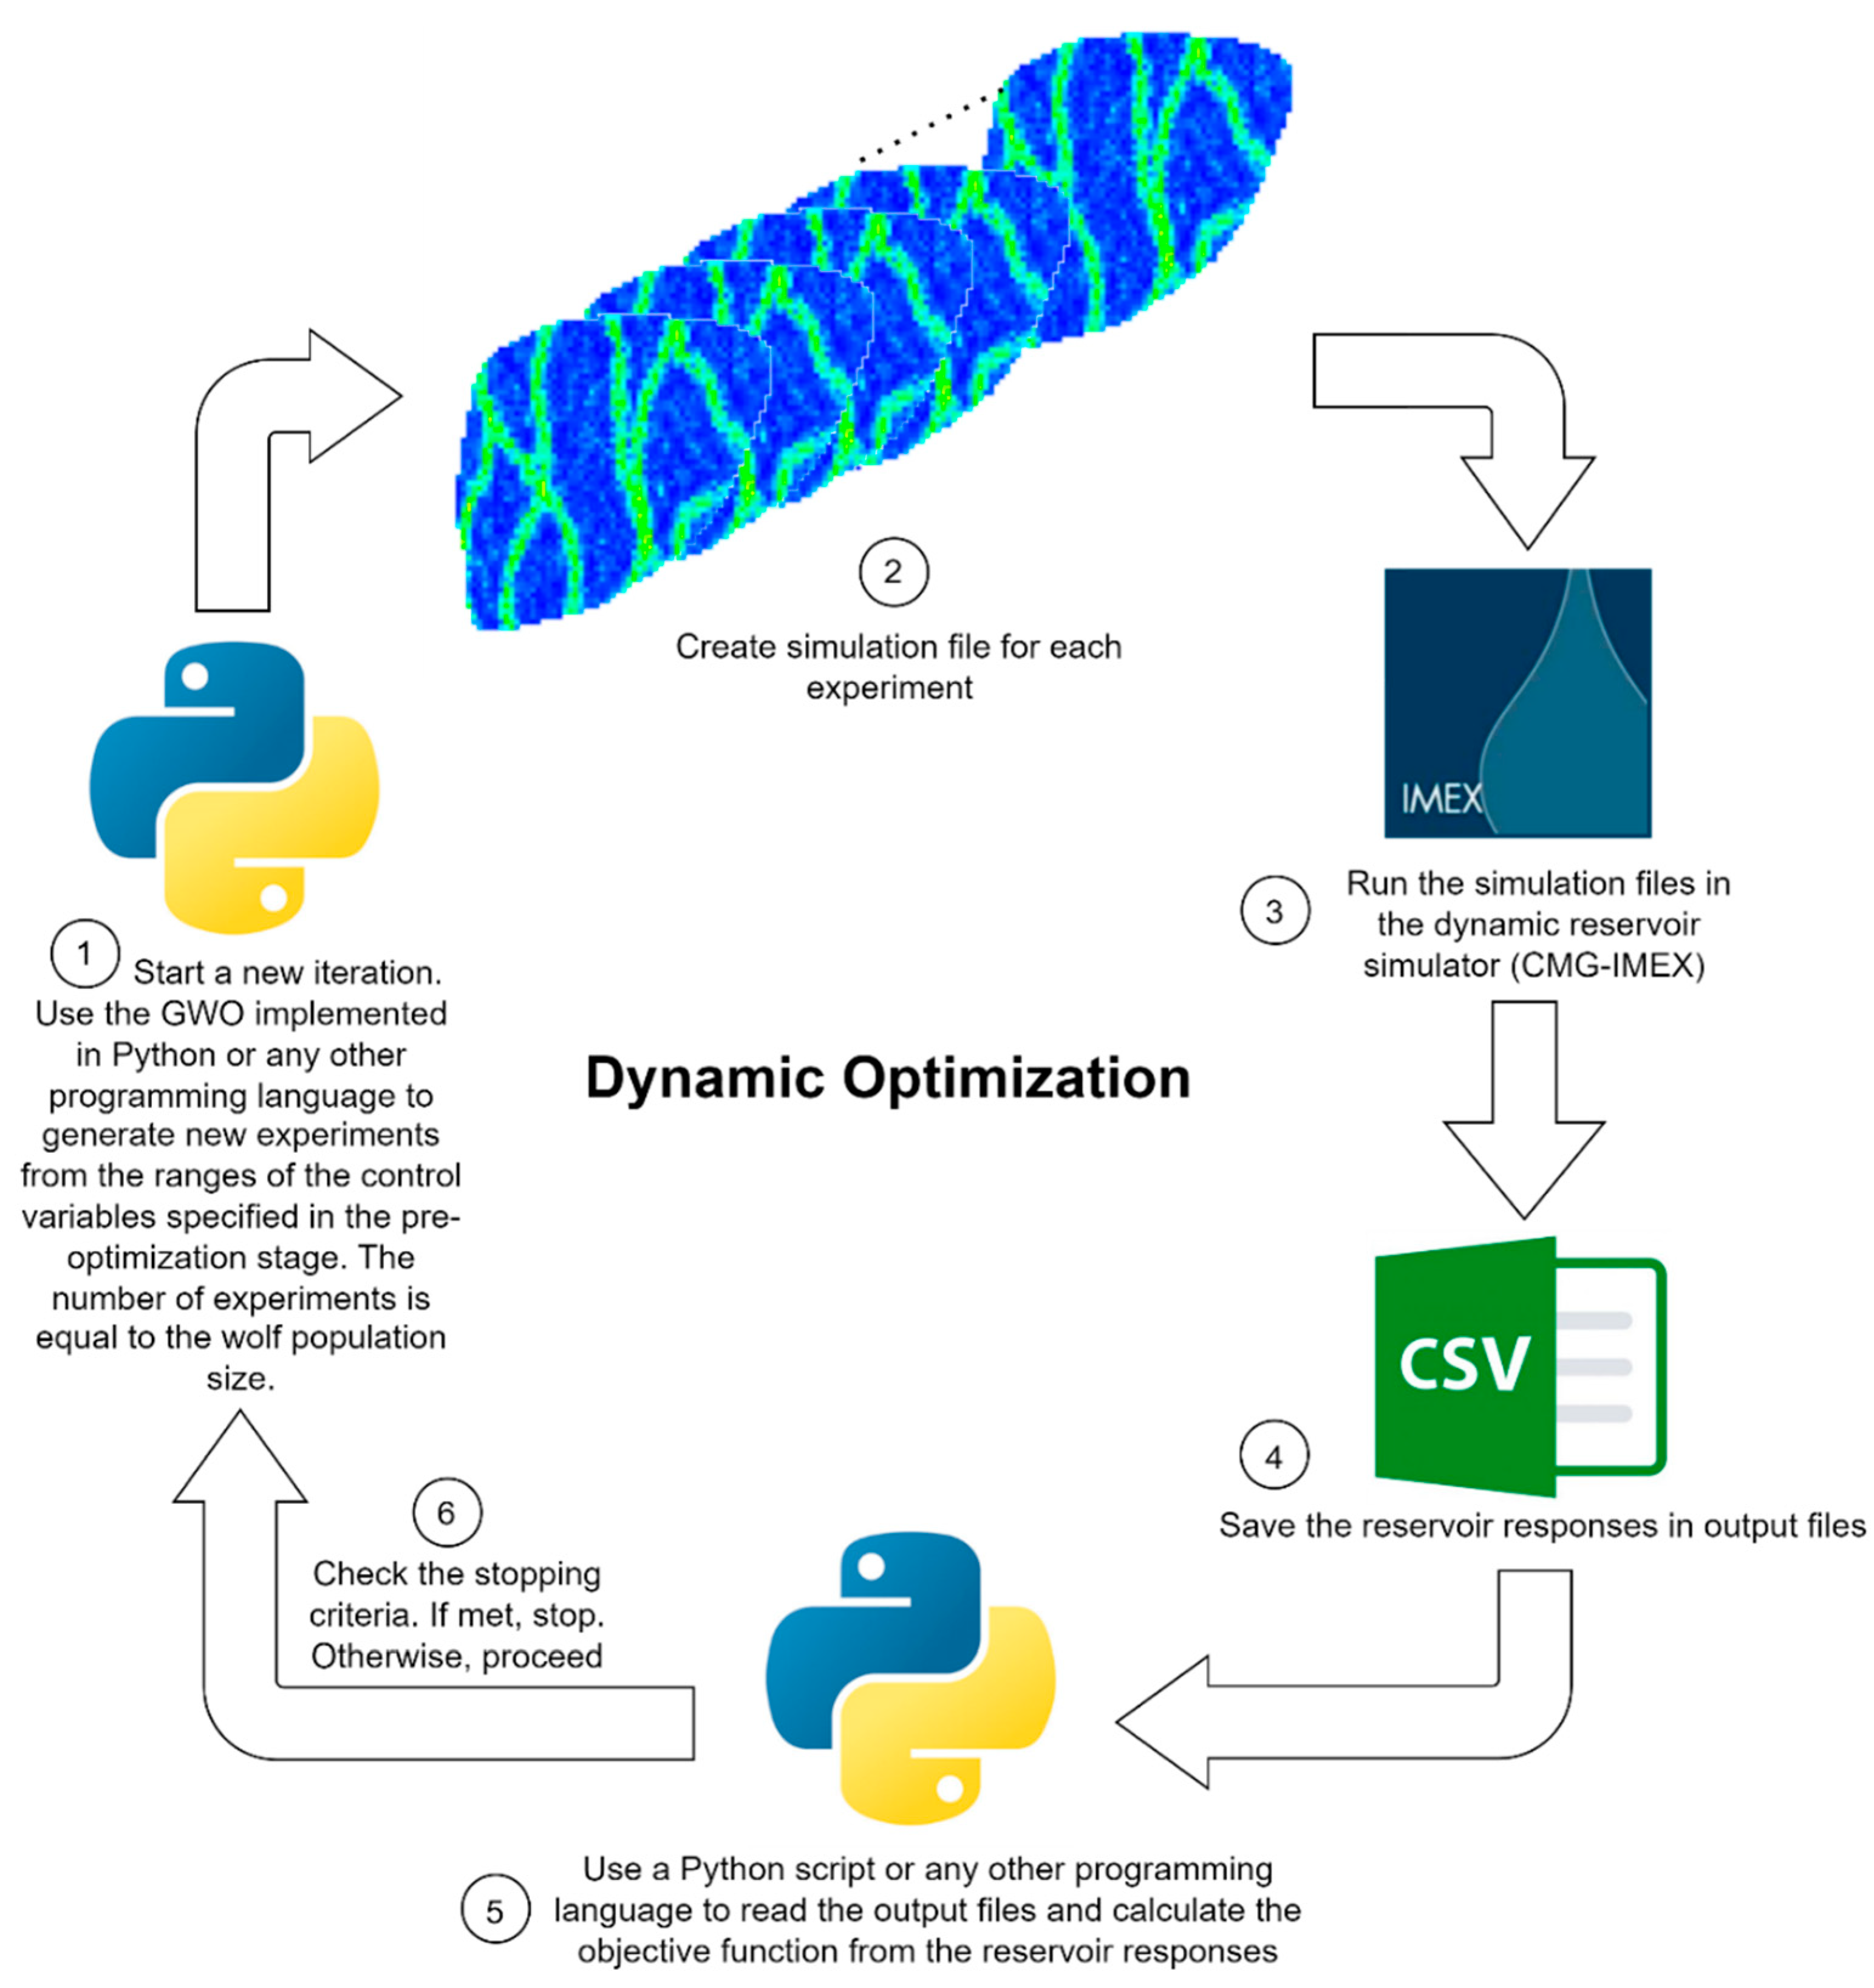
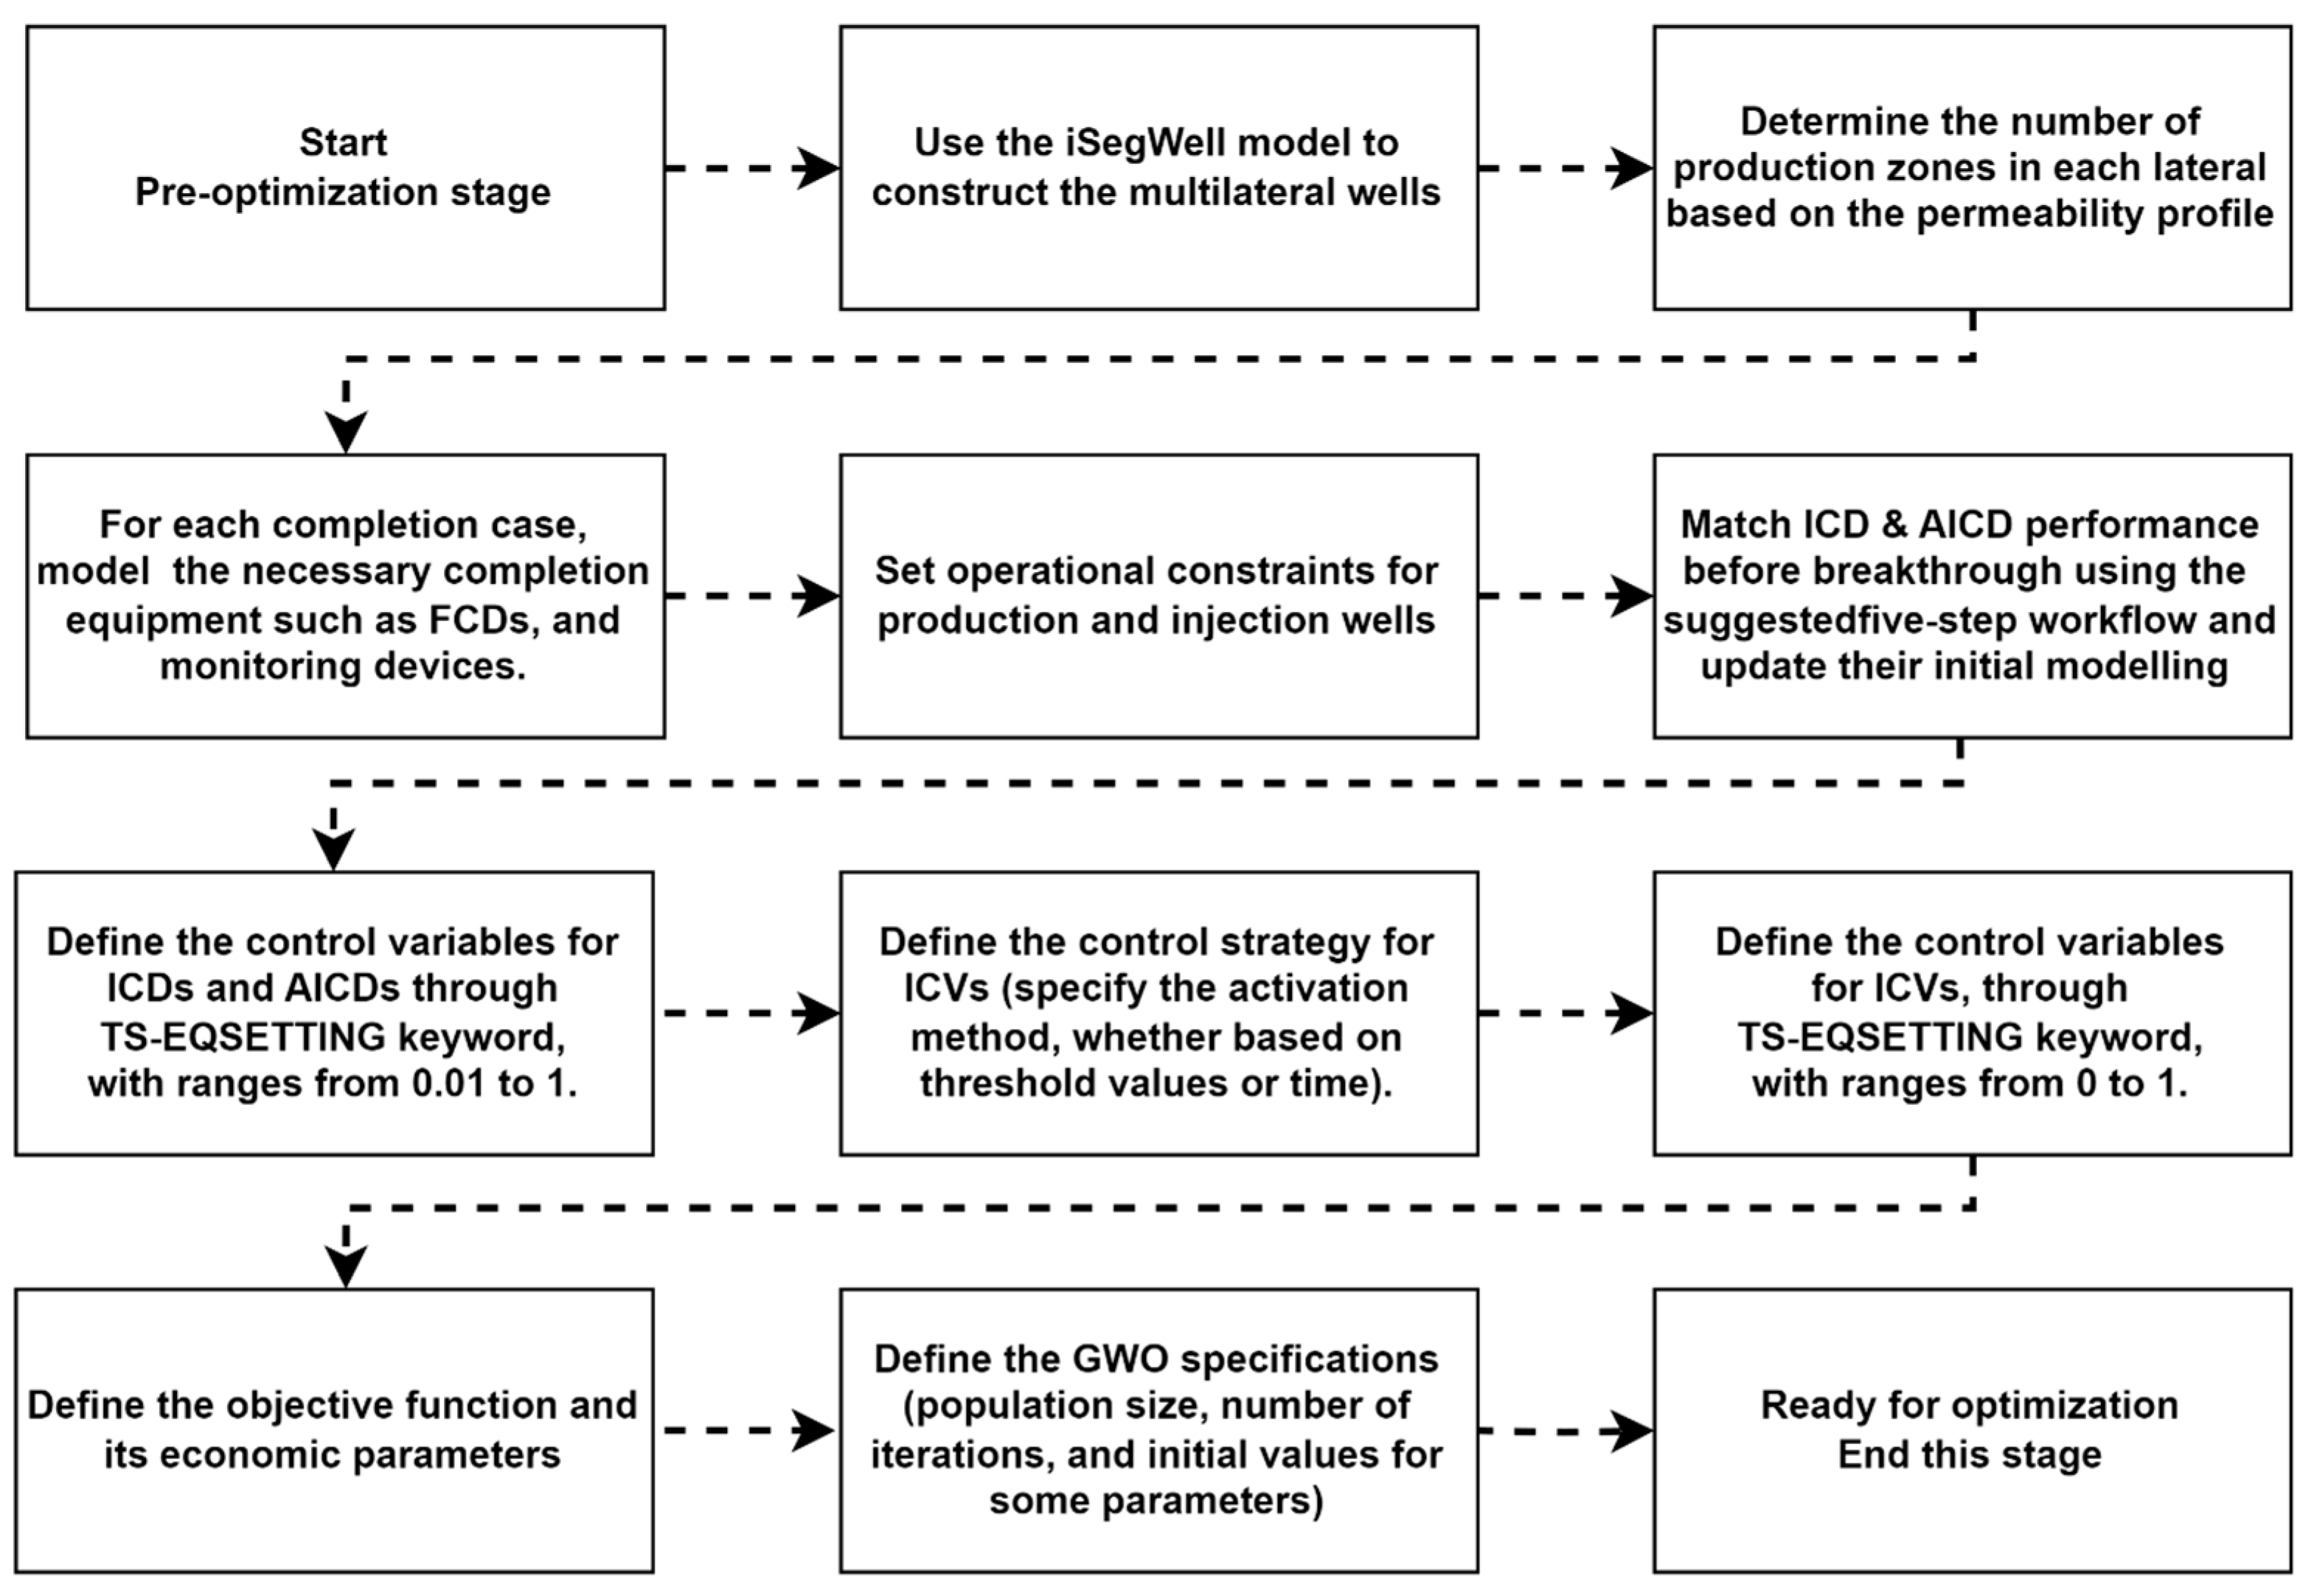
To establish a meaningful comparison between passive inflow control devices (ICDs) and autonomous inflow control devices (AICDs), it is essential to match their initial performances, particularly the pressure drop, before breakthrough occurrence. This is due to the fact that before breakthrough (i.e., for the oil-only flow) they are supposed to achieve the same goal: balance the inflow profile; while after breakthrough the AICDs would choke production of unwanted fluids, unlike the ICDs.
To achieve this goal, we implement a structured five-step workflow, to accurately match the performance of ICDs and AICDs, as depicted in Figure 4.

4. Methodology

The primary aim is to conduct a thorough comparative analysis and performance evaluation of various completion scenarios that integrate both single and multiple types of flow control devices within multilateral wells. To accomplish the aforementioned objective, dynamic optimization is applied to all potential completion scenarios. This process aims to identify the optimal completion design (i.e., the FCD settings in this problem) for each case that maximizes the NPV value. Subsequently, the completion scenarios can be analyzed, evaluated, and ranked based on their optimal design performance.
Before commencing the dynamic optimization, a pre-optimization stage is imperative. In this preliminary phase, the multilateral well with essential completion equipment such as packers, flow control devices (including ICDs, AICDs and ICVs) and monitoring sensors are simulated. Next, well constraints are defined, ICD and AICD performances are matched, and the ranges for control variables representing the ICDs’ and AICDs’ settings are defined. Additionally, the ICVs control strategies (i.e., reactive or proactive) are then defined. In the reactive control strategy, ICVs are triggered based on local water cut values measured through monitoring points at the valves’ location, employing three shut-in water cut ranges (greater than or equal to 50%, 70%, and 90%), representing fast, intermediate, and slow activations, respectively. The proactive strategy operates ICV at either 12 or 6-month time intervals. Subsequently, optimization algorithm specifications, such as the number of iterations and population size, are determined. Figure 5 provides a comprehensive visual representation of the detailed workflow for this pre-optimization stage.
In this study, a dynamic optimization is conducted in which at each iteration, the GWO suggests experiments containing values for control variables (FCDs setting) and communicates these suggestions to the reservoir simulator as shown in Figure 6. The simulator calculates the reservoir’s response based on the input values, and the optimization algorithm uses feedback from the simulator to fine-tune its search strategy, and to suggest new values for the control variables aiming to enhance the objective function. This process continues until the predefined criteria (e.g., the maximum number of iterations) are met.

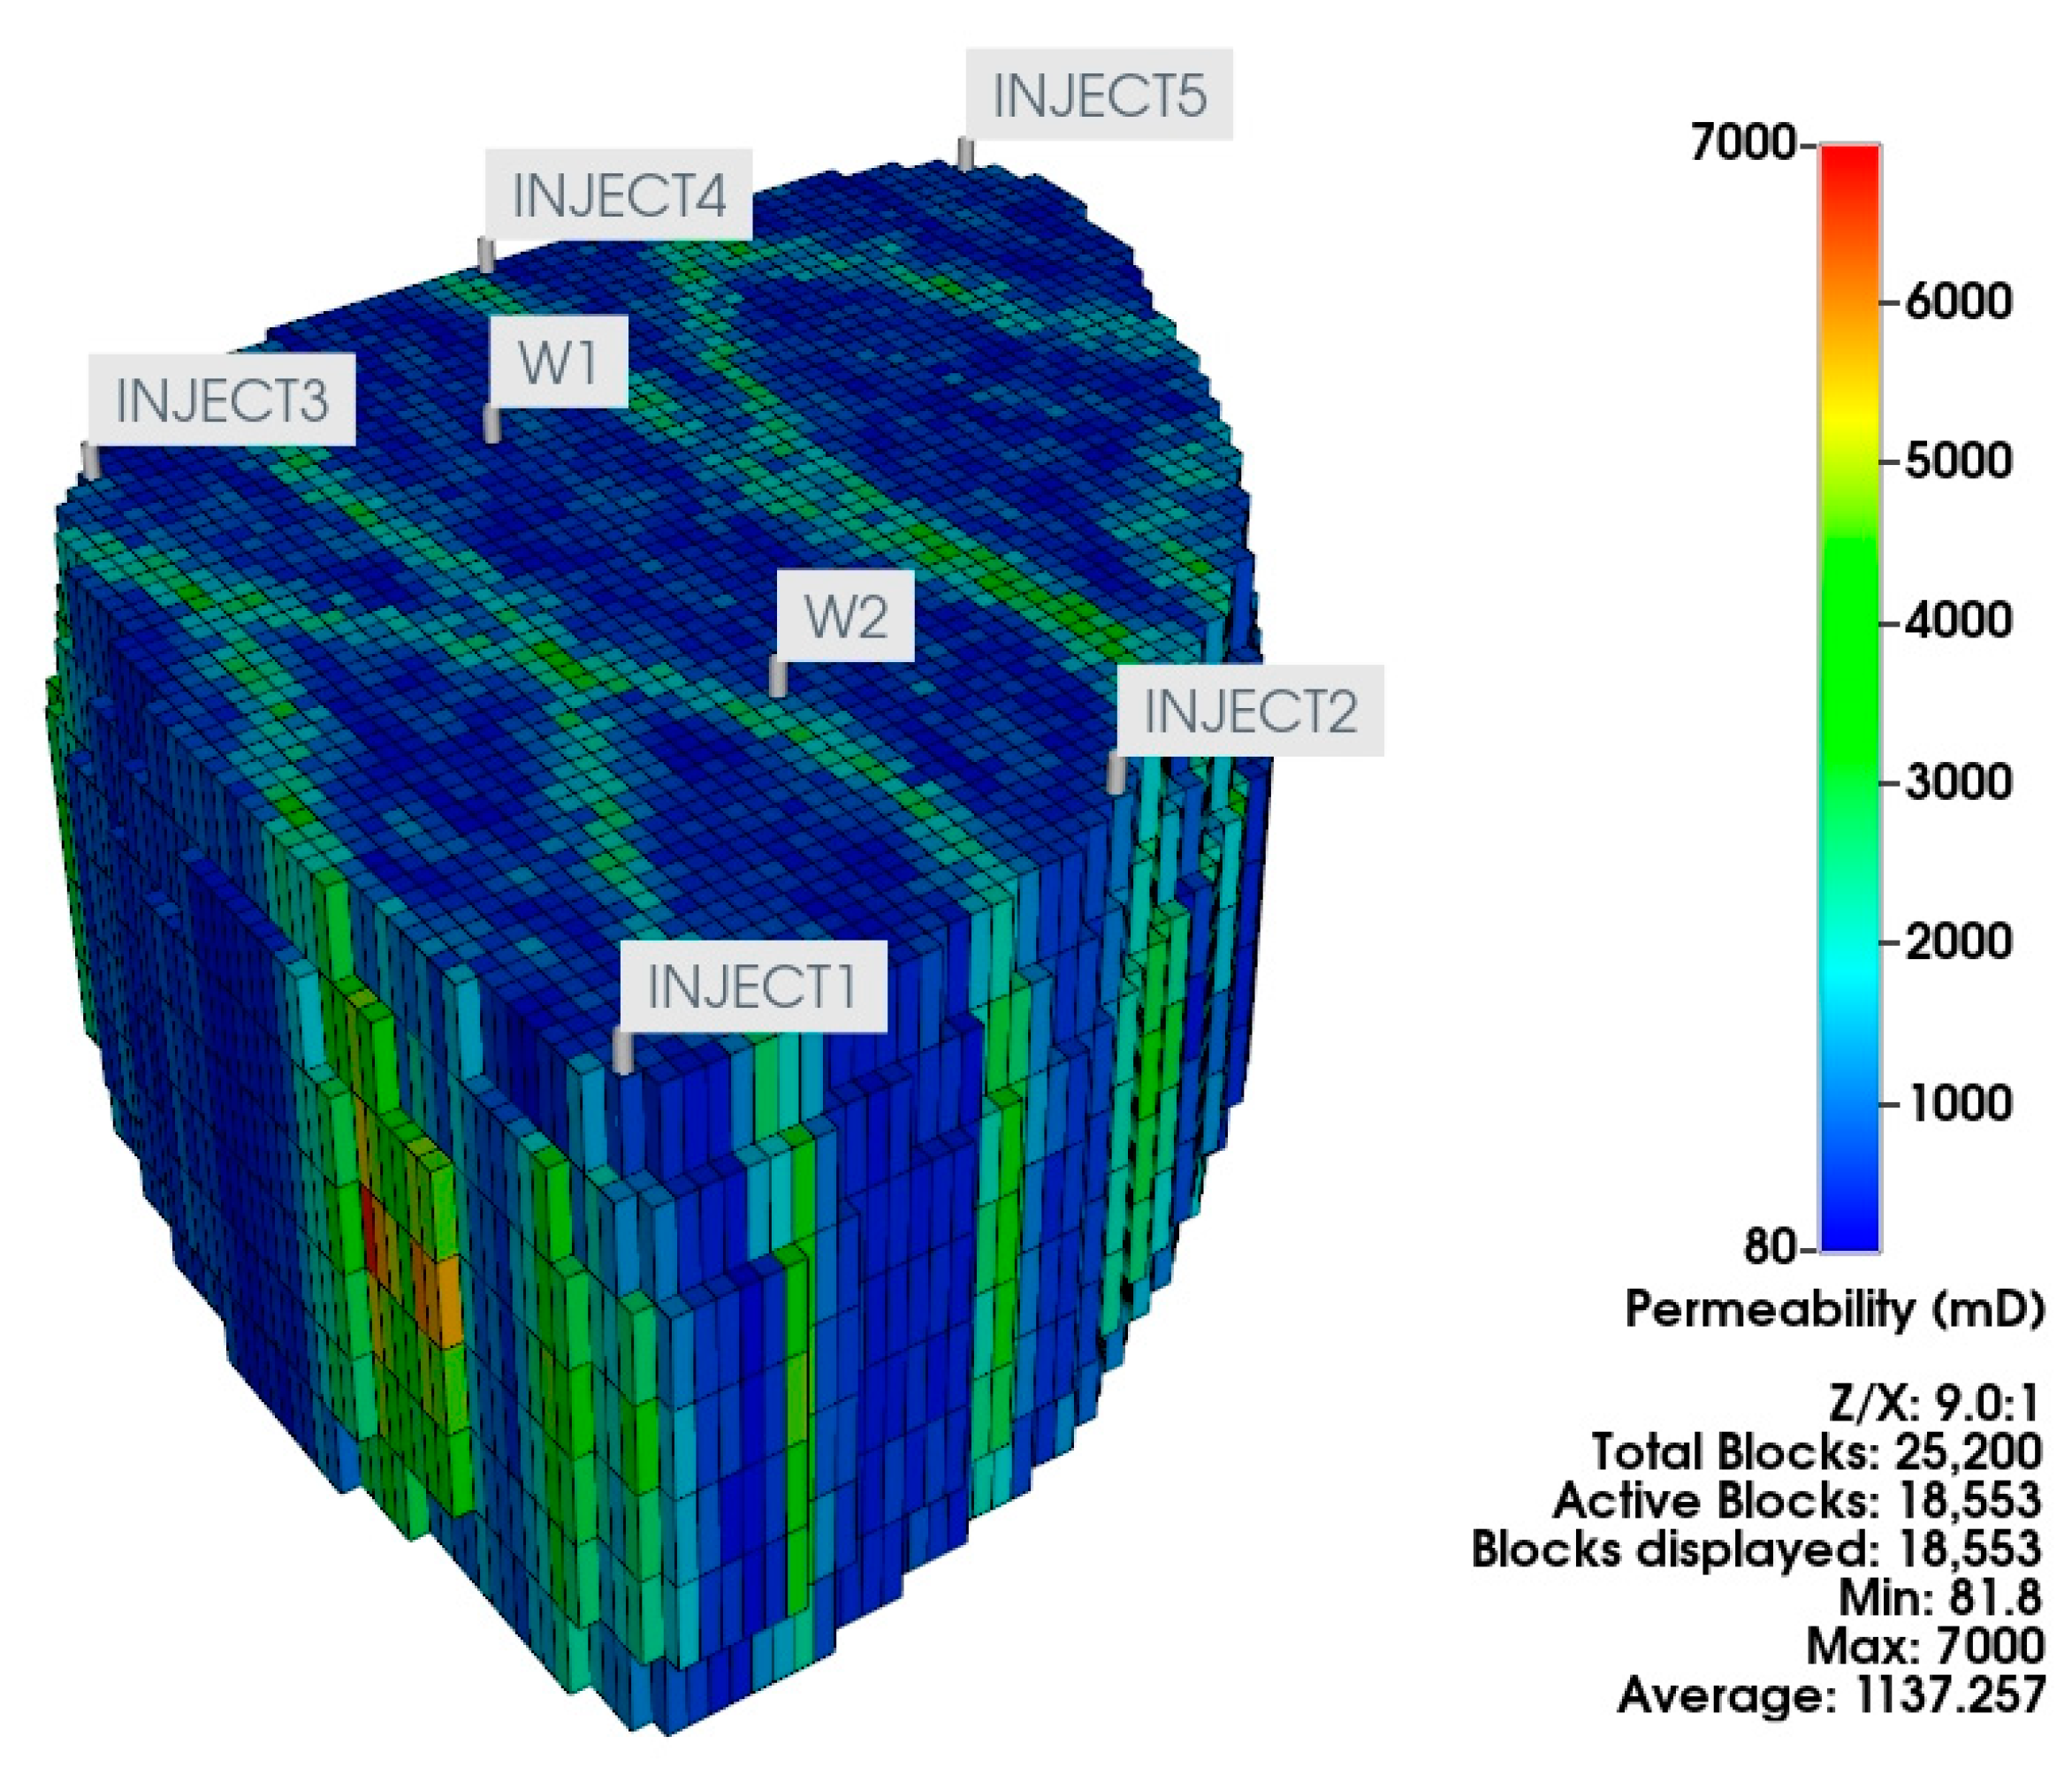
5. Case Study–Egg Field Model

The Egg Field Reservoir Model is a three-dimensional channelized oil benchmark reservoir, consisting of 25,200 grid cells arranged in a 60 × 60 × 7 configuration [52]. Out of these cells, 18,533 are active and spread across seven layers. This model incorporates high-permeability pathways within a low-permeability background, mimicking the winding patterns typically observed in river systems in fluvial environments. The model operates under water flooding recovery mechanism, with eight water injection wells located along the reservoir boundary and four oil production wells positioned in the central region of the reservoir. Table 2 presents some of the Egg reservoir properties along with their measuring units. Figure 7 shows the distribution of horizontal permeability in the Egg model. In this study, the Egg model we developed with two dual-lateral wells instead of the four vertical conventional wells and five water injectors instead of eight injectors. The field operates with a maximum production capacity of 2500 m3/day. Production wells operate with a minimum bottom hole pressure of 39.8 × 10⁶ Pa. Meanwhile, the injector wells operate with a maximum bottom hole pressure of 40.2 × 10⁶ Pa and a maximum injection rate of 79.5 m3/day. The long-term production forecast of the wells is taken as 10 years.
Various well completion scenarios based on the FCD type and control strategy are developed following the pre-optimization workflow explained in Section 4. This process has resulted in 22 distinct completion cases, each individually adopted within the dual-lateral wells as detailed in Appendix B. In the reactive approach, multi-position ICVs are activated at three water cut ranges: water cut ≥50%, water cut ≥70%, and water cut ≥90%, corresponding to fast, intermediate, and slow ICV activation and closure, respectively. In the proactive strategy, the ICVs are controlled every 12 or 6 months.
The nomenclature for completion cases with multiple types of flow control devices is structured with three components to enhance clarity and ease of understanding. The first component identifies the type of completion inside the laterals, encompassing options such as open hole (OH), ICDs, and AICDs. The second part delineates the ICVs at the lateral junction and their associated control strategy. Lastly, the third part specifies the value at which the control strategy is activated, whether it is the local water cut for reactive control or a time interval for proactive control. For example, a case named “AICDs_RICVs_90% WC” indicates AICDs installed inside the lateral and reactive ICVs at the lateral junctions, controlled at a local water cut of 90% water cut. Another instance is the case “OH_PICVs_6 m”, indicating an open-hole completion within the laterals with proactive ICVs at the lateral junctions controlled at a 6-month time interval. Completion cases involving a single type of flow control device are denoted by device type. For the cases where the ICVs are installed inside the laterals, additional details are added to specify how these ICVs are controlled and at what value, such as “PICVs_12 m” which describes proactive ICVs within the laterals controlled at 12-month time interval. Appendix B provides comprehensive details for all of the cases considered.
All completion scenarios utilize identical branch compartmentalization determined by the permeability profile. Figure 8 shows well completion schematics for the two dual-lateral production wells where the FCD on the plot refers to either an ICD or an AICD.
The number of control or decision variables varies for cases is determined according to the number of FCDs in the case and the employed control strategy. Further explanation about all completion scenarios and their corresponding number of control variables can be found in Appendix B.
Following the workflow outlined in Section 3.3, Multivariate Nonlinear Regression (MVNLR) technique is used to match AICD performance with experimental results for FloSure® RCP-AICD [4]. Based on the matching, the values of a A I C D , m , n , x and y are defined and the AICD performance can be described by Equation (11). Figure 9 illustrates the matching between the mathematical model (blue and black solid lines) and experimental data (blue squares and black circles).
P A I C D = 9.78 × 10 6 ρ m i x 2 1000 1 · 1 μ m i x 0.5734 · q 3.1
Next, the reference pressure drop (around 1.5 bar) is estimated based on the average productivity index, initial liquid production rate, and operational constraints. Using this pressure in MVLNR, we match the performance of ICD and AICD for single-phase oil and derive the mathematical model for the equivalent ICD as in Equation (12). The matching of ICD and AICD process is depicted in Figure 9 where the ICD performance is represented by the black dashed line, and the AICD performance is presented by the black solid line.
Δ P I C D = 1.97 × 1 0 5 ρ m i x 1 ρ c a l 0 · μ c a l μ m i x 0 · q 2
The 22 completion cases are then optimized using Grey Wolf Optimizer as detailed in Section 4. The goal is to identify the optimal completion design (FCD setting) that maximizes the objective function (NPV) for each individual case within limited simulation budget of 1000 runs. The best performance of the GWO is achieved with a population size set at 20 based on simulation performance for all completion cases. The optimization process is repeated 10 times for each case, with different seeds, to mitigate the inherent randomness associated with the population-based algorithm (GWO). Eventually, the best-performing optimization run (i.e., the one with the highest NPV) was selected to represent each scenario. Figure 10 shows the selected best-performing optimization run across all completion scenarios, systematically grouped into open hole, ICD, AICD, and ICV-based completion.
Overall, there is a substantial increase in the objective function for all optimized well completion cases. However, the magnitude of this increase varies among the different cases and groups. Examining the open hole-based completion cases, where ICVs controlled production from open hole branches, we observe that their optimized NPVs range closely between 66.3 and 68.7 million USD, as shown in Figure 10A. However, the OH_RICVs_90% WC case which represents the slow reactive ICVs stands out, not only for scoring the lowest NPV within the open hole-based completion group but also among all 22 completion cases, recording only 43.96 million USD. This highlights the risk associated with having ICVs controlling the overall production from open hole branches with a high water cut threshold (essentially such high a WC when the ICV control is already too late, rendering that ICV control mostly useless).
For the ICD-based completion cases shown in Figure 10B, incorporating only ICDs within the lateral sections results in a profit of 53 million USD, representing the lowest figure compared to scenarios where both ICDs and ICVs are integrated into the well completion design. Notably, enhanced completion performance is observed when ICDs are integrated with intermediate and fast-reactive ICVs, particularly in the ICDs_RICVs_70% WC and ICDs_RICVs_50% WC cases, with NPVs of 71.9 and 71.8 million USD, respectively. Additionally, completion scenarios featuring ICDs with proactive ICVs also yield competitive results, with NPVs of 71.2 and 70.8 million USD for ICDs_PICVs_6 m and ICDs_PICVs_12 m cases, respectively. Conversely, cases where ICDs are integrated with slow-reactive ICVs exhibit a lower NPV, approximately around 62 million USD. However, this is still about 17% higher than the scenario involving solely ICDs. This highlights the advantages of employing multiple types of flow control devices compared to relying on a single type for well completion.
Furthermore, an improved completion performance is evident when integrating AICDs with reactive ICVs, as depicted in Figure 10C, in comparison to both open hole and ICD-based completion cases. Following a trend similar to the ICD-based completions, the AICDs_RICVs_70% WC and AICDs_RICVs_50% WC cases exhibit the highest NPVs, with values around 75 million USD and 73.6 million USD, respectively. AICDs, when integrated with proactive ICVs, demonstrate slightly better performance than ICDs in a similar configuration, with NPVs of 71.6 million USD and 72.4 million USD for AICDs_PICVs_12 m and AICDs_PICVs_6 m cases, respectively. While AICD-only completions perform as expected and outdo the ICD-only ones with a 61.7 million USD NPV, it represents the least favourable scenario within this category, raising concerns about the performance of single- type passive or autonomous FCD completions. In the worst-case scenario of multiple types of FCDs in this group, where AICDs are integrated with slow-reactive (i.e., 90% WC threshold) ICVs, the NPV still exceeds that of the standalone AICDs case, reaching about 65.2 million USD, reflecting an approximate 6% increase in profits. This once again underlines the strategic advantage of employing multiple types of FCDs over a singular type (A)ICD to achieve a highly effective well completion performance.
In cases involving ICVs within the laterals, the fast (i.e., responding to the 50% WC threshold) and intermediate (i.e., responding to the 70% WC threshold) reactive ICV completions demonstrate the highest NPVs, approximately 80 and 78 million USD respectively, as illustrated in Figure 10D. These results greatly stand out among the 22 completion cases, highlighting the efficacy of precise local control compared to other completion. The slow reactive ICVs exhibit the lowest performance, with an NPV of around 52 million USD. The delayed response of the ICVs in these cases resulted in water breakthroughs, rendering the closure of the ICVs ineffective being well overdue. Surprisingly, proactively controlled ICVs show a decline in the production performance. This is attributed to the decreased efficiency of the GWO when the number of control variables significantly increases (above 100), as seen in the PICVs_12 m and PICVs_6 m cases where there are 150 and 300 control variables, respectively. To address this issue, the optimization process was extended to 12,000 simulation runs allowing the GWO to process these complex optimization cases. Figure 11 visually represents the extended simulation for PICV_12 m and PICV_6 m cases, resulting in improved NPVs of 76 and 72 million USD respectively. This emphasizes the need for the development of more efficient optimization algorithms for intelligent completion design, particularly when simulation budget is limited, and the number of control variables experiences a substantial increase (usually above 100 control variables). It is worth noting that during our study, the GWO faced convergence challenges solely in the PICV_12 m and PICV_6 m cases. Extending the simulation process beyond 1000 simulation runs for other completion cases yielded outcomes similar to those obtained with 1000 simulation runs.
In summary, our primary analysis reveals that incorporating ICVs at lateral junctions can significantly enhance completion performance in open hole, solely ICD, and solely AICD cases. However, the extent of the improvement offered by the ICVs depends on the completion or FCD type implemented inside the laterals, which determines the level of local control per compartment. For instance, the best performance is achieved by AICDs followed by ICDs and the open hole. The control strategy applied to the ICVs also plays a crucial role in these completion cases. Reactively controlled ICVs generally offer optimal performance, with variations depending on the speed at which the ICVs are controlled. On the other hand, proactively controlled ICVs exhibit more stable performance across all completion cases. ICV-based completions, on the other hand, consistently demonstrate the highest performance by providing effective local monitoring and control of individual zones. However, it is important to note that ICV-based completions can be relatively expensive, necessitating a careful consideration of costs for a more accurate assessment. In this study, completion costs are not factored in to keep our results clean of the manufacturer- and market competition-dependent costs, obscuring the underlying, optimization performance comparison. Additionally, the number of control variables in proactively controlled ICVs placed within laterals can increase significantly, making it difficult for the optimization algorithm to converge within a limited simulation budget.
Figure 12 shows the cumulative oil and water production for all completion scenarios considered in this study, comparing them to the base case where the open hole completion technique is employed. It is evident that water production in the base case (OH) is significantly higher, attributed to the absence of any control. In general, the introduction of flow control device technology, utilizing single or multiple flow control devices, has resulted in a significant reduction in water production and/or a modest enhancement in oil production. The effectiveness of each completion scenario depends more on how the well completion can manage the water production than increasing oil production. Upon comparing each case with its equivalent completion scenarios, it becomes apparent that water management improves as we progress from OH, ICD, AICD to ICV-based completions.
Some completion cases, including ICDs, AICDs, OH_RICVs_90% WC, and RICVs_90% WC, demonstrated reduced effectiveness in managing water production. While the AICDs showed better water production control compared to the ICDs, both completion methods failed to completely shut down water production from offensive zones, leading to elevated cumulative water production. In OH_RICVs_90% WC and RICVs_90% WC cases, the slow response of the ICVs and the delay until the local water cut reached 90% resulted in water invasion in the wells, contributing to their diminished performance. Interestingly, in the cases where slow-reacting ICVs were combined with (A)ICDs, such as in (A)ICDs_RICVs_90% WC cases, cumulative water production was notably higher than in the cases with (A)ICDs only. Despite this increased water production, the combined approach still demonstrated higher NPVs. The reason behind this lies in the fact that in cases with (A)ICDs_RICVs_90% WC, there is a tendency for the installed ICDs or AICD settings to be less restrictive, allowing for increased oil production in the early stages. As the water cut reaches 90%, the ICVs then restricts the lateral flow that exceeds this threshold. This approach leads to enhanced cumulative oil production, ultimately contributing to a more favourable NPV. In contrast, scenarios involving solely (A)ICDs lack such flexibility which may pose challenges in managing and balancing oil and water production in both early and later stages, affecting overall efficiency.
Another interesting set of cases involves completion scenarios that combine ICDs with fast and intermediate reactive ICVs. Specifically, the completion cases incorporating intermediate reactive ICVs, such as ICDs_RICVs_70% WC, demonstrate higher cumulative water production and nearly similar water cumulative production compared to case with fast reactive ICVs. Surprisingly, despite similar high cumulative water production, ICDs_RICVs_70% WC cases still exhibit nearly similar NPV with ICDs_RICVs_50% WC counterpart. This phenomenon is explained by the fact that ICDs_RICVs_70% WC cases tend to achieve greater cumulative oil production in the early stages, unlike ICDs_RICVs_50% WC cases, which constrain production early on and delay it to later stages which negatively affecting the NPV. This is visually represented in Figure 13.
The optimal settings for both ICDs and AICDs, normalized between 0 and 1, in the completion cases involving the use of ICD and AICD devices, are illustrated in Figure 14. The key observation highlights a significant contrast in optimal settings for flow control devices between the cases involving single-type (A)ICD completions, and those involving multiple types of FCDs. This is imperative due to the prevalent issue of early breakthrough with widespread water invasion in all well laterals. The imposition of restrictive settings becomes crucial in the single type (A)ICD completion to prolong the brief period of oil production and subsequently resist water production in later stages. Conversely, in multiple types of FCD-based completion, the imposition of a restrictive size is selective, primarily applied to specific offensive zones, while the rest are maintained with a less restrictive size. This strategic approach aims to enhance early-stage oil production before a water breakthrough occurs, relying on the ICVs to subsequently close off the laterals once the water cut reaches a predetermined level.
Expanding upon this observation, it becomes evident that the integration of multiple flow control devices (FCDs) within well completions significantly shapes the optimal configurations of these devices, deviating notably from scenarios where a singular application of these devices is employed. This underlines a notable correlation between the multiple types of FCDs, rendering sequential optimization—an approach where each FCD type is individually optimized through a sequential process—less favourable in such cases. This crucial insight emphasizes the inherent risk associated with optimizing multiple types of FCD-based completions sequentially, utilizing the industry-standard technique of separately optimizing passive or autonomous inflow control devices through analytical tools, followed by a subsequent individual optimization of interval control valves (ICVs) using a dynamic simulator. The intricate correlation between different FCD types suggests that a simultaneous optimization strategy may be more suitable for achieving optimal performance in complex well completion scenarios.
In the following four figures, we present oil and water production rates for each branch across various completion scenarios, categorized into open hole, ICD, AICD, and ICV-based completion groups. Figure 15 specifically focuses on open hole (OH)-based completion cases where differentially controlled ICVs are used to control flow from open hole completed laterals. Upon examining the oil and water production rate curves across all branches, a common trend emerges—early breakthrough issues affecting all completion methods. Notably, the open hole (OH Base case) completion (depicted in purple), lacking any control mechanism, exhibits the highest water production. The OH_RICVs_90% WC case (depicted in green) follows closely, attributing its higher water production to delayed responses from ICVs, particularly in the top and bottom branches of W2, significantly impacting the NPV. Interestingly, the highest performance cases appear to involve a similar production technique, strategically restricting early production from both branches in W1 and permitting production from the top branch in W2, where water breakthrough takes relatively longer. In the instances where ICVs are proactively controlled, such as in the OH_PICVs_6 m case (depicted in blue), the production shows fluctuations. This behavior is a result of timely ICV adjustments based on predetermined intervals, which can adopt any configuration that help mitigating water production.
The oil and water production rates for lateral branches in ICD-based completion scenarios are illustrated in Figure 16. As mentioned earlier, ICDs (depicted in purple) typically employ restrictive settings to manage early-stage water breakthroughs and maintain high resistance after breakthrough. This restrictive approach negatively impacts oil production rates across all laterals, making it a less favourable completion technique compared to other multiple-type FCD-based completion cases within this group. When ICVs are combined with ICDs, the ICDs tend to have less restrictive sizes, allowing for increased oil production in the early stages. However, the higher water production associated with less restrictive ICD settings is subsequently tackled by the ICVs, which completely shut down the branch when its production is no longer profitable. The effectiveness of multiple FCD-type completions depends on how the ICVs are controlled. Intermediate and reactive ICVs (depicted in black and red) exhibit better performance when combined with ICDs compared to slow-reacting ICVs (depicted in green). Proactively controlled ICVs in the ICDs_PICVs_12 m and ICDs_PICVs_6 m cases (depicted in orange and blue, respectively) showcase different production styles, specifically in W2, where oscillations significantly increase.
The performance of AICD-based completion cases per lateral branch is illustrated in Figure 17. Generally, AICD-based completions demonstrate superior water management compared to the open hole and ICD-based completion types. Across all lateral branches in AICD-based completion cases, the maximum water production remains below 100 m3/day, a notable improvement compared to the 150 m3/day observed in the best ICD-based completion case. This enhanced local water control contributes to increased efficiency of ICVs at the lateral junction.
When comparing the best cases in ICD and AICD-based completion techniques, it becomes apparent that incorporating AICDs within the lateral has influenced the optimal production plan established in ICD-based completion. In the two most favourable scenarios in AICD-based completion (AICDs_RICVs_70% WC and AICDs_RICVs_50% WC, depicted in black and red, respectively), the top lateral in W1 is no longer shut in, resulting in additional oil production which contributed to the high NPVs in these cases.
In the scenarios featuring ICV-based completions, the local control was significantly enhanced with ICVs taking charge of production zones. This resulted in an extended period of oil production across all branches (i.e., production period before shutting the branch), as illustrated in Figure 18. Notably, intermediate and fast-reactive ICVs (depicted in black and red) exhibited superior performance by effectively managing water, thereby contributing to higher NPVs.

6. Conclusions

In this work, we investigated the feasibility of incorporating flow control technology in multilateral wells through a dynamic optimization process, employing the grey wolf optimizer. We utilize the benchmark, Egg reservoir model and develop it with two dual-lateral wells. These dual-lateral wells form the basis for the implementation and evaluation of 22 unique completion scenarios, encompassing both single and multiple types of flow control devices, and incorporating reactive and proactive management strategies.
The best completion scenario for multilateral wells is the ICV-based completion where ICVs are implemented inside the laterals which are equiped with mointering packages and control facilities similar to the ManaraTM [32], MultiNodeTM [33] and PulseEightTM [34] completion systems. In this type of completion, reactive control over the ICVs provided the best perfomance where the incremental NPV reaches to 80 million USD (ignoring the completion cost). The capex and opex of such completion is expected to be significantly high, which may influence the attractivenes of this option.
The completions which employ multiple types of flow control devices can offer a more affordable substitute. In this completion technique, passive or autonomous ICDs are placed inside the lateral branches while ICVs are placed only at the lateral junctions to control lateral branch inflow. However, the efficiency of such a technique depends on the local control provided by (A)ICDs and the cotrol strategy applied to the ICVs (reactive or proactive). When (A)ICDs combined with sensitivie-to-WC ICVs control strategies, they provide better perfomance compared to the ones controlled proactively. The completions with AICDs combined with the ICVs, however, provide higher performance than ICDs with the ICVs. The best performance observed for the AICDs with reactive ICVs controlled at 70% water cut threshold, where the NPV reached up to 75 million USD. This is due to an increased local water control provided by the AICDs compared to the ICDs. The completions combining ICDs with reactive ICVs still can show resonable NPV results with around 72 million USD. Singular-type ICDs or AICDs completions could only achieve NPVs of around 53 and 62 million USD, respectively, which is significnalty lower than the combination of passive and active control devices.
All in all, combining mutiple types of flow control devices within well completions significantly improves the production performance compared to the scenarios where single-type devices are employed. This study also shows that a significant interference is expected between the controls representing the setting of multiple types of FCDs, rendering sequential optimization—an approach where each FCD type is individually optimized through a sequential process—less favourable in such cases. This includes the industry-standard technique of separately optimizing passive or autonomous inflow control devices through analytical tools, followed by a subsequent individual optimization of intelligent completion valves (ICVs) using a dynamic simulator. A simultaneous optimization strategy is ideally required to achieve optimal performance in such complex well completion scenarios. Lastly, controlling the ICVs proactivelly can result in a significant increase in the number of control varaibles. A chosen optimization algorithm may not be able to tackle this huge number of control variables, and hence the a more efficient optimization framework is needed.
These findings will be helpful to the advanced well compeltion design community of engineers and researchers, comprehensively illustrating how a combination of FCD types in a well completion is superior to single-type designs (the perennial point of debate), given such well completion is optimised properly. The paper also outlines the challenges and solutions to such optimization.

Author Contributions

J.A.: Conceptualization, methodology, coding, modelling, data analysis, writing manuscript. M.H.S.: Supervision, conceptualization, review/edit manuscript. K.M.: supervision, review/edit manuscript. A.M.: Modelling, and review/edit manuscript. B.M.E.M.: Supervision, review/edit manuscript. All authors have read and agreed to the published version of the manuscript.

Funding

This research was funded by the Libyan Ministry of Higher Education and Scientific Research (No. 1015-2019), Research Council of Norway and Equinor through Research Council (No. 308817).

Data Availability Statement

Data are contained within the article.

Acknowledgments

Authors are thankful to the sponsor, the Libyan Ministry of Higher Education, Research Council of Norway and Equinor through Research Council for providing financial support.

Conflicts of Interest

The authors declare no conflict of interest.

Nomenclature

FCDFlow Control Device
MLWMultilateral Well
ICVInflow (Interval) Control Valve
ICDInflow Control Device
AICDAutonomous Inflow Control Device
USDUnited States Dollar
NPVNet Present Value
FDFluidic Diode
RCPRate-Controlled Production
AICVAutonomous Inflow Control Valve
PDGsPermanent Downhole Gauges
TECTubing Encased Conductor
SCADASupervisory Control and Data Acquisition
CAPEXCapital Expenditure
OPEXOperational Expenditure
WAGWater Alternating Gas
CO2 Carbon Dioxide
MSWMulti-Segmented Well

Appendix A. Pseudocode of the GWO Algorithm

Step1: Initialize the population of grey wolves randomly  X i  ( i = 1, 2, …, n)
Step2: Initialize the value of  a ,  A  and  C  
Step3: Calculate the objective function of all wolves in the population
               X α = the best solution
               X β = the second-best solution
               X δ = the third-best solution
Step4: while  t < total number of iterations:
                      For each search agent
                            Update the location of the wolves use Equation (8)
                      End for
                            Update a , A and C  
                            Calculate objective function of all wolves
                            Update X α , X β and X δ
              End while
Step5: return X α

Appendix B. All Completion Scenarios (Cases) Implemented in This Study

Case No.Completion Case NameExplanationNo. Control VariablesCompletion
Type Based on FCDs
Control Strategy
0OH (Base case)Open-hole lateral branches without any control0Open holeNo control
1OH_PICVs_12 mOpen-hole lateral branches with proactive ICVs at lateral junctions, where ICVs are controlled at 12-month intervals40SingleProactive
2OH_PICVs_6 mOpen-hole lateral branches with proactive ICVs at lateral junctions, where ICVs are controlled at 6-month intervals80SingleProactive
3OH_RICVs_50% WCOpen-hole lateral branches with fast-reactive ICVs at lateral junctions (each ICV is activated when the local water cut is ≥50% of the branch production)4SingleReactive
4OH_RICVs_70% WCOpen-hole lateral branches with intermediate-reactive ICVs at lateral junctions (each ICV is activated when the local water cut is ≥70% of the branch production)4SingleReactive
5OH_RICVs_90% WCOpen-hole lateral branches with slow-reactive ICVs at lateral junctions (each ICV is activated when the local water cut is ≥90% of the branch production)4SingleReactive
6ICDsICDs installed within lateral branches15SingleNo control
7ICDs_PICVs_12 mICDs installed within lateral branches with proactive ICVs at lateral junctions, where ICVs are controlled at 12-month intervals55MultipleProactive
8ICDs_PICVs_6 mICDs within lateral branches with proactive ICVs at lateral junctions, where ICVs are controlled at 6-month intervals95MultipleProactive
9ICDs_RICVs_50% WCICDs installed within lateral branches with fast-reactive ICVs at lateral junctions (each ICV is activated when the local water cut is ≥ 50% of the branch production)19MultipleReactive
10ICDs_RICVs_70% WCICDs installed within lateral branches with intermediate-reactive ICVs at lateral junctions (each ICV is activated when the local water cut is ≥ 70% of the branch production)19MultipleReactive
11ICDs_RICVs_90% WCICDs installed within lateral branches with slow-reactive ICVs at lateral junctions (each ICV is activated when the local water cut is ≥90% of the branch production)19MultipleReactive
12AICDsAICDs installed within lateral branches15SingleNo control
13AICDs_PICVs_12 mAICDs installed within lateral branches with proactive ICVs at lateral junctions, where ICVs are controlled at 12-month intervals55MultipleProactive
14AICDs_PICVs_6 mAICDs installed within lateral branches with proactive ICVs at lateral junctions, where ICVs are controlled at 6-month intervals95MultipleProactive
15AICDs_RICVs_50% WCAICDs installed within lateral branches with fast-reactive ICVs at lateral junctions (each ICV is activated when the local water cut is ≥50% of the branch production)19MultipleReactive
16AICDs_RICVs_70% WCAICDs installed within lateral branches with intermediate-reactive ICVs at lateral junctions (each ICV is activated when the local water cut is ≥70% of the branch production)19MultipleReactive
17AICDs_RICVs_90% WCAICDs installed within lateral branches with slow-reactive ICVs at lateral junctions (each ICV is activated when the local water cut is ≥90% of the branch production)19MultipleReactive
18PICVs_12 mProactive ICVs installed within lateral branches, where ICVs are controlled at 12-month intervals150SingleProactive
19PICVs_6 mProactive ICVs installed within lateral branches, where ICVs are controlled at 12-month intervals300SingleProactive
20RICVs_50% WCFast reactive ICVs installed within lateral branches (each ICV is activated when the local water cut is ≥50% of the layer production)15SingleReactive
21RICVs_70% WCIntermediate reactive ICVs installed within lateral branches (each ICV is activated when the local water cut is ≥70% of the layer production)15SingleReactive
22RICVs_90% WCSlow reactive ICVs installed within lateral branches (each ICV is activated when the local water cut is ≥90% of the layer production)15SingleReactive

References

  1. Rosi, G.A.; Zhu, D.; Gates, I.D.; Wang, J. Passive Flow Control Devices—Well Design and Physics of Their Different Flow Regimes: A Review. J. Pet. Sci. Eng. 2022, 218, 110999. [Google Scholar] [CrossRef]
  2. Muradov, K.; Haghighat Sefat, M.; Moradi Dowlatabad, M. Fast Optimization of Packer Locations in Wells with Flow Control Completions. J. Pet. Sci. Eng. 2021, 205, 108933. [Google Scholar] [CrossRef]
  3. Zhang, N.; Li, H.; Liu, Y.; Shan, J.; Tan, Y.; Li, Y. A New Autonomous Inflow Control Device Designed for a Loose Sand Oil Reservoir with Bottom Water. J. Pet. Sci. Eng. 2019, 178, 344–355. [Google Scholar] [CrossRef]
  4. Tendeka. FloSure Autonomous ICD. Available online: https://tq.com/solutions/completions/subsurface-flow-control/production/flosure-autonomous-icd/ (accessed on 9 January 2024).
  5. Inflow Control. Autonomous Inflow Control Valve (AICV). Available online: https://www.inflowcontrol.no/ (accessed on 12 February 2024).
  6. Halliburton. EquiFlow® Autonomous Inflow Control Devices (AICD). Available online: https://www.halliburton.com/en/completions/well-completions/sand-control/halliburton-equiflow-inflow-control-devices (accessed on 9 January 2024).
  7. Baker Oil Tools. Inflow Control Device. Available online: https://www.bakerhughes.com/completions/subsurface-flow-control/inflow-control-devices (accessed on 21 March 2024).
  8. SLB. Inflow Control Valve (ICV). Available online: https://glossary.slb.com/terms/i/inflow_control_valve (accessed on 19 January 2024).
  9. Eltaher, E.; Muradov, K.; Davies, D.; Grassick, P. Autonomous Flow Control Device Modelling and Completion Optimisation. J. Pet. Sci. Eng. 2019, 177, 995–1009. [Google Scholar] [CrossRef]
  10. Moradi, A.; Samani, N.A.; Kumara, A.S.; Moldestad, B.M.E. Evaluating the Performance of Advanced Wells in Heavy Oil Reservoirs under Uncertainty in Permeability Parameters. Energy Rep. 2022, 8, 8605–8617. [Google Scholar] [CrossRef]
  11. Mathiesen, V.; Brent, B. Autonomous Valve Controls Excess Water, Gas Production to Increase Oil Recovery. J. Pet. Technol. 2020, 72, 44–46. [Google Scholar] [CrossRef]
  12. Aljubran, M.J.; Horne, R. Surrogate-Based Prediction and Optimization of Multilateral Inflow Control Valve Flow Performance with Production Data. SPE Prod. Oper. 2021, 36, 224–233. [Google Scholar] [CrossRef]
  13. Botechia, V.E.; Schiozer, D.J. Model-Based Life Cycle Control of ICVs in Injectors in a Benchmark Analogous to a Pre-Salt Field. J. Pet. Sci. Eng. 2022, 215, 110707. [Google Scholar] [CrossRef]
  14. Shahreyar, N.; Butler, B.; Shakeel, M. Improved Reservoir Management with Multi Positioning Interval Control Valves in Multilateral Wells. In Proceedings of the SPE Middle East Oil and Gas Show and Conference, Manama, Bahrain, 19–21 February 2023; Society of Petroleum Engineers (SPE): Houston, TX, USA, 2023. [Google Scholar] [CrossRef]
  15. Broni–bediako, E.; Fuseini, N.I.; Akoto, R.N.A.; Brantson, E.T. Application of Intelligent Well Completion in Optimising Oil Production from Oil Rim Reservoirs. Adv. Geo-Energy Res. 2019, 3, 343–354. [Google Scholar] [CrossRef]
  16. Grebenkin, I.M.; Davies, D.R. A Novel Optimisation Algorithm for Inflow Control Valve Management. In Proceedings of the SPE Europec/EAGE Annual Conference, Copenhagen, Denmark, 4–7 June 2012. [Google Scholar] [CrossRef]
  17. Elfeel, M.A.; Tonkin, T.; Watanabe, S.; Abbas, H.; Bratvedt, F.; Goh, G.; Gottumukkala, V.; Giddins, M.A. Employing Smart Flow. Control Valves for Fast Closed-Loop Reservoir Management. Abu Dhabi International Petroleum Exhibition & Conference, Abu Dhabi, United Arab Emirates, 12–15 November 2018; SLB: Austin, TX, USA, 2018. [Google Scholar] [CrossRef]
  18. Dilib, F.A.; Jackson, M.D. Closed-Loop Feedback Control for Production Optimization of Intelligent Wells Under Uncertainty. SPE Prod. Oper. 2013, 28, 345–357. [Google Scholar] [CrossRef]
  19. Augusto, M.; Pinto, S. Short-Term and Long-Term Optimizations for Reservoir Management with Intelligent Wells. In Proceedings of the SPE Latin American and Caribbean Petroleum Engineering Conference, Quito, Ecuador, 18–20 November 2015. [Google Scholar] [CrossRef]
  20. Vasper, A.; Endre, J.; Mjos, S.; Thi, T.; Duong, T. Efficient Optimization Strategies for Developing Intelligent Well Business Cases. In Proceedings of the SPE Intelligent Energy International Conference and Exhibition, Aberdeen, UK, 6–8 September 2016. [Google Scholar] [CrossRef]
  21. Barreto, C.E.A.G.; Schiozer, D.J. Optimal Placement Design of Inflow Control Valve Using a Dynamic Optimization Process Based on Technical and Economic Indicators. J. Pet. Sci. Eng. 2015, 125, 117–127. [Google Scholar] [CrossRef]
  22. Addiego-Guevara, E.A.; Jackson, M.D.; Giddins, M.A. Insurance Value of Intelligent Well Technology against Reservoir Uncertainty. In Proceedings of the Improved Oil Recovery Symposium, Tulsa, OK, USA, 20–23 April 2008. [Google Scholar] [CrossRef]
  23. Ebadi, F.; Davies, D. Should “Proactive” or “Reactive” Control Be Chosen for Intelligent Well Management? In Proceedings of the Intelligent Energy Conference and Exhibition, Amsterdam, The Netherlands, 11–13 April 2006. [CrossRef]
  24. Sampaio, M.A.; Barreto, C.E.A.G.; Schiozer, D.J. Optimization of Proactive Control Valves of Producer and Injector Intelligent Wells under Economic Uncertainty. In Proceedings of the SPE Europec/EAGE Annual Conference, Copenhagen, Denmark, 4–7 June 2012; SPE: Tulsa, OK, USA, 2012. [Google Scholar] [CrossRef]
  25. Chen, B.; Reynolds, A.C. Optimal Control of ICV’s and Well Operating Conditions for the Water-Alternating-Gas Injection Process. J. Pet. Sci. Eng. 2017, 149, 623–640. [Google Scholar] [CrossRef]
  26. Brouwer, D.; Jansen, J.; Intl, S.E. Dynamic Optimization of Waterflooding with Smart Wells Using Optimal Control Theory. SPE J. 2004, 9, 391–402. [Google Scholar] [CrossRef]
  27. Ilamah, O.; Waterhouse, R. Field-Scale Production Optimization with Intelligent Wells; SLB: Austin, TX, USA, 2018. [Google Scholar]
  28. Sefat, M.H.; Muradov, K.M.; Davies, D.R. Optimal Field Development and Control Yields Accelerated, More Reliable, Production: A North Sea Case Study. In Proceedings of the SPE Intelligent Energy International Conference and Exhibition, Aberdeen, UK, 6–8 September 2016. [Google Scholar] [CrossRef]
  29. Sefat, M.H.; Muradov, K.; Davies, D. Field Management by Proactive Optimisation of Intelligent Wells-A Practical Approach. In Proceedings of the SPE Middle East Intelligent Energy Conference and Exhibition, Manama, Bahrain, 28–30 October 2013. [Google Scholar] [CrossRef]
  30. Alghareeb, Z.M.; Horne, R.N.; Yuen, B.B.; Shenawi, S.H. Proactive Optimization of Oil Recovery in Multilateral Wells Using Real Time Production Data. In Proceedings of the SPE Annual Technical Conference and Exhibition, New Orleans, LA, USA, 4–7 October 2009. [Google Scholar] [CrossRef]
  31. Asthana, P.; Jacob, S.; Bouldin, B.; Zeghlache, M.L.; Almulhim, M. Downhole Flow Control Technologies: From Simple Starts to Wireless Smarts. In Proceedings of the SPE/IATMI Asia Pacific Oil & Gas Conference and Exhibition, Jakarta, Indonesia, 10–12 October 2023. [Google Scholar] [CrossRef]
  32. Schlumberger. Manara. Available online: https://www.slb.com/products-and-services/innovating-in-oil-and-gas/completions/well-completions/intelligent-completions/intelligent-completion-systems/manara-production-and-reservoir-management (accessed on 9 January 2024).
  33. Baker Hughes. MultiNode. Available online: https://www.bing.com/search?q=MultiNodeTM+completion&cvid=e0fdd1779df34c478581defc5e5e2c8a&gs_lcrp=EgZjaHJvbWUqBggAEEUYOzIGCAAQRRg7MgYIARAAGEAyBggCEAAYQDIGCAMQABhAMgYIBBAAGEAyBggFEAAYQDIGCAYQABhAMgYIBxAAGEAyBggIEEUYPDIHCAkQRRj8VdIBCDg1NDhqMGo5qAIAsAIA&FORM=ANAB01&PC=EDGEESS (accessed on 9 January 2024).
  34. Tendeka. PulseEight. Available online: https://tq.com/solutions/completions/wireless-intelligent-completions/intelligent-control-valve/ (accessed on 9 January 2024).
  35. Shahreyar, N.; Butler, B.; Corona, G. Maximizing Asset Value & Field Recovery with Advanced Completion Solutions-A Digital Twin Field Case Study with Multilateral, Intelligent Completion, and AICD Completion Technologies; SPE: Tulsa, OK, USA, 2021. [Google Scholar]
  36. Langaas, K.; Jeurissen, E.J.W.G.; Abay, H.K. Combining Passive and Autonomous Inflow-Control Devices in a Trilateral Horizontal Well in the Alvheim Field. In SPE Production and Operations; Society of Petroleum Engineers (SPE): Tulsa, OK, USA, 2019; Volume 34, pp. 446–460. [Google Scholar] [CrossRef]
  37. Carvajal, G.; Saldierna, N.; Querales, M.; Thornton, K.; Loiza, J. Coupling Reservoir and Well Completion Simulators for Intelligent Multi-Lateral Wells: Part 1; SPE: Tulsa, OK, USA, 2018. [Google Scholar]
  38. Prakash Das, O.; Al-Enezi, K.; Aslam, M.; El-Gezeeri, T.; Ziyab, K.; Fipke, S.R.; Ewens, S. Novel Design and Implementation of Kuwait’s First Smart Multilateral Well with Inflow Control Device and Inflow Control Valve for Life-Cycle Reservoir Management in High Mobility Reservoir, West Kuwait; SPE: Tulsa, OK, USA, 2012. [Google Scholar]
  39. Mark, G.; Clifford, A.; Bona, P. Simulations Demonstrate the Benefits of Continuous Improvement in Multilateral Wells in the Norwegian Sea. In Proceedings of the SPE Annual Technical Conference & Exhibition, Virtual, 27–29 October 2020; SPE: Tulsa, OK, USA, 2020. [Google Scholar]
  40. Carpenter, C. Intelligent Completion in Water-Injector Well Improves Field Development. J. Pet. Technol. 2019, 71, 62–64. [Google Scholar] [CrossRef]
  41. Halliburton. NETool. 2023. Available online: https://www.halliburton.com/en/software/decisionspace-365-enterprise/decisionspace-365-reservoir-and-production (accessed on 9 January 2024).
  42. Ahdeema, J.; Sefat, M.H.; Muradov, K. Hybrid Framework for Enhanced Dynamic Optimization of Intelligent Completion Design in Multilateral Wells with Multiple Types of Flow Control Devices. Energies 2023, 16, 7189. [Google Scholar] [CrossRef]
  43. Ahdeema, J.; Sefat, M.H.; Muradov, K. Hybrid Optimization Technique Allows Dynamic Completion Design and Control in Advanced Multilateral Wells with Multiple Types of Flow Control Devices. In Proceedings of the SPE Offshore Europe Conference and Exhibition, Aberdeen, UK, 5–8 September 2023. [Google Scholar] [CrossRef]
  44. CMG. IMEX; Computer Modelling Group Ltd.: Calgary, AB, Canada, 2023. [Google Scholar]
  45. Mirjalili, S.; Mirjalili, S.M.; Lewis, A. Grey Wolf Optimizer. Adv. Eng. Softw. 2014, 69, 46–61. [Google Scholar] [CrossRef]
  46. Ng, C.S.W.; Jahanbani Ghahfarokhi, A.; Nait Amar, M. Production Optimization under Waterflooding with Long Short-Term Memory and Metaheuristic Algorithm. Petroleum 2023, 9, 53–60. [Google Scholar] [CrossRef]
  47. Ocran, D.; Ikiensikimama, S.S.; Broni-Bediako, E. Grey Wolf Optimizer for Solving Well Placement Optimization Problem Constrained to Minimum Well Distance. Pet. Sci. Technol. 2023, 41, 1391–1413. [Google Scholar] [CrossRef]
  48. Rezvani, H.; Rafiei, Y. A Novel Analytical Technique for Determining Inflow Control Devices Flow Area in CO2-EOR and CCUS Projects. J. Pet. Explor. Prod. Technol. 2023, 13, 1951–1962. [Google Scholar] [CrossRef]
  49. Nait Amar, M.; Jahanbani Ghahfarokhi, A.; Ng, C.S.W.; Zeraibi, N. Optimization of WAG in Real Geological Field Using Rigorous Soft Computing Techniques and Nature-Inspired Algorithms. J. Pet. Sci. Eng. 2021, 206, 109038. [Google Scholar] [CrossRef]
  50. Delavar, M.R. Hybrid Machine Learning Approaches for Classification and Detection of Fractures in Carbonate Reservoir. J. Pet. Sci. Eng. 2022, 208, 109327. [Google Scholar] [CrossRef]
  51. Holmes, J.; Barkve, T.; Hydro ASA, N. Application of a Multisegment Well Model to Simulate Flow in Advanced Wells. In Proceedings of the SPE European Petroleum Conference, Hague, The Netherlands, 20–22 October 1998. [Google Scholar] [CrossRef]
  52. Jansen, J.D.; Fonseca, R.M.; Kahrobaei, S.; Siraj, M.M.; Van Essen, G.M.; Van den Hof, P.M.J. The Egg Model—A Geological Ensemble for Reservoir Simulation. Geosci. Data J. 2014, 1, 192–195. [Google Scholar] [CrossRef]
Figure 1. Main types of flow control devices [4,5,6,7,8].
Processes 12 00785 g001
Figure 2. Grey wolves’ hierarchy.
Processes 12 00785 g002
Figure 3. Updating the wolves’ positions in Grey Wolf Optimizer.
Processes 12 00785 g003
Figure 4. Workflow for matching ICD and AICD performance.
Processes 12 00785 g004
Figure 5. A pre-optimization stage framework: a detailed visualization of the key steps and processes leading to the preparation for dynamic optimization.
Processes 12 00785 g005
Figure 6. General workflow for dynamic optimization integrating GWO and CMG-IMEX simulator.
Processes 12 00785 g006
Figure 7. The egg reservoir model showing permeability distribution along the X-axis, as well as the names and positions of the wells.
Processes 12 00785 g007
Figure 8. Completion schematics for production wells W1 (top) and W2 (bottom) in cases involving the use of multiple flow control devices (FCD here refers to either ICD or AICD depending on the case).
Processes 12 00785 g008
Figure 9. Comparison of AICD Experimental Data with AICD and ICD Mathematical Models, Demonstrating Matched Performance at the Reference Pressure.
Processes 12 00785 g009
Figure 10. Optimization process using GWO for all 22 completion cases grouped into: (A) Open hole-based completion cases; (B) ICD-based completion cases; (C) AICD-based completion cases; (D) ICV-based completion cases.
Processes 12 00785 g010
Figure 11. Extended simulation processes employing the GWO when the number of control variables experiences a substantial increase. The blue line represents the PICVs_12 m case with 150 control variables, whereas the red line depicts the PICVs_6 m case with 300 control variables.
Processes 12 00785 g011
Figure 12. Field cumulative oil and water production for all completion cases.
Processes 12 00785 g012
Figure 13. Comparison between ICDs_RICVs_50% WC and ICDs_RICVs_70% WC cases in terms of cumulative oil and water production (left) and NPVs (right).
Processes 12 00785 g013
Figure 14. Normalized ICD and AICD settings (ranging from 0 to 1) for completion cases featuring passive and autonomous inflow control devices.
Processes 12 00785 g014
Figure 15. Comparative analysis of oil and water production rates across various branches in open hole-based completion scenarios.
Processes 12 00785 g015
Figure 16. Comparative analysis of oil and water production rates across various branches in ICD-based completion scenarios.
Processes 12 00785 g016
Figure 17. Comparative analysis of oil and water production rates across various branches in AICD-based completion scenarios.
Processes 12 00785 g017
Figure 18. Comparative analysis of oil and water production rates across various branches in ICV-based completion scenarios.
Processes 12 00785 g018
Table 1. Economic parameters used in the objective function calculations.
ParametersField UnitsSI Units
Crude Oil price60 USD/STB377.4 USD/m3
Water management cost6 USD/STB37.7 USD/m3
Water injection cost6 USD/STB37.7 USD/m3
Annual discount rate10%10%
Table 2. Reservoir and fluid properties of the egg model.
PropertyValueUnit (SI)
Porosity   ( )0.2-
Oil   compressibility   ( C o )1.0 × 10⁻¹⁰Pa−1
Water   compressibility   ( C w )1.0 × 10⁻¹⁰Pa−1
Rock   compressibility   ( C r )0.0Pa−1
Water   viscosity   ( μ w )0.2Pa s
Oil   viscosity   ( μ o )5.0 × 10⁻³Pa s
Initial   reservoir   pressure   ( P R )40 × 106Pa
Disclaimer/Publisher’s Note: The statements, opinions and data contained in all publications are solely those of the individual author(s) and contributor(s) and not of MDPI and/or the editor(s). MDPI and/or the editor(s) disclaim responsibility for any injury to people or property resulting from any ideas, methods, instructions or products referred to in the content.

