Article

Scaling Fed-Batch and Perfusion Antibody Production Processes in Geometrically Dissimilar Stirred Bioreactors

School of Life Sciences and Facility Management, Institute of Chemistry and Biotechnology, ZHAW Zurich University of Applied Sciences, 8820 Wädenswil, Switzerland
*
Author to whom correspondence should be addressed.
Processes 2024, 12(4), 806; https://doi.org/10.3390/pr12040806
Submission received: 25 March 2024 / Revised: 10 April 2024 / Accepted: 15 April 2024 / Published: 17 April 2024

Abstract

:
Modern production processes for biopharmaceuticals often work with very high cell densities. Moreover, there is a trend towards moving from fed-batch to continuous perfusion processes; a development that is influencing the requirements for bioreactor design and process control. In this study, the transfer of fed-batch and perfusion experiments between different cylindrical stirred lab-scale bioreactors and Thermo Scientific’sTM (Waltham, MA, USA) cubical HyPerformaTM DynaDriveTM Single-Use Bioreactor was investigated. Different scaling parameters were used, which were selected based on the requirements of the respective processes. Peak cell densities of up to 49 × 106 cells mL−1 and antibody titers of up to 5.2 g L−1 were achieved in 15- to 16-day fed-batch experiments. In 50-day perfusion cultivations, a viable cell volume of >100 mm3 mL−1 was maintained and more than 1 g L−1 d−1 of antibodies were harvested. The perfusion processes were automated with both cell bleed control and glucose concentration control. Cell retention was performed using Repligen’s (Waltham, MA, USA) XCell® ATF perfusion systems and single-use devices. In summary, approaches for successfully scaling highly productive fed-batch and perfusion processes between geometrically dissimilar lab and pilot scale bioreactors were demonstrated. The advantages of perfusion in comparison to fed-batch processes were also observed.

1. Introduction

The biopharmaceutical market continues to grow and is contributing an increasingly large share to the pharmaceutical industry’s total sales. Monoclonal antibodies (mAbs), mostly produced using Chinese hamster ovary (CHO) cells, play the most important role [1]. In order to meet the increasing demand and at the same time reduce production costs, numerous companies and research groups have been trying to intensify production processes. This process intensification is focused on both upstream and downstream processes. In the case of upstream process intensification, the aim is typically to switch from classic fed-batch to continuous perfusion mode, because perfusion processes deliver a higher volumetric productivity [2,3,4,5]. For example, modern production processes using CHO K1 cells can be performed in perfusion mode at low perfusion rates of 1–1.5 volume of medium per cultivation volume and day (vvd) with a viable cell volume (VCV) of more than 100 mm3 mL−1, which, depending on the cell diameter, corresponds to viable cell densities (VCDs) of about 100 × 106 cells mL−1, compared to the VCDs of 20 × 106 cells mL−1 to more than 30 × 106 cells mL−1 usually achieved in fed-batch processes [6]. Based on the bioreactor volume, such perfusion processes can produce more than 1 g L−1 d−1 of mAbs [7,8]. Depending on the cell line used and the process control, productivity can be increased by up to 8-fold [9,10,11,12]. In addition to increasing productivity, a higher and more consistent product quality can also be achieved and overall production costs can be reduced [13,14,15].
A major challenge, however, for production processes with such high biomass concentrations is oxygen transfer. High volumetric mass transfer coefficients (kLa values) were often not necessary for mammalian-cell-based production processes, since only low VCDs were achieved in these fed-batch processes. Consequently, cell culture bioreactors have been designed in such a way that axial pumping stirrers ensure good mixing at low stirrer speeds and low specific power inputs, because the avoidance of high shear forces in the cultivation of mammalian cells was a major concern for a long time [16,17]. However, various studies have shown that CHO cells can be successfully cultivated at high specific power inputs of up to 4700 W m−3 using radial pumping stirrers which are classically used in microbial bioreactors [18,19,20], indicating that the tolerance range of the cells to shear forces is quite high.
Such higher power inputs may be necessary for the perfusion processes mentioned above. High cell density processes are now common, since modern production cell lines, cell culture media, and perfusion equipment are available. Therefore, the requirements for cell culture bioreactors must be reconsidered. Single-use bioreactors are now predominant in many modern biopharmaceutical production processes, with cell retention usually being performed using Repligen’s (Waltham, MA, USA) alternating tangential flow filtration (ATF) systems [2]. Single-use systems are primarily used because of the lower risk of contamination, the elimination of complex cleaning and sterilization procedures, and the ease with which they can be commissioned and disposed of [5,21]. Specifically designed for high-cell-density perfusion processes, Thermo ScientificTM (Waltham, MA, USA) launched the HyPerformaTM DynaDriveTM bioreactor platform in 2020, which breaks from traditional design approaches. Using the AllegroTM STR platform, PALL (now Cytiva, Marlborough, MA, USA) has already shown that a stirred bioreactor does not always need to be cylindrical. The HyPerforma DynaDrive bioreactor has a rectangular footprint, but a significantly higher bioreactor fill height (H) to bioreactor diameter (D) ratio of 2.9 [22] compared to Cytiva’s Allegro STR with an H/D of 1.0 [23]. Previously, the range of H/D ratios for commercially available cylindrical stirred single-use bioreactors was limited to between 1.5 and 2.2 [21]. The higher H/D ratio and the small bubbles produced by the drilled hole sparger with their large specific surface area result in a longer residence time of the gas bubbles, leading to an increased kLa [24]. Mixing and the power input are achieved using a ladder-like setup consisting of one stirrer close to the bottom and three stirrers at different heights. HyPerforma DynaDrive bioreactors are available in a range of scales from pilot (50 L) to industrial (5000 L). There are no geometrically comparable systems on the laboratory scale; this is why process development of antibody production processes is usually carried out in cylindrical stirred bioreactors. One of the most frequently used single-use systems is Sartorius’ Ambr® 250 (Göttingen, Germany), which has the advantage that several experiments can be carried out simultaneously with a high degree of automation. However, the scaling criteria for transferring processes from a traditional cylindrical stirred laboratory bioreactor to the pilot-scale, cubically shaped HyPerforma DynaDrive still need to be defined.
Various biochemical engineering parameters, such as the specific power input, kLa value, mixing time, and stirrer tip speed, are used for the transfer of mammalian-based production processes from the laboratory scale to the production scale. Keeping one of these parameters constant inevitably results in a change in the others at a different scale. For further information, various publications are available that examine this topic in detail [25,26,27]. When scaling up traditional mammalian-based production processes, the bioreactor geometry usually remains the same and a constant specific power input is most frequently used as the scale-up criterion [25]. This makes sense, since the same geometry and uniform power input deliver an identical flow profile and power input distribution, resulting in no change to the smallest eddies, regardless of the bioreactor volume [26]. These factors are often vitally important in chemical engineering processes. However, in a system where the success of the process is not determined by the perfectly identical chemical composition and distribution of the reactants, but by living cells which express a product of interest, all physical and chemical parameters can be varied to a certain extent. For example, Maschke et al. 2022 defined design spaces for growing a CHO cell line in orbitally shaken systems, taking into account the specific power input or eddy size, mixing time and necessary oxygen supply [28]. Variations usually occur in cell culture processes due to the fact that the flow is not fully turbulent under typical cultivation conditions, especially at the laboratory scale. Thus, the energy dissipation distribution varies with scale, even when the specific power input remains the constant scaling criterion [29,30,31]. Consequently, due to the requirement to address fluctuating flow conditions, the importance of geometric similarity becomes negligible in cell culture processes, provided all critical parameters are maintained within ranges that do not negatively impact the cell line.
In this study, antibody production processes were conducted at the laboratory scale in 250 mL shake flasks (Corning®, Corning, NY, USA; fed-batch), Ambr 250 modular vessels (Sartorius; fed-batch) and the 3 L HyPerforma Glass vessel (Thermo Scientific; fed-batch and perfusion). Both processes, fed batch and perfusion, were additionally performed in the 50 L HyPerforma DynaDrive (Thermo Scientific). Before the tests were carried out in the cylindrical stirred lab-scale bioreactors and the HyPerforma DynaDrive with a rectangular footprint, considerations were made regarding suitable scaling criteria. It was shown that when scaling CHO-cell-based mAb production processes up or down, the bioreactor design does not affect performance, provided the cultivation conditions are kept within reasonable ranges. Accordingly, various parameters, such as the kLa value and the stirrer tip speed, can be kept constant and used as scaling criteria without any recognizable effect on growth and product formation.

2. Materials and Methods

2.1. Cell Line and Medium

A trastuzumab-producing CHO K1 cell line (provided by Thermo Sicentific) was used for all the experiments. Fed-batch cultivations were carried out using Efficient-ProTM Medium (GibcoTM, Waltham, MA, USA), supplemented with 1% Anti-Clumping Agent (Gibco) and 6 mmol L−1 L-glutamine (Gibco), and Efficient-Pro Feed 1 (Gibco) was used as a feed solution. For perfusion cultivations, 0.66× concentrated High-Intensity Perfusion CHO Medium (Gibco) was used as the basal medium and 1x concentrated High-Intensity Perfusion CHO Medium was used as the perfusion medium. Both were supplemented with 1% Anti-Clumping Agent (Gibco) and 4 mmol L−1 L-glutamine (Gibco).

2.2. Inoculum Production

Inoculum production started 10 d before the fed-batch and perfusion cultivations were inoculated. The cryopreserved cells were thawed in the corresponding basal medium and subcultured over 4 passages. During the second and third passages, selection pressure was applied to the cells by the addition of 150 nmol L−1 methotrexate (Sigma Aldrich®, St. Louis, MO, USA). The last passage was carried out in shake flasks, if only lab scale bioreactors were inoculated afterwards, or in a 10 L wave-mixed bioreactor (CellbagTM 10 L, Cytiva) with a 5 L working volume if a production experiment was carried out in the pilot-scale bioreactor.
Shake flasks were cultivated at 37 °C, 8% CO2, 80% relative humidity, a shaking speed of 120 min−1 and an amplitude of 25 mm. Wave cultivations were carried out at 37 °C with 0.2 volume gas per cultivation volume and minute (vvm) overlay gassing using air and 8% CO2. A rocking rate of 20–30 min−1 and an angle of 8–10° was chosen. A ReadyToProcess WAVETM 25 control unit (Cytiva) was used for the wave-mixed bioreactor.

2.3. Fed-Batch Cultivations

Fed-batch cultivations were carried out at lab and pilot scale. Four different cultivation systems were used:
  • Shake flasks, 250 mL (Corning).
  • An Ambr 250 modular (Sartorius).
  • A 3 L HyPerforma Glass bioreactor (Thermo Scientific); controlled by a HyPerforma G3Lab Bioprocess Controller.
  • A 50 L HyPerforma DynaDrive S.U.B. (Thermo Scientific); controlled by a HyPerforma G3Pro Bioprocess Controller.
The fed-batch experiments were inoculated with a VCD of 0.3 × 10⁶ cells mL−1. After an initial batch phase of 3 days, feed medium equivalent to 3% of the current working volume was added every day. For the first Ambr 250 cultivation and the HyPerforma Glass bioreactor, the feed was added to the shake flasks as a daily bolus. To prevent the glucose concentration from dropping below 2 g L−1, a 450 g L−1 glucose solution was also added as a bolus when necessary. For the 50 L pilot-scale cultivation with the HyPerforma DynaDrive and the second and third Ambr 250 cultivations, the feed and the glucose solution were added continuously. Dissolved oxygen (DO) was maintained at 40%, and the pH was maintained at ≤7.15. The cell suspension was harvested on day 16 or, if viability was already <60%, on day 15.
Foaming was automatically controlled in all the stirred bioreactors by adding antifoam C (diluted 1:10, Sigma Aldrich). Antifoam was also added quasi-continuously to the 50 L cultivation. Cultivations in shake flasks were performed at 37 °C, 8% CO2, 80% relative humidity, and a shaking speed of 120 min−1 with a shaking amplitude of 25 mm. The cultivation parameters during the fed-batch processes in the stirred bioreactors are summarized in Table 1.

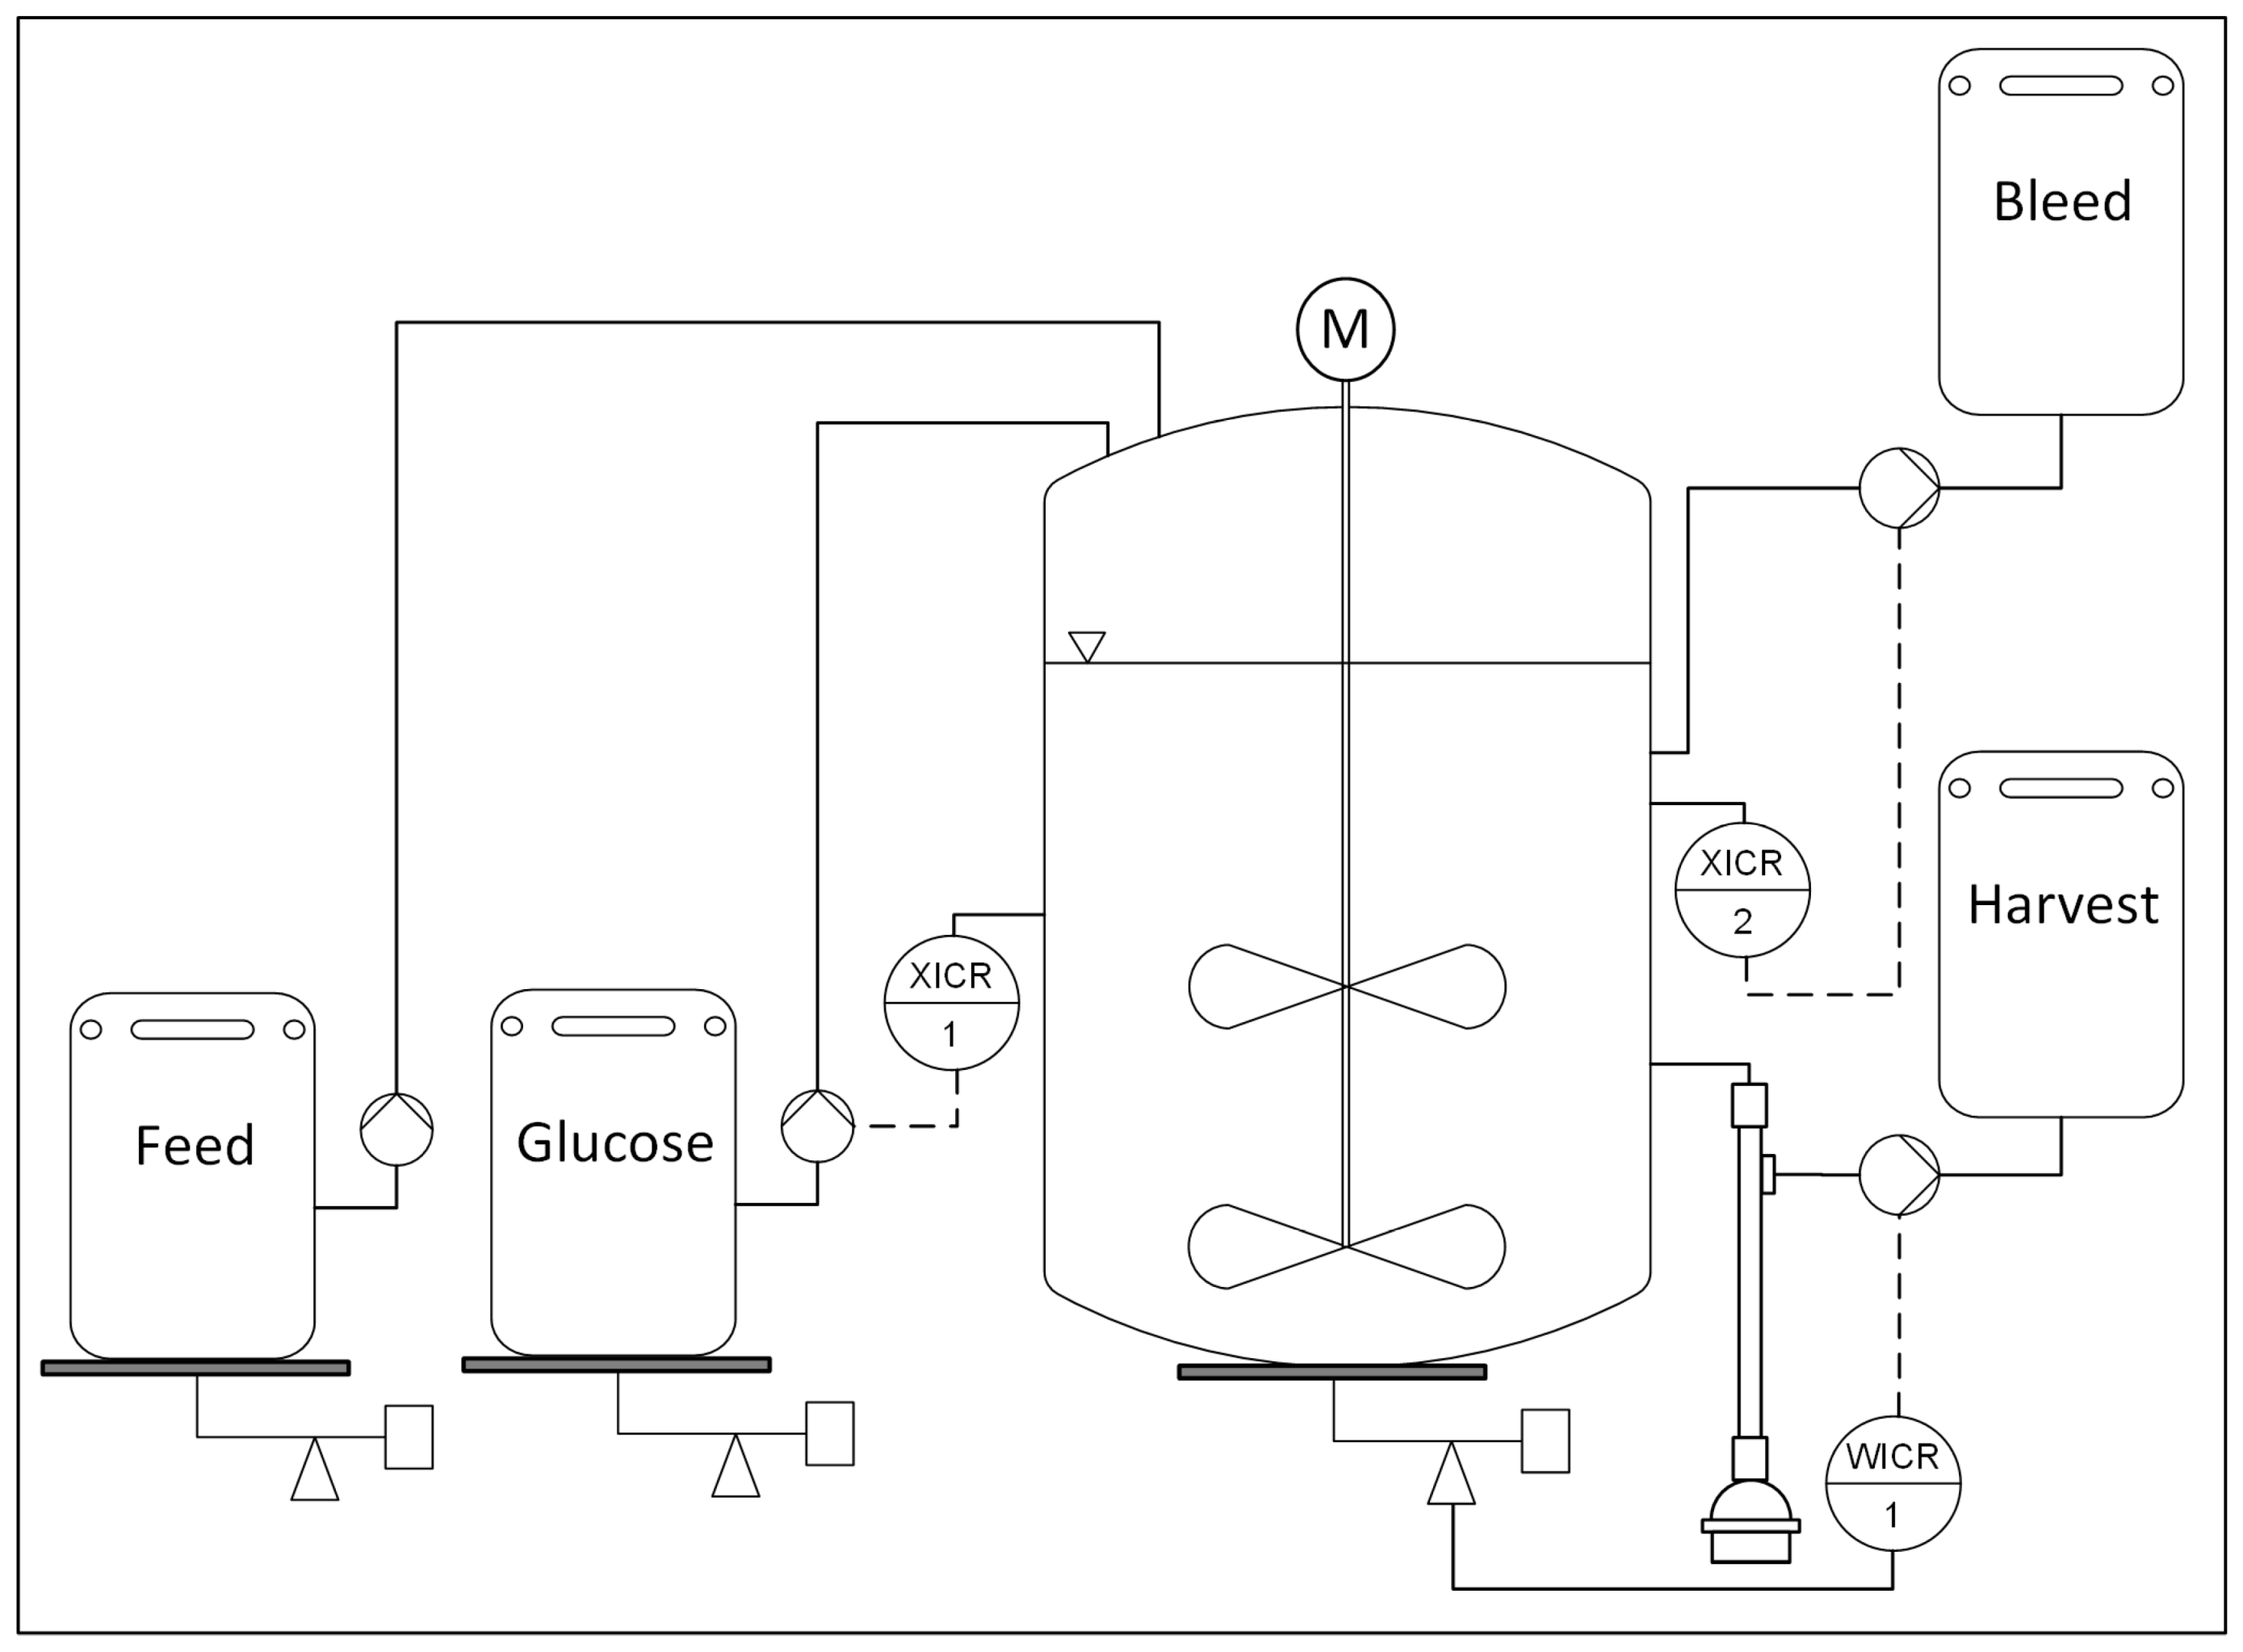
2.4. Perfusion Cultivations at 2 L and 50 L Scale

The 2 L perfusion cultivation was carried out using a 3 L HyPerforma Glass bioreactor (Thermo Scientific) and a HyPerforma G3Lab Controller (Thermo Scientific). The experimental setup is shown schematically in Figure 1. For the two 50 L perfusion cultivations, the ATF version of the HyPerforma DynaDrive (Thermo Scientific) was used with the corresponding HyPerforma G3Pro Bioprocess Controller. For the laboratory scale, cell retention was realized using an XCell ATF 2 single-use device (ATF rate: 0.9 L min−1, shear rate: 1981 s−1), controlled by an XCell Lab controller, and for the pilot scale, an XCell ATF 6 single-use device (ATF rate: 17.0 L min−1, shear rate: 2005 s−1), controlled by an XCell LS controller, was used. The bioreactors were filled to 90% of their working volume one day before inoculation, and ATFs were connected and wetted online overnight. Both bioreactors were inoculated with a VCD of 0.3 × 10⁶ cells mL−1. After a 3-day batch phase, perfusion was started. Based on the growth of the cells, the perfusion rate was adjusted on a daily basis until a perfusion rate of 1 d−1 had been achieved. When a VCV of 120 mm3 mL−1 had been reached, the bleed pump was started and controlled using an Incyte® ARC® permittivity probe (Hamilton Bonaduz, Bonaduz, Switzerland) to maintain a constant VCV of 100–130 mm3 mL−1.
In order to keep the bioreactor volumes constant at 2 and 50 L, the harvest pump was controlled based on the bioreactor weight. The glucose concentration in the 2 L cultivation was measured using a CITSens MeMo glucose sensor (Mettler Toledo GmbH, C-CIT Sensors, Urdorf, Switzerland) and automatically maintained at 1–2 g L−1 via the addition of a 450 g L−1 glucose solution (Carl Roth, Karlsruhe, Germany). In the 50 L cultivations, the glucose concentration was kept constant at 2 g L−1 using a CITSens Bio glucose sensor (Mettler Toledo GmbH, C-CIT Sensors) for the first run and was manually controlled for the second run. To prevent foaming, a 1:10 diluted antifoam C emulsion (Sigma Aldrich) was added periodically. In all the cultivations, the pH was maintained at a value of ≤7.15 by adding CO2 via the drilled hole sparger (50 L bioreactor) or the ring sparger (3 L bioreactor). DO was maintained at 40% by the addition of N2 (only the 50 L bioreactor), air and O2 through the sparger. An air overlay gassing rate of 0.05 vvm was chosen for the 50 L cultivation and 0.1 vvm for the 2 L cultivation. The stirrer speed was set to 136.5 min−1 (corresponding to 40 W m−3) in the HyPerforma DynaDrive and 435 min−1 for the 2 L cultivation. The perfusion processes cultivation parameters are summarized in Table 2.

2.5. Analytics

During the experiments, the VCD, viability, cell diameter and aggregation rate were determined daily using a Cedex® HiRes analyzer (Roche Diagnostics, Basel, Switzerland). The substrates and metabolites (glucose, glutamine, lactate and ammonium) as well as the IgG concentration were analyzed daily using a Cedex Bio analyzer (Roche Diagnostics).
Antibody quality was analyzed by measuring N-glycosylation, charge variants and the ratio of low and high molecular species of the antibody. Glycans were analyzed using hydrophilic interaction ultra-performance liquid chromatography, charge variants were analyzed using ion-exchange high-performance liquid chromatography and low and high molecular species of the antibody were analyzed using size exclusion chromatography.

3. Results

3.1. Fed Batch

3.1.1. Scaling Considerations

The primary consideration in choosing the scaling criterion for fed-batch mode was to achieve VCDs exceeding 40 × 106 cells mL−1 with the CHO K1 cell line being used. While this leads to oxygen limitations in standard shake flask processes, in stirred bioreactors, dissolved oxygen levels can be controlled. Nevertheless, the low kLa value in the Ambr 250 compared to the HyPerforma DynaDrive means that the specific power input, which is often used, is not a suitable scale-up parameter. This is because, at specific power input values between 20 and 50 W m−3, very high oxygen gassing rates are required in the Ambr 250, which can lead to foaming problems in the small headspace of the vessels and blocking of the exhaust filter. Nevertheless, a constant power input of 40 W m−3 was selected for the cultivations in the pilot-scale bioreactor, as this is a suitable scaling criterion for a possible transfer to the production scale. The resultant stirrer tip speed in the DynaDrive (0.71–0.79 m s−1) was determined to be a suitable scaling criterion. This increased the oxygen supply in comparison to if the specific power input had been used as a criterion, but still avoided very high stirrer speeds. In the 3 L HyPerforma Glass bioreactor, however, these stirrer tip speeds could not be applied, since at the beginning of the experiment, the upper stirrer was only just submerged and stirrer speeds higher than 200 min−1 would have led to a vortex. Therefore, a speed of 200 min−1 was selected and increased to 250 min−1 as the volume increased. Despite the different parameters chosen, comparable results in terms of growth and product formation were observed in all stirred systems.

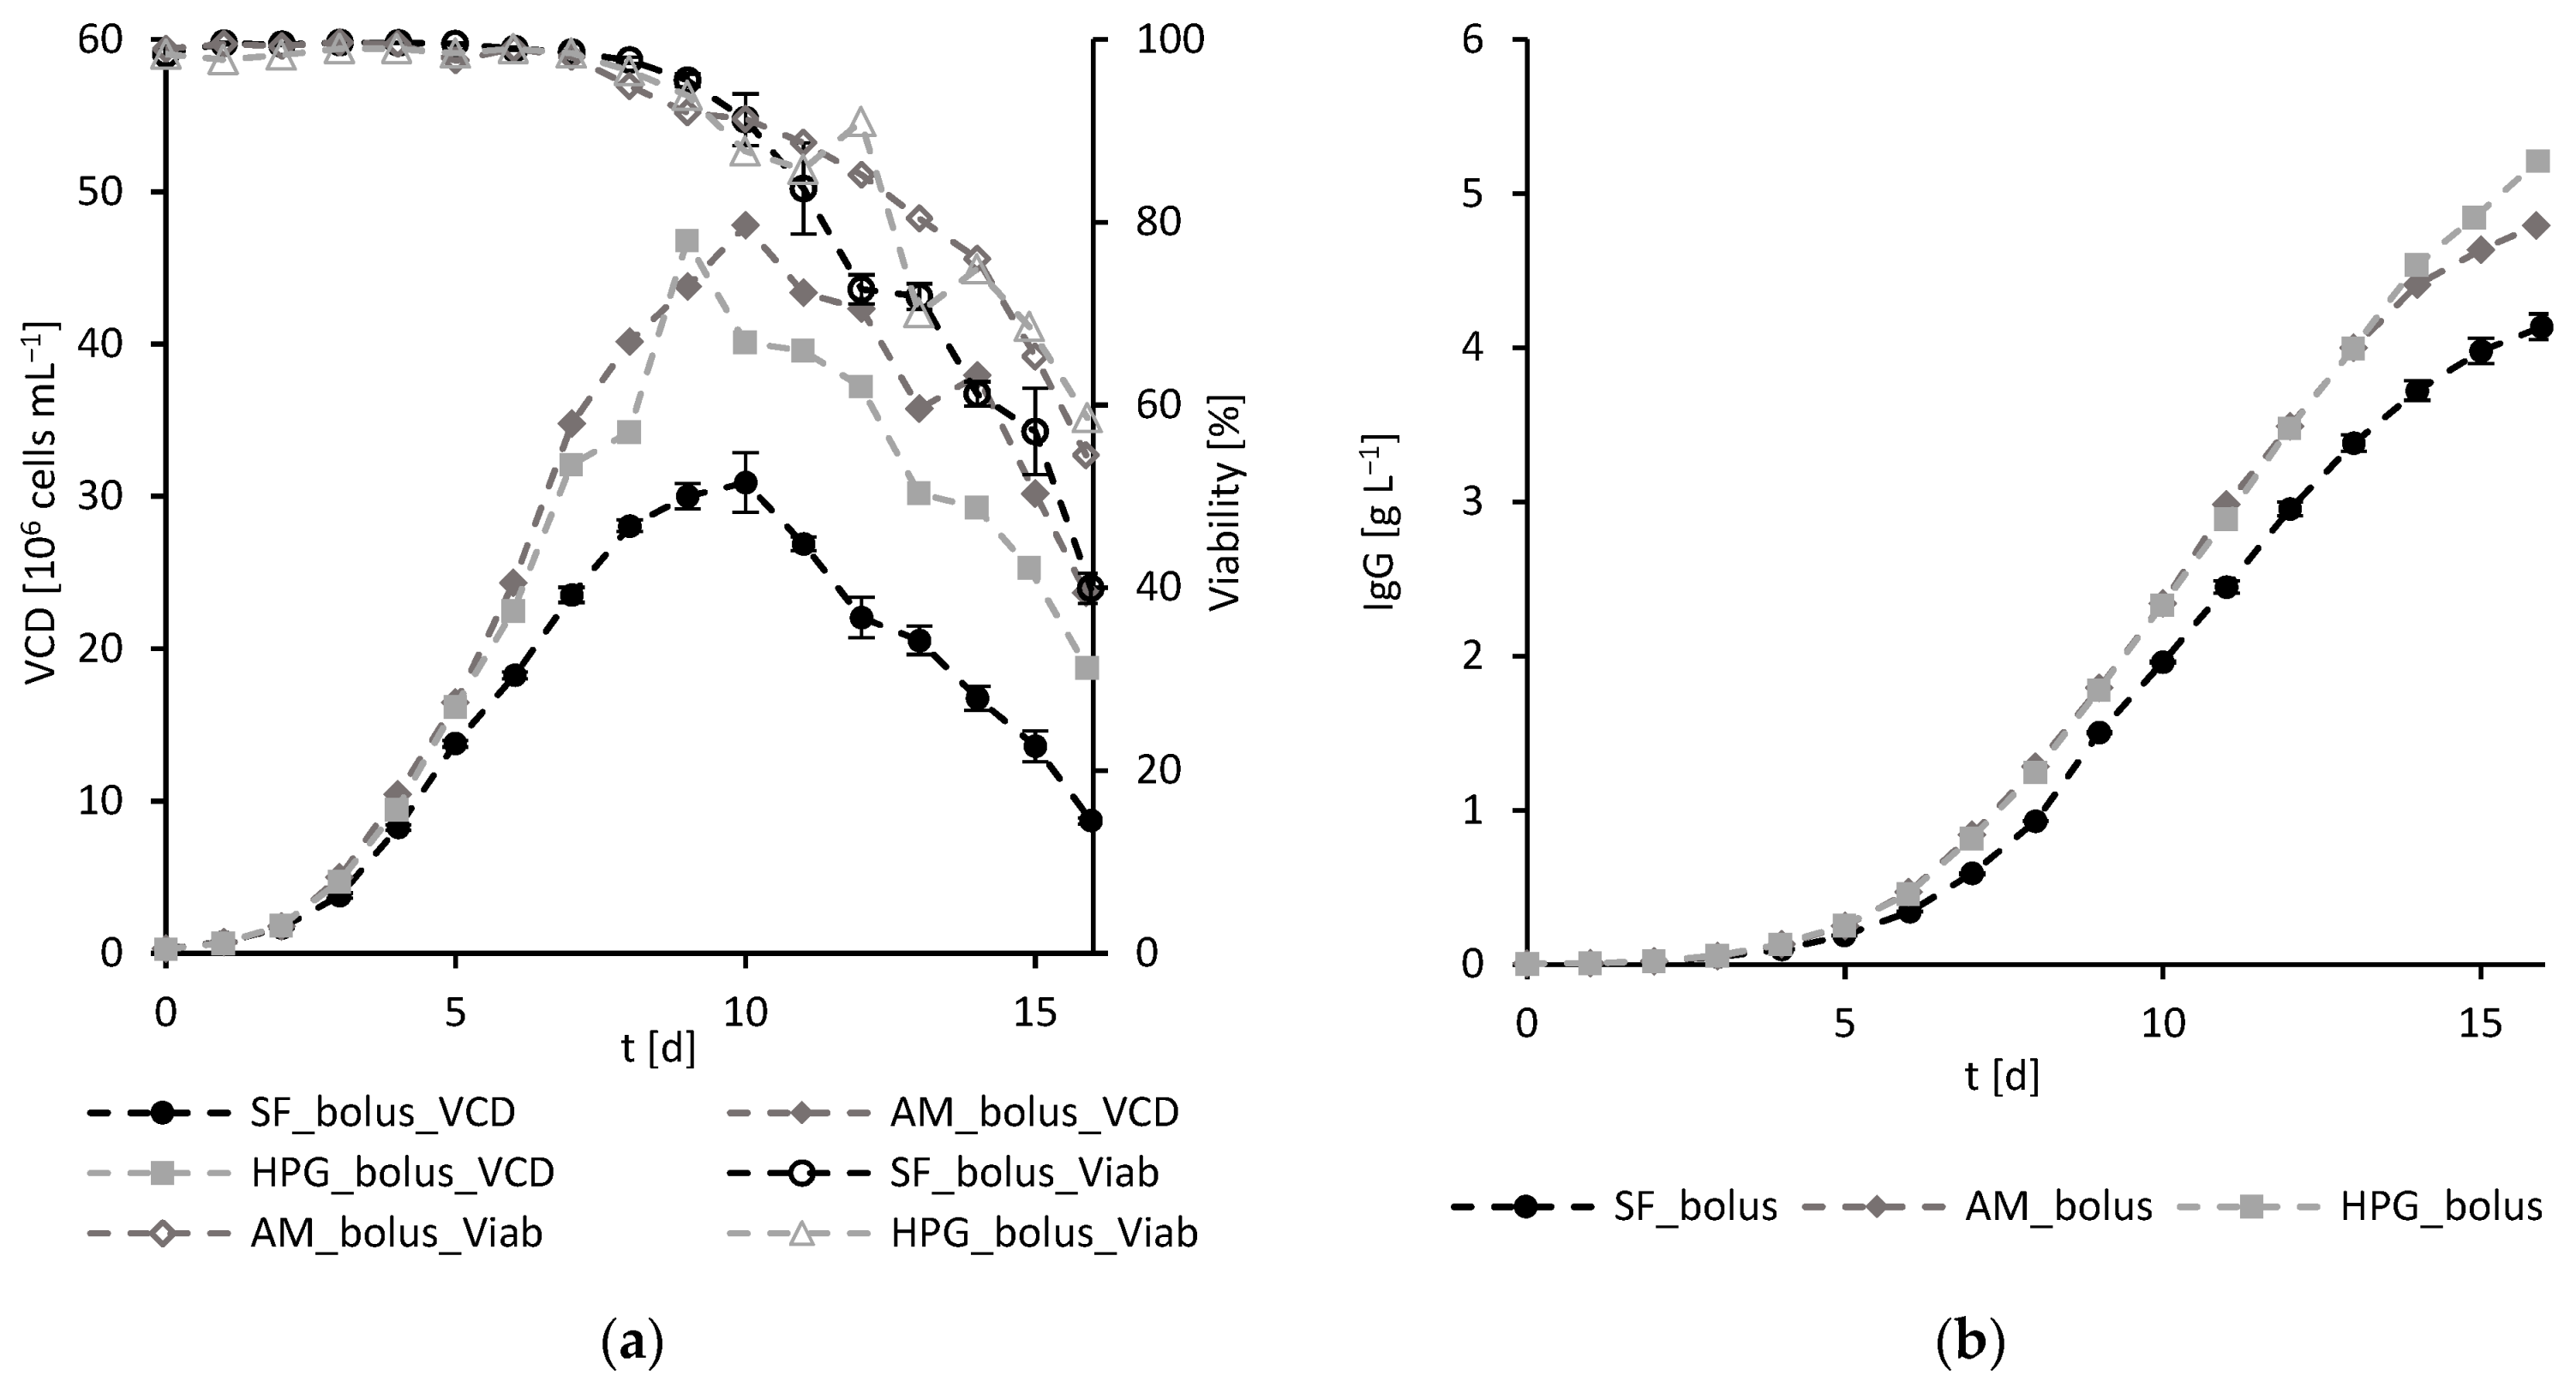
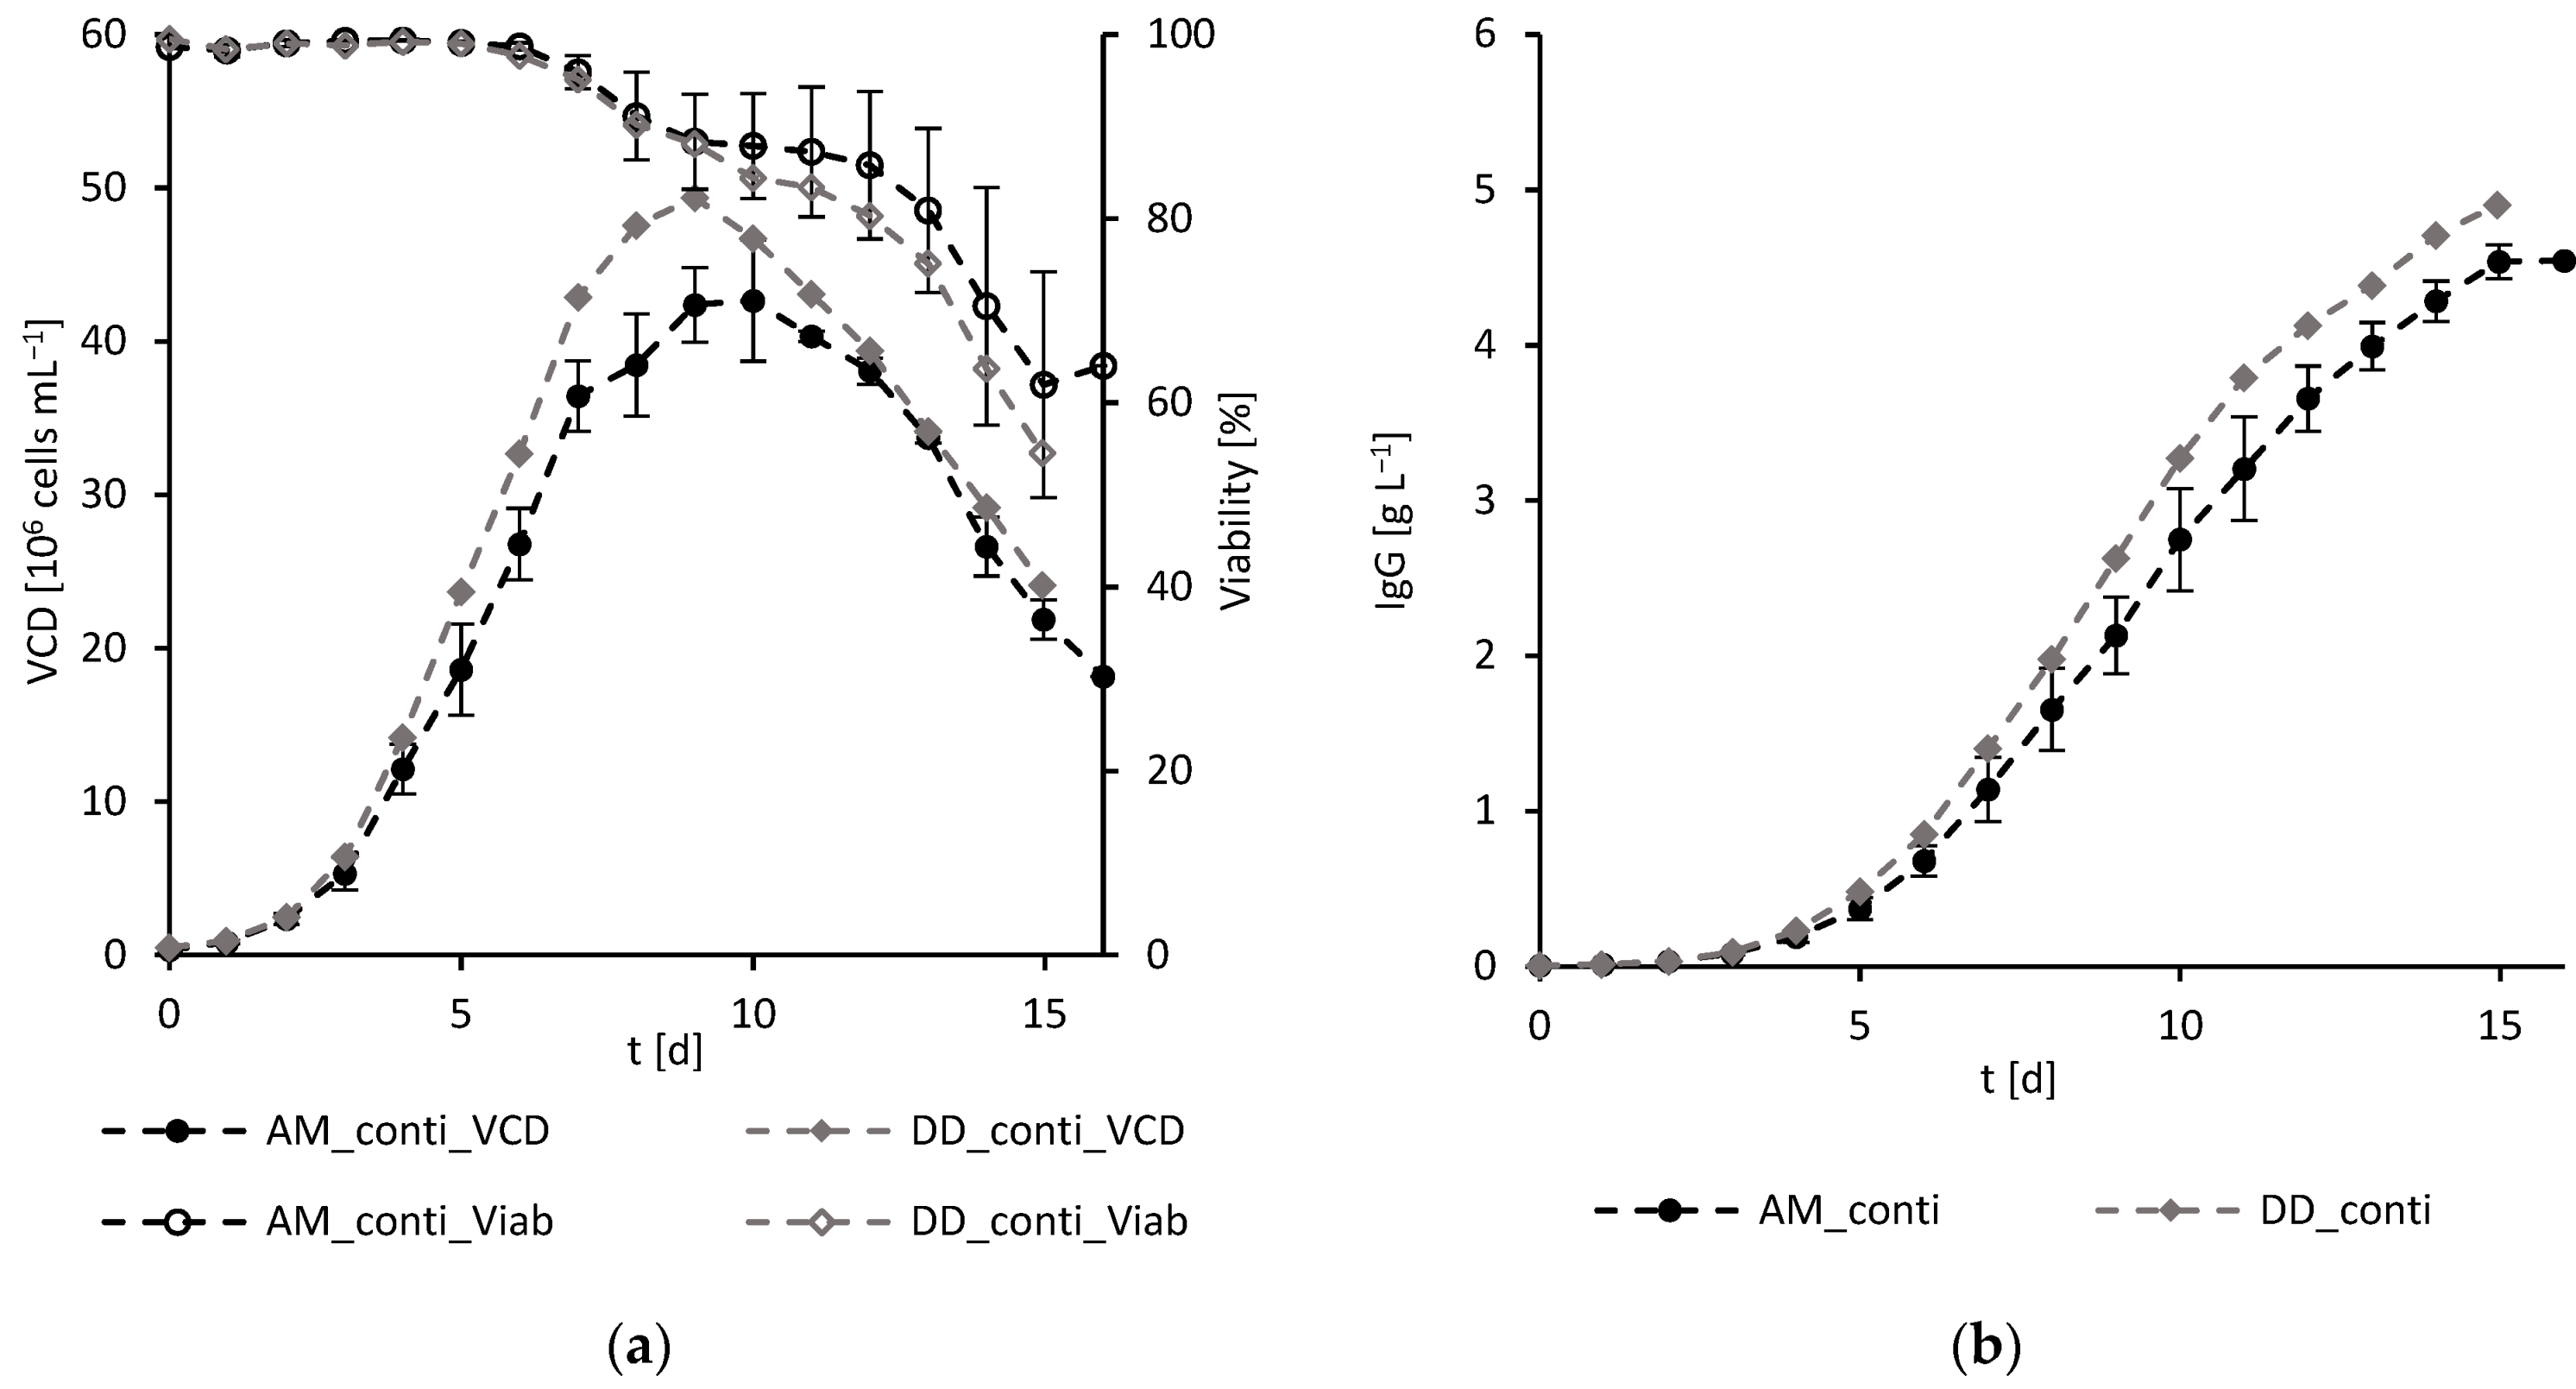
3.1.2. Experimental Results

Since lab-scale bioreactors, especially shake flasks, are usually fed using daily boluses, the fed-batch experiments in the shake flasks, the Ambr 250 vessel and the 3 L HyPerforma Glass bioreactor were also fed in this way. Growth and IgG production were comparable in the two stirred bioreactors, but were significantly lower in the shake flasks (Figure 2). A maximum VCD of 48 × 106 cells mL−1 was achieved in the Ambr 250, and in the HyPerforma Glass bioreactor, the maximum was 47 × 106 cells mL−1. However, the maximum VCD in the shake flasks was only 31 ± 2 × 10⁶ cells mL−1. Growth rates were comparable during the first four days but were consistently lower in the shake flask than in the stirred bioreactors afterwards (Figure 2a). A final IgG concentration of 4.1 ± 0.1 g L−1 was achieved in the shake flasks, 4.8 g L−1 in the Ambr 250, and 5.2 g L−1 in the HyPerforma Glass (Figure 2b).
To avoid concentration peaks resulting from the daily bolus feeding, continuous feeding can be implemented instead. Since the pumps in the Ambr system allow for very low flow rates, two cultivations were carried out in Ambr 250 vessels with continuous feeding. These cultivations were comparable to those with bolus feeding. The cells reached a maximum VCD of 49 × 106 cells mL−1 after 9 days in the HyPerforma DynaDrive, and 43 ± 4 × 10⁶ cells mL−1 was achieved in the Ambr 250 on day 10 (Figure 3a). At the time of harvest, 4.9 g L−1 IgG was measured in the HyPerforma DynaDrive and 4.5 ± 0.1 g L−1 in the Ambr 250 vessels (Figure 3b).
Glycosylation, charge variants and the ratio of antibody fragments and aggregates were analyzed as quality parameters. While the glycan distribution was very similar in the Ambr 250 cultivations and the HyPerforma DynaDrive cultivation, the proportion of G0F glycans was slightly higher in the shake flask cultivations and lower in the 2 L cultivation. Correspondingly, the proportion of G1F and G2F glycans was also lower or higher (Figure 4a). The charge variants were comparable in the agitated systems; however, in the shake flask, a slightly higher proportion of the uncharged variants and a lower proportion of acidic variants were measured (Figure 4b). The proportion of basic variants was less than 10% in all the cultivations. The proportion of monomers was >97% in all the fed-batch cultivations.

3.2. Perfusion

3.2.1. Scaling Considerations

Since the goal was to achieve even higher VCDs (up to over 100 × 106 cells mL−1) in perfusion mode, a comparable kLa value to that of the HyPerforma DynaDrive was selected as a scaling-down criterion for the 2 L cultivation. In the HyPerforma DynaDrive, a specific power input of 40 W m−3 was again selected, which corresponds to a kLa of 11 h−1 at a sparger gassing rate of 0.05 vvm. In the 2 L bioreactor, a speed of 435 min−1 was selected, corresponding to a kLa of 12 h−1 at 0.05 vvm.

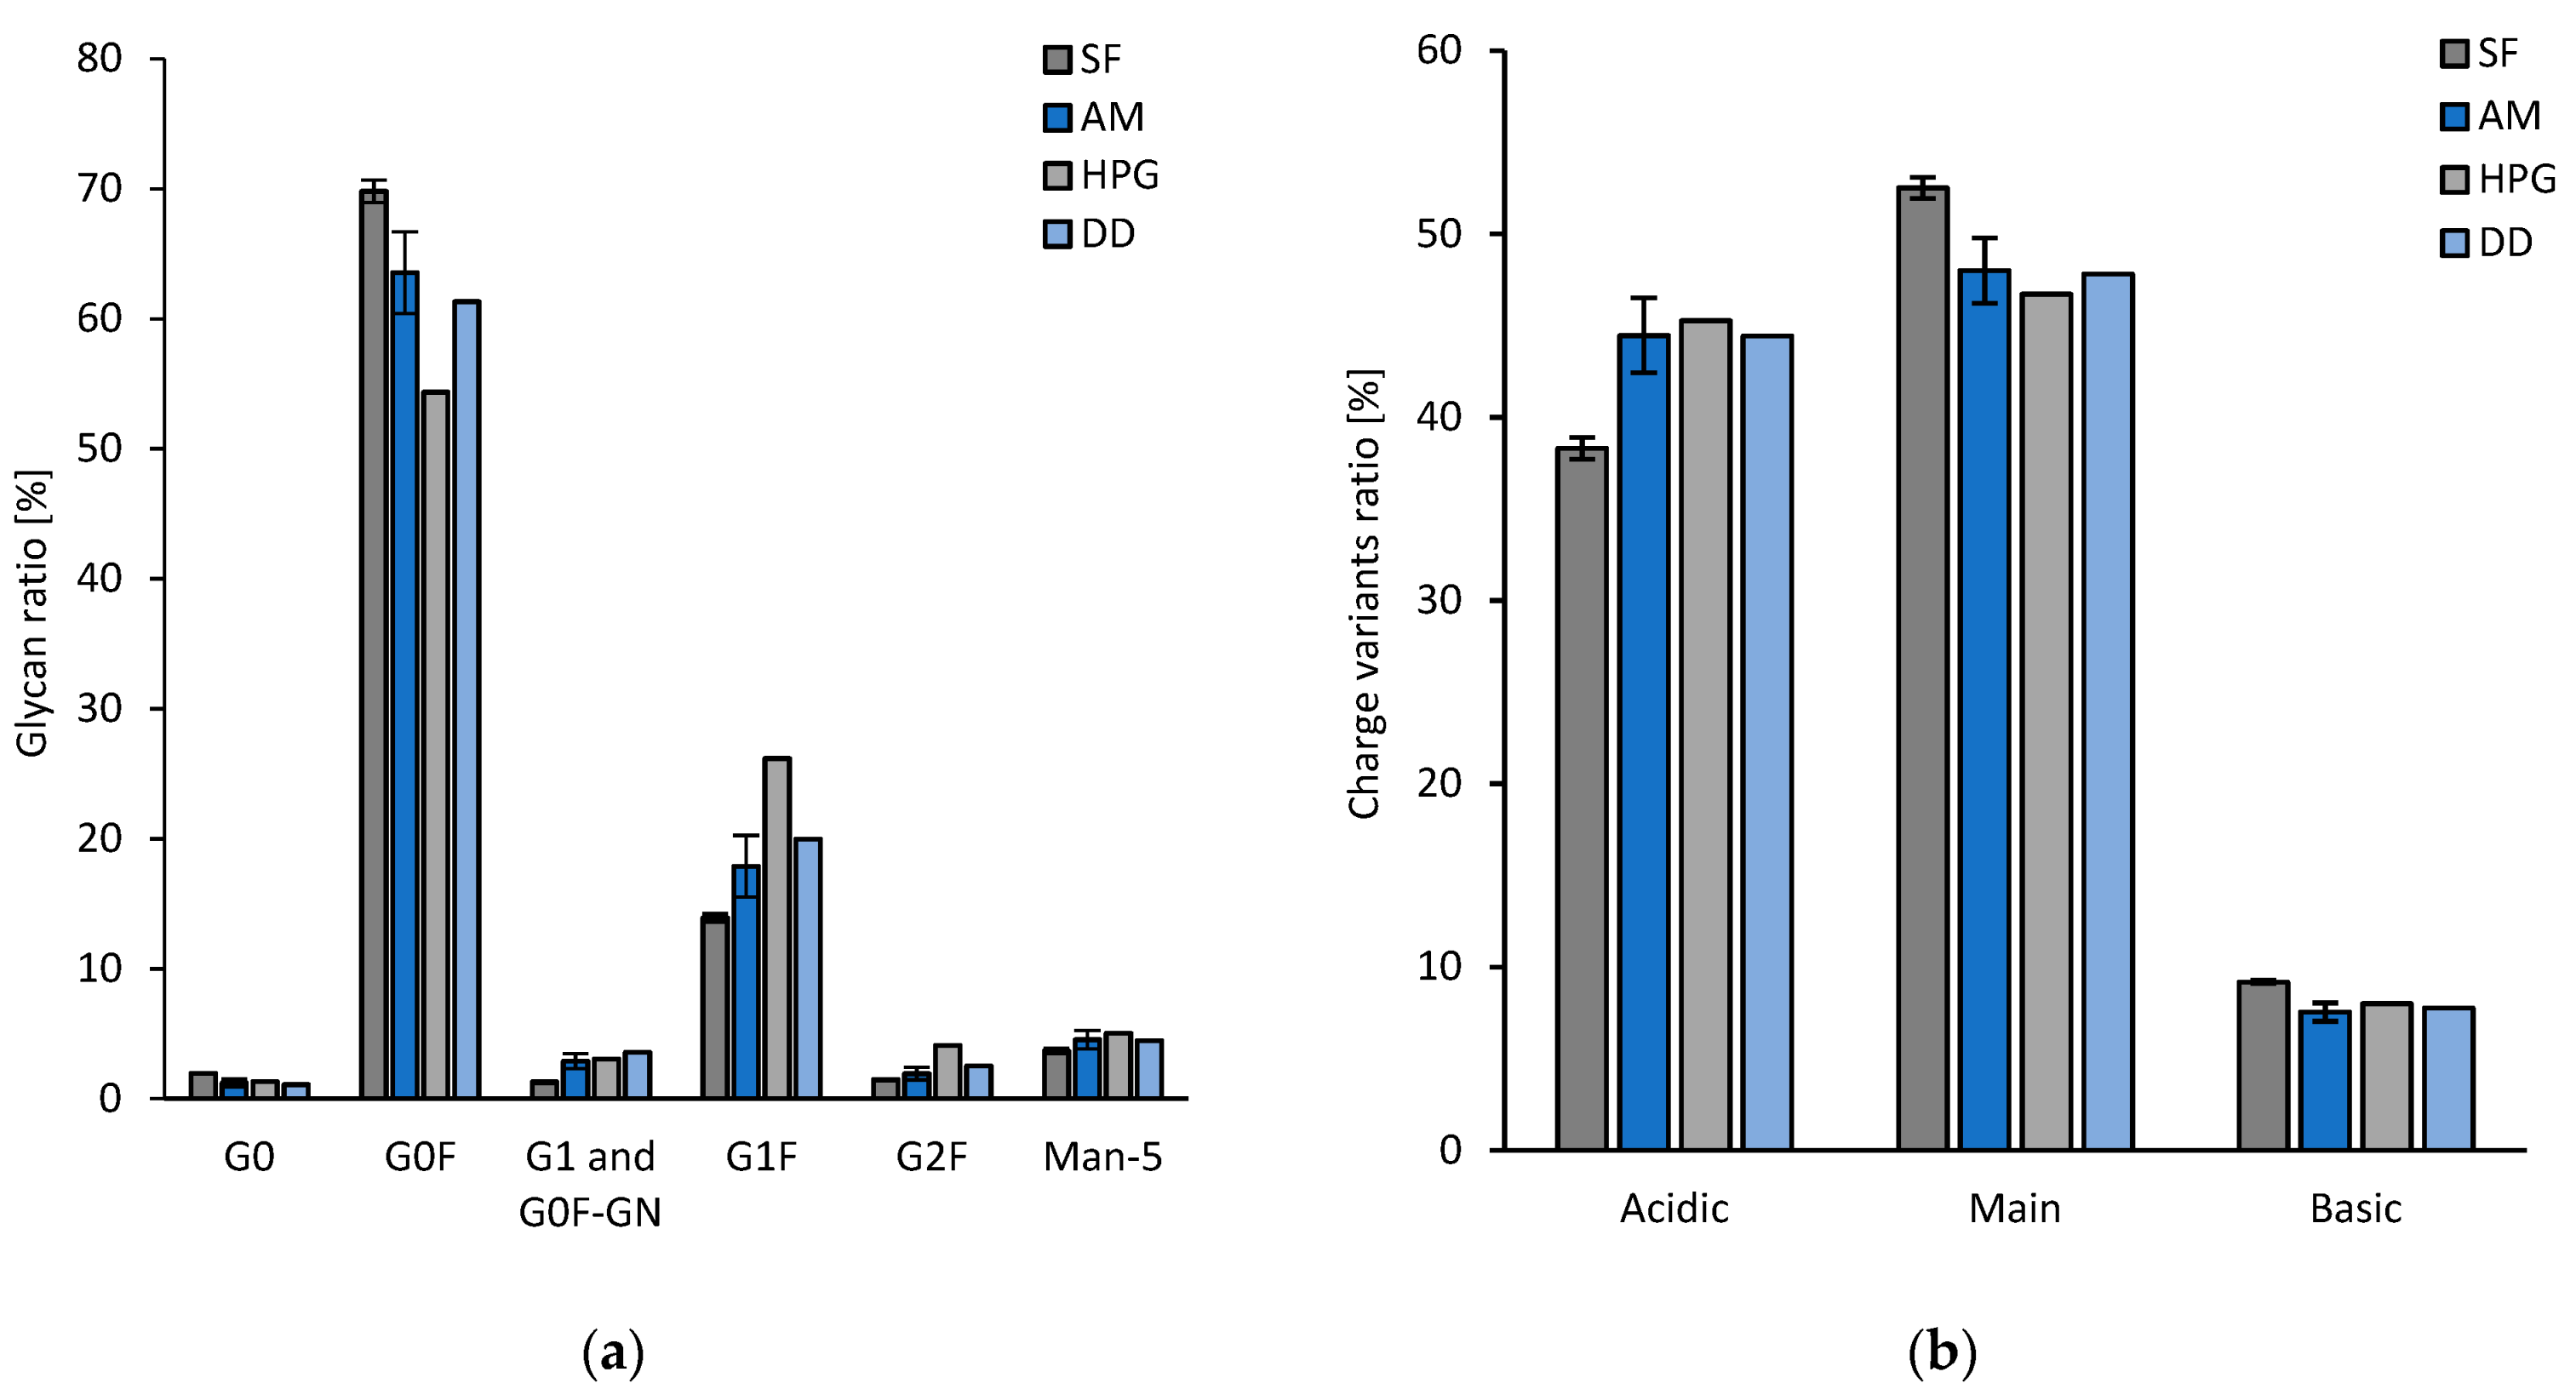
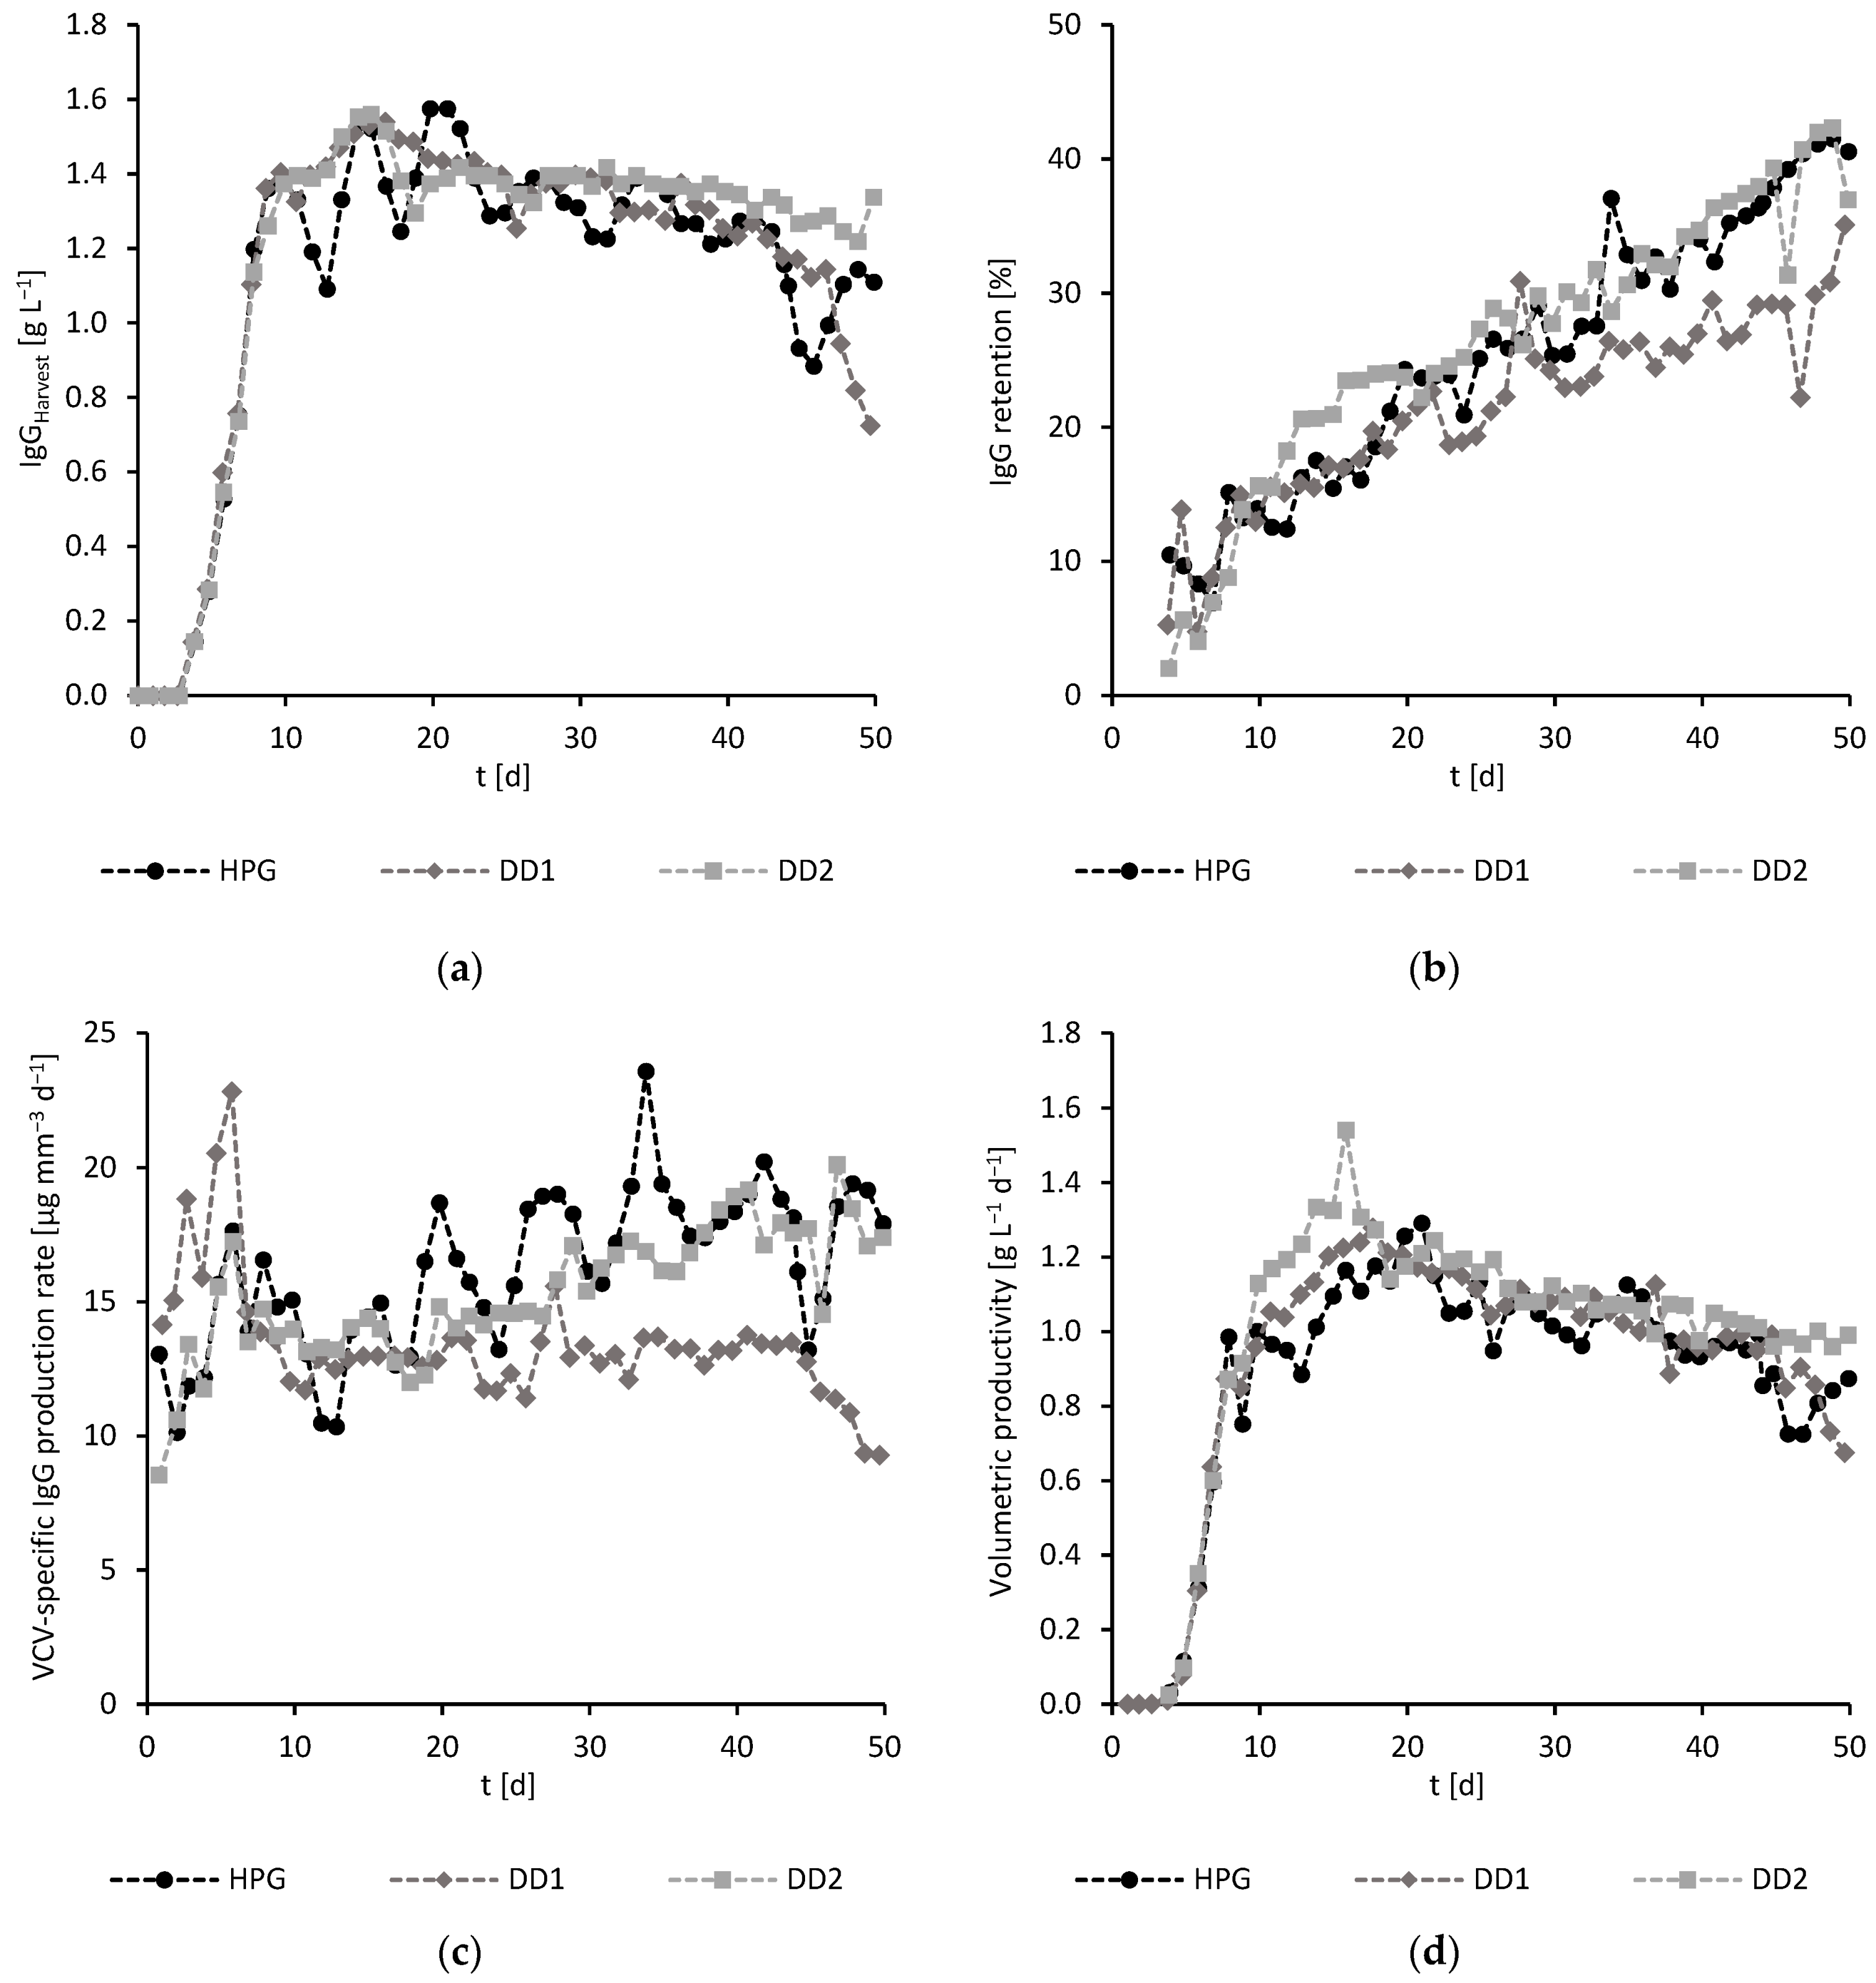
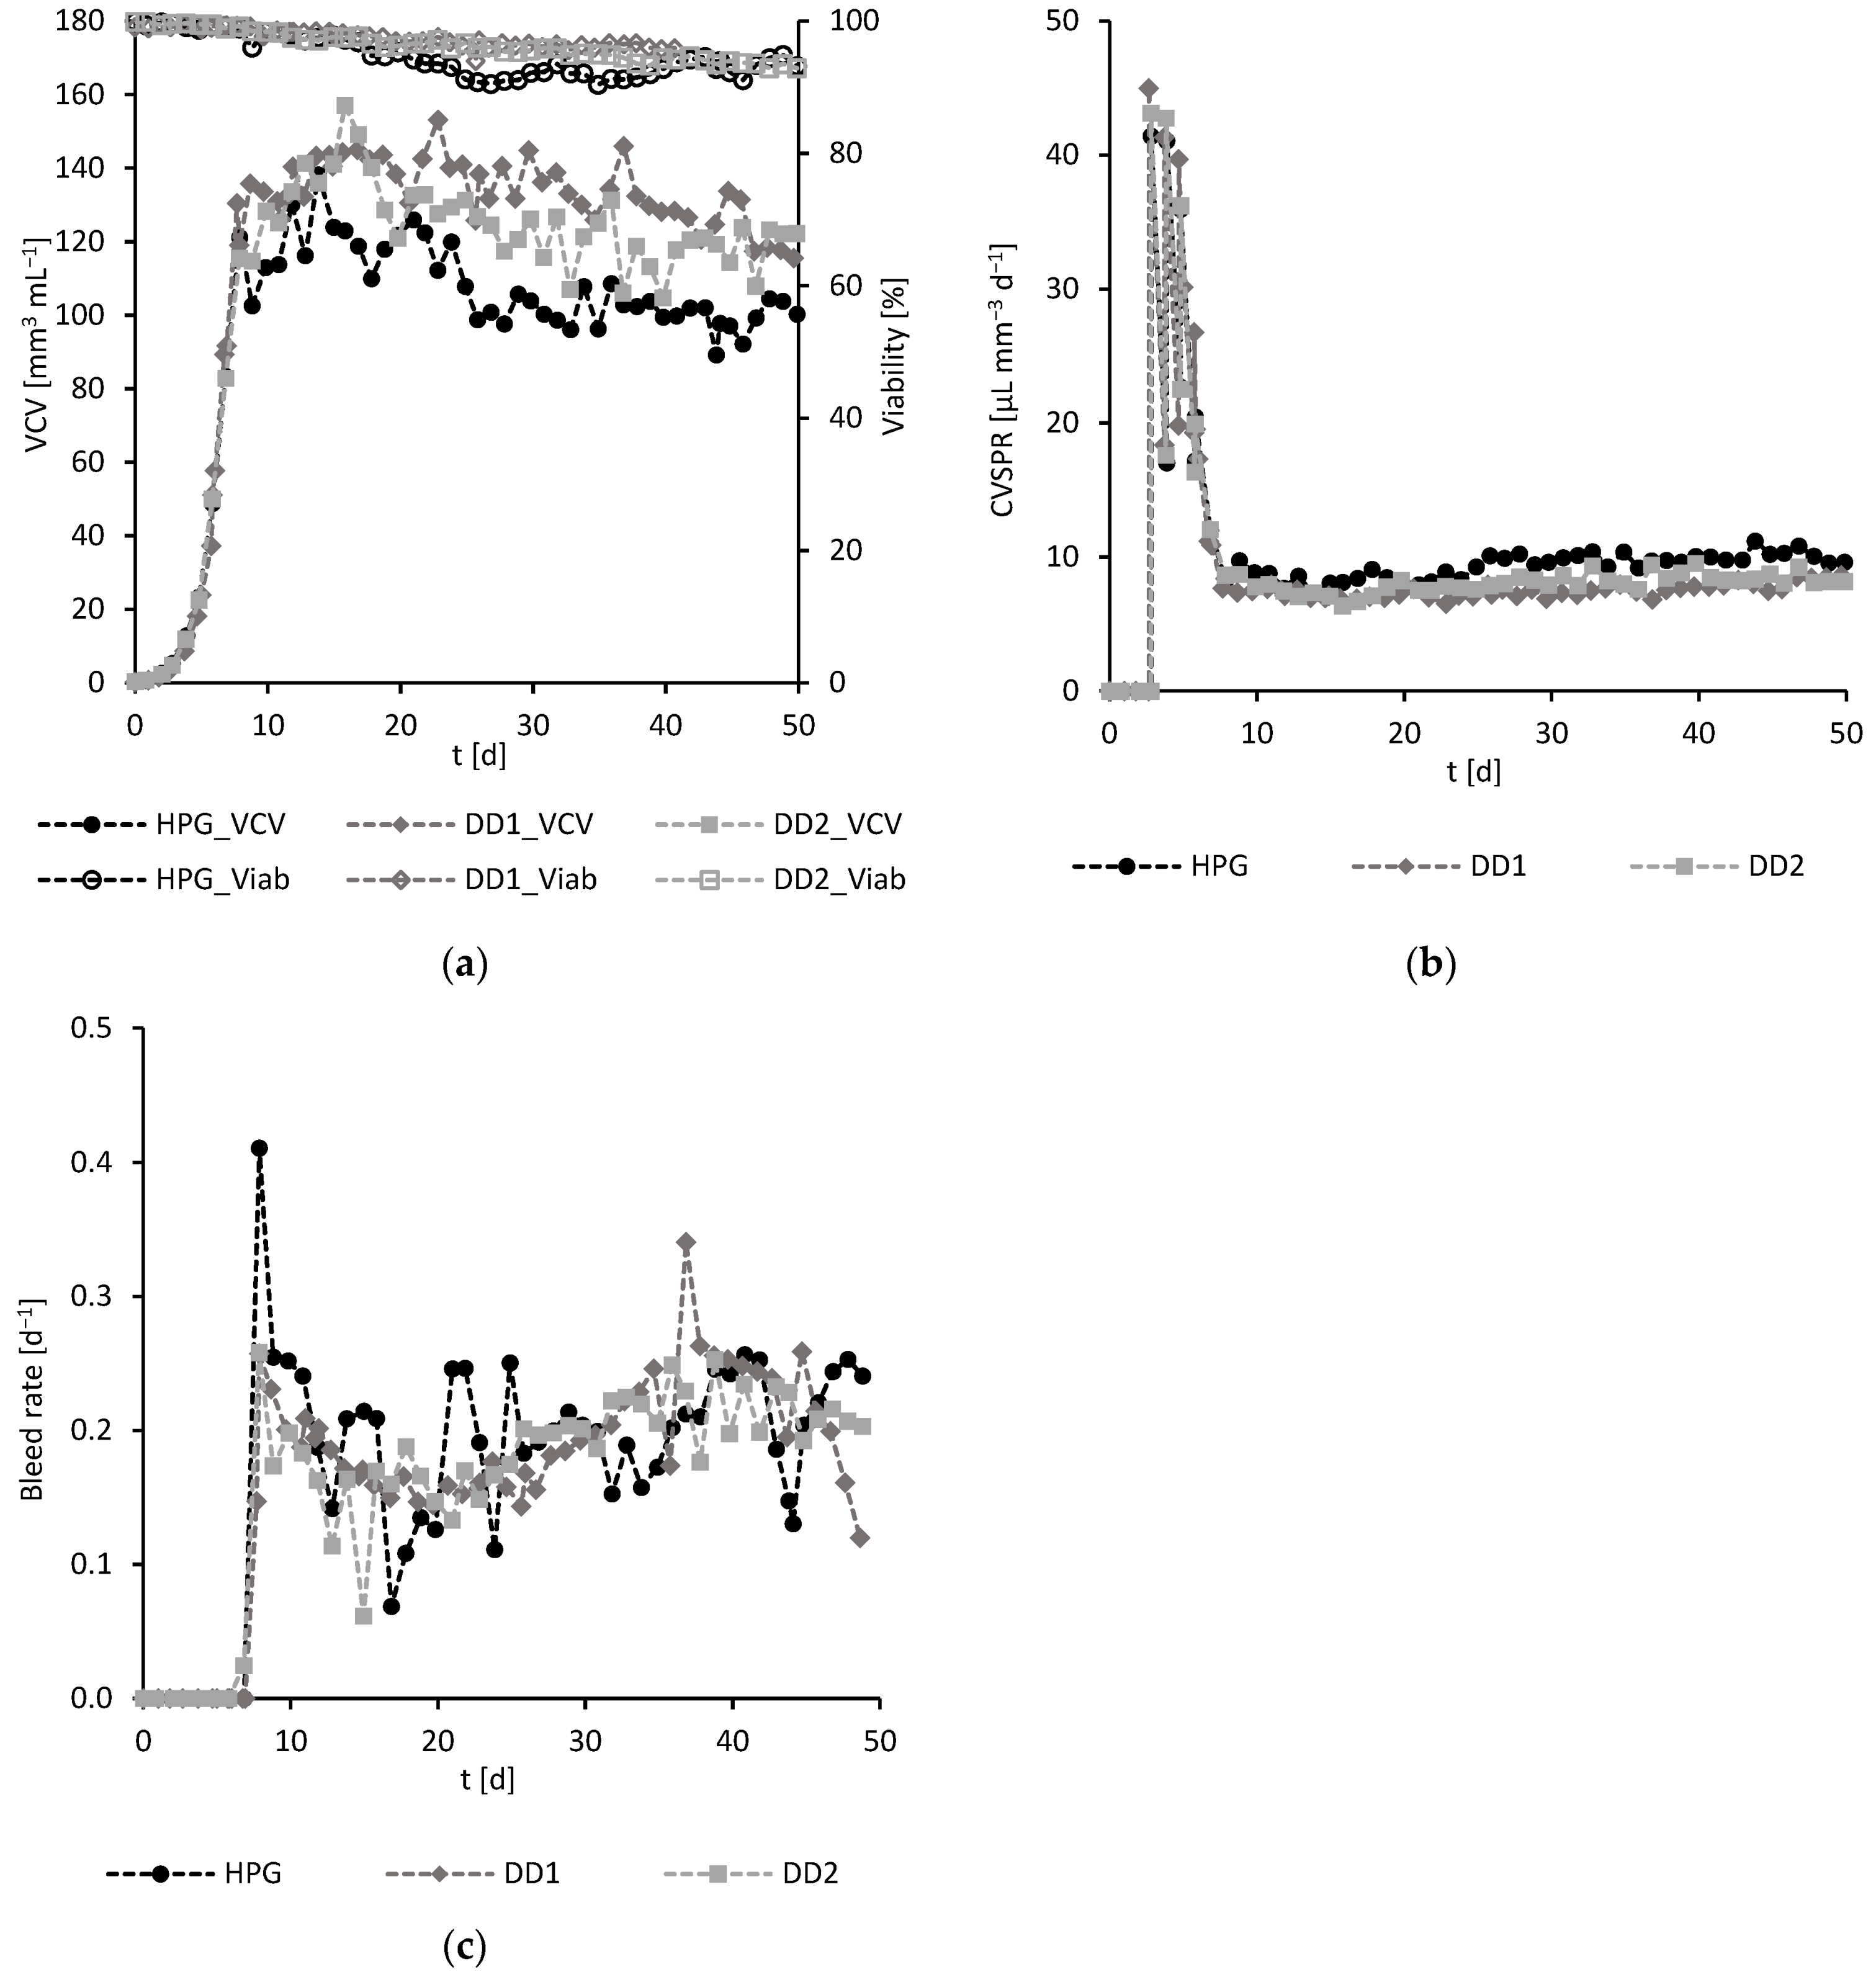
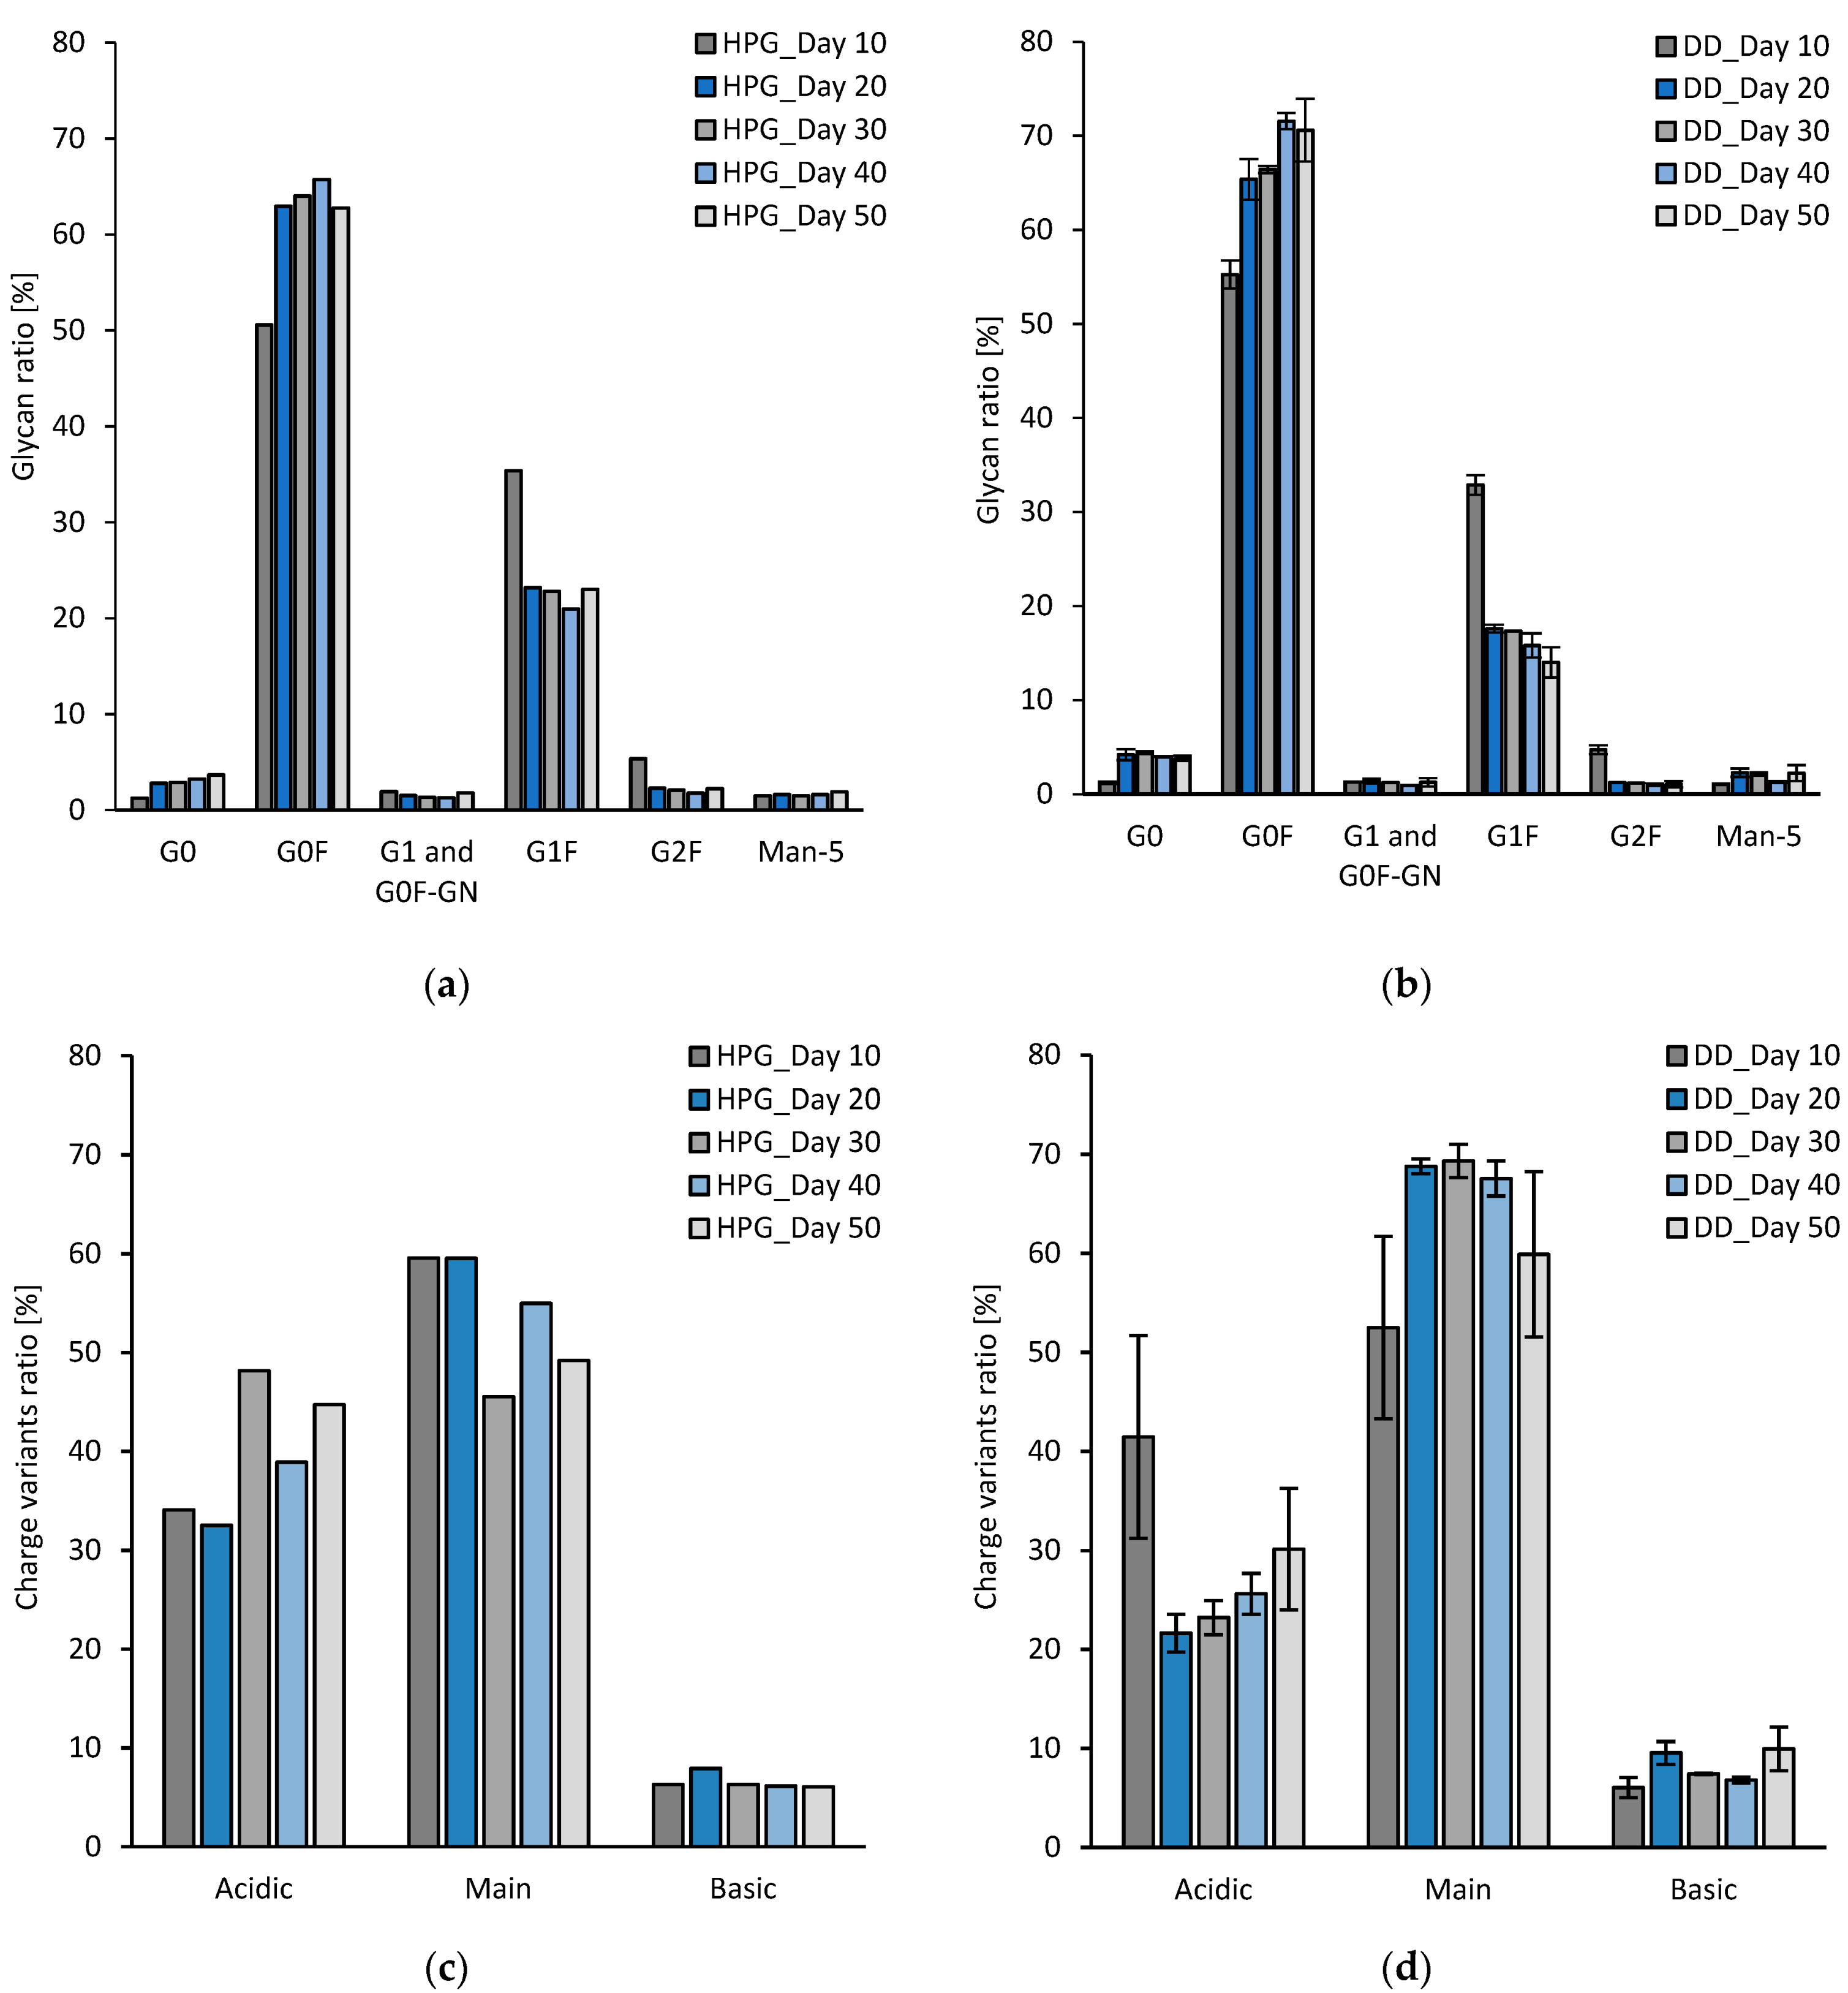
3.2.2. Experimental Results

In the three perfusion experiments, the goal was to achieve a constant VCV of 120–140 mm3 mL−1 from day 8 by regulating the bleed pump based on the permittivity. The VCVs decreased slowly until the end of cultivation but always stayed above 100 mm3 mL−1 for the 50 L runs (Figure 5). The VCV setpoint for the 2 L cultivation was set to 100 mm3 mL−1 from day 25 to counteract a further drop in viability. The measured VCVs between day 10 and day 50 were on average 108 ± 11 mm3 mL−1 (HPG), 134 ± 9 mm3 mL−1 (DD1), and 125 ± 11 mm3 mL−1 (DD2). In all the cultivations, viability remained above 90% until the termination of the experiment on day 50. Corresponding to the slightly lower biomass concentration in the 2 L experiment, the VCV-specific perfusion rate (CVSPR) was slightly higher in the 2 L experiment at 9.4 ± 0.9 µL mm3 d−1 compared to 7.5 ± 0.5 µL mm3 d−1 (DD1) and 8.0 ± 0.7 µL mm3 d−1 (DD2) between day 10 and 50 (Figure 5b). The bleed rate and thus the growth of the cells were comparable in all three experiments, with averages of 0.19 ± 0.04 d−1 in both 50 L cultivations and 0.20 ± 0.05 d−1 in the 2 L cultivation between day 10 and day 50 (Figure 5c).
Product formation was similar in all three cultivations (Figure 6). The IgG concentration in the harvest remained above 1.2 g L−1 between day 9 and day 43 (apart from day 12 and 13 in the 2 L experiment, Figure 6a). In one HyPerforma DynaDrive cultivation and the 2 L cultivation, the concentration dropped after 43 and 44 days; however, the concentration in the second 50 L cultivation was maintained until day 50. During the entire 50-day cultivation, the IgG retention of the ATF membrane continuously increased and reached values of about 30% in the first 50 L cultivation and about 40% in the second 50 L cultivation and the 2 L cultivation (Figure 6b). This retention mainly led to an increase in the concentration in the bioreactor, while the concentration in the harvest only decreased very slowly (Figure 6a).
On average, the VCV-specific IgG production rate between day 10 and day 50 was 12.5 ± 1.9 µg mm3 d−1 (HPG), 9.94 ± 1.2 µg mm3 d−1 (DD1) and 12.1 ± 1.0 µg mm3 d−1 (DD2) (Figure 6c). During the same period, the volumetric productivity of the bioreactors, based on the bioreactor working volume and the mass of antibodies harvested downstream of the ATF, was 1.01 ± 0.12 g L−1 d−1 (HPG) 1.05 ± 0.13 g L−1 d−1 (DD1) and 1.12 ± 0.12 g L−1 d−1 (DD2) (Figure 6d).
Based on the glycan profile, the antibody quality from the 2 L and the 50 L cultivations was comparable. Between the first and second quality assessments on day 10 and day 20, respectively, there was an increase in the G0F glycan proportion from 51% to 64% in the 2 L glass bioreactor and from 55 ± 1% to 65 ± 2% in the HyPerforma DynaDrive (Figure 7a,b). Between day 20 and 50, the percentage remained between 63% and 66% (HPG) and 65 ± 2% and 72 ± 1% (DD).
The charges of the antibodies did not show any clear trends (Figure 7c,d). However, in the second HyPerforma DynaDrive perfusion run, the course of the charge variants during the cultivation remained quite stable; the uncharged variant was already 62% on day 10 and remained constant between 68% and 71% from day 20 to day 50 (Figure 7d; always the upper limit of the error bar). The content of monomers stayed above 94% for all the perfusion runs.

4. Discussion

In this study, options were examined for transferring processes from cylindrical stirred laboratory bioreactors, such as the Ambr 250 and the HyPerforma Glass 3 L bioreactor, to the rectangular-shaped stirred 50 L HyPerforma DynaDrive, which is completely different in terms of design, stirrer configuration, and gassing. The objective was to achieve VCDs of up to 50 × 106 cells mL−1 in fed-batch mode and greater than 100 × 106 cells mL−1 in perfusion mode. Based on the assumption that the cells in the 50 L HyPerforma DynaDrive are sufficiently well supplied with oxygen at a specific power input of 40 W m−3, even for very high VCDs, and that this power input can also be easily transferred to the HyPerforma DynaDrive bioreactors up to the cubic meter scale, this specific power input was defined as the cultivation criterion for the pilot-scale experiments. Since this specific power input would not provide a sufficient oxygen input in the laboratory-scale bioreactors, other transfer criteria from the HyPerforma DynaDrive to the laboratory scale had to be taken into consideration. Assuming the CHO cells are able to tolerate relatively high shear forces, but that an identical kLa value would result in very high stirrer speeds in the Ambr 250, an identical stirrer tip speed to that in the HyPerforma DynaDrive at 40 W m−3 was used in the Ambr 250 as a consensus scaling criterion for the fed-batch experiments. In the 2 L perfusion run, where the goal was to achieve even higher VCDs, a comparable kLa value to that in the HyPerforma DynaDrive at 40 W m−3 was used.
The selected transfer criteria proved to be suitable for both the fed-batch and the perfusion experiments. In the 15- to 16-day fed-batch experiments, maximum VCDs between 43 and 49 × 106 cells mL−1 were achieved. Regardless of the bioreactor scale, the cultivations yielded comparable final titers of 4.5 to 5.2 g L−1 IgG in the stirred bioreactors. In the shake flasks, however, where oxygen limitation was assumed, only 31 ± 2 × 10⁶ cells mL−1 and 4.1 ± 0.1 g L−1 were achieved. The quality attributes of the mAbs differed slightly in the different bioreactors, but the Ambr 250 and the HyPerforma DynaDrive were comparable in terms of glycosylation, charge variants and the proportion of monomers. The results of the fed-batch cultivations in the shake flasks with lower VCDs and IgG titers show that controlled cultivation conditions can have a significant effect on the performance of the cell line. However, in controlled bioreactors gassed with pure oxygen, kLa values of only 8–14 h−1 are required to reach 50 × 106 cells mL−1 based on oxygen uptake rates (OURs) of between 1.4 and 2.5 mol cell−1 h−1, the range in which the middle 50% of the OUR data for CHO cells analyzed by Seidel et al. (2021) are found [32]. In contrast, high kLa values from 60 to over 100 h−1 are necessary in shake flasks that are gassed with an air–CO2 mixture [32]. However, such high kLa values can only be achieved with very high shaking rates. This leads to the conclusion that for process development with modern production cell lines, where cell densities far above 107 cells mL−1 are common, as far as possible for the final steps of cell line screening, it is advisable to use bioreactor systems with the highest levels of process control. There are review articles available that provide a detailed overview of microbioreactors that can be used for this purpose [33,34].
In perfusion mode, one ATF module per cultivation was successfully used for 50 days. There was good comparability between the cultivation with a 2 L working volume using the XCell ATF 2 and the two cultivations with a 50 L working volume using XCell ATF 6s. Although IgG retention increased steadily, it was possible to harvest an average of more than 1.0 g L−1 d−1 between day 10 and day 50. Further use of the IgG in the bleed, so-called bleed recycling [8,35], could make it possible to increase the volumetric productivity to over 1.3 g L−1 d−1. The use of the bioreactor weight for harvest control, a permittivity probe for bleed control and a glucose probe for glucose control enabled automated process control, with at-line sample analysis only serving to confirm the online values and to monitor additional parameters, such as metabolites and IgG quantity and quality.
The glycan profile was stable between day 20 and day 50 of the perfusion runs and comparable to the fed-batch results. For all processes, the glycosylation pattern was promising. The main glycans observed were G0F and G1F, which are also the main glycans that can be found in vivo [36]. At most sampling points in the perfusion runs, the uncharged variant of mAb was present at a higher ratio than in the fed-batch experiments. However, the content of monomers was slightly lower than in the fed-batch experiments, but nevertheless still above 94%.
Table 3 provides an overview of the volumetric productivity of the different processes on a 50 L scale. The HyPerforma DynaDrive in fed-batch mode delivered a space-time yield of 0.33 g L−1 d−1 IgG, while the two perfusion processes produced 0.91 and 0.97 g L−1 d−1. In the productive phase between day 10 and day 50, the volumetric productivity was 1.05 and 1.12 g L−1 d−1. Thus, the perfusion processes allowed for 2.8- to 3.0-times higher IgG titers to be produced. Bausch et al. reported a similar increase in space-time yield by a factor of 3 [9]. However, even higher increases have been reported in the literature [11,12], but these studies used cell lines that produced at the same time 3-times lower antibody titers in fed-batch mode than the cell line used in this work.
Intensifying the process by switching from fed-batch to perfusion mode can therefore roughly triple the productivity of a 50 L bioreactor. The importance of the associated cost reduction in antibody production for biopharmaceutical manufacturers is demonstrated by the market data for the antibody trastuzumab used in this study. Sales of the original product Herceptin amounted to USD 2.9 billion in 2021, and six biosimilars had come onto the market by June 2022 [1]. Trastuzumab is used for the treatment of HER2-positive breast cancer, with 6.36 g of antibody being required for the adjuvant therapy of a patient suffering from early breast cancer (weight: 60 kg) [37,38]. Assuming the yield of the downstream process is at least 80% (an overview of continuous downstream processes and their yield is given in [39]), more than 2,000 patients could be treated annually using the harvested product from a 50 L perfusion bioreactor (Table 3).

5. Conclusions

This work has successfully demonstrated the transferability of CHO-cell-based mAb production processes from geometrically dissimilar stirred bioreactors for fed-batch and perfusion processes. When scaling up the fed-batch process from the Ambr 250 to the HyPerforma DynaDrive, comparable cell densities, IgG titers and IgG qualities were achieved. The scaling of perfusion processes from the 2 L laboratory to the 50 L pilot scale was not only successful but also featured full in-line measurement control. This dual achievement underscores the scalability of Repligen’s ATF systems and the ability to maintain stable process control for over 50 days. The high volumetric productivity in the perfusion processes enables cost savings, reduces bioreactor sizes and maintains the manufacturing capacity in production plants. Alternatively, the yield could be increased by a factor of 2.8 to 3.2 while still using the same bioreactor size.

Author Contributions

Conceptualization, V.O., J.O., D.E. and R.E.; methodology, V.O. and J.O.; validation, V.O. and J.O.; formal analysis, V.O. and J.O.; investigation, V.O. and J.O.; resources, D.E. and R.E.; data curation, V.O. and J.O.; writing—original draft preparation, V.O. and J.O.; writing—review and editing, V.O., J.O., D.E. and R.E.; visualization, V.O. and J.O.; supervision, D.E. and R.E.; project administration, D.E. and R.E. All authors have read and agreed to the published version of the manuscript.

Funding

This research received no external funding.

Data Availability Statement

The data presented in this study are available on request from the corresponding author.

Acknowledgments

The authors would like to thank Thermo Fisher Scientific’s Bioproduction Group for providing the HyPerforma DynaDrive S.U.B., the G3Pro control unit, cells, and medium and their analytical support during the whole project. Special thanks here go to Troy Richards, Christopher Brau, Anatoly Tzekov and Raymond Cheng. Furthermore, we want to thank Repligen for providing the XCell ATF devices and the corresponding XCell ATF Large Scale Controller. Additionally, we want to thank Hamilton Bonaduz for providing the Incyte ARC permittivity probe and Mettler Toledo GmbH, C-CIT Sensors, for providing the glucose sensors and control units. Finally, we want to thank Andry Ehrhart and Lukas Hausherr for their support during the experimental phase.

Conflicts of Interest

The authors declare no conflicts of interest.

References

  1. Walsh, G.; Walsh, E. Biopharmaceutical Benchmarks 2022. Nat. Biotechnol. 2022, 40, 1722–1760. [Google Scholar] [CrossRef]
  2. MacDonald, M.A.; Nöbel, M.; Roche Recinos, D.; Martínez, V.S.; Schulz, B.L.; Howard, C.B.; Baker, K.; Shave, E.; Lee, Y.Y.; Marcellin, E.; et al. Perfusion Culture of Chinese Hamster Ovary Cells for Bioprocessing Applications. Crit. Rev. Biotechnol. 2022, 42, 1099–1115. [Google Scholar] [CrossRef]
  3. Wong, H.E.; Chen, C.; Le, H.; Goudar, C.T. From Chemostats to High-Density Perfusion: The Progression of Continuous Mammalian Cell Cultivation. J. Chem. Technol. Biotechnol. 2022, 97, 2297–2304. [Google Scholar] [CrossRef]
  4. Matanguihan, C.; Wu, P. Upstream Continuous Processing: Recent Advances in Production of Biopharmaceuticals and Challenges in Manufacturing. Curr. Opin. Biotechnol. 2022, 78, 102828. [Google Scholar] [CrossRef] [PubMed]
  5. Müller, J.; Teale, M.; Steiner, S.; Junne, S.; Neubauer, P.; Eibl, D.; Eibl, R. Intensified and Continuous MAb Production with Single-Use Systems. In Cell Culture Engineering and Technology; Pörtner, R., Ed.; Springer: Cham, Switzerland, 2021; pp. 401–429. ISBN 978-3-030-79871-0. [Google Scholar]
  6. Lavado-García, J.; Pérez-Rubio, P.; Cervera, L.; Gòdia, F. The Cell Density Effect in Animal Cell-Based Bioprocessing: Questions, Insights and Perspectives. Biotechnol. Adv. 2022, 60, 108017. [Google Scholar] [CrossRef]
  7. Schwarz, H.; Mäkinen, M.E.; Castan, A.; Chotteau, V. Monitoring of Amino Acids and Antibody N-Glycosylation in High Cell Density Perfusion Culture Based on Raman Spectroscopy. Biochem. Eng. J. 2022, 182, 108426. [Google Scholar] [CrossRef]
  8. Romann, P.; Kolar, J.; Chappuis, L.; Herwig, C.; Villiger, T.K.; Bielser, J.M. Maximizing Yield of Perfusion Cell Culture Processes: Evaluation and Scale-up of Continuous Bleed Recycling. Biochem. Eng. J. 2023, 193, 108873. [Google Scholar] [CrossRef]
  9. Bausch, M.; Schultheiss, C.; Sieck, J.B. Recommendations for Comparison of Productivity Between Fed-Batch and Perfusion Processes. Biotechnol. J. 2019, 14, 1700721. [Google Scholar] [CrossRef] [PubMed]
  10. Gomez, N.; Lull, J.; Yang, X.; Wang, Y.; Zhang, X.; Wieczorek, A.; Harrahy, J.; Pritchard, M.; Cano, D.M.; Shearer, M.; et al. Improving Product Quality and Productivity of Bispecific Molecules through the Application of Continuous Perfusion Principles. Biotechnol. Prog. 2020, 36, e2973. [Google Scholar] [CrossRef]
  11. Walther, J.; Lu, J.; Hollenbach, M.; Yu, M.; Hwang, C.; McLarty, J.; Brower, K. Perfusion Cell Culture Decreases Process and Product Heterogeneity in a Head-to-Head Comparison with Fed-Batch. Biotechnol. J. 2019, 14, 1700733. [Google Scholar] [CrossRef]
  12. Bielser, J.-M.; Chappuis, L.; Xiao, Y.; Souquet, J.; Broly, H.; Morbidelli, M. Perfusion Cell Culture for the Production of Conjugated Recombinant Fusion Proteins Reduces Clipping and Quality Heterogeneity Compared to Batch-Mode Processes. J. Biotechnol. 2019, 302, 26–31. [Google Scholar] [CrossRef] [PubMed]
  13. Arnold, L.; Lee, K.; Rucker-Pezzini, J.; Lee, J.H. Implementation of Fully Integrated Continuous Antibody Processing: Effects on Productivity and COGm. Biotechnol. J. 2019, 14, 1800061. [Google Scholar] [CrossRef] [PubMed]
  14. Mahal, H.; Branton, H.; Farid, S.S. End-to-End Continuous Bioprocessing: Impact on Facility Design, Cost of Goods, and Cost of Development for Monoclonal Antibodies. Biotechnol. Bioeng. 2021, 118, 3468–3485. [Google Scholar] [CrossRef] [PubMed]
  15. Narayanan, H.; Sponchioni, M.; Morbidelli, M. Integration and Digitalization in the Manufacturing of Therapeutic Proteins. Chem. Eng. Sci. 2022, 248, 117159. [Google Scholar] [CrossRef]
  16. Dreher, T.; Husemann, U.; Adams, T.; de Wilde, D.; Greller, G. Design Space Definition for a Stirred Single-Use Bioreactor Family from 50 to 2000 L Scale. Eng. Life Sci. 2014, 14, 304–310. [Google Scholar] [CrossRef]
  17. Tregidgo, M.; Dorn, M.; Lucas, C.; Micheletti, M. Design and Characterization of a Novel Perfusion Reactor for Biopharmaceuticals Production. Chem. Eng. Res. Des. 2023, 194, 344–357. [Google Scholar] [CrossRef]
  18. Nienow, A.W.; Scott, W.H.; Hewitt, C.J.; Thomas, C.R.; Lewis, G.; Amanullah, A.; Kiss, R.; Meier, S.J. Scale-down Studies for Assessing the Impact of Different Stress Parameters on Growth and Product Quality during Animal Cell Culture. Chem. Eng. Res. Des. 2013, 91, 2265–2274. [Google Scholar] [CrossRef]
  19. Sieck, J.B.; Cordes, T.; Budach, W.E.; Rhiel, M.H.; Suemeghy, Z.; Leist, C.; Villiger, T.K.; Morbidelli, M.; Soos, M. Development of a Scale-Down Model of Hydrodynamic Stress to Study the Performance of an Industrial CHO Cell Line under Simulated Production Scale Bioreactor Conditions. J. Biotechnol. 2013, 164, 41–49. [Google Scholar] [CrossRef] [PubMed]
  20. Freiberger, F.; Budde, J.; Ateş, E.; Schlüter, M.; Pörtner, R.; Möller, J. New Insights from Locally Resolved Hydrodynamics in Stirred Cell Culture Reactors. Processes 2022, 10, 107. [Google Scholar] [CrossRef]
  21. Jossen, V.; Eibl, R.; Eibl, D. Single-Use Bioreactors—An Overview. In Single-Use Technology in Biopharmaceutical Manufacture; Eibl, R., Eibl, D., Eds.; Wiley: Hoboken, NJ, USA, 2019; pp. 37–52. ISBN 9781119477891. [Google Scholar]
  22. Thermo Fisher Scientific HyPerforma DynaDrive Single-Use Bioreactor Service Guide. Available online: https://assets.thermofisher.com/TFS-Assets/BPD/Reference-Materials/hyperforma-dynadrive-single-use-bioreactor-service-guide-2022.pdf (accessed on 23 November 2023).
  23. Schirmer, C.; Müller, J.; Steffen, N.; Werner, S.; Eibl, R.; Eibl, D. How to Produce MAbs in a Cube-Shaped Stirred Single-Use Bioreactor at 200 L Scale. In Animal Cell Biotechnology: Methods and Protocols; Pörtner, R., Ed.; Humana Press: New York, NY, USA, 2020; pp. 169–186. ISBN 978-1-0716-0191-4. [Google Scholar]
  24. Thermo Fisher Scientific Data Sheet—HyPerforma DynaDrive Single-Use Bioreactor. Available online: https://assets.thermofisher.com/TFS-Assets/BPD/Datasheets/50l-dynadrive-sub-data-sheet.pdf (accessed on 23 November 2023).
  25. Karimi Alavijeh, M.; Baker, I.; Lee, Y.Y.; Gras, S.L. Digitally Enabled Approaches for the Scale up of Mammalian Cell Bioreactors. Digit. Chem. Eng. 2022, 4, 100040. [Google Scholar] [CrossRef]
  26. Kaiser, S.C. Characterization and Optimization of Single-Use Bioreactors and Biopharmaceutical Production Processes Using Computational Fluid Dynamics. Doctoral Thesis, Technische Universität, Berlin, Germany, 2014. [Google Scholar]
  27. Junker, B.H. Scale-up Methodologies for Escherichia Coli and Yeast Fermentation Processes. J. Biosci. Bioeng. 2004, 97, 347–364. [Google Scholar] [CrossRef] [PubMed]
  28. Maschke, R.W.; Seidel, S.; Bley, T.; Eibl, R.; Eibl, D. Determination of Culture Design Spaces in Shaken Disposable Cultivation Systems for CHO Suspension Cell Cultures. Biochem. Eng. J. 2022, 177, 108224. [Google Scholar] [CrossRef]
  29. Liepe, F.; Sperling, R.; Jembere, S. Rührwerke: Theoretische Grundlagen, Auslegung und Bewertung; Fachhochschule Anhalt: Köthen, Germany, 1998; ISBN 9783000031953. [Google Scholar]
  30. Zlokarnik, M. Rührtechnik—Theorie und Praxis; Springer: Berlin/Heidelberg, Germany, 1999; ISBN 978-3-642-63675-2. [Google Scholar]
  31. Nienow, A.W. Re “Development of a Scale-down Model of Hydrodynamic Stress to Study the Performance of an Industrial CHO Cell Line under Simulated Production Scale Bioreactor Conditions” [Sieck, J.B., Cordes, T., Budach, W.E., Rhiel, M.H., Suemeghy, Z., Leist, C., Villiger, T.K., Morbidelli, M., Soos, M., 2013. Journal of Biotechnology 164, 41–49]. J. Biotechnol. 2014, 171, 82–84. [Google Scholar] [CrossRef] [PubMed]
  32. Seidel, S.; Maschke, R.W.; Werner, S.; Jossen, V.; Eibl, D. Oxygen Mass Transfer in Biopharmaceutical Processes: Numerical and Experimental Approaches. Chem. Ing. Tech. 2021, 93, 42–61. [Google Scholar] [CrossRef]
  33. Teworte, S.; Malcı, K.; Walls, L.E.; Halim, M.; Rios-Solis, L. Recent Advances in Fed-Batch Microscale Bioreactor Design. Biotechnol. Adv. 2022, 55, 107888. [Google Scholar] [CrossRef]
  34. Frey, L.J.; Krull, R. Microbioreactors for Process Development and Cell-Based Screening Studies. In Microfluidics in Biotechnology. Advances in Biochemical Engineering/Biotechnology; Bahnemann, J., Grünberger, A., Eds.; Springer: Cham, Switzerland, 2020; Volume 179, pp. 67–100. ISBN 978-3-031-04188-4. [Google Scholar]
  35. Bielser, J.M.; Chami, J.; Markarian, J. Continuous Bleed Recycling Significantly Increases Recombinant Protein Production Yield in Perfusion Cell Cultures. Biochem. Eng. J. 2021, 169, 107966. [Google Scholar] [CrossRef]
  36. Jefferis, R. Glycosylation of Recombinant Antibody Therapeutics. Biotechnol. Prog. 2005, 21, 11–16. [Google Scholar] [CrossRef]
  37. Cameron, D.; Piccart-Gebhart, M.J.; Gelber, R.D.; Procter, M.; Goldhirsch, A.; de Azambuja, E.; Castro, G.; Untch, M.; Smith, I.; Gianni, L.; et al. 11 Years’ Follow-up of Trastuzumab after Adjuvant Chemotherapy in HER2-Positive Early Breast Cancer: Final Analysis of the HERceptin Adjuvant (HERA) Trial. Lancet 2017, 389, 1195–1205. [Google Scholar] [CrossRef]
  38. European Medicines Agency Summary of Product Characteristics—Herceptin. Available online: https://www.ema.europa.eu/en/documents/product-information/herceptin-epar-product-information_en.pdf (accessed on 29 November 2023).
  39. Gerstweiler, L.; Bi, J.; Middelberg, A.P.J. Continuous Downstream Bioprocessing for Intensified Manufacture of Biopharmaceuticals and Antibodies. Chem. Eng. Sci. 2021, 231, 116272. [Google Scholar] [CrossRef]
Figure 1. Simplified representation of the elements required to regulate the 2 L and 50 L perfusion cultivations. WICR = weight indicating control recording; XICR = concentration indicating control recording; measuring and control point XICR 1 = measuring and regulation of glucose concentration and XICR 2 = measuring and regulation of the VCV.
Processes 12 00806 g001
Figure 2. Course of (a) VCD and viability, and (b) IgG concentration during the fed-batch experiments performed with bolus feeding (nomenclature: SF = shake flask, AM = Ambr 250, HPG = HyPerforma Glass bioreactor, bolus = bolus feeding and Viab = viability). n = 3 for SF experiments, n = 1 for AM and HPG experiments; error bars represent the standard deviation.
Processes 12 00806 g002
Figure 3. Course of (a) VCD and viability, and (b) IgG concentration during the fed-batch experiments performed with continuous feeding (nomenclature: AM = Ambr 250, DD = HyPerforma DynaDrive bioreactor, conti = continuous feeding, and Viab = viability). n = 1 for DD experiment, n = 2 for AM experiments; error bars represent the data range.
Processes 12 00806 g003
Figure 4. (a) N-glycosylation profile (glycans that are less than 1% of the total glycan content are not shown), and (b) charge variant profile of the produced mAbs on day 14 of the fed-batch processes (nomenclature: SF = shake flask, AM = Ambr 250, HPG = HyPerforma Glass bioreactor, DD = HyPerforma DynaDrive bioreactor). n = 3 for SF and AM experiments, n = 1 for HPG and DD experiment; error bars represent the standard deviation.
Processes 12 00806 g004
Figure 5. Course of (a) VCV and viability, (b) viable cell volume specific perfusion rate (CVSPR), and (c) bleed rate during the three perfusion experiments performed with continuous feeding (nomenclature: HPG = HyPerforma Glass bioreactor, DD = HyPerforma DynaDrive bioreactor, Viab = viability).
Processes 12 00806 g005
Figure 6. Course of (a) concentration of IgG in the harvest (IgGHarvest), (b) IgG retention through the ATF, (c) VCV-specific IgG production rate, and (d) volumetric productivity during the three perfusion experiments (nomenclature: HPG = HyPerforma Glass bioreactor, DD = HyPerforma DynaDrive bioreactor).
Processes 12 00806 g006
Figure 7. N-glycosylation profile (glycans that are less than 1% of the total glycan content are not shown) during (a) the perfusion run in the 2 L bioreactor, and (b) the perfusion runs in the DynaDrive. Charge variant profile during (c) the perfusion run in the 2 L bioreactor, and (d) the perfusion runs in the DynaDrive (nomenclature: HPG = HyPerforma Glass bioreactor, DD = HyPerforma DynaDrive bioreactor). n = 1 for HPG experiment, n = 2 for DD experiments; error bars represent the data range.
Processes 12 00806 g007
Table 1. Cultivation parameters for fed-batch cultivations in the three different stirred bioreactors.
ParameterAmbr 2503 L HyPerforma GlassHyPerforma DynaDrive
Volume175–220 mL1.45–2.0 L35–50 L
Temperature37 °C37 °C37 °C
Feed additionBolus or continuousBolusContinuous
Stirrer configuration2× pitched blade (3 blades)2× pitched blade (3 blades)Flexible rope
ladder with
3× pitched blade (2 blades)
1× sweep impeller (2 blades)
Stirrer speed522–582 min−1200–250 min−1125–140 min−1
Stirrer tip speed0.71–0.79 m s−10.59–0.73 m s−10.71–0.79 m s−1
Specific power input60–90 W m−330–63 W m−340 W m−3
SpargerOpen pipe spargerRing spargerDrilled hole sparger
pH≤7.15 (CO2 via sparger)≤7.15 (CO2 via sparger)≤7.15 (CO2 via sparger)
DO≥40% (O2 and air via sparger)≥40% (O2 via sparger)=40% (N2, O2 and air via sparger)
Table 2. Cultivation parameters for perfusion cultivations.
Parameter3 L HyPerforma GlassHyPerforma DynaDrive
Volume2 L50 L
Temperature37 °C37 °C
Cell retentionXCell ATF 2 single-useXCell ATF 6 single-use
Stirrer configuration2× pitched blade
(3 blades)
Flexible rope
ladder with
3× pitched blade
(2 blades)
1× sweep impeller
(2 blades)
Stirrer speed435 min−1136.5 min−1
Stirrer tip speed1.28 m s−10.77 m s−1
Specific power input320 W m−340 W m−3
SpargerRing spargerDrilled hole sparger
pH≤7.15 (CO2 via sparger)≤7.15 (CO2 via sparger)
DO≥40% (O2 and air via sparger)=40% (N2, O2 and air via sparger)
Table 3. Comparison of productivity in fed-batch and perfusion mode and possible number of therapies. * During the productive phase between day 10 and 50. ** Assuming 6.36 g mAbs per year per woman (60 kg) and 80% mAb recovery in the downstream process.
Fed BatchPerfusion
Process duration [d]1550
Yield per 50 L batch [kg]0.2452.28–2.44
Space-time yield [g L−1 d−1]0.330.91–0.97
Volumetric productivity * [g L−1 d−1]-1.05–1.12
Annual productivity (50 L bioreactor) [kg]6.016.6–17.7
Increase [%]-179–197
Possible annual therapies **7502089–2227
Disclaimer/Publisher’s Note: The statements, opinions and data contained in all publications are solely those of the individual author(s) and contributor(s) and not of MDPI and/or the editor(s). MDPI and/or the editor(s) disclaim responsibility for any injury to people or property resulting from any ideas, methods, instructions or products referred to in the content.

