
Converting Candlenut Shell Waste into Graphene for Electrode Applications

 , ,
, ,  , ,
, ,  , , , , , ,
  and
and
Abstract
1. Introduction
2. Materials and Methods
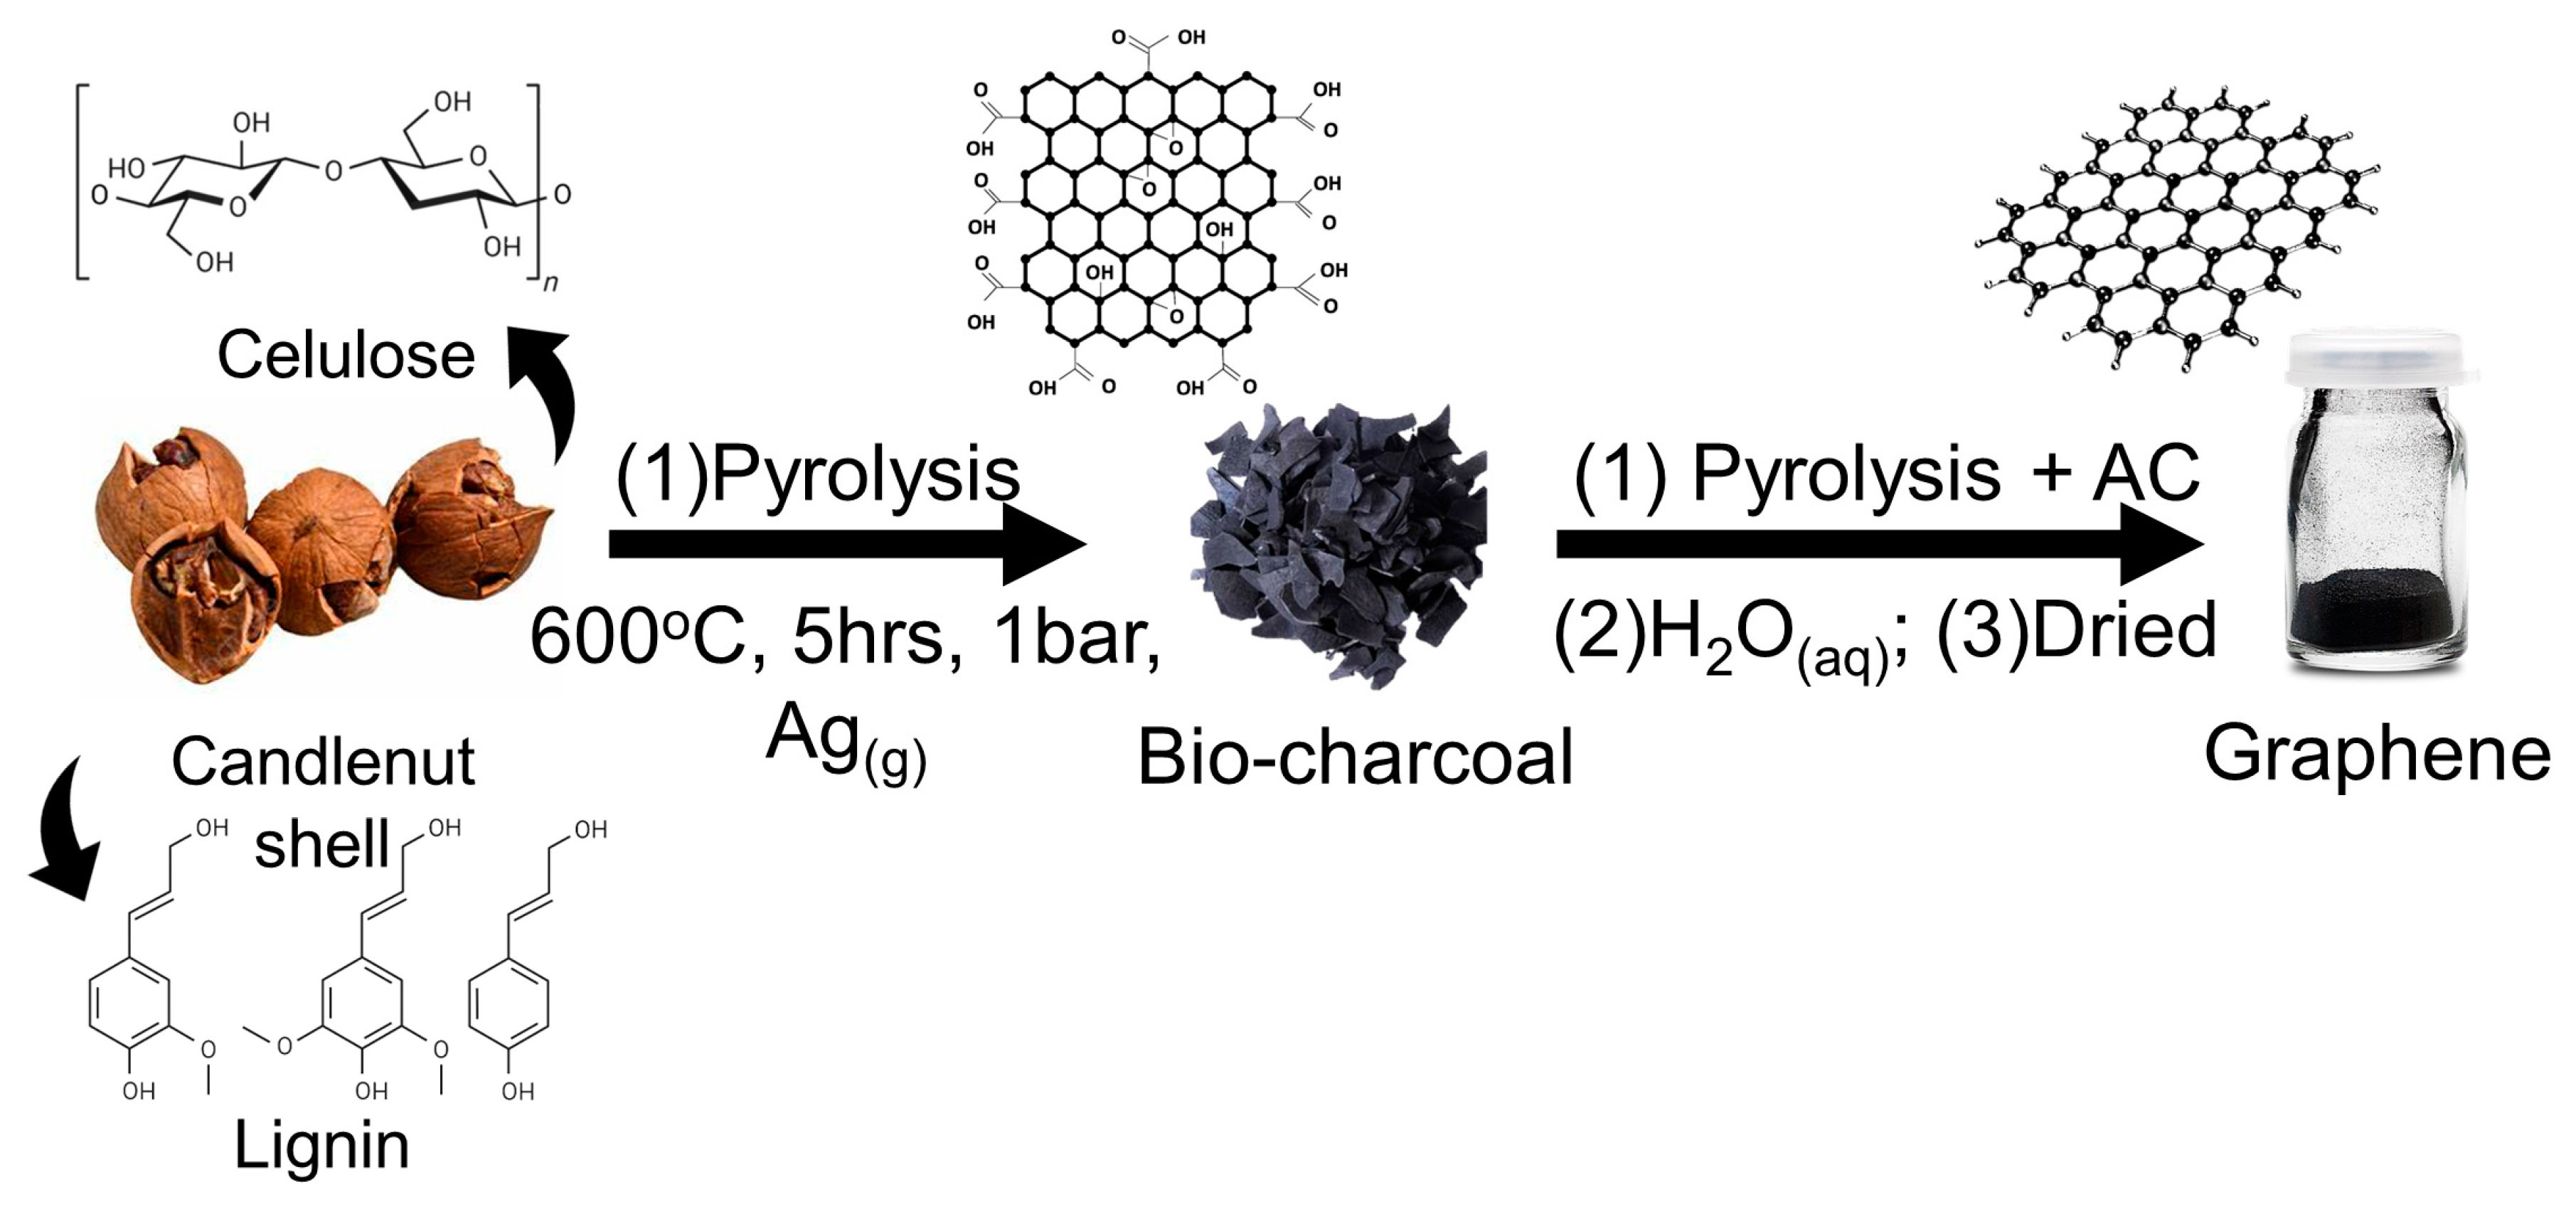
2.1. Preparations of Candlenut Graphene Nano Sheets (GNS)
2.2. Doping of GNS
2.3. Preparation of Electrodes
2.4. Electrochemistry Experiment
2.5. AC Electrical Resistance Experiment
3. Results and Discussion
3.1. XRD
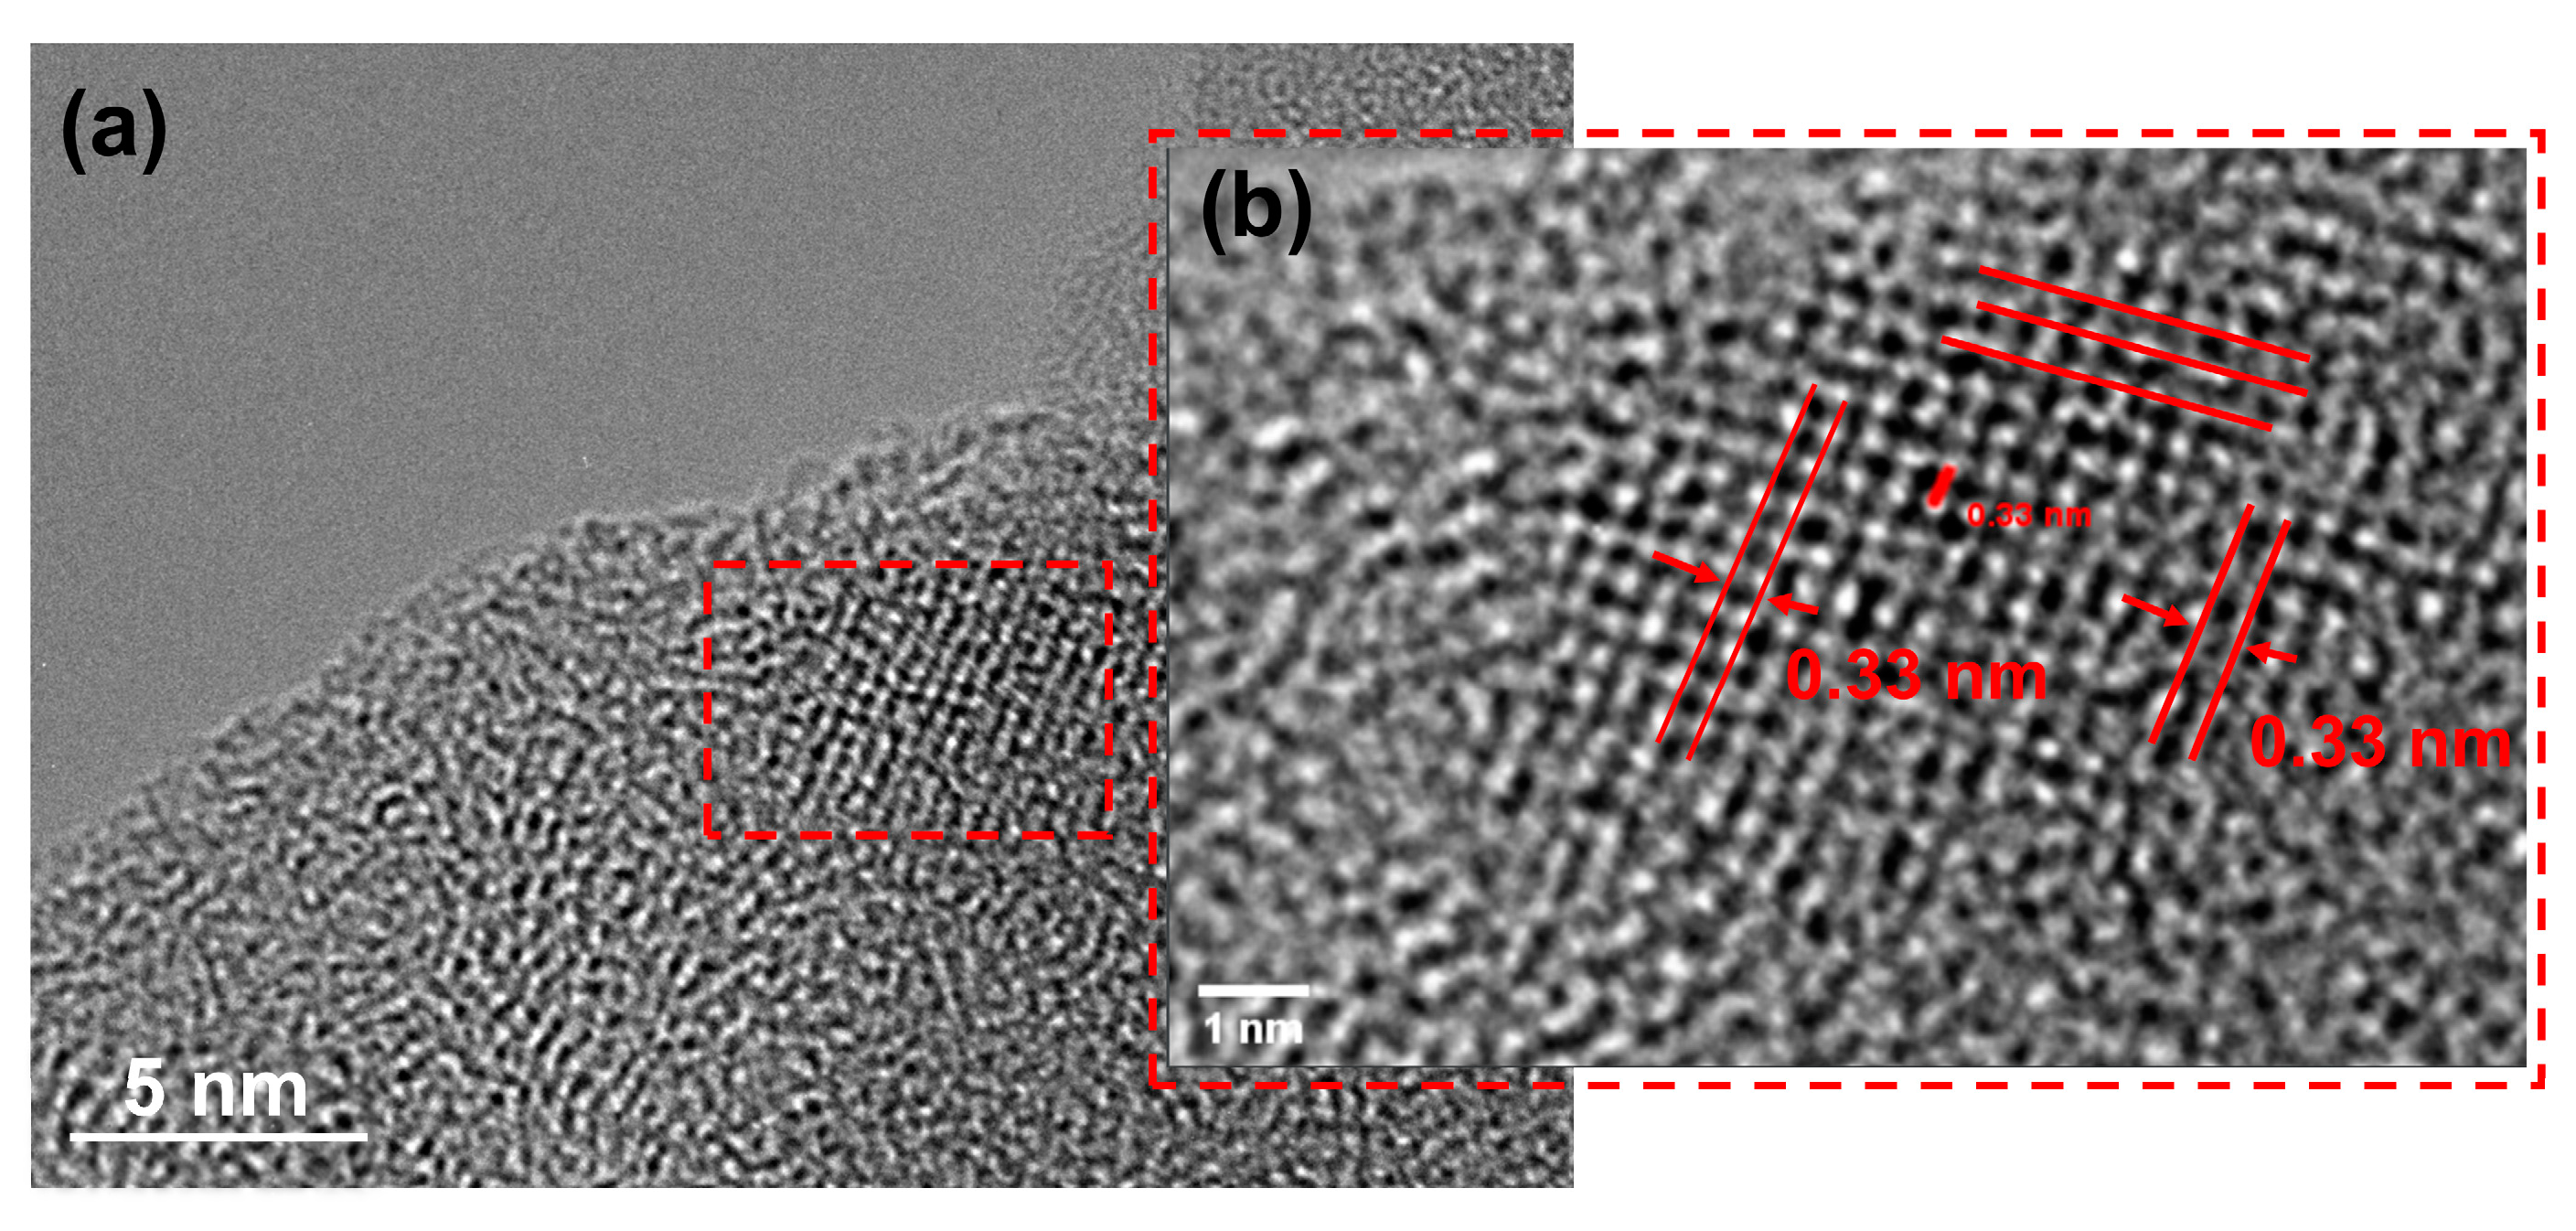
3.2. SEM–EDX
3.3. TGA
3.4. FTIR
3.5. XPS
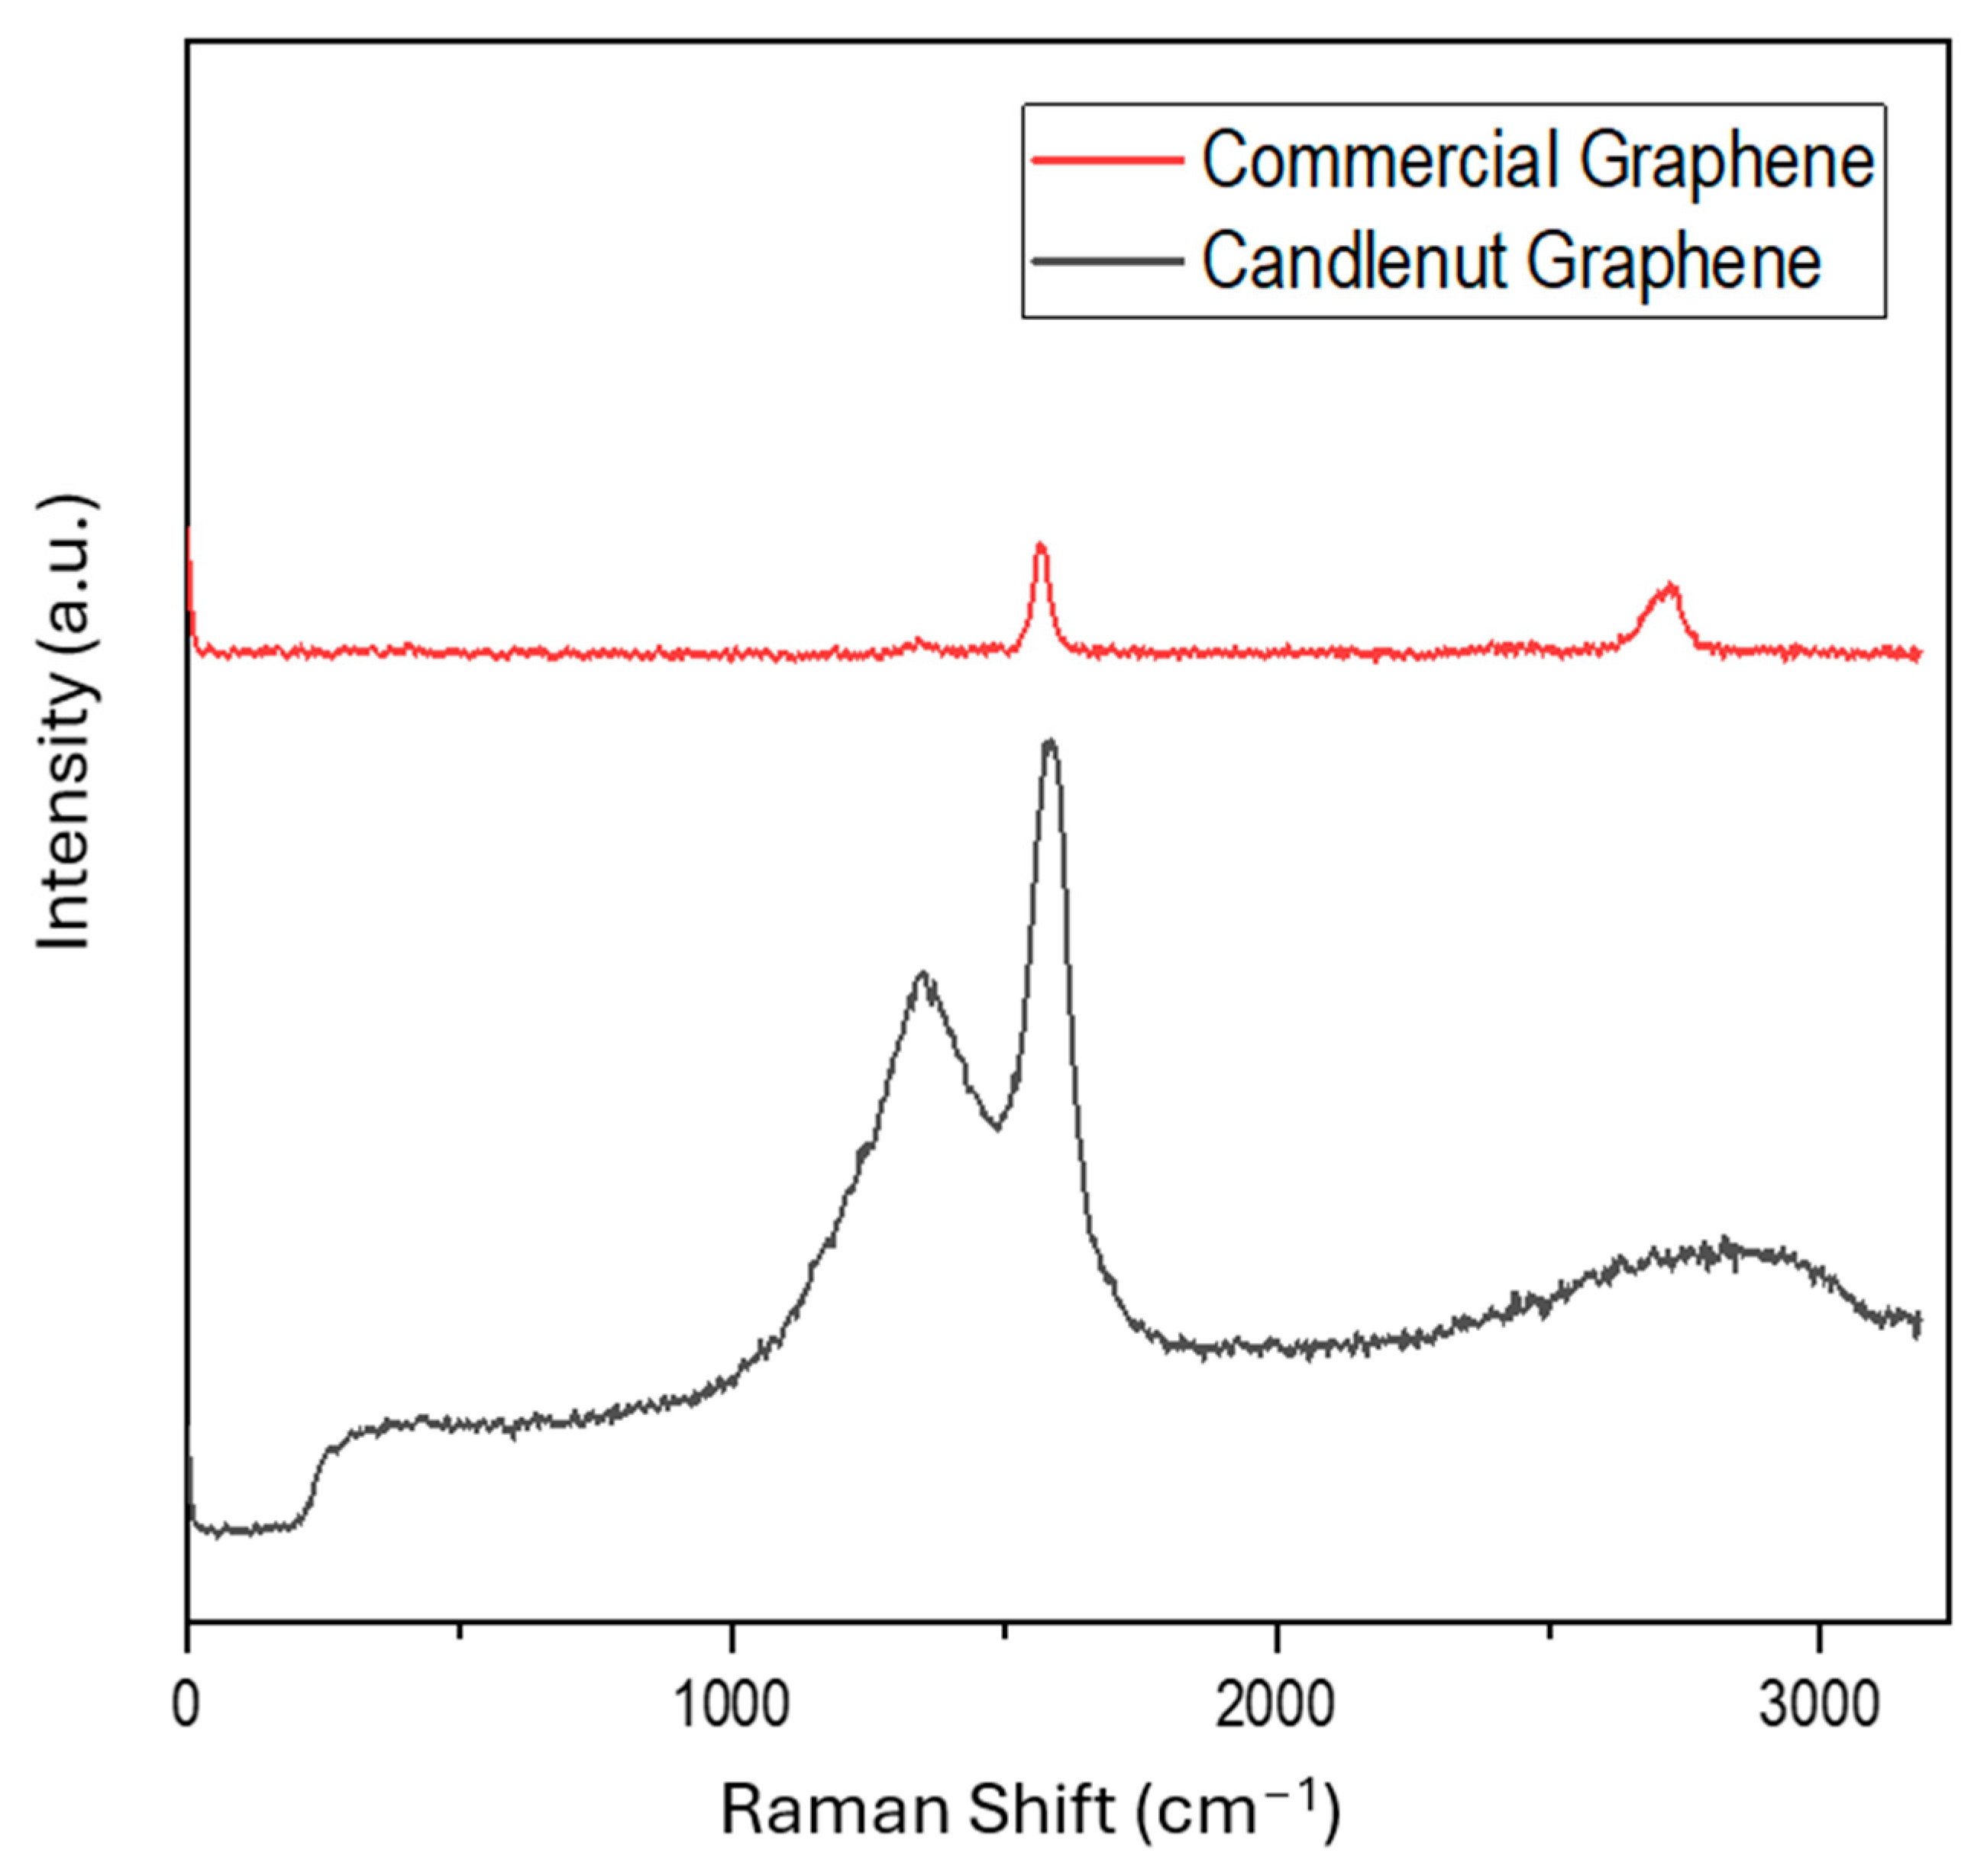
3.6. Raman
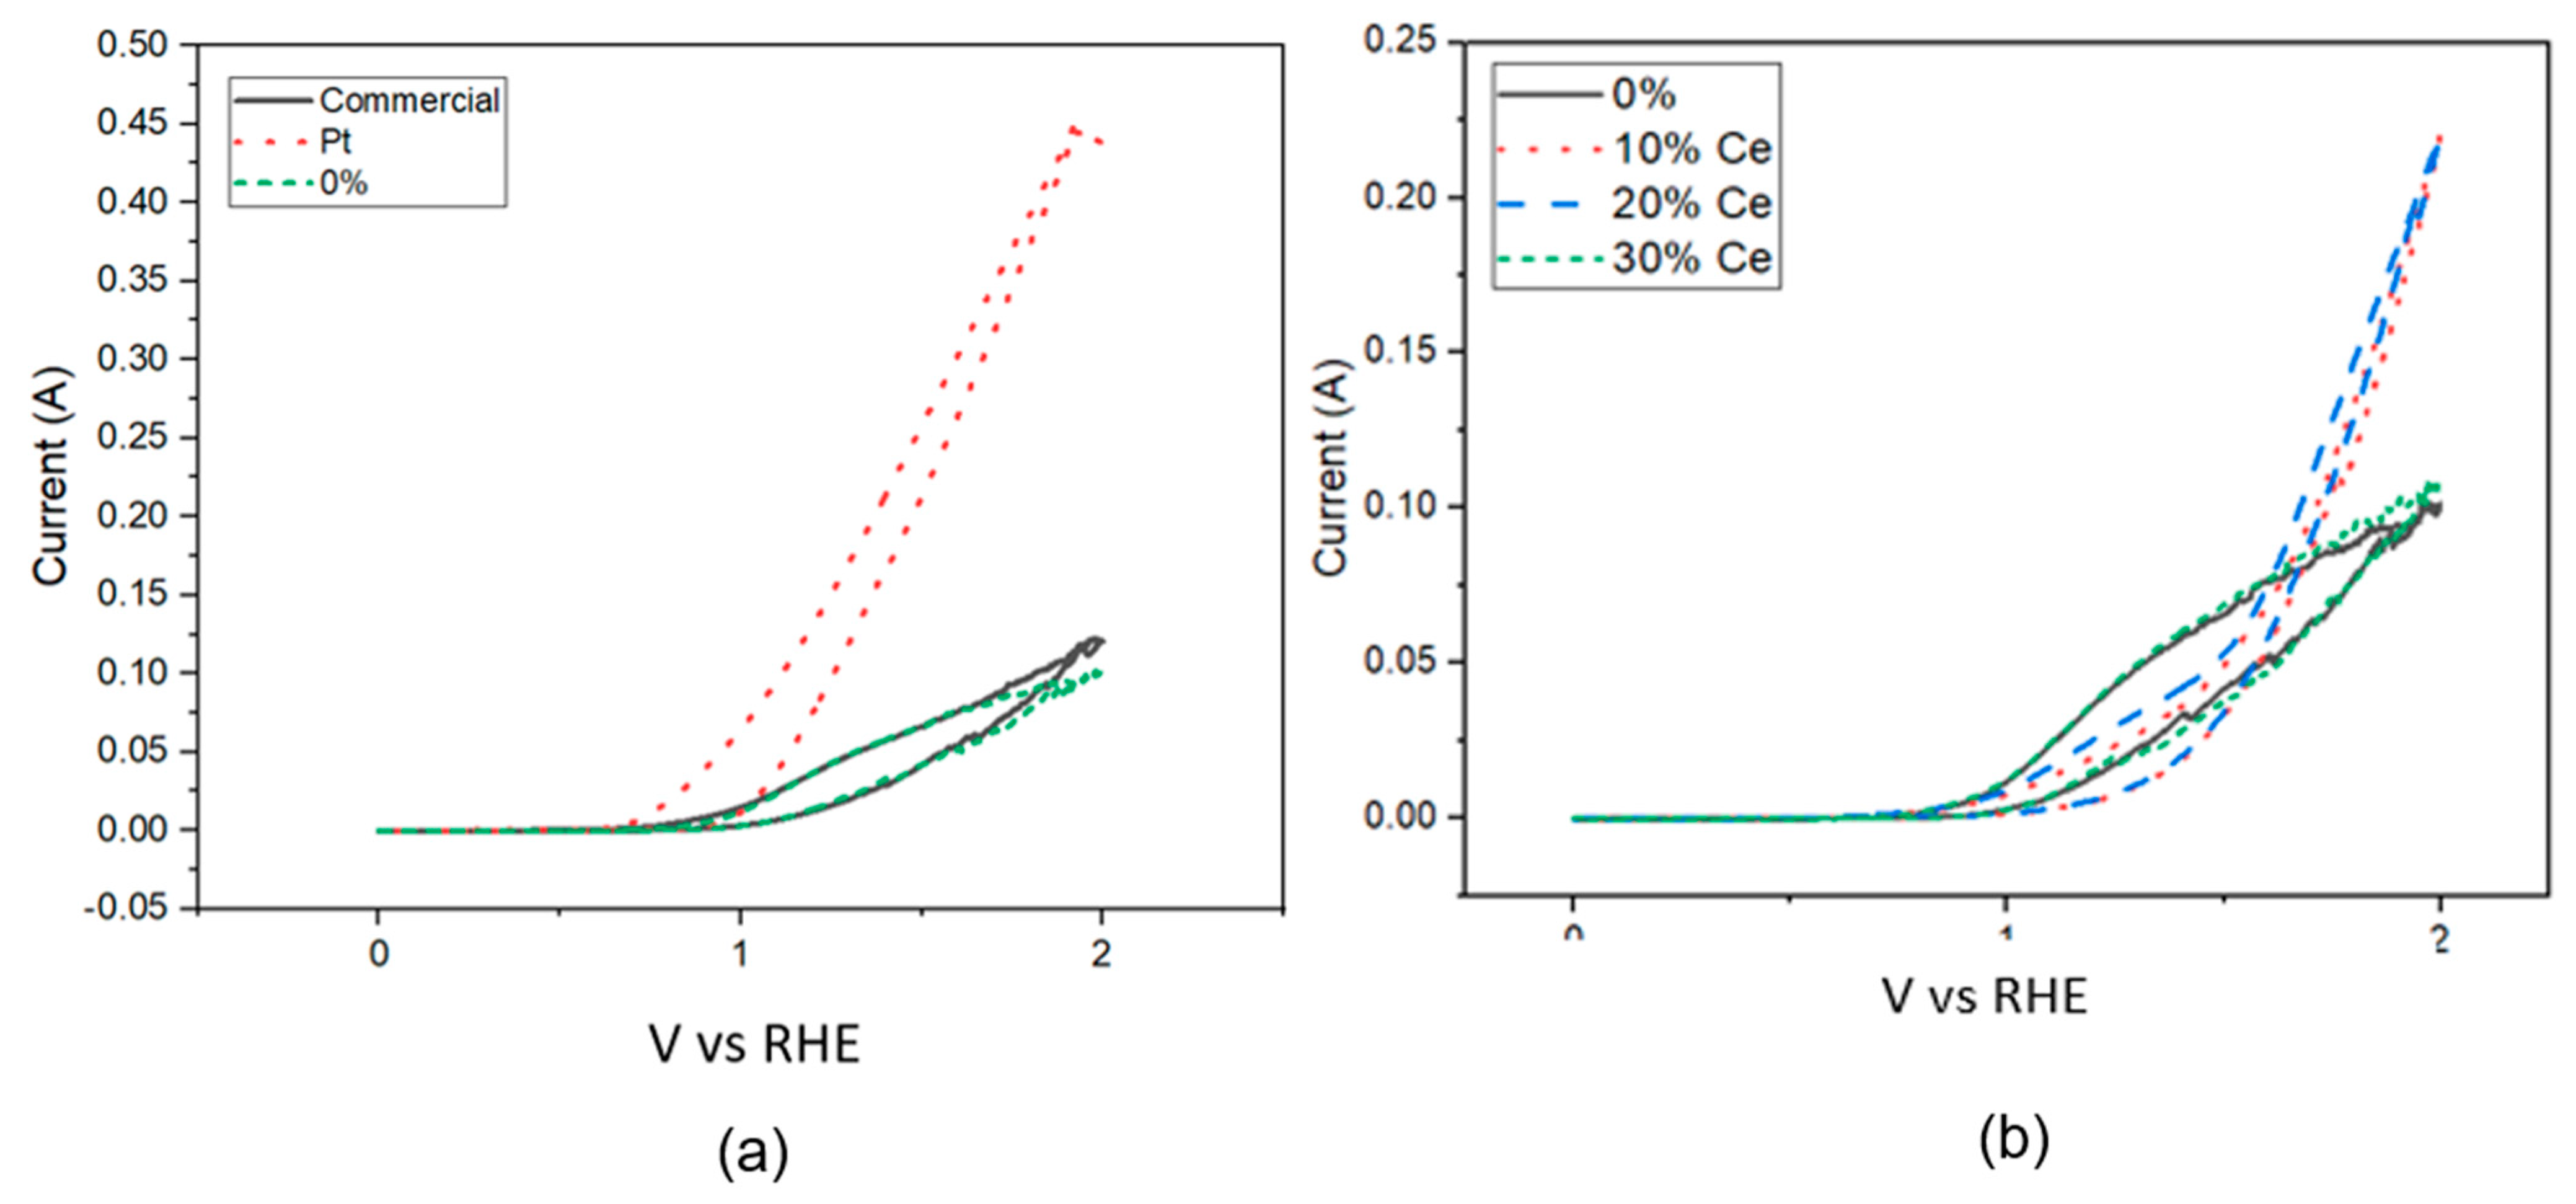
3.7. Electrochemistry Tests
3.8. AC Electrical Resistance
4. Conclusions
Author Contributions
Funding
Data Availability Statement
Conflicts of Interest
References
- Choi, S.H.; Yun, S.J.; Won, Y.S.; Oh, C.S.; Kim, S.M.; Kim, K.K.; Lee, Y.H. Large-scale synthesis of graphene and other 2D materials towards industrialization. Nat. Commun. 2022, 13, 1484. [Google Scholar] [CrossRef] [PubMed]
- Lv, P.; Li, X.; Zhang, Z.; Nie, B.; Wu, Y.; Deng, N.; Tian, H.; Ren, T.L.; Wang, G. Industrial-scale production of high-quality graphene sheets by millstone grinders. J. Phys. D Appl. Phys. 2022, 55, 164022. [Google Scholar] [CrossRef]
- Koul, B.; Yakoob, M.; Shah, M.P. Agricultural waste management strategies for environmental sustainability. Environ. Res. 2022, 206, 112285. [Google Scholar] [CrossRef] [PubMed]
- Shahbaz, M.; Taqvi, S.A.A.; Inayat, M.; Inayat, A.; Sulaiman, S.A.; McKay, G.; Al-Ansari, T. Air catalytic biomass (PKS) gasification in a fixed-bed downdraft gasifier using waste bottom ash as catalyst with NARX neural network modelling. Comput. Chem. Eng. 2020, 142, 107048. [Google Scholar] [CrossRef]
- Ali, G.A.M.; Habeeb, O.A.; Algarni, H.; Chong, K.F. CaO impregnated highly porous honeycomb activated carbon from agriculture waste: Symmetrical supercapacitor study. J. Mater. Sci. 2019, 54, 683–692. [Google Scholar] [CrossRef]
- Sukmana, I.F.; Widiatmoko, P.; Nurdin, I.; Devianto; Prakoso, T. Effect of ZnCl2 on properties of graphene produced from palm empty fruit bunch. IOP Conf. Ser. Mater. Sci. Eng. 2020, 778, 012011. [Google Scholar] [CrossRef]
- Arunachalam, S.; Kirubasankar, B.; Pan, D.; Liu, H.; Yan, C.; Guo, Z.; Angaiah, S. Research progress in rare earths and their composites based electrode materials for supercapacitors. Green Energy Environ. 2020, 5, 259–273. [Google Scholar] [CrossRef]
- Chen, L.F.; Lu, Y.; Yu, L.; Lou, X.W.D. Designed formation of hollow particle-based nitrogen-doped carbon nanofibers for high-performance supercapacitors. Energy Environ. Sci. 2017, 10, 1777–1783. [Google Scholar] [CrossRef]
- Zhang, K.; Irmak, S.; Catchmark, J.M. Preparation and properties of heteroatom-doped bacterial cellulose-derived carbonaceous materials. Carbohydr. Polym. Technol. Appl. 2023, 6, 100400. [Google Scholar] [CrossRef]
- Kothandam, G.; Singh, G.; Guan, X.; Lee, J.M.; Ramadass, K.; Joseph, S.; Benzigar, M.; Karakoti, A.; Yi, J.; Kumar, P.; et al. Recent Advances in Carbon-Based Electrodes for Energy Storage and Conversion. Adv. Sci. 2023, 10, 2301045. [Google Scholar] [CrossRef]
- Zhao, Z.; Chen, H.; Zhang, W.; Yi, S.; Chen, H.; Su, Z.; Niu, B.; Zhang, Y.; Long, D. Defect engineering in carbon materials for electrochemical energy storage and catalytic conversion. Mater. Adv. 2023, 4, 835–867. [Google Scholar] [CrossRef]
- Ghosh, S.; Behera, S.K.; Mishra, A.; Casari, C.S.; Ostrikov, K.K. Quantum Capacitance of Two-Dimensional-Material-Based Supercapacitor Electrodes. Energy Fuels 2023, 37, 17836–17862. [Google Scholar] [CrossRef]
- Mao, Y.Q.; Dong, G.H.; Li, Y.Q.; Huang, P.; Fu, S.Y. One-step fabrication of N/O self-doped porous carbon derived from 2-MeIM for high-performance supercapacitor electrode. J. Energy Storage 2023, 74, 109263. [Google Scholar] [CrossRef]
- Fang, Y.; Wang, H.; Ji, S.; Wang, X.; Kannan, P.; Wang, R. N and O co-doped carbon cloth as high-capacitance electrodes for high-energy capacitors. Diam. Relat. Mater. 2022, 129, 109343. [Google Scholar] [CrossRef]
- Li, Z.; Lin, J.; Li, B.; Yu, C.; Wang, H.; Li, Q. Construction of heteroatom-doped and three-dimensional graphene materials for the applications in supercapacitors: A review. J. Energy Storage 2021, 44, 103437. [Google Scholar] [CrossRef]
- Shah, S.S.; Aziz, M.A.; Rasool, P.I.; Mohmand, N.Z.K.; Khan, A.J.; Ullah, H.; Feng, X.; Oyama, M. Electrochemical synergy and future prospects: Advancements and challenges in MXene and MOFs composites for hybrid supercapacitors. Sustain. Mater. Technol. 2024, 39, e00814. [Google Scholar] [CrossRef]
- Benoy, S.M.; Pandey, M.; Bhattacharjya, D.; Saikia, B.K. Recent trends in supercapacitor-battery hybrid energy storage devices based on carbon materials. J. Energy Storage 2022, 52, 104938. [Google Scholar] [CrossRef]
- Pallares, R.M.; Abergel, R.J. Transforming lanthanide and actinide chemistry with nanoparticles. Nanoscale 2020, 12, 1339. [Google Scholar] [CrossRef] [PubMed]
- Karthickprabhu, S.; Vikraman, D.; Kathalingam, A.; Prasanna, K.; Kim, H.S.; Karuppasamy, K. Electrochemical and cycling performance of neodymium (Nd3+) doped LiNiPO4 cathode materials for high voltage lithium-ion batteries. Mater. Lett. 2019, 237, 224. [Google Scholar] [CrossRef]
- Siburian, R.; Paiman, S.; Hutagalung, F.; Ali, A.M.M.; Simatupang, L.; Goei, R.; Rusop, M.M. Facile method to synthesize of magnesium-graphene nano sheets for candidate of primary battery electrode. Colloid Interface Sci. Commun. 2022, 48, 100612. [Google Scholar] [CrossRef]
- Zdorovets, M.V.; Kozlovskiy, A.L. Study of the stability of the structural properties of CeO2 microparticles to helium irradiation. Surf. Coat. Technol. 2020, 383, 125286. [Google Scholar] [CrossRef]
- Li, J.; He, R.; Guo, G.; Li, Y.; Liao, Y.; Li, Y. Synthesis of Hierarchical Layered Quasi-Triangular Ce(OH)CO3 and Its Thermal Conversion to Ceria with High Polishing Performance. ACS Omega 2023, 8, 8519–8529. [Google Scholar] [CrossRef] [PubMed]
- Chuah, R.; Gopinath, S.C.B.; Anbu, P.; Salimi, M.N.; Yaakub, A.R.W.; Lakshmipriya, T. Synthesis and characterization of reduced graphene oxide using the aqueous extract of Eclipta prostrata. Biotech 2020, 10, 364. [Google Scholar] [CrossRef] [PubMed]
- Abaszade, R.G.; Mamedova, S.A.; Agayev, F.H.; Budzulyak, S.I.; Kapush, O.A.; Mamedova, M.A.; Nabiyev, A.M.; Kotsyubynsky, V.O. Synthesis and Characterization of Graphene Oxide Flakes for Transparent Thin Films. Phys. Chem. Solid State 2021, 22, 595. [Google Scholar] [CrossRef]
- Barros, N.G.; Neto, A.C.G.; Vaccioli, K.B.; Angulo, H.R.V.; Silva, L.G.A.; Toffoli, S.M.; Valera, T.S. Graphene Oxide: A Comparison of Reduction Methods. J. Carbon Res. 2023, 9, 73. [Google Scholar] [CrossRef]
- Anagbonu, P.; Ghali, M.; Allam, A. Low-temperature green synthesis of few-layered graphene sheets from pomegranate peels for supercapacitor applications. Sci. Rep. 2023, 13, 15627. [Google Scholar] [CrossRef] [PubMed]
- Chenniappan, T.; Uttamchand, N. Effect of graphene on thermal, mechanical, and shape memory properties of polyurethane nanocomposite. Appl. Phys. A 2022, 128, 937. [Google Scholar] [CrossRef]
- Krishna, D.N.G.; Philip, J. Review on surface-characterization applications of X-ray photoelectron spectroscopy (XPS): Recent developments and challenges. Appl. Surf. Sci. Adv. 2022, 12, 100332. [Google Scholar] [CrossRef]
- Aarva, A.; Sainio, S.; Deringer, V.L.; Caro, M.A.; Laurila, T. X-ray Spectroscopy Fingerprints of Pristine and Functionalized Graphene. J. Phys. Chem. C 2021, 125, 18234–18246. [Google Scholar] [CrossRef]
- Siburian, R.; Ali, A.M.M.; Sebayang, K.; Supeno, M.; Tarigan, K.; Simanjuntak, C.; Aritonang, S.P.; Hutagalung, F. The loading effect of Pt clusters on Pt/graphene nano sheets catalysts. Sci. Rep. 2021, 11, 2532. [Google Scholar] [CrossRef]
- Isaacs, M.A.; Drivas, C.; Lee, R.; Palgrave, R.; Parlett, C.M.A.; Morgan, D.J. XPS surface analysis of ceria-based materials: Experimental methods and considerations. Appl. Surf. Sci. Adv. 2023, 18, 100469. [Google Scholar] [CrossRef]
- Morgan, D.J. Photoelectron spectroscopy of ceria: Reduction, quantification and the myth of the vacancy peak in XPS analysis. Surf. Interface Anal. 2023, 55, 787–850. [Google Scholar] [CrossRef]
- Zou, S.; Zhu, X.; Zhang, L.; Guo, F.; Zhang, M.; Tan, Y.; Gong, A.; Fang, Z.; Ju, H.; Wu, C.; et al. Biomineralization-Inspired Synthesis of Cerium-Doped Carbonaceous Nanoparticles for Highly Hydroxyl Radical Scavenging Activity, Nanoscale Research Letters. Nanoscale Res. Lett. 2018, 13, 76. [Google Scholar] [CrossRef] [PubMed]
- Vári, G.; Óvári, L.; Kiss, J.; Kónya, Z. LEIS and XPS investigation into the growth of cerium and cerium dioxide on Cu(111). Phys. Chem. Chem. Phys. 2015, 17, 5124–5132. [Google Scholar] [CrossRef] [PubMed]
- Della Mea, G.B.; Matte, L.P.; Thill, A.S.; Lobato, F.O.; Benvenutti, E.V.; Arenas, L.T.; Jürgensen, A.; Hergenröder, R.; Poletto, F.; Bernardi, F. Tuning the oxygen vacancy population of cerium oxide (CeO2−x, 0 < x < 0.5) nanoparticles. Appl. Surf. Sci. 2017, 422, 1102–1112. [Google Scholar] [CrossRef]
- Yaacov, A.B.; Falling, L.J.; David, R.B.; Attia, S.; Andrés, M.A.; Nemšák, S.; Eren, B. Oxidation and Reduction of Polycrystalline Cerium Oxide Thin Films in Hydrogen. J. Phys. Chem. Lett. 2023, 14, 7354–7360. [Google Scholar] [CrossRef] [PubMed]
- Hourcade, M.G.; Reis, G.S.; Grimm, A.; Dinh, V.M.; Lima, E.C.; Larsson, S.H.; Gentili, F.G. Microalgae biomass as a sustainable precursor to produce nitrogen-doped biochar for efficient removal of emerging pollutants from aqueous media. J. Clean. Prod. 2022, 348, 131280. [Google Scholar] [CrossRef]
- Omiri, J.; Snoussi, Y.; Bhakta, A.K.; Truong, S.; Ammar, S.; Khalil, A.M.; Jouini, M.; Chehimi, M.M. Citric-Acid-Assisted Preparation of Biochar Loaded with Copper/Nickel Bimetallic Nanoparticles for Dye Degradation. Colloids Interfaces 2022, 6, 18. [Google Scholar] [CrossRef]
- Ji, R.; Wu, Y.; Bian, Y.; Song, Y.; Sun, Q.; Jiang, X.; Zhang, L.; Han, J.; Cheng, H. Nitrogen-doped porous biochar derived from marine algae for efficient solid-phase microextraction of chlorobenzenes from aqueous solution. J. Hazard. Mater. 2021, 407, 124785. [Google Scholar] [CrossRef]
- Yan, Y.; Manickam, S.; Lester, E.; Wu, T.; Pang, C.H. Synthesis of graphene oxide and graphene quantum dots from miscanthus via ultrasound-assisted mechano-chemical cracking method. Ultrason. Sonochem. 2021, 73, 105519. [Google Scholar] [CrossRef]
- Cheng, D.; Tian, M.; Wang, B.; Zhang, J.; Chen, J.; Feng, X.; He, Z.; Dai, L.; Wang, L. One-step activation of high-graphitization N-doped porous biomass carbon as advanced catalyst for vanadium redox flow battery. J. Colloid Interface Sci. 2020, 572, 216–226. [Google Scholar] [CrossRef] [PubMed]
- Sun, W.; Bai, J.; Li, C.; Liu, J. Effect of graphitization degree of electrospinning carbon fiber on catalytic oxidation of styrene and electrochemical properties. Chem. Phys. Lett. 2019, 715, 299–309. [Google Scholar] [CrossRef]
- Qiu, C.; Zhou, Q.; Gao, R.; Guo, Y.; Qin, J.; Wang, D.; Song, Y. An Unprecedented CeO2/C Non-Noble Metal Electrocatalyst for Direct Ascorbic Acid Fuel Cells. Nanomaterials 2023, 13, 2669. [Google Scholar] [CrossRef] [PubMed]
- Shaheen, I.; Hussain, I.; Zahra, T.; Javed, M.S.; Shah, S.S.A.; Khan, K.; Hanif, M.B.; Assiri, M.A.; Said, Z.; Arifeen, W.U.; et al. Recent advancements in metal oxides for energy storage materials: Design, classification, and electrodes configuration of supercapacitor. J. Energy Storage 2023, 72, 108719. [Google Scholar] [CrossRef]
- Elgrishi, N.; Rountree, K.J.; McCarthy, B.D.; Rountree, E.S.; Eisenhart, T.T.; Dempsey, J.L. A Practical Beginner’s Guide to Cyclic Voltammetry. J. Chem. Educ. 2018, 95, 197–206. [Google Scholar] [CrossRef]
- Wan, C.; Ling, Y.; Wang, S.; Pu, H.; Huang, Y.; Duan, X. Unraveling and Resolving the Inconsistencies in Tafel Analysis for Hydrogen Evolution Reactions. ACS Cent. Sci. 2024, 10, 658–665. [Google Scholar] [CrossRef] [PubMed]
- Sabir, A.S.; Pervaiz, E.; Khosa, R.; Sohail, U. An inclusive review and perspective on Cu-based materials for electrochemical water splitting. RSC Adv. 2023, 13, 4963–4993. [Google Scholar] [CrossRef] [PubMed]
- Anantharaj, S.; Noda, S.; Jothi, V.R.; Yi, S.C.; Driess, M.; Menezes, P.W. Strategies and Perspectives to Catch the Missing Pieces in Energy-Efficient Hydrogen Evolution Reaction in Alkaline Media. Angew. Chem. Int. Ed. Engl. 2021, 60, 18981–19006. [Google Scholar] [CrossRef] [PubMed]
- Gebremariam, G.K.; Jovanović, A.Z.; Pašti, I.A. The Effect of Electrolytes on the Kinetics of the Hydrogen Evolution Reaction. Hydrogen 2023, 4, 776–806. [Google Scholar] [CrossRef]
- Saji, V.S. Corrosion and Materials Degradation in Electrochemical Energy Storage and Conversion Devices. ChemElectroChem 2023, 10, e202300136. [Google Scholar] [CrossRef]
- Fang, X.; Wu, D.; Liu, J.; Yang, Y.; Lv, S.; Wu, S.; Chen, Y. Microstructure evolution and corrosion resistance of high-pressure rheo-cast Mg–Zn–Y alloy containing quasicrystal. J. Mater. Res. Technol. 2023, 24, 542–556. [Google Scholar] [CrossRef]
- Sotillo, A.F.; Aparicio, P.F. Durable corrosion-resistant coating based in graphene oxide for cost-effective fuel cells components. iScience 2023, 26, 106569. [Google Scholar] [CrossRef] [PubMed]
- Wirtanen, T.; Prenzel, T.; Tessonnier, J.P.; Waldvogel, S.R. Cathodic Corrosion of Metal Electrodes—How to Prevent It in Electroorganic Synthesis. Chem. Rev. 2021, 121, 10241–10270. [Google Scholar] [CrossRef] [PubMed]
- Weia, L.; Gao, Z. Recent research advances on corrosion mechanism and protection, and novel coating materials of magnesium alloys: A review. RSC Adv. 2023, 13, 8427–8463. [Google Scholar] [CrossRef]


| Element | Weight (%) | Atomic (%) |
|---|---|---|
| C | 94.95 | 95.00 |
| O | 4.15 | 4.72 |
| K | 0.65 | 0.20 |
| Ca | 0.24 | 0.07 |
| Element | Weight (%) | Atomic (%) |
|---|---|---|
| C | 78.49 | 80.36 |
| O | 9.60 | 9.10 |
| Ce | 10.49 | 10.04 |
| S | 0.48 | 0.19 |
| Ni | 0.02 | 0.03 |
| Ca | 0.52 | 0.16 |
| F | 0.10 | 0.12 |
| Al | 0.13 | 0.06 |
| K | 0.30 | 0.10 |
| 20 wt% Ce/Graphene | 30 wt% Ce/Graphene | |||
|---|---|---|---|---|
| Element | Weight (%) | Atomic (%) | Weight (%) | Atomic (%) |
| C | 77.13 | 77.12 | 67.63 | 68.03 |
| O | 1.43 | 1.29 | 1.11 | 1.47 |
| Ce | 20.45 | 20.64 | 30.18 | 30.01 |
| S | 0.06 | 0.51 | 0.55 | 0.21 |
| Ni | 0.00 | 0.00 | 0.00 | 0.00 |
| Ca | 0.27 | 0.11 | 0.22 | 0.05 |
| F | 0.00 | 0.00 | 0.00 | 0.00 |
| Al | 0.00 | 0.00 | 0.12 | 0.17 |
| K | 0.29 | 0.12 | 0.19 | 0.07 |
| Si | 0.38 | 0.21 | 0.00 | 0.00 |
| Working Electrode | Maximum Current (A) | Area Enclosed |
|---|---|---|
| Pt | 0.4474 | 0.4932 |
| Blank GCE | 0.2184 | 0.1486 |
| GCE coated with Commercial graphene | 0.1224 | 0.1183 |
| GCE coated with Candlenut graphene | 0.1016 | 0.1096 |
| GCE coated with 10 wt% Ce/Graphene | 0.1081 | 0.1117 |
| GCE coated with 20 wt% Ce/Graphene | 0.0944 | 0.0952 |
| GCE coated with 30 wt% Ce/Graphene | 0.0795 | 0.0815 |
| Working Electrode | Anodic Slope | Cathodic Slope | Icorr (μA cm−2) | Ecorr (V) |
|---|---|---|---|---|
| Pt | 0.3966 | −0.1951 | −2.7829 | 1.7572 |
| Commercial graphene | 1.1489 | −0.3131 | −2.6894 | 1.7114 |
| Candlenut graphene | 0.7564 | −0.3993 | −3.0316 | 1.7308 |
| 10 wt% Ce/Graphene | 0.3091 | −0.2071 | −3.3787 | 1.8387 |
| 20 wt% Ce/Graphene | 0.4167 | −0.2854 | −3.1983 | 1.7708 |
| 30 wt% Ce/Graphene | 0.6111 | −0.3330 | −3.0752 | 1.7641 |
| Sample | AC Resistance (MΩ) |
|---|---|
| Commercial Graphene (0.24 wt.%) | 5.80 ± 0.40 |
| Candlenut Graphene (0.24 wt.%) | 4.10 ± 0.54 |
| Candlenut Graphene-Commercial Graphene (0.24 wt%) | 4.42 ± 0.22 |
| Candlenut Graphene-Ce-Commercial Graphene (0.24 wt.%) | 4.27 ± 0.29 |
| Candlenut Graphene-Commercial Graphene (2.4 wt%) | 4.43 ± 0.22 |
| Candlenut Graphene-N Commercial Graphene (2.4 wt.%) | 4.19 ± 0.17 |
| Candlenut Graphene-Fe-Commercial Graphene (2.4 wt.%) | 4.35 ± 0.54 |
| Candlenut Graphene-Zn-Commercial Graphene (2.4 wt.%) | 4.31 ± 0.26 |
| Candlenut Graphene-Ni-Commercial Graphene (2.4 wt.%) | 4.21 ± 0.17 |
Disclaimer/Publisher’s Note: The statements, opinions and data contained in all publications are solely those of the individual author(s) and contributor(s) and not of MDPI and/or the editor(s). MDPI and/or the editor(s) disclaim responsibility for any injury to people or property resulting from any ideas, methods, instructions or products referred to in the content. |
© 2024 by the authors. Licensee MDPI, Basel, Switzerland. This article is an open access article distributed under the terms and conditions of the Creative Commons Attribution (CC BY) license (https://creativecommons.org/licenses/by/4.0/).
Share and Cite
Siburian, R.; Tarigan, K.; Manik, Y.G.O.; Hutagalung, F.; Alias, Y.; Chan, Y.C.; Chang, B.P.; Siow, J.; Ong, A.J.; Huang, J.; et al. Converting Candlenut Shell Waste into Graphene for Electrode Applications. Processes 2024, 12, 1544. https://doi.org/10.3390/pr12081544
Siburian R, Tarigan K, Manik YGO, Hutagalung F, Alias Y, Chan YC, Chang BP, Siow J, Ong AJ, Huang J, et al. Converting Candlenut Shell Waste into Graphene for Electrode Applications. Processes. 2024; 12(8):1544. https://doi.org/10.3390/pr12081544
Chicago/Turabian StyleSiburian, Rikson, Kerista Tarigan, Yosia Gopas Oetama Manik, Fajar Hutagalung, Yatimah Alias, Yong Ching Chan, Boon Peng Chang, Jonathan Siow, Amanda Jiamin Ong, Jingfeng Huang, and et al. 2024. "Converting Candlenut Shell Waste into Graphene for Electrode Applications" Processes 12, no. 8: 1544. https://doi.org/10.3390/pr12081544
APA StyleSiburian, R., Tarigan, K., Manik, Y. G. O., Hutagalung, F., Alias, Y., Chan, Y. C., Chang, B. P., Siow, J., Ong, A. J., Huang, J., Paiman, S., Goh, B. T., Simatupang, L., Goei, R., Tok, A. I. Y., Yahya, M. F. Z. R., & Bahfie, F. (2024). Converting Candlenut Shell Waste into Graphene for Electrode Applications. Processes, 12(8), 1544. https://doi.org/10.3390/pr12081544