
Study on the Evolution of Mechanical Properties and Acoustic Emission of Medium-Permeability Sandstone under Multi-Level Cyclic Loading Stress Paths

 , ,
, ,
Abstract
:1. Introduction
2. Experiment Methods and Materials
2.1. Experimental Schemes Design
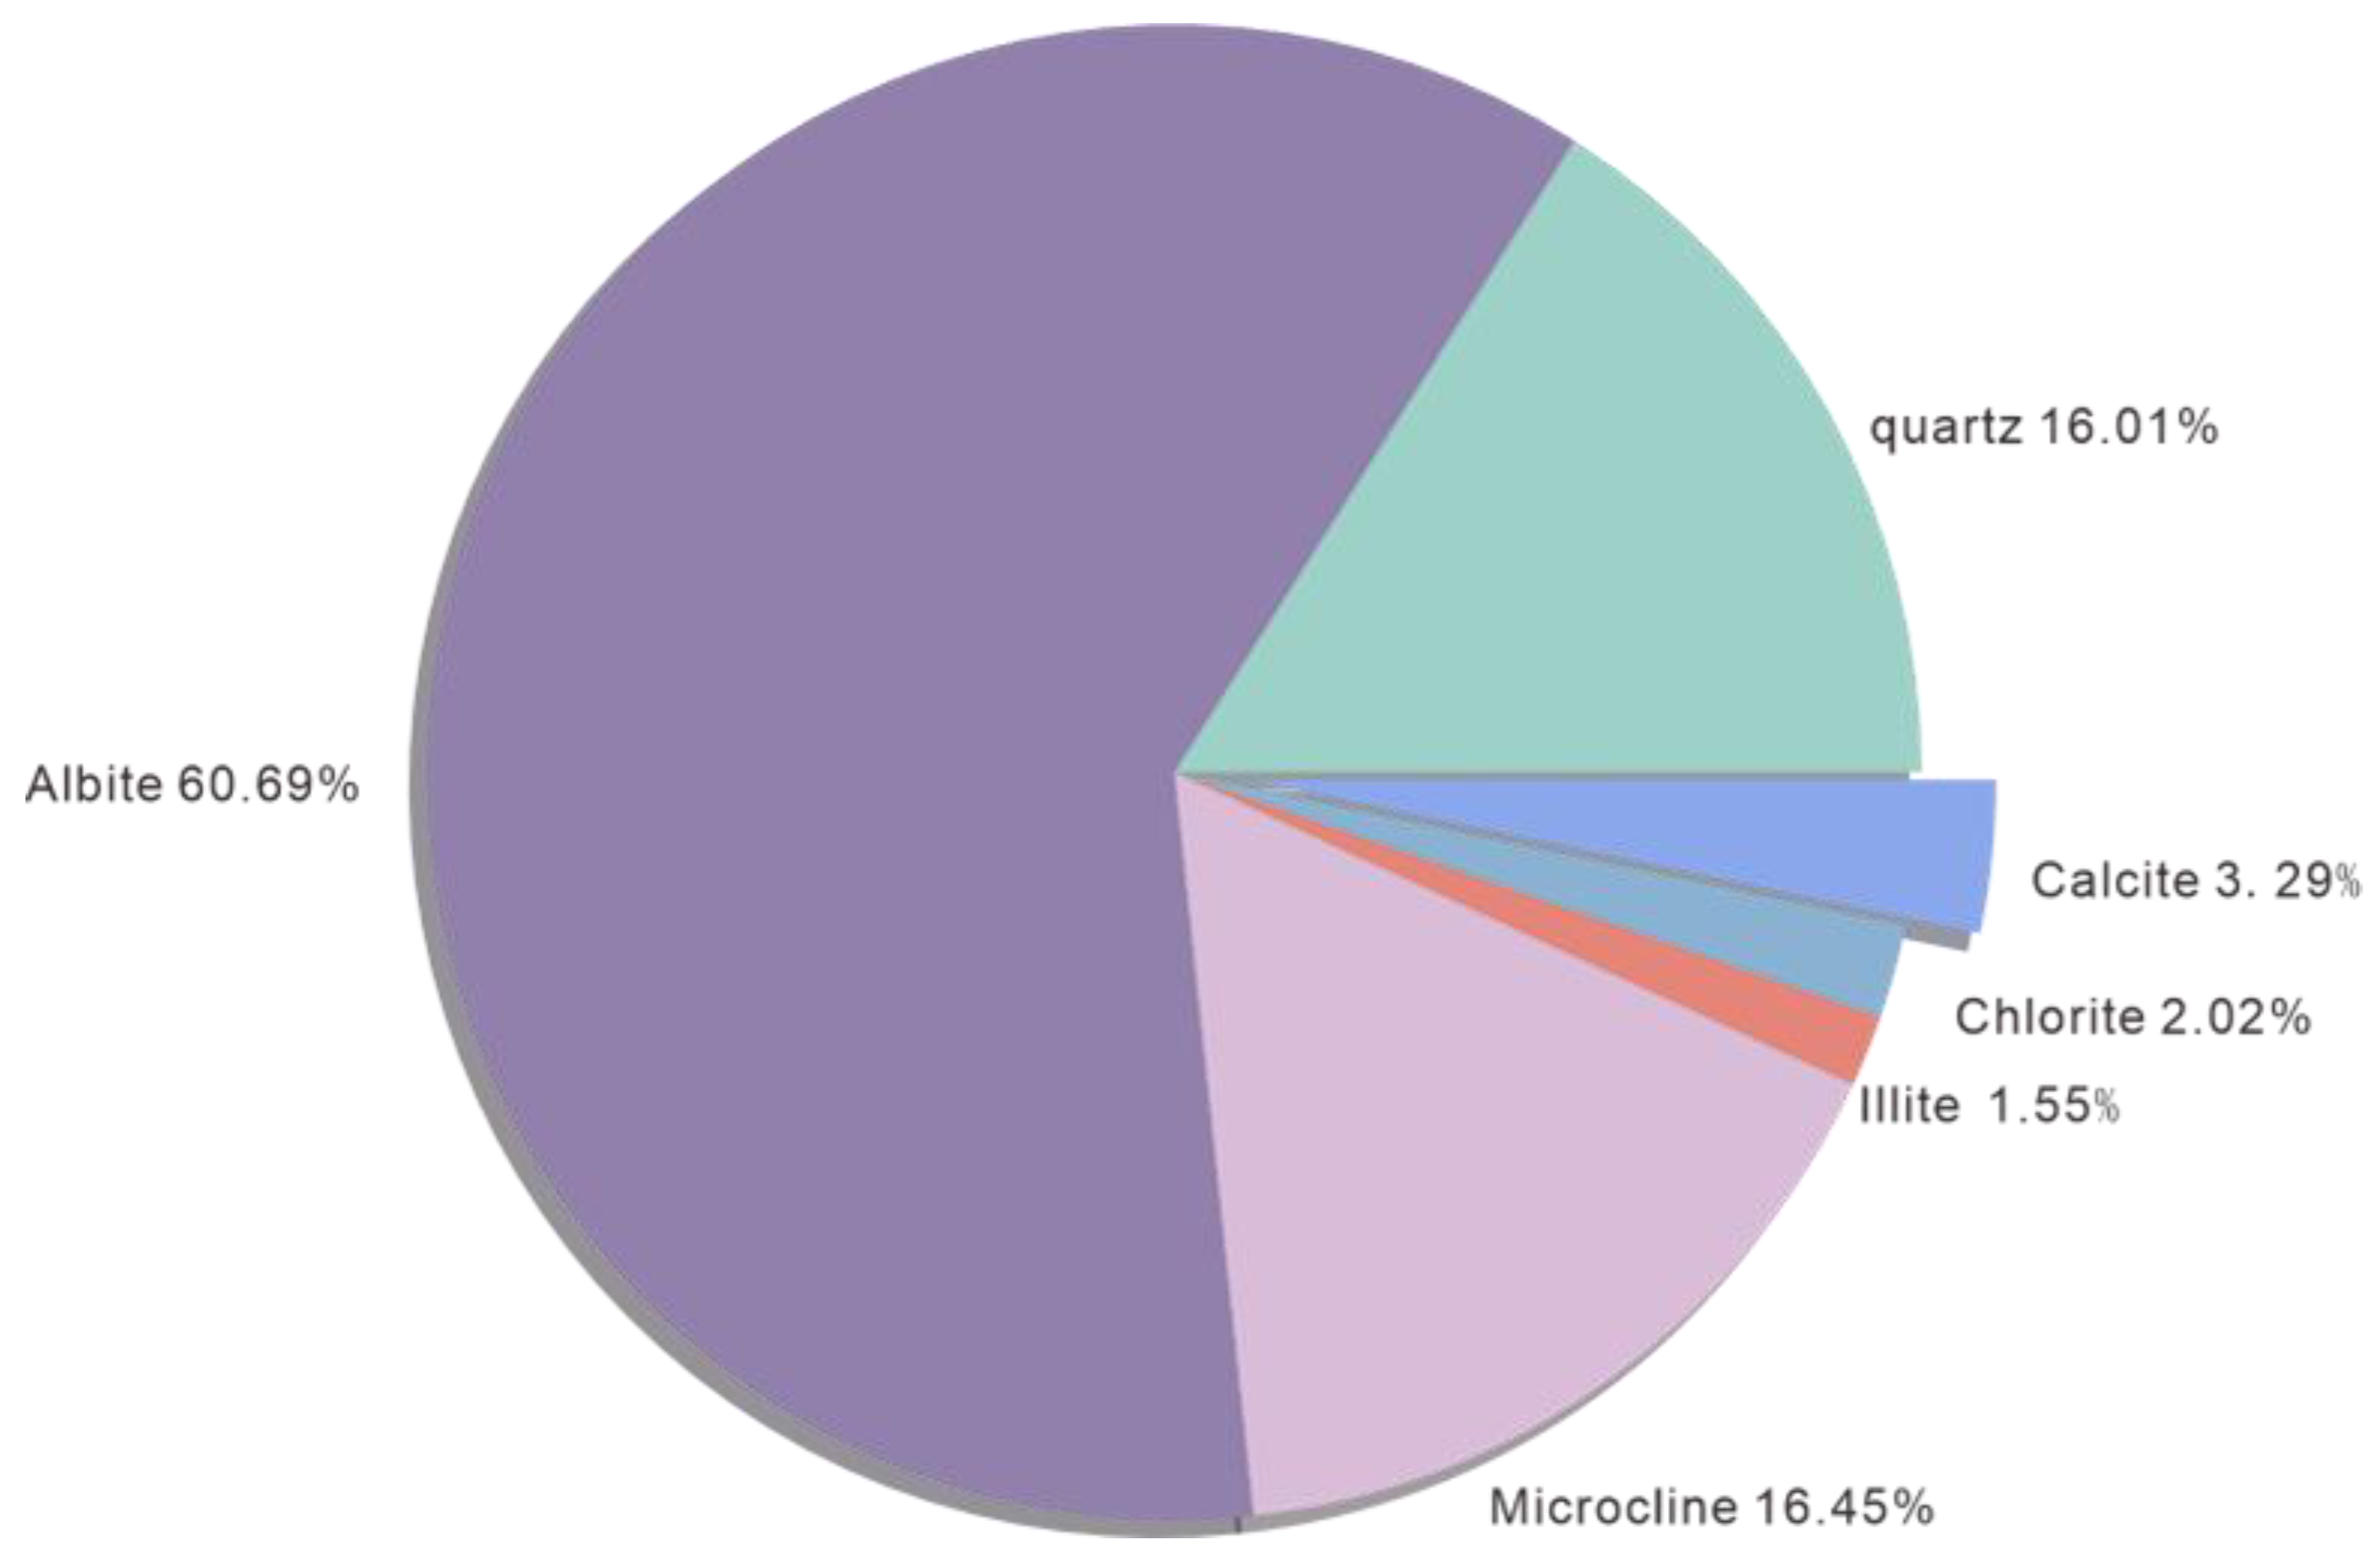
2.2. Medium-Permeability Sandstone Samples
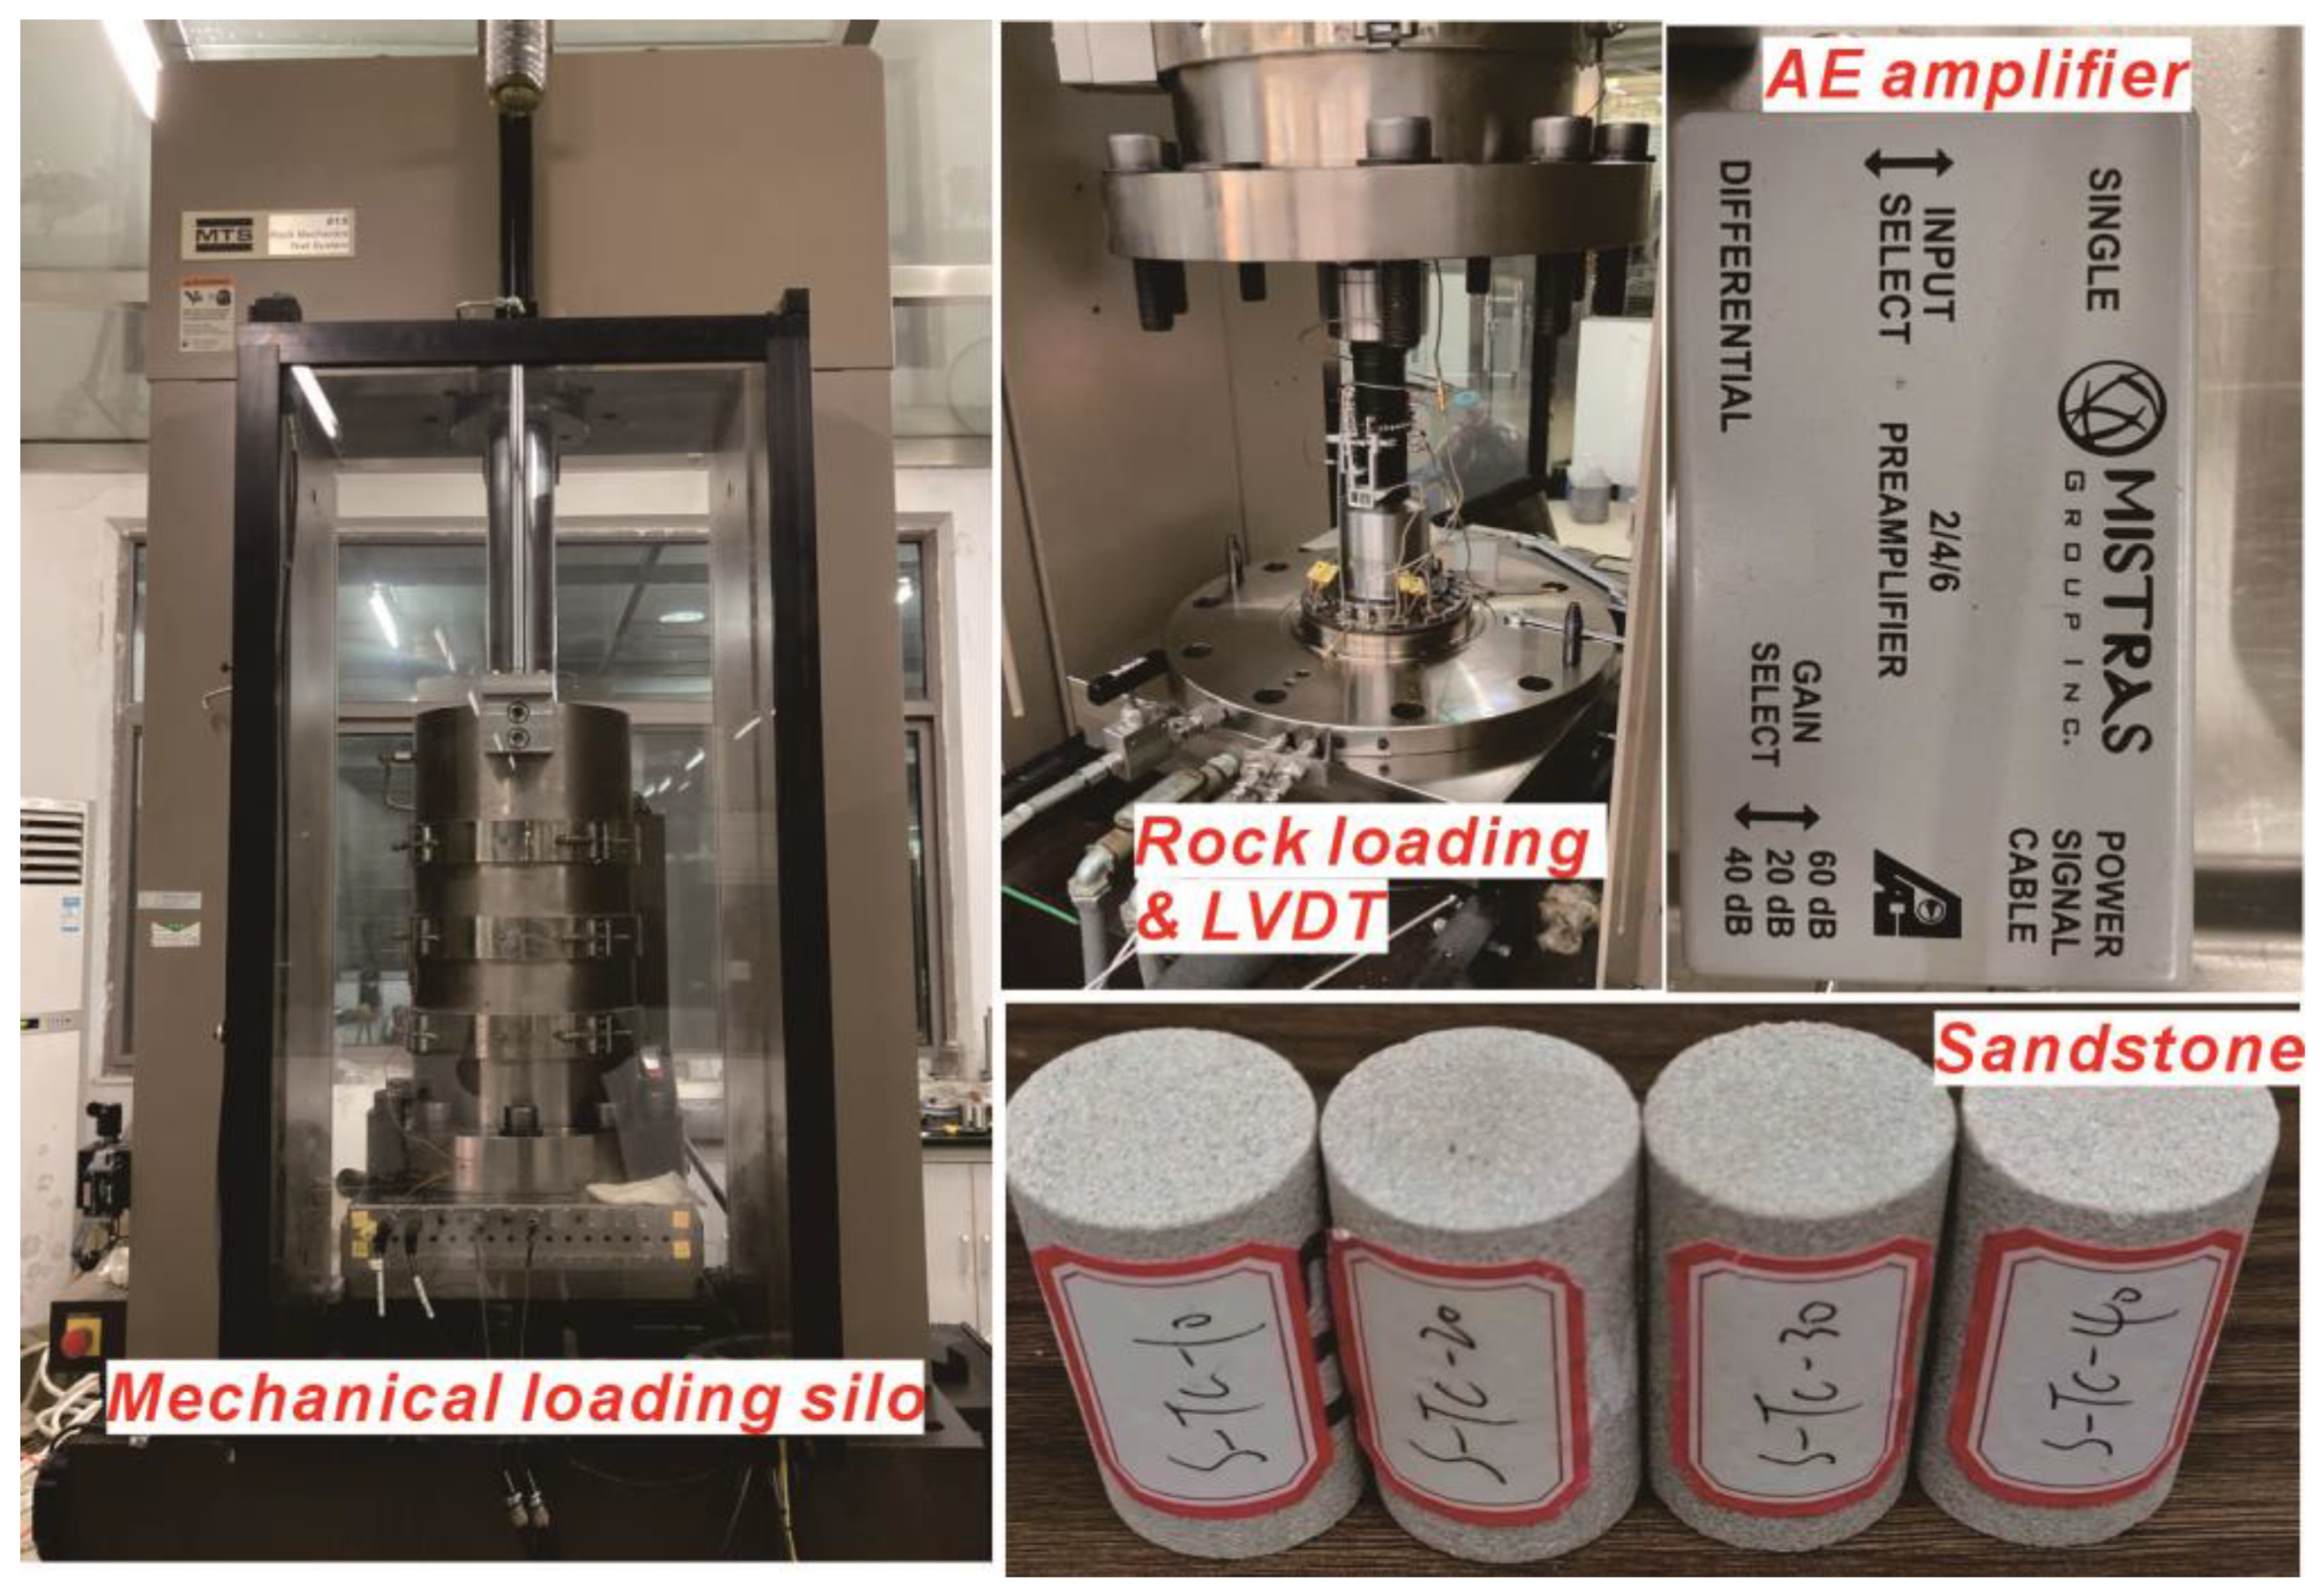
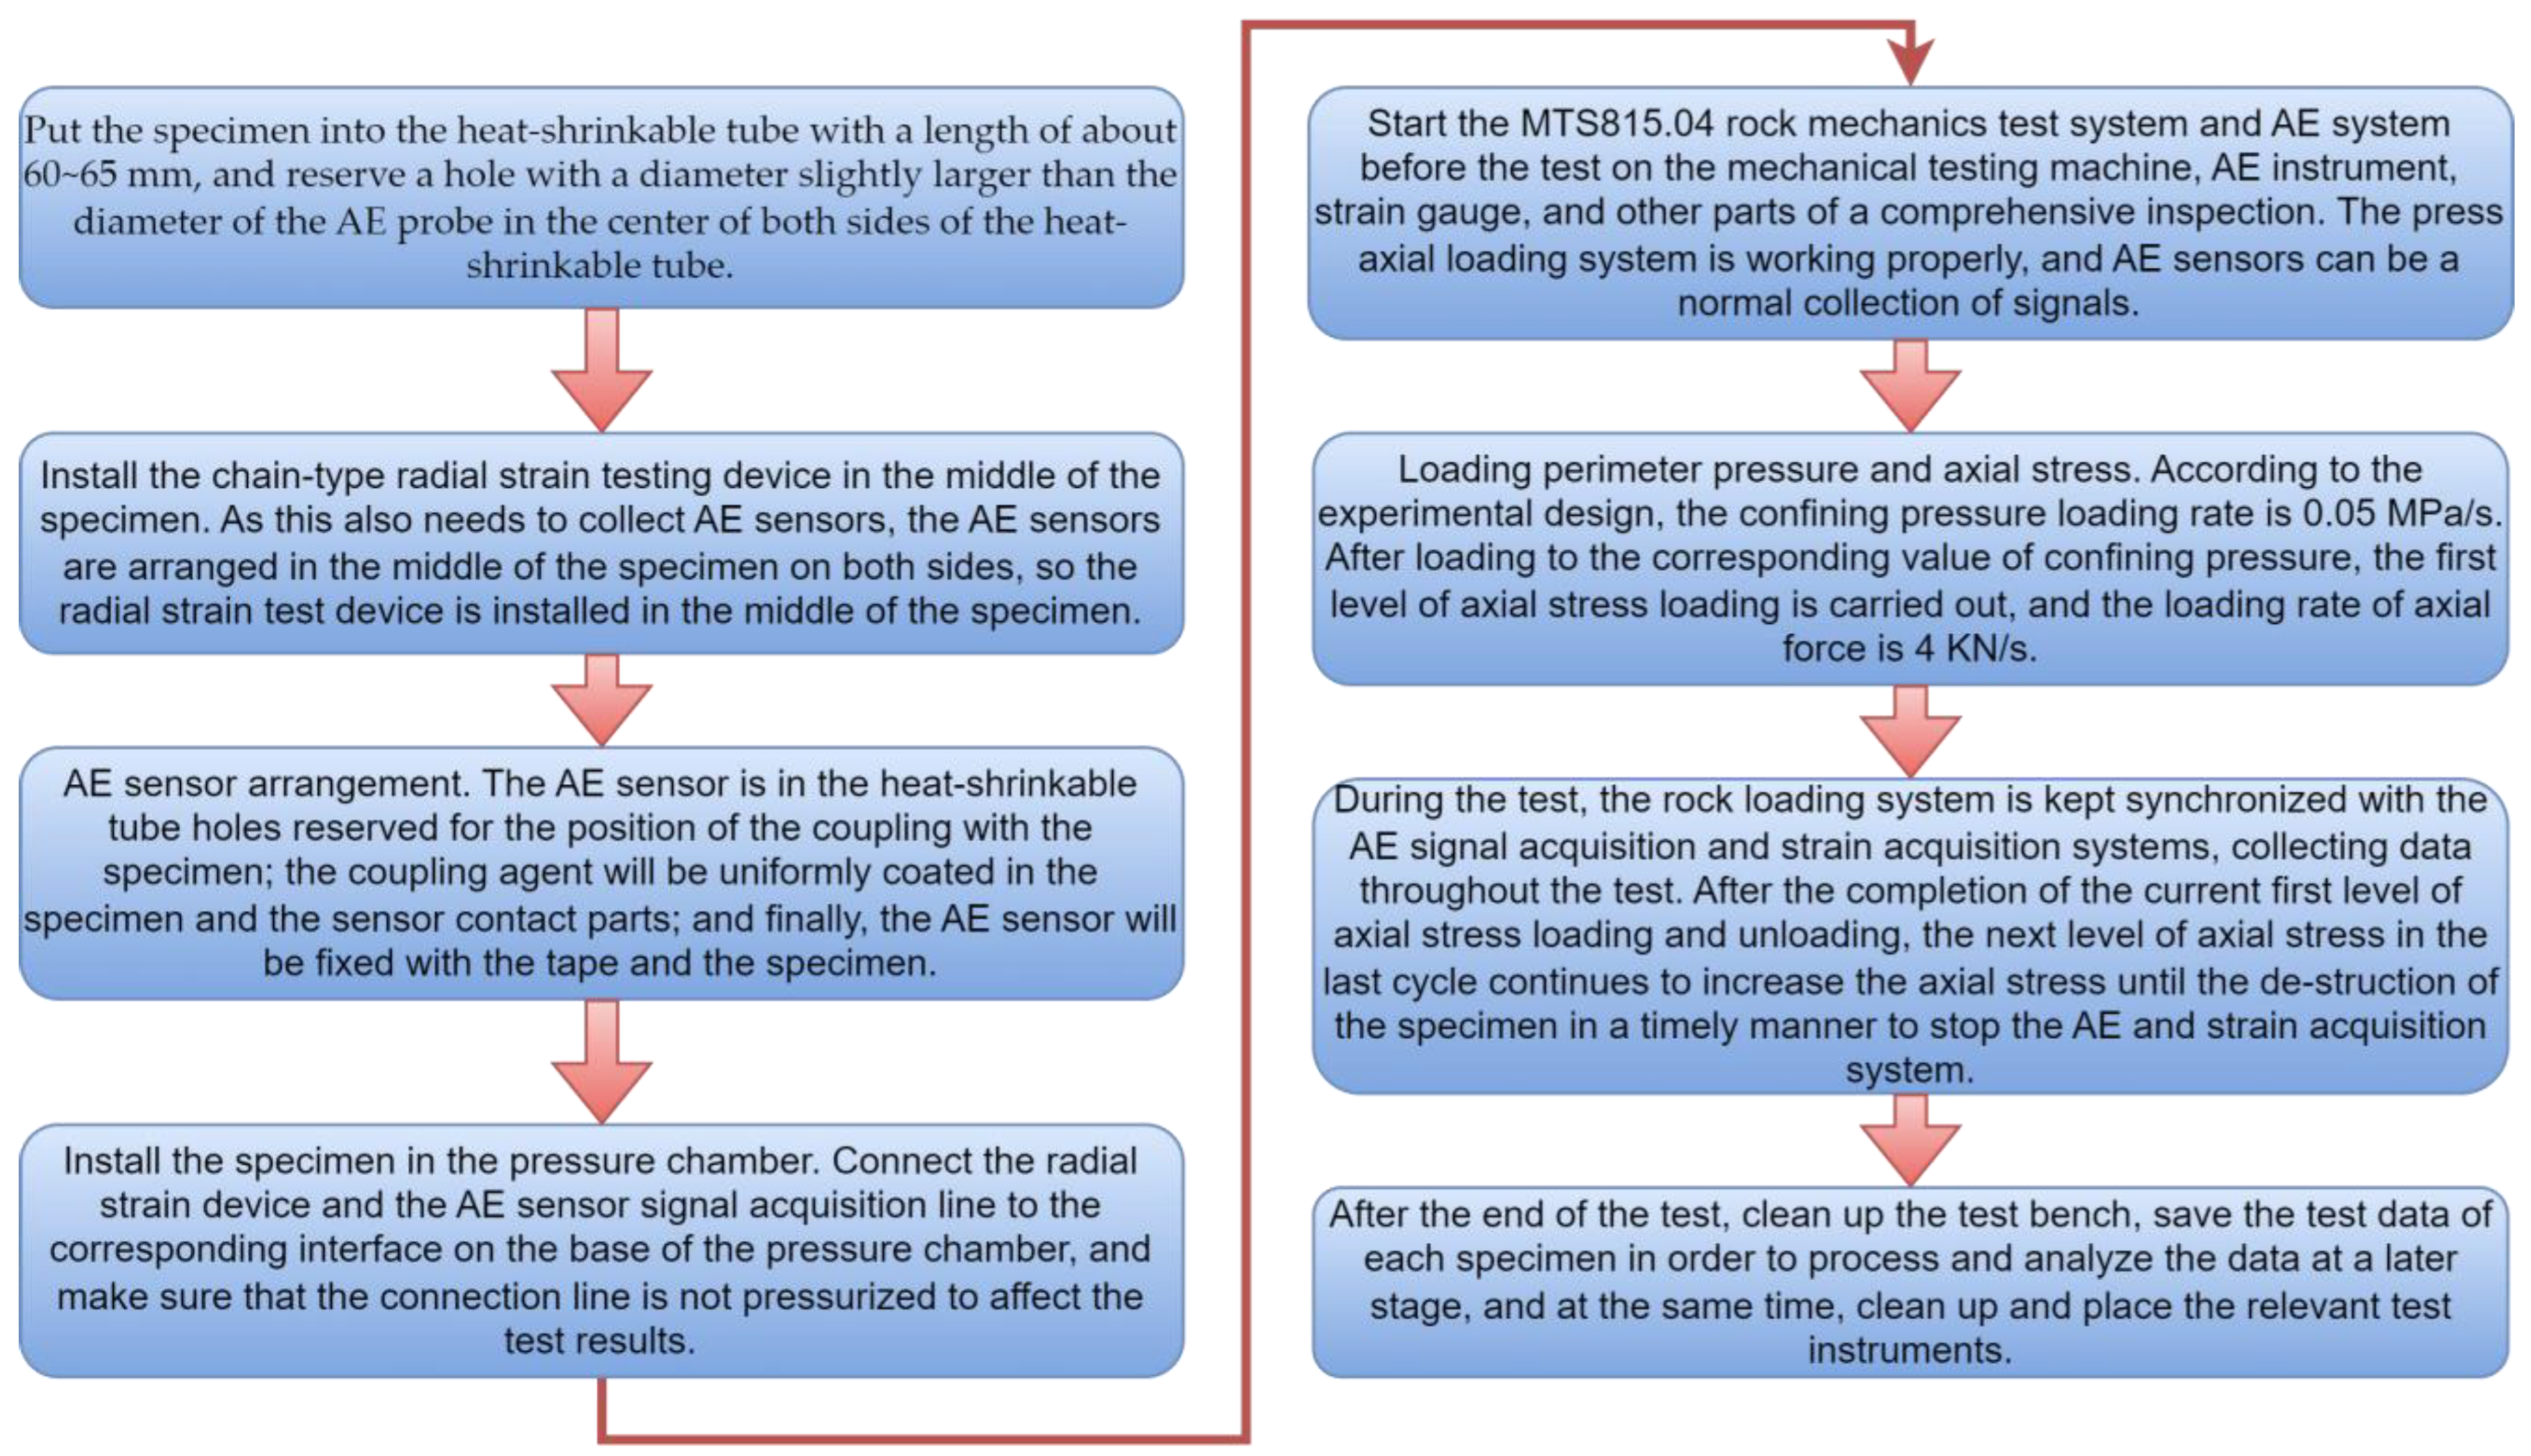
2.3. Experimental Equipment and Procedures

| Specimen NO. | Confining Pressures (MPa) | Height (mm) | Diameter (mm) |
|---|---|---|---|
| S-U-2 | 0 | 51.55 | 25.08 |
| S-1 | 10 | 51.82 | 25.15 |
| S-2 | 20 | 50.01 | 24.82 |
| S-4 | 40 | 50.30 | 24.92 |
| Specimen NO. | Diameter (mm) | Height (mm) | Confining Pressure (MPa) | Peak Stress (MPa) | Axial Pressure | Number of Cycles |
|---|---|---|---|---|---|---|
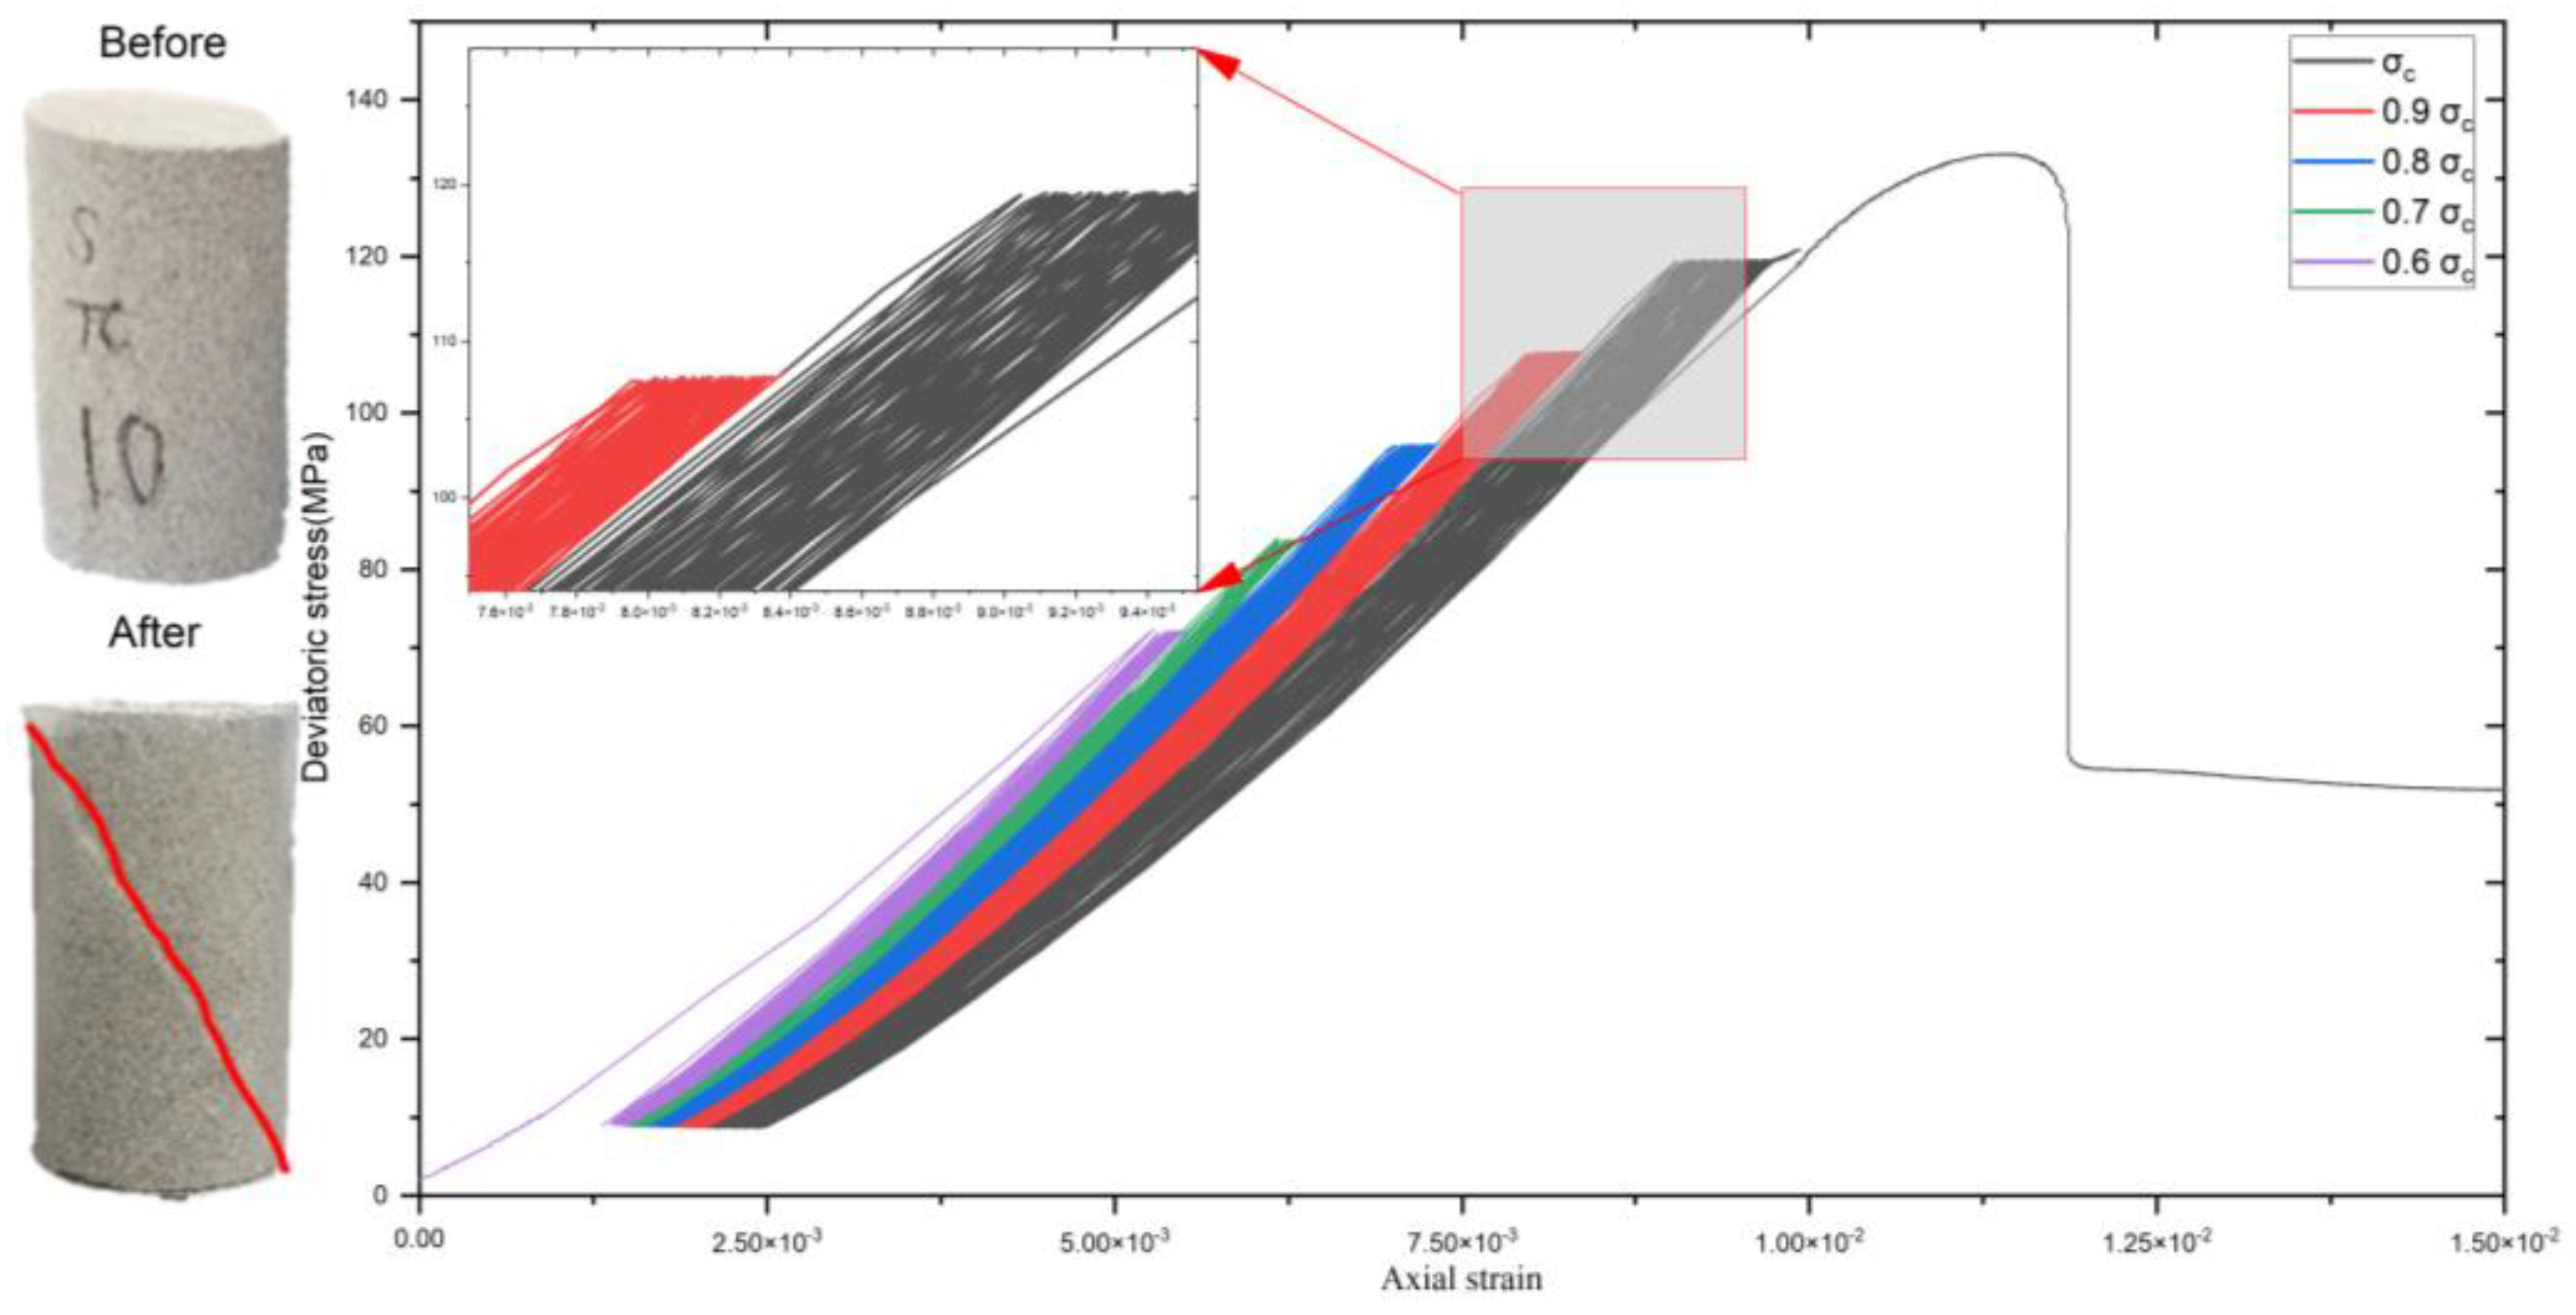
| S-TC-10 | 25.11 | 50.21 | 10 | 117 | 10 MPa~0.6 σc | 40 |
| 10 MPa~0.7 σc | ||||||
| 10 MPa~0.8 σc | ||||||
| 10 MPa~0.9 σc | ||||||
| 10 MPa~1.0 σc | ||||||
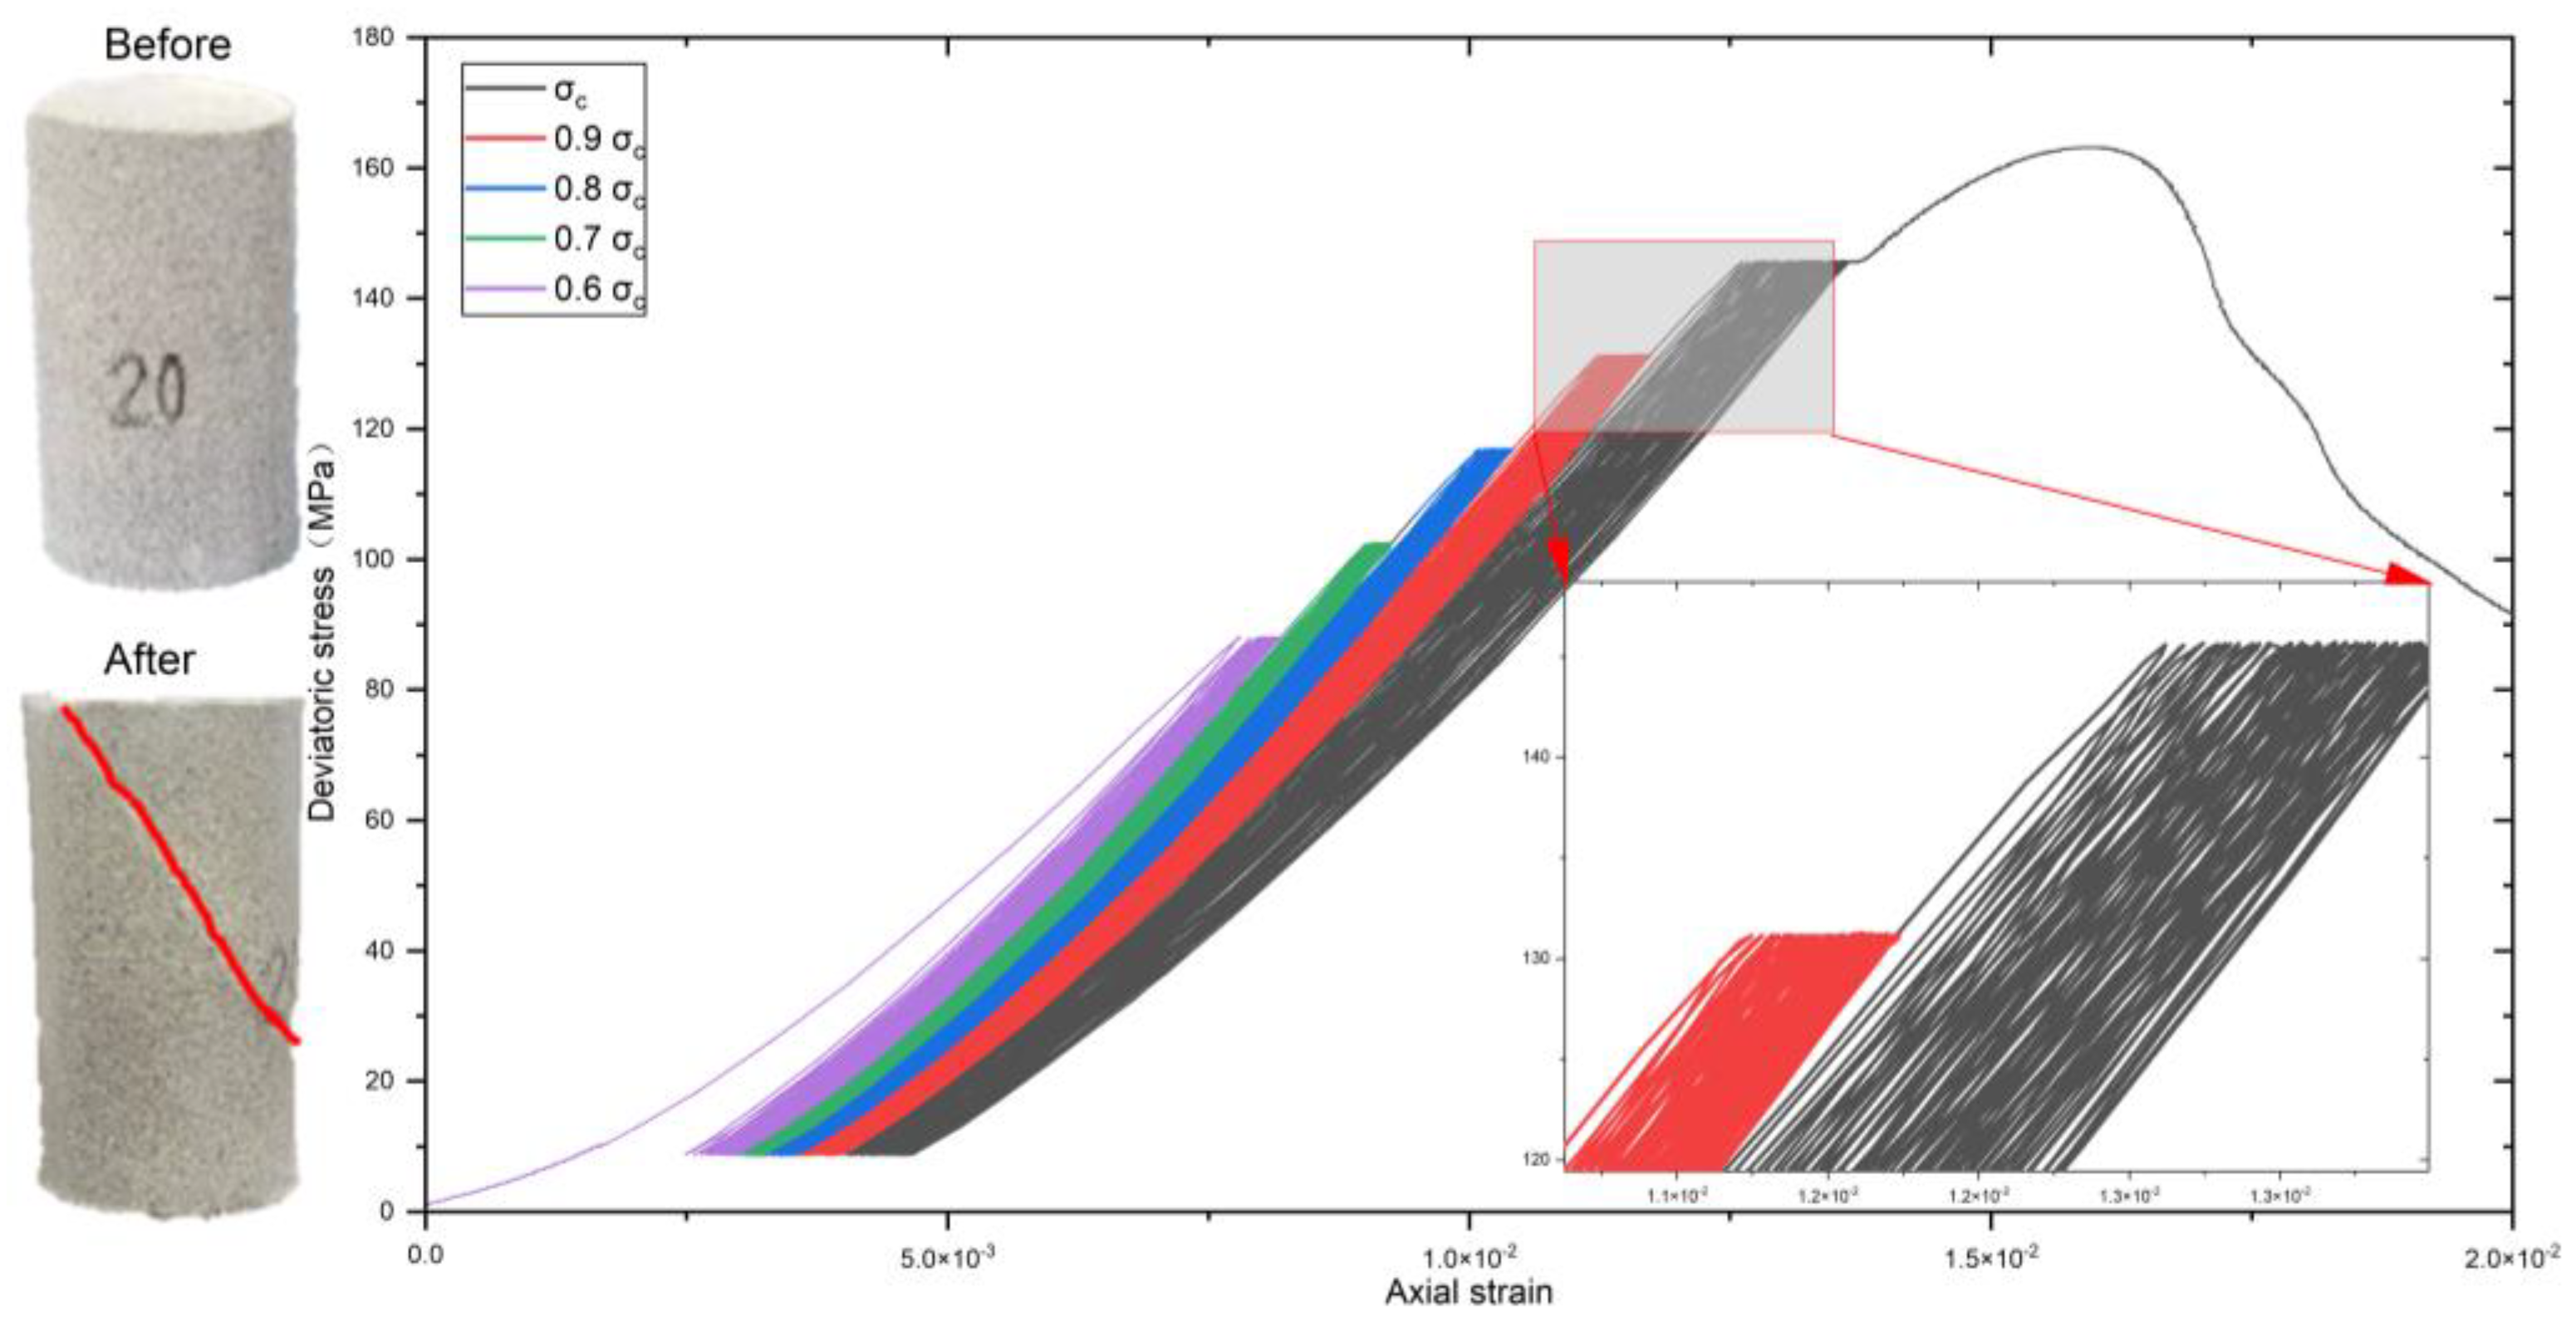
| S-TC-20 | 24.86 | 50.03 | 20 | 143 | 10 MPa~0.6 σc | 40 |
| 10 MPa~0.7 σc | ||||||
| 10 MPa~0.8 σc | ||||||
| 10 MPa~0.9 σc | ||||||
| 10 MPa~1.0 σc | ||||||
| S-TC-30 | 25.21 | 50.08 | 30 | 164 | 10 MPa~0.6 σc | 40 |
| 10 MPa~0.7 σc | ||||||
| 10 MPa~0.8 σc | ||||||
| 10 MPa~0.9 σc | ||||||
| 10 MPa~1.0 σc | ||||||
| S-TC-40 | 24.88 | 49.89 | 40 | 186 | 10 MPa~0.6 σc | 40 |
| 10 MPa~0.7 σc | ||||||
| 10 MPa~0.8 σc | ||||||
| 10 MPa~0.9 σc | ||||||
| 10 MPa~1.0 σc |
3. Results of the Experiment
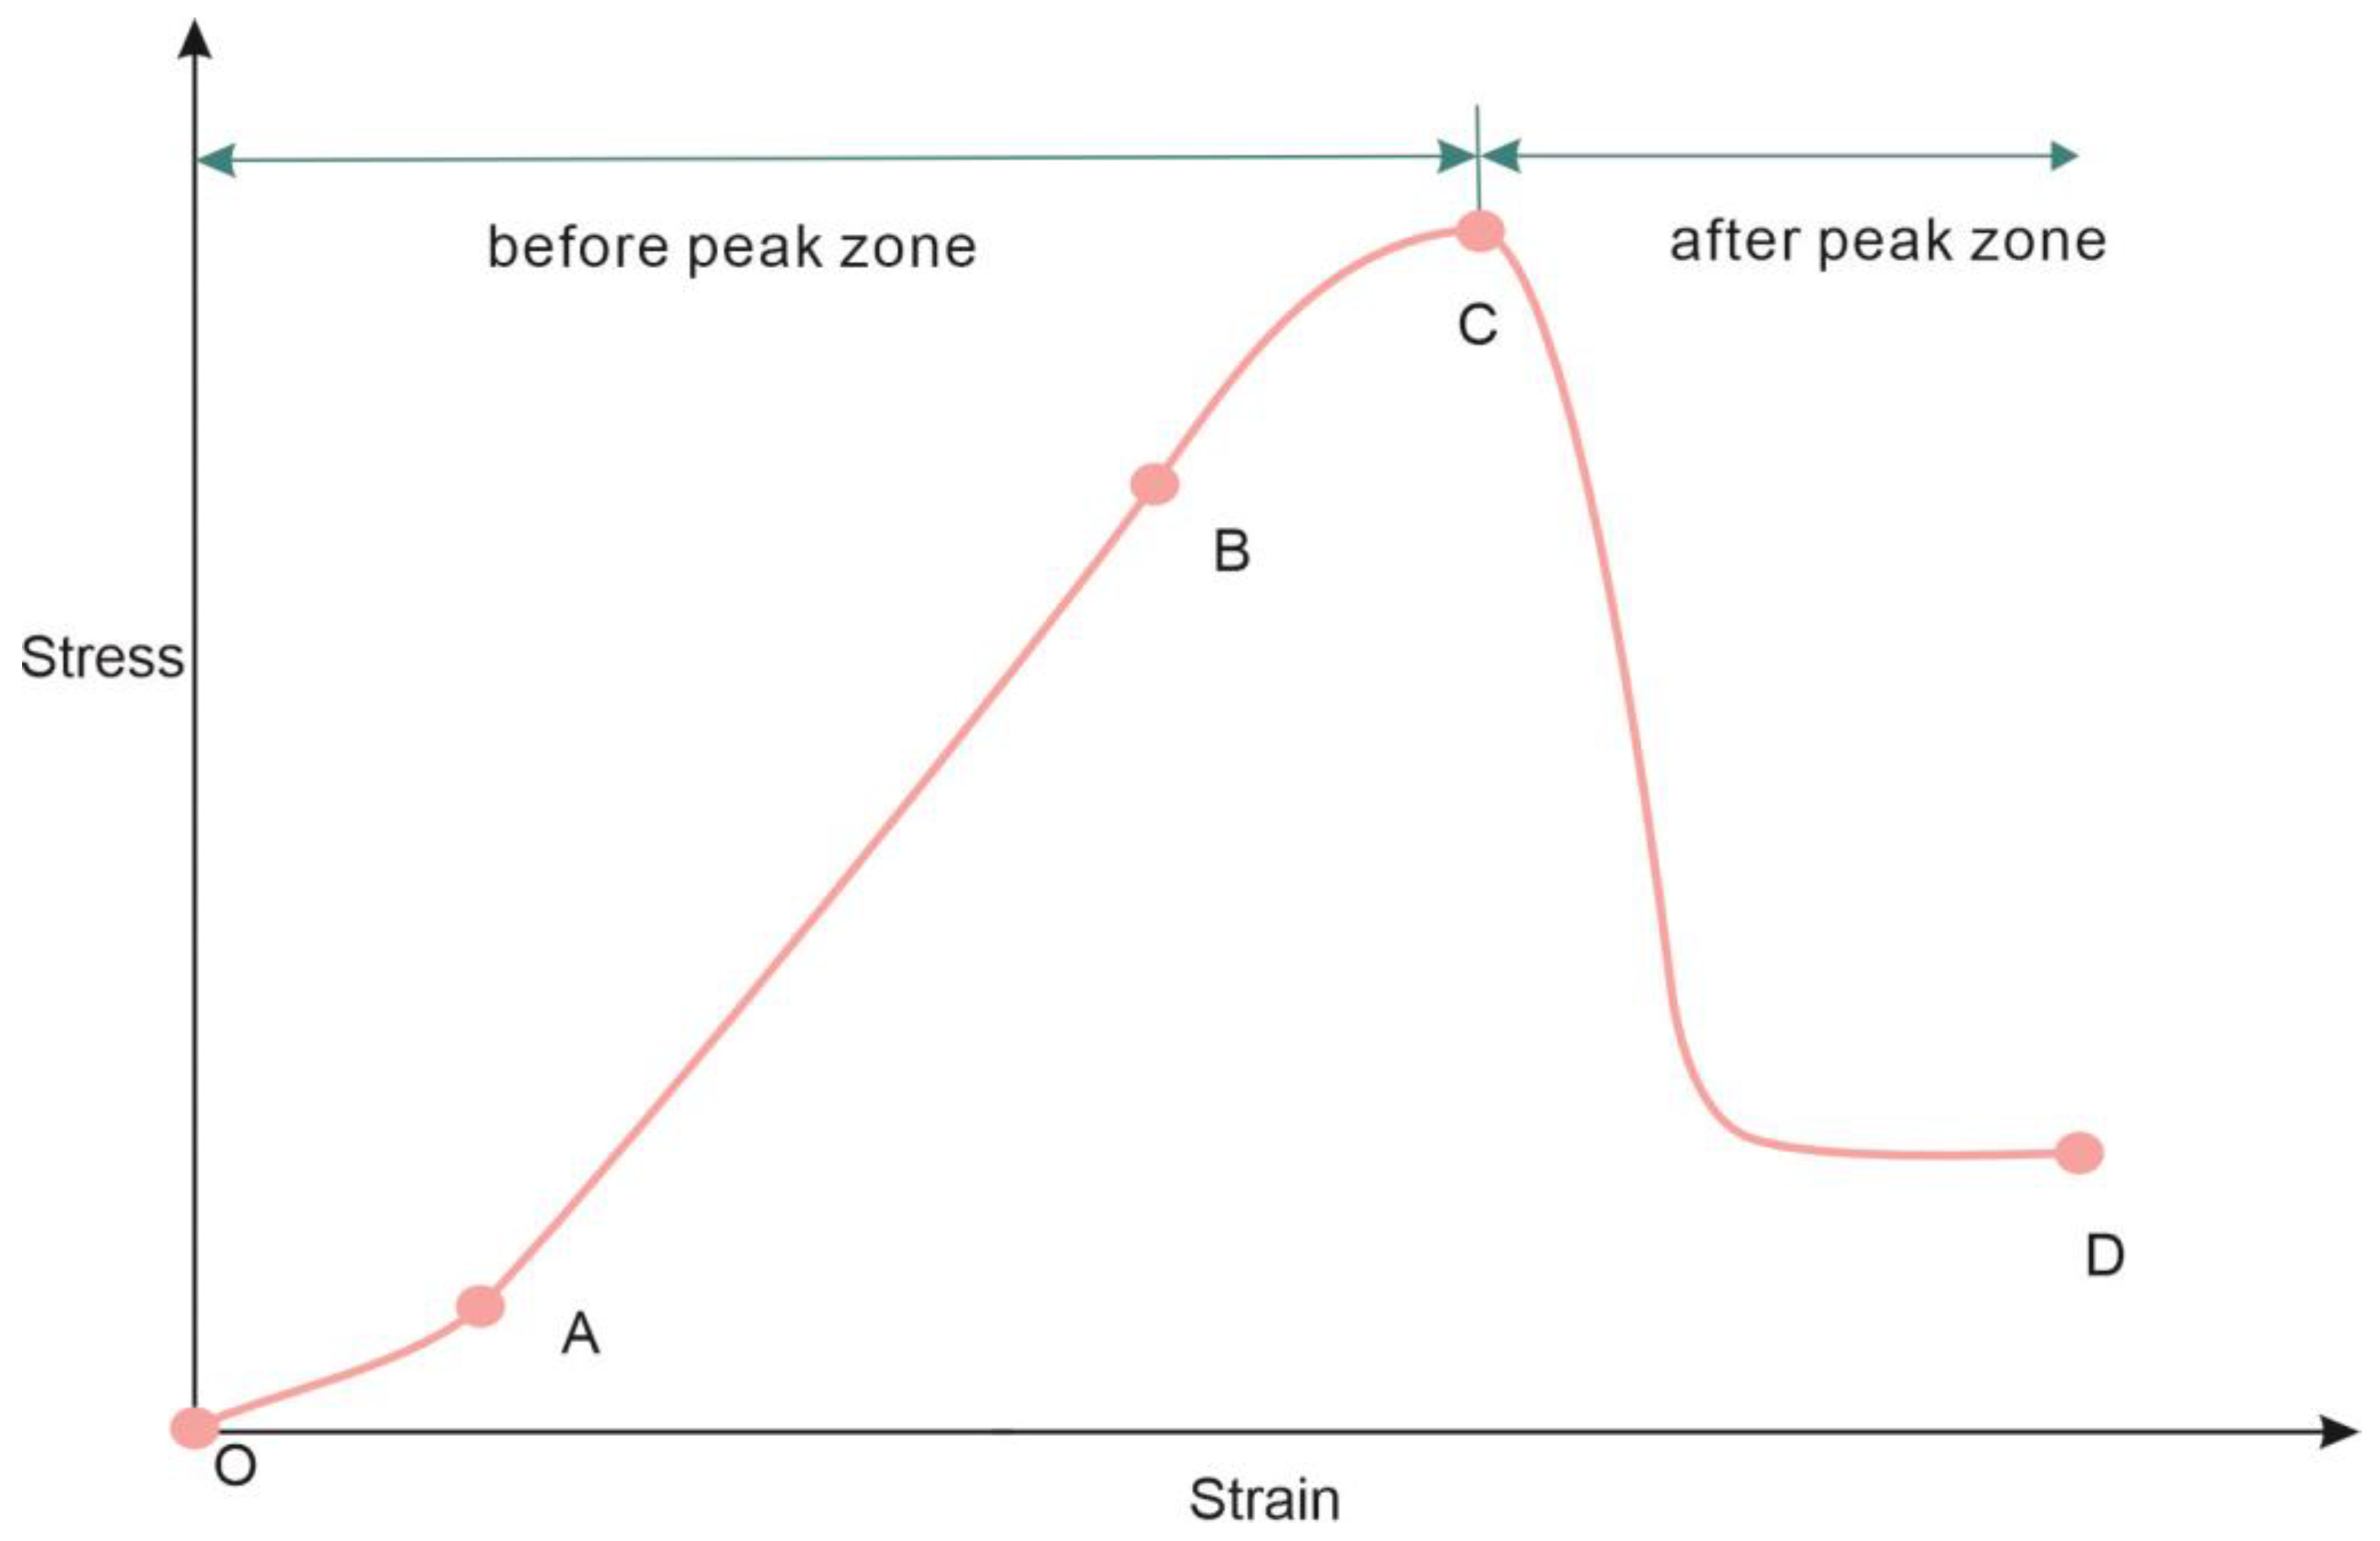
3.1. Triaxial Compressive Stress–Strain Curve
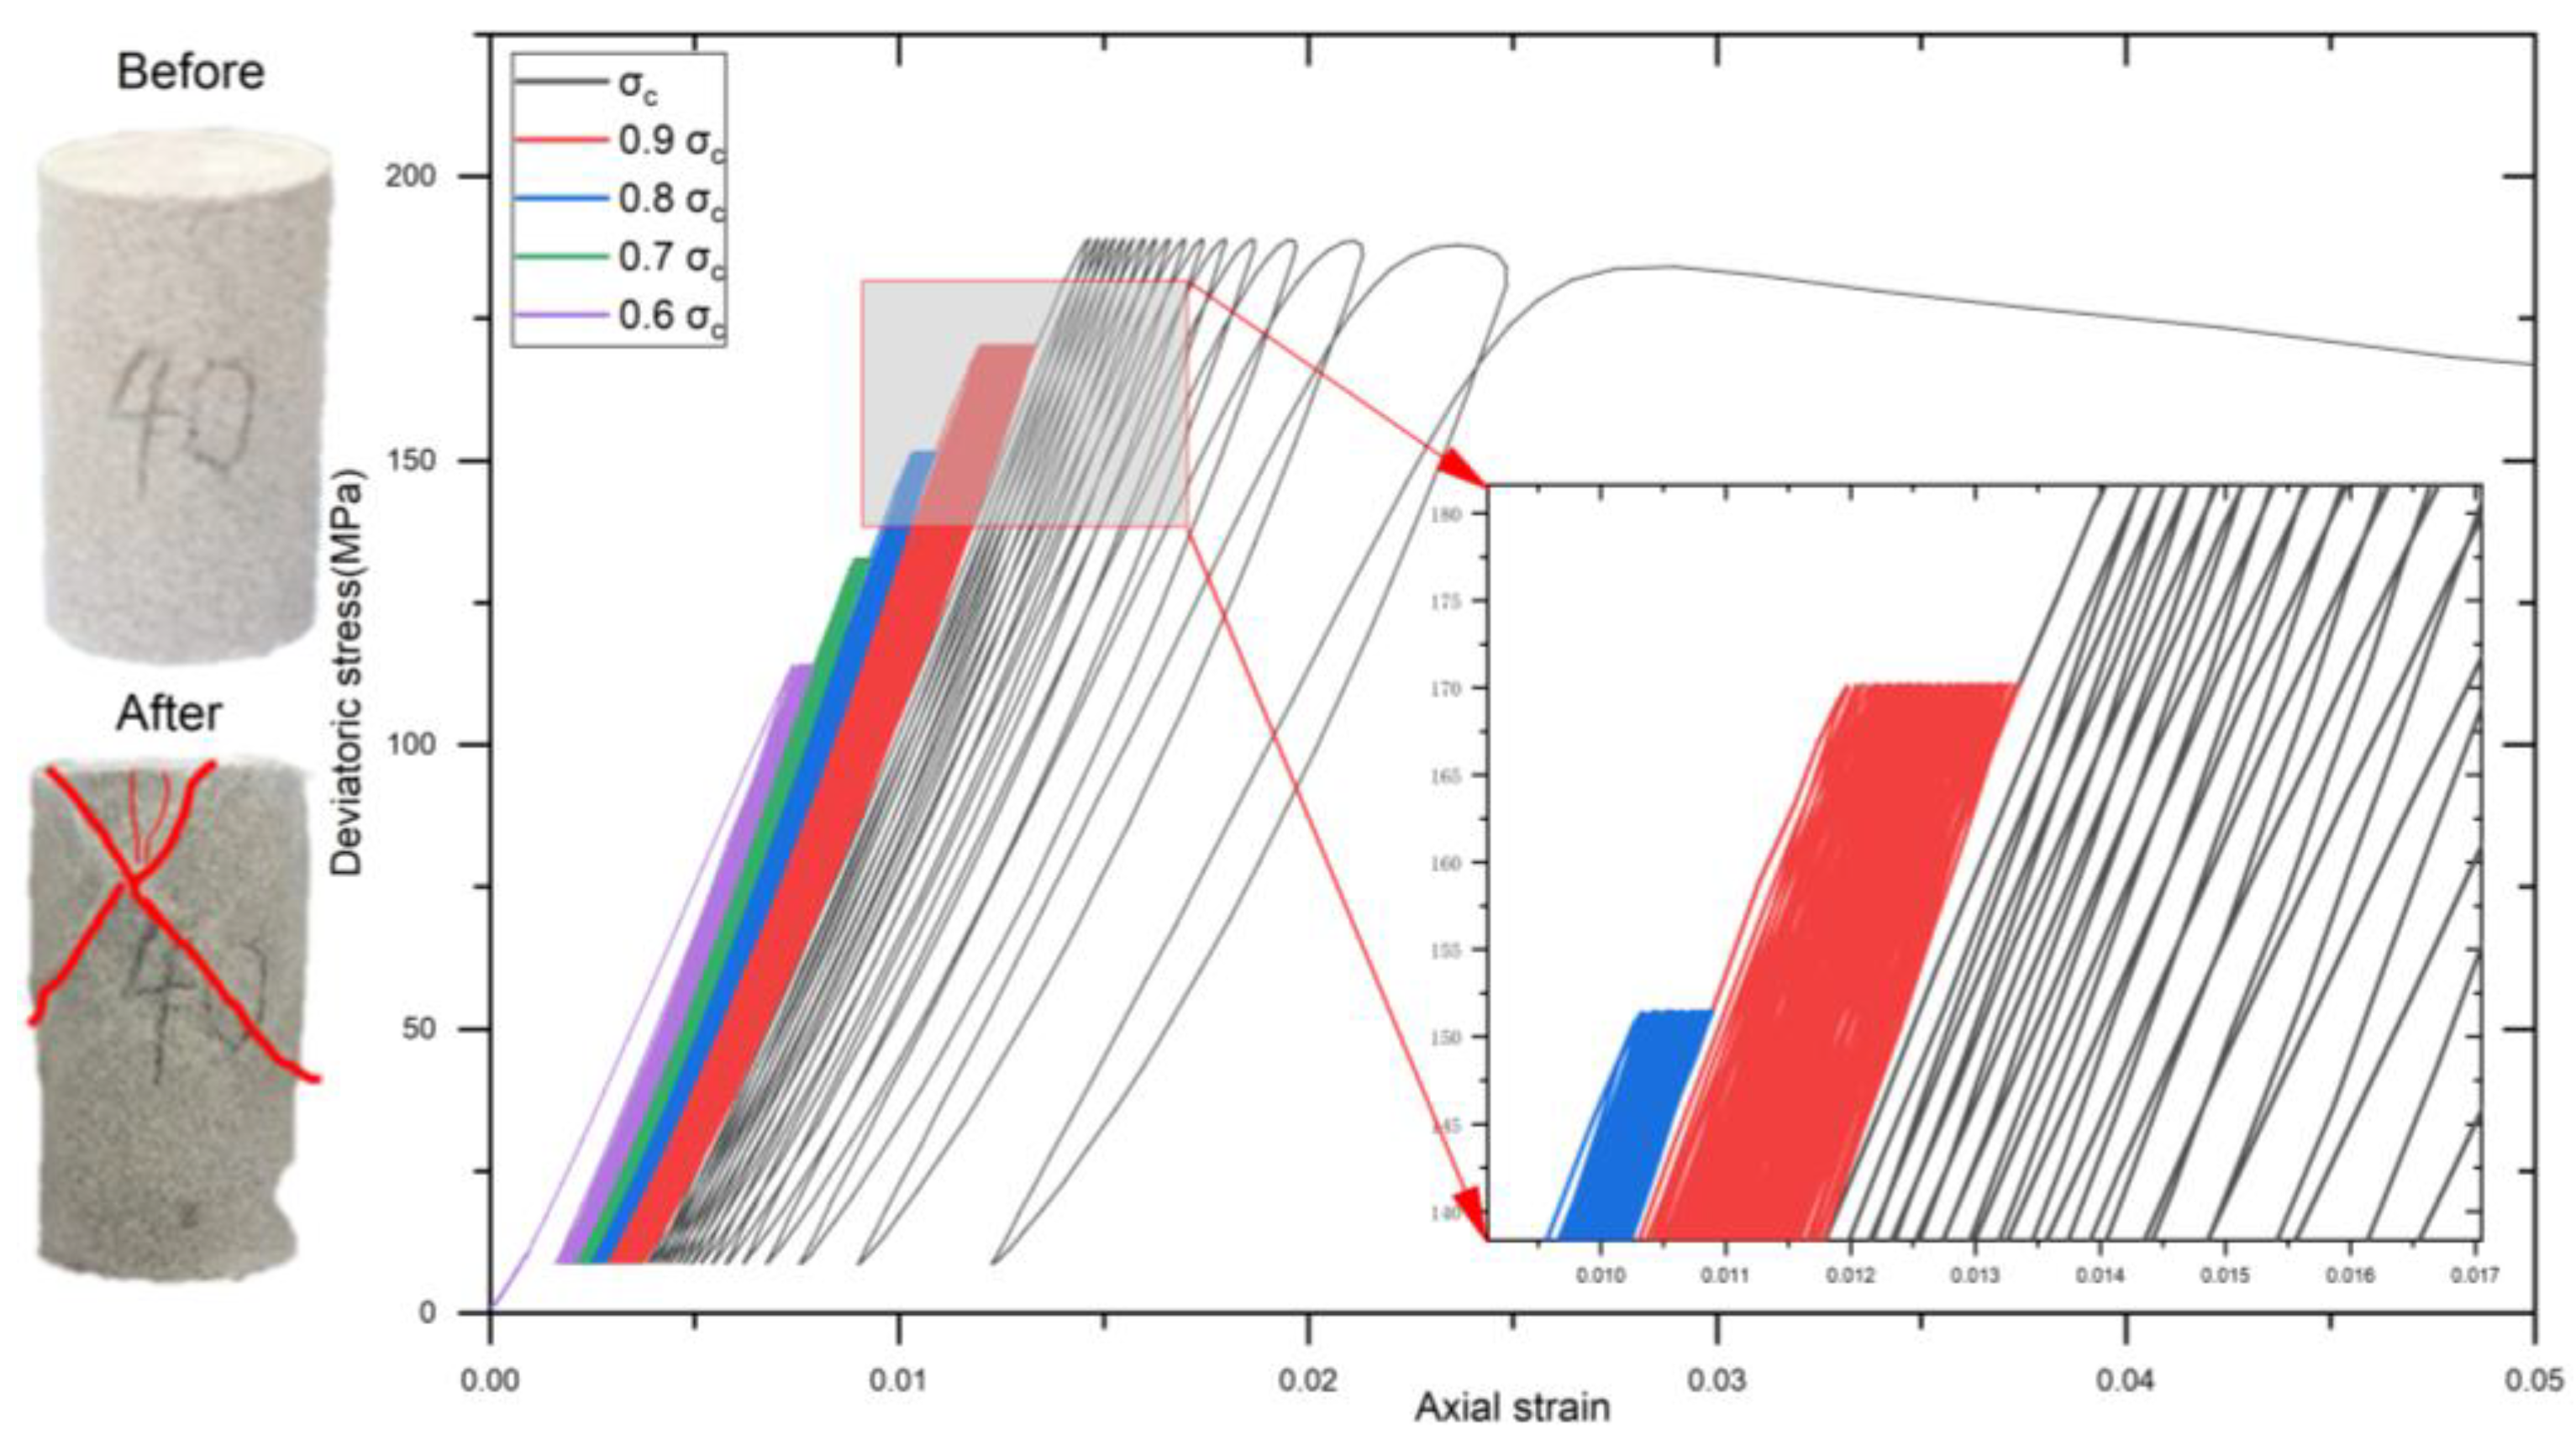
3.2. Stress-Strain Curve in Cyclic Loading–Unloading Triaxial Compression
4. Discussion
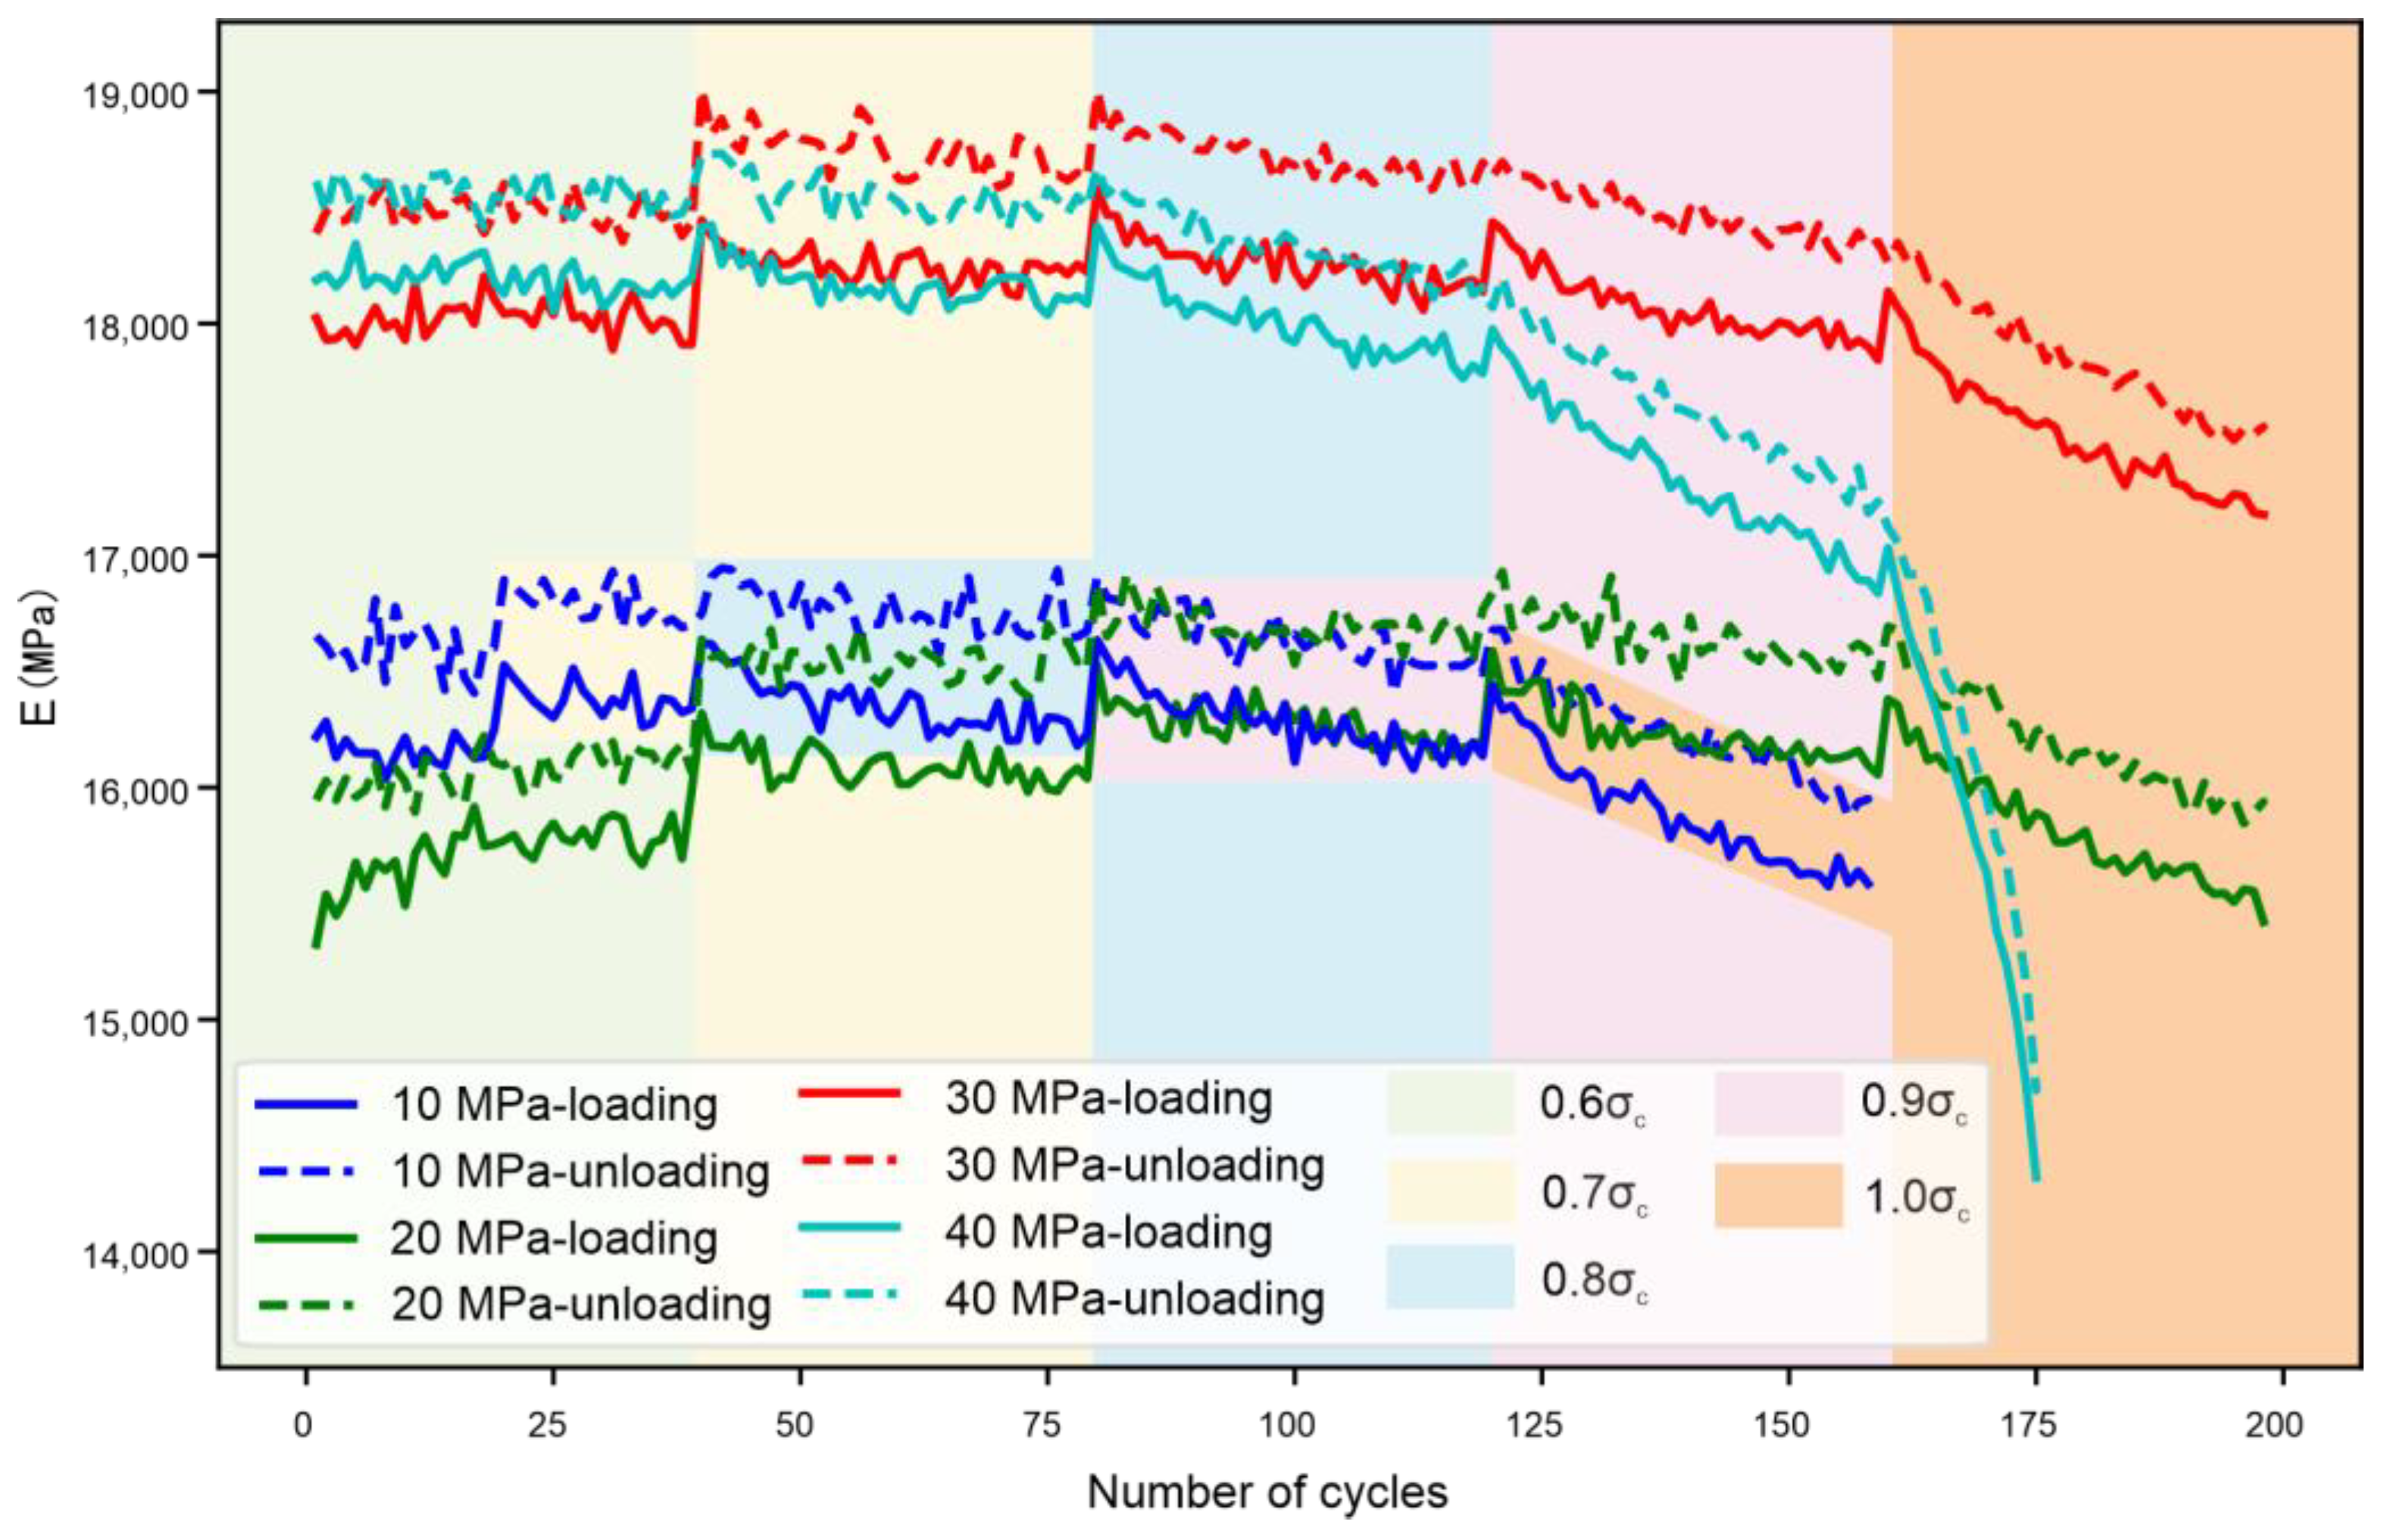
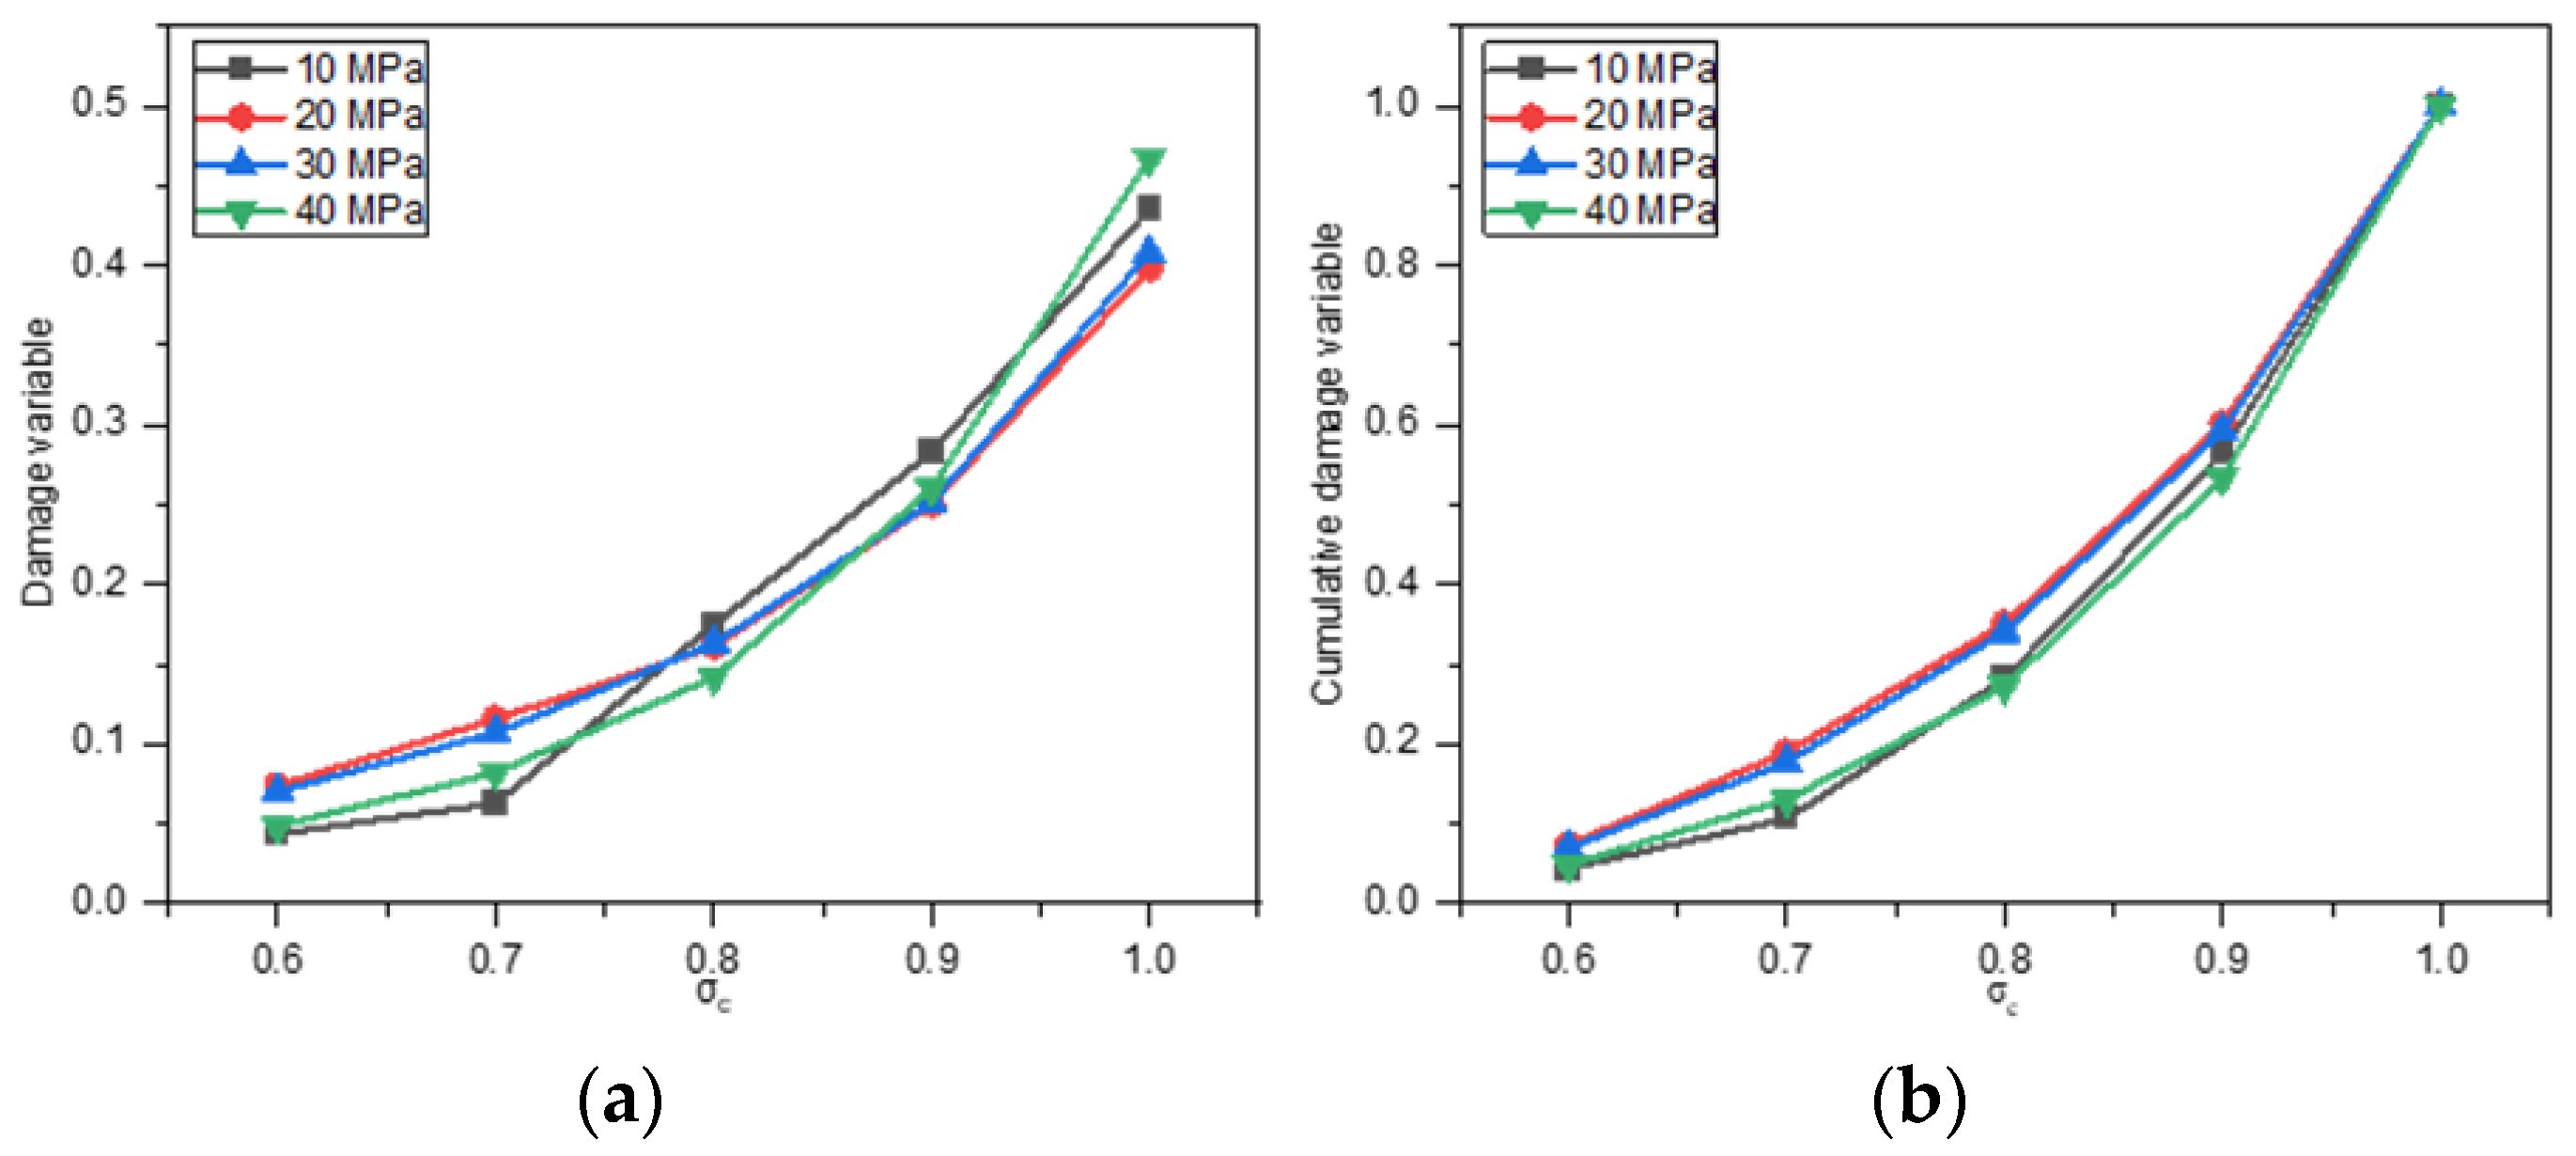
4.1. Mechanical Parameters Analysis in Cyclic Loading–Unloading Tests
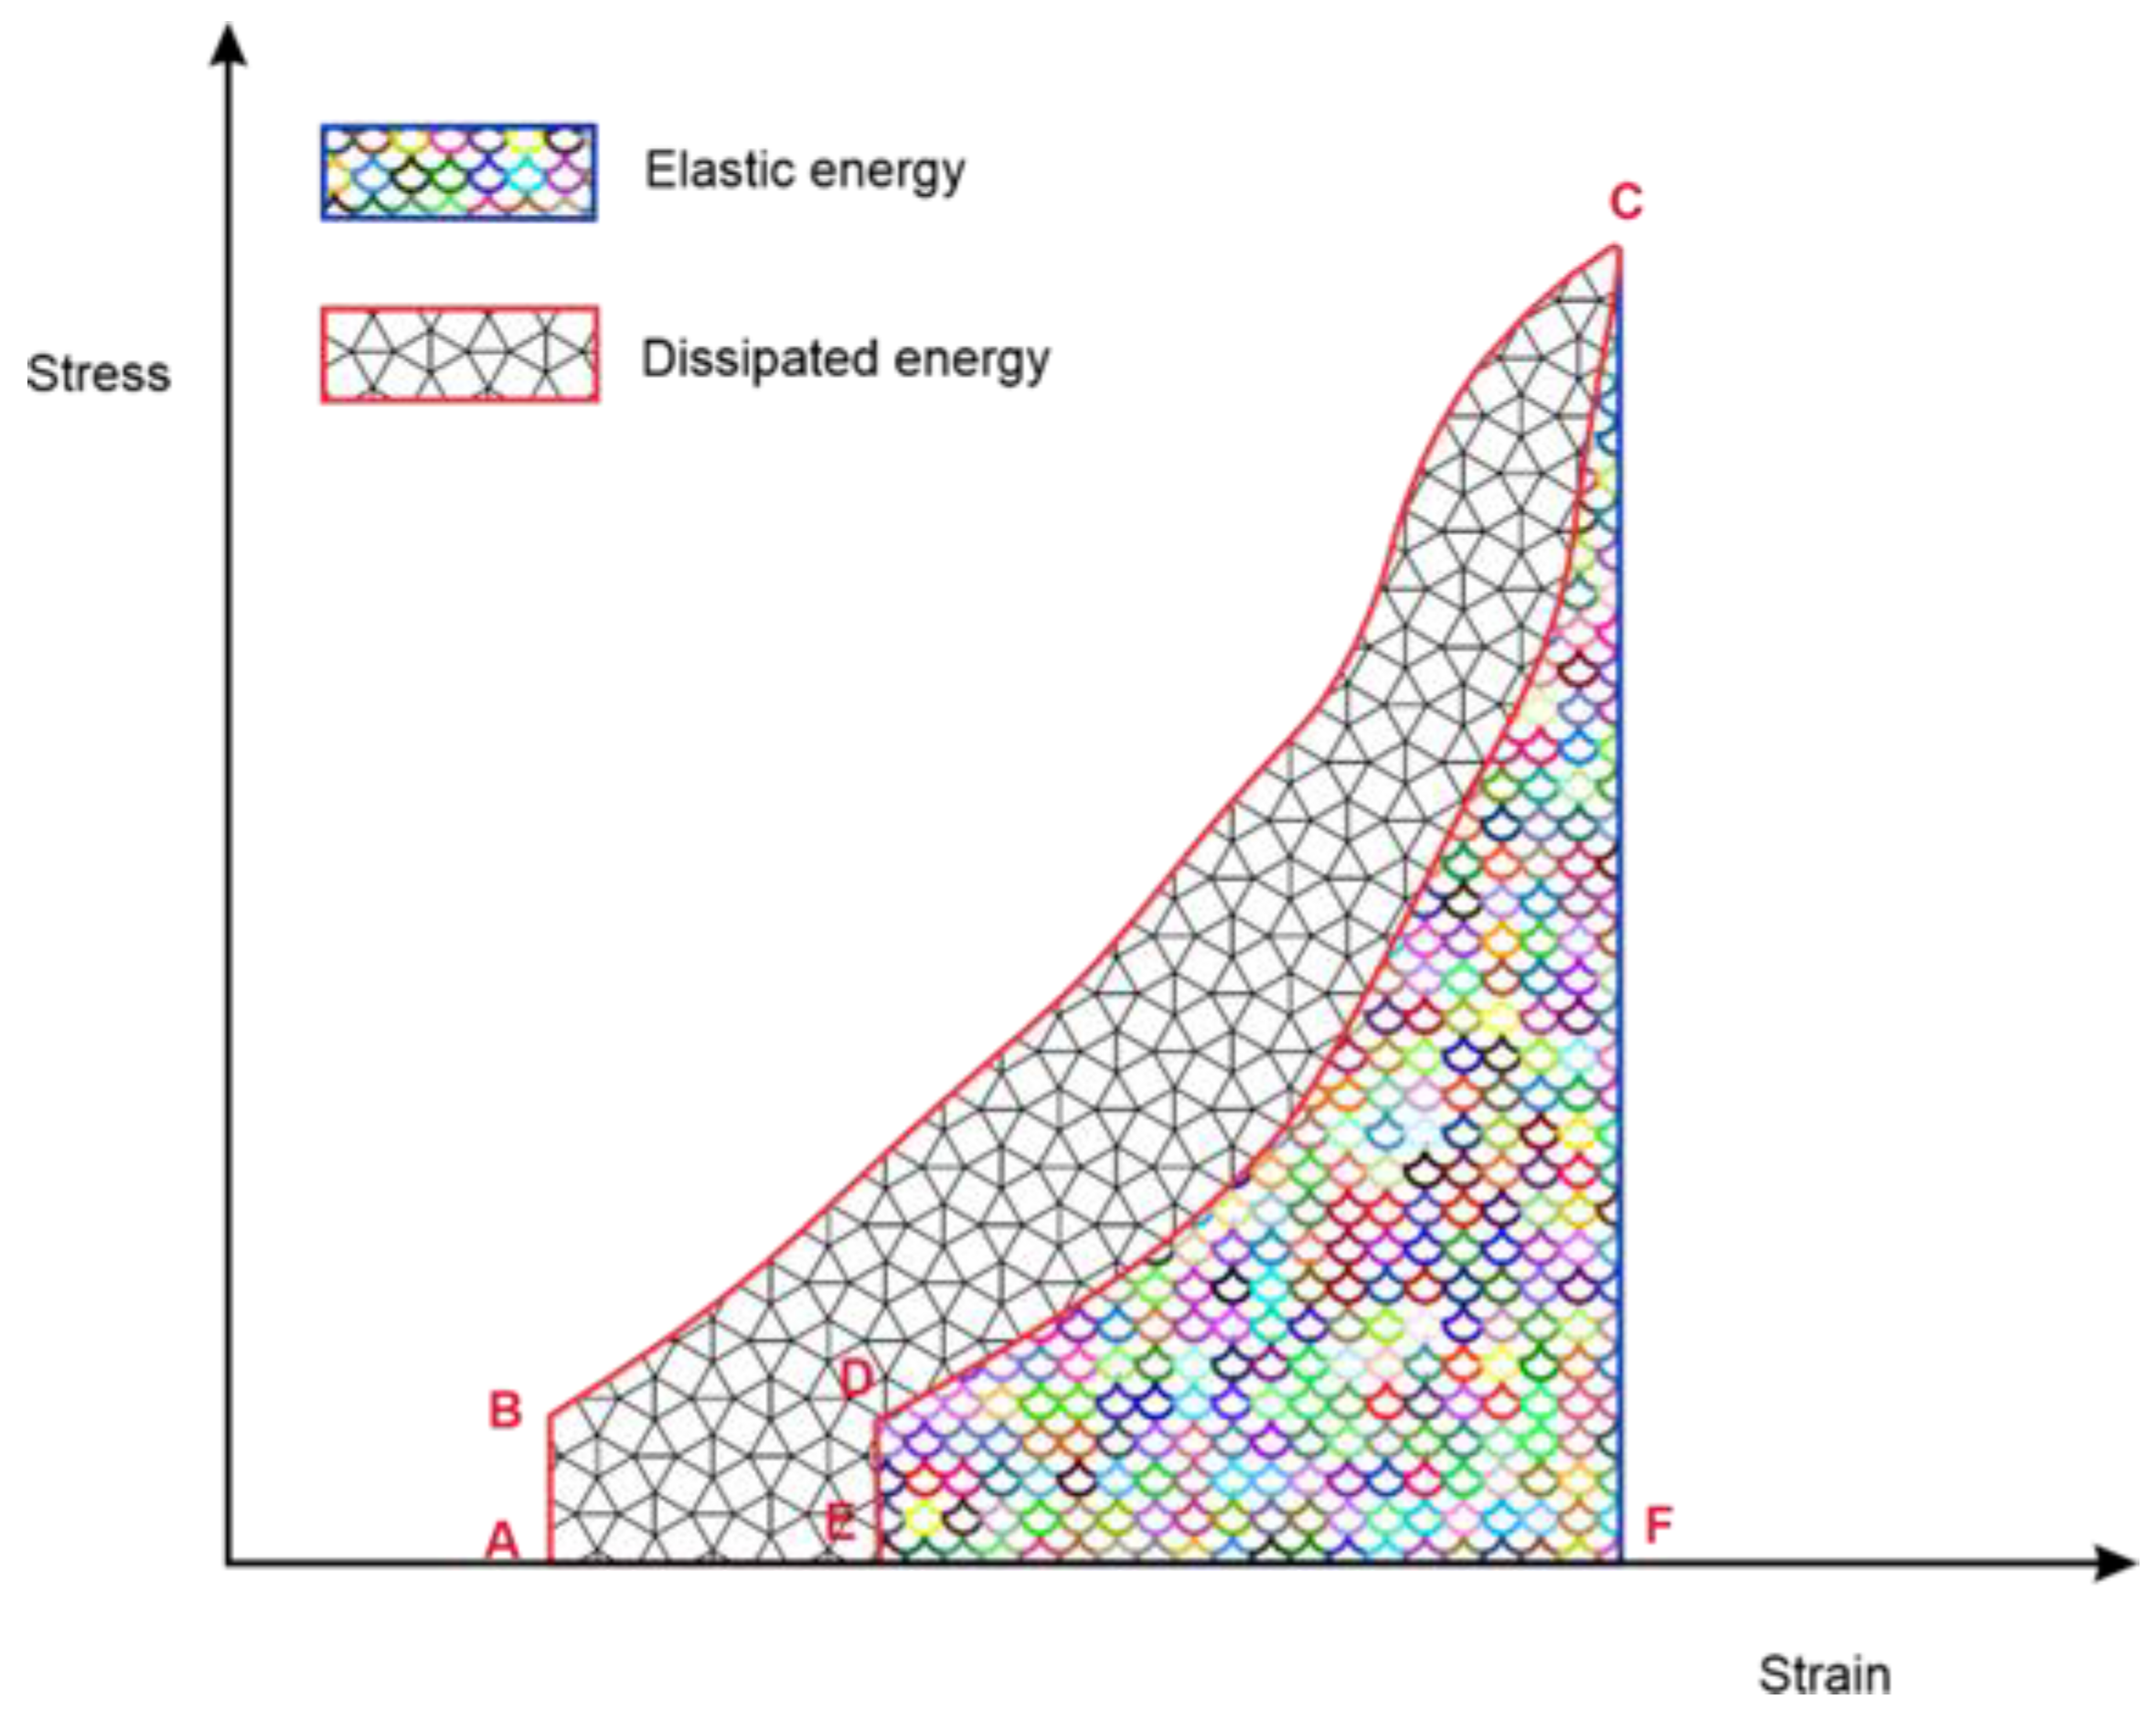
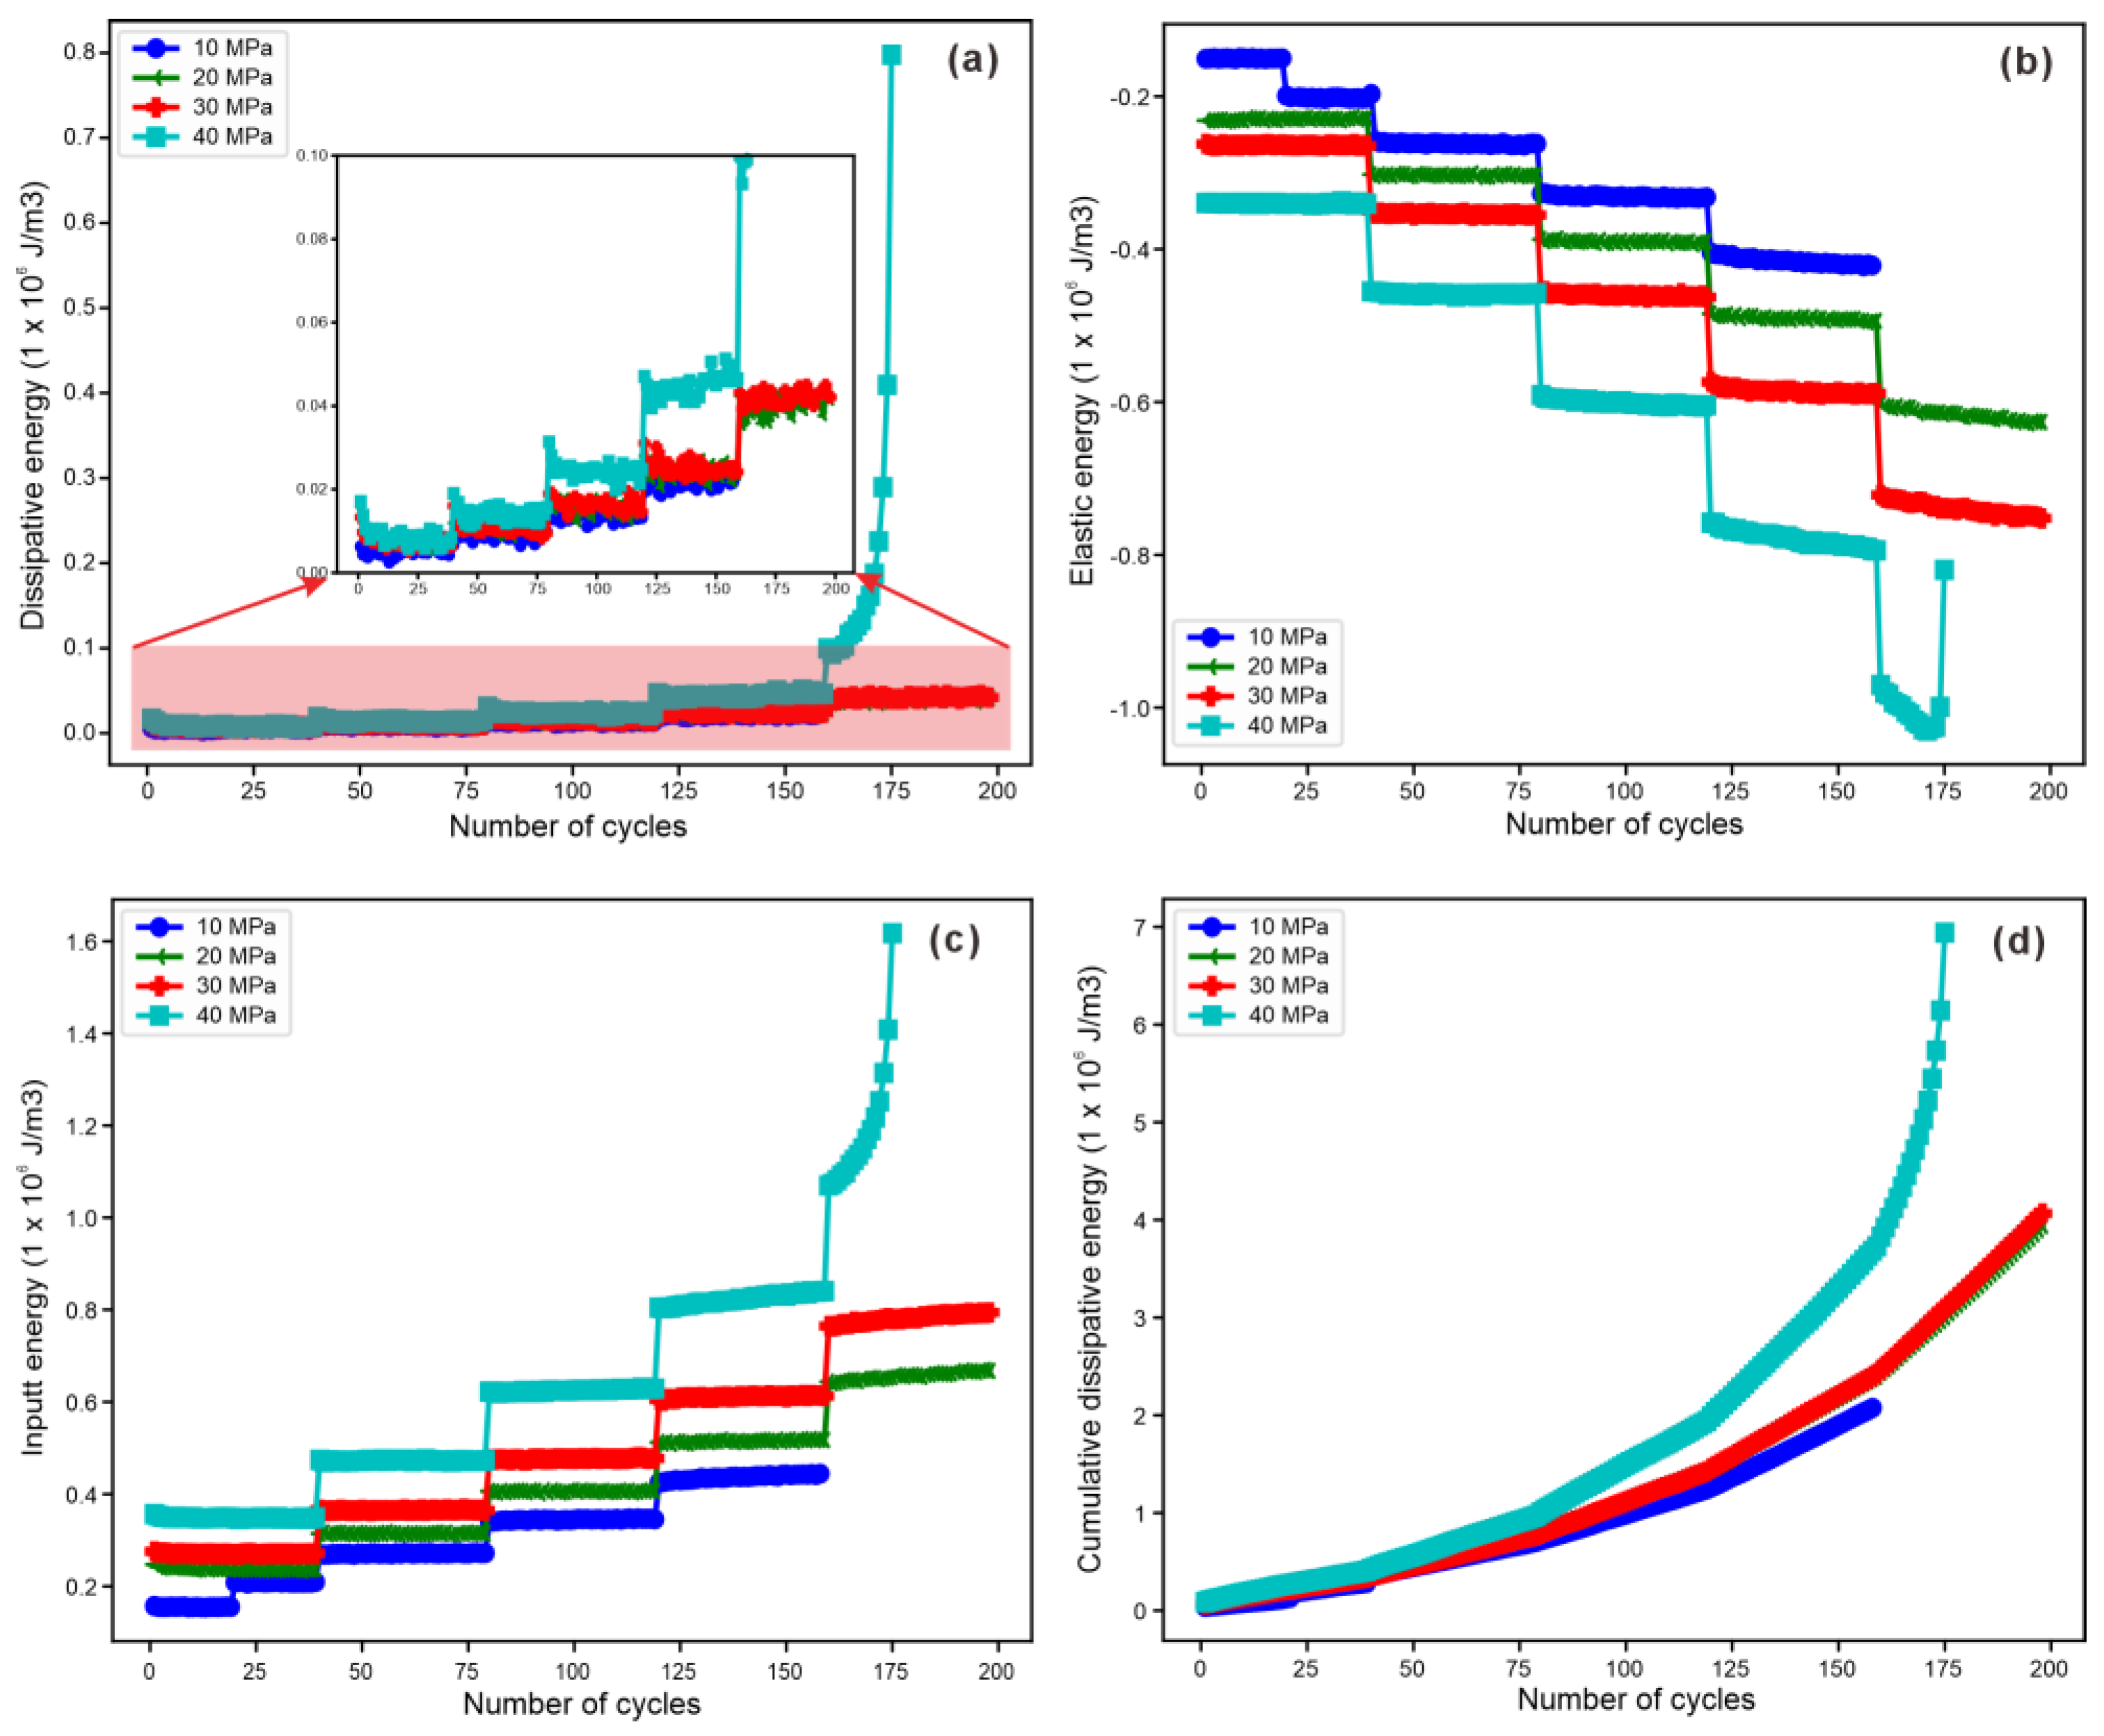
4.2. Energy Evolution Analysis in Cyclic Loading–Unloading Tests
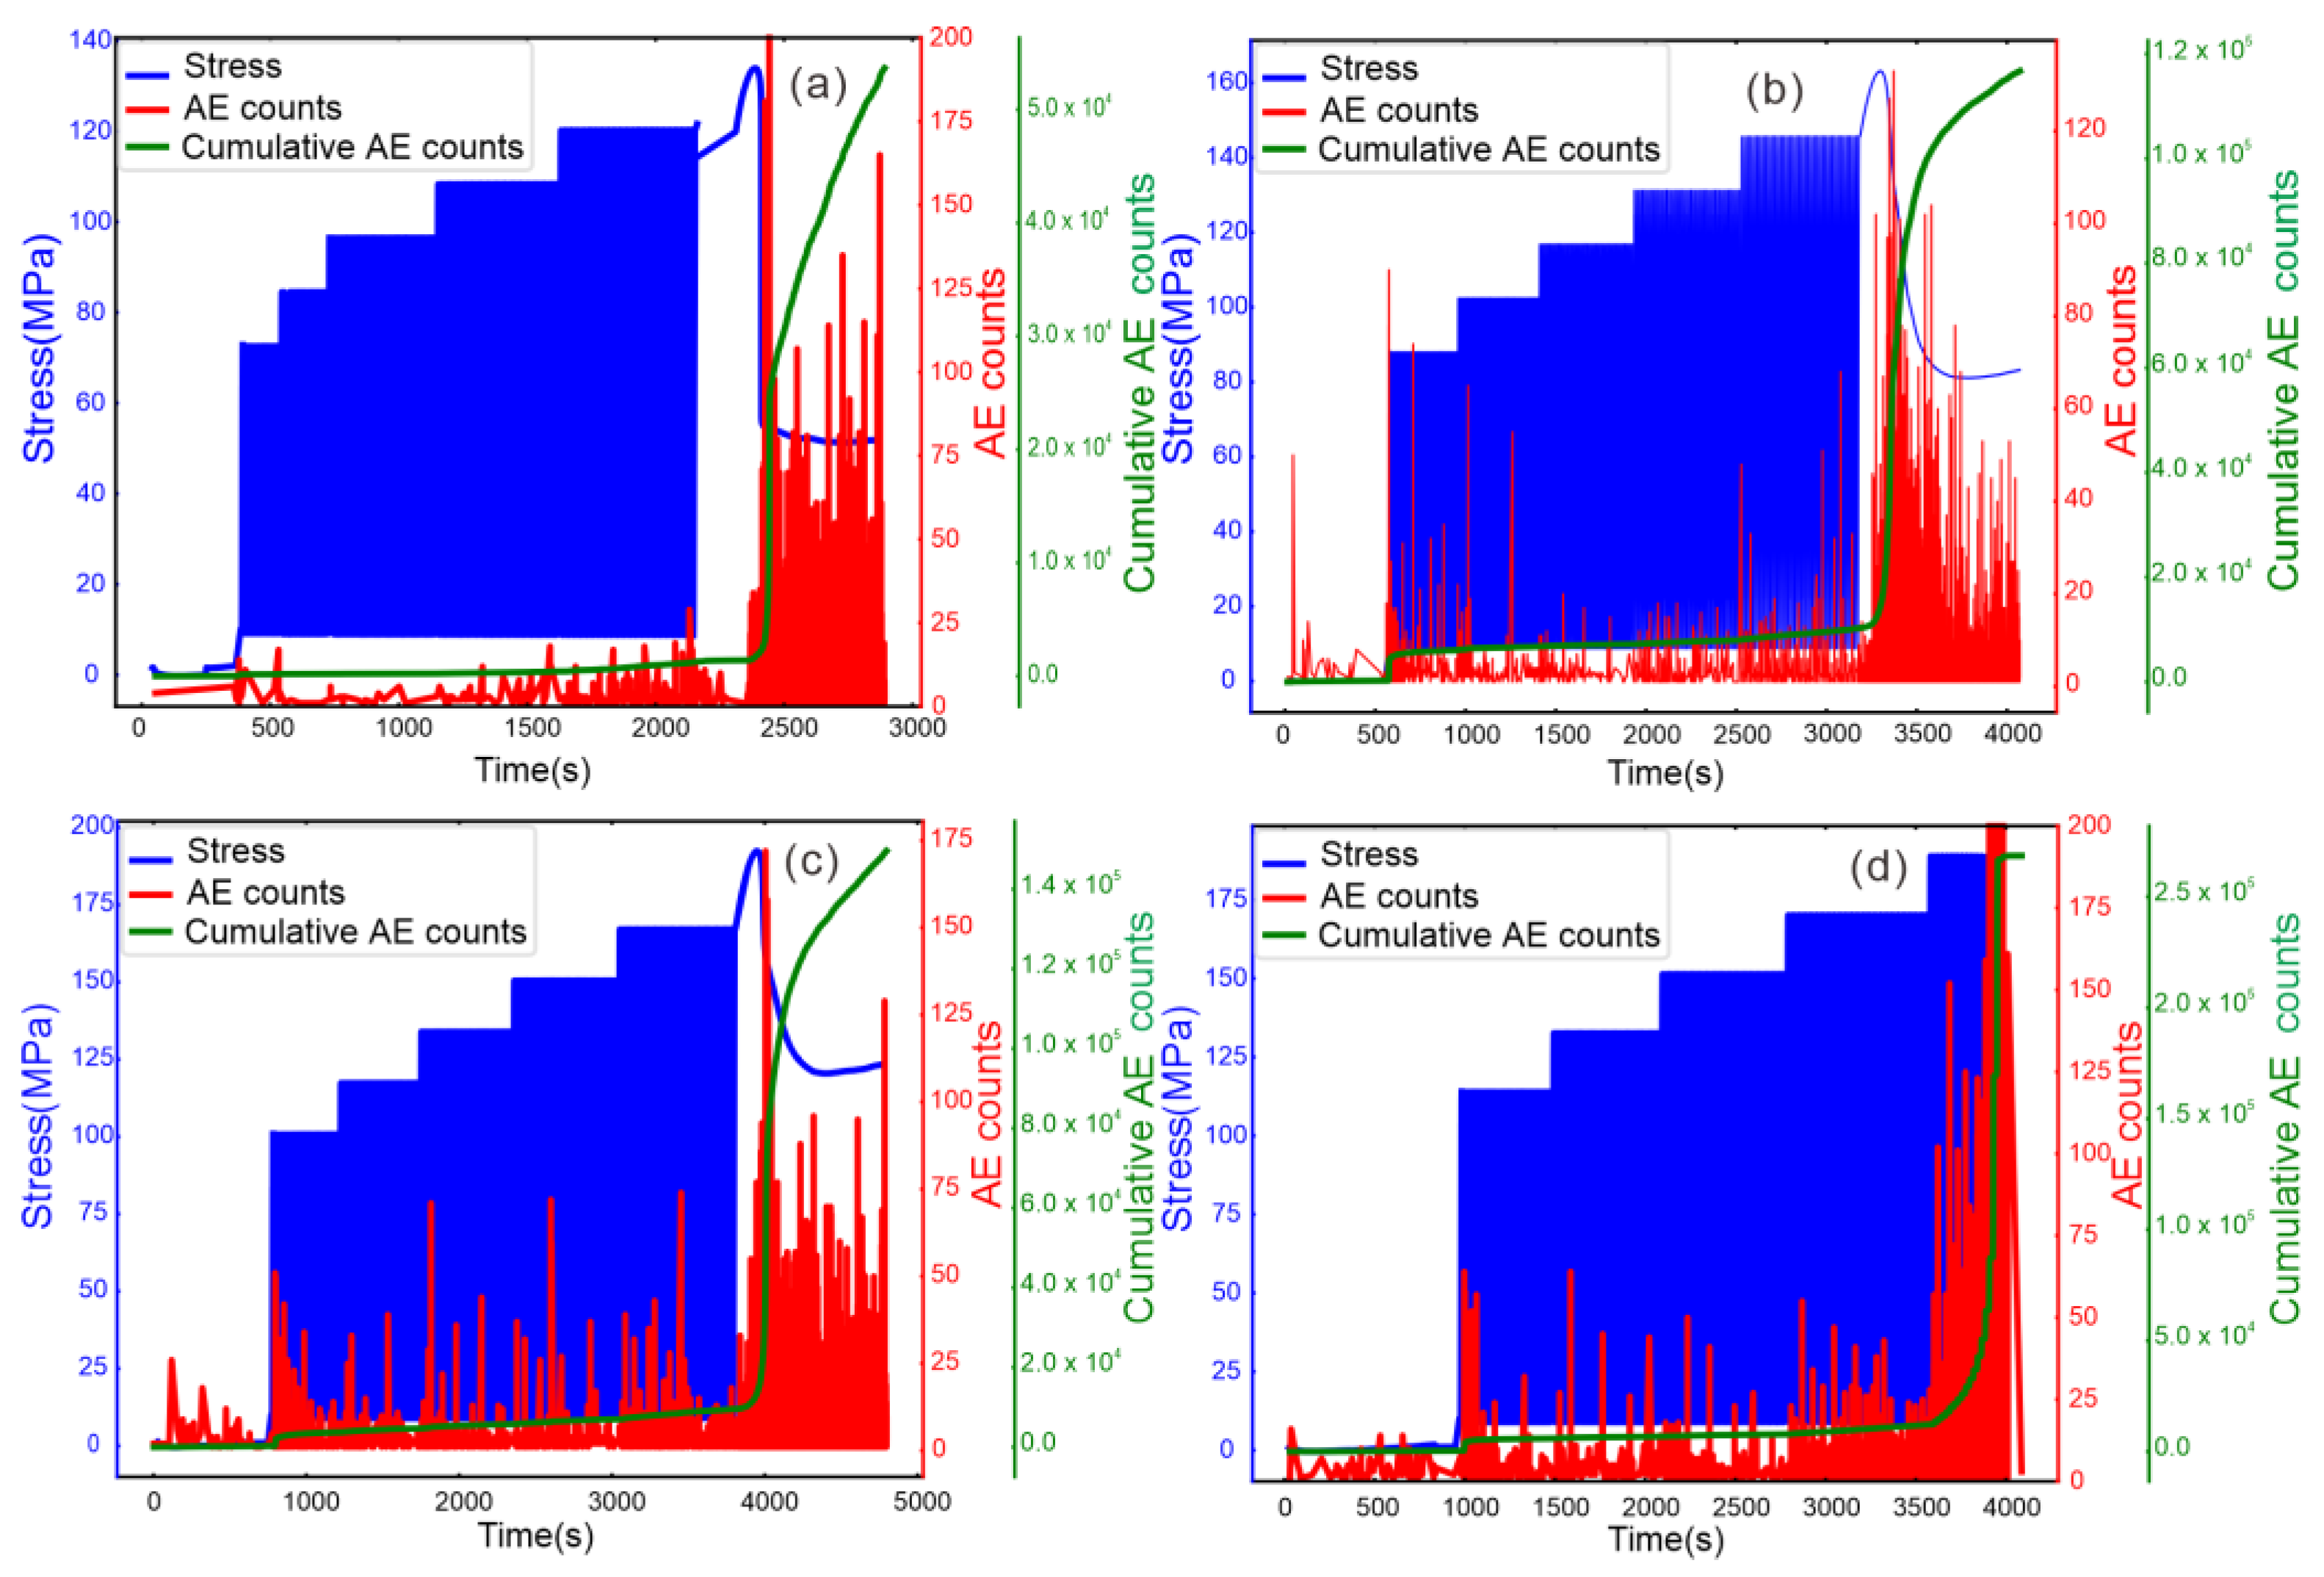
4.3. AE Count Characteristic Analysis in Cyclic Loading–Unloading Tests
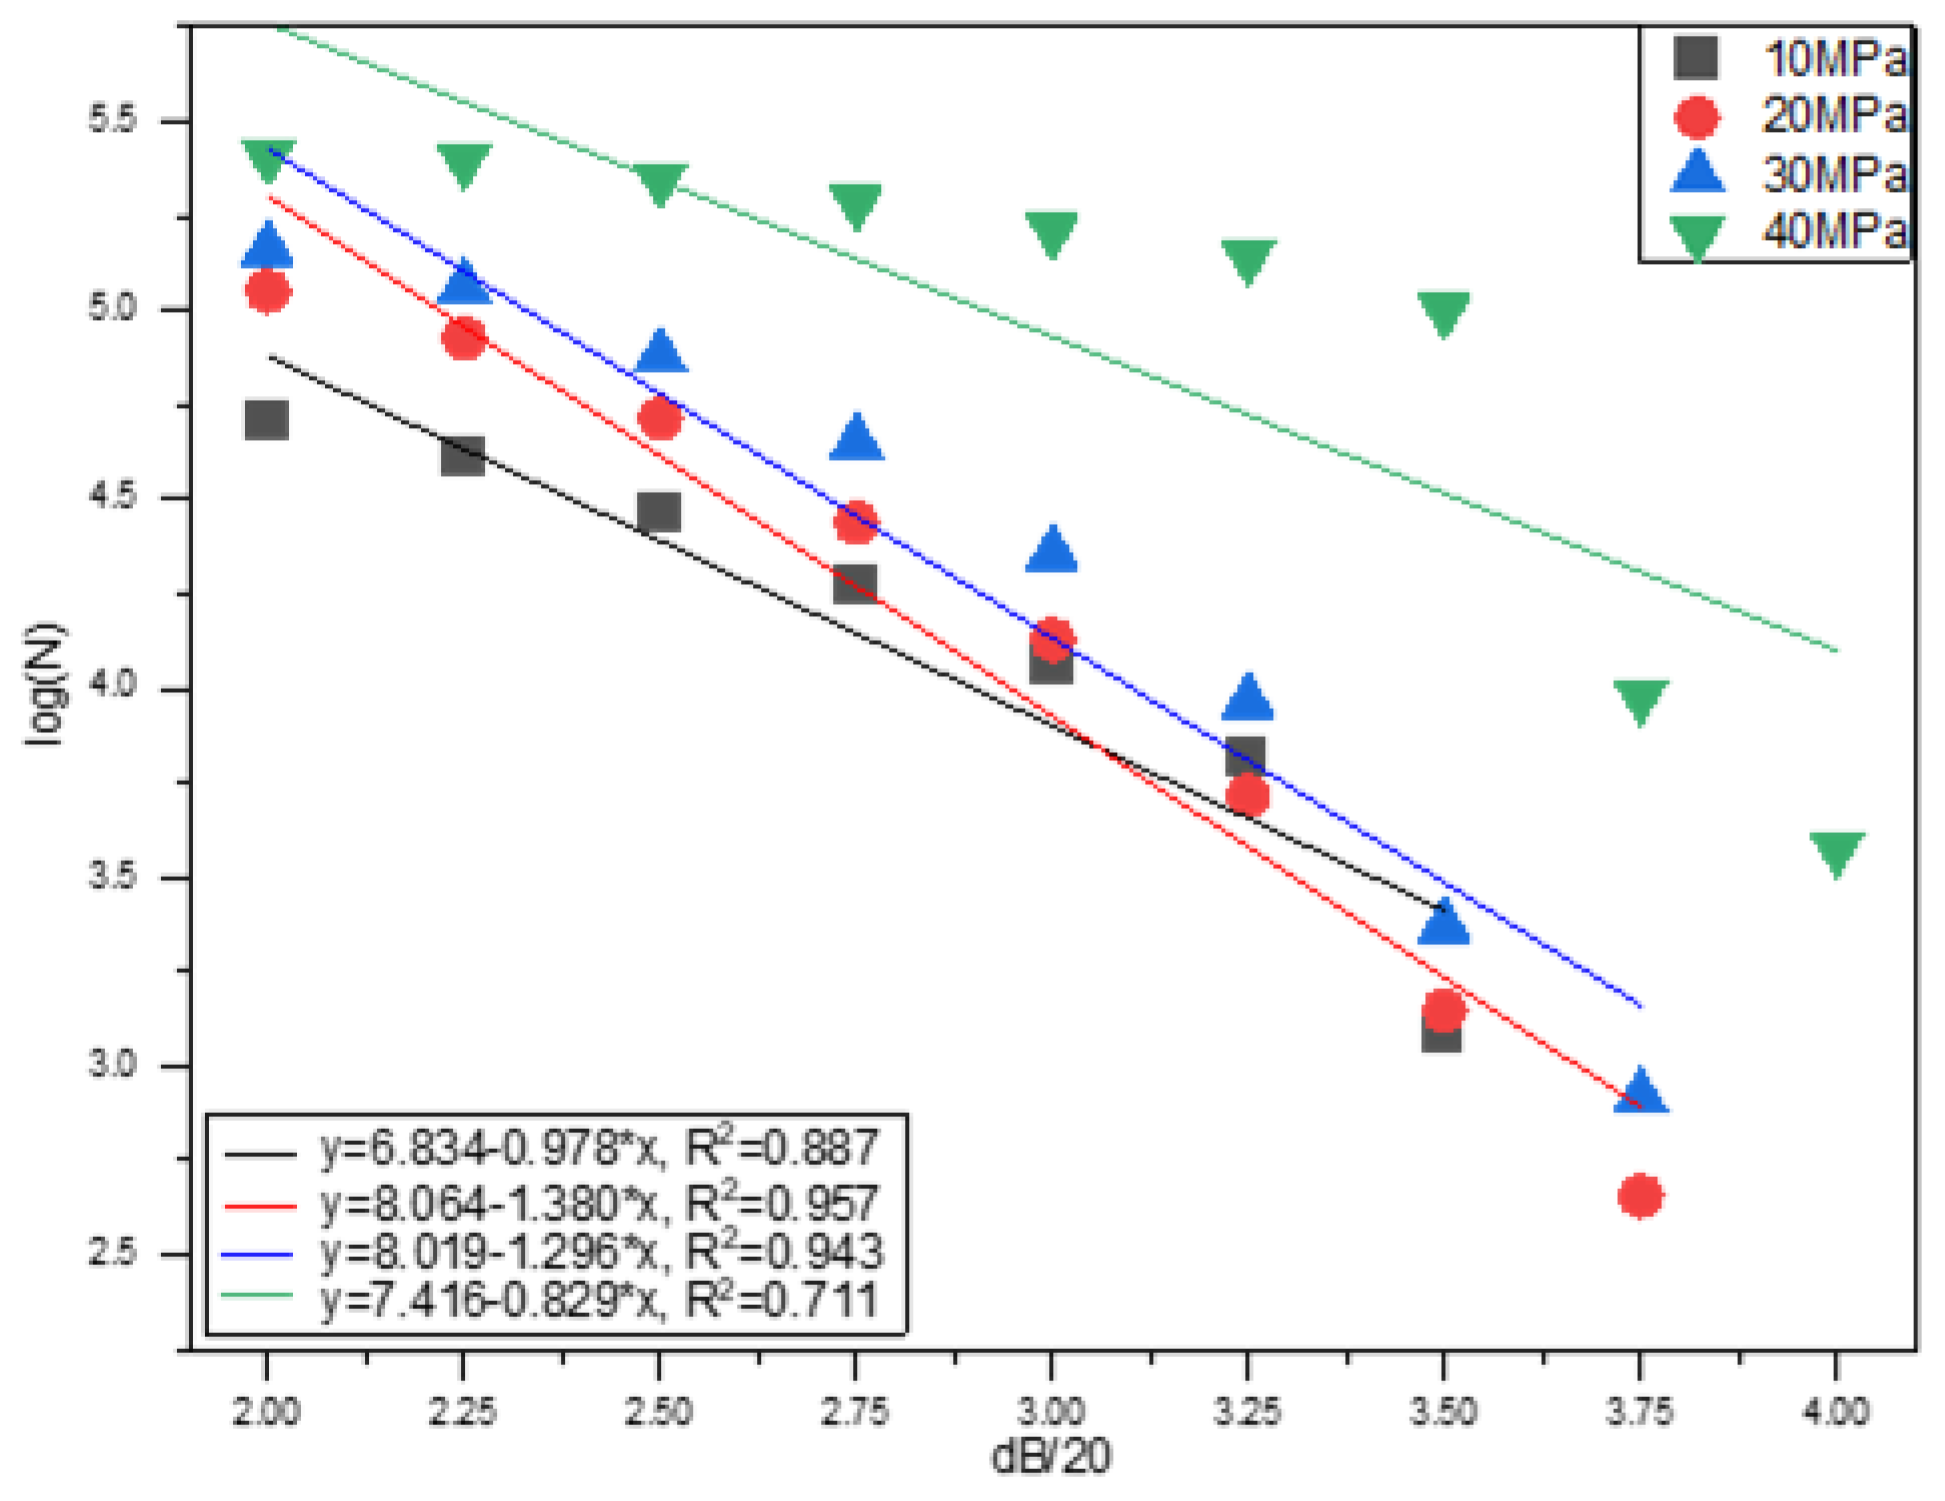
4.4. b-Value Analysis in Cyclic Loading–Unloading Tests
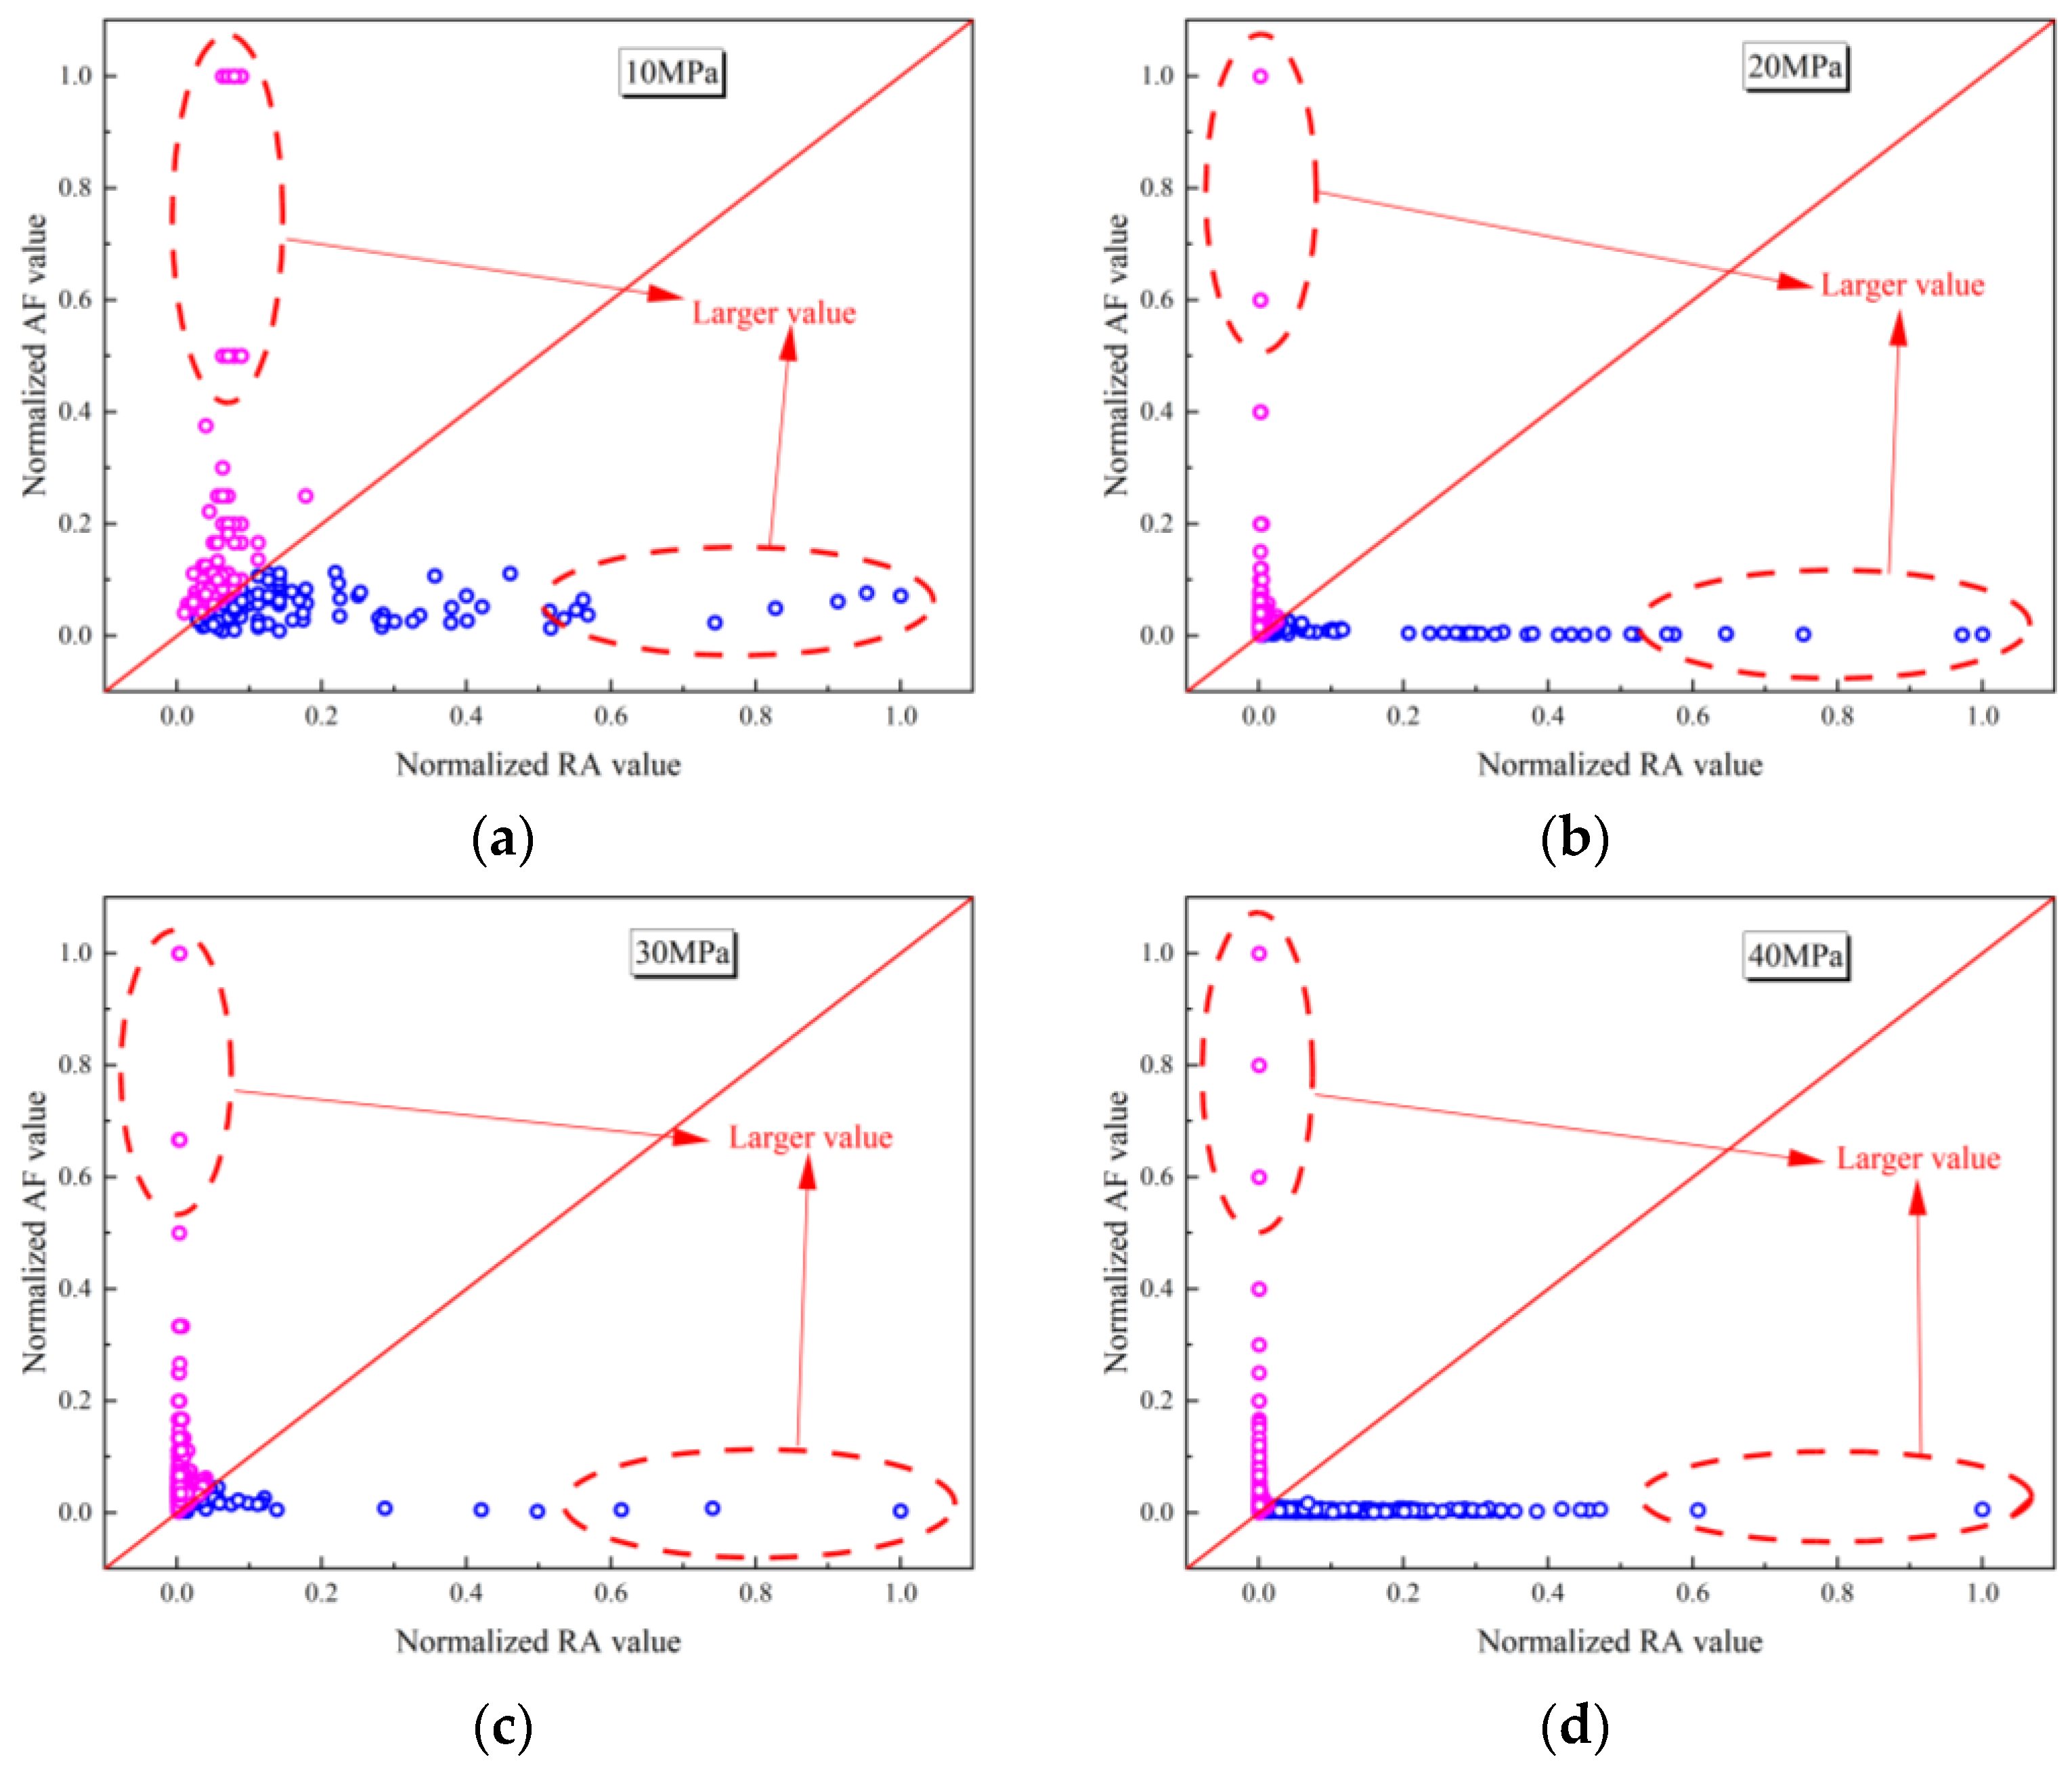
4.5. RAAF Distribution Analysis in Cyclic Loading–Unloading Tests
5. Conclusions
Author Contributions
Funding
Data Availability Statement
Conflicts of Interest
References
- Al-Shafi, M.; Massarweh, O.; Abushaikha, A.S.; Bicer, Y. A review on underground gas storage systems: Natural gas, hydrogen and carbon sequestration. Energy Rep. 2023, 9, 6251–6266. [Google Scholar]
- Liu, H.; Yang, C.; Liu, J.; Hou, Z.; Xie, Y.; Shi, X. An overview of underground energy storage in porous media and development in China. Gas Sci. Eng. 2023, 117, 205079. [Google Scholar]
- Zhou, Y.; Sheng, Q.; Li, N.; Fu, X. The relationship between dynamic strength and strain rate and damage to rock materials subjected to dynamic cyclic loading. Geomech. Geophys. Geo-Energy Geo-Resour. 2021, 7, 88. [Google Scholar]
- Hu, M.; Xu, W.; Wang, H.; Ning, Y.; Wang, R.; Lyu, C.; Zhang, T. Deformation characteristics of muddy sandstones during cyclic loading and unloading with different stress lower limits under pore pressure. Int. J. Fatigue 2023, 172, 107606. [Google Scholar]
- Wang, M.; Li, J.; Tan, H.; Wang, J.; Shi, Z.; Li, K. Study on fatigue characteristics and thermal damage mechanism of red sandstone under high temperature-cyclic load coupling. Int. J. Fatigue 2023, 168, 107405. [Google Scholar]
- Wang, S.; Xu, W.; Sun, M.; Wang, W. Experimental investigation of the mechanical properties of fine-grained sandstone in the triaxial cyclic loading test. Environ. Earth Sci. 2019, 78, 416. [Google Scholar]
- Zhou, J.; Deng, G.; Tian, S.; Xian, X.; Yang, K.; Zhang, C.; Dong, Z. Experimental study on the permeability variation of sandstone at cyclic stress: Implication for underground gas storage. J. Energy Storage 2023, 60, 106677. [Google Scholar]
- Shirani Faradonbeh, R.; Taheri, A.; Karakus, M. Post-peak behaviour of rocks under cyclic loading using a double-criteria damage-controlled test method. Bull. Eng. Geol. Environ. 2021, 80, 1713–1727. [Google Scholar]
- Shirani Faradonbeh, R.; Taheri, A.; Karakus, M. Failure Behaviour of a Sandstone Subjected to the Systematic Cyclic Loading: Insights from the Double-Criteria Damage-Controlled Test Method. Rock Mech. Rock Eng. 2021, 54, 5555–5575. [Google Scholar]
- You, W.; Dai, F.; Liu, Y.; Yan, Z. Effect of confining pressure and strain rate on mechanical behaviors and failure characteristics of sandstone containing a pre-existing flaw. Rock Mech. Rock Eng. 2022, 55, 2091–2109. [Google Scholar]
- Yang, D.; Hu, J.; Ding, X. Analysis of energy dissipation characteristics in granite under high confining pressure cyclic load. Alex. Eng. J. 2020, 59, 3587–3597. [Google Scholar]
- Kang, P.; Jiaqi, Z.; Quanle, Z.; Junhui, M. Fatigue deformation characteristics and damage model of sandstones subjected to cyclic loading: Implications for fatigue life prediction. Int. J. Geomech. 2022, 22, 04021261. [Google Scholar]
- Geranmayeh Vaneghi, R.; Thoeni, K.; Dyskin, A.V.; Sharifzadeh, M.; Sarmadivaleh, M. Strength and damage response of sandstone and granodiorite under different loading conditions of multistage uniaxial cyclic compression. Int. J. Geomech. 2020, 20, 04020159. [Google Scholar]
- Munoz, H.; Taheri, A. Postpeak Deformability Parameters of Localized and Nonlocalized Damage Zones of Rocks under Cyclic Loading. Geotech. Test. J. 2019, 42, 1663–1684. [Google Scholar]
- Zhu, X.; Li, Y.; Wang, C.; Sun, X.; Liu, Z. Deformation failure characteristics and loading rate effect of sandstone under uniaxial cyclic loading and unloading. Geotech. Geol. Eng. 2019, 37, 1147–1154. [Google Scholar]
- Liu, Y.; Dai, F. A review of experimental and theoretical research on the deformation and failure behavior of rocks subjected to cyclic loading. J. Rock Mech. Geotech. Eng. 2021, 13, 1203–1230. [Google Scholar]
- Peng, K.; Wang, Y.; Zou, Q.; Cheng, Y.; Song, X. Experimental study of energy dissipation characteristics and crack coalescence modes of cracked sandstone under different cyclic loading paths. Bull. Eng. Geol. Environ. 2021, 80, 5881–5895. [Google Scholar]
- Šancer, J.; Štrejbar, M.; Maleňáková, A. Effects of cyclic loading on the rheological properties of sandstones. Cent. Eur. J. Geosci. 2011, 3, 207–214. [Google Scholar]
- Peng, K.; Zhou, J.; Zou, Q.; Zhang, Y.; Tan, G. Deformation characteristics and failure modes of sandstones under discontinuous multi-level cyclic loads. Powder Technol. 2020, 373, 599–613. [Google Scholar]
- Yu, X.; Tan, Y.; Song, W.; Kemeny, J.; Qi, S.; Zheng, B.; Guo, S.-f. Damage evolution of rock-encased-backfill structure under stepwise cyclic triaxial loading. J. Rock Mech. Geotech. Eng. 2024, 16, 597–615. [Google Scholar]
- Deng, G.; Zhou, J.; Tian, S.; Xian, X.; Zhou, L.; Zhang, C.; Li, S.; Tan, Y. Pore structure changes and its stress-sensitive behavior in sandstone under cyclic stress: Implication for underground gas storage. Gas Sci. Eng. 2023, 119, 205130. [Google Scholar]
- Duan, X.-l.; Wang, W.; Liu, S.-f.; Cao, Y.; Zheng, Z.; Zhu, Q. Experimental investigation on mechanical behavior, energy evolution and gas permeability of anisotropic phyllite subjected to triaxial compression and cyclic loading. Geomech. Energy Environ. 2023, 35, 100483. [Google Scholar]
- Hu, K.; Fu, H.; Li, J.; Deng, H. Constitutive model for simulating the mechanical behaviour of rock under triaxial cyclic loading. Comput. Geotech. 2023, 159, 105420. [Google Scholar]
- Wang, J.; Li, J.; Shi, Z.Y.; Chen, J.; Lin, H. Fatigue characteristics and fracture behaviour of sandstone under discontinuous multilevel constant-amplitude fatigue disturbance. Eng. Fract. Mech. 2022, 274, 108773. [Google Scholar]
- Zhang, T.; Xu, W.; Wang, R.; Yan, L.; He, M. Deformation characteristics of cement mortar under triaxial cyclic loading: An experimental investigation. Int. J. Fatigue 2021, 150, 106305. [Google Scholar]
- Shen, R.; Chen, T.; Li, T.; Li, H.; Fan, W.; Hou, Z.; Zhang, X. Study on the effect of the lower limit of cyclic stress on the mechanical properties and acoustic emission of sandstone under cyclic loading and unloading. Theor. Appl. Fract. Mech. 2020, 108, 102661. [Google Scholar]
- Wang, Y.; Gao, S.H.; Li, C.H.; Han, J.Q. Energy dissipation and damage evolution for dynamic fracture of marble subjected to freeze-thaw and multiple level compressive fatigue loading. Int. J. Fatigue 2021, 142, 105927. [Google Scholar]
- Du, K.; Li, X.; Tao, M.; Wang, S. Experimental study on acoustic emission (AE) characteristics and crack classification during rock fracture in several basic lab tests. Int. J. Rock Mech. Min. Sci. 2020, 133, 104411. [Google Scholar]
- Gao, Y.; Lan, D.; Yang, S.; Hou, P.; Wang, Y.; Ding, F. The Acoustic Emission Behavior and Its Fractal Characteristics of the Sandstone Under the Disturbance Stress Paths. Rock Mech. Rock Eng. 2023, 56, 5487–5511. [Google Scholar]
- Zhang, H.; Guo, J.; Sun, F.; Shi, X.; Zhu, Z. Experimental Study on Acoustic Emission Characteristics in the Fracture Process of Granite Under Dry and Saturated State. Geotech. Geol. Eng. 2022, 40, 5213–5231. [Google Scholar]
- Li, D.; Wang, E.; Kong, X.; Ali, M.; Wang, D. Mechanical behaviors and acoustic emission fractal characteristics of coal specimens with a pre-existing flaw of various inclinations under uniaxial compression. Int. J. Rock Mech. Min. Sci. 2019, 116, 38–51. [Google Scholar]
- Li, H.; Ma, H.; Yang, C.; Zhao, K.; Hu, Z.; Daemen, J. Acoustic emission characteristics of rock salt under multi-stage cyclic loading. Int. J. Fatigue 2023, 176, 107911. [Google Scholar]
- Tang, C.A.; Chen, Z.H.; Xu, X.H.; Li, C. A Theoretical Model for Kaiser Effect in Rock. Pure Appl. Geophys. 1997, 150, 203–215. [Google Scholar]
- Zhao, K.; Ma, H.; Yang, C.; Daemen, J.J.K. The role of prior creep duration on the acoustic emission characteristics of rock salt under cyclic loading. Int. J. Rock Mech. Min. Sci. 2022, 157, 105166. [Google Scholar]
- Li, Z.; Suo, J.; Fan, J.; Fourmeau, M.; Jiang, D.; Nelias, D. Damage evolution of rock salt under multilevel amplitude creep–fatigue loading with acoustic emission monitoring. Int. J. Rock Mech. Min. Sci. 2023, 164, 105346. [Google Scholar]
- Zhang, L.; Cong, Y.; Meng, F.; Wang, Z.; Zhang, P.; Gao, S. Energy evolution analysis and failure criteria for rock under different stress paths. Acta Geotech. 2021, 16, 569–580. [Google Scholar]
- Li, T.; Pei, X.; Wang, D.; Huang, R.; Tang, H. Nonlinear behavior and damage model for fractured rock under cyclic loading based on energy dissipation principle. Eng. Fract. Mech. 2019, 206, 330–341. [Google Scholar]
- Gao, Y.; Feng, X.-T. Study on damage evolution of intact and jointed marble subjected to cyclic true triaxial loading. Eng. Fract. Mech. 2019, 215, 224–234. [Google Scholar]
- Chen, Z.; He, C.; Ma, G.; Xu, G.; Ma, C. Energy Damage Evolution Mechanism of Rock and Its Application to Brittleness Evaluation. Rock Mech. Rock Eng. 2019, 52, 1265–1274. [Google Scholar]
- Peng, R.; Xie, H.; Ju, Y.; Zhou, H. Influence of elastic energy storage in testing machines on the testing of mechanical properties of rocks. Mech. Eng. 2005, 51–55. [Google Scholar]
- Chen, Z.; Tang, C.; Xu, X.; Li, C. Theoretical and experimental study of the Kaiser effect in rock acoustic emission. Chin. J. Nonferrous Met. 1997, 12–15. [Google Scholar]
- Liu, M.; Lu, J.; Ming, P.; Song, J. AE-based damage identification of concrete structures under monotonic and fatigue loading. Constr. Build. Mater. 2023, 377, 131112. [Google Scholar]
- Shi, Z.; Li, J.; Wang, J. Effect of creep load on fatigue behavior and acoustic emission characteristics of sandstone containing pre-existing crack during fatigue loading. Theor. Appl. Fract. Mech. 2022, 119, 103296. [Google Scholar]
- Li, S.; Yang, D.; Huang, Z.; Gu, Q.; Zhao, K. Acoustic emission characteristics and failure mode analysis of rock failure under complex stress state. Theor. Appl. Fract. Mech. 2022, 122, 103666. [Google Scholar]
- Dong, L.; Zhang, Y.; Bi, S.; Ma, J.; Yan, Y.; Cao, H. Uncertainty investigation for the classification of rock micro-fracture types using acoustic emission parameters. Int. J. Rock Mech. Min. Sci. 2023, 162, 105292. [Google Scholar]
- Zhao, K.; Yang, D.; Gong, C.; Zhuo, Y.; Wang, X.; Zhong, W. Evaluation of internal microcrack evolution in red sandstone based on time–frequency domain characteristics of acoustic emission signals. Constr. Build. Mater. 2020, 260, 120435. [Google Scholar]

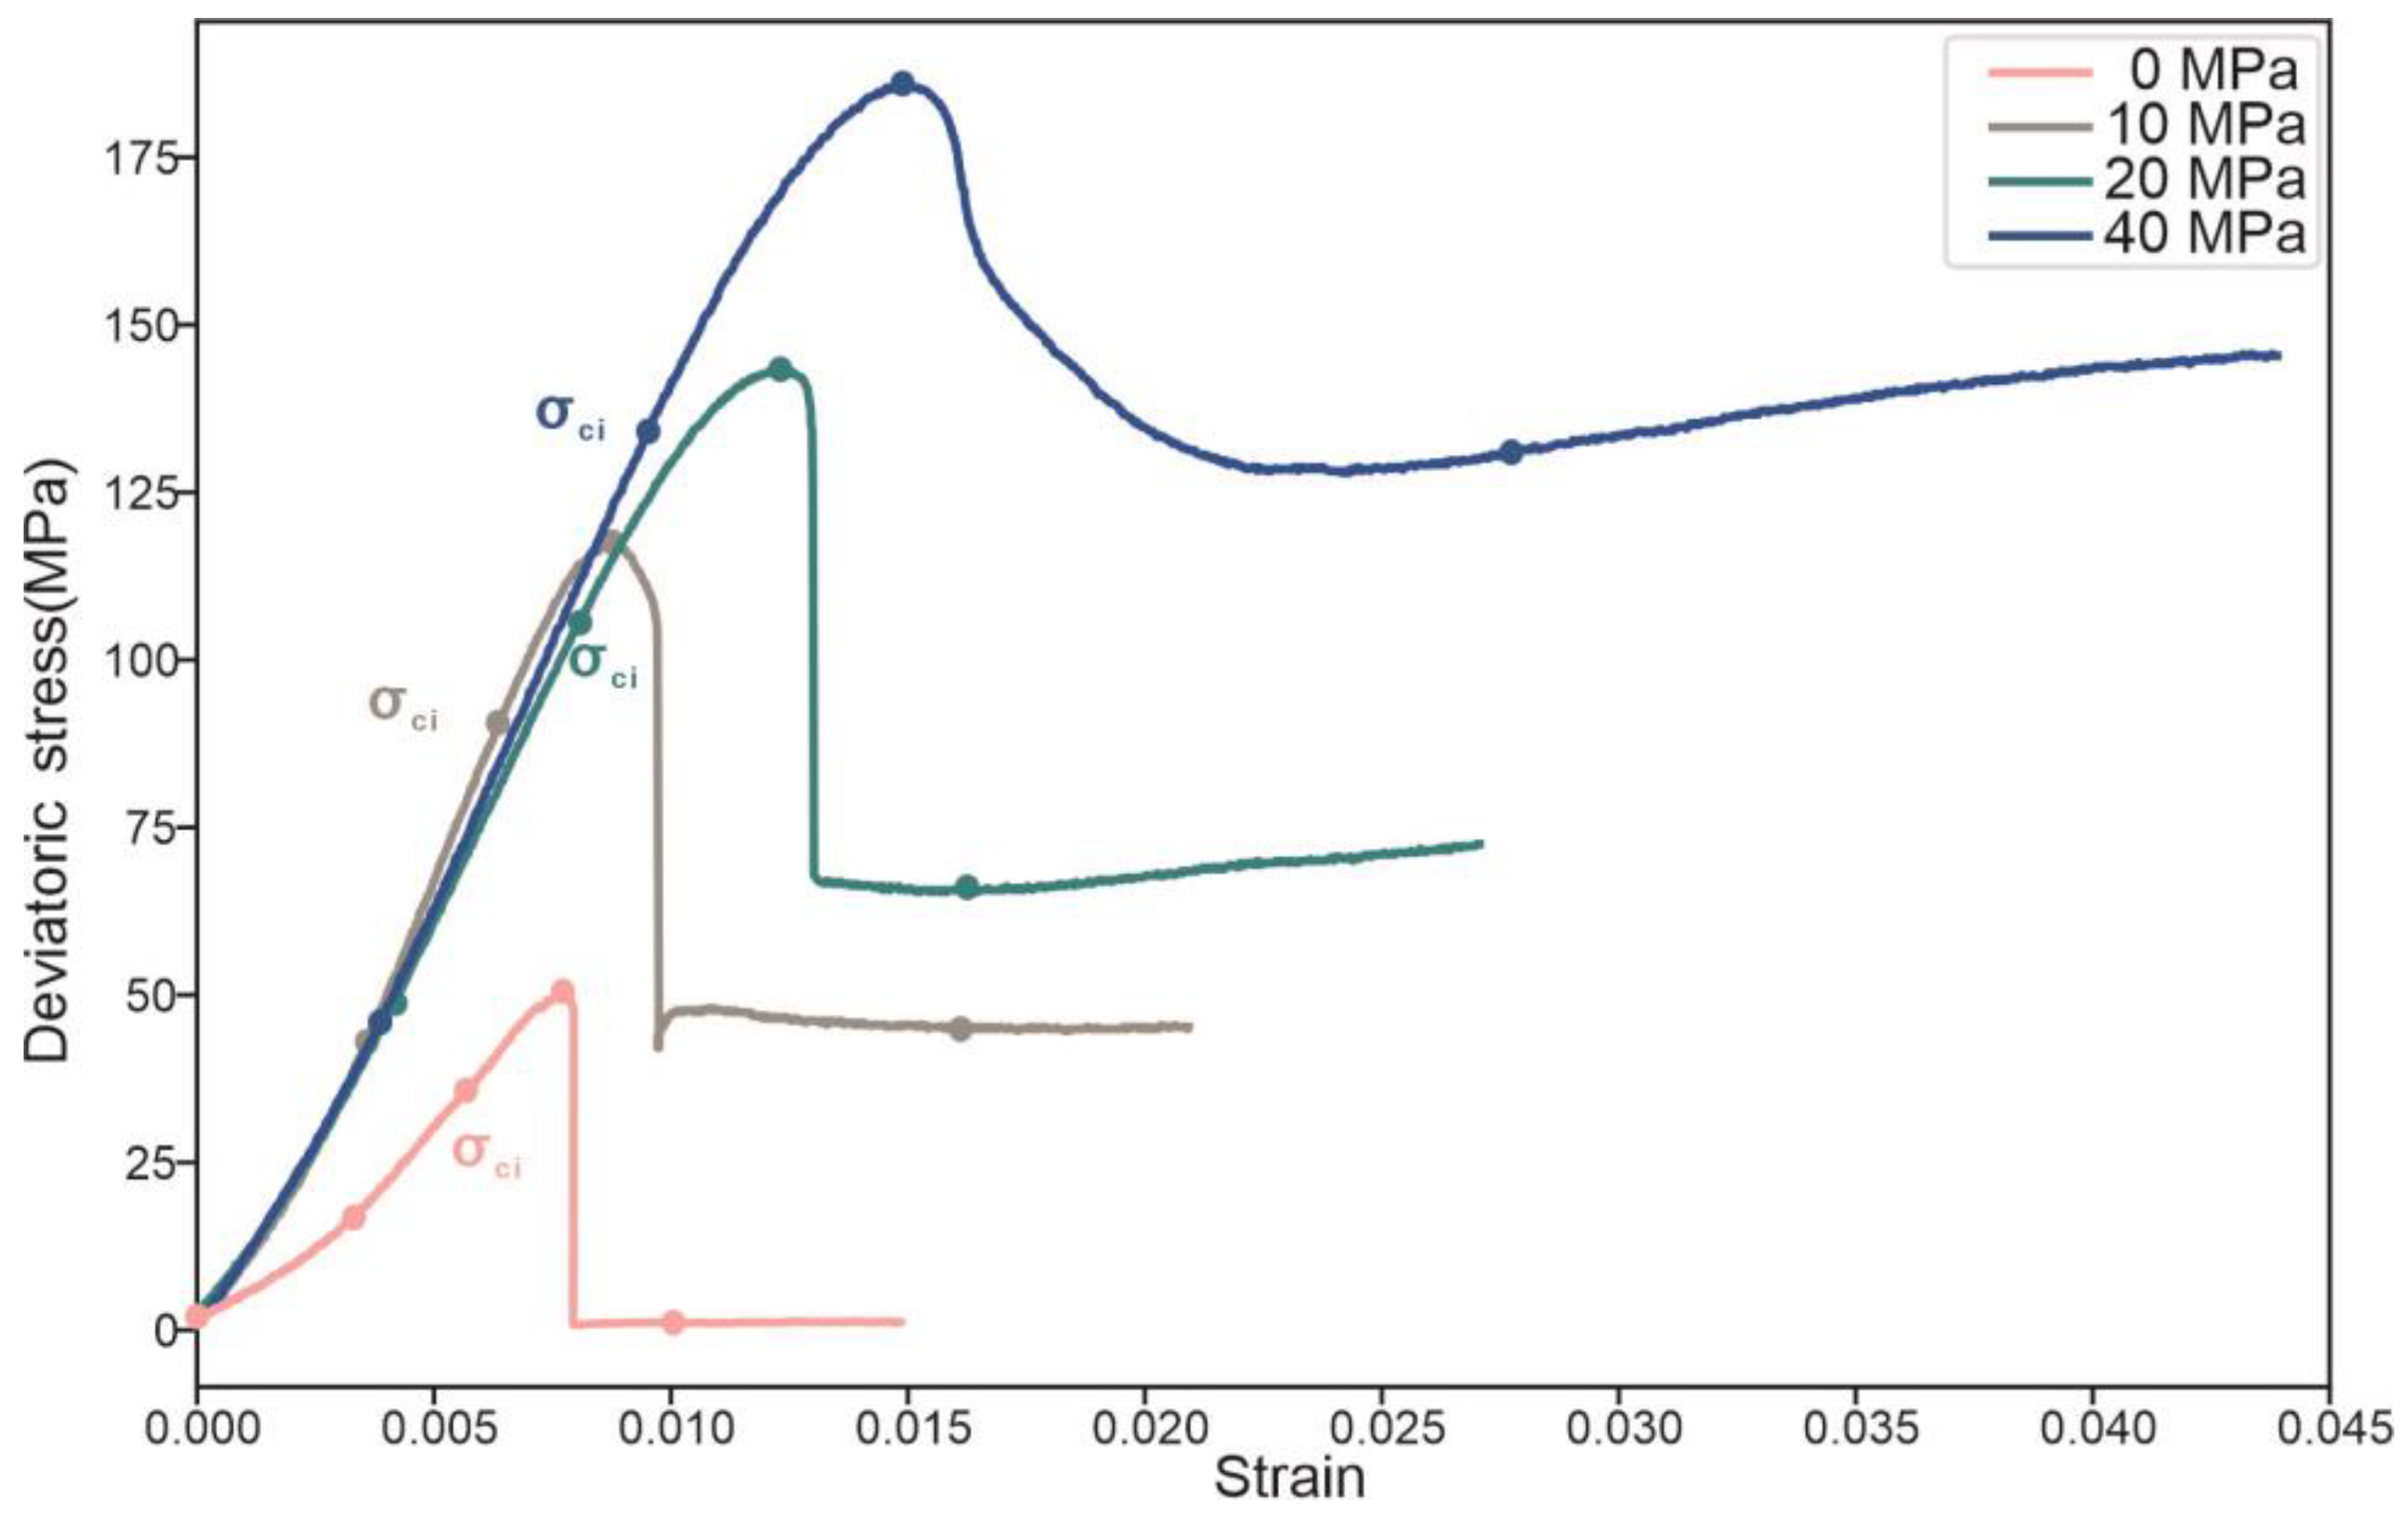
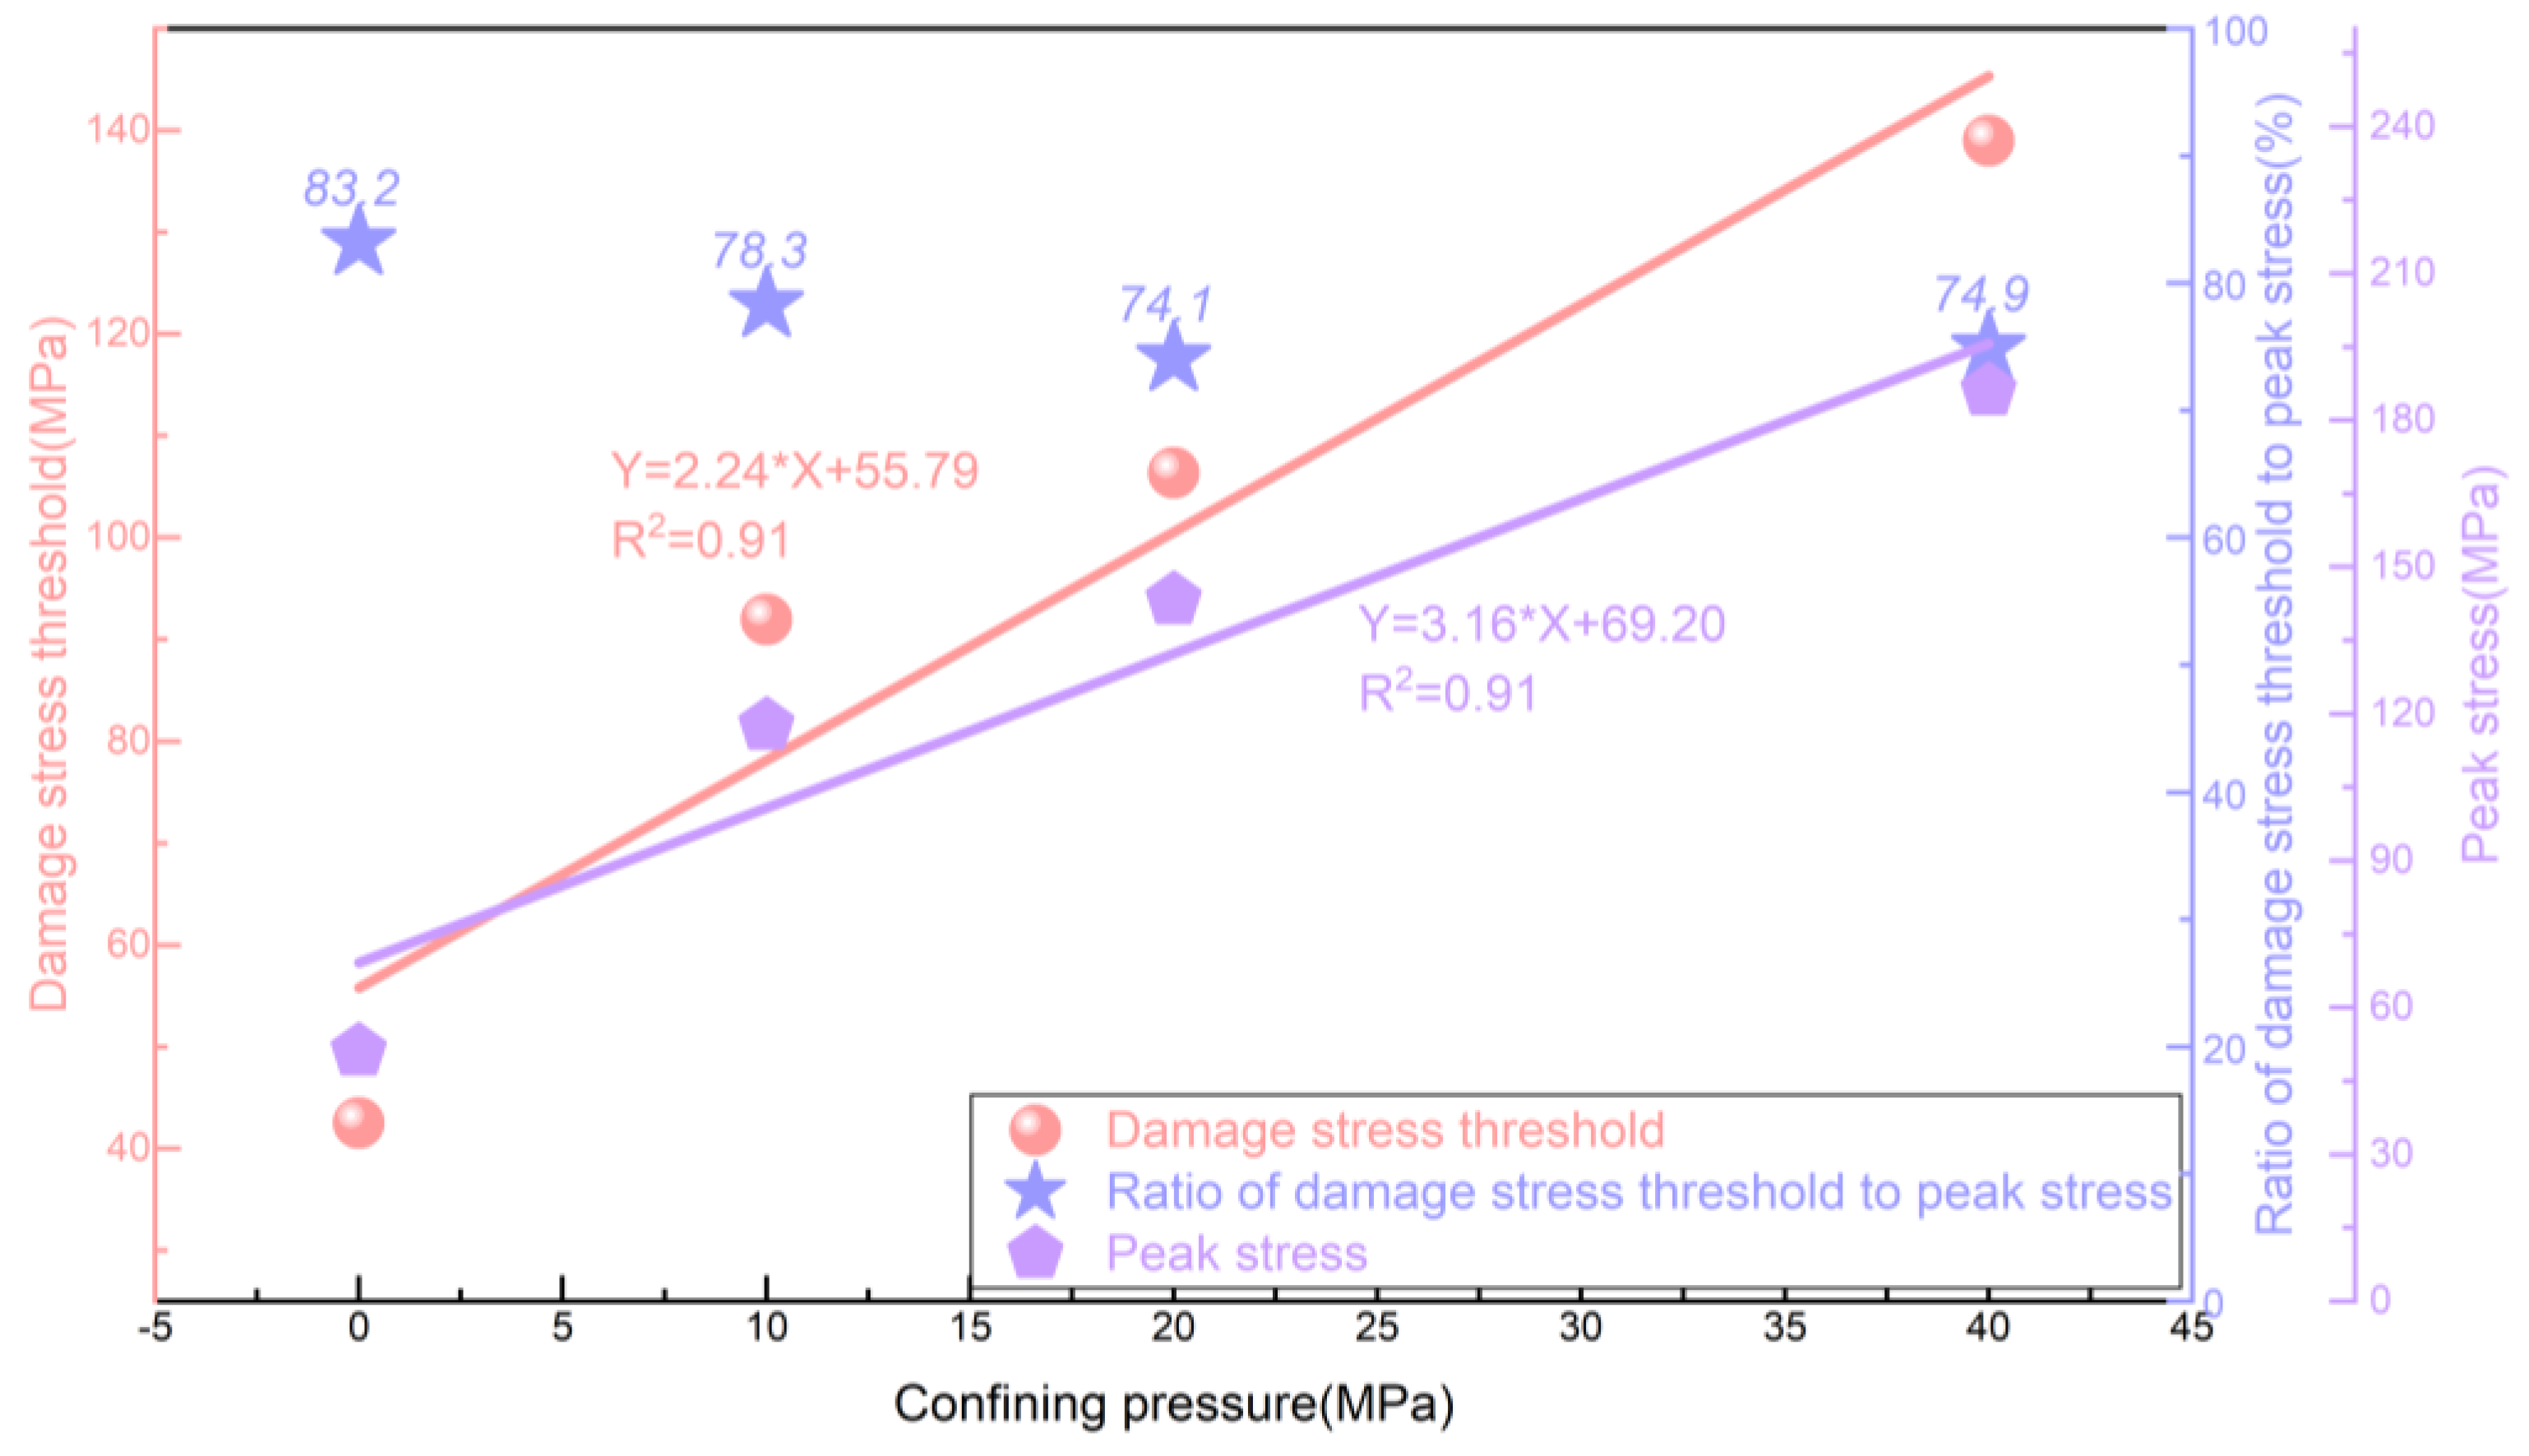


| Specimen NO. | Confining Pressure (MPa) | Peak Stress (MPa) | Damage Stress Threshold (MPa) | Elastic Modulus (MPa) | Poisson’s Ratio |
|---|---|---|---|---|---|
| S-U-2 | 0 | 51.12 | 42.53499 | 7894 | 0.16 |
| S-1 | 10 | 117.66 | 91.96987 | 17,302 | 0.15 |
| S-2 | 20 | 143.30 | 106.37346 | 14,843 | 0.17 |
| S-4 | 40 | 186.00 | 138.99171 | 15,976 | 0.15 |
| Stress Level | 10 MPa | 20 MPa | 30 MPa | 40 MPa | ||||
|---|---|---|---|---|---|---|---|---|
| 0.6σc | 0.0440 | 0.0440 | 0.0742 | 0.0742 | 0.0703 | 0.07034 | 0.0488 | 0.0488 |
| 0.7σc | 0.0628 | 0.1068 | 0.1160 | 0.1902 | 0.1073 | 0.1776 | 0.0821 | 0.1310 |
| 0.8σc | 0.1747 | 0.2815 | 0.1613 | 0.3515 | 0.1631 | 0.3407 | 0.1418 | 0.2728 |
| 0.9σc | 0.2834 | 0.5649 | 0.2504 | 0.6019 | 0.2514 | 0.5921 | 0.2604 | 0.5332 |
| 1.0σc | 0.4351 | 1 | 0.3981 | 1 | 0.4079 | 1 | 0.4668 | 1 |
| Stress Level | 10 MPa | 20 MPa | 30 MPa | 40 MPa | ||||
|---|---|---|---|---|---|---|---|---|
| 0.6σc | 0.00343 | 0.00343 | 0.04997 | 0.04997 | 0.02491 | 0.02491 | 0.03335 | 0.03335 |
| 0.7σc | 0.00013 | 0.00356 | 0.0057 | 0.05567 | 0.00632 | 0.03123 | 0.00435 | 0.0377 |
| 0.8σc | 0.00239 | 0.00595 | 0.00394 | 0.05961 | 0.00707 | 0.03831 | 0.00324 | 0.04094 |
| 0.9σc | 0.00168 | 0.00762 | 0.00629 | 0.0659 | 0.00835 | 0.04666 | 0.01404 | 0.05498 |
| 1.0σc | 0.01504 | 0.02266 | 0.01794 | 0.08384 | 0.01696 | 0.06362 | 0.94502 | 1 |
| 1.14/1.17σc | 0.97734 | 1 | 0.91616 | 1 | 0.93637 | 1 | / | / |
Disclaimer/Publisher’s Note: The statements, opinions and data contained in all publications are solely those of the individual author(s) and contributor(s) and not of MDPI and/or the editor(s). MDPI and/or the editor(s) disclaim responsibility for any injury to people or property resulting from any ideas, methods, instructions or products referred to in the content. |
© 2024 by the authors. Licensee MDPI, Basel, Switzerland. This article is an open access article distributed under the terms and conditions of the Creative Commons Attribution (CC BY) license (https://creativecommons.org/licenses/by/4.0/).
Share and Cite
Xia, D.; Liu, H.; Liu, J.; Guo, Y.; Liu, M.; Qiu, X.; Li, H.; Tan, H.; Lu, J. Study on the Evolution of Mechanical Properties and Acoustic Emission of Medium-Permeability Sandstone under Multi-Level Cyclic Loading Stress Paths. Processes 2024, 12, 1773. https://doi.org/10.3390/pr12081773
Xia D, Liu H, Liu J, Guo Y, Liu M, Qiu X, Li H, Tan H, Lu J. Study on the Evolution of Mechanical Properties and Acoustic Emission of Medium-Permeability Sandstone under Multi-Level Cyclic Loading Stress Paths. Processes. 2024; 12(8):1773. https://doi.org/10.3390/pr12081773
Chicago/Turabian StyleXia, Debin, Hejuan Liu, Jianjun Liu, Yintong Guo, Mancang Liu, Xiaosong Qiu, Haibo Li, Hongying Tan, and Jun Lu. 2024. "Study on the Evolution of Mechanical Properties and Acoustic Emission of Medium-Permeability Sandstone under Multi-Level Cyclic Loading Stress Paths" Processes 12, no. 8: 1773. https://doi.org/10.3390/pr12081773