Article

Numerical Investigation of Inlet Height and Width Variations on Separation Performance and Pressure Drop of Multi-Inlet Cyclone Separators

by
Saikat Barua
1,
Mohd Faizal Mohideen Batcha
1,
Akmal Nizam Mohammed
1,
Yazid Saif
2,*,
Sami Al-Alimi
3,
Mohammed A. M. Al-fakih
4 and
Wenbin Zhou
5,6,*
1
Department of Mechanical and Manufacturing Engineering, Universiti Tun Hussein Onn Malaysia (UTHM), Parit Raja 86400, Johor, Malaysia
2
Sustainable Polymer Engineering, Advanced Manufacturing and Materials Center (SPEN-AMMC), Faculty of Mechanical and Manufacturing, Engineering Universiti Tun Hussein Onn Malaysia (UTHM), Parit Raja 86400, Johor, Malaysia
3
Sustainable Manufacturing and Recycling Technology (SMART) Research Cluster, Advanced Manufacturing and Materials Centre (AMMC), Universiti Tun Hussein Onn Malaysia (UTHM), Parit Raja 86400, Johor, Malaysia
4
Department of Mechanical Engineering, Universiti Teknologi PETRONAS, Seri Iskandar 32610, Perak, Malaysia
5
School of Science and Engineering, University of Dundee, Dundee DD1 4HN, UK
6
Department of Mechanical Engineering, Imperial College London, London SW7 2AZ, UK
*
Authors to whom correspondence should be addressed.
Processes 2024, 12(9), 1820; https://doi.org/10.3390/pr12091820
Submission received: 21 July 2024 / Revised: 23 August 2024 / Accepted: 26 August 2024 / Published: 27 August 2024

Abstract

:
Multi-inlet cyclone separators can play a vital role in industrial processes by enhancing particle separation efficiency and minimizing energy consumption. This numerical study investigates multi-inlet cyclone separators to enhance their performance using a constant flow rate with a varying inlet height and width. By systematically varying the inlet height and width, three-inlet and four-inlet cyclone separators are developed and evaluated, termed 3 inlet-a, 4 inlet-a, 3 inlet-b, and 4 inlet-b. The findings reveal that increasing the number of inlets without changing the total inlet area does not improve the separation performance. However, strategic modifications to the inlet height and width significantly enhance the separation efficiency. Notably, the 3 inlet-a and 4 inlet-a designs achieve higher separation efficiencies at a 1.22 m 3 /s flow rate without increasing the pressure drop. Meanwhile, the 3 inlet-b and 4 inlet-b models demonstrate superior performances, with a higher separation efficiency and a pressure drop only marginally higher than the two-inlet design. This study provides valuable insights into the impact of inlet variations on cyclone separator performance, guiding future efforts to enhance the separation efficiency in multi-inlet designs.

1. Introduction

Cyclone separators are widely used for particle separation in gas streams by leveraging centrifugal force [1]. The earliest cyclones were used mainly for capturing dust from grain- and wood-processing mills. Over the years, the demand for cyclone separators has surged in industries requiring gas stream particle removal. Cyclone separators have become popular for their efficiency, adaptability, and cost effectiveness in many industries [2].
The principle of dust collection does not need any moving parts in the cyclone separator, minimizing maintenance needs. Gas (air) and particles enter tangentially at the top through inlets. The centrifugal force combined with the turbulent airflow within the cyclone separator creates a strong rotational motion that pushes the particles toward the cyclone walls. This enhanced interaction between the particles and the cyclone walls increases the likelihood of particle removal and effectively separates them from the air stream [3].
The inlet dimension of a cyclone separator is crucial, because it significantly impacts the device’s efficiency and performance. Proper inlet sizing controls the velocity of the gas and particle mixture entering the cyclone, which influences the centrifugal forces for effective separation. Brar et al. [4] examined the performances of multi-inlet cyclone separators with three inlet cross-section shapes (Standard Inlet (RA), Half-Height Inlet (RH), Half-Width Inlet (RW)), and their impacts on pressure losses and collection efficiencies were analyzed using an advanced closure Large Eddy Simulation (LES). Significant findings indicated that the RH variant had the lowest pressure losses and collection efficiencies, while the RW variant had the highest. Elsayed and Lacor [5] investigated the effect of cyclone inlet dimensions on performance and flow patterns using the Reynolds stress turbulence model (RSM) for five cyclone separators. Their findings revealed that increasing the inlet dimensions reduced the maximum tangential velocity and pressure drop [5]. Dianyu et al. [6] found that reducing the inlet width increased the separation efficiency.
Cyclone separators are designed to operate optimally within a specific range of inlet velocities, ensuring effective separation without excessive energy costs or premature equipment degradation. Fetuga et al. [7] found that a 20% increase in inlet velocity significantly affected static pressure and separation efficiency, highlighting the importance of velocity in cyclone performance. Increasing the air volumetric flow rate improved the separation efficiency [8]. However, increasing the velocity or flow rate also increased the pressure drop in the cyclone [9,10]. The relationship between pressure drop and separation capability involves a dynamic compromise for adjustment without sacrificing efficiency.
Movafaghian et al. [11] investigated the advantages of using two intake cyclones for improved hydrodynamics compared to a single cyclone. Their findings indicated that a single inlet cyclone with dual inlets outperformed the conventional single cyclone. The study by Wang et al. [12] also revealed that double-inlet cyclones had a higher separation efficiency compared to single inlets at the same flow rate. The results from the study by Safikhani et al. [13] indicated that a three-inlet cyclone achieved a higher collection efficiency, lower pressure drop, and reduced turbulence, making it the recommended design for an improved cyclone performance.
The presence of short-circuit flow significantly influences the separation efficiency in cyclone separators. Short-circuit flow refers to a flow mechanism in which particles bypass the separation process and exit directly through the vortex finder, reducing the overall separation efficiency [14]. This leads to increased costs and unnecessary energy loss, ultimately diminishing the cyclone separator efficiency [15]. Dong et al. [16] used computational fluid dynamics to simulate a cyclone, finding that the proportion of short-circuiting particles, especially for small particles, increased with higher intake velocities. The dust ceiling phenomenon, documented by Huang et al. [17], shows high solid concentrations in both the dust ceiling and cone regions, which can be attributed to particle interaction forces. Ostermeier et al.’s study [18] using the computational fluid dynamics DEM (Discrete Element Method) model reproduced the dust ceiling phenomenon, where solid concentrations could reach 28%, with the upward gas flow preventing downward flow due to particle loading.
Han et al. [19] used a 3D-printed guide vane cyclone separator, finding that the tangential velocity, inflow velocity, and particle radius influenced the separation efficiency. The optimal structure No. 1 (number of vanes—nine, vane thickness—4.51 mm, vane arc length—55 mm, and vane height—54.05 mm) showed an improved efficiency. Yao et al. [20] investigated dense medium cyclone efficiency with a tapered inlet with varying duct lengths. Longer ducts imply a more gradual taper, resulting in a reduced pressure drop. This initially increased the overall separation efficiency and minimized the energy loss, thereby impacting the tangential velocity and particle movement.
Pressure drop is another crucial factor in determining how well a cyclone separator performs [21]. The vortex finder has a great influence on the separation efficiency and pressure drop. With an increase in the vortex finder diameter, the pressure drop of the cyclone separator is significantly reduced [12,22]. In addition to the contraction losses at the inlet of the vortex finder tube, the formation of eddies and the dissipation of the gas’s dynamic energy at the outlet are significant contributors to the overall pressure drop in the cyclone separator [23].
In this study, multi-inlet cyclone separators were studied with constant flow rates using the commercial CFD with version (Workbench 2023 R1) software ANSYS fluent for conducting this numerical analysis. This research combined previous studies on the best multi-inlet and proper inlet dimensions for optimal performance. Two types of analyses were conducted: one by reducing the velocity and another by adjusting the inlet area. At first, the dual-inlet (2i) cyclone separator was modified to include three and four inlets (3i and 4i), while maintaining the same flow rate by reducing the inlet velocity to compensate for the increased total inlet area. For the cyclone separators 3a, 4a, 3b, and 4b, the inlet area was adjusted in terms of the inlet height and width to maintain the flow rate. The evaluation criteria for these cyclone separators were based on the separation efficiency (or particle collection efficiency) and pressure drop.

2. Methodology

2.1. Turbulence Model

The utilization of the Re-Normalization Group (RNG) k-ε model in the context of cyclone separators represents a significant advancement in computational fluid dynamics, particularly in the simulation of the complex turbulent flows characteristic of such systems. By employing equations for turbulence kinetic energy (k) and its dissipation (ε), this model enhances the comprehension and prediction of flow velocities, pressure fluctuations, and the efficacy of particle separation. This heightened predictive capacity is vital for optimizing cyclone separator designs across various industrial applications. Incorporating detailed equations governing the production and dissipation of turbulence kinetic energy allows the model to accurately capture the intricate flow dynamics unique to cyclone separators, thereby providing a robust tool for design and performance assessments.
The k-epsilon turbulence model is based on two transport equations, one for the turbulent kinetic energy (k) and the other for the turbulent dissipation rate (ε) [24].
The Transport Equation for k:
t ( k ) + x i ρ k u i = x j μ + μ t σ k k x j + P k ρ ε
where:
  • ρ is the fluid density,
  • ui is the velocity component in the i direction,
  • μ is the molecular viscosity,
  • μt is the turbulent viscosity,
  • σk is the Prandtl number for the turbulent kinetic energy,
  • Pk represents the production of turbulent kinetic energy,
  • ε is the turbulent dissipation rate.
The Transport Equation for epsilon:
t ( ρ ε ) + x i ρ ε u i = x j μ + μ t σ ε ε x j + C ε 1 ε k P k C ε 2 ρ ε 2 k
The RNG model introduces additional terms into the transport equations for k and ε to improve their accuracy. These additional terms are derived using concepts from renormalization group theory.
The RNG-Modified Transport Equations:
t ( ρ k ) + x i ρ k u i = x j μ + μ t σ k k x j + P k ρ ε + x j μ t σ k β x j
t ( ρ ε ) + x i ρ ε u i = x j μ + μ t σ ε ε x j + C ε 1 ε k P k C ε 2 ρ ε 2 k + x j μ t σ ε β x j
μ t = C μ ρ k 2 ε
where:
  • β is the additional variable introduced by the RNG model,
  • The terms involving β are responsible for improving the model’s performance, particularly in adverse pressure gradient flows.
The constants σk, σε, C ε 1 , C ε 2 , C μ , and other model coefficients are typically calibrated based on experimental or DNS (Direct Numerical Simulation) data for different flow conditions. However, for the RNG k-ε, the default values are used for σk = 1.39, σε = 1.39, C ε 1 = 1.42, C ε 2 , = 1.68, and C μ = 0.0845 [25,26].

2.2. Grid Independency Test

Table 1 provides the grid independence test and validation results conducted in the authors’ previous study based on Barua et al. [27] using five different grid sizes: 40 mm, 35 mm, 30 mm, 27 mm, and 25 mm for a 2i cyclone separator. Each grid size featured varying element counts, pressure drops, and Y-velocity values. The difference in axial velocity Y (velocity component, acting along the axial direction towards the pressure outlet) between the 40 mm and 30 mm grids was approximately 0.53%, but this difference narrowed to just 0.1% when comparing the 30 mm with the 25 mm grids. Similarly, the pressure drop between the 40 mm and 30 mm grids was around 10.7%, whereas it decreased to 6.7% between the 30 mm and 25 mm grids, as shown in Figure 1.
These results indicated that the 30 mm, 27 mm, and 25 grid sizes offered the same results in terms of the Y-velocity, with minimal differences. However, the pressure drop result was still distinguishable, and a higher difference was captured transitioning between 30 mm and 27 mm than between 27 mm and 25 mm. Thus, 27 mm was chosen, as it had minimal difference from 25 mm, to reduce the computational cost without sacrificing accuracy.

2.3. Validation of Numerical Setup

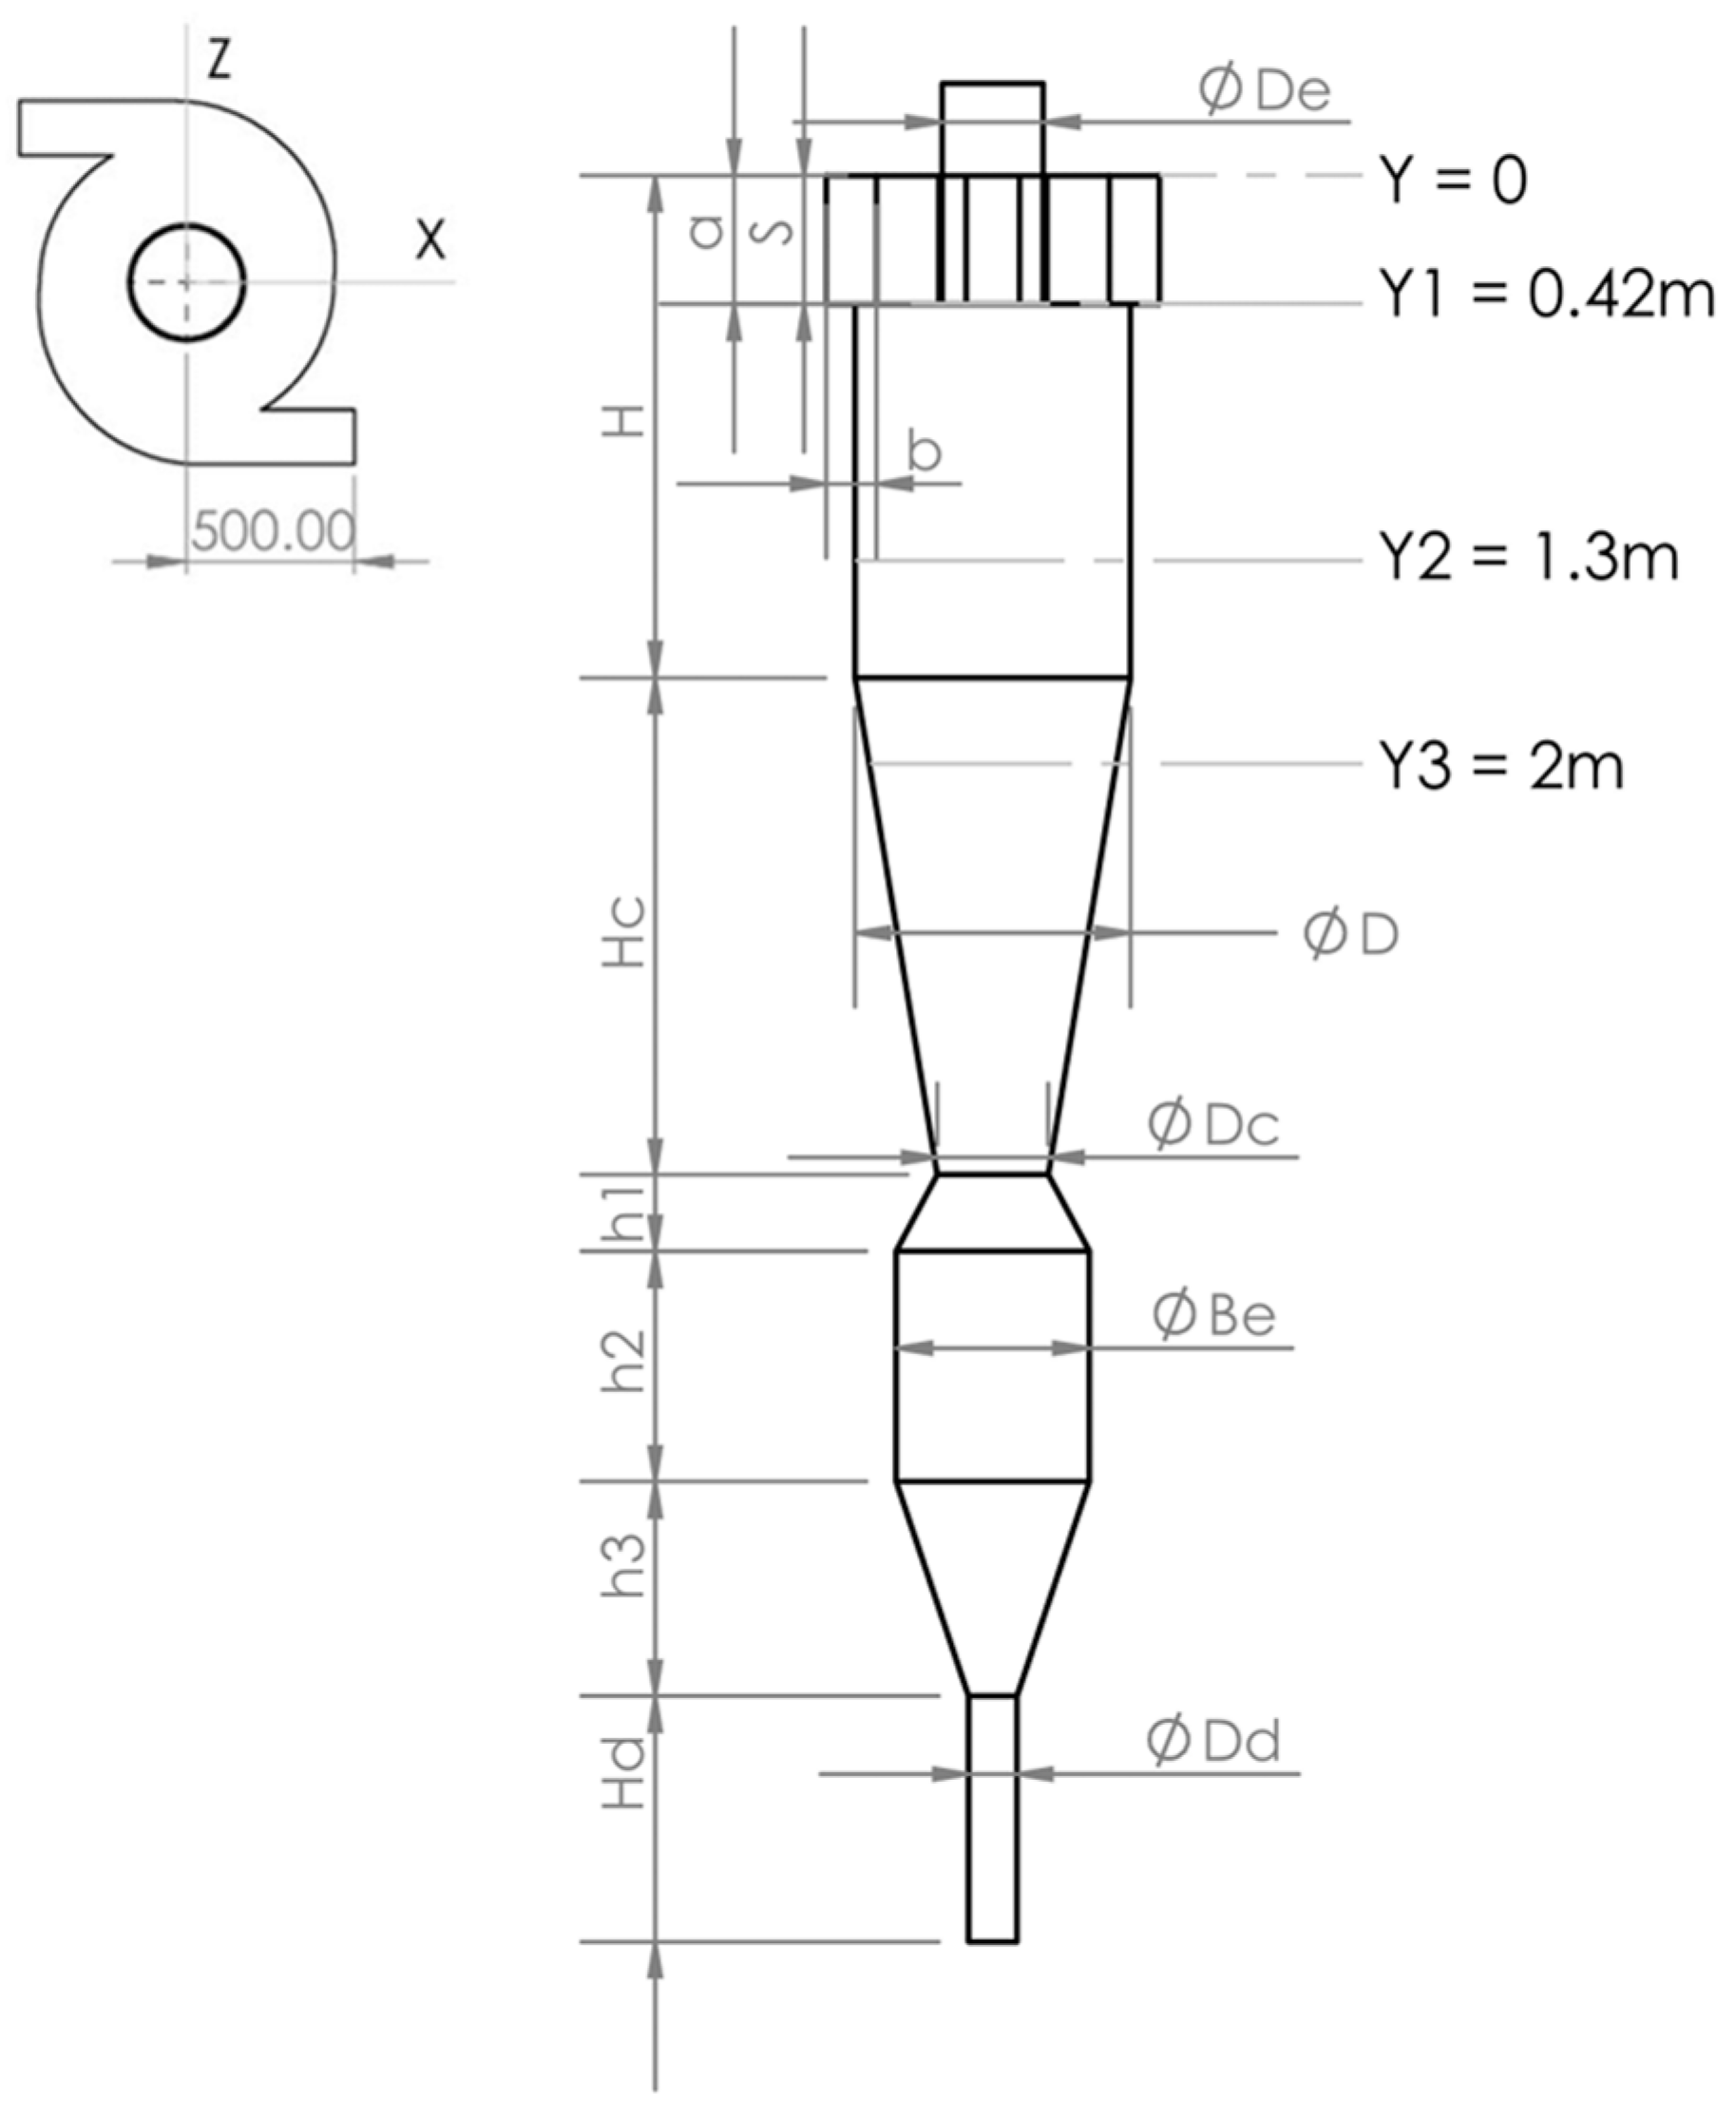
In the author’s previous investigation [27], the turbulence model RNG k-ε was validated against the Reynolds Stress Model (RSM) results from Wang et al. [28], which were previously validated with experimental data for predicting cyclone separator performance. Figure 2 and Table 2 provide the dimensions of the dual-inlet cyclone, including the diameters of both the inlet and outlet vortexes and the Y1, Y2, and Y3 positions. The Y1 position is located just below the vortex finder, Y2 is near the bottom of the barrel, and Y3 is in the cone area.
The particle diameter, representing the size of the particles entering the separator, served as the primary variable. Both models exhibited a consistent trend of increasing their particle collection efficiencies as the particle diameter increased, reflecting the expected behavior of cyclone separators.
The collection efficiency of a cyclone is defined as the mass of the particles collected against the mass of the particles injected into the cyclone. In numerical analysis, the collection efficiency of a cyclone separator is defined as the ratio of particles successfully captured to the total number of particles injected, excluding incomplete particles or those particles that have not yet reached a final state:
Collection   efficiency   ( η c )   % = η t p η i n p η i p × 100 %
Here,
  • η t p = Number of particles trapped
  • η i p = Number of particles incomplete
  • η i n p = Number of particles injected
Table 3 compares the numerical data from Wang et al. [28] using the RSM and current numerical data using the RNG k-ε turbulence models, concerning the cyclone’s separation efficiency at 15.5 m/s. The average deviation between these results was approximately 2%, with the maximum deviation reaching 4.76%. At smaller particle diameters such as 1 µm and 5 µm, the differences between the models were relatively modest, standing at 3.00% and 1.89%, respectively. However, as the particle diameter increased, particularly at 7 µm, the variations became more pronounced. At 7 µm, the RSM model predicted a notably higher efficiency compared to the RNG K-ε model, with a difference of 4.76%. Similarly, at 10 µm, the difference remained discernible at 1.65%, favoring the RSM model. Despite these disparities, the differences between the models diminished as the particle size further increased. At 12 µm, the difference narrowed to 0.66%, and at 20 µm, both models converged to predict identical efficiencies, resulting in a difference of 0%.

2.4. Boundary Conditions

Figure 3 and Figure 4 show the geometries of the multi-inlet cyclone separators used in this study. Two-inlet (2i), three-inlet (3i), and four-inlet (4i) cyclone separators without modifications to their inlet dimensions are shown in Figure 3. Figure 4 shows the 3i and 4i cyclone separators with changes in their inlet dimensions according to Table 2, termed the 3a, 4a, 3b, and 4b cyclone separators.
Table 4 contains the numerical analysis parameters of this study. Three flow rates of 1.22, 1.63, and 2.05 m 3 /s were used for the simulation of these multi-inlet cyclone separators. The particle diameter of the injected particles ranged from 1 to 20 micrometers. The particle density was chosen to be 1750 kg/ m 3 to simulate the average particle density of coal dust.
As the 3i and 4i cyclone separators had an increased number of inlet areas, the velocity was reduced to maintain the flow rate. The inlet velocities used for 3i were 6, 8, and 10 m/s, two-thirds of the 2i cyclone separator. For the 4i cyclone separator, half of the inlet velocity of 2i was used, with values of 4.5, 6, and 7.5 m/s.
For the 3a, 4a, 3b, and 4b cyclone separators, the inlet height (a) and inlet width (b) were varied consequently to maintain the flow rate. Hence, the same velocities of 9, 12, and 15 m/s were used for the 2i, 3a, 4a, 3b, and 4b cyclone separators for flowrates of 1.22, 1.63, and 2.05 m 3 /s.
The turbulence intensity values detailed in Table 5 provide the inlet and outlet boundary conditions for the different velocities. The inlet turbulence intensity was categorized into groups, as the inlet area and velocity of these groups were the same. For the outlet, since all the cyclone separators had identical outlet areas or hydraulic diameters, there was no change in turbulence intensity.
This measurement of the inlet and outlet turbulence intensities for a fully developed pipe flow is expressed in this equation [29]:
For a fully developed pipe flow:
I = 0.16 R e d h 1 8
The Reynolds Number for the flow in a duct or pipe can be expressed as:
R e = ρ g · d h · u i n μ
  • ρ g = fluid density
  • d h = hydraulic diameter
  • u i n = velocity
  • μ = kinematic viscosity
Hydraulic diameter:
d h = 2 a b a + b
Flowrate:
Q = u i n A
Here, A = Area (a × b)
u i n = Q A

3. Results

3.1. Collection Efficiency

Figure 5, Figure 6 and Figure 7 present the collection efficiencies of all the cyclone separators. The performance of the 2i cyclone is compared with that of the 3i, 4i, 3a, 4a, 3b, and 4b cyclones to evaluate the effectiveness of these new cyclone separators. Specifically, Figure 6 compares the collection efficiencies of the 2i, 3a, and 4a cyclones, while Figure 7 compares those of the 2i, 3b, and 4b cyclones.
The results obtained with an increasing number of inlets and the same flow rate maintained are provided in Figure 5. The results from each flow rate show that the 2i cyclones had a higher separation efficiency. As the flow rate increased, the average efficiency deviation of the 4i cyclone converged towards that of the 2i cyclone, with deviations recorded at 20.7%, 19.12%, and 17.67%. In contrast, the 3i cyclone showed minimal improvement, with gains of 8.11%, 9.77%, and 8.06%. However, the deviation of the collection efficiency was greater for the 2i, 3i, and 4i cyclone separators, with particles equal to and larger than 20 µm having a 100% collection efficiency.
The inlet areas of 3a and 4a were reduced in height (a), resulting in a square-shaped inlet. This modification significantly improved their performance by increasing the inlet velocity, which, in turn, enhanced the particle collection efficiency. The performances of 3a and 4a were notably higher at lower flow rates, particularly at 1.22 m³/s, where they demonstrated averages of 3% and 2% higher collection efficiencies, respectively, compared to the 2i cyclone separator. However, this performance decreased by 0.66% and 0.54% at a flow rate of 1.63 m³/s. The separation efficiency further declined by 1.95% and 1.7% at a flow rate of 2.05 m³/s.
The collection efficiency further improved with the rectangle-shaped inlets of the 3b and 4b cyclones. Although a similar trend of a reduced collection efficiency was observed at higher flow rates, the 3b configuration maintained a higher collection efficiency than the 2i configuration for particles smaller than 7 µm. In contrast, the performance of the 4b cyclone remained relatively high; however, there was a noticeable reduction in efficiency for particle sizes of 5 µm and 12 µm.
The improvement in the separation performances of 3a, 4a, 3b, and 4b decreased with an increase in the flow rate. At a flow rate of 1.22 m³/s, unit 3b showed an average improvement of 1.4% for all particle sizes, while unit 4b demonstrated a more substantial improvement of 4.1% compared to the 2i cyclone separator. As the flow rate increased to 1.63 m³/s, unit 3b’s improvement was 1.2%, whereas unit 4b’s improvement was 1.5%. Finally, at a flow rate of 2.05 m³/s, the performance improvement of unit 3b was 0.3%, and unit 4b experienced a 0.5% increase.
Table 6 provides the short-circuit flow variations among the cyclone separator types. The short-circuit flow was calculated by the difference between the inlet flow rate and the downward flow rate at the axial position of the vortex finder bottom (Y1 = 0.42 m) [30]. The results show that with an increase in the flow rate, there was also an increase in the short-circuit flow percentage. As a result, the separation efficiencies of 3a, 4a, 3b, and 4b did not increase significantly compared to the 2i cyclone separator. Among the cyclone separators, 2i generated the lowest and 3b generated the highest short-circuit flow. However, 4i showed the highest value of a 46.2% short-circuit flow at a 1.22 m 3 /s flow rate.
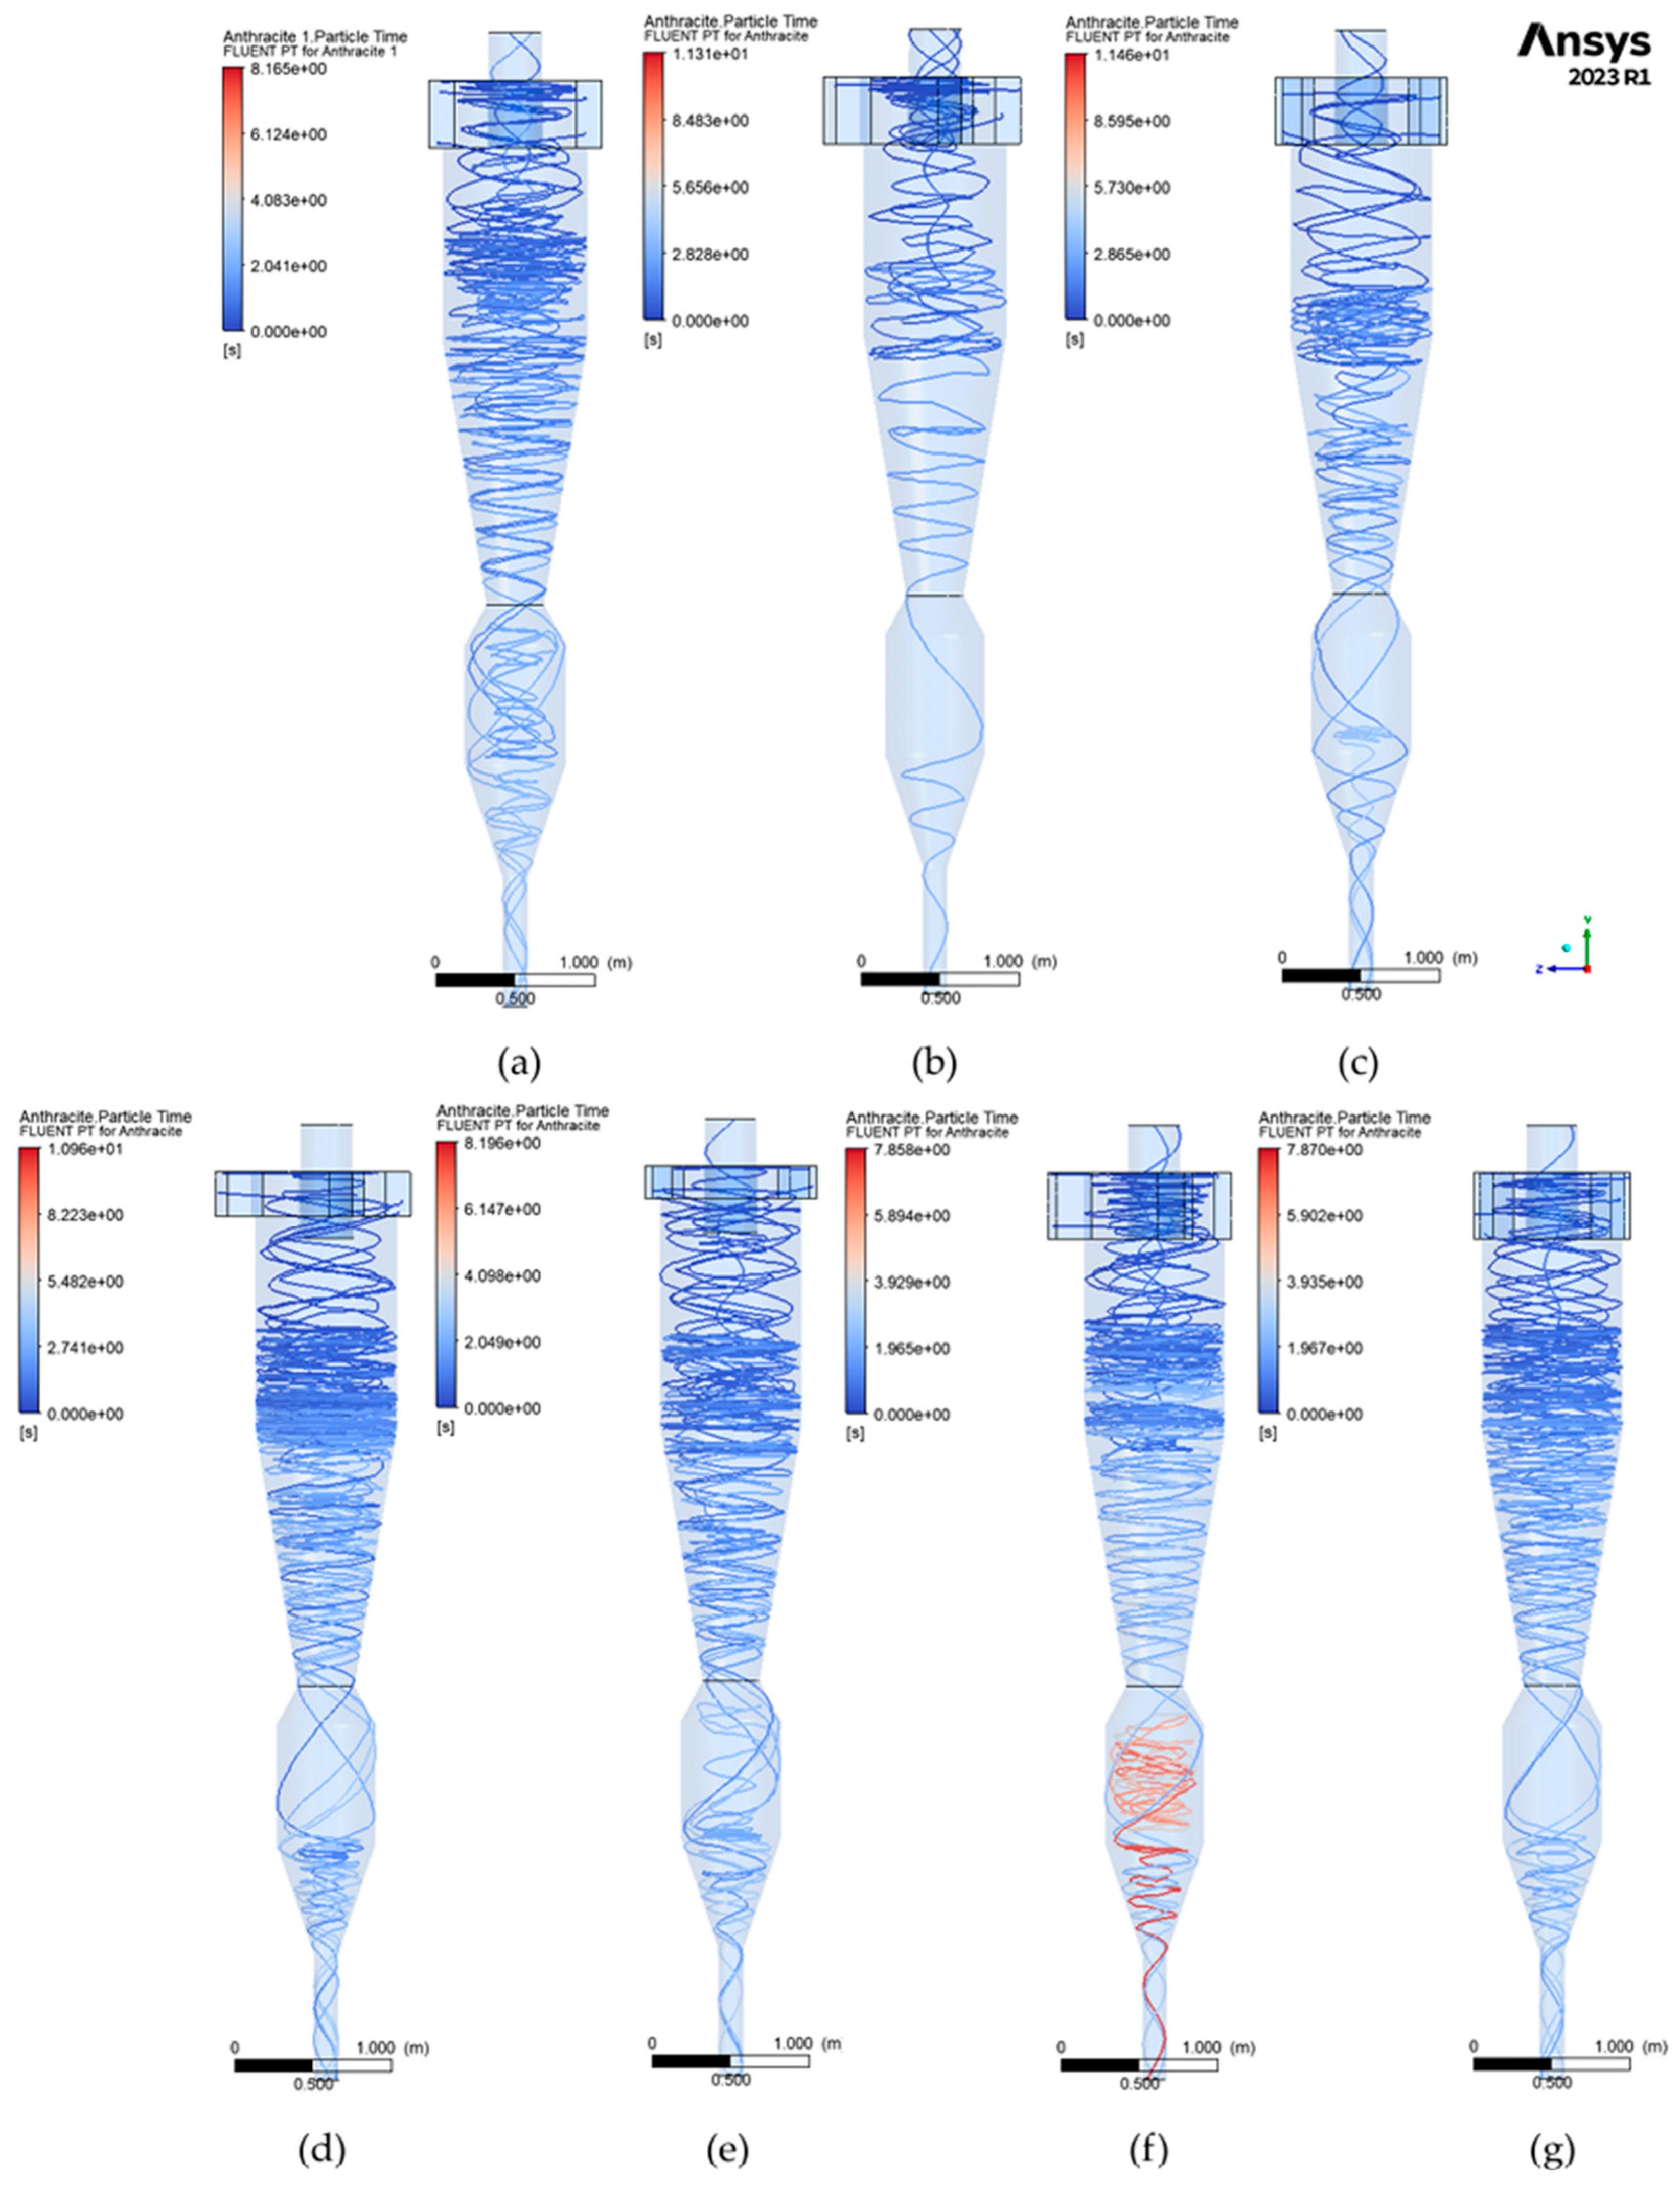
Figure 8 illustrates the particle residence time and particle track lines within the cyclone separator. The particle residence time refers to the duration a particle stays within the cyclone before being separated and collected. This residence time increases with the effective number of spiral paths the gas takes within the cyclone [31]. Additionally, the residence time is influenced by the flow rate and velocity; as the gas volumetric flow rate increases, the gas velocity also increases, resulting in a shorter residence time [32]. The highest residence time, recorded at 11.5 s, was observed in the four-inlet cyclone separator, where the inlet velocity was lower than that in other configurations. Despite having the same flow rate, the 3a, 3b, 4a, and 4b configurations exhibited a significant difference in residence times, likely due to the short-circuit flow within the cyclone separators.

3.2. Pressure Drop

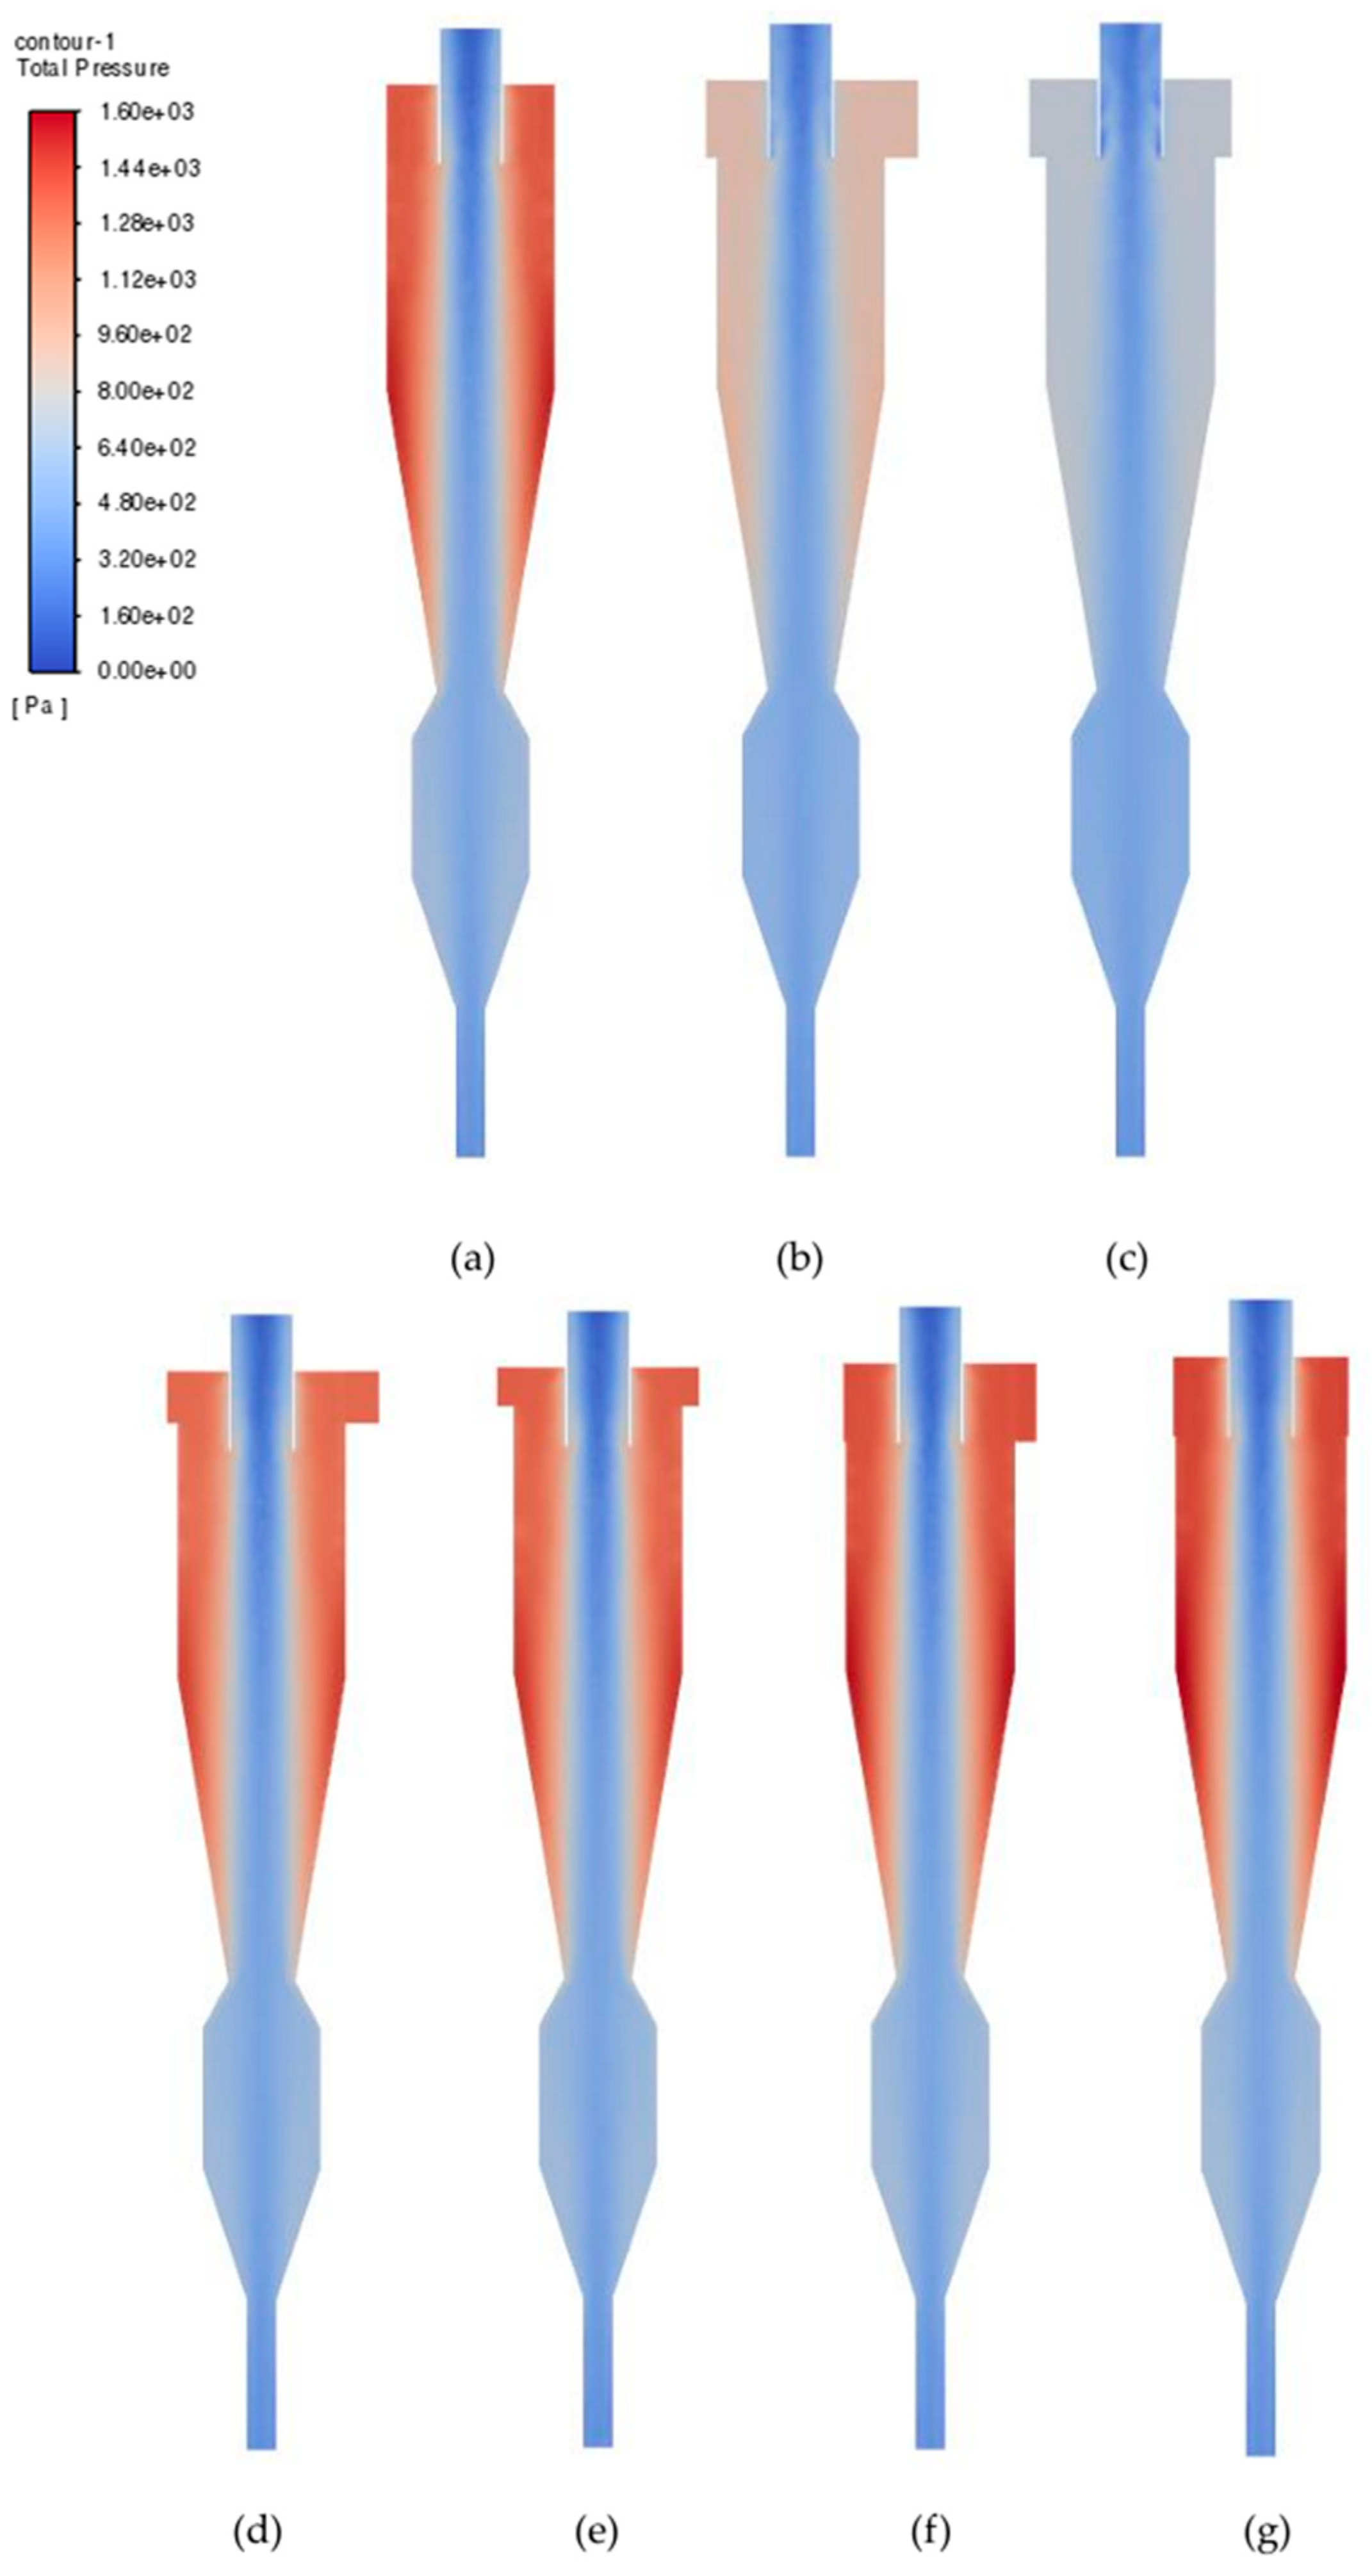
The pressure drop in a cyclone separator is defined as the difference in the pressure between the inlet and outlet, and it is influenced by various factors such as the geometry of the cyclone, surface roughness, inlet velocity, solid loading, and temperature [33]. Figure 9 and Figure 10 illustrate the pressure drop characteristics for the cyclone configurations designated as 2i, 3i, 4i, 3a, 4a, 3b, and 4b.
Figure 10 shows a direct correlation between the pressure drop, the number of inlets, and the flow rate. As the flow rate increased, the pressure drop correspondingly increased across all cyclone configurations. Notably, there was a significant variance in the pressure drop between the 2i cyclones and the 3i and 4i cyclones. The 2i cyclones exhibited the highest pressure drop, while the 4i cyclones showed the lowest. This trend can be attributed to the fact that increasing the number of inlets generally decreased the velocity within each inlet, which, in turn, reduced the pressure drop.
The differences in pressure drop observed in Figure 9 provide further insight. At the very top near the inlets, there was a region of high pressure. This high-pressure region was due to the incoming flow entering the cyclone at a high velocity, causing a sharp increase in the pressure as the air or gas was forced into the separator. As the flow moved downward through the cyclone, the pressure gradually decreased. The pressure drop occurred as the flow began to swirl around the central axis of the cyclone, creating centrifugal forces that pushed the particles towards the walls. Near the bottom, the pressure was significantly lower. By this stage, the swirling flow had lost much of its energy, and the pressure continued to drop as the air or gas moved toward the outlet. The lowest pressure was observed after the cone area, where the flow velocity decreased and particles were collected.
For instance, the total pressure contours indicated that the 3a and 4a cyclones exhibited nearly identical pressure drops; however, they achieved overall improvements of 3.1% and 1.2%, respectively, across all flow rates compared to the 2i cyclone, as shown in Figure 10. This suggests that, despite the increase in the number of inlets, the overall pressure drop could be reduced with the increase in separation efficiency shown in Figure 6 at a 1.22 m 3 /s flowrate.
Conversely, the 3b and 4b cyclones exhibited slightly higher pressure drops, at 1.9% and 3.6%, respectively, compared to the 2i cyclone. This increase can be attributed to the rise in tangential velocity and the energy loss caused by particle collisions with the wall. When examining the collection efficiencies of these cyclones, a clear relationship between pressure drop and efficiency is evident. Cyclones with a higher collection efficiency tend to have higher pressure drops, indicating that, while adding inlets can reduce the pressure drop, it may also necessitate careful design considerations to balance efficiency and pressure loss.

3.3. Tangential Velocity

As shown in Figure 11, Figure 12 and Figure 13, the tangential velocity was calculated at 12 radial points on the mid-plane of the cyclone separator. The points start from the left to the right radial distance, covering the entire diameter of the cyclone. The tangential velocity graph appears to be an “M” shape, which shows a good distribution of this velocity component. From Figure 14, this “M” shape in the tangential velocity distribution is further confirmed. The Y1 position exhibits higher tangential velocity values, approximately 29 m/s, with a spread of about 0.1 m on both sides. Due to its proximity to the vortex finder, the pressure in this region was lower, likely contributing to the increased tangential velocity.
As shown in Figure 11, the Y2 position had an even distribution of velocity from 0.2 to 0.4 until a sharp descent near the wall surface. Here, the tangential velocity decreased to around 22.5 m/s, because, as the flow moved down the cyclone, this velocity reduction was caused by the viscous forces exerted by the cyclone walls, slowing down the tangential motion of the particles. Additionally, with the continuous rotation through the same radial barrel area, the tangential velocity could not increase and might even decrease slightly as energy dissipated through friction and turbulence. The Y3 position, which is located in the cone area, had only one peak point at around 0.3 m on each side and then gradually descended to the wall surface. The velocity here was slightly higher than at Y2, as Y3 was located in the cone area, with pressure gradually reducing through the cone area.
The tangential velocity of the 2i cyclone was the highest, 3i was the second highest, and 4i had the lowest magnitude in Figure 11. The 2i cyclone tangential velocity at Y1 had a smoother curve and was well distributed. In contrast, the 3i and 4i cyclones had a sharp peak magnitude near 0.1m. At Y2, 3i and 4i became much smoother and more well-distributed. The graph illustrates that, at a constant flow rate, adding more inlets (moving from two to three or four) did not necessarily increase the tangential velocity, and the differences in the velocity profiles could have been due to an increase in the net flow area. When the flow rate is constant but the flow area increases, the flow velocity must decrease. This is because the fluid’s velocity is inversely proportional to the cross-sectional area it flows through.
Figure 12 and Figure 13 show the tangential velocities of squared and narrow rectangle-shaped inlets. Surprisingly, reducing the inlet area had a good impact on the tangential velocity. 3a and 4a cyclones’ tangential velocities reached almost a similar magnitude as the two-inlet cyclones, but the 3b and 4b cyclones improved what was observed with the two-inlet cyclones. In the Y1, Y2, and Y3 axial positions with 4b, the tangential velocity improved by an average of 4%, 4.82%, and 3.21%, respectively. In comparison, the 3b cyclone separator showed minimal improvement, with changes of −1.55%, 3.78%, and 1.1%. Figure 14 shows the tangential velocity distribution at the x = 0 cross-sectional area. The tangential velocity can be observed to gradually decrease from the top to the bottom of the cyclone separator.
From these graphs, it can be inferred that the number of inlets and shape affected the tangential velocity profile. This could have influenced the cyclones’ separation efficiency, since the tangential velocity is a critical factor in the centrifugal separation process. A high tangential velocity enhances the centrifugal force that is applied to the tiny particles, improving the effectiveness of fine particle separation [34]. A reduction in the tangential velocity along the wall in the lower section can result in particles flowing directly towards the outlet, thereby decreasing separation efficiency [35].

3.4. Axial Velocity

In a cyclone separator, axial velocity refers to the velocity component acting vertically along the height of the cyclone separator. Figure 15, Figure 16 and Figure 17 offer a compelling comparison of the axial velocity profiles across different axial positions (Y1, Y2, and Y3) within the cyclone separators with varying inlet configurations.
At Y1, the highest velocity was observed with maximum of 40 m/s at the center of the cyclone. The velocity dropped gradually as the flow traveled through the cyclone separator. The lowest velocity was observed at the Y3 position, which was lower than 5 m/s. The axial flow was downward in the outer region (descending flow) and upward in the central core (ascending flow) as the flow reversed direction near the bottom of the cyclone. The 3a, 4a, 3b, and 4b cyclone separators exhibited average increases in upward axial flow of 0.82%, 9.13%, 1.63%, and 7.85%, respectively. In the case of downward axial flow, the observed increases were 6.13%, 8.63%, 8.14%, and 8.41%. These higher axial velocities contribute to an enhanced collection efficiency of cyclone separators [36].
Conversely, with an increase in the inlet area, as seen in the 3i and 4i cyclone separators, both axial velocity and collection efficiency were observed to decrease [34]. From Table 6, the short-circuit flow in 3a and 3b was higher compared to in 4a and 4b. This increased short-circuit flow disrupted the main vortex flow pattern, leading to a reduction in the axial velocity due to the resulting interference [37,38]. The results indicate that, for the 3a and 4a cyclone separators, the lower downward axial velocity and higher upward axial velocity, respectively, adversely affected separation performance. In contrast, the 3b and 4b cyclone separators appeared to achieve a balance between upward and downward axial velocities, leading to an improved separation efficiency.

3.5. Turbulent Kinetic Energy, Dissipation Rate, and Intensity

Turbulent kinetic energy (TKE) represents the energy associated with turbulent motion within the fluid flow. In cyclone separators, turbulent motion occurs as the fluid swirls around the separator’s cylindrical or conical geometry. TKE is a measure of the kinetic energy per unit mass associated with the random motion of fluid particles due to turbulence. The dissipation of (k) in cyclone separators can be attributed to various factors, including viscosity effects, turbulence decay, and energy transfer mechanisms within the turbulent flow field. As the fluid swirls around the separator’s geometry, the viscous forces act to dampen turbulent fluctuations, causing (k) to dissipate gradually. This dissipation process contributes to the decay of turbulence and the eventual stabilization of the flow within the separator. Turbulence intensity quantifies the degree of turbulence present in a flow relative to the mean flow velocity. It is typically expressed as the ratio of the root-mean-square (RMS) velocity fluctuations to the mean flow velocity.
Strong turbulence kinetic energy (k), particularly in the upper section of a cyclone separator, can impede the movement of particles towards the separator wall. This impedes the centrifugal forces required for effective particle separation. Lower turbulence kinetic energy enhances the stability of the flow field in a cyclone and reduces its impact on particle separation [39]. To find the relation between separation efficiency and turbulence intensity, examining the pre-separation area is important.
Figure 18, Figure 19 and Figure 20 show the turbulent kinetic energy (k), dissipation rate (ε), and intensity. Particle collection is deeply related to these values. Figure 19 and Figure 20 show the turbulence graphs of the squared- and rectangular-shaped cyclone separators. From Figure 18, it is evident there was significant drop in k, ε, and intensity for the 3i and 4i cyclone separators. Higher inlet velocities introduced more energy into the system, leading to greater flow instability. This instability manifested as turbulence within the cyclone separator. As this study was conducted with a constant flow rate but with variations in inlet velocity, significant differences in k, ε, and intensity were to be expected. The evident behavior of a low (k) might be beneficial for a higher separation efficiency, but tangential and axial velocity might have greater impacts on separation efficiency. Figure 19 and Figure 20 show the same trend of a higher magnitude for 2i and 4b, as the particle separation efficiency was also higher among the compared cyclone separators. From Figure 14, it can be confirmed that the increased turbulence in the flow entrance region can hinder the tangential velocity, as the particles have not been significantly colliding with the cyclone separator wall in this region (Figure 8). Dianyu et al. [6] found that their new designs exhibited a higher turbulence intensity in the pre-separation area compared to the base design, also resulting in an increased separation efficiency by reducing the short-circuit flow. Similar results were observed for the rectangular inlet cyclone separators 3b and 4b, where the turbulence intensity increased to 6.25% and 6.53% at a flow rate of 2.05 m³/s. Correspondingly, the short-circuit flow percentages decreased from 29.6% to 26.9%. For the square inlet configurations 3a and 4a, an inverse pattern was observed [39]. With a reduction in the turbulence intensity by 0.57% and 3.65%, the short-circuit flow percentage was reduced from 27.4% to 26.5%, respectively.

4. Conclusions

This study investigated the performance of cyclone separators through numerical analysis and conducted a comparison of different inlet variations’ performance. The primary aim was to enhance the collection efficiency while minimizing the pressure drop, thereby improving the overall performance of cyclone separators. Key findings from this research include:
  • The 3i and 4i multi-inlet configurations performances were significantly lower relative to the baseline 2i. Changes in inlet height (a) and width (b) showed dramatic changes in performance, especially for the rectangular inlet configurations 3b and 4b, whose efficiency increased by 1.4% and 4.1% at 1.22 m3/s.
  • The study revealed that altering inlet geometries to square or rectangular shapes increased tangential velocities. The 3a and 4a designs, featuring squared inlets, achieved lower tangential velocities comparable to the two-inlet design. In contrast, the 3b and 4b designs surpassed the baseline 2i cyclone separator, with average increases of 1.1% and 4.01% across all three axial positions.
  • Higher downward axial velocities in cyclone separators generally enhance collection efficiency. However, increased short-circuit flow can disrupt the vortex pattern, leading to a reduction in axial velocity and, subsequently, a decrease in overall separation efficiency.
  • Despite the enhancements in collection efficiency, the multi-inlet cyclones 3a, 3b, 4a, and 4b did not exhibit a significant increase in pressure drop. Specifically, 3a and 4a showed improvements of 3.1% and 1.2%, respectively, while 3b and 4b experienced only modest increases of 1.9% and 3.6% compared to the 2i cyclone.
  • This research demonstrates that the separation efficiency of multi-inlet configurations is significantly influenced by turbulence. As the turbulence intensity in separators 3b and 4b increased to 6.25% and 6.53%, respectively, the separation efficiency improved by 0.3% to 0.5% compared to the base configuration 2i at a flow rate of 2.05 m³/s.

Author Contributions

Conceptualization, S.B. and A.N.M.; data curation, A.N.M.; formal analysis, M.F.M.B., S.A.-A. and M.A.M.A.-f.; investigation, A.N.M. and W.Z.; methodology, S.B., M.F.M.B., Y.S. and W.Z.; resources, Y.S., S.A.-A., M.A.M.A.-f. and W.Z.; software, S.B.; supervision, M.F.M.B.; validation, S.A.-A.; visualization, M.F.M.B., M.A.M.A.-f. and W.Z.; writing—original draft, S.B.; writing—review and editing, Y.S. and W.Z. All authors have read and agreed to the published version of the manuscript.

Funding

The research was supported by Universiti Tun Hussein Onn Malaysia (UTHM) through an Industrial Matching Grant (Q628).

Data Availability Statement

Data are contained within the article.

Conflicts of Interest

The authors declare no conflicts of interest.

References

  1. Wasilewski, M.; Brar, L.S.; Ligus, G. Experimental and numerical investigation on the performance of square cyclones with different vortex finder configurations. Sep. Purif. Technol. 2020, 239, 116588. [Google Scholar] [CrossRef]
  2. Marinuc, M.; Rus, F. The effect of particle size and input velocity on cyclone separation process. Bull. Transilv. Univ. Brasov. For. Wood Ind. Agric. Food Eng. Ser. II 2011, 4, 117. [Google Scholar]
  3. Malahayati, N.; Darmadi, D.; Alisa Putri, C.; Mairiza, L.; Rinaldi, W.; Yunardi, Y. Comparative performance analysis between conventional and square cyclones for solid Particle-Gas Separation: A review. Mater. Today Proc. 2022, 63, S318–S325. [Google Scholar] [CrossRef]
  4. Brar, L.S.; Rahmani, F.; Wasilewski, M. Performance analysis of multi-inlet cyclone separators considering different shapes and locations of the inlet ducts. Adv. Powder Technol. 2024, 35, 104325. [Google Scholar] [CrossRef]
  5. Elsayed, K.; Lacor, C. The effect of cyclone inlet dimensions on the flow pattern and performance. Appl. Math. Model. 2011, 35, 1952–1968. [Google Scholar] [CrossRef]
  6. E, D.; Fan, H.; Su, Z.; Xu, G.; Zou, R.; Yu, A.; Kuang, S. Numerical study of the multiphase flows and separation performance of hydrocyclone with tapered cross-section inlet. Powder Technol. 2023, 416, 118208. [Google Scholar] [CrossRef]
  7. Fetuga, I.A.; Olakoyejo, O.T.; Abolarin, S.M.; Adelaja, A.O.; Ologunoba, S.O.; Oluwatusin, O.; Fetuata, O.; Adewumi, O.O.; Robinson, U.D.; De Oliveira Siqueira, A.M. Eulerian–Lagrangian fluid dynamics study on the effects of inlet radial angle on the performance and flow pattern of multi-inlet cyclone separator. Alex. Eng. J. 2023, 78, 453–468. [Google Scholar] [CrossRef]
  8. Chen, J.; Jiang, Z.; Chen, J. Effect of inlet air volumetric flow rate on the performance of a Two-Stage cyclone separator. ACS Omega 2018, 3, 13219–13226. [Google Scholar] [CrossRef]
  9. Parvaz, F.; Hosseini, S.H.; Elsayed, K.; Ahmadi, G. Numerical investigation of effects of inner cone on flow field, performance and erosion rate of cyclone separators. Sep. Purif. Technol. 2018, 201, 223–237. [Google Scholar] [CrossRef]
  10. Prasanna, N.; Subramanian, K.; Ajay, S.; Rajagopal, T.; Vigneshwaran, V. CFD study on the performance of reducing pressure drop holes in cyclone separator. Mater. Today Proc. 2021, 43, 1960–1968. [Google Scholar] [CrossRef]
  11. Movafaghian, S.; Jaua-Marturet, J.A.; Mohan, R.S.; Shoham, O.; Kouba, G.E. The effects of geometry, fluid properties and pressure on the hydrodynamics of gas–liquid cylindrical cyclone separators. Int. J. Multiph. Flow 2000, 26, 999–1018. [Google Scholar] [CrossRef]
  12. Wang, Z.; Sun, G.; Jiao, Y. Experimental study of large-scale single and double inlet cyclone separators with two types of vortex finder. Chem. Eng. Process. 2020, 158, 108188. [Google Scholar] [CrossRef]
  13. Safikhani, H.; Zamani, J.; Musa, M. Numerical study of flow field in new design cyclone separators with one, two and three tangential inlets. Adv. Powder Technol. 2018, 29, 611–622. [Google Scholar] [CrossRef]
  14. Kuang, S.; Chu, K.; Yu, A.; Vince, A. Numerical study of liquid–gas–solid flow in classifying hydrocyclones: Effect of feed solids concentration. Miner. Eng. 2012, 31, 17–31. [Google Scholar] [CrossRef]
  15. Cyclone Separator Working Principle (Dust Separator) Explained—saVRee. (n.d.). Available online: https://savree.com/en/encyclopedia/cyclone-separator-working-principle-dust-separator (accessed on 1 June 2024).
  16. Dong, S.; Wang, C.; Zhang, Z.; Cai, Q.; Dong, K.; Cheng, T.; Wang, B. Numerical study of short-circuiting flow and particles in a gas cyclone. Particuology 2023, 72, 81–93. [Google Scholar] [CrossRef]
  17. Huang, A.N.; Ito, K.; Fukasawa, T.; Fukui, K.; Kuo, H.P. Effects of particle mass loading on the hydrodynamics and separation efficiency of a cyclone separator. J. Taiwan Inst. Chem. Eng. 2018, 90, 61–67. [Google Scholar] [CrossRef]
  18. Ostermeier, P.; Fischer, F.; Fendt, S.; DeYoung, S.; Spliethoff, H. Coarse-grained CFD-DEM simulation of biomass gasification in a fluidized bed reactor. Fuel 2019, 255, 115790. [Google Scholar] [CrossRef]
  19. Han, C.; Hu, Y.; Li, W.; Bie, Q. Gas-solid separation performance and structure optimization in 3D printed guide vane cyclone separator. Adv. Powder Technol. 2022, 33, 103815. [Google Scholar] [CrossRef]
  20. Yao, Y.; Shang, M.; Huang, Z.; Zhou, T.; Zhang, M.; Yang, H.; Lyu, J. Effects of the inlet duct length on the performance of a dense medium cyclone: An experimental and numerical study. Chem. Eng. Res. Des. 2022, 187, 41–50. [Google Scholar] [CrossRef]
  21. Zhang, L.; Fan, J.; Zhang, P.; Gao, F.; Chen, G.; Li, J. Effect of local erosion on the flow field and separation performance of the cyclone separator. Powder Technol. 2023, 413, 118007. [Google Scholar] [CrossRef]
  22. Sun, Y.; Yu, J.; Wang, W.; Yang, S.; Hu, X.; Feng, J. Design of vortex finder structure for decreasing the pressure drop of a cyclone separator. Korean J. Chem. Eng. 2020, 37, 743–754. [Google Scholar] [CrossRef]
  23. Chen, J.; Shi, M. A universal model to calculate cyclone pressure drop. Powder Technol. 2007, 171, 184–191. [Google Scholar] [CrossRef]
  24. Analytis, G. Implementation and assessment of the renormalization group (RNG), quadratic and cubic non-linear eddy viscosity k–ε models in GOTHIC. Nucl. Eng. Des. 2001, 210, 177–191. [Google Scholar] [CrossRef]
  25. Perini, F.; Zha, K.; Busch, S.; Reitz, R. Comparison of Linear, Non-Linear and Generalized RNG-Based k-Epsilon Models for Turbulent Diesel Engine Flows, SAE Technical Papers on CD-ROM/SAE Technical Paper Series. [CrossRef]
  26. Papageorgakis, G.C.; Assanis, D.N. Comparison of linear and nonlinear RNG-based k-epsilon models for incompressible turbulent flows. Numer. Heat Transf. Part B Fundam. 1999, 35, 1–22. [Google Scholar] [CrossRef]
  27. Barua, S.; Batcha, M.F.M.; Amin, A.M.; Mohammed, A.N.; Wae-Hayee, M. Optimizing Cyclone Separator Performance: Effects of Vortex Finder Diameter, Inlet Velocity, and Particle Diameter on Separation Efficiency and Pressure Drop. J. Adv. Res. Appl. Mech. 2024. under publication. [Google Scholar]
  28. Wang, Z.; Sun, G.; Song, Z.; Yuan, S.; Qian, Z. Effect of inlet volute wrap angle on the flow field and performance of double inlet gas cyclones. Particuology 2023, 77, 29–36. [Google Scholar] [CrossRef]
  29. Wei, Q.; Sun, G.; Gao, C. Numerical analysis of axial gas flow in cyclone separators with different vortex finder diameters and inlet dimensions. Powder Technol. 2020, 369, 321–333. [Google Scholar] [CrossRef]
  30. E, D.; Xu, G.; Fan, H.; Cui, J.; Tan, C.; Zhang, Y.; Zou, R.; Kuang, S.; Yu, A. Numerical investigation of hydrocyclone inlet configurations for improving separation performance. Powder Technol. 2024, 434, 119384. [Google Scholar] [CrossRef]
  31. 2003. In Handbook of Fluidization and Fluid-Particle Systems; CRC Press eBooks: Boca Raton, FL, USA. [CrossRef]
  32. Song, J.; Sun, G.; Chao, Z.; Wei, Y.; Shi, M. Gas flow behavior and residence time distribution in a FCC disengager vessel with different coupling configurations between two-stage separators. Powder Technol. 2010, 201, 258–265. [Google Scholar] [CrossRef]
  33. Karagoz, I.; Avci, A. Modelling of the pressure drop in tangential inlet cyclone separators. Aerosol Sci. Technol. 2005, 39, 857–865. [Google Scholar] [CrossRef]
  34. Feng, M.; Gui, C.; Zhou, Y.; Lei, Z. Numerical study on performance optimization and flow mechanism of a new cyclone separator. Green Chem. Eng. 2024, in press. [Google Scholar] [CrossRef]
  35. Chaghakaboodi, H.A.; Saidi, M. Numerical study of gas-solid flow in a square cyclone separator with different vortex finders. Process Saf. Environ. Prot. 2023, 194, 621–635. [Google Scholar] [CrossRef]
  36. Seon, G.; Ahn, J.; Hwang, W. Analysis of the impact of flow characteristics on the separation efficiency and pressure drop of a cyclone-type oil separator. J. Mech. Sci. Technol. 2022, 36, 273–283. [Google Scholar] [CrossRef]
  37. Wang, C.; Ma, Y.; Sui, W. The Secondary Flows in a Cyclone Separator: A review. Processes 2023, 11, 2935. [Google Scholar] [CrossRef]
  38. Misiulia, D.; Lidén, G.; Antonyuk, S. Secondary lip flow in a cyclone separator. Flow Turbul. Combust. 2023, 110, 581–600. [Google Scholar] [CrossRef]
  39. Yang, H.; Wang, N.; Cao, Y.; Meng, X.; Yao, L. Effects of helical fins on the performance of a cyclone separator: A numerical study. Adv. Powder Technol. 2023, 34, 103929. [Google Scholar] [CrossRef]
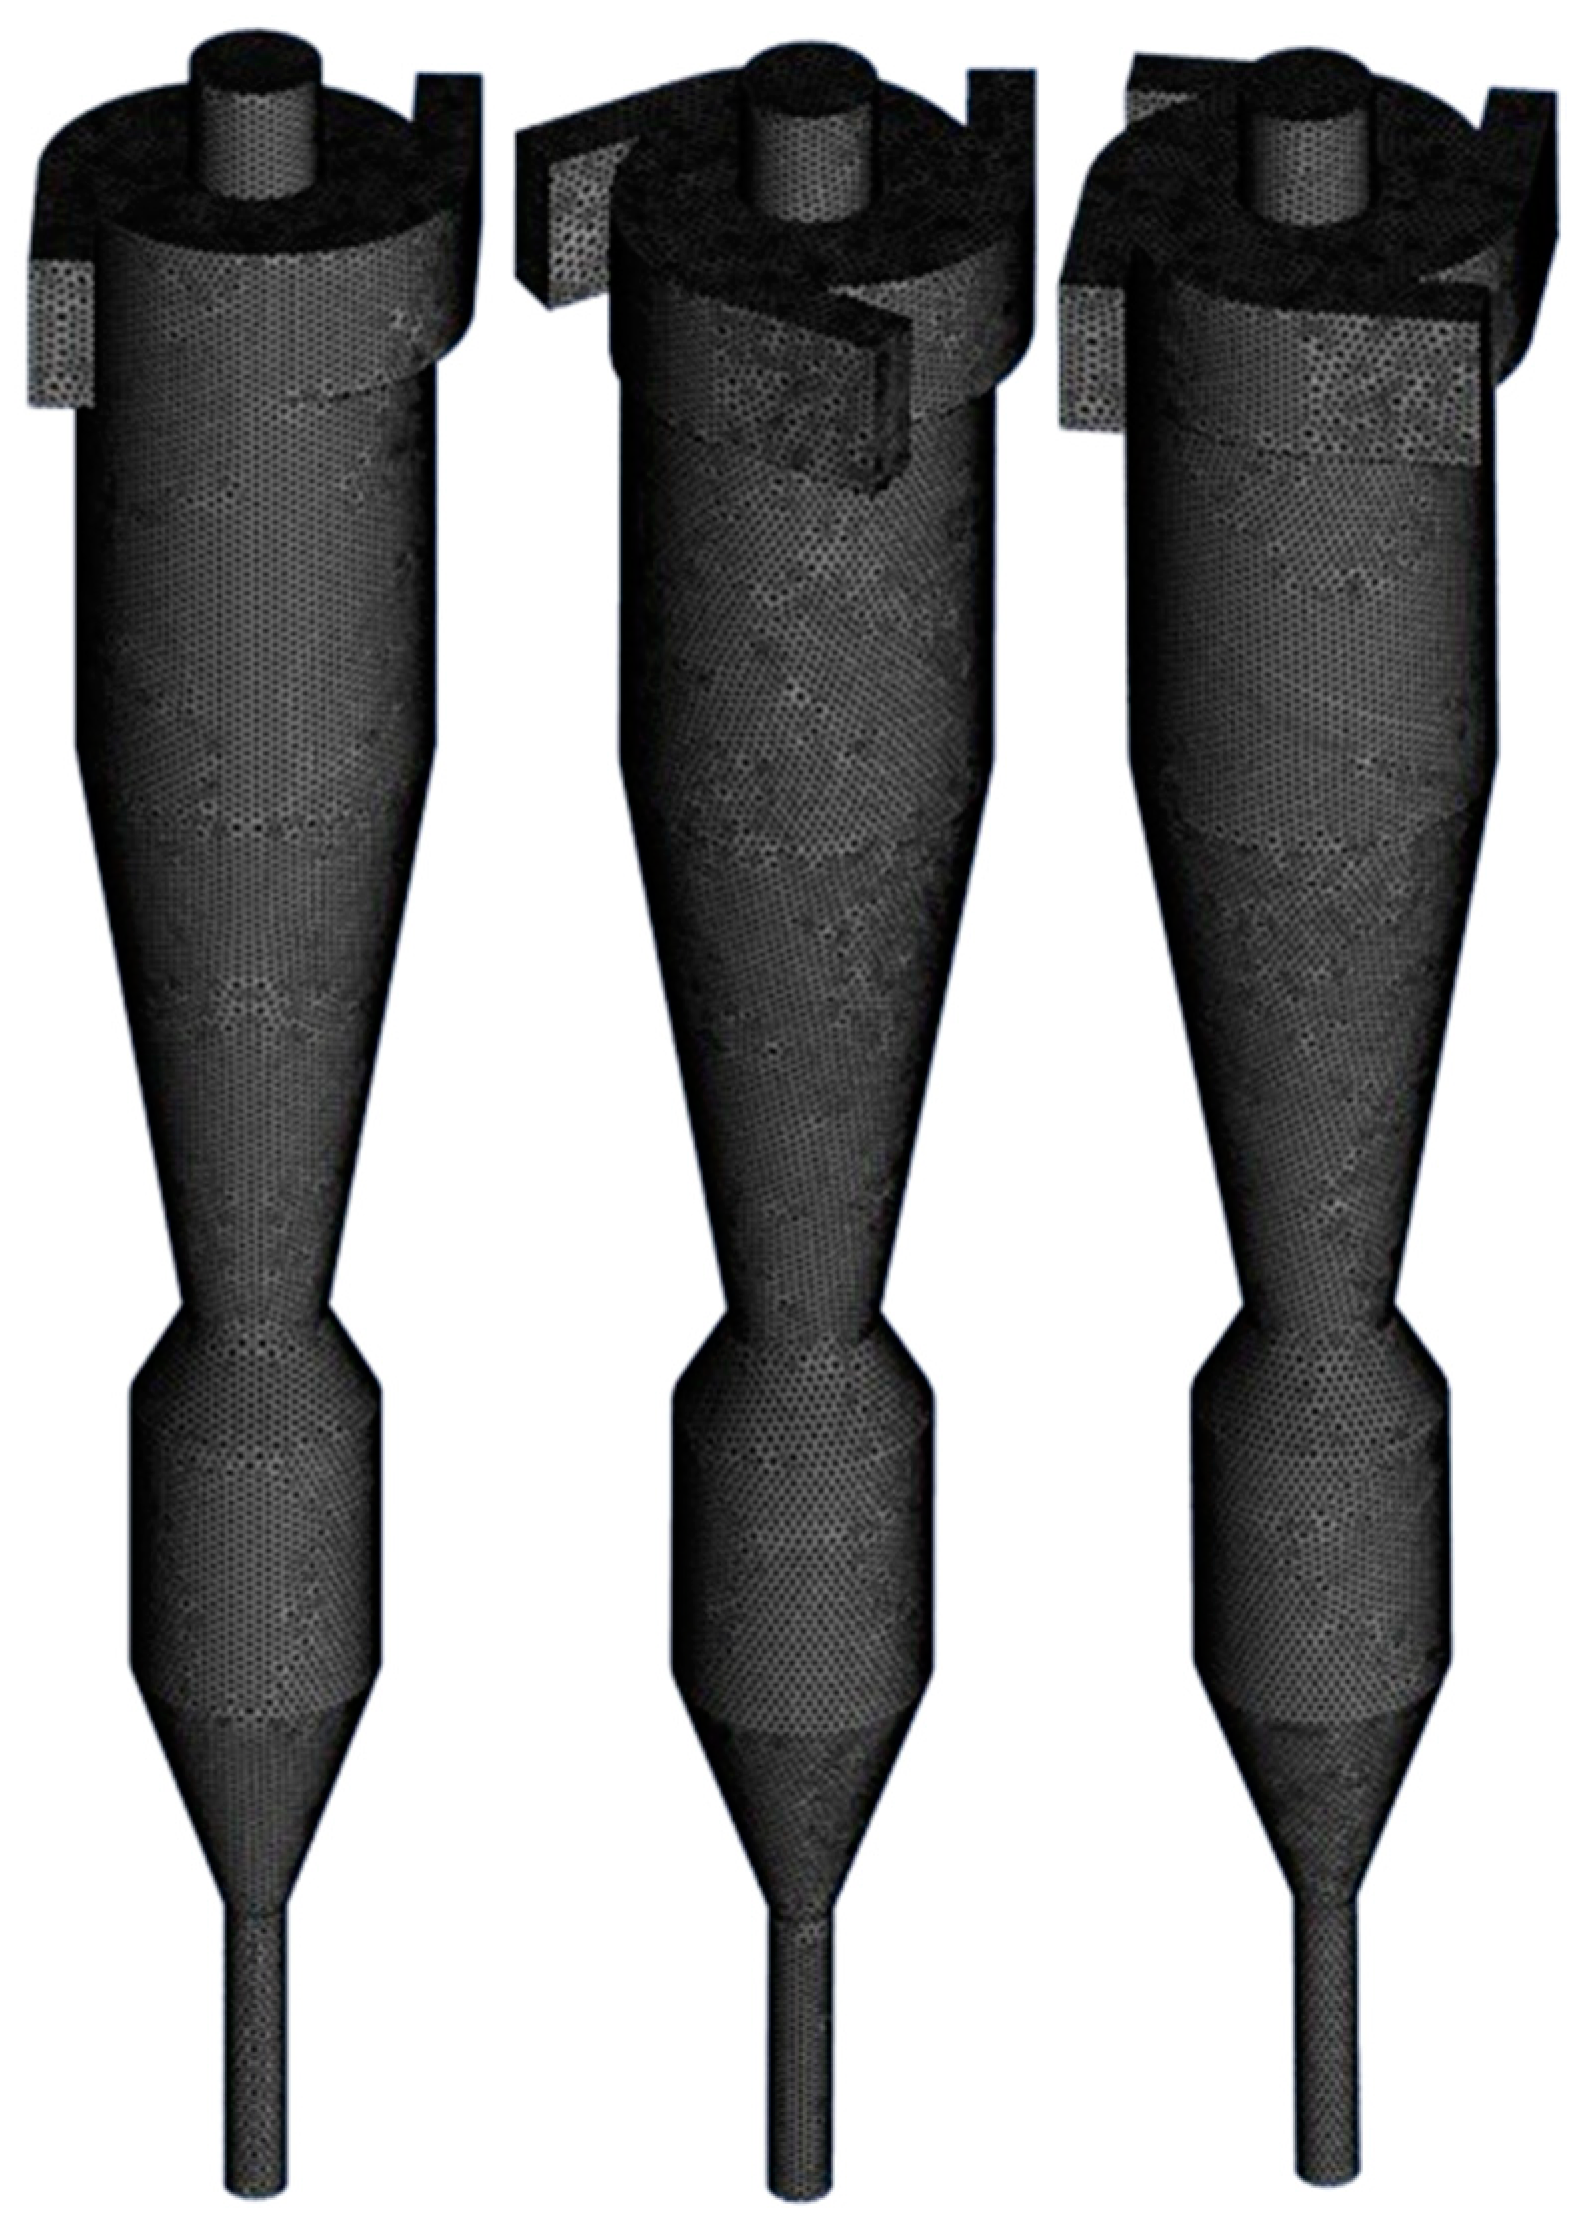
Figure 1. Meshed geometry of 2i, 3i, and 4i cyclone separators.
Processes 12 01820 g001
Figure 2. Cyclone separator geometry with dimensions.
Processes 12 01820 g002
Figure 3. Multi-inlet geometries: (a) 2 inlets (2i); (b) 3 inlets (3i), and (c) 4 inlets (4i).
Processes 12 01820 g003
Figure 4. Modified multi-inlet geometries: (a) 3 inlet-a (3a); (b) 4 inlet-b (4a); (c) 3 inlet-b (3b); and (d) 4 inlet-b (4b).
Processes 12 01820 g004
Figure 5. Particle collection efficiencies of 2-, 3-, and 4-inlet cyclone separators at (a) 1.22; (b) 1.63; and (c) 2.05 m 3 /s flowrates.
Processes 12 01820 g005
Figure 6. Particle collection efficiencies of 2i, 3a, and 4a cyclone separators at (a) 1.22; (b) 1.63; and (c) 2.05 m 3 /s flowrates.
Processes 12 01820 g006
Figure 7. Particle collection efficiencies of 2i, 3b, and 4b cyclone separators at (a) 1.22; (b) 1.63; and (c) 2.05 m 3 /s flowrates.
Processes 12 01820 g007
Figure 8. Particle path line with track or residence time of (a) 2i; (b) 3i; (c) 4i; (d) 3a; (e) 4a; (f) 3b; and (g) 4b at 2.05 m 3 /s flowrate and 7 µm particle diameter.
Processes 12 01820 g008
Figure 9. Total pressure difference cross-section view of (a) 2i; (b) 3i; (c) 4i; (d) 3a; (e) 4a; (f) 3b; and (g) 4b cyclone separators at a 2.05 m 3 /s flowrate (Position X = 0).
Processes 12 01820 g009
Figure 10. Pressure drop of 2i, 3i, and 4i cyclones at various flow rates.
Processes 12 01820 g010
Figure 11. The tangential velocities of 2i, 3i, and 4i cyclone separators in Y1, Y2, and Y3 axial positions at 2.05 m 3 / s .
Processes 12 01820 g011
Figure 12. The tangential velocities of 2i, 3a, and 4a cyclone separator in Y1, Y2, and Y3 axial positions at 2.05 m 3 / s .
Processes 12 01820 g012
Figure 13. The tangential velocities of 2i, 3b, and 4b cyclone separator in Y1, Y2, and Y3 axial positions at 2.05 m 3 / s .
Processes 12 01820 g013
Figure 14. Tangential velocity cross-section view of (a) 2i; (b) 3i; (c) 4i; (d) 3a; (e) 4a; (f) 3b; and (g) 4b cyclone separators at a 2.05 m 3 /s flowrate (Position X = 0).
Processes 12 01820 g014
Figure 15. Axial velocities of 2i, 3i, and 4i cyclone separators in Y1, Y2, and Y3 axial positions at 2.05 m 3 /s (−V = Downward, +V = Upward direction).
Processes 12 01820 g015
Figure 16. Axial velocities of 2i, 3a and 4a cyclone separator in Y1, Y2, and Y3 axial positions at 2.05 m 3 /s (−V = Downward, +V = Upward direction).
Processes 12 01820 g016
Figure 17. Axial velocities of 2i, 3b, and 4b cyclone separator in Y1, Y2, and Y3 axial positions at 2.05 m 3 /s (−V = Downward, +V = Upward direction).
Processes 12 01820 g017
Figure 18. Turbulent kinetic energy (k), dissipation rate (ε), and intensity of 2i, 3i, and 4i cyclone separators in Y1 axial position at 2.05 m 3 / s .
Processes 12 01820 g018
Figure 19. Turbulent kinetic energy (k), dissipation rate (ε), and intensity of 2i, 3a, and 4a cyclone separators in Y1 axial position at 2.05 m 3 / s .
Processes 12 01820 g019
Figure 20. Turbulent kinetic energy (k), dissipation rate (ε), and intensity of 2i, 3b, and 4b cyclone separators in Y1 axial position at 2.05 m 3 / s .
Processes 12 01820 g020
Table 1. Grid independency test [27].
Size (mm)ElementPressure-Drop (Pa)Y—Velocity (m/s)
40176,0181038.15424.71
35240,0981101.71424.81
30342,9521162.35324.84
27440,2811210.4424.85
25528,3791246.69524.86
Table 2. Dimensions of the dual-inlet cyclone.
GeometryCycloneDimension
Barrel diameter, D/mm 900
Vortex finder diameter, De/mm 330
Vortex finder length,
S/mm
419
Vortex finder length
(Outer), mm
300
Inlet height, a/mm2i, 3i, 4i, 3b, 4b419
3a279.3
4a209.5
Inlet width, b/mm2i, 3i, 4i, 3a, 4a163
3b108.7
4b81.5
Inlet length, mm 500
Barrel height, H/mm 1638
Cone height, Hc/mm 1620
Cone bottom diameter, Dc/mm 360
Bin diameter, Be/mm 630
Dipleg diameter,
Dd/mm
156
Dipleg length Hd (mm) 800
h1 (mm), h2 (mm), h3 (mm) 250, 750, 700
Table 3. The separation efficiency of dual-inlet cyclone separator [27].
Particle DiameterWang et al. [28]Barua et al. [27]Deviation (%)Average (Approx)
150.6453.6432%
574.3576.241.89
793.3788.614.76
1010098.351.65
1210099.340.66
201001000
Table 4. Numerical analysis parameters.
ItemValueUnit
Flowrate1.22, 1.63, and 2.05 m 3 /s
Particle diameter1 to 20µm
Particle bulk density1750kg/ m 3
Table 5. Turbulence intensity.
TypeCyclone Separator 1.22   m 3 / s 1.63   m 3 / s 2.05   m 3 / s
Inlet2i3.6%3.5%3.4%
3i3.82%3.68%3.58%
4i3.9%3.82%3.72%
3a and 3b3.77%3.64%3.54%
4a and 4b3.63%3.5%3.41%
Outlet2i, 3i, 4i, 3a, 3b, 4a, and 4b3.88%3.75%3.36%
Table 6. Short-circuit flow percentage.
Cyclone Type 1.22   m 3 /s 1.63   m 3 /s 2.05   m 3 /s
2 inlet26.1%26.3%26.8%
3 inlet28.0%28.1%28.6%
4 inlet46.2%28.1%28.6%
3 inlet a26.7%27.0%27.4%
4 inlet a25.7%26.0%26.5%
3 inlet b29.1%29.1%29.6%
4 inlet b26.1%26.4%26.9%
Disclaimer/Publisher’s Note: The statements, opinions and data contained in all publications are solely those of the individual author(s) and contributor(s) and not of MDPI and/or the editor(s). MDPI and/or the editor(s) disclaim responsibility for any injury to people or property resulting from any ideas, methods, instructions or products referred to in the content.