

Exploring Alloy Composition Dynamics: Thermodynamic Analysis of Fe-Al-Si-Cr System in Homogeneous Liquid State

 , ,
, ,
Abstract
1. Introduction
2. Materials and Methods
2.1. Thermodynamic-Diagram Analysis
2.2. Phase Diagram Plotting
2.3. Mathematical Modeling
3. Results and Discussion
- (1)
- The Gibbs energy values of these compounds have been calculated by the following formula:
- (2)
- Calculation of the reaction of the enthalpy change at a given temperature:
- (3)
- Determination of the reaction of the entropy change at a given temperature:
- (4)
- Calculation of the reaction of the Gibbs energy change at a given temperature— using the Gibbs–Helmholtz formula.
- -
- —a standard value of the reaction of enthalpy, J/mol;
- -
- —a standard value of the reaction of entropy, J/(mol∙K);
- -
- —value of the reaction of the heat capacity, J/(mol∙K);
- -
- Tmel.—a current temperature or temperature of the phase transition (melt, evaporation, etc.) of the component, respectively, K;
- -
- T—a temperature where the system is in the homogeneous liquid-phase state, K;
- -
- ΔH0mel.—enthalpy of phase transition or melt of a component, respectively, J/mol;
- -
- ∆S0mel.—entropy of phase transition or melt of a component, respectively, J/(mol∙K).
CrSi2 = a2Cr + b2Fe + c2Al + d2Si = 2.07900∙Cr
Al = a3Cr + b3Fe + c3Al + d3Si = 1.0∙Al
FeSi2 = a4Cr + b4Fe + c4Al + d4Si = 2.0∙Fe
CrSi2 = a2Cr + b2Fe + c2Al + d2Si = 3.84615∙Cr − 3.84615∙Fe − 2.07101∙Si
Al = a3Cr + b3Fe + c3Al + d3Si = 1.0∙Al
FeSi2 = a4Cr + b4Fe + c4Al + d4Si = 2.0∙Fe
Cr5Si3 = a2Cr + b2Fe + c2Al + d2Si = −6.19048∙Cr + 6.19048∙Fe + 3.33333∙Si
Al = a3Cr + b3Fe + c3Al + d3Si = 1.0∙Al
FeSi2 = a4Cr + b4Fe + c4Al + d4Si = 2.0∙Fe Fe
Fe = a2Cr + b2Fe + c2Al + d2Si = 0.71698∙Cr + 1.0∙Fe − 2.07692∙Al − 4.0∙Si
Cr3Si = a3Cr + b3Fe + c3Al + d3Si = 1.17925∙Cr
Fe2Si = a4Cr + b4Fe + c4Al + d4Si = −0.89623∙Cr + 5.0∙Si Fe
4. Conclusions
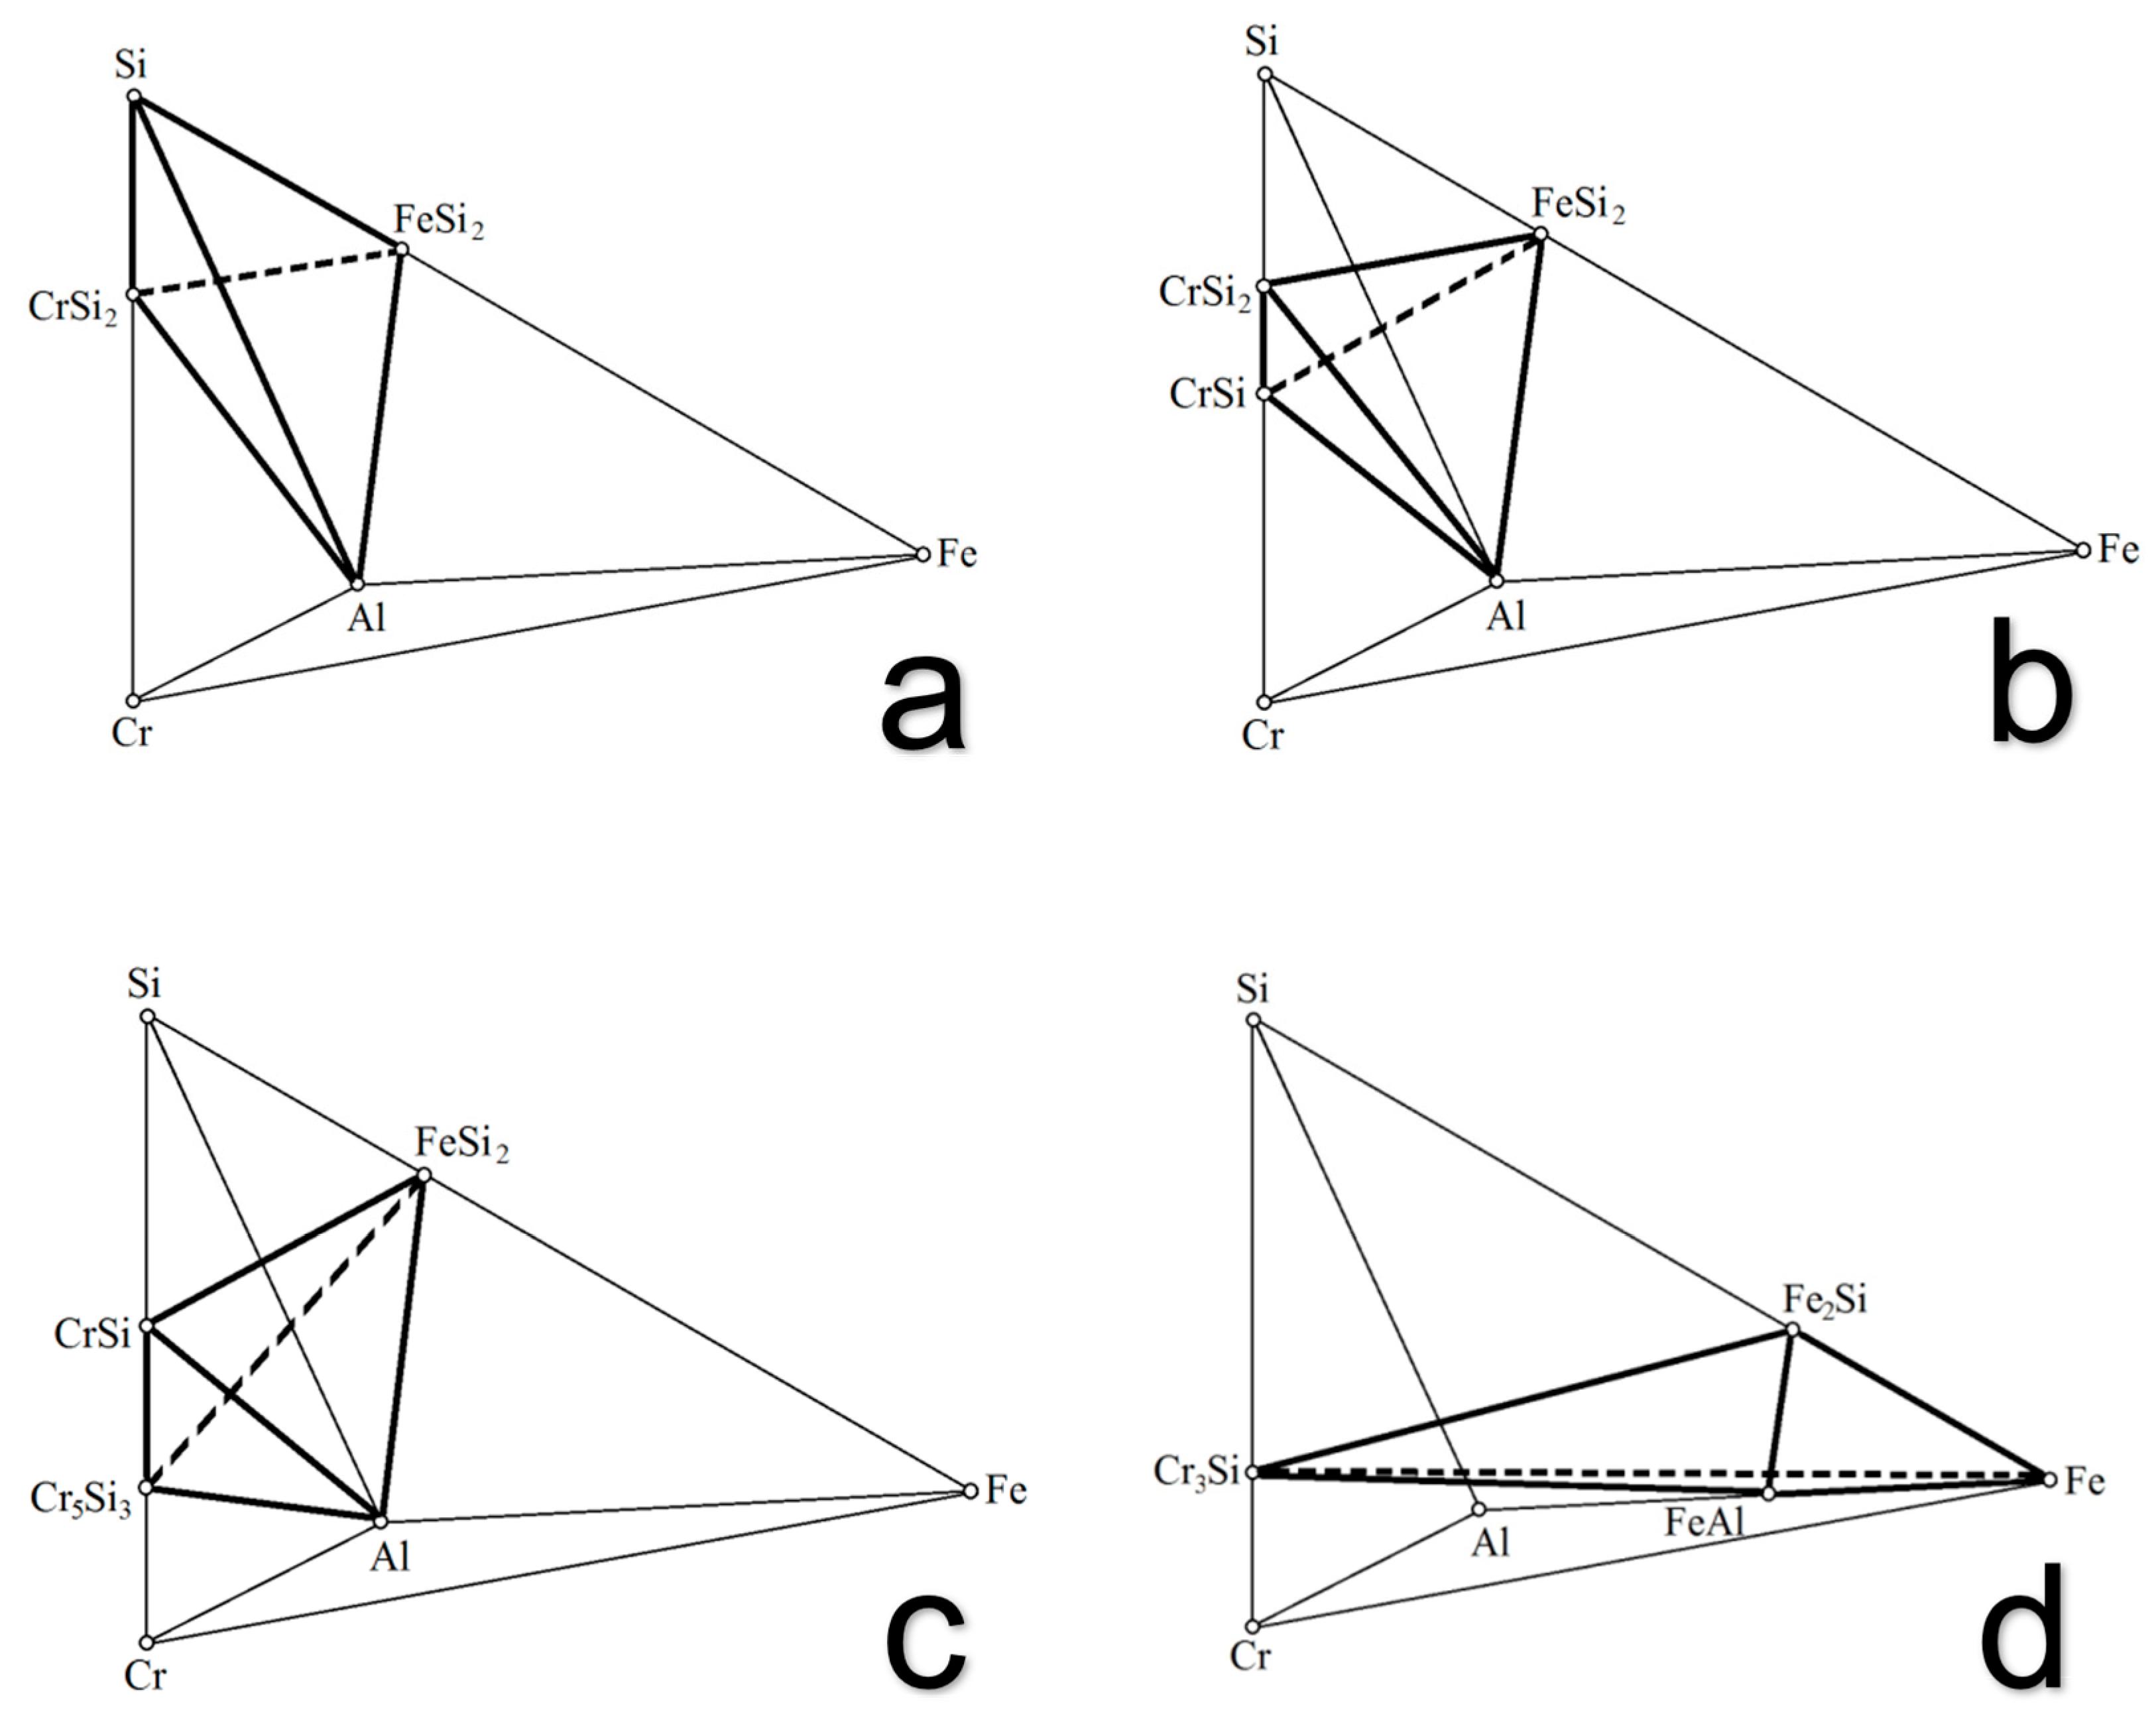
- A phase diagram of the metal Fe-Al-Si-Cr system modeling the compositions of the multicomponent chromium alloys including the complex aluminum–silicon–chromium alloy has been plotted. It has been found that the system consisted of 21 stable elementary tetrahedra. The amount of the relative volumes of the elementary tetrahedra was practically equal to unity (0.999999), and thus, it has confirmed the accuracy of the made tetrahedration;
- The analytical expressions for each tetrahedron have been derived. The created mathematical model can find the phase composition of the complex aluminum–silicon–chromium alloy in combination with other properties to optimize the technological process of its production. Based on the calculations, it has been stated that the phase compositions of aluminum–silicon–chromium are characterized by tetrahedron No.1 (Si-FeSi2-Al-CrSi2). The found tetrahedron is the most volumetric (Vi = 0.2405) phase triangle of the metal Cr-Fe-Al-Si system. Therefore, the large volume of the tetrahedron has provided good conditions for the melt of aluminum–silicon–chromium. As a result, it was possible to freely adjust the composition of the charge to obtain the required grade composition of the alloy.
Author Contributions
Funding
Data Availability Statement
Conflicts of Interest
References
- Magdalena, R.; Valero, A.; Palacios, J.-L.; Valero, A. Mining energy consumption as a function of ore grade decline: The case of lead and zinc. J. Sustain. Min. 2021, 20, 109–121. [Google Scholar] [CrossRef]
- Yan, Z.-m.; Lv, X.-w.; Li, Z.-s. Physicochemical properties and structure of titania-containing metallurgical slags: A review. J. Iron Steel Res. Int. 2022, 29, 187–206. [Google Scholar] [CrossRef]
- Fan, X.; Yang, Z.; Zhang, C. High Temperature Oxidation and Wear Resistance of Y-modified Hot Dipping Aluminized Coating on SCH12 Steel. Rare Met. Mater. Eng. 2012, 41, 231–235. [Google Scholar]
- Gialanella, S.; Malandruccolo, A. Aerospace Alloys; Springer: Berlin/Heidelberg, Germany, 2020. [Google Scholar]
- Zepon, G.; Silva, B.H.; Zlotea, C.; Botta, W.J.; Champion, Y. Thermodynamic modelling of hydrogen-multicomponent alloy systems: Calculating pressure-composition-temperature diagrams. Acta Mater. 2021, 215, 117070. [Google Scholar] [CrossRef]
- Mikhailov, G.; Makrovets, L. Thermodynamic Analysis of the Processes in the High-Temperature Multicomponent Fe–Y–Si–O–C System. Russ. Metall. (Met.) 2023, 2023, 1159–1164. [Google Scholar] [CrossRef]
- Baisanov, S.; Tolokonnikova, V.; Yerekeyeva, G.; Narikbayeva, G.; Korsukova, I. Thermodynamic-diagram analysis of the Fe-Si-Al-Mn system with the construction of diagrams of phase relations. Metalurgija 2022, 61, 828–830. [Google Scholar]
- Young, D.A. Phase Diagrams of the Elements; University of California Press: Berkeley, CA, USA, 2023. [Google Scholar]
- Saka, H. Introduction to Phase Diagrams in Materials Science and Engineering; World Scientific: Singapore, 2020. [Google Scholar]
- Zhumagaliyev, Y.; Nurumgaliyev, Y.G.; Mongolkhan, A.O.; Davletova, A.; Sagynbekova, G. Thermodynamic-diagram analysis of the Fe-Si-Al-Cr system with the construction of diagrams of phase relations. Metalurgija 2022, 61, 825–827. [Google Scholar]
- Saslow, W.M. A history of thermodynamics: The missing manual. Entropy 2020, 22, 77. [Google Scholar] [CrossRef]
- Tolokonnikova, V.V.; Baisanov, S.; Yerekeyeva, G.S.; Narikbayeva, G.I.; Korsukova, I.Y. Evaluation of the Degree of Dissociation of A Congruent Compound Fe2Ti across the Bjerrum–Guggenheim Coefficient. Metals 2022, 12, 2132. [Google Scholar] [CrossRef]
- Kasenov, B.K.; Aldabergenov, M.K.; Pashinkin, A.S. Thermodynamic Methods in Chemistry and Metallurgy; Rauan-Demeu: Almaty, Kazakhstan, 1994; p. 256. [Google Scholar]
- Kasenov, B.K.; Aldabergenov, M.K.; Pashinkin, A.S. Methods of Applied Thermodynamics in Chemistry and Metallurgy; Glasir: Karaganda, Kazakhstan, 2008; p. 332. [Google Scholar]
- Tolokonnikova, V.; Baisanov, S.; Narikbayeva, G.; Yerekeyeva, G. Regularities of phase equilibria based on the Bjerrum-Guggenheim concept for the Fe-Al binary system. CIS Iron Steel Rev. 2022, 24, 79–83. [Google Scholar] [CrossRef]
- Reid, R.C.; Sherwood, T.K. The Properties of Gases and Liquids; McGraw-Hill Book Co.: New York, NY, USA, 1958; 386p. [Google Scholar]
- Perry, J.H. Chemical Engineers’ Handbook; Mc Graw-Hill Education: New York, NY, USA, 1950. [Google Scholar]
- Viktorov, M.M. Methods for Calculating of Physical and Chemical Values and Applied Calculations; Chemistry: Moscow, Russia, 1977; p. 360. [Google Scholar]
- Sun, H.; Yang, J.; Lu, X.; Liu, W.; Ye, G.; Zhang, R.; Yang, W. Dephosphorization in double slag converter steelmaking process at different temperatures by industrial experiments. Metals 2021, 11, 1030. [Google Scholar] [CrossRef]
- Salina, V.; Baisanov, S.O. Temperature dependence of the specific heat, enthalpy, and entropy of melting of BaSi2, Mn11Si19, and Fe2Si. Izv. Nats. Akad. Nauk Resp. Kazakhstan Ser. Khim 2010, 7–10. [Google Scholar]
- Morachevsky, A.G.; Sladkova, I.B. Thermodynamic Calculations in Metallurgy: Reference Guide; Metallurgiya: Moscow, Russia, 1985; p. 137. [Google Scholar]
- Joubert, J.-M.; Kaplan, B.; Selleby, M. The specific heat of Al-based compounds, evaluation of the Neumann-Kopp rule and proposal for a modified Neumann-Kopp rule. Calphad 2023, 81, 102562. [Google Scholar] [CrossRef]
- Samoshkin, D.; Abdullaev, R.; Stankus, S.; Agazhanov, A.S. Heat capacity of magnesium-calcium alloys in the solid state. Thermophys. Aeromechanics 2023, 30, 575–580. [Google Scholar] [CrossRef]
- Krestovnikov, A.N.; Vladimirov, L.P.; Gulyanitskiy, B.S.; Fisher, A.Y. Reference Guide on Calculations of Equilibria of Metallurgical Reactions; Metallurgizdat: Moscow, Russia, 1963; p. 416. [Google Scholar]
- Mel’Nikova, S.; Isaenko, L.; Pashkov, V.; Pevnev, I. Phase transition in a KPb2Br5 crystal. Phys. Solid State 2005, 47, 332–336. [Google Scholar] [CrossRef]
- Baisanov, S.; Shabanov, Y.; Baisanov, A.; Issagulov, A.; Laurent, C. Diagram of phase structure of metallic system in liquid state. In Proceedings of the the Fourteenth International Ferroalloys Congress INFACON XIV, Kiev, Ukraine, 31 May–4 June 2015; pp. 540–547. [Google Scholar]
- Yasin, G.; Ibraheem, S.; Ali, S.; Arif, M.; Ibrahim, S.; Iqbal, R.; Kumar, A.; Tabish, M.; Mushtaq, M.; Saad, A. Defects-engineered tailoring of tri-doped interlinked metal-free bifunctional catalyst with lower gibbs free energy of OER/HER intermediates for overall water splitting. Mater. Today Chem. 2022, 23, 100634. [Google Scholar] [CrossRef]
- Wang, B.; Chen, L.-Q. Theory of strain phase equilibria and diagrams. Acta Mater. 2024, 274, 120025. [Google Scholar] [CrossRef]
- Makhambetov, Y.; Timirbayeva, N.; Baisanov, S.; Baisanov, A.; Shabanov, E. Thermodynamic modeling of phase composition for Fe-Ca-Si-Al system. Metalurgija 2021, 60, 117–120. [Google Scholar]
- Zhumagaliev Ye, B.S.; Chekimbaev, A.; Nurgali, N. Phase diagram of Ti-Fe-Al system. In Proceedings of the 12th International Ferroalloys Congress: Sustainable Future, Helsinki, Finland, 6–9 June 2010; pp. 653–656. [Google Scholar]
- Mekhtiev, A.; Shabanov, Y.; Issagulov, A.; Baissanov, S.; Baissanov, A.; Issagulova, D. Development of technology of complex aluminum-silicon-chrome alloy with utilization of off grade raw materials. Metalurgija 2015, 54, 157–160. [Google Scholar]
- Akberdin, A.; Kim, A.; Orlov, A.; Sultangaziev, R. Diagram of the phase composition of the Fe-Si-Al system and its isothermal sections. CIS Iron Steel Rev. 2022, 23, 76–80. [Google Scholar] [CrossRef]
- Nurgali, N.Z.; Kelamanov, B.S.; Tazhiyev, Y.B.; Sariyev, O.R.; Abdirashit, A.M.; Burumbayev, A.G.; Zayakin, O. Modeling of metal systems Fe-Ti, Ti-Si, Ti-Al. Vestnik KazNRTU 2021, 143, 115–121. [Google Scholar] [CrossRef]
- Kelamanov, B.S.; Zayakin, O.V.; Yessengaliev, D.A.; Kobegen, Y.; Adaybayeva, R.A.; Temirbekov, A.Z. Study of the Fe-Si-Al-Ba system using the thermodynamic-diagrammatic analyses method. Eng. J. Satbayev Univ. 2023, 145, 20–24. [Google Scholar] [CrossRef]
- Kelamanov, B.S.; Yessengaliyev, D.; Tazhiyev, Y.B.; Zayakin, O. Study of the Ti-Zr-Al-Si system by thermodynamic-diagram analysis and phase composition of ferrum-silicon-cyrconium alloy. Vestnik KazNRTU 2021, 143, 71–78. [Google Scholar] [CrossRef]
- Makhambetov, Y.; Abdirashit, A.; Kuatbay, Y.; Yerzhanov, A.; Issengaliyeva, G.; Angsapov, A. Research of microstructure and phase composition of a new complex alloy–alumosilicomanganese (Al-Si-Mn). Metalurgija 2022, 61, 804–806. [Google Scholar]
- Makhambetov, Y.; Abdirashit, A.; Kuatbay, Y.; Yerzhanov, A.; Mukhambetkaliyev, A.; Abishkenov, M. Thermodynamic diagrammatic analysis (TDA) of the system Al-Si-Mn-Fe. Metalurgija 2022, 61, 807–809. [Google Scholar]
- Nurgali, N.; Sariev, O.; Mukhambetkaliyev, A.; Momenov, B.; Kuandykova, A.; Abdrashev, R. Phase composition of titanium-containing raw materials depending on its titanium oxide content. Metalurgija 2021, 60, 374–376. [Google Scholar]
- Akberdin, A.; Kim, A.; Sultangaziev, R.; Orlov, A. The method of mathematical description of the phase composition diagrams. CIS Iron Steel Rev. 2023, 25, 79–83. [Google Scholar] [CrossRef]
- Issagulov, A.Z.; Baisanov, C.O.; Baisanov, A.C.; Azotte, A.; Shabanov, E.Z. Analytical expressions of the Fe-Al-Si-Cr system and the phase composition of the complex aluminum-silicon-chromium alloy. Proc. Univ. Karaganda 2016, 2, 18–22. [Google Scholar]


| Compounds | ∆Hmel., kJ/mol | ∆Smel., J/(mol∙K) | , J/(mol∙K) | Tmel., K |
|---|---|---|---|---|
| Cr2Al | −33.0 | 75.31 | 77.58 | 298 |
| 76.727 | 64.86 | 27.32 | 1183 | |
| Fe2Al5 | −200.83 | 206.37 | 197.76 | 298 |
| 100.08 | 69.31 | 254.49 | 1444 | |
| FeSi | −76.57 | 46.024 | 48.53 | 298 |
| 70.103 | 41.8 | 87.51 | 1678 | |
| Cr3Si | −138.07 | 86.61 | 90.41 | 298 |
| 131.284 | 74.17 | 28.15 | 1770 | |
| Cr5Si3 | −326.57 | 182.5 | 291.77 | 298 |
| 126.364 | 73.47 | 269.35 | 1720 | |
| CrSi2 | −100.42 | 55.65 | 63.59 | 298 |
| 102.959 | 69.8 | 27.75 | 1475 |
| Compounds | Coordinates Based on Mass Fraction × 1000 | |||
|---|---|---|---|---|
| Cr | Fe | Al | Si | |
| Cr | 1000 | 0 | 0 | 0 |
| Fe | 0 | 1000 | 0 | 0 |
| Al | 0 | 0 | 1000 | 0 |
| Si | 0 | 0 | 0 | 1000 |
| FeAl | 0 | 675 | 325 | 0 |
| Fe2Al5 | 0 | 453 | 547 | 0 |
| FeAl3 | 0 | 409 | 591 | 0 |
| Fe2Si | 0 | 800 | 0 | 200 |
| Fe5Si3 | 0 | 769 | 0 | 231 |
| FeSi | 0 | 667 | 0 | 333 |
| FeSi2 | 0 | 500 | 0 | 500 |
| CrAl7 | 216 | 0 | 784 | 0 |
| Cr2Al11 | 259 | 0 | 741 | 0 |
| CrAl4 | 325 | 0 | 675 | 0 |
| Cr4Al9 | 461 | 0 | 539 | 0 |
| Cr5Al8 | 546 | 0 | 454 | 0 |
| Cr2Al | 790 | 0 | 210 | 0 |
| Cr3Si | 848 | 0 | 0 | 152 |
| Cr5Si3 | 755 | 0 | 0 | 245 |
| CrSi | 650 | 0 | 0 | 350 |
| CrSi2 | 481 | 0 | 0 | 519 |
| Equation of Reaction | ∆G02500, (kJ/mol) |
|---|---|
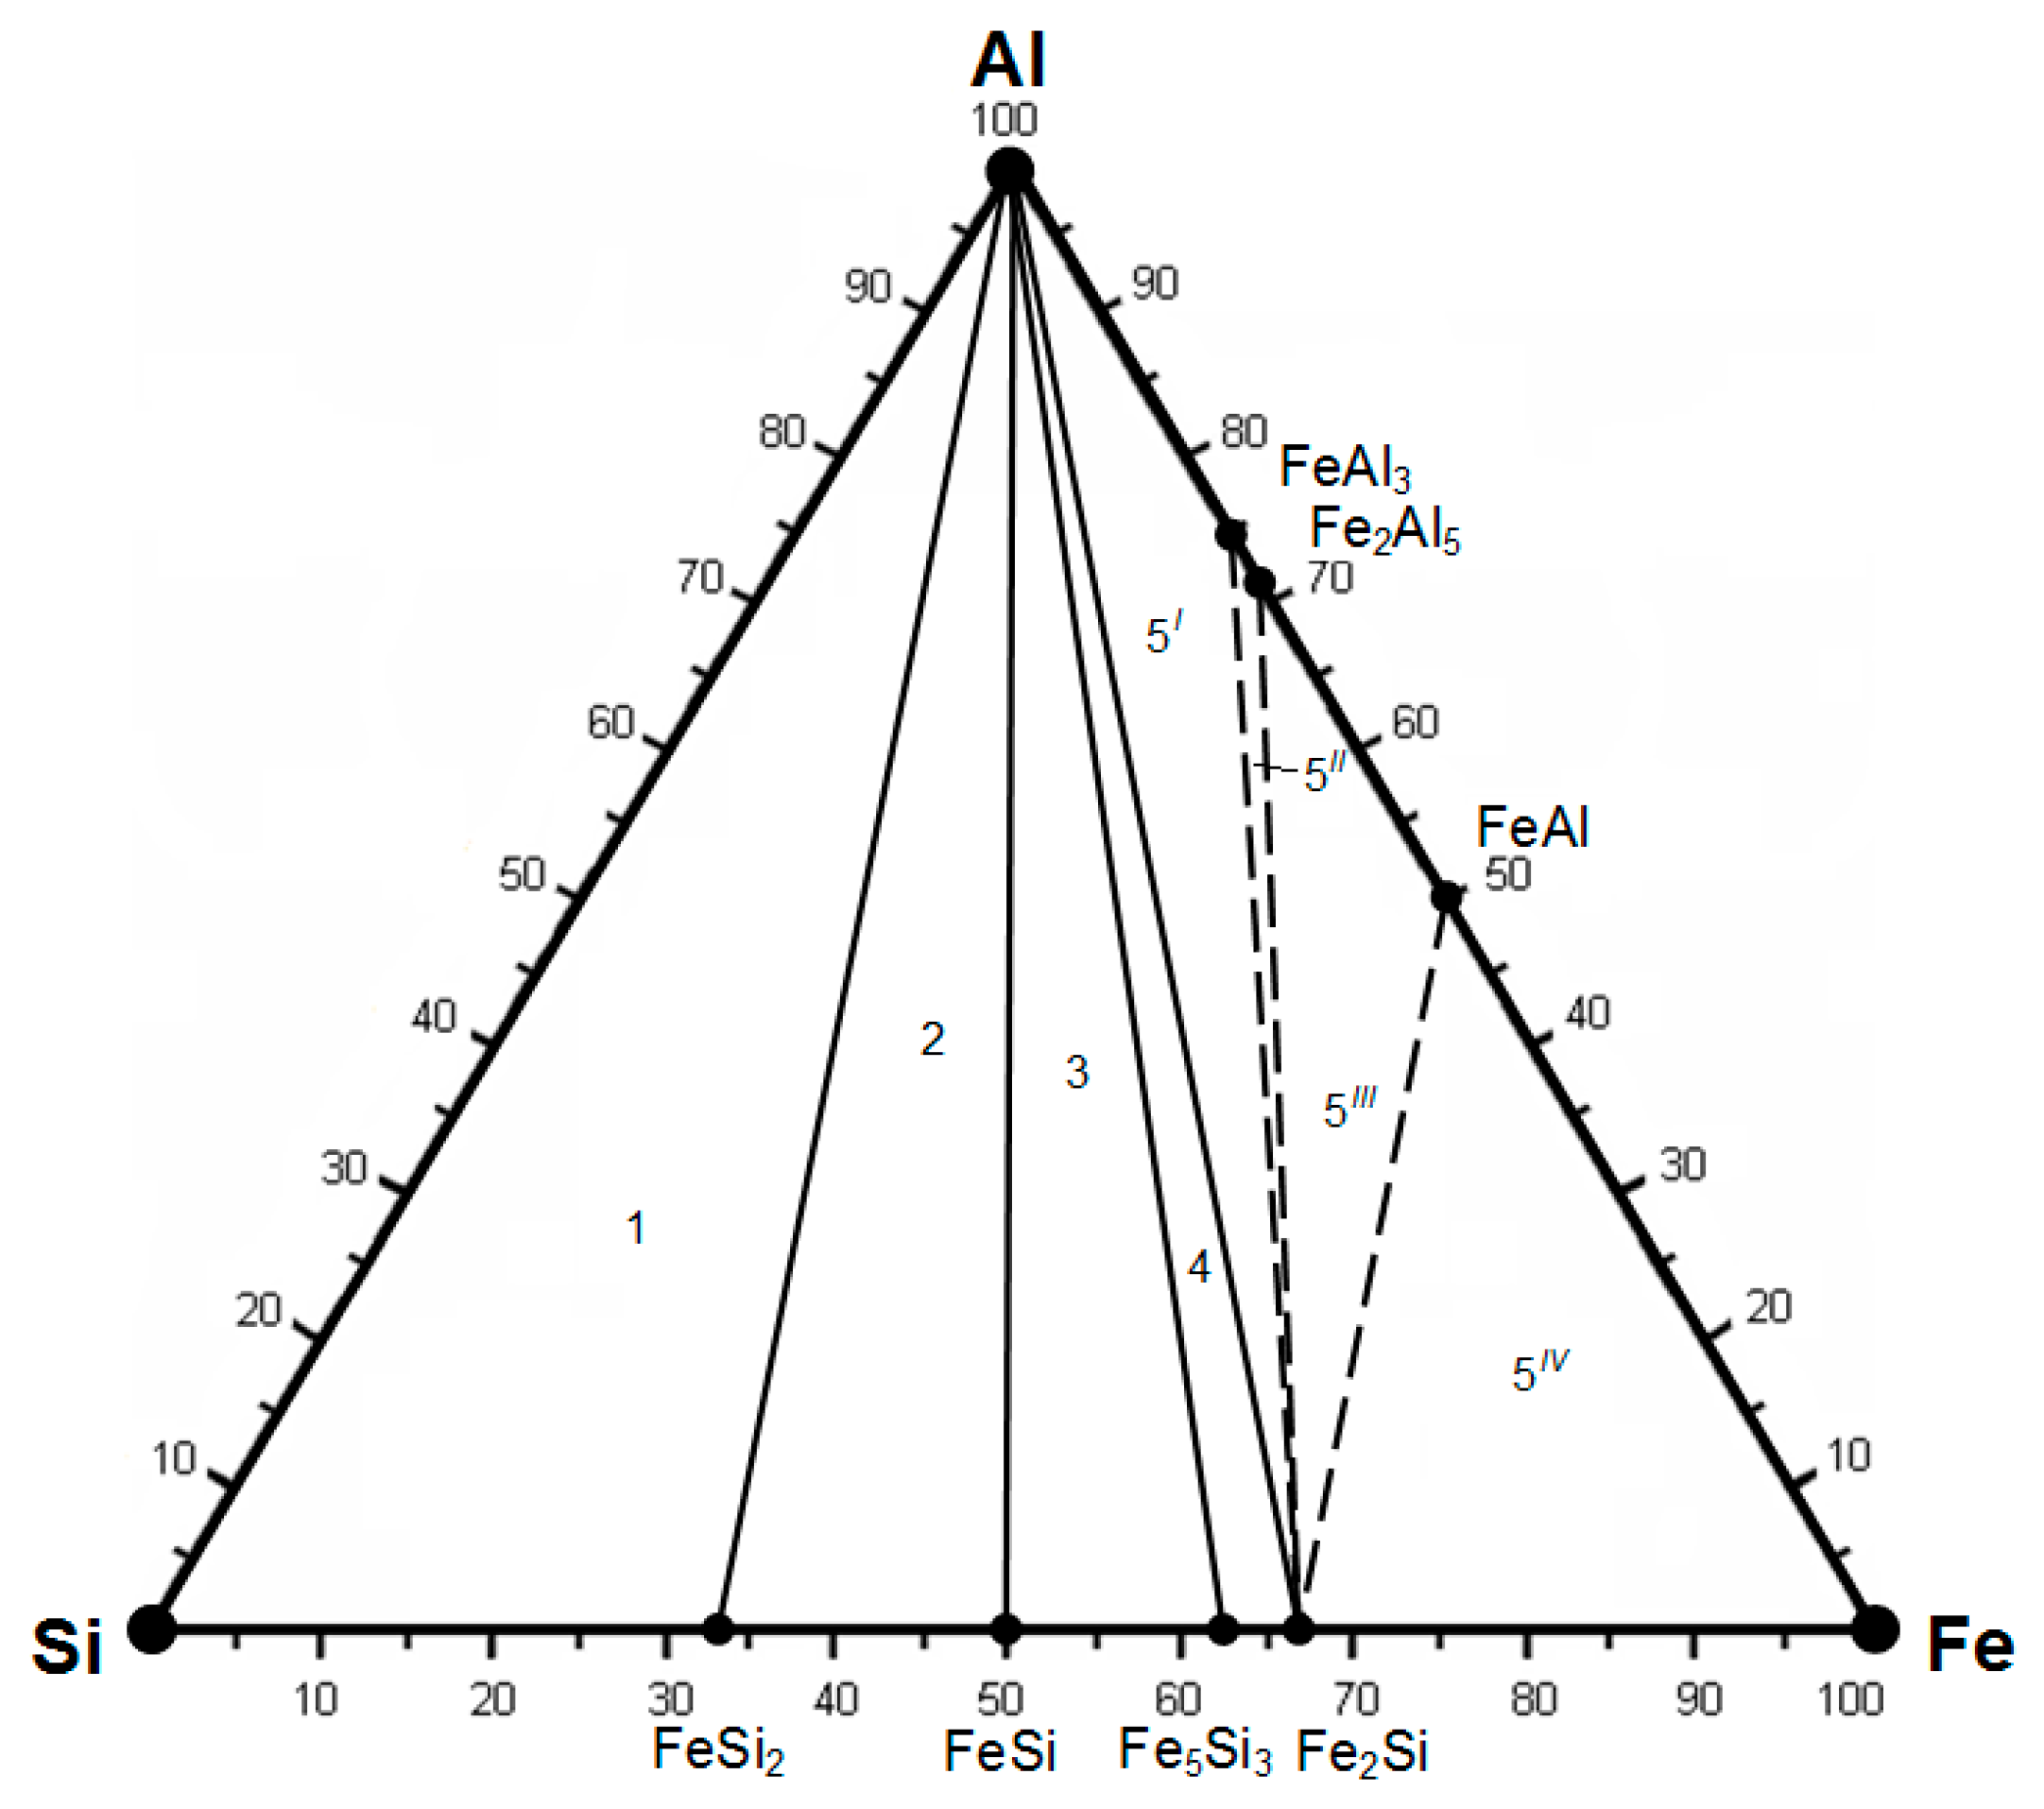
| 3Al + FeSi2 = FeAl3 + 2Si | 112.61 |
| FeAl3 + FeSi2 = 3Al + 2FeSi | −40.52 |
| 2FeAl3 + 3FeSi = 6Al + Fe5Si3 | −93.33 |
| FeAl3 + Fe5Si3 = 3Al + 3Fe2Si | −39.12 |
| Equation of Reaction | ∆G02500, (kJ/mol) |
|---|---|
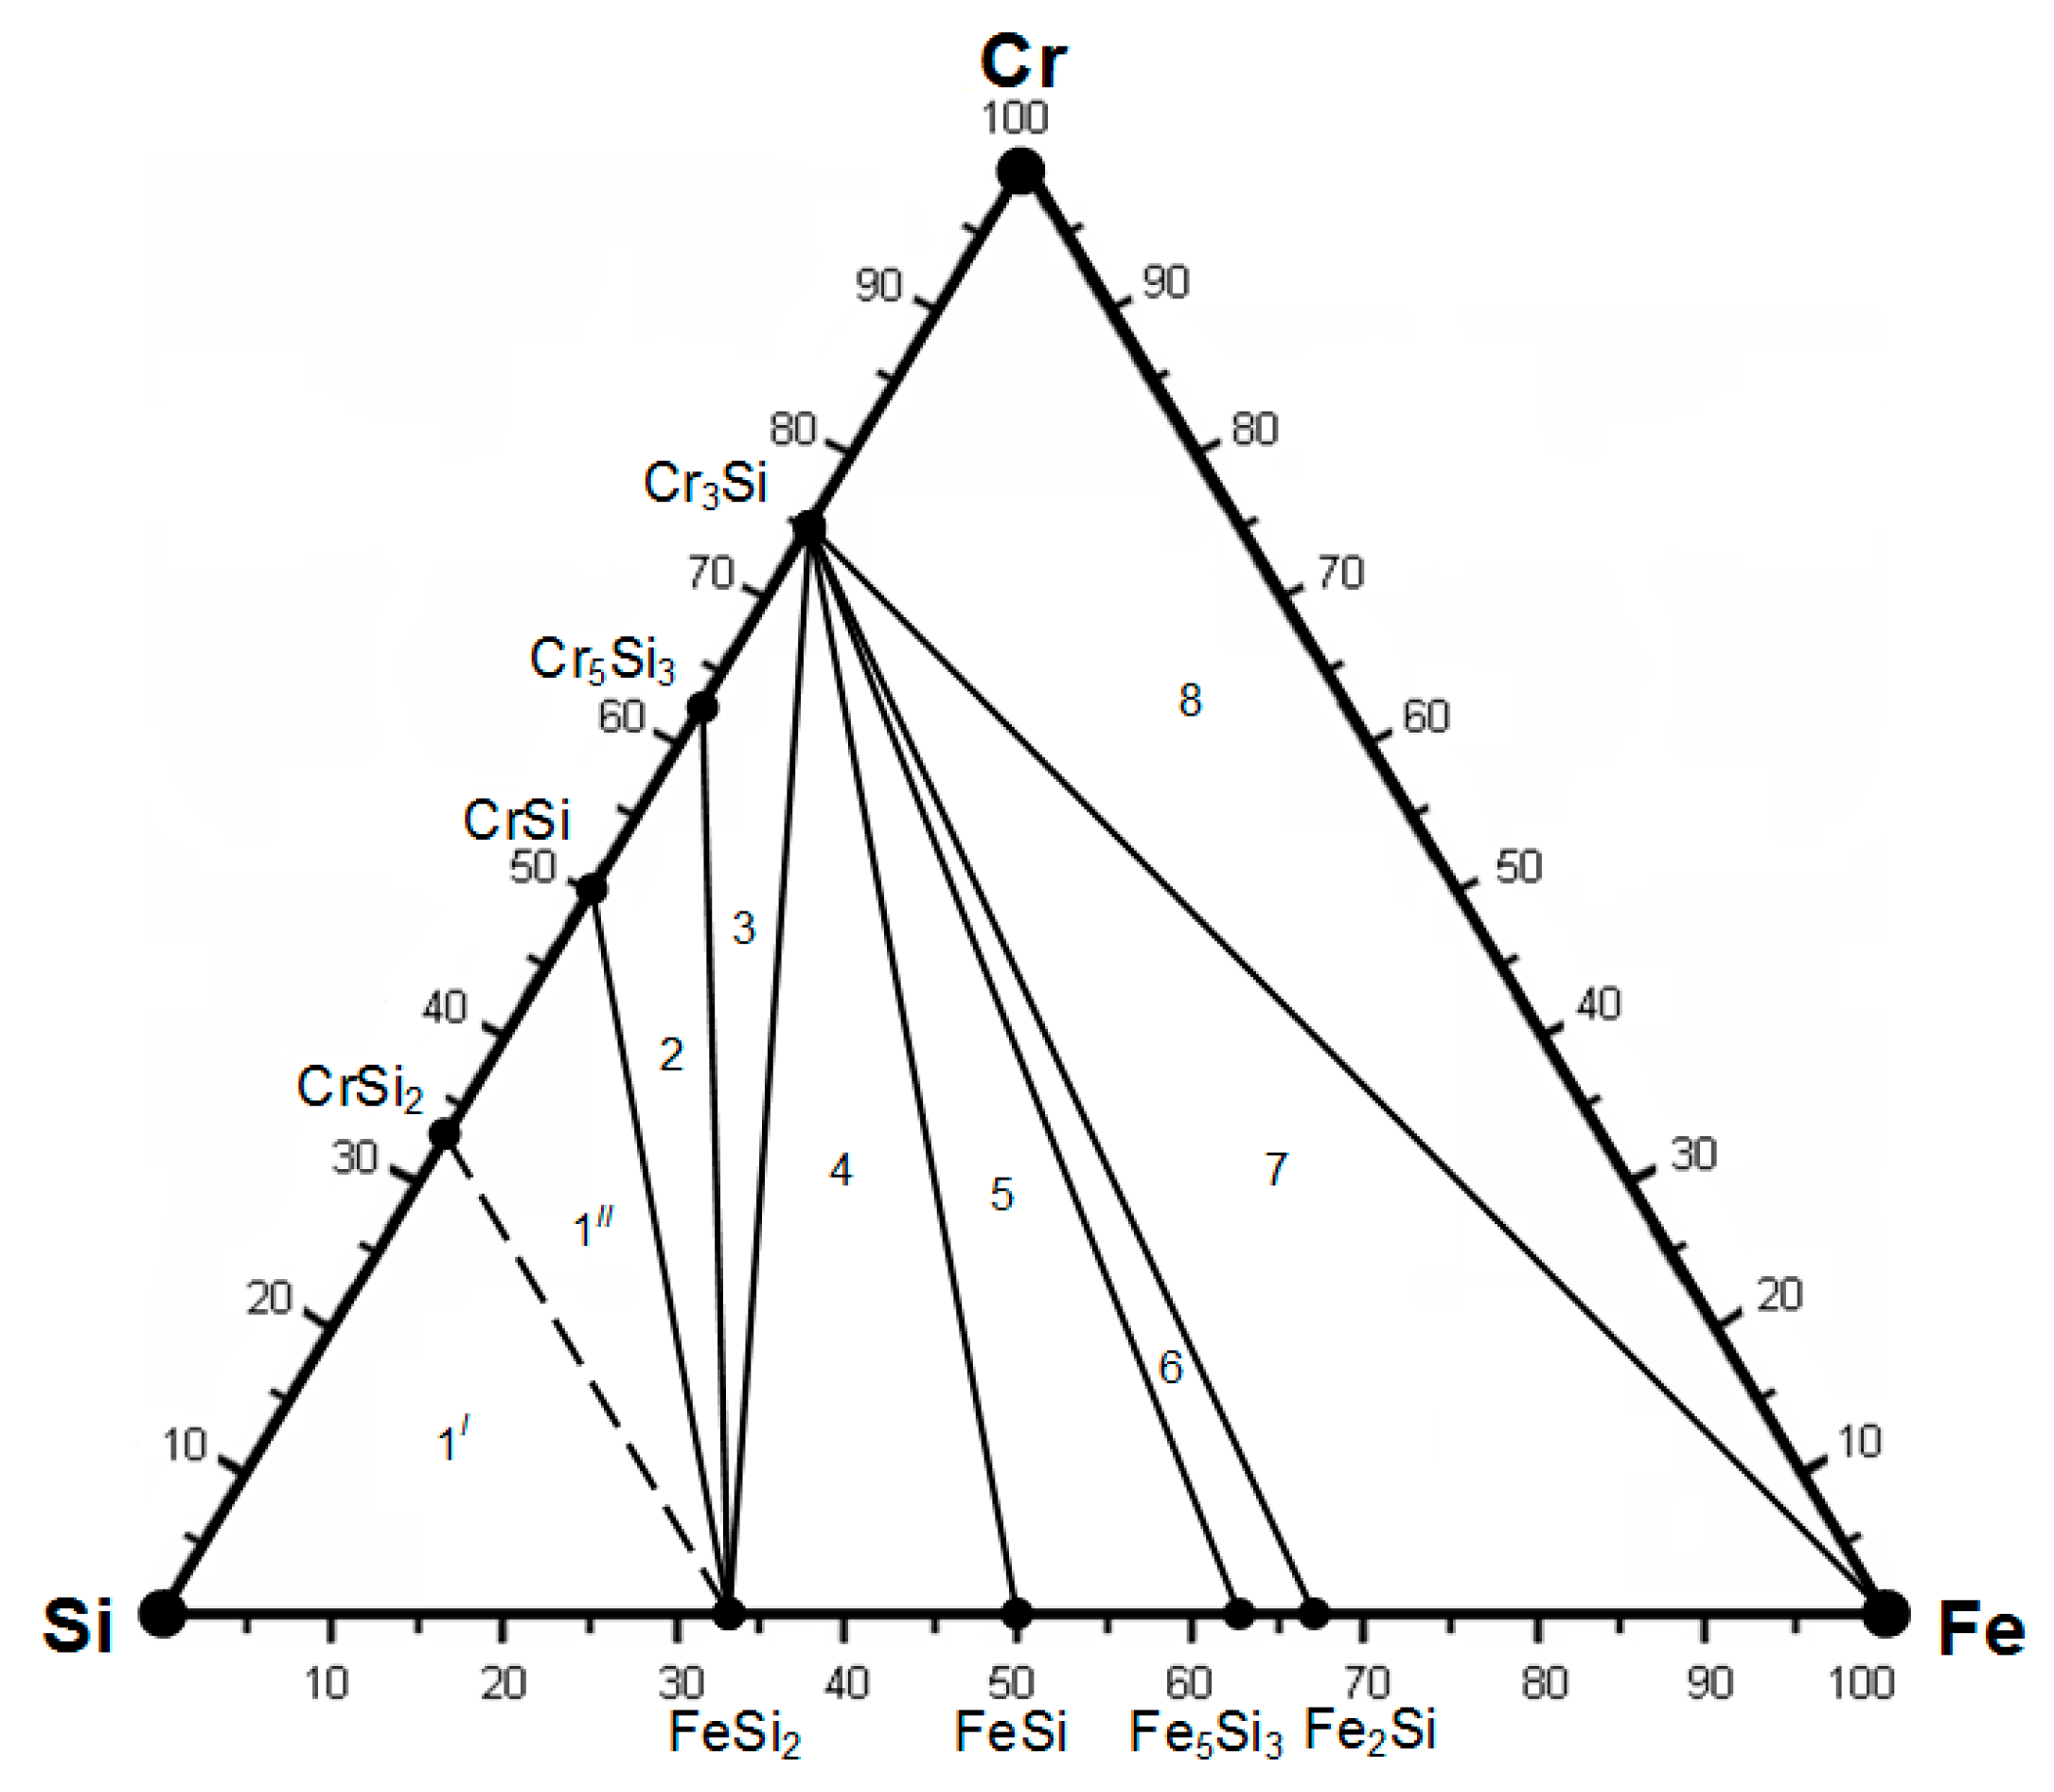
| FeSi + CrSi2 = FeSi2 + CrSi | −45.77 |
| 2FeSi + 5CrSi = 2FeSi2 + Cr5Si3 | −32.06 |
| 4FeSi + 3Cr5Si3 = 4FeSi2 + 5Cr3Si | −70.95 |
| FeSi + Cr3Si = FeSi2 + 3Cr | 14.61 |
| Fe5Si3 + 2Cr3Si = 5FeSi + 6Cr | 39.79 |
| 5Fe2Si + Cr3Si = 2Fe5Si3 + 3Cr | 7.09 |
| 2Fe + Cr3Si = Fe2Si + 3Cr | 41.24 |
| Equation of Reaction | ∆G02500, (kJ/mol) |
|---|---|
| Fe + Cr2Al = FeAl + 2Cr | −71.62 |
| Fe2Al5 + 6Cr = 2FeAl + 3Cr2Al | 338.09 |
| 2FeAl3 + 3Cr = Fe2Al5 + Cr2Al | −282.52 |
| 11FeAl3 + 2.5Cr2Al = 5.5Fe2Al5 + Cr5Al8 | −1614.65 |
| 26FeAl3 + 4Cr5Al8 = 13Fe2Al5 + 5Cr4Al9 | −3489.90 |
| 14FeAl3 + Cr4Al9 = 7Fe2Al5 + 4CrAl4 | −2194.17 |
| 3FeAl3 + CrAl4 = 1.5Fe2Al5 + 0.5Cr2Al11 | −388.55 |
| 3FeAl3 + 0.5Cr2Al11 = 1.5Fe2Al5 + CrAl7 | −440.55 |
| Equation of Reaction | ∆G02500, (kJ/mol) |
|---|---|
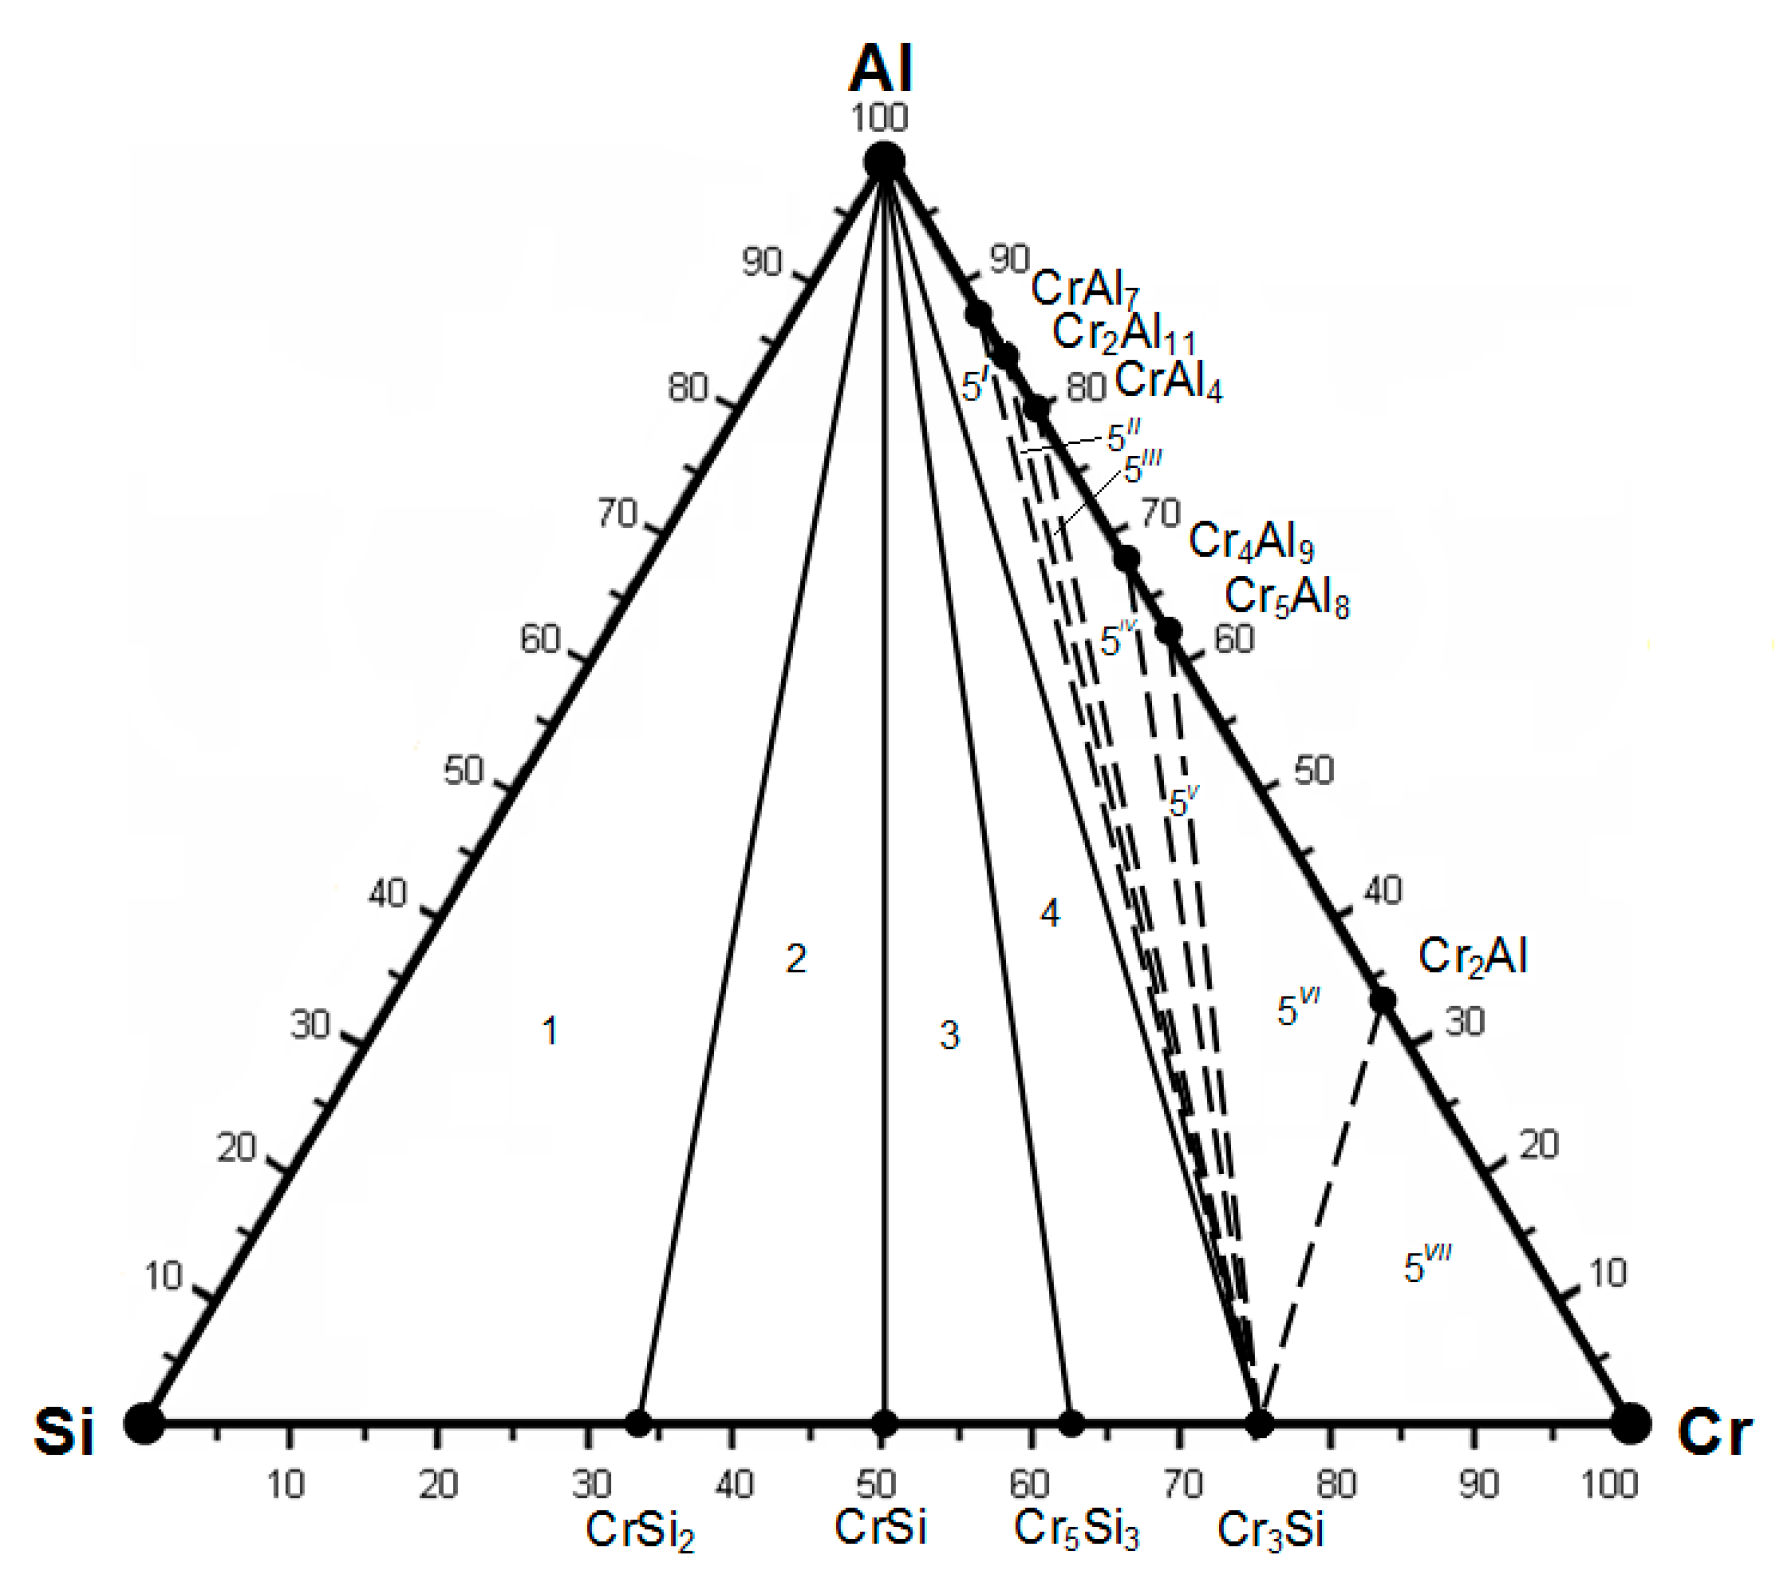
| 2Si + CrAl7 = CrSi2 + 7Al | −190.22 |
| CrSi2 + CrAl7 = 2CrSi + 7Al | −214.37 |
| 3CrSi + 2CrAl7 = Cr5Si3 + 14Al | −339.78 |
| 0.5Cr5Si3 + 2CrAl7 = 1.5Cr3Si + 14Al | −359.51 |
| System | Initial Triangles | ||
|---|---|---|---|
| Boundary | 1 | 6 | 16 |
| Si-AlFe | FeSi2-Al-Si | Fe5Si3-Al-FeSi | – |
| Si-Cr-Fe | FeSi2-CrSi2-Si | Fe5Si3-Cr3Si-FeSi | – |
| Fe-Al-Cr | – | – | Fe2Al5-Cr4Al9-Cr5Al8 |
| Si-Al-Cr | Si-Al-CrSi2 | – | Cr3Si-Cr4Al9-Cr5Al8 |
| General | The resulting tetrahedra | ||
| Fe-Cr-Si-Al | Si-FeSi2-Al-CrSi2 | Fe5Si3-FeSi-Al-Cr3Si | Fe2Al5-Cr4Al9-Cr5Al8-Cr3Si |
| Tetrahedra No. | Tetrahedra | Elementary Volumes |
|---|---|---|
| 1 | Si-FeSi2-Al-CrSi2 | 0.2405 |
| 2 | CrSi2-FeSi2-CrSi-Al | 0.0845 |
| 3 | CrSi-Cr5Si3-Al-FeSi2 | 0.0525 |
| 4 | Cr5Si3-Cr3Si-Al-FeSi2 | 0.0465 |
| 5 | FeSi-FeSi2-Al-Cr3Si | 0.1416 |
| 6 | Fe5Si3-FeSi-Al-Cr3Si | 0.0865 |
| 7 | Fe2Si-Fe5Si3-Al-Cr3Si | 0.0263 |
| 8 | FeAl3-Al-Cr3Si-Fe2Si | 0.0693 |
| 9 | FeAl3-Fe2Al5-Cr3Si-Fe2Si | 0.0074 |
| 10 | Fe2Al5-FeAl-Cr3Si-Fe2Si | 0.0376 |
| 11 | FeAl-Fe-Cr3Si-Fe2Si | 0.0551 |
| 12 | Fe-Cr-Cr3Si-FeAl | 0.0494 |
| 13 | FeAl-Fe2Al5-Cr-Cr3Si | 0.0337 |
| 14 | Fe2Al5-Cr-Cr3Si-Cr2Al | 0.0144 |
| 15 | Fe2Al5-Cr2Al-Cr5Al8-Cr3Si | 0.0168 |
| 16 | Fe2Al5-Cr4Al9-Cr5Al8-Cr3Si | 0.0058 |
| 17 | Fe2Al5-CrAl4-Cr4Al9-Cr3Si | 0.0093 |
| 18 | Fe2Al5-Cr2Al11-CrAl4-Cr3Si | 0.0045 |
| 19 | Fe2Al5-CrAl7-Cr2Al11-Cr3Si | 0.0029 |
| 20 | FeAl3-Fe2Al5-CrAl7-Cr3Si | 0.0014 |
| 21 | Al-FeAl3-CrAl7-Cr3Si | 0.0134 |
| Amount | 0.9994 | |
| Initial Components | Coefficients | Polytopes, Their Volumes and Transformation Coefficients | ||||||||||
| 1 | 2 | 3 | 4 | 5 | 6 | 7 | 8 | 9 | 10 | 11 | ||
| Si FeSi2 Al CrSi2 | CrSi CrSi2 Al FeSi2 | CrSi Cr5Si3 Al FeSi2 | Cr5Si3 Cr3Si Al FeSi2 | FeSi Cr3Si Al FeSi2 | FeSi Cr3Si Al Fe5Si3 | Fe2Si Cr3Si Al Fe5Si3 | FeAl3 Al Cr3Si Fe2Si | FeAl3 Fe2Al5 Cr3Si Fe2Si | FeAl Fe2Al5 Cr3Si Fe2Si | FeAl Fe Cr3Si Fe2Si | ||
| Volumes | 0.2405 | 0.0845 | 0.0525 | 0.0465 | 0.141616 | 0.086496 | 0.026288 | 0.069366 | 0.007462 | 0.037651 | 0.05512 | |
| Cr | a1 | −1.079 | −2.84615 | 7.19048 | −1.6344 | −2.994 | 7.53922 | −24.8065 | 1.75301 | −8.91337 | 1.76662 | 0 |
| a2 | 0 | 3.84615 | −6.1905 | 2.63441 | 0 | 0 | 0 | −1.03603 | 9.63036 | −1.04963 | 0.71698 | |
| a3 | 0 | 0 | 0 | 0 | 0 | 0 | 0 | 1.17925 | 1.17925 | 1.17925 | 1.17925 | |
| a4 | 2.079 | 0 | 0 | 0 | 3.99401 | −6.5392 | 25.8065 | −0.89623 | −0.89623 | −0.89623 | −0.8962 | |
| Fe | b1 | −1 | 2.84615 | −7.1905 | −9.1183 | 2.99401 | −2.2647 | 7.45161 | 2.44499 | −12.4318 | 2.46396 | 0 |
| b2 | 2 | −3.84615 | 6.19048 | 8.11828 | 0 | 0 | 0 | −1.44499 | 13.4318 | −1.46396 | 1 | |
| b3 | 0 | 0 | 0 | 0 | 0 | 0 | 0 | 0 | 0 | 0 | 0 | |
| b4 | 0 | 2 | 2 | 2 | −1.994 | 3.26471 | −6.45161 | 0 | 0 | 0 | 0 | |
| Al | c1 | 0 | 0 | 0 | 0 | 0 | 0 | 0 | 0 | 10.2955 | −2.04054 | 3.07692 |
| c2 | 0 | 0 | 0 | 0 | 0 | 0 | 0 | 1 | −9.29545 | 3.04054 | −2.0769 | |
| c3 | 1 | 1 | 1 | 1 | 1 | 1 | 1 | 0 | 0 | 0 | 0 | |
| c4 | 0 | 0 | 0 | 0 | 0 | 0 | 0 | 0 | 0 | 0 | 0 | |
| Si | d1 | 1 | 3.07101 | −2.3333 | 9.11828 | 0.53666 | −1.3514 | 4.44644 | −9.77995 | 49.7272 | −9.85586 | 0 |
| d2 | 0 | −2.07101 | 3.33333 | −8.1183 | 1.17925 | 1.17925 | 1.17925 | 5.77995 | −53.7273 | 5.85586 | −4 | |
| d3 | 0 | 0 | 0 | 0 | 0 | 0 | 0 | 0 | 0 | 0 | 0 | |
| d4 | 0 | 0 | 0 | 0 | −0.7159 | 1.17212 | −4.62568 | 5 | 5 | 5 | 5 | |
| Initial Components | Coefficients | Polytopes, Their Volumes and Transformation Coefficients | ||||||||||
| 12 | 13 | 14 | 15 | 16 | 17 | 18 | 19 | 20 | 21 | |||
| Fe Cr Cr3Si FeAl | FeAl Fe2Al5 Cr Cr3Si | Fe2Al5 Cr Cr3Si Cr2Al | Fe2Al5 Cr5Al8 Cr3Si Cr2Al | Fe2Al5 Cr4Al9 Cr5Al8 Cr4Al9 | Fe2Al5 CrAl4 Cr3Si Cr4Al9 | Fe2Al5 CrAl4 Cr3Si Cr2Al11 | Fe2Al5 CrAl7 Cr3Si Cr2Al11 | FeAl3 Fe2Al5 CrAl7 Cr3Si | FeAl3 Al CrAl7 Cr3Si | |||
| Volumes | 0.0494 | 0.033744 | 0.01446 | 0.016801 | 0.005853 | 0.009364 | 0.004544 | 0.002961 | 0.001445 | 0.013428 | ||
| Cr | a1 | 0 | −2.0405 | 0 | 0 | 0 | 0 | 0 | 0 | −37.3687 | 0 | |
| a2 | 1 | 3.04054 | 1 | −0.86066 | 6.34118 | −3.96323 | 11.2273 | −17.2326 | 33.7391 | −3.6296 | ||
| a3 | 0 | 0 | 0 | 0 | 0 | 0 | 0 | 0 | 4.62963 | 4.62963 | ||
| a4 | 0 | 0 | 0 | 1.86066 | −5.3412 | 4.96323 | −10.2273 | 18.2326 | 0 | 0 | ||
| Fe | b1 | 1 | 0 | 2.20751 | 2.20751 | 2.20751 | 2.20751 | 2.20751 | 2.20751 | −12.4318 | 2.44499 | |
| b2 | 0 | 0 | 4.54252 | −3.90955 | 6.54894 | −4.09309 | 4.73854 | −7.27311 | 13.4318 | −1.445 | ||
| b3 | 0 | −5.579 | 0 | 0 | 0 | 0 | 0 | 0 | 0 | 0 | ||
| b4 | 0 | 6.57895 | −5.75 | 2.70204 | −7.7565 | 2.88558 | −5.94605 | 6.06561 | 0 | 0 | ||
| Al | c1 | −2.0769 | 0 | 0 | 0 | 0 | 0 | 0 | 0 | 10.2955 | 0 | |
| c2 | 0 | 0 | −3.7619 | 3.2377 | −5.4235 | 3.38971 | −3.92424 | 6.02325 | −9.29545 | 1 | ||
| c3 | 0 | 1 | 0 | 0 | 0 | 0 | 0 | 0 | 0 | 0 | ||
| c4 | 3.07692 | 0 | 4.7619 | −2.2377 | 6.42353 | −2.38971 | 4.92424 | −5.02326 | 0 | 0 | ||
| Si | d1 | 0 | 2.46396 | 0 | 0 | 0 | 0 | 0 | 0 | 208.478 | 0 | |
| d2 | −5.579 | −1.464 | −5.579 | 4.80155 | −35.377 | 22.1107 | −62.6364 | 96.1395 | −188.228 | 20.2495 | ||
| d3 | 6.57895 | 0 | 6.57895 | 6.57895 | 6.57895 | 6.57895 | 6.57895 | 6.57895 | −25.8285 | −25.828 | ||
| d4 | 0 | 0 | 0 | −10.3805 | 29.7982 | −27.6896 | 57.0574 | −101.719 | 6.57895 | 6.57895 | ||
| Material | The Chemical Composition, % | ||||||||
|---|---|---|---|---|---|---|---|---|---|
| Cr | Si | Al | Fe | C | P | S | Ti | Ca | |
| Complex aluminum–silicon–chromium alloy | |||||||||
| AS65Cr15 | 15.71 | 53.4 | 10.47 | 13.25 | 0.54 | 0.037 | 0.07 | 0.58 | 1.40 |
| AS65Cr20 | 20.33 | 48.48 | 13.21 | 15.09 | 0.75 | 0.028 | 0.047 | 0.66 | 1.10 |
| AS60Cr25 | 25.5 | 49.41 | 10.79 | 11.25 | 0.40 | 0.046 | 0.033 | 0.31 | 0.86 |
| AS60Cr30 | 28.95 | 47.15 | 10.12 | 11.25 | 0.56 | 0.05 | 0.04 | 0.42 | 0.94 |
| Complex aluminum–chromium–silicon (ACS) alloy | |||||||||
| ACS No.1 alloy | 33.4 | 23.57 | 13.07 | 24.29 | 0.69 | 0.10 | 0.006 | - | 0.06 |
| ACS No.2 alloy | 41.88 | 27.42 | 10.73 | 16.62 | 0.58 | 0.08 | 0.005 | - | 0.16 |
| ACS No.3 alloy | 61.61 | 14.40 | 0.17 | 15.39 | 0.35 | - | 0.004 | - | 0.32 |
| Material | The Standard Phase Composition, % | Tetrahedron | Volume | |||||||||
|---|---|---|---|---|---|---|---|---|---|---|---|---|
| Si | FeSi2 | Al | CrSi2 | CrSi | Cr5Si3 | FeAl | Fe | Cr3Si | Fe2Si | |||
| Complex aluminum–silicon–chromium alloy | ||||||||||||
| AS65Cr15 | 25.0 | 28.54 | 11.28 | 35.18 | - | - | - | - | - | - | Si-FeSi2-Al-CrSi2 (No.1) | 0.2405 |
| AS65Cr20 | 11.78 | 31.08 | 13.6 | 43.53 | - | - | - | - | - | - | Si-FeSi2-Al-CrSi2 (No.1) | 0.2405 |
| AS60Cr25 | 10.99 | 23.2 | 11.13 | 54.68 | - | - | - | - | - | - | Si-FeSi2-Al-CrSi2 (No.1) | 0.2405 |
| AS60Cr30 | 17.69 | 23.08 | 10.38 | 48.85 | - | - | - | - | - | - | Si-FeSi2-Al-CrSi2 (No.1) | 0.2405 |
| Complex aluminum–chromium–silicon (ACS) alloy | ||||||||||||
| ACS No.1 alloy | - | 51.5 | 13.85 | - | 11.15 | 23.50 | - | - | - | - | CrSi-Cr5Si3-Al-FeSi2 (No.3) | 0.0525 |
| ACS No.2 alloy | - | 34.4 | 11.1 | 41.74 | 12.75 | - | - | - | - | - | CrSi2-FeSi2-CrSi-Al (No.2) | 0.0845 |
| ACS No.3 alloy | - | - | - | - | - | - | 0.55 | 1.75 | 79.34 | 18.35 | FeAl-Fe-Cr3Si-Fe2Si (No.11) | 0.05512 |
| Name | Component, % | |||
|---|---|---|---|---|
| Cr | Si | Al | Fe | |
| Aluminum–silicon–chromium grade: AS65Cr15 | 16.92 | 57.53 | 11.28 | 14.27 |
| Aluminum–silicon–chromium grade: AS65Cr20 | 20.94 | 49.92 | 13.6 | 15.54 |
| Aluminum–silicon–chromium grade: AS60Cr25 | 26.3 | 50,97 | 11.13 | 11.6 |
| Aluminum–silicon–chromium grade: AS60Cr30 | 29.7 | 48.38 | 10.38 | 11.54 |
| ACS No.1 alloy | 35.41 | 24.99 | 13.85 | 25.75 |
| ACS No.2 alloy | 43.33 | 28.37 | 11.10 | 17.20 |
| ACS No.3 alloy | 67.28 | 15.73 | 0.18 | 16.81 |
Disclaimer/Publisher’s Note: The statements, opinions and data contained in all publications are solely those of the individual author(s) and contributor(s) and not of MDPI and/or the editor(s). MDPI and/or the editor(s) disclaim responsibility for any injury to people or property resulting from any ideas, methods, instructions or products referred to in the content. |
© 2024 by the authors. Licensee MDPI, Basel, Switzerland. This article is an open access article distributed under the terms and conditions of the Creative Commons Attribution (CC BY) license (https://creativecommons.org/licenses/by/4.0/).
Share and Cite
Shabanov, Y.; Zhumagaliyev, Y.; Nurgali, N.; Dossekenov, M.; Almuratova, K.; Orynbassar, R.; Kainenova, T.; Bakirova, B.; Kanapiyeva, F.; Zhunussova, E. Exploring Alloy Composition Dynamics: Thermodynamic Analysis of Fe-Al-Si-Cr System in Homogeneous Liquid State. Processes 2024, 12, 1947. https://doi.org/10.3390/pr12091947
Shabanov Y, Zhumagaliyev Y, Nurgali N, Dossekenov M, Almuratova K, Orynbassar R, Kainenova T, Bakirova B, Kanapiyeva F, Zhunussova E. Exploring Alloy Composition Dynamics: Thermodynamic Analysis of Fe-Al-Si-Cr System in Homogeneous Liquid State. Processes. 2024; 12(9):1947. https://doi.org/10.3390/pr12091947
Chicago/Turabian StyleShabanov, Yerbol, Yerlan Zhumagaliyev, Nurzhan Nurgali, Murat Dossekenov, Karlyga Almuratova, Raigul Orynbassar, Tursyngul Kainenova, Botagoz Bakirova, Fatima Kanapiyeva, and Elvira Zhunussova. 2024. "Exploring Alloy Composition Dynamics: Thermodynamic Analysis of Fe-Al-Si-Cr System in Homogeneous Liquid State" Processes 12, no. 9: 1947. https://doi.org/10.3390/pr12091947
APA StyleShabanov, Y., Zhumagaliyev, Y., Nurgali, N., Dossekenov, M., Almuratova, K., Orynbassar, R., Kainenova, T., Bakirova, B., Kanapiyeva, F., & Zhunussova, E. (2024). Exploring Alloy Composition Dynamics: Thermodynamic Analysis of Fe-Al-Si-Cr System in Homogeneous Liquid State. Processes, 12(9), 1947. https://doi.org/10.3390/pr12091947