Article

Study on the Evolution Law and Theoretical Solution of a Freezing Temperature Field in Transcritical CO2 Ultra-Low Temperature Formation

1
Engineering Research Center of Mine Underground Engineering Ministry of Education, Anhui University of Science and Technology, Huainan 232001, China
2
School of Civil Engineering and Architecture, Anhui University of Science and Technology, Huainan 232001, China
3
Henan Key Laboratory of Underground Engineering and Disaster Control, Henan Polytechnic University, Jiaozuo 454000, China
4
Anhui Provincial Key Laboratory of Building Structure and Underground Engineering, Anhui Jianzhu University, Hefei 230601, China
*
Author to whom correspondence should be addressed.
Processes 2025, 13(4), 1154; https://doi.org/10.3390/pr13041154
Submission received: 10 March 2025 / Revised: 3 April 2025 / Accepted: 7 April 2025 / Published: 10 April 2025

Abstract

:
This study explored the feasibility of applying transcritical CO2 in an artificial ground freezing method. By carrying out indoor modeling tests, the temperature field evolution law and the development characteristics of the freezing front during the freezing process of transcritical CO2 in a sand layer were analyzed, and the freezing effect of transcritical CO2 was compared with that of traditional alcohol. The theoretical solution of the freezing temperature field was derived, and the accuracy of the theoretical analytical solution was verified by test results. The results showed that the freezing efficiency of transcritical CO2 was significantly higher than that of alcohol. After 6 h of freezing, the temperature range of the measuring point (C1–C7/C10–C16) can reach −28 °C–3.5 °C, and the freezing front radius exceeded 60 mm. The temperature range of the alcohol measuring point (J1–J7/J10–J16) was only −12.6 °C–8.8 °C, and it took 24 h to achieve the same radius. The test data were in good agreement with the theoretically predicted values, verifying the rationality of the theoretical formula. Freezing temperature Td had a significant influence on the calculation results of freezing front radius. After transcritical CO2 freezing for 24 h, the difference in the freezing front radius R(Td = −2) reached 8.02 mm when the freezing temperature Td was −2 °C and 0 °C. The difference in the freezing front radius caused by the freezing temperature Td was concentrated in the range of 1.5–8.1 mm, and the difference in the effect on different types of refrigerants was small. The research results not only confirm the feasibility of the application of transcritical CO2 in the freezing method but also provide test data and experience for engineering applications, which promotes the innovation and development of freezing method technology.

1. Introduction

With the acceleration of urbanization and rapid development of infrastructure construction in China, the role of foundation reinforcement technology in engineering projects has become increasingly prominent. Particularly in tunnel and subway construction, the freezing method [1,2,3,4,5] has been widely adopted owing to its unique advantages. This technique utilizes artificial refrigeration to form a freezing curtain within the soil layer, thereby consolidating the formation, isolating the groundwater, and stabilizing the construction environment.
Brine and liquid nitrogen are often used as refrigerants in freezing method construction technology [6,7,8,9]. Brine freezing is widely adopted in freezing construction because of its simple operation and low cost. However, the efficiency of brine freezing is constrained by the freezing depth and the complexity of the construction environment. In particular, when facing high velocity formations [10,11,12], brine freezing leads to slow development of the frozen wall, prolonging the closure time of the frozen wall or even failing to intersect the ring. Liquid nitrogen’s freezing temperature can reach −80 °C, which enables rapid freezing. However, the latent heat of evaporation of liquid nitrogen is small, resulting in uneven diffusion of water in the soil layer, which easily causes uneven freezing. In addition, the production and storage costs of liquid nitrogen are relatively high, and there are certain safety risks during operation. In view of the above problems, there is an urgent need for a safe and environmentally friendly refrigeration medium, and CO2 as a natural refrigerant has begun to receive attention from the industry in recent years. As a new type of refrigerant, transcritical CO2 has the following potential advantages. (1) Its temperature can be lowered to −50 °C, which can release more cold energy, thereby improving freezing efficiency. (2) It can absorb a large amount of heat during the gasification process, which helps achieve uniform freezing of the soil layer. (3) As an environmentally friendly medium, transcritical CO2 emissions have little impact on the environment and have been widely used in food refrigeration and air conditioning industries [13,14].
The evolution law of the temperature field [15,16,17,18,19,20] is the research basis for the freezing method and is also an important basis for its construction design. The research methods for the temperature field mainly include field monitoring, theoretical analytic solution, and numerical simulation. In terms of field monitoring, Rong et al. [21] studied the effects of groundwater flow rate and salinity on the freezing of saline soil through tests, obtained the freezing temperature of sand with different salinity, established a two-pipe freezing model with controllable flow rate, and analyzed the temperature distribution of saturated saline sand. Sun et al. [22] studied the temperature field evolution law under different seepage velocities and temperature gradients based on a self-developed double-pipe freezing test system for seepage formation to explore the influence of seepage flow on formation freezing. In terms of theoretical analysis methods, Wang et al. [23] derived the analytical solution for the steady-state temperature field of the asymmetric frozen curtain under directional seepage based on the theoretical solution of the steady-state temperature field and verified the rationality of the formula based on a hydrothermal coupling model test system. Zhang et al. [24] proposed a new method based on the temperature signal of the freezer to improve the solving accuracy of the global temperature field in order to solve the problem of temperature field in the subway communication channel. This was verified in the freezing project of a communication channel in Beijing. Hong et al. [25] established the mathematical model of the temperature field of the adiabatic boundary, solved the analytical solution of the temperature field of single, double, and triple freezing pipes by using the superposition of thermal potential function and the combined image method, and verified the accuracy and applicability of the formula by numerical simulation. In terms of numerical simulation, Cai et al. [26] used Abaqus finite element software to numerically simulate the freezing temperature field of liquid nitrogen in a single pipe and verified the reliability of the established analytical solution. During the construction of the Gongbei Tunnel, Long et al. [27] used COMSOL (v5.6) finite element software based on the two-dimensional porous medium heat transfer theory to conduct numerical simulation analysis for the temperature field change in the pipe curtain freezing method. The results show that the simulated temperature field variation law is consistent with the field measured data, which verifies the accuracy of the simulation, and further reveals the temperature field evolution law before and after the opening of the special-shaped freezing pipe. Cui et al. [28] studied the application of the pile row freezing method in a deep foundation pit through numerical simulation and analyzed the freezing temperature field and frost heave deformation under different hole layouts.
Currently, there are relatively few studies on the application of transcritical CO2 in freezing method technology, and they mainly focus on the study of cracking coal using transcritical CO2 to improve the permeability of coal seam, as well as some theoretical discussions [29,30]. Xu et al. [31] used liquid CO2 cycling cracking technology to transform coal reservoirs and studied the pore and fissure structure of lignite samples through a self-developed test platform and low-field nuclear magnetic resonance technology. Zhou et al. [32] studied the effects of freezing time, the number of freeze–thaw cycles, and coal water saturation on coal porosity by using the self-developed liquid CO2 freeze–thaw cracking test device and nuclear magnetic resonance testing technology. The response surface method was used to design experiments and build a quadratic regression model to analyze the effects of these factors on porosity. Hong et al. [33] studied the flow and heat transfer process in a vertical ascending pipe with an inner diameter of 5 mm under different operating conditions by means of numerical simulation, aiming at the heat transfer deterioration mechanism of four different types of supercritical CO2, and further discussed the heat transfer deterioration mechanism from a microscopic perspective. Wang et al. [34] carried out an elastoplastic stress analysis of the multi-refrigerant artificial frozen wall considering the difference in temperature of the refrigerant and the difference in distance between the freezing pipe and the formation, considering the significant influence on the non-uniform characteristics of the frozen wall of the double-row pipe. Therefore, to promote the application of transcritical CO2 in the freezing method, more experimental studies are urgently needed to verify its freezing effect, optimize the process parameters, and provide technical support and theoretical basis for actual engineering.
In this study, a transcritical CO2 refrigerant was innovatively applied to artificial ground freezing technology, with its feasibility systematically verified through the following research approaches. Specific research paths are as follows. Based on laboratory model tests [35,36], the evolution law of temperature field of transcritical CO2 during the freezing process of sand layer was explored. By establishing a comparison group with conventional alcohol freezing, the differences in freezing rate and freezing front expansion range between the two groups were systematically analyzed. Based on the cross-validation of the test data and numerical simulation results of transcritical CO2, the feasibility of transcritical CO2 in practical engineering was discussed. This research opens up a new direction for the green development of artificial freezing technology.

2. Design of Laboratory Model Tests

A single-pipe freezing test of transcritical CO2 and alcohol was conducted in this study. The test design included the selection of similar materials, the determination of physical and thermodynamic parameters, the establishment of a model test system and the test operation steps.

2.1. Measurement of Physical and Thermodynamic Parameters

The similar material selected for this model test was standard sand, which was manually screened, and its particle size was controlled within the range of 1 ± 0.15 mm, as shown in Figure 1. The particle size, dry density, and saturation density of round sand were determined according to the geotechnical test method standard [37]. The thermodynamic parameters were obtained by laboratory tests. Specific parameters are listed in Table 1. In the process of filling the test box, every accumulation of a 50 mm-thick sand layer was compacted to ensure that the sand layer was uniform and dense. The compaction process should be avoided to shift the temperature measurement points and ensure the accuracy of the temperature measurement data. Compacted round sand formed a porous medium with uniform porosity in the test box, which could be regarded as a homogeneous material. This not only ensures that the material has good thermal conductivity characteristics but also facilitates the uniform development of freezing fronts to achieve a balanced temperature distribution.

2.2. Similarity Criteria for Model Tests

In the freezing engineering, a commonly used freezing pipe is a φ108 × 6–φ168 × 8 mm seamless steel pipe. The freezing pipe size selected in this study was φ20 × 2 mm, which can simulate the freezing pipe size of φ140 mm. Therefore, the geometric similarity ratio CL = 7. According to the π theorem method, C a s C t / C L 2 = 1 C t = C L 2 = 49 , that is, the freezing of the model test for 1 h is equivalent to 49 h of the actual project. Where Cas, Ct, and CL are the medium temperature conductivity shrinkage ratio, time shrinkage ratio, and length shrinkage ratio, respectively. In the model test, the refrigerant temperature, initial soil temperature, and freezing pipe wall temperature were consistent with actual engineering conditions. According to the Kosovich criterion [21], C B e = C c p w C T C T = 1 , that is, the temperature value of the corresponding position in the model test is equal to that in the actual formation.

2.3. Model Test System

The model test system consisted of three parts: a test box, freezing system, and temperature measuring system. These components work synergistically to provide an accurate test platform for exploring the evolution law of the transcritical CO2 temperature field. The detailed layout and connection modes of the system are illustrated in Figure 2.

2.3.1. Test Box

Considering the geometric similarity ratio and temperature boundary effect, a test box with dimensions of 1440 × 1140 × 800 mm (length × width × height) was adopted in this study. The interior of test box was filled with 800 mm high homogeneous round sand. A single φ20 × 2 mm freezing pipe was arranged in the center of the test box. The fixed support was welded to the bottom of the test box to prevent the freezing pipe from tilting. In addition, several hooks were welded around the test box to facilitate the arrangement of temperature measuring points. To reduce the interference of ambient temperature on the freezing test, the outer side of the test box and freezing pipe were wrapped with thermal insulation materials to isolate the influence of external temperature.

2.3.2. Freezing System

The components of the freezing system mainly included a refrigeration unit (alcohol), carbon dioxide cylinders (trancritical CO2, 40 L), a freezing pipe, flowmeter, pressure relief valve and liquid dispenser, etc. These components were connected through low-temperature stainless steel hoses and threaded joints to form a complete freezing system. The refrigerants used in the system included industrial alcohol with a purity of 97% (freezing point of −110 °C, boiling point of 78 °C) and transcritical CO2 (freezing point of −56.6 °C, boiling point of −78.5 °C). The refrigeration unit can reduce the temperature of the alcohol to −30 °C, while the transcritical CO2 factory temperature is approximately −50 °C. In the freezing test, the flow rates of both the alcohol and transcritical CO2 were controlled at 1.2 m/s. The principle of transcritical CO2 frozen strata relies on the heat absorption characteristics of its phase transition to reduce the soil temperature and then form the frozen curtain. However, this process releases a large amount of CO2 gas, which requires the use of a pressure relief valve to release excess pressure and ensure that the test environment has good ventilation conditions to avoid the risk of suffocation. In addition, the distributor is used to ensure that a continuous supply of transcritical CO2 is available to maintain the continuity of the freezing operation.

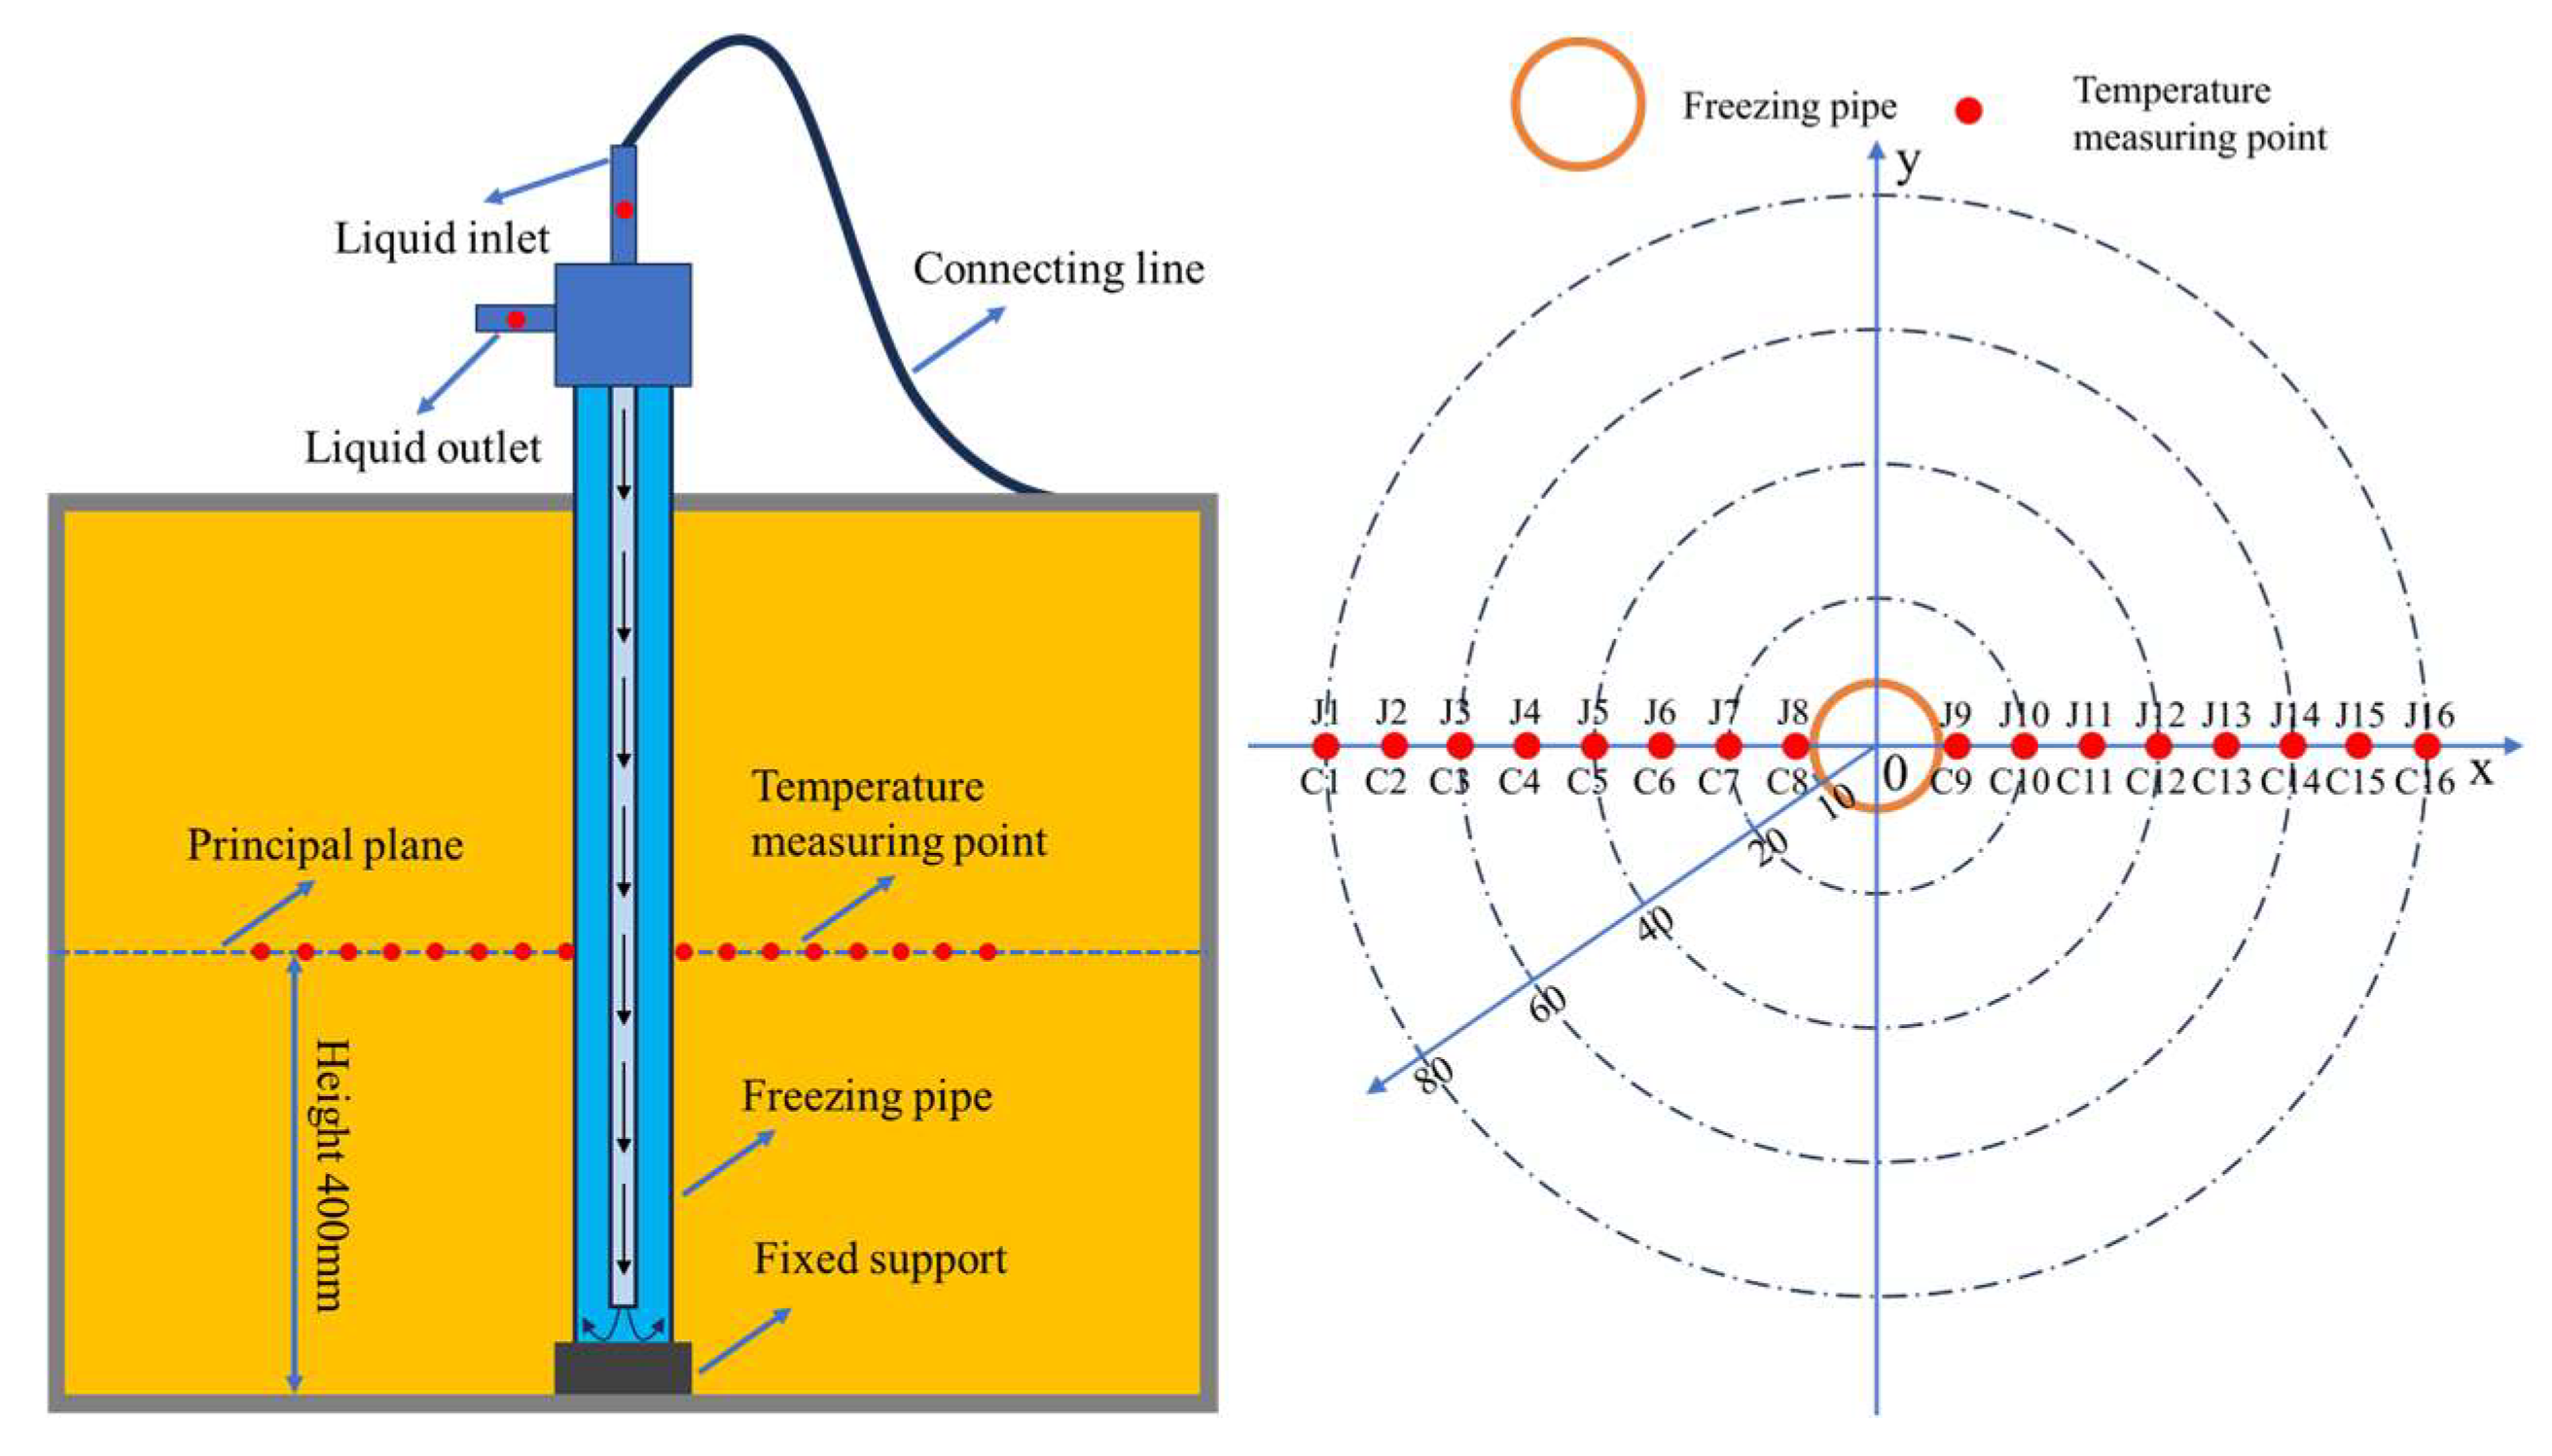
2.3.3. Temperature Measuring System

In the model tests, the sand layer temperature was measured using TDS-630 monitoring equipment, which had the function of automatic data acquisition. The frequency of data collection for the alcohol single-pipe freezing test was 5 min, which was increased to 1 min for the transcritical CO2 test. The temperature measuring points were arranged in the same manner to better compare the freezing effects of the two refrigerants. In other words, 14 temperature measuring points were arranged symmetrically along the horizontal direction of the freezing pipe on a plane with a sand layer height of 400 mm, and the distance between the temperature measurement points was 10 mm. In addition, 2 temperature measuring points were arranged on the surface of the freezing pipe wall, and 1 temperature measuring point was arranged at liquid inlet and outlet. A total of 18 temperature measuring points were used. J1–J16 represent the temperature measuring points of the alcohol test, and C1–C16 represent the temperature measuring points of the transcritical CO2 test. The specific arrangement of the measurement points is shown in Figure 3.

2.3.4. Test Operation Steps

First, the materials required for the test were prepared, the test box was processed, and a freezing pipe was installed to ensure stability. Next, the sand was screened, the landfill work was completed, the temperature measuring points were installed simultaneously, and the rope was passed through the hook of the test box such that the temperature measuring points were stably fixed on the rope. After the sand layer was filled on the top surface, the test box was sealed and insulation measures were implemented. The TDS-630 temperature measuring system was debugged, the temperature acquisition frequency was set to ensure the accuracy of data recording, and the pipes and lines between the systems and test were connected to ensure normal function. The temperature measurement system and freezing system were used to carry out the alcohol and transcritical CO2 single-pipe freezing control test, record the data during the test, and complete the corresponding concluding work after the test. The test procedure is shown in Figure 4.

3. Analysis of Laboratory Model Test Results

In this study, the evolution law of temperature field during the freezing process of transcritical CO2 was deeply explored by model test. To evaluate the transcritical CO2 freezing efficiency, its freezing temperature field was compared with that of alcohol. The results show that the freezing efficiency of transcritical CO2 is better than that of alcohol; its freezing speed is faster and wider. The specific research content is as follows.

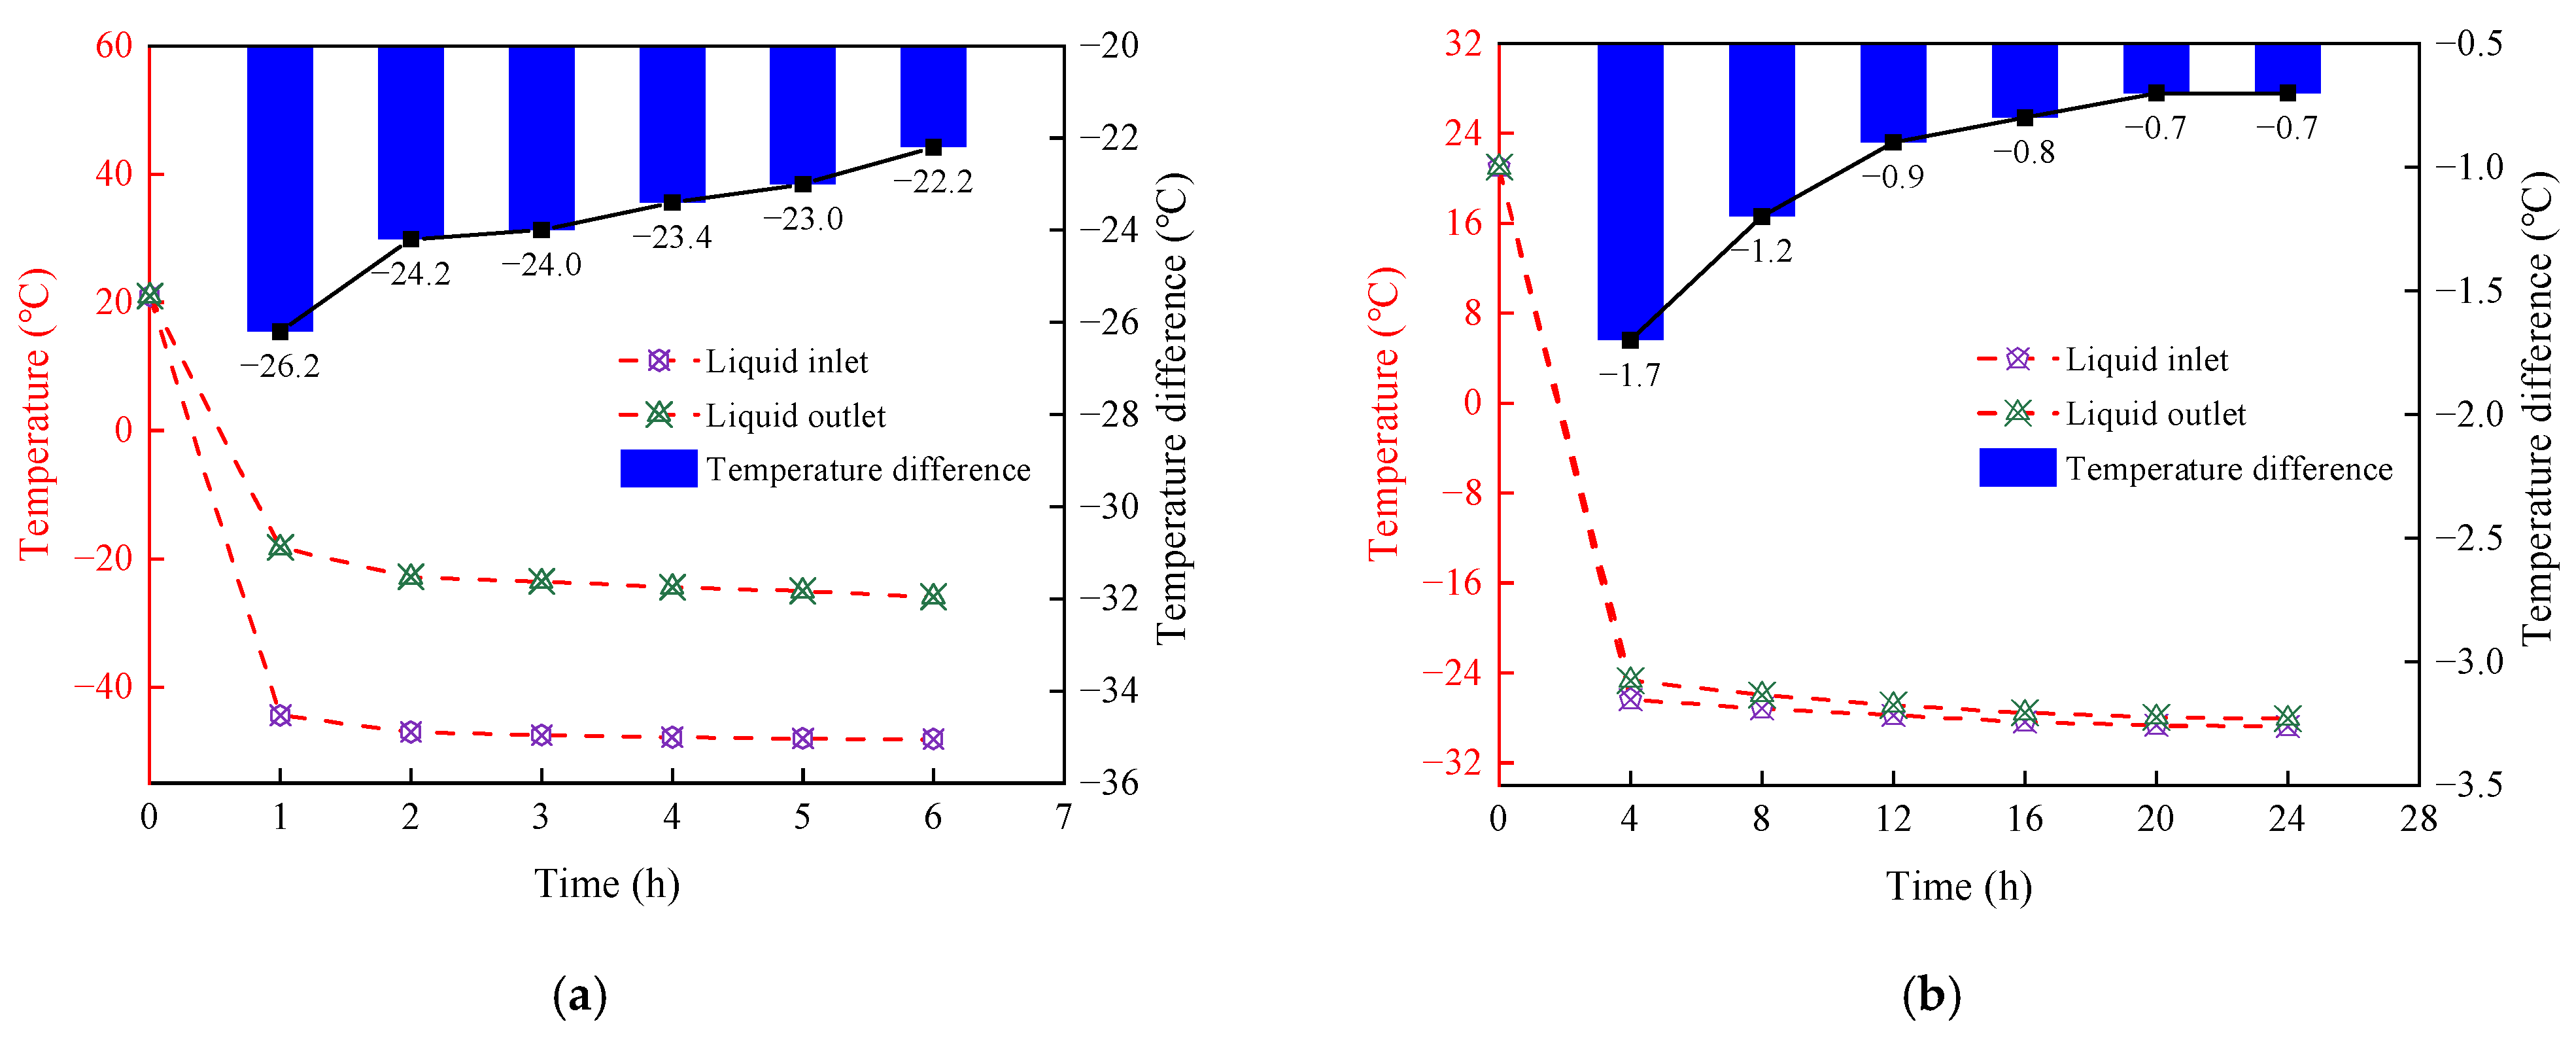
3.1. Analysis of Temperature Difference Between Liquid Inlet and Outlet

The temperature difference between the liquid inlet and outlet is one of the important indexes for evaluating freezing efficiency. A larger temperature difference indicates that the refrigerant can effectively absorb heat from the formation as it passes through the freezing pipe. When the temperature difference is in equilibrium, it indicates that the heat exchange rate between the refrigerant and the formation has stabilized, the development speed of the freezing front slows down, and the heat exchange in the frozen area finally reaches a stable state. As shown in Figure 5, with the increase in freezing time, the temperature difference between liquid inlet and outlet gradually decreases and tends to be stable. In a transcritical CO2 freezing test, when liquid carbon dioxide was released from the cylinder and flowed into the freezing pipe, evaporation began to occur as the pressure decreased. In this process, transcritical CO2 absorbs a large amount of heat (latent heat of evaporation), causing the temperature of the liquid inlet to drop rapidly. At the liquid outlet, transcritical CO2 has been mostly or completely evaporated into gas, and gaseous carbon dioxide carries a large amount of heat. This resulted in a relatively high temperature at the liquid outlet and a large temperature difference between liquid inlet and outlet, with the maximum temperature difference reaching 26.2 °C. In contrast, the alcohol freezing test adopts a cyclic freezing method, which mainly relies on heat conduction to reduce the temperature of the sand layer. It was observed that the temperature difference between the liquid inlet and outlet was relatively small, and the maximum temperature difference was only 1.7 °C.

3.2. Temperature Field Analysis

3.2.1. Temperature Change Rule of Measuring Points

In the model tests of this study, the same arrangement of temperature measuring points were adopted uniformly to ensure the accuracy and comparability of the test results. These points were evenly distributed around the freezing pipe to accurately record temperature variations. Analysis of Figure 6 reveals that in both the transcritical CO2 and alcohol freezing tests, symmetrically positioned temperature measuring points exhibited identical trends in temperature variation. This indicates that the temperature field presents good uniformity during the entire freezing process. The change law of the entire temperature field can be divided into the following three stages. (1) Rapid cooling stage: At this stage, the temperature of the sand layer drops rapidly, exhibiting a high cooling rate. (2) Active freezing stage: The temperature of the sand layer continues to decrease, but the cooling rate slows down compared with the rapid cooling stage. (3) Stable freezing stage: With the passage of time, the decrease in sand layer temperature gradually tends to be stable. In addition, the red dotted line in the figure indicates the freezing temperature (Td), which is −1 °C according to Table 1.
For the same 6 h freezing period, the temperature distribution across the measuring points in the transcritical CO2 freezing test exhibited a wide range, spanning from −28 °C to 3.5 °C. In contrast, the alcohol freezing test showed a relatively narrow temperature distribution at the measuring points, ranging from −12.6 °C to 8.8 °C, and the maximum temperature difference between the two reached 15.4 °C. In addition, after 24 h of freezing, it was observed that 12 temperature measuring points in the alcohol freezing test dropped to −1 °C. This indicates that the freezing front radius has reached a distance of 60 mm. In the transcritical CO2 freezing test, 12 temperature measuring points also dropped to −1 °C after 6 h of freezing. Compared with the alcohol freezing test, the time was reduced by three quarters. This result fully demonstrates that the efficiency of transcritical CO2 freezing is significantly better than that of alcohol.
In summary, the heat transfer efficiency and freezing range of transcritical CO2 are better than those of alcohol during freezing. Compared to the liquid nitrogen freezing technology, although the refrigerant temperature can reach a very low −80 °C, which can realize rapid freezing, its freezing effect is not uniform enough. The transcritical CO2 freezing technology exhibits rapid and uniform freezing characteristics, which is of great significance for the practical application of freezing engineering. Future studies could further explore the potential advantages of transcritical CO2 freezing technology.

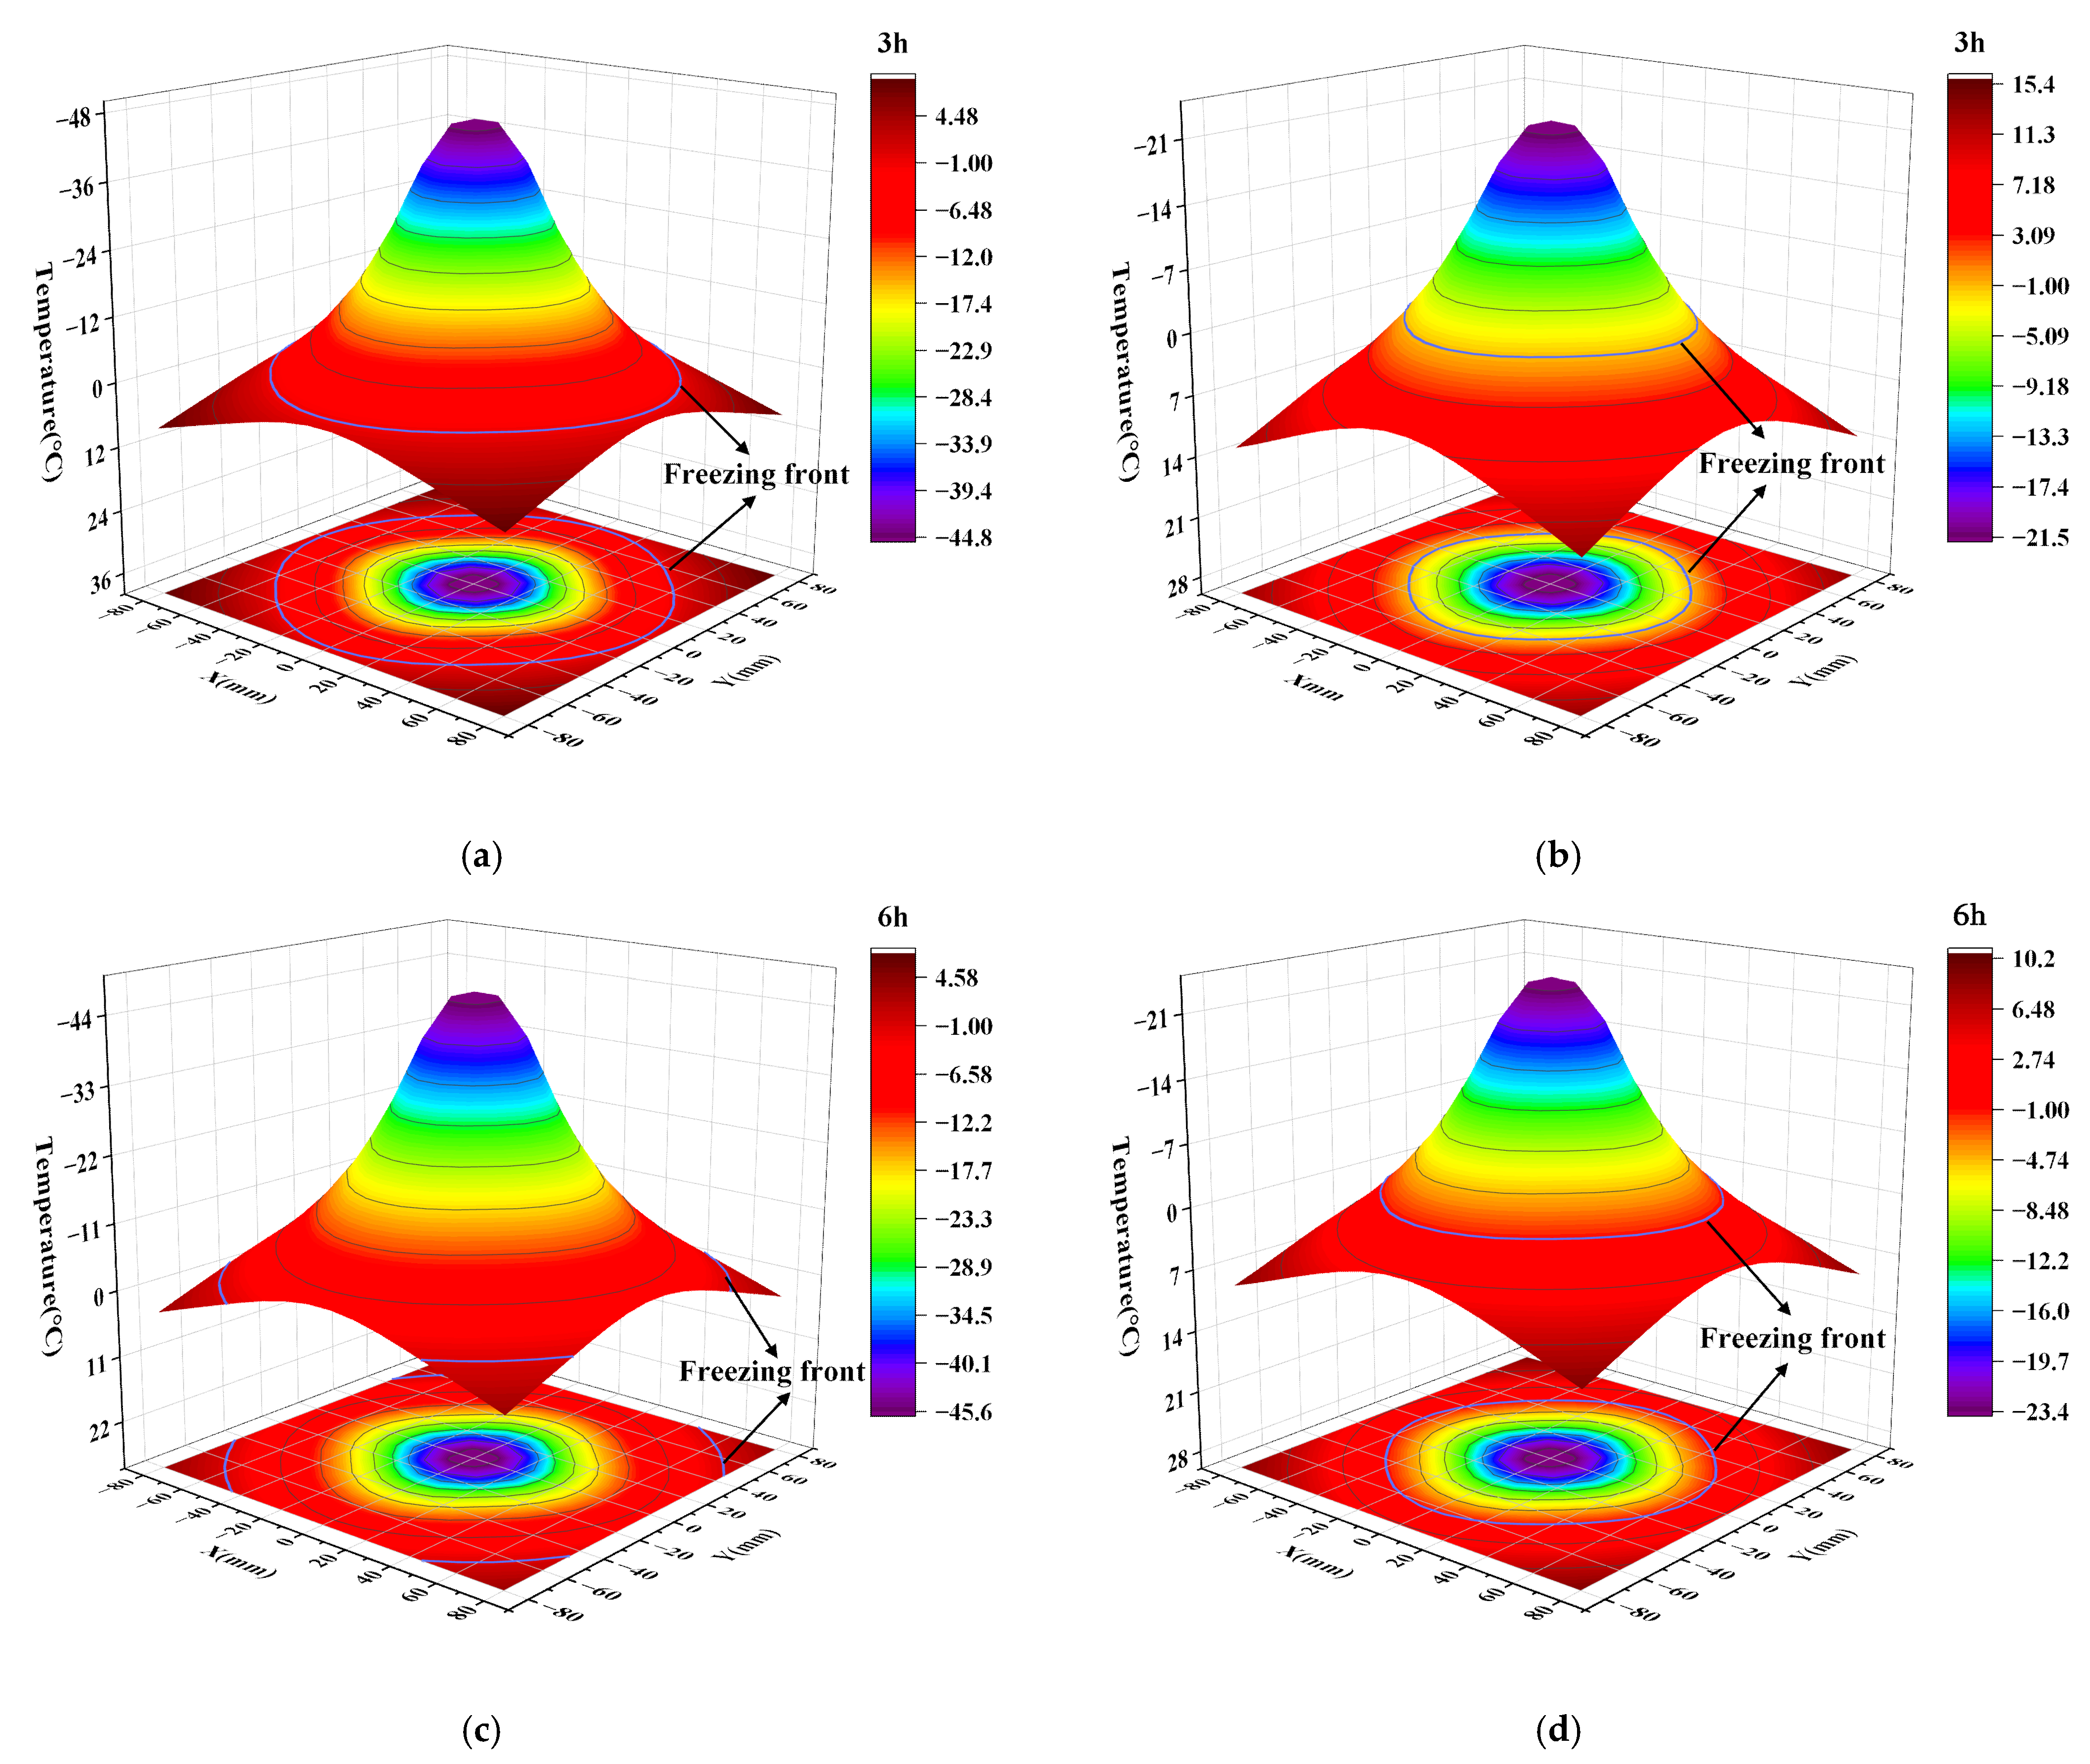
3.2.2. Spatial Temperature Field Distribution Characteristics

In this study, by arranging symmetric temperature measurements on both sides of the freezing pipe, temperature data were recorded at different time points during the freezing process to analyze the spatial temperature field distribution of the sand layer freezing. In the figure, the transverse axis represents the position of the freezing pipe and temperature measuring point, and the vertical axis represents the temperature. Using these measurements, the spatial temperature distribution was plotted, as shown in Figure 7 and Figure 8.
Figure 7 shows the spatial temperature field distribution characteristics of the alcohol and transcritical CO2 freezing for 6 h. From the figure, it can be observed that at the same time point, the temperatures at the symmetrically positioned measuring points remained consistent. This indicates that the temperature sensors were accurately placed without displacement during sand layer compaction and further demonstrated the uniformity of the sand fill. As the distance from the center of the freezing pipe increased, the temperature at the measurement points gradually raised, showing a clear temperature gradient. This indicates that the cooling effect decreases with increasing distance. On the whole, the distribution law of transcritical CO2 freezing temperature field is the same as that of alcohol freezing temperature field. The temperature on both sides of the freezing pipe is roughly a “V” symmetrical distribution, and the temperature gradually increases with increasing distance. As the freezing test proceeded, the temperature curve showed a gradual downward trend, that is, the width of the “V”-shaped opening gradually expanded. The distance between the two adjacent curves gradually decreases in the late freezing period, which indicates that the temperature field expansion rate slows down after entering the stable stage in the late freezing period. In addition, a significant difference in temperature at the freezing pipe wall between transcritical CO2 and alcohol can be observed, with the transcritical CO2 pipe wall temperature being lower and less variable than that of alcohol. This also shows from the side that the transcritical CO2 can transfer the cold amount more effectively during the freezing process, and its refrigeration performance is better. As the freezing test proceeded, the temperature difference between the measuring points gradually increased, especially near the center of the freezing pipe.
Figure 7 shows the three-dimensional freezing temperature field curves of the transcritical CO2 and alcohol. As shown in the figure, the three-dimensional freezing temperature field exhibits a peak shape, and its peak value corresponds to the wall temperature of the freezing pipe. The closed temperature curve in the figure represents isotherms formed during freezing. These isotherms were centered on the freezing pipe, showing a spatial distribution law of approximately concentric circles. The results showed that the temperature difference between the two symmetric measuring points was not significant ( Δ T < 0.6 °C). In addition, as the distance from the freezing pipe decreased, the temperature of the frozen region sharply decreased, indicating a significant temperature gradient around the freezing pipe. The maximum radial temperature gradient of transcritical CO2 reached 0.57 °C/mm after freezing for 3 h, while the maximum radial temperature gradient of alcohol reached 0.59 °C/mm in the same time. With the extension of freezing time, the temperature gradient gradually decreased. After freezing for 6 h, the maximum radial temperature gradient of transcritical CO2 decreases to 0.53 °C/mm, while that of alcohol decreases to 0.36 °C/mm.
With the freezing test, the freezing front gradually expanded outward. The transcritical CO2 had a freezing front radius of more than 50 mm after freezing for 3 h, while the alcohol had a freezing front radius of 30 mm during the same time. When the freezing time was extended to 6 h, the transcritical CO2 freezing front radius exceeded 60 mm, whereas the alcohol freezing front radius exceeded only 40 mm. This experimental data clearly demonstrates the significant advantages of transcritical CO2 in terms of freezing rate and spreading range. However, with the extension of freezing time, the growth rate of the freezing front radius of both transcritical CO2 and alcohol exhibited a significant slowdown. The reason for this phenomenon is that the frozen wall formed during the freezing process will hinder the further transfer of the cold amount, resulting in increased thermal resistance. Simultaneously, with the increase in the volume of the frozen area, the amount of cold that could be absorbed per unit time was relatively reduced, which led to a decrease in the freezing speed.

4. Formula Derivation and Verification Analysis of Transcritical CO2 Single-Pipe Freezing Temperature Field

In this study, the analytical solution of the transient temperature field of the transcritical CO2 frozen and unfrozen area was derived by establishing a single-pipe freezing theoretical model and setting the boundary conditions of the temperature field. The error analysis of the calculation results based on the theoretical formula and test data was performed to verify the accuracy of the theoretical analytical solution.

4.1. Basic Assumption

(1)
The frozen soil is a homogeneous material, and its thermodynamic parameters remain constant during the freezing process.
(2)
The plane heat conduction problem is simplified to a single pipe axisymmetric problem.
(3)
The temperature of the freezing pipe wall remains unchanged during freezing.
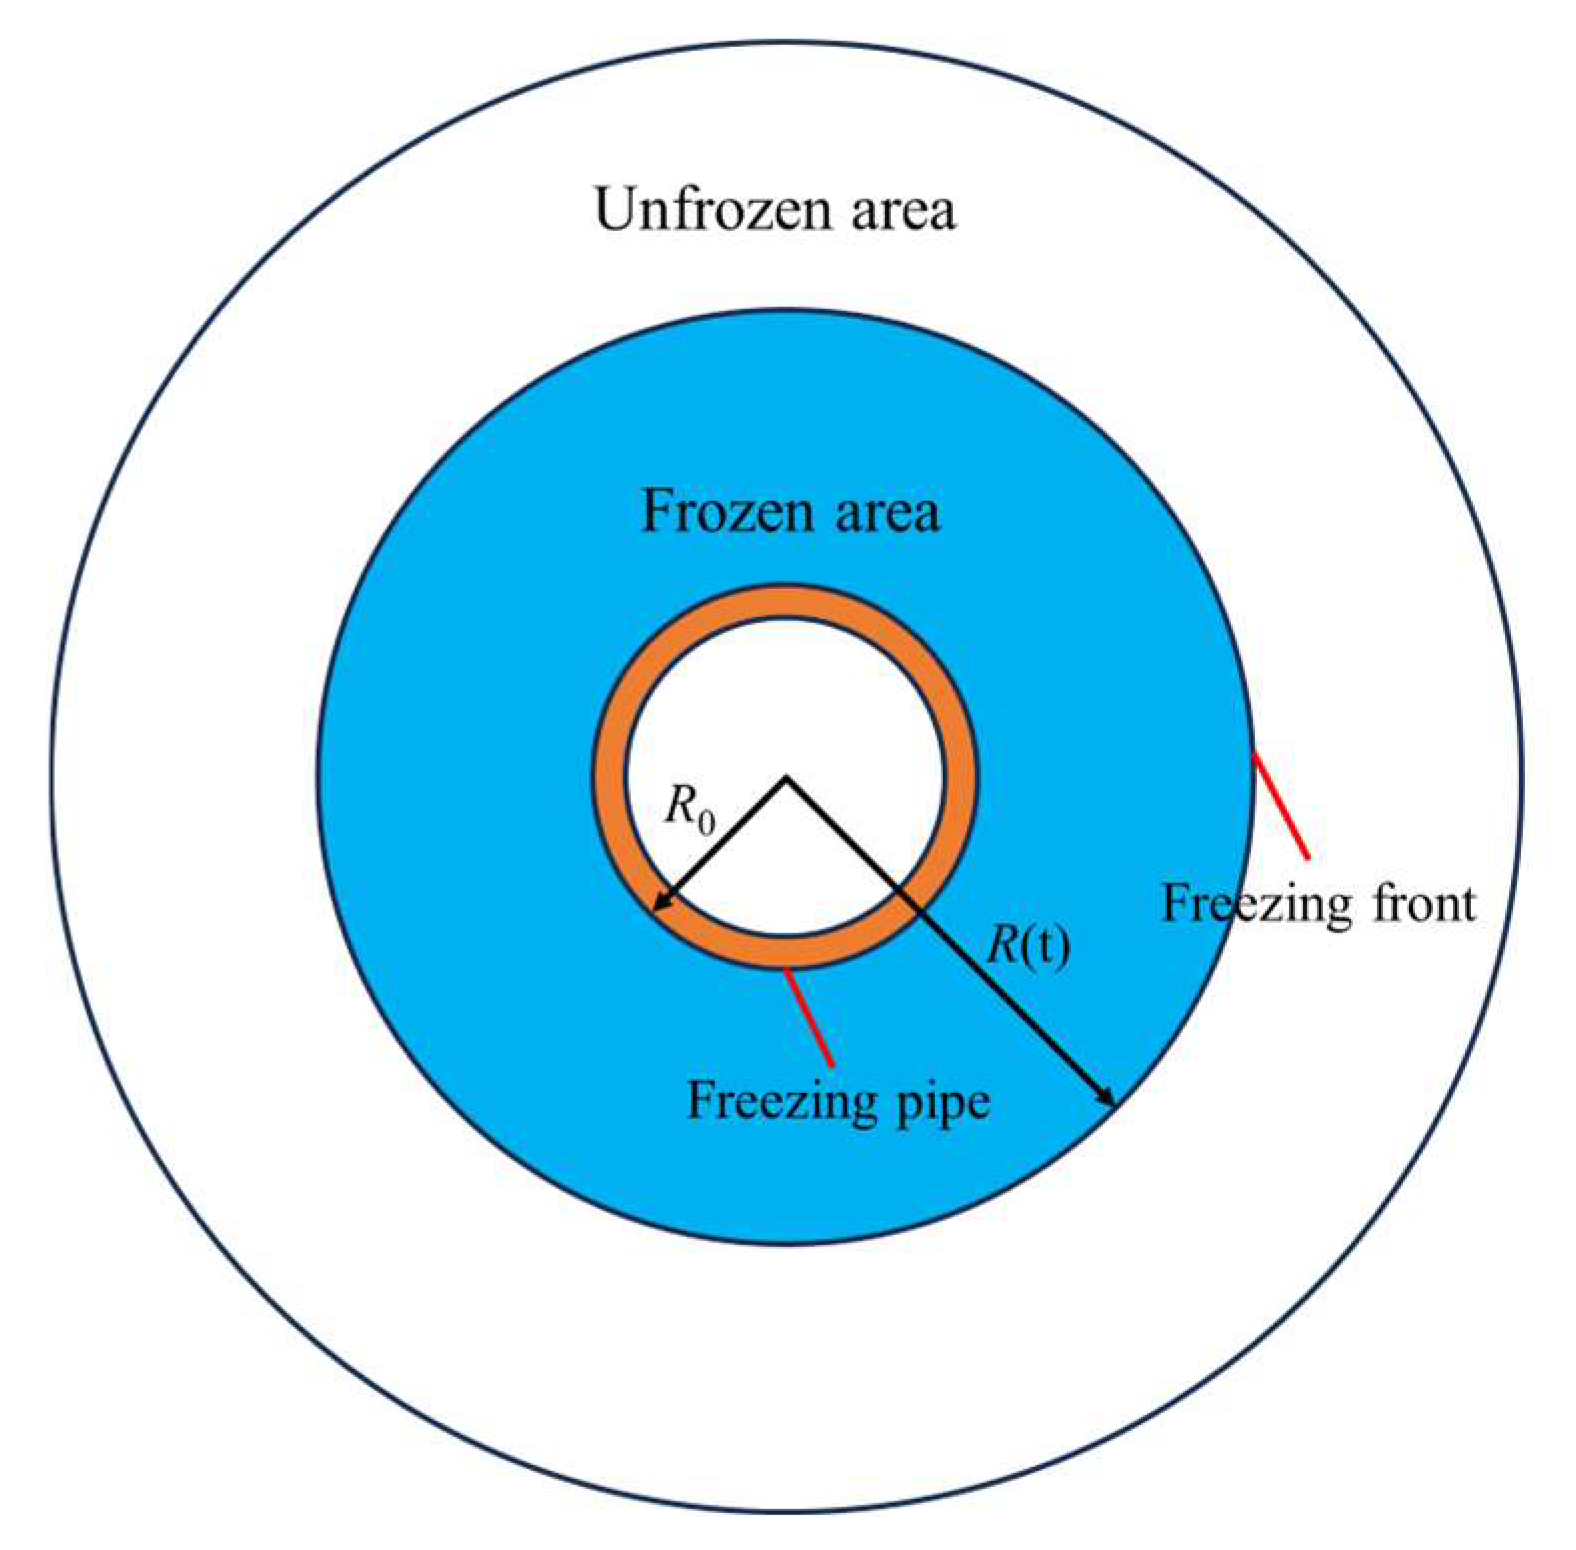
(4)
The freezing front spreads evenly around to form obvious frozen and unfrozen areas, as shown in Figure 9, where R0 is the radius of the freezing pipe and R(t) is the radius of the freezing front.

4.2. Derivation of Transient Temperature Field Formula of Transcritical CO2 Single-Pipe Freezing

Governing equation of heat conduction in frozen area:
T 1 t = α 1 2 T 1 r 2 + 1 r T 1 r R 0 r R t
Governing equation of heat conduction in unfrozen area:
T 2 t = α 2 2 T 2 r 2 + 1 r T 1 r R t r R
Temperature field boundary conditions:
T 2 = T 0 t = 0 T 1 = T c r = r 0 T 1 = T 2 = T d r = R t T 2 = T 0 r = R
The ice–water phase transition occurs when the freezing temperature is reached, and the heat balance equation is as follows:
k 1 T 1 t k 2 T 2 t = L d R t d t
In the formula, T1 and T2 are the temperatures in the frozen and unfrozen areas, respectively; Td is the freezing temperature; T0 is the initial temperature of the sand layer; and Tc is the temperature of the freezing pipe wall. α 1 and α 2 are the thermal diffusivities of the frozen soil and unfrozen soil (m2/d), respectively. k1 and k2 are the thermal conductivities (kcal/m·d·°C) of the frozen soil and unfrozen soil, respectively. L is the latent heat of freezing per unit volume of soil (kcal/m3).
Solve Equations (1) and (2) by introducing variables x1 and x2:
x 1 = r 2 4 α 1 t x 2 = r 2 4 α 2 t
By substituting formula (5) into formulas (1) and (2), we obtain
2 T 1 x 1 2 + 1 + 1 x 1 T 1 x 1 = 0 2 T 2 x 2 2 + 1 + 1 x 2 T 2 x 2 = 0
By solving the differential equation of Equation (6), we can obtain
T 1 = A E i x 1 + B T 2 = C E i x 1 + D
where A, B, C, and D are the parameters to be evaluated and Ei(x) is the exponential integral function, E i x = x e y y d y .
Equation (3) of the combined vertical (7) and temperature field boundary conditions can be obtained:
A = T c T d E i r 0 2 4 α 1 t E i R ( t ) 2 4 α 1 t B = T c T c T d E i r 0 2 4 α 1 t E i r 0 2 4 α 1 t E i R ( t ) 2 4 α 1 t C = T d T 0 E i R ( t ) 2 4 α 2 t D = T 0
Then, by substituting Equation (8) into Equation (7), the analytical solution of the transient temperature field in the frozen and unfrozen areas can be obtained:
T 1 = T c + T d T c E i r 0 2 4 α 1 t E i r 2 4 α 1 t E i r 0 2 4 α 1 t E i R ( t ) 2 4 α 1 t R 0 r R t
T 1 = T 0 + T d T 0 E i r 0 2 4 α 2 t E i R ( t ) 2 4 α 2 t R t r
From the above formula, it can be seen that the freezing front radius R(x) is also required to solve the temperature field distribution law in the freezing process. By substituting Equations (9) and (10) into Equation (4), we can obtain
k 1 T d T c e δ 2 4 α 1 E i r 0 2 4 α 1 t E i δ 2 4 α 1 t + k 2 T d T 0 e δ 2 4 α 2 E i δ 2 4 α 2 = L δ 2 4
where δ is an undetermined constant and the following conditions exist:
R t = δ t

4.3. Comparative Analysis of Theoretical Formula Calculation and Experimental Results

To verify the accuracy of the theoretical formula, an error analysis was performed between the theoretical calculation results and model test results, as shown in Figure 10. The physical and thermodynamic parameters used in the calculations are listed in Table 1 and Table 2, respectively.
By comparison, it was found that the theoretical calculation results were in good agreement with the model test results. Among the 16 temperature measuring points, only a few temperature measuring points had an error of 1.6 °C, and this difference showed a decreasing trend with the increase in freezing time. This confirmed the accuracy of the theoretical formula.

5. Theoretical Formula Calculation and Analysis

In the model test, a freezing time of 6 h corresponds to 12.25 days in the actual project timeline. This duration is insufficient to meet the project requirements. However, model tests have verified the accuracy of the theoretical formula, which lays a foundation for further research on the development of the frozen wall during the transcritical CO2 freezing process.

5.1. Effect of Freezing Temperature Td on Freezing Front

In the actual freezing process, the water in the soil is jointly affected by various factors, such as surface energy exchange, solute concentration, and geological pressure [27], resulting in a change in the freezing temperature Td, which is not constant at 0 °C. The influence of freezing temperature Td on the freezing front was studied based on the analytical solution of the transient temperature field of a single pipe. The relationship between the freezing front radius and time of alcohol, brine, transcritical CO2, and liquid nitrogen at different freezing temperatures was analyzed. The initial formation temperature T0 was 28 °C, and the freezing pipe wall temperatures Tc were −25 °C, −30 °C, −45 °C, and −70 °C, respectively. The calculation results are shown in Figure 11 and the freezing parameters are listed in Table 1.
According to the chart analysis, the four types of refrigerants exhibit similar change rules for the freezing front radius, which can be divided into three stages. (1) Initial rapid freezing period: In the early stages of freezing, the large temperature difference between the refrigerant and sand layer results in rapid heat transfer and solidification of moisture into ice in the sand layer. This process promotes continuous outward expansion of the freezing front. (2) Intermediate slow freezing period: With the deepening of the freezing process, the reduction in freezable water in the sand layer as well as the decrease in the efficiency of cold transfer leads to a slow increase in the radius of the freezing front. (3) The final stable freezing period: At the end of freezing, most of the water in sand layer has been converted into ice and the range of cold transfer provided by the refrigerant is limited, and finally the radius of the freezing front is stable.
Further studies show that the freezing temperature Td has a significant influence on the freezing front. The higher the freezing temperature Td under the same conditions, the larger the radius of the freezing front, and this effect increases with freezing time. In the figure, R(Td = −2) represents the difference between the freezing front radius at the freezing temperature of −2 °C and that at the freezing temperature of 0 °C. For example, after 24 h of transcritical CO2 freezing, when the freezing temperature is −2 °C and the freezing temperature is 0 °C, the calculated freezing front radius difference R (Td = −2) is 8.02 mm. In addition, comparison of the data for different refrigerants shows that the change in the freezing front radius caused by the freezing temperature Td is concentrated in the range of 1.5–8.1 mm. This indicates that the influence of freezing temperature Td on the freezing front radius is consistent despite the difference in refrigerant type, and the change in refrigerant type does not lead to a significant difference.

5.2. Development Law of Transcritical CO2 Frozen Wall

During the freezing process, the thickness of the frozen wall is one of the most important indicators of the freezing effect and construction quality. It is directly related to whether the frozen wall can effectively isolate groundwater and resist soil pressure, thereby ensuring construction safety and smooth progress. As shown in Table 3 and Figure 12, based on the derived theoretical formula, the development laws of the frozen wall thickness and area with time under transcritical CO2 freezing conditions were calculated and analyzed.
Figure 12 illustrates the development law of the frozen wall over time under transcritical CO2 freezing condition. During the initial 12 h, the thickness of the frozen wall increased rapidly, demonstrating high freezing efficiency. Subsequently, the rate of increase in the thickness of the frozen wall gradually decreased between 12 and 22 h. Finally, the frozen wall thickness stabilized during the 22–24 h period. After 24 h of freezing, the thickness of the frozen wall reached 93.21 mm and the area of the frozen wall expanded significantly to 33,134.23 mm2.

6. Conclusions

To explore the application potential of transcritical CO2 in freezing construction technology, this study carried out a control test of transcritical CO2 and alcohol single-tube freezing based on a self-built test system and analyzed the error of the single-tube freezing theoretical model combined with the test data. The principal findings of this research can be summarized as follows:
(1)
Based on the model tests, the differences in freezing efficiency between transcritical CO2 and alcohol were compared and analyzed. The test results showed that the temperature range of the measuring point can reach −28 °C–3.5 °C by using transcritical CO2 freezing for 6 h. The temperature span of the alcohol measuring point was only maintained at −12.6 °C~8.8 °C. The comparison shows that the temperature field of transcritical CO2 was significantly lower than that of alcohol, with the maximum temperature difference reaching 15.4 °C. In addition, the freezing front radius of the transcritical CO2 freezing test reached 60 mm, while it took 24 h to reach the same radius as alcohol freezing.
(2)
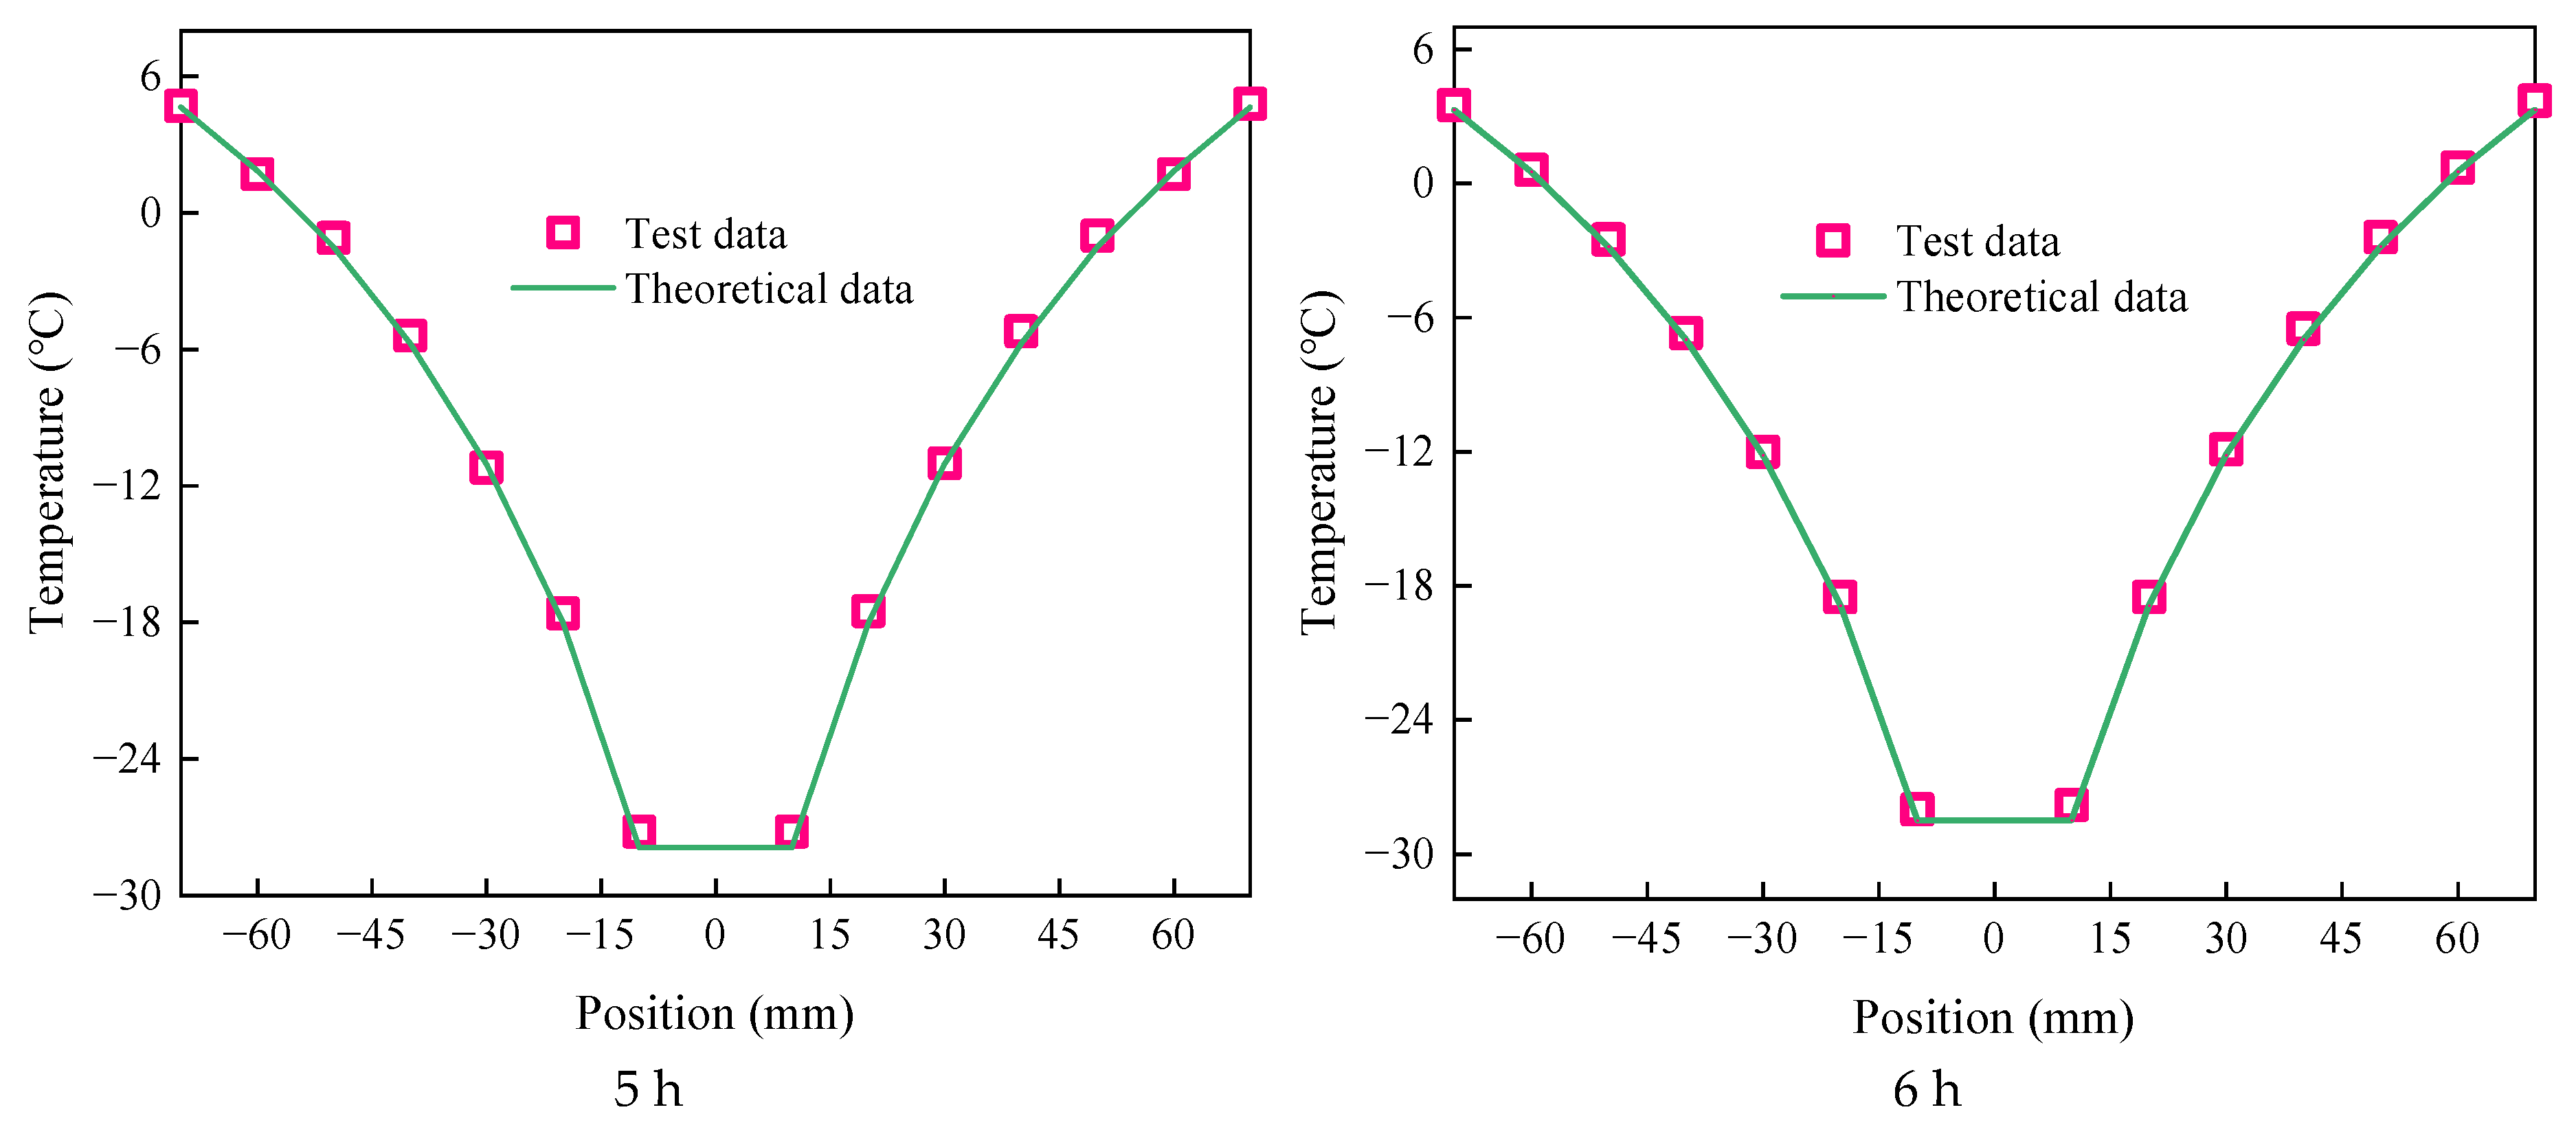
An error analysis comparing the test data with theoretical calculations of transcritical CO2 was conducted, verifying the accuracy of the theoretical model. The results demonstrate a strong agreement between the two temperature field distributions, with only a few measurement points exhibiting a temperature deviation of 1.6 °C. As freezing time increased, the difference showed a decreasing trend.
(3)
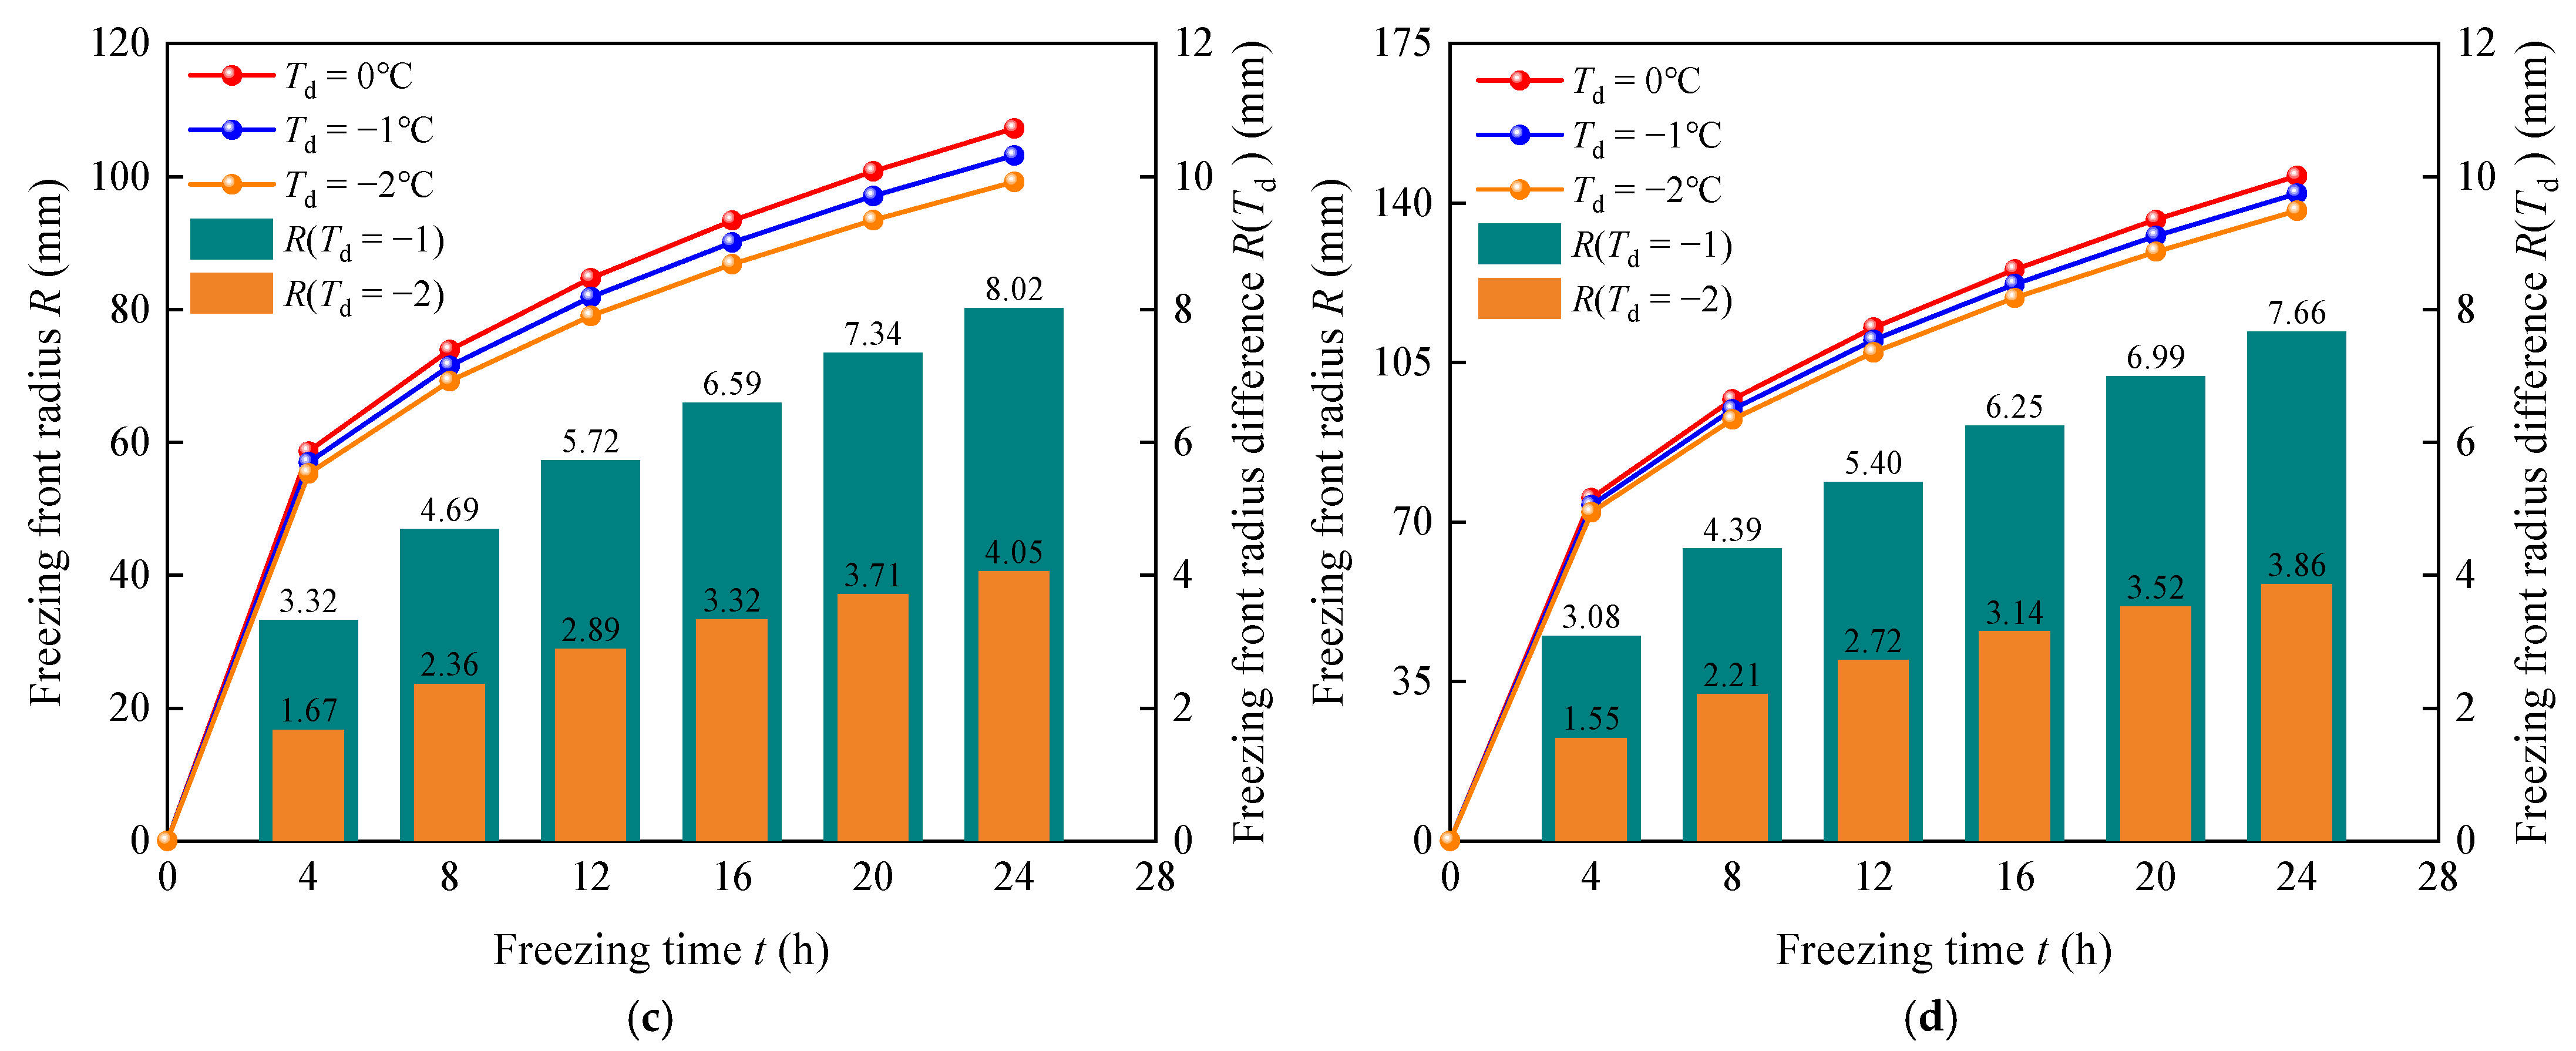
The influence of freezing temperature Td on the freezing front was explored based on the theoretical formula derived in this study. The results showed that the higher the freezing temperature Td under the same freezing conditions, the larger the corresponding radius of the freezing front, and that this effect was significant with freezing time. After 24 h of transcritical CO2 freezing, the calculated difference in the freezing front radius R(Td = −2) reached 8.02 mm when the freezing temperature Td was −2 °C and 0 °C. In addition, a comparison of the data for different refrigerants showed that the difference in the freezing front radius caused by the freezing temperature Td was within the range of 1.5–8.1 mm, and the change in refrigerant type did not lead to a significant difference.
(4)
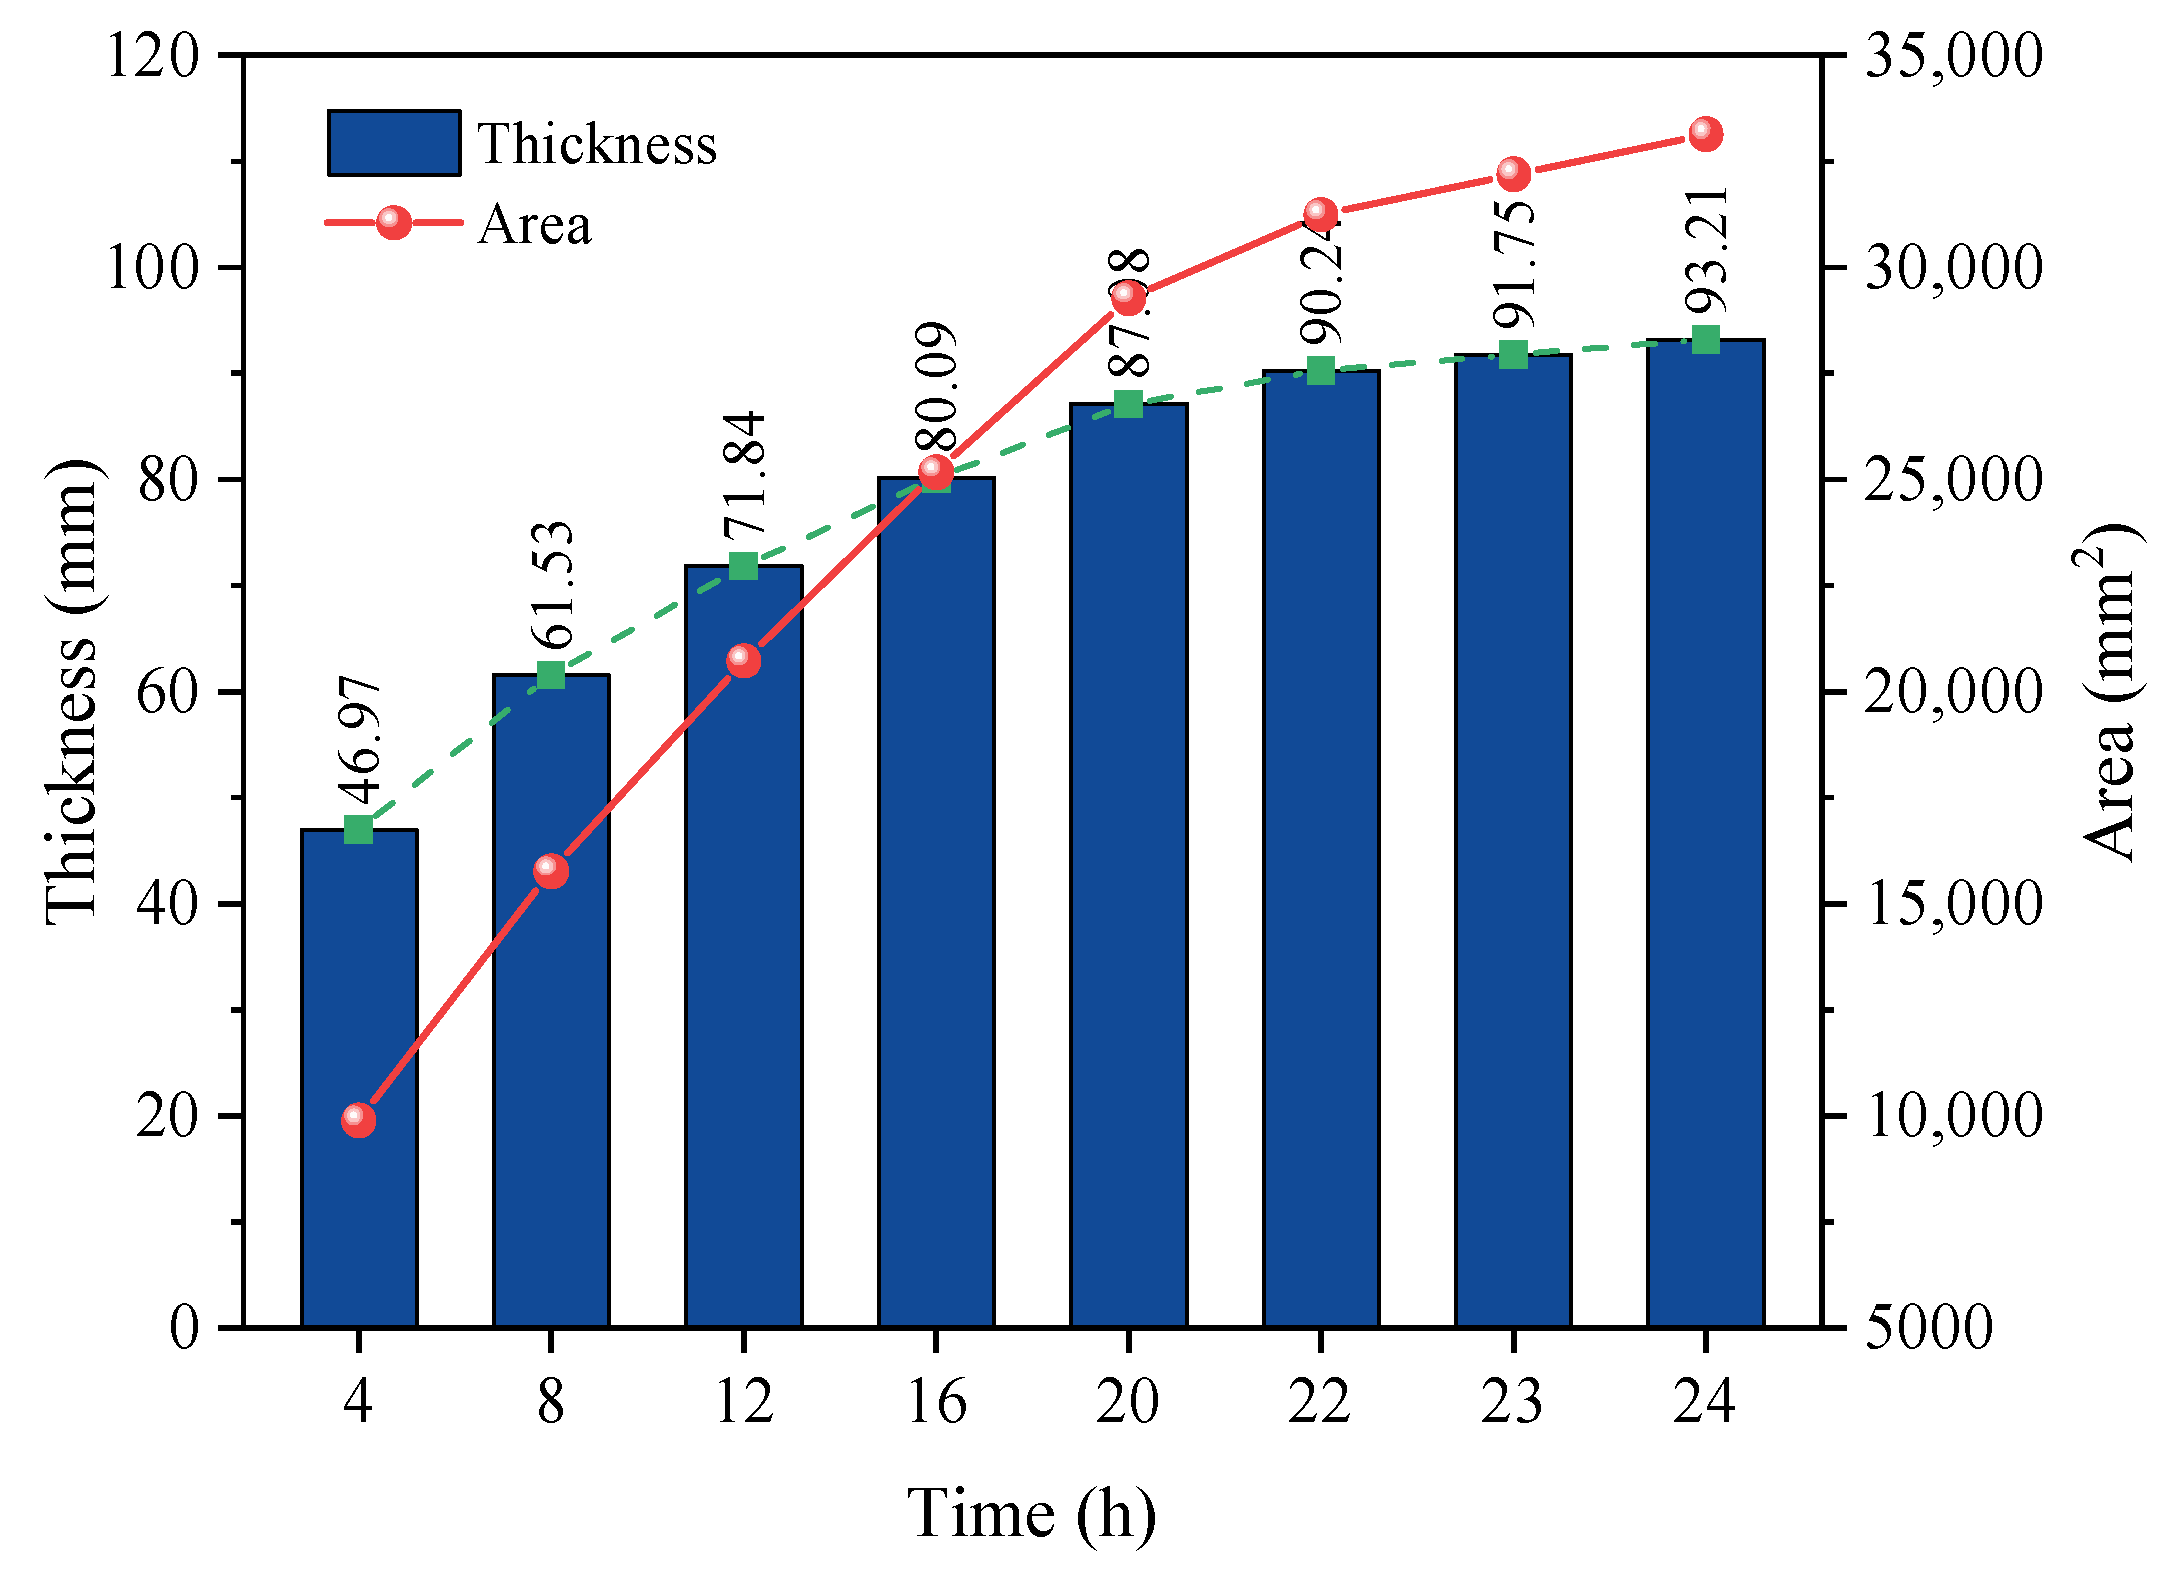
The formation law of the frozen wall during the freezing process of transcritical CO2 was calculated and analyzed by theoretical formula. It was found that the thickness of the frozen wall rapidly increased during the initial 12 h of freezing. During 12–22 h, the growth rate gradually decreased. Within 22–24 h, the thickness of the frozen wall gradually stabilized. After 24 h of freezing, the frozen wall area finally reached 33,134.23 mm2.
(5)
Based on the single-pipe transcritical CO2 freezing test, this study initially explored the freezing theory, but some limitations were encountered; the influence of seepage conditions on the freezing process was not considered in the test, and homogeneous round sand was used to simulate the formation, whereas the soil in the actual project mostly showed heterogeneity, cracks, or layered structures, which led to deviations between the uniformity of the freezing front and the distribution of the temperature field. The multi-pipe interaction, long-term stability of the frozen wall, and economy of the refrigerant require further study. In the future, it will be necessary to improve the theoretical system through multi-physical field coupling models and field tests and focus on breaking through the multi-refrigerant joint freezing technology, building an efficient freezing technology system that adapts to complex geological conditions, and promoting engineering applications.

Author Contributions

Writing—original draft preparation, Z.Z.; conceptualization, B.W.; software, X.L.; investigation, C.R.; supervision, Z.Y. All authors have read and agreed to the published version of the manuscript.

Funding

This work was supported by the Mine Underground Engineering Ministry of Education Engineering Research Center Open Fund Project (JYBGCZX2022103), the Key Laboratory of Underground Engineering and Disaster Control of Henan Province Open Fund Project (KFKT 2023-06), the Natural Science Foundation of Anhui Province (2408085ME147), and the Key Laboratory of Building Structure and Underground Engineering of Anhui Province (KLBSUE-2023-02).

Data Availability Statement

The data used to support the findings of this study are available from the corresponding author upon request.

Conflicts of Interest

The authors declare that they have no known competing financial interests or personal relationships that could have appeared to influence the work reported in this paper.

References

  1. Xiang, L.; Wang, F.; Jin, B.; Ouyang, O. Study on temperature field distribution of connecting passage construction in red sandstone strata by freezing method. J. Civ. Eng. 2020, 53, 306–311. [Google Scholar]
  2. Alzoubi, M.A.; Xu, M.; Hassani, F.P.; Poncet, S.; Sasmito, A.P. Artificial ground freezing: A review of thermal and hydraulic aspects. Tunn. Undergr. Space Technol. 2020, 104, 103534. [Google Scholar] [CrossRef]
  3. Gao, G.; Guo, W.; Zhu, X. Degree of artificial freezing analyses under high seepage condition. Int. J. Heat Mass Transf. 2025, 236, 126352. [Google Scholar] [CrossRef]
  4. Wu, W.; Yan, Q.; Zhang, C.; Yang, K.; Xu, Y. A novel method to study the energy conversion and utilization in artificial ground freezing. Energy 2021, 234, 121066. [Google Scholar] [CrossRef]
  5. Yang, Y.; Lei, D.; Chen, Y.; Cai, C.; Hou, S. Coupled thermal-hydro-mechanical model of deep artificial freezing clay. Cold Reg. Sci. Technol. 2022, 198, 103534. [Google Scholar] [CrossRef]
  6. Li, F.; Fang, L.; Wang, L.; Ding, H. Research on frost heave deformation control of close tunnel on operating station. J. Civ. Eng. 2020, 53, 292–299. [Google Scholar]
  7. Hou, S.; Yang, Y.; Chen, Y.; Lei, D.; Cai, C. Analysis of Coupled Seepage and Temperature Fields of Fractured Porous Rock Mass under Brine–Liquid Nitrogen Freezing. J. Mar. Sci. Eng. 2022, 10, 787. [Google Scholar] [CrossRef]
  8. Li, B.; Li, L.; Huang, L.; Lv, X. The Temperature field evolution and water migration law of coal under low-temperature freezing conditions. Int. J. Environ. Res. Public Health 2021, 18, 13188. [Google Scholar] [CrossRef]
  9. Nikolaev, P.; Jivkov, A.P.; Margetts, L.; Sedighi, M. Modelling artificial ground freezing subjected to high velocity seepage. Int. J. Heat Mass Transf. 2024, 221, 125084. [Google Scholar] [CrossRef]
  10. Alzoubi, M.A.; Madiseh, A.; Hassani, F.P.; Sasmito, A.P. Heat transfer analysis in artificial ground freezing under high seepage: Validation and heatlines visualization. Int. J. Therm. Sci. 2019, 139, 232–245. [Google Scholar] [CrossRef]
  11. Liu, B.; Han, Q.; Han, Y.; Li, T.; Ma, S.; Zhang, B. An optimized method for analysis of existing tunnels undercrossed by new tunnels in rich-water strata. Transp. Geotech. 2024, 49, 101436. [Google Scholar] [CrossRef]
  12. Kang, Y.; Hou, C.; Li, K.; Liu, B.; Sang, H. Evolution of temperature field and frozen wall in sandy cobble stratum using LN2 freezing method. Appl. Therm. Eng. 2021, 185, 116334. [Google Scholar] [CrossRef]
  13. Yi, W.B.; Choi, K.H.; Yoon, J.I.; Son, C.H.; Ha, S.J.; Jeon, M.J. Exergy characteristics of R404A indirect refrigeration system using CO2 as a secondary refrigerant. Heat Mass Transf. 2019, 55, 1133–1142. [Google Scholar] [CrossRef]
  14. Wang, J.; Evans, M.; Belusko, M.; Zhao, C.; Liu, M.; Bruno, F. Subcooling effect on the optimal performance for a transcritical CO2 heat pump with cold thermal energy storage. Heat Mass Transf. 2022, 59, 1257–1275. [Google Scholar] [CrossRef]
  15. Zhou, X.; Ren, X.; Ye, X.; Tao, L.; Zeng, Y.; Liu, X. Temperature field and anti-freezing system for cold-region tunnels through rock with high geotemperatures. Tunn. Undergr. Space Technol. 2021, 111, 103843. [Google Scholar] [CrossRef]
  16. Zhang, S.; Zhou, X.-M.; Ma, W.; Liu, Y.; Lu, C. Longitudinal temperature acquisition system of ground freezing and its application in solving temperature field. Cold Reg. Sci. Technol. 2023, 213, 103911. [Google Scholar] [CrossRef]
  17. Yan, Q.; Wu, W.; Zhong, H.; Zhao, Z.; Zhang, C. Temporal and spatial variation of temperature and displacement fields throughout cross-passage artificial ground freezing. Cold Reg. Sci. Technol. 2023, 209, 103817. [Google Scholar] [CrossRef]
  18. Chen, W.; Wan, W.; He, H.; Liao, D.; Liu, J. Temperature field distribution and numerical simulation of improved freezing scheme for shafts in loose and soft stratum. Rock Mech. Rock Eng. 2024, 57, 2695–2725. [Google Scholar] [CrossRef]
  19. Zhang, S.; Yue, Z.; Sun, T.; Zhang, J.; Huang, B. Analytical determination of the soil temperature distribution and freezing front position for linear arrangement of freezing pipes using the undetermined coefficient method. Cold Reg. Sci. Technol. 2021, 185, 103253. [Google Scholar] [CrossRef]
  20. Zhou, J.; Zhao, W.; Tang, Y. Practical prediction method on frost heave of soft clay in artificial ground freezing with field experiment. Tunn. Undergr. Space Technol. 2021, 107, 103647. [Google Scholar] [CrossRef]
  21. Rong, C.; Sun, S.; Cheng, H.; Duan, Y.; Yang, F. Experimental Study on Temporal and Spatial Evolutions of Temperature Field of Double-Pipe Freezing in Saline Stratum with a High Velocity. Energies 2022, 15, 1308. [Google Scholar] [CrossRef]
  22. Sun, L.; Shi, P.; Lang, R.; Shang, A. Laboratory model test on artificial freezing behavior under seepage. Chin. J. Rock Mech. Eng. 2024, 43, 3530–3542. [Google Scholar]
  23. Wang, B.; Rong, C.; Cheng, H. Analytical solution of steady-state temperature field of asymmetric frozen curtain induced by directional seepage. Eng. Sci. Technol. 2022, 54, 76–87. [Google Scholar]
  24. Zhang, S.; Zhou, X.; Zhang, J.; Sun, Q.; Liu, Y.; Ma, W.; Xu, H. Method for solving temperature field of single row pipe based on temperature Rise Formula of freezer. J. Railw. Sci. Eng. 2024, 21, 1102–1113. [Google Scholar]
  25. Hong, Z.; Fu, S.; Hu, X.; Wang, B. Analytical solution of artificial freezing temperature field under adiabatic boundary. J. Tongji Univ. (Nat. Sci.) 2024, 52, 749–758. (In Chinese) [Google Scholar]
  26. Cai, H.; Xu, L.; Yang, Y.; Li, L. Analytical solution and numerical simulation of the liquid nitrogen freezing-temperature field of a single pipe. AIP Adv. 2018, 8, 055119. [Google Scholar] [CrossRef]
  27. Long, W.; Rong, C.; Duan, Y.; Guo, K. Numerical calculation of temperature field by pipe curtain freezing method in Gongbei tunnel. Coal Geol. Explor. 2020, 48, 160–168. [Google Scholar]
  28. Cui, Z.D.; Zhang, L.J.; Xu, C. Numerical simulation of freezing temperature field and frost heave deformation for deep foundation pit by AGF. Cold Reg. Sci. Technol. 2023, 213, 103908. [Google Scholar] [CrossRef]
  29. Yi, Z.; Meng, Q.; Lin, C. Numerical study of supercritical CO2 heat transfer characteristics in twisted oval tubes. Heat Mass Transf. 2025, 61, 8. [Google Scholar] [CrossRef]
  30. Lin, W.; Du, Z.; Gu, A. Analysis on heat transfer correlations of supercritical CO2 cooled in horizontal circular tubes. Heat Mass Transf. 2012, 48, 705–711. [Google Scholar] [CrossRef]
  31. Xu, J.; Zhai, C.; Sang, S.; Sun, Y.; Cong, Y.; Zheng, Y.; Tang, W. Evolution of pore characteristics of coal fractured by liquid CO2 cycle based on low field nuclear magnetic resonance technology. J. China Coal Soc. 2021, 46, 3578–3589. [Google Scholar]
  32. Zhou, X.; Zhou, L.; Jiang, Y.; Bai, G.; Liu, T.; Wang, X. Experimental study on the influence of multiple factors on liquid CO2 freeze-thaw cracking coal. China Saf. Sci. J. 2023, 33, 58–67. [Google Scholar]
  33. Hong, R.; Yuan, B.; Du, W. Analysis of heat transfer deterioration mechanism of supercritical carbon dioxide in vertical riser pipe. Acta Chemologica Sin. 2023, 74, 339–3319. [Google Scholar]
  34. Wang, B.; Liang, X.; Zhang, Z.; Cai, H.; Rong, C. Elastoplastic stress analysis of multi-refrigerant heterogeneous artificial frozen wall. Coal Geol. Explor. 2024, 52, 106–120. [Google Scholar]
  35. Wu, W.; Ding, Z.; Yan, Q.; Zhao, Z. Modification on constant temperature boundary considering conjugate heat transfer of brine turbulent flow in brine artificial ground freezing method. Int. Commun. Heat Mass Transf. 2025, 160, 108387. [Google Scholar] [CrossRef]
  36. Bai, Y.; Sun, Y.; Liu, W.; Sun, P.; Xiao, S. Model test study on the formation of basin-shaped freezing range in sandy gravel stratum under seepage conditions. Therm. Sci. Eng. Prog. 2024, 51, 102601. [Google Scholar] [CrossRef]
  37. GB/T50123-2019; Standard for Geotechnical Test Methods. Water Conservancy and Hydropower Engineering Construction Quality Monitoring Station: Xinyang, China, 2021.
Figure 1. Shape characteristics of homogeneous sand.
Processes 13 01154 g001
Figure 2. Three-dimensional diagram of model test system.
Processes 13 01154 g002
Figure 3. Layout of temperature measuring points.
Processes 13 01154 g003
Figure 4. Test operation steps.
Processes 13 01154 g004
Figure 5. Curve of temperature difference between liquid inlet and outlet and time. (a) Transcritical CO2 freezing process. (b) Alcohol freezing process.
Processes 13 01154 g005
Figure 6. Temperature change rule of measuring points. (a) Temperature measuring points of transcritical CO2 freezing test. (b) Temperature measuring points of alcohol freezing test.
Processes 13 01154 g006
Figure 7. Comparison of temperature field curves of transcritical CO2 and alcohol.
Processes 13 01154 g007
Figure 8. Three-dimensional freezing temperature field curve of transcritical CO2 and alcohol. (a) Temperature field curve of transcritical CO2 freezing test for 3 h. (b) Temperature field curve of alcohol freezing test for 3 h. (c) Temperature field curve of transcritical CO2 freezing test for 6 h. (d) Temperature field curve of alcohol freezing test for 6 h.
Processes 13 01154 g008
Figure 9. Single-pipe freezing diagram.
Processes 13 01154 g009
Figure 10. The error analysis of test data and theoretical calculation value of transcritical CO2.
Processes 13 01154 g010aProcesses 13 01154 g010b
Figure 11. The relationship between freezing front radius and time of four refrigerants at different freezing temperatures. (a) Freezing of alcohol. (b) Freezing of brine. (c) Freezing of transcritical CO2. (d) Freezing of liquid nitrogen.
Processes 13 01154 g011aProcesses 13 01154 g011b
Figure 12. Development law of transcritical CO2 frozen wall.
Processes 13 01154 g012
Table 1. Physical and thermodynamic parameters of round sand.
StatusArgumentNumerical Value
Unfrozen soilParticle size (mm)1 ± 0.15
Dry density (kg/m3)1612
Saturation density (kg/m3)2480
Water content28%
Thermal diffusivity (m2/d)0.1028
Thermal conductivity (kcal/m·d·°C)35.93
Frozen soilLatent heat of icing25,663.04
Freezing temperature (°C)−1
Unfrozen water content8%
Thermal diffusivity (m2/d)0.0651
Thermal conductivity (kcal/m·d·°C)43.36
Table 2. Transcritical CO2 freezing parameters.
R0TdT0Tc
10 mm−1 °C28 °C−45 °C
Table 3. Development law of transcritical CO2 freezing range.
Time (h)Thickness (mm)Area (mm2)
446.979877.12
861.5315,751.94
1271.8420,717.05
1680.0925,170.89
2087.0829,279.01
2290.2431,236.90
2391.7532,194.62
2493.2133,134.23
Disclaimer/Publisher’s Note: The statements, opinions and data contained in all publications are solely those of the individual author(s) and contributor(s) and not of MDPI and/or the editor(s). MDPI and/or the editor(s) disclaim responsibility for any injury to people or property resulting from any ideas, methods, instructions or products referred to in the content.

