Article

Hydrodynamic Characterization of Particle–Bubble Aggregate Transport: Bubble Load Dynamics During Vertical Ascent

1
Key Laboratory of High-Effcient Mining and Safety of Metal-Mines, Ministry of Education (USTB), University of Science and Technology Beijing, Beijing 100083, China
2
State Key Laboratory of Mineral Processing Science and Technology, BGRIMM Group, Beijing 100160, China
3
BGRIMM Machinery & Automation Technology Co., Ltd., Beijing 100160, China
*
Authors to whom correspondence should be addressed.
Processes 2025, 13(4), 1218; https://doi.org/10.3390/pr13041218
Submission received: 23 March 2025 / Revised: 11 April 2025 / Accepted: 15 April 2025 / Published: 17 April 2025
(This article belongs to the Special Issue Mineral Processing Equipments and Cross-Disciplinary Approaches)

Abstract

:
Precise evaluation of flotation performance facilitates process optimization and separation efficiency enhancement, while bubble load quantification emerges as a critical diagnostic tool increasingly recognized within mineral processing research. This study introduces an enhanced bubble load measurement system that integrates equilibrium principles with vacuum suction technology. The system ensures stable and continuous sampling, significantly improving the precision and efficiency of bubble load measurements in flotation processes. Through synchronized testing in roughing and scavenging operations, dynamic variations in bubble load and their relationships with particle size and ore grade were analyzed. Results reveal contrasting trends: bubble load increased during roughing but decreased during scavenging. The distributions of particle size and mineral content carried by bubbles further highlight correlations between bubble stability and flotation efficiency. These findings provide practical guidelines for optimizing equipment design and operational parameters, demonstrating significant potential for advancing intelligent monitoring in mineral processing systems.

1. Introduction

Flotation, as a physicochemical separation technology widely applied in mineral processing, wastewater treatment, and related fields, relies fundamentally on interactions between bubbles and particles [1]. With growing global resource demands, enhancing flotation efficiency has become critical for improving mineral recovery rates, conserving resources, and mitigating environmental impacts [2,3]. The essence of flotation lies in the interaction process between mineral particles and bubbles, encompassing four stages: capture, mineralization, transport, and froth stabilization. Multiple factors govern its efficiency, including mineral surface properties, reagent regimes, bubble characteristics, flow field hydrodynamics, and froth stability [4,5,6]. Accurate evaluation of flotation performance is crucial for optimizing operational conditions and advancing separation efficiency, offering significant practical value.
Bubble load, a core parameter reflecting separation efficacy in flotation, is defined as the mineral mass adhered to per unit bubble volume or surface area [7]. This parameter quantifies the loading characteristics of particle–bubble aggregates, serving as a key criterion for assessing flotation performance [8]. Bubble load is influenced by diverse factors including physicochemical properties of mineral particles, bubble size/stability, reagent concentration, and hydrodynamic conditions within the flotation cell [9,10,11]. Notably, these factors vary across different stages (e.g., rougher stage, scavenger stage, cleaner stage) within the same mineral processing circuit.
As mineralized bubbles ascend, bubble load dynamically varies, significantly influencing flotation performance evaluation [12]. Precise measurement and control of bubble load are critical for optimizing flotation performance. In particular, during scaling-up of flotation cells, the extended rising distance of mineralized bubbles amplifies bubble load fluctuations, thereby directly affecting the final recovery rate and concentrate grade. Recent years have seen growing interest in bubble load rate measurement. When integrated with techniques for assessing other flotation kinetic parameters, this integration provides a holistic understanding of the flotation process [13,14,15,16]. Seaman [17] developed an innovative bubble load measurement device and implemented the device to analyze bubble load in industrial-scale flotation cells. Yianatos [18] employed a similar method to evaluate froth recovery in a 130 m3 flotation machine and explored the impact of fine particle entrainment. These findings underscore the idea that bubble load measurement is an effective tool for flotation process analysis.
However, existing bubble load measurement devices still face limitations in industrial applications. For instance, while Dyer’s apparatus has a total volume of 5 L, its effective volume of only 2 L leads to extended sampling durations [19,20]. In low bubble load scenarios (e.g., scavenger operations), the initial sample volume may inadequately meet analytical demands, and repeated sampling may induce measurement errors. Furthermore, drainage processes may allow mineralized bubbles or particles to escape from the device’s riser tube, causing result deviations. This issue was partially addressed by Moys [20] through integration of a regulation port into the test apparatus, achieving a measurement standard deviation of 0.72%. Despite these improvements, the stability and continuous operation of current devices remain suboptimal.
To overcome the limitations of existing bubble load measurement systems, recent studies have made significant advancements. Ata [21] employed high-speed imaging to establish a quantitative correlation between particle surface coverage on bubbles and bubble load. Nissinen [22] developed a soft-sensing method based on mineralized-bubble conductivity for bubble load estimation. Ge [23] numerically simulated particle characteristic factors influencing bubble load through computational models. Collectively, bubble load measurement research is advancing toward smart, real-time capabilities [24]; however, challenges persist in measurement accuracy and stability.
This study introduces an enhanced bubble load measurement system combining the equilibrium method and vacuum suction technology, enabling continuous and stable sampling with improved precision and efficiency. Through synchronous testing and analysis of parallel industrial flotation circuits, this study elucidates dynamic bubble load variations and their relationships with mineral particle size and grade. These findings deepen the mechanistic understanding of flotation selectivity, thereby offering novel practical guidelines for process optimization.

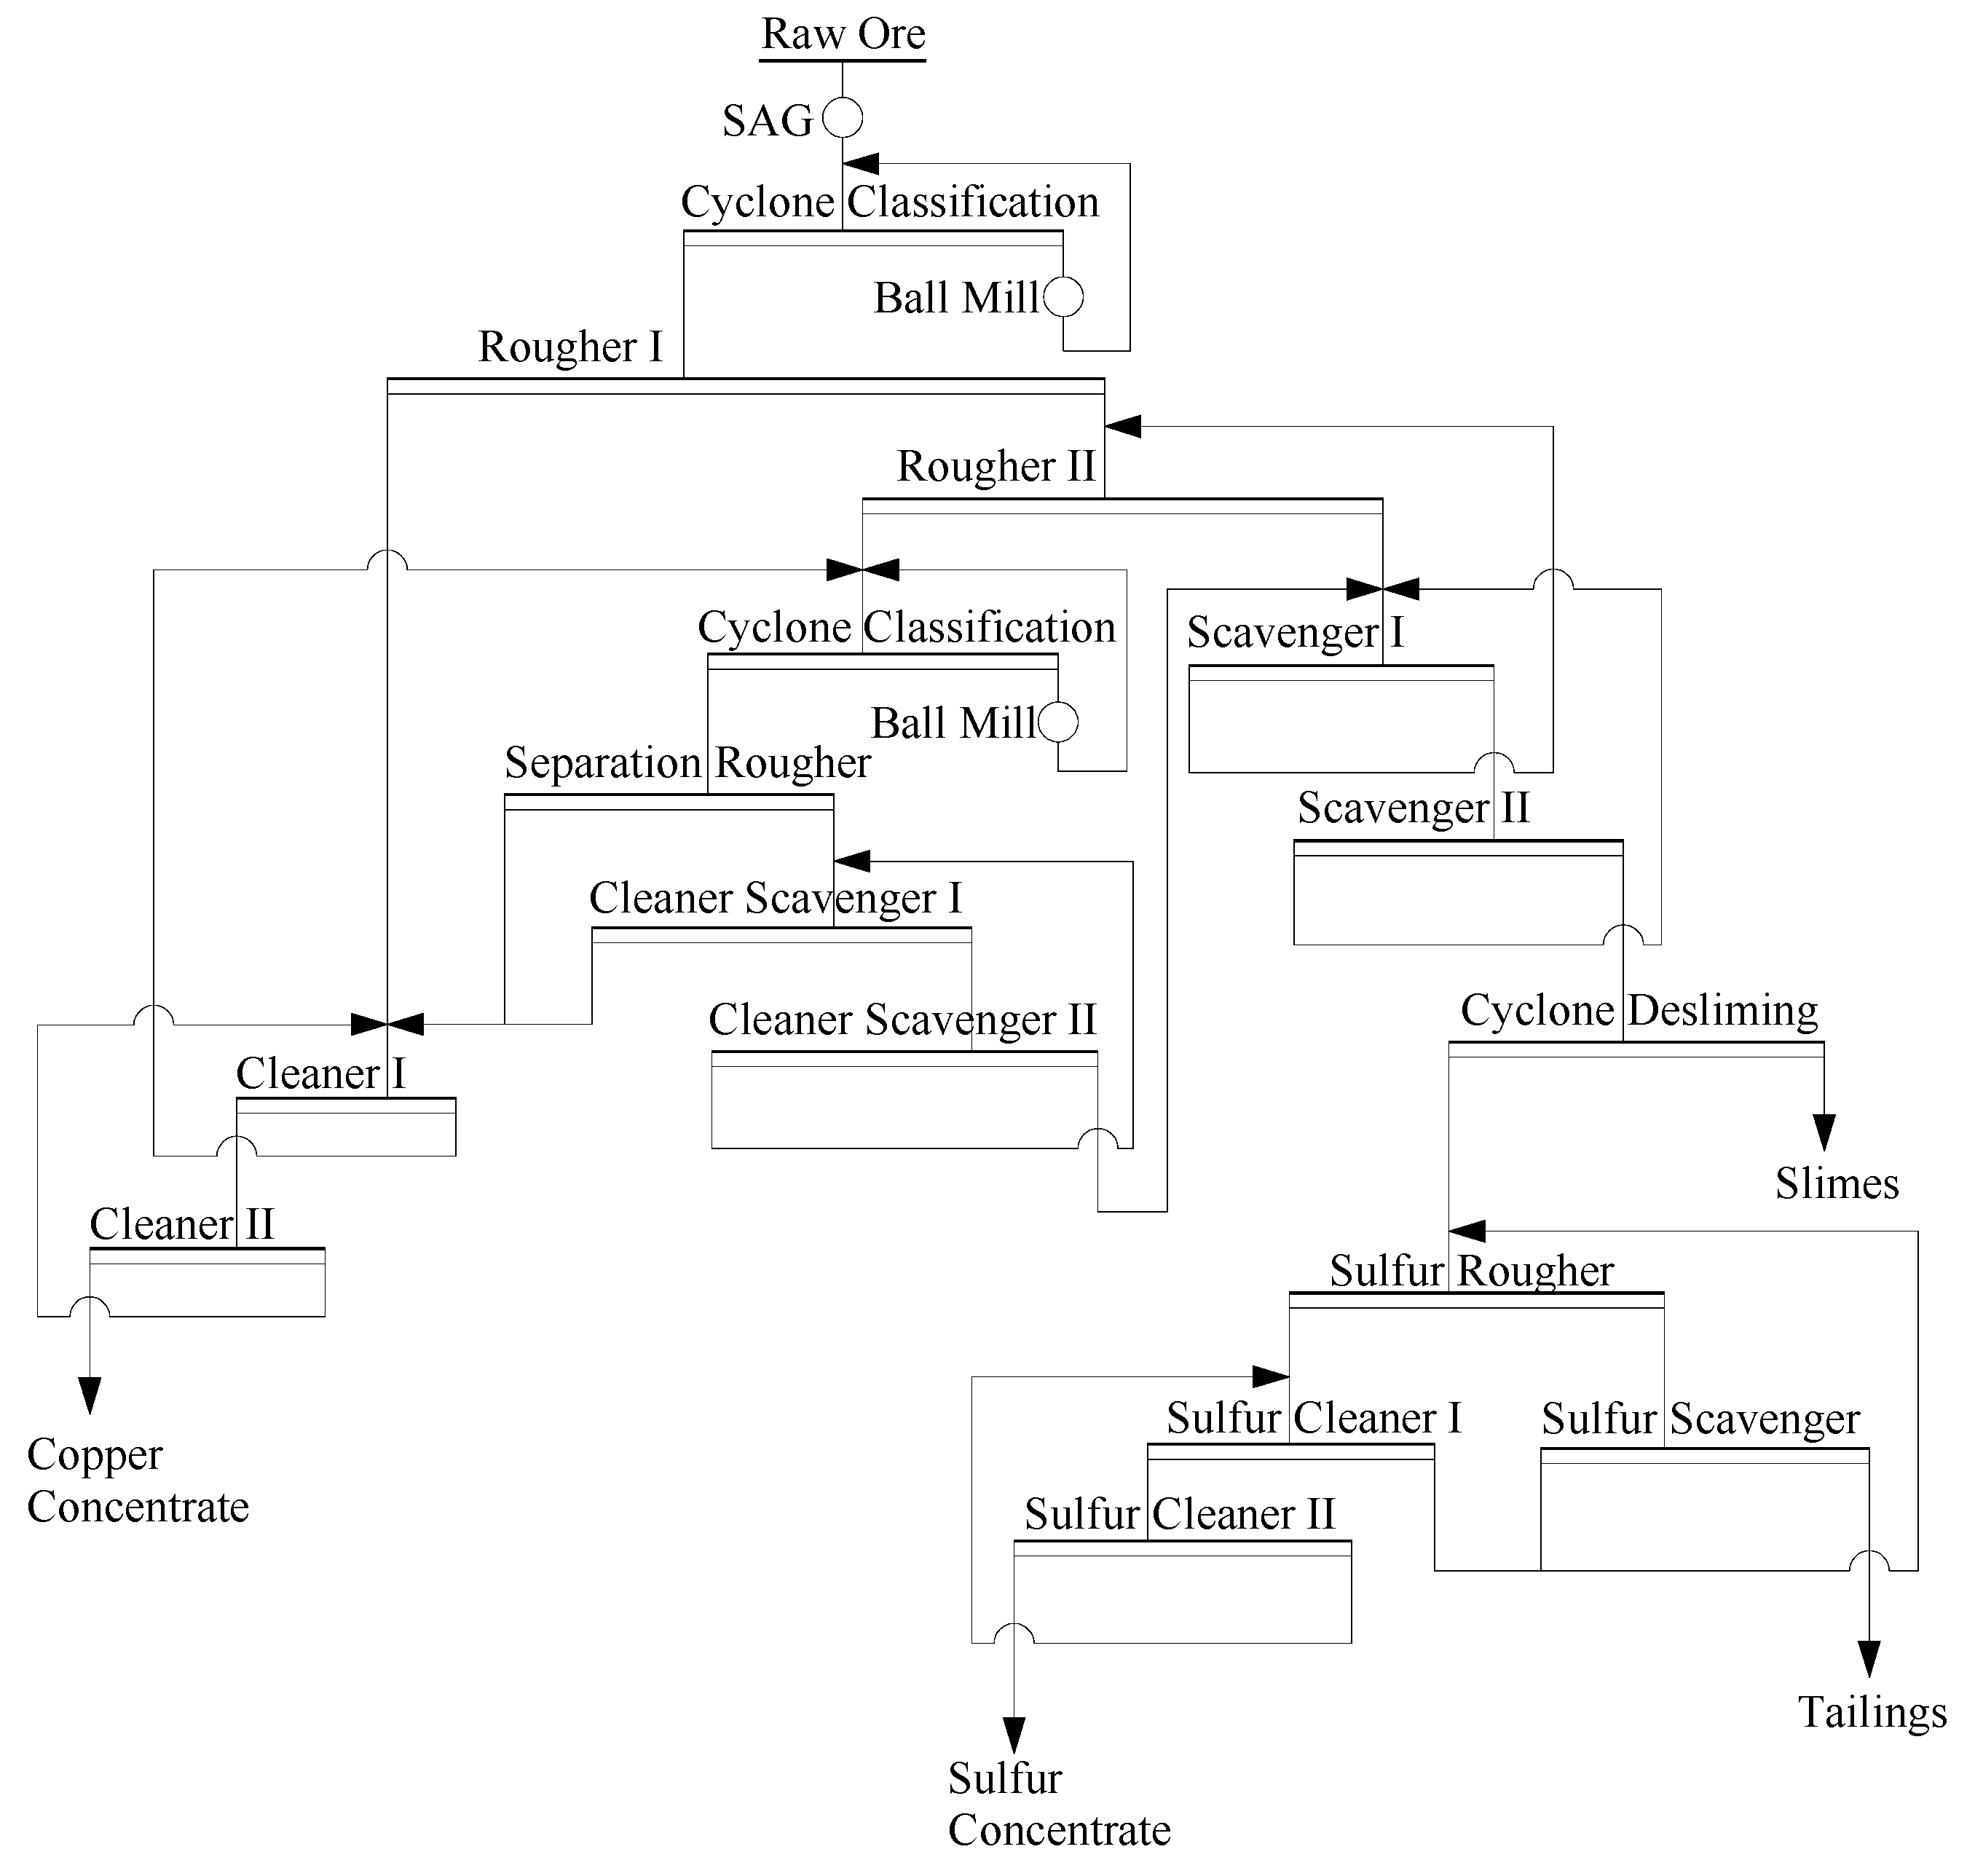
2. Mineralogical Characteristics and Processing Flowsheet

2.1. Mineralogical Characteristics

The Jiangxi copper deposit is a large polymetallic deposit primarily composed of copper sulfide ores, with associated gold, silver, and other valuable elements (Table 1). The orebody is hosted in the contact zones among carbonate, clastic, and igneous rocks. More than 70 types of ore minerals exhibiting complex mineralogical compositions have been identified. Dominant metallic minerals include pyrite, chalcopyrite, chalcocite, digenite, bornite, covellite, enargite, tennantite, sphalerite, galena, molybdenite, arsenopyrite, malachite, azurite, magnetite, hematite, and native copper (Table 2). Gangue minerals are primarily quartz, garnet, calcite, feldspar, and kaolinite. Ore textures are dominated by massive, disseminated, and veinlet-disseminated structures, supplemented by loose, brecciated, banded, pseudo-banded, and annular textures [25].

2.2. Process Flowsheet

The beneficiation plant operates with two parallel circuits (line I and line II), both following a copper-first and sulfur-later sequence (see Figure 1). The copper concentrate circuit involves two rougher stages, two scavenger stages, one separation–rougher stage, two cleaning–scavenger stages, and two cleaner stages. Copper tailings undergo desliming process and are subsequently processed through one rougher stage, one scavenger stage, and two cleaner stages to produce sulfur concentrate.

3. Sampling and Testing

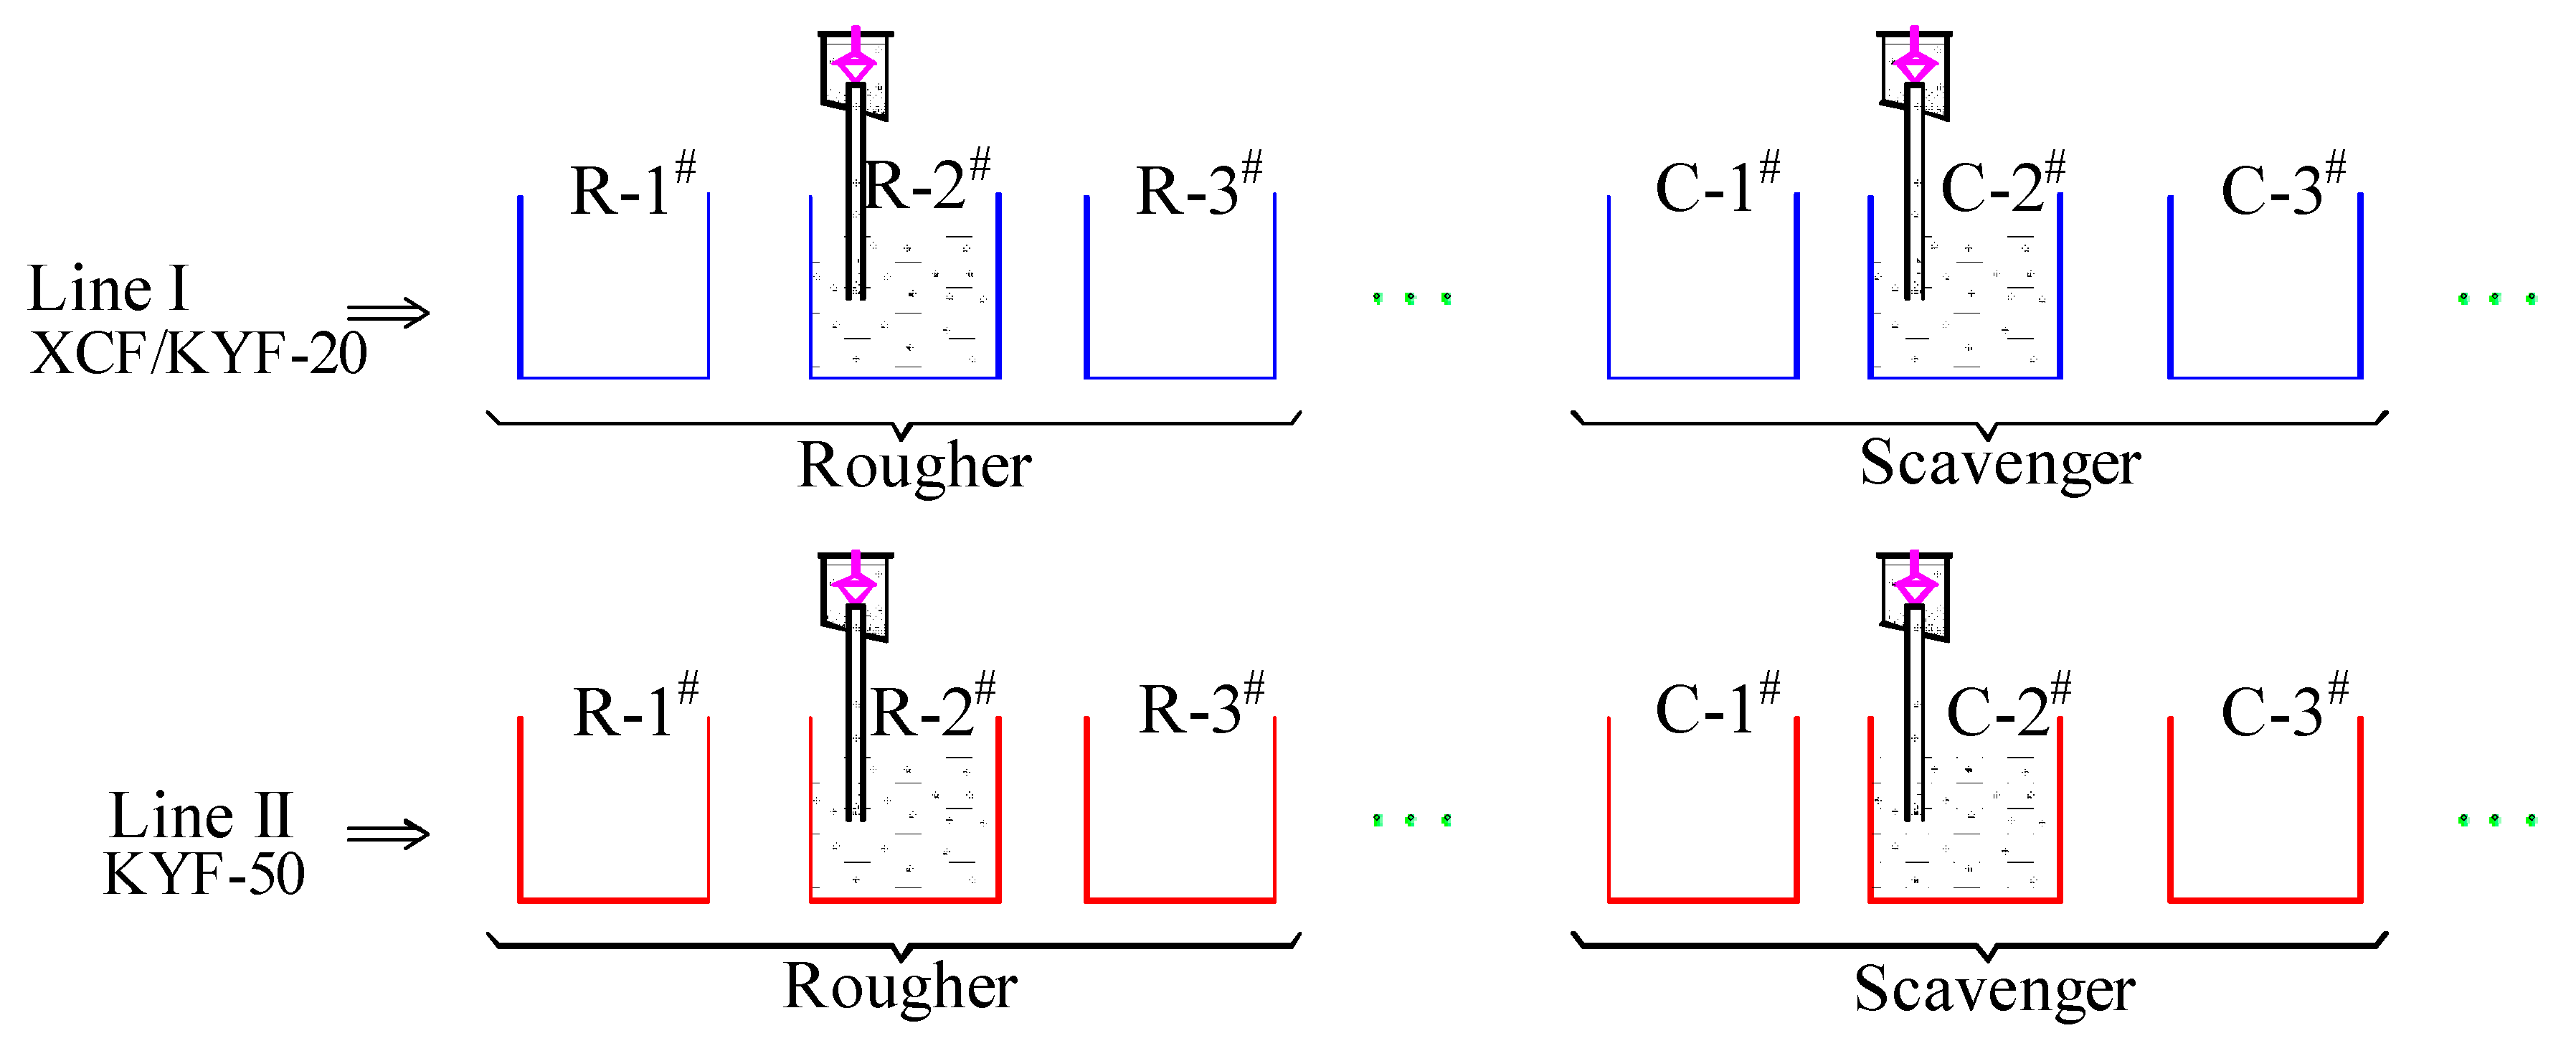
3.1. Testing Apparatus

This study utilizes an innovative bubble load measurement apparatus comprising a riser tube, collection chamber, gas conduit, and measurement cylinder (see Figure 2). Distinct from Seaman’s design [7], the new apparatus employs an equilibrium-based principle. The vacuum pump evacuates gas from the collection chamber while implementing real-time suction volume modulation to maintain a stable gas–liquid interface, thereby reducing particle entrainment and sampling volume insufficiency induced by fluid flow dynamics.
The aeration rate is quantified at the vacuum pump outlet through a water displacement system. This technique allows the cumulative collection of bubble volumes during extended sampling periods (≥30 min), whereas bubble-entrained particles settle within the sampler for analysis.

3.2. Sampling

Froth flotation processes typically comprise three sequential stages: rougher, cleaner, and scavenger stages. The rougher stage achieves rapid recovery of the majority of valuable minerals, whereas the scavenger stage targets residual valuables in rougher tailings. The combined efficiency of these two stages fundamentally determines the overall mineral recovery in beneficiation processes. This comparative study was implemented in two parallel flotation circuits (line I and line II) within the same concentrator plant, operating under deliberately matched process flowsheets and reagent regimes. Line I utilizes eight XCF/KYF-20 flotation cells (Designed and manufactured by BGRIMM-MAT, Beijing, China) for sulfur rougher and scavenger operations at 2000 t·d−1 throughput, while line II employs nine KYF-50 flotation cells (Designed and manufactured by BGRIMM-MAT, Beijing, China) for the equivalent processing stages, achieving 5000 t·d−1 capacity.
Bubble load sampling was systematically conducted at the second flotation cells in both the rougher and scavenger circuits of each production line. Spatial sampling involved collecting ore slurry from four vertical measurement planes (baseline: 950 mm ±5 mm below overflow weir) with 150 mm vertical intervals between adjacent sampling ports, with spatial coordinates documented in Figure 3. All acquired samples underwent standardized particle size analysis and sulfur grade determination.

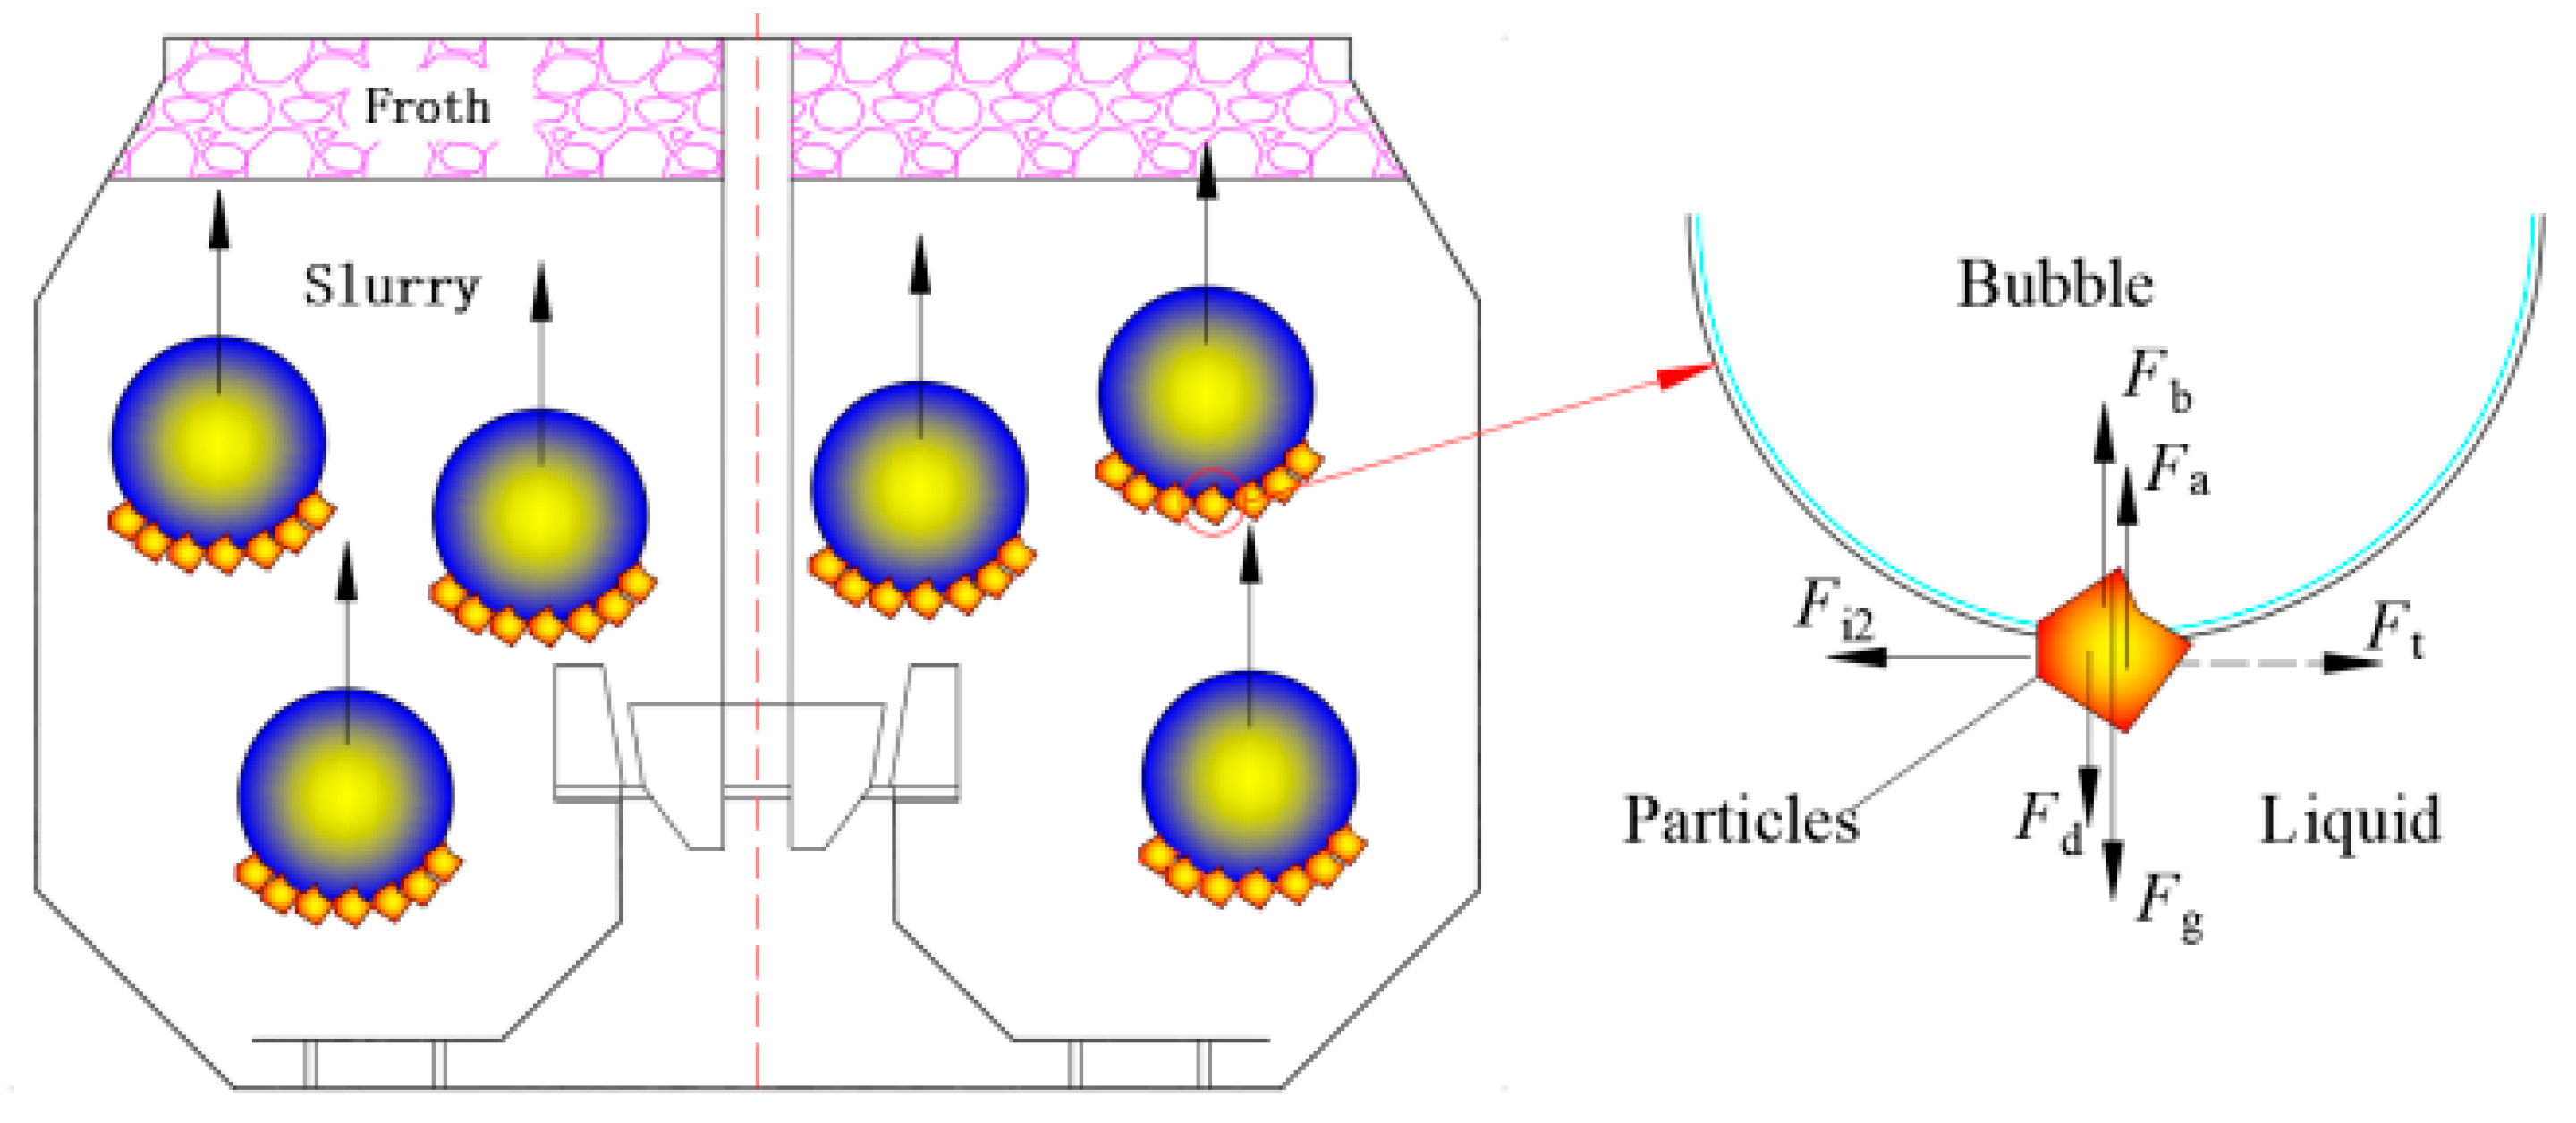
3.3. Stability Analysis of Particle–Bubble Aggregates (PBAs) During Ascension

The ascent dynamics of particle–bubble aggregates (PBAs, mineralized bubbles) involve complex force interactions that collectively determine bubble–particle stability. Buoyancy force drives PBA ascent through the pulp phase, counteracted by gravitational settling and viscous drag forces. Interfacial adhesive forces enhance particle attachment to bubble surfaces, in contrast to destabilizing inertial/turbulent forces that may compromise PBAs’ structural integrity [26]. The quantitative force balance governing mineralized bubble trajectories is systematically analyzed in Figure 4 with vector resolution diagrams. Precise optimization of these competing force interactions constitutes a critical control parameter for flotation process intensification.
When mineral particles carried by bubbles are in uniform ascent or static equilibrium, the force balance is expressed as
F b , F a , F d , F g , F t = 0
Under accelerated, ascent or when turbulent forces (Ft) vary due to flow-field perturbations,
F b , F a , F d , F g , F t = m p a = F i
where the following elements are represented:
  • Fb—Buoyancy force (N);
  • Fa—Adhesive force (N);
  • Fd—Viscous drag force (N);
  • Fg—Gravitational force;
  • Ft—Turbulent force (N);
  • Fi—Inertial force (N);
  • mp—Particle mass (kg);
  • a—Acceleration (m/s2).
The ascent of mineralized bubbles involves a transition from acceleration to steady-state velocity, coupled with dynamically changing turbulent forces. Both factors (imbalanced forces during acceleration and turbulent fluctuations) critically destabilize mineralized bubbles.
The primary objective of this study is to investigate how flotation cell tank structure and flow-field characteristics affect the stability of mineralized bubbles (MBs) during ascension. To isolate these factors, constraints are applied; variations in mineral properties, reagent schemes, and aeration parameters are excluded, with analysis focused solely on force interactions governing MBs within the flotation cell. During accelerated MBs ascent, four forces act simultaneously: buoyancy (Fb), gravity (Fg), viscous drag (Fd), and inertia (Fi). Particle detachment occurs when
F b , F d , F g , F t , F i > F a
Furthermore, the ascension of MBs is subjected to multidirectional turbulent forces (TF). TF are irregular forces exerted on bubbles and particles, which simultaneously enhance bubble–particle collision frequency (promoting attachment) and destabilize PBAs, leading to particle detachment. TF exhibit spatial heterogeneity within flotation cells, and different mineralogical properties and reagent regimes demand tailored turbulence adaptability. Investigating optimal ore characteristics and the internal flow fields of cells will enhance beneficiation recovery rates.
Turbulent forces lack a simplified mathematical expression and are governed by the anisotropic turbulence dissipation rate (ε) and fluid viscosity. Schulze [27] demonstrated that the critical acceleration governing particle detachment depends on TF intensity, hypothesizing that detachment occurs when the turbulent eddy length scale matches the bubble–particle aggregate dimensions. He introduced the stability probability (Ps) to quantify particle–bubble attachment stability. Bloom and Heindel [28] experimentally modified the Ps calculation as
P s = 1 exp A s 1 1 Bo
where
As = 0.5 (empirical constant)
Bo* = modified Bond number
The modified Bond number (Bo*), defined as the detachment-to-adhesion force ratio, governs particle–bubble attachment stability:
Bo = d p 2 Δ ρ p g + 1.9 ρ p ε 2 / 3 d p 2 + d b 2 1 / 3 + 1.5 d p 4 σ d b d b ρ f g sin 2 π θ 2 6 σ sin π θ 2 sin π + θ 2
where
  • d p = P a r t i c l e d i a m e t e r [μm]
  • Δ ρ p = ρ p ρ f (particle-fluid density difference) [kg/m3]
  • g = 9.81   [ m / s 2 ]
  • ρ p = P a r t i c l e d e n s i t y k g / m 3
  • ε = E n e r g y d i s s i p a t i o n r a t e   [ W / k g ]
  • d b = B u b b l e d i a m e t e r m m
  • σ = S u r f a c e t e n s i o n N / m
  • ρ f = F l u i d d e n s i t y k g / m 3
  • θ = C o n t a c t a n g l e [°]
Analysis of the Bo* formulation indicates that the turbulent kinetic energy dissipation rate (ε, m2·s−3) dominantly controls attachment stability. Consequently, flow-field simulations effectively map the spatial distribution of turbulent regimes within flotation cells. Figure 5 demonstrates heterogeneous ε distribution zones in the cell interior. Ascending mineralized bubbles traverse alternating high ε and low ε regions, thereby dynamically influencing their stability.

4. Results and Discussion

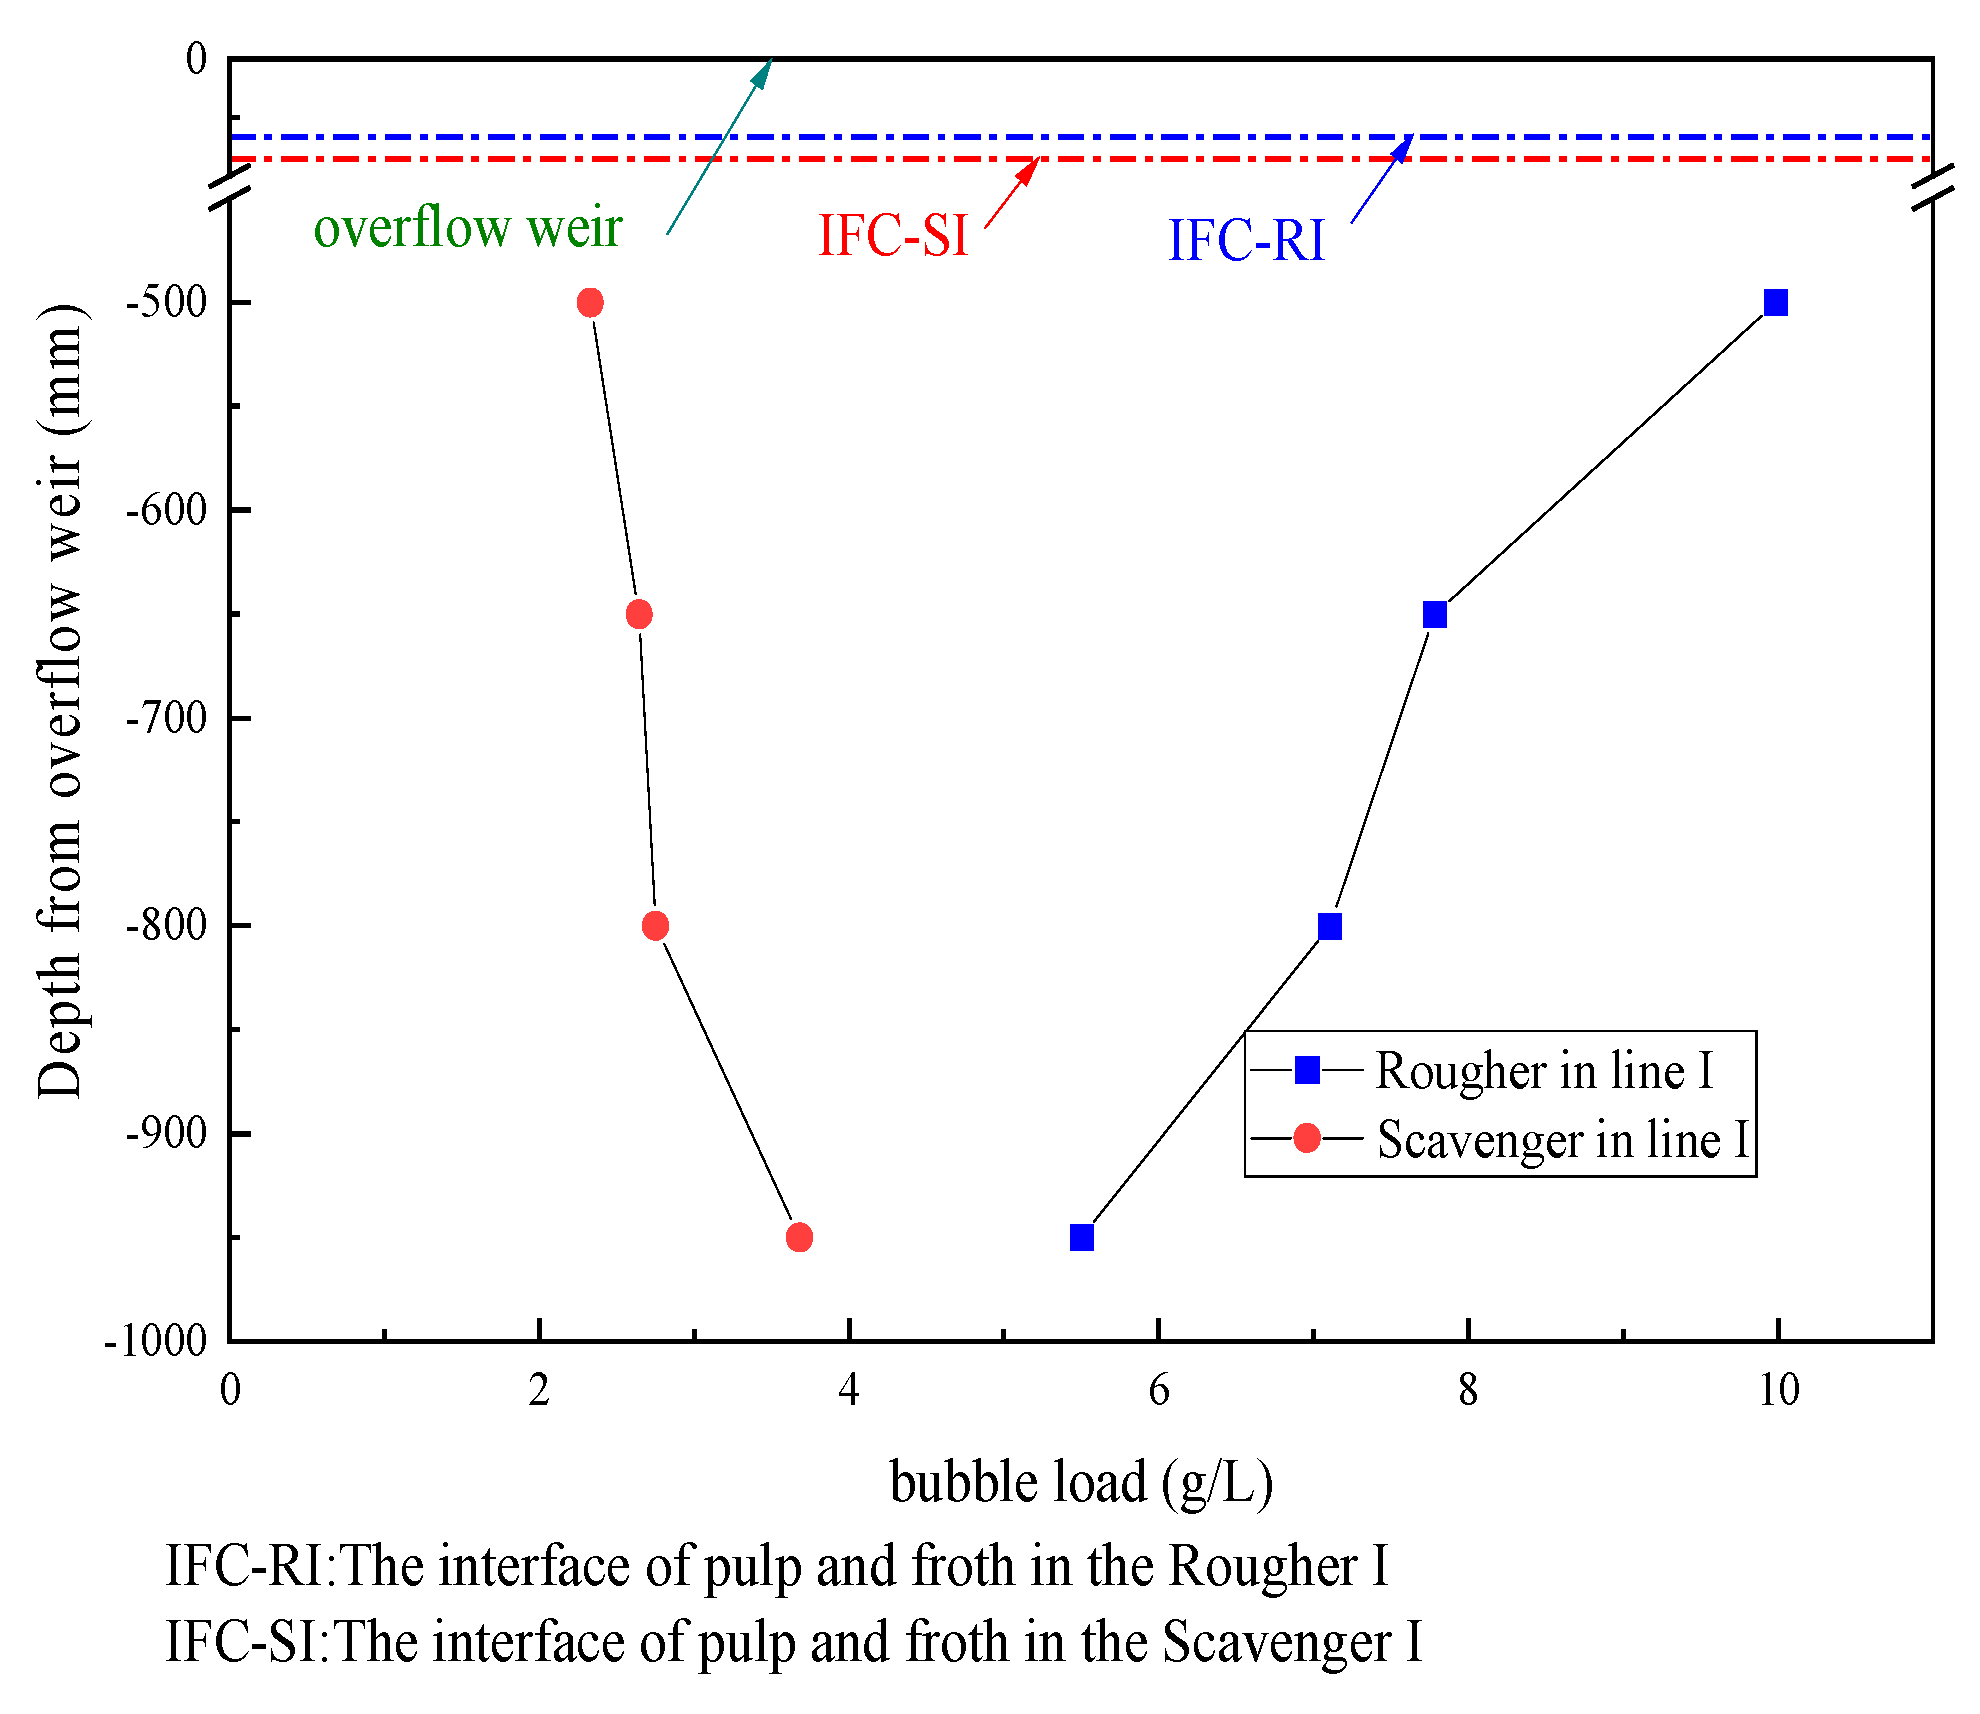
4.1. Trend Analysis of Bubble Load Dynamics

Mineralized bubbles bearing particle–bubble aggregates ascend to the froth phase; however, the mass of attached particles undergoes dynamic changes during this upward transport. The bubble load demonstrates discernible variation patterns as the bubbles rise. Elucidating these hydrodynamic trends provides critical insights into the actual flotation mechanism.
Figure 6 quantifies the bubble load characteristics of the rougher flotation cell (R-2#) within the line I processing circuit. The bubble load demonstrates a gradual upward trend with ascending sampling positions, peaking at 10 g/L in the uppermost position (h = −500 mm relative to overflow weir). Conversely, the scavenger flotation cell (C-2#) exhibits an inverse hydrodynamic behavior: the bubble load systematically decreases as sampling positions rise. The uppermost position in the scavenger cell registers a bubble load of 2.33 g/L, with minimal variations observed across all sampling points.
Figure 7 delineates the bubble load dynamics in both rougher (R-2#) and scavenger (C-2#) flotation cells within the line II. While maintaining consistent trend patterns with line I, the line II processing circuit demonstrates elevated load magnitudes. In the rougher cell, the bubble load reaches 16 g/L at the uppermost position (−500 mm), demonstrating 60% enhancement over line I’s maximum capacity (10 vs. 16 g/L). The scavenger cell manifests analogous inverse hydrodynamics; systematic reduction in bubble load correlates with ascending sampling positions. Notably, the scavenger cell registers its peak bubble load of 20 g/L at the deepest sampling point (−1200 mm), outperforming the rougher cell’s maximum capacity. Subsequent positional elevation results in progressive load decline, culminating in 8.47 g/L at the uppermost position (−500 mm), 47.1% lower than the rougher cell’s peak value.
Figure 6 and Figure 7 demonstrate distinct hydrodynamic patterns; bubble load systematically accumulates with vertical elevation in rougher cells, whereas scavenger cells show inverse depletion characteristics. The line II rougher operation achieves a maximum bubble load of 16 g/L, demonstrating 88.2% capacity enhancement compared to line I, a divergence mechanistically governed by pulp phase properties, process parameters, and impeller design variations.
Although Amir Eskanlou [12] observed consistent vertical bubble load variation trends in laboratory flotation columns with our rougher stage results, his experiments solely used 99.64% pure quartz monomineral samples, failing to replicate actual ore characteristics of multi-stage mineral processing. Meanwhile, Yianatos et al. [7,29] conducted bubble load measurements across different flotation stages (e.g., rougher/scavenger) in industrial flotation machines, yet neglected layered analyses through vertical bubble rising paths, leaving critical gaps in understanding dynamic load variation mechanisms.

4.2. Characterizing Particle Size Distribution in Flotation Bubble Loads

The particle size distribution in mineralized bubble-carrying particles was analyzed during their ascent. Figure 8a demonstrates a gradual decline in fine particle (−38 μm) mineralization content across ascending sampling points within rougher cells of line I. This trend correlates with observable bubble load variations in Figure 6, indicating that coarse particles (+38 μm) exhibit stronger adhesion stability than fine ones during bubble transport.
Figure 8b demonstrates that in the scavenger flotation cells of line I, the proportion of fine-sized (−38 μm) mineral particles attached to bubbles initially increases and then decreases as the sampling depth ascends, whereas the proportion of medium-sized (+38–74 μm) particles first decreases and then increases. The coarse-sized (+74 μm) particles show a consistent upward trend in proportion. As illustrated in Figure 6, the bubble load gradually diminishes during the scavenging process, a phenomenon mainly caused by the detachment of fine-sized minerals.
Figure 8c indicates that within the rougher stage of line II, the particle size distribution across all fractions remains stable (±2% variation range) with increasing sampling depth. This stability correlates with the progressive bubble load accumulation trend observed in Figure 7, demonstrating that particle attachment during the rougher process exhibits near size-independent behavior as mineralized bubbles ascend through the pulp phase.
Figure 8d indicates that in the scavenger flotation cells of line II, the particle size distribution varies significantly across different sampling points. As the mineralized bubbles ascend, the proportion of fine-sized (−38 μm) minerals increases markedly. When correlated with the bubble load trend in Figure 7, it can be deduced that the scavenging process is dominated by the detachment of coarse particles (+38 μm) during the upward movement of mineralized bubbles.
In summary, Figure 8a–d demonstrate that the bubble load exhibits significant variations across different particle size fractions in the scavenging stage of line II. This phenomenon likely contributes to the 12.3% lower sulfur recovery rate observed in line II compared to line I, as evidenced by the scavenger circuit’s reduced efficiency in recovering middling-sized coarse particles (+38–74 μm).

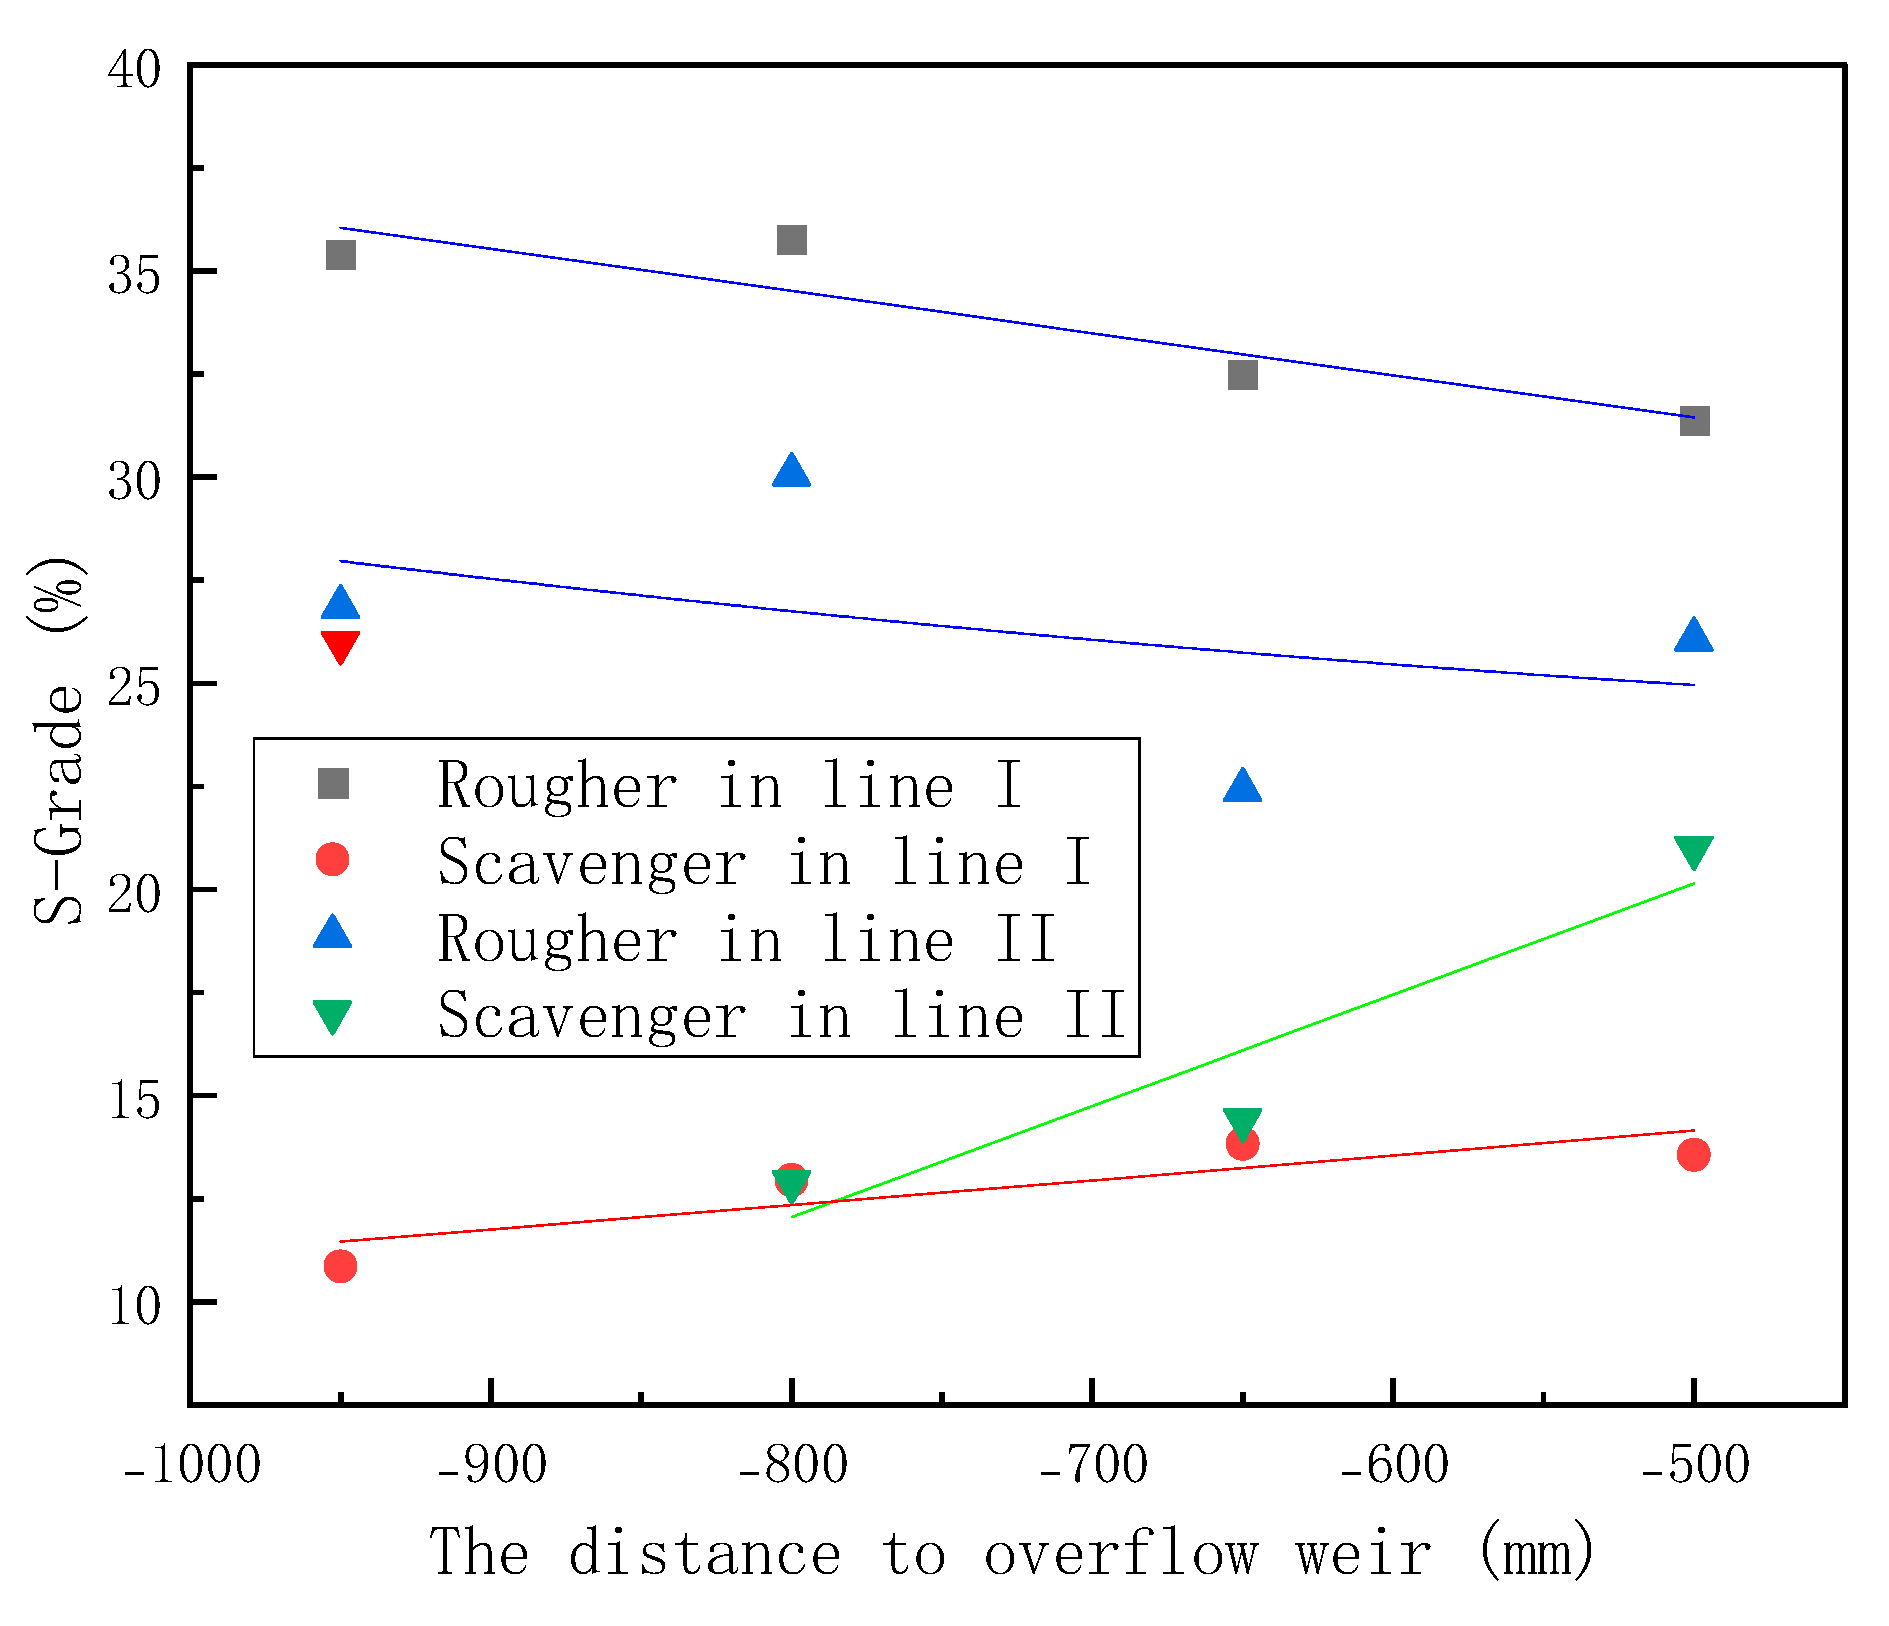
4.3. Quantitative Analysis of Metallic Components in Flotation Bubble Loads

As illustrated in Figure 9, the bubble load measurement data reveal that the mineral grade trends in line I and line II are similar, with the exception of the first data point in the scavenging stage of line II, which was excluded as an outlier during trend analysis. In the rougher stage, the sulfur grade decreases progressively as the mineralized bubbles ascend, whereas in the scavenging stage, the sulfur grade increases. Furthermore, the sulfur grade in the rougher stage of line I is consistently higher than that of line II, while the sulfur grade in the scavenging stage of line I is lower than that of line II. This indicates that line I achieves superior separation efficiency compared to line II.
As the mineralized bubbles ascended, the metal content in the bubble load was quantified, specifically measuring the mass of sulfur per liter of gas (g/L). The analysis results, depicted in Figure 10, reveal that the sulfur content in the bubbles increases during the rougher stage but decreases in the scavenging stage. Although the trends in line I and line II are consistent, the magnitude of variation in line II is notably larger than that in line I across all flotation stages.
The improved bubble load measurement device provides essential evaluation means for flotation performance characterization, yet exhibits three key limitations:
  • During vertical movement through sampling tubes, particle–bubble aggregates undergo partial shedding that remains unquantified.
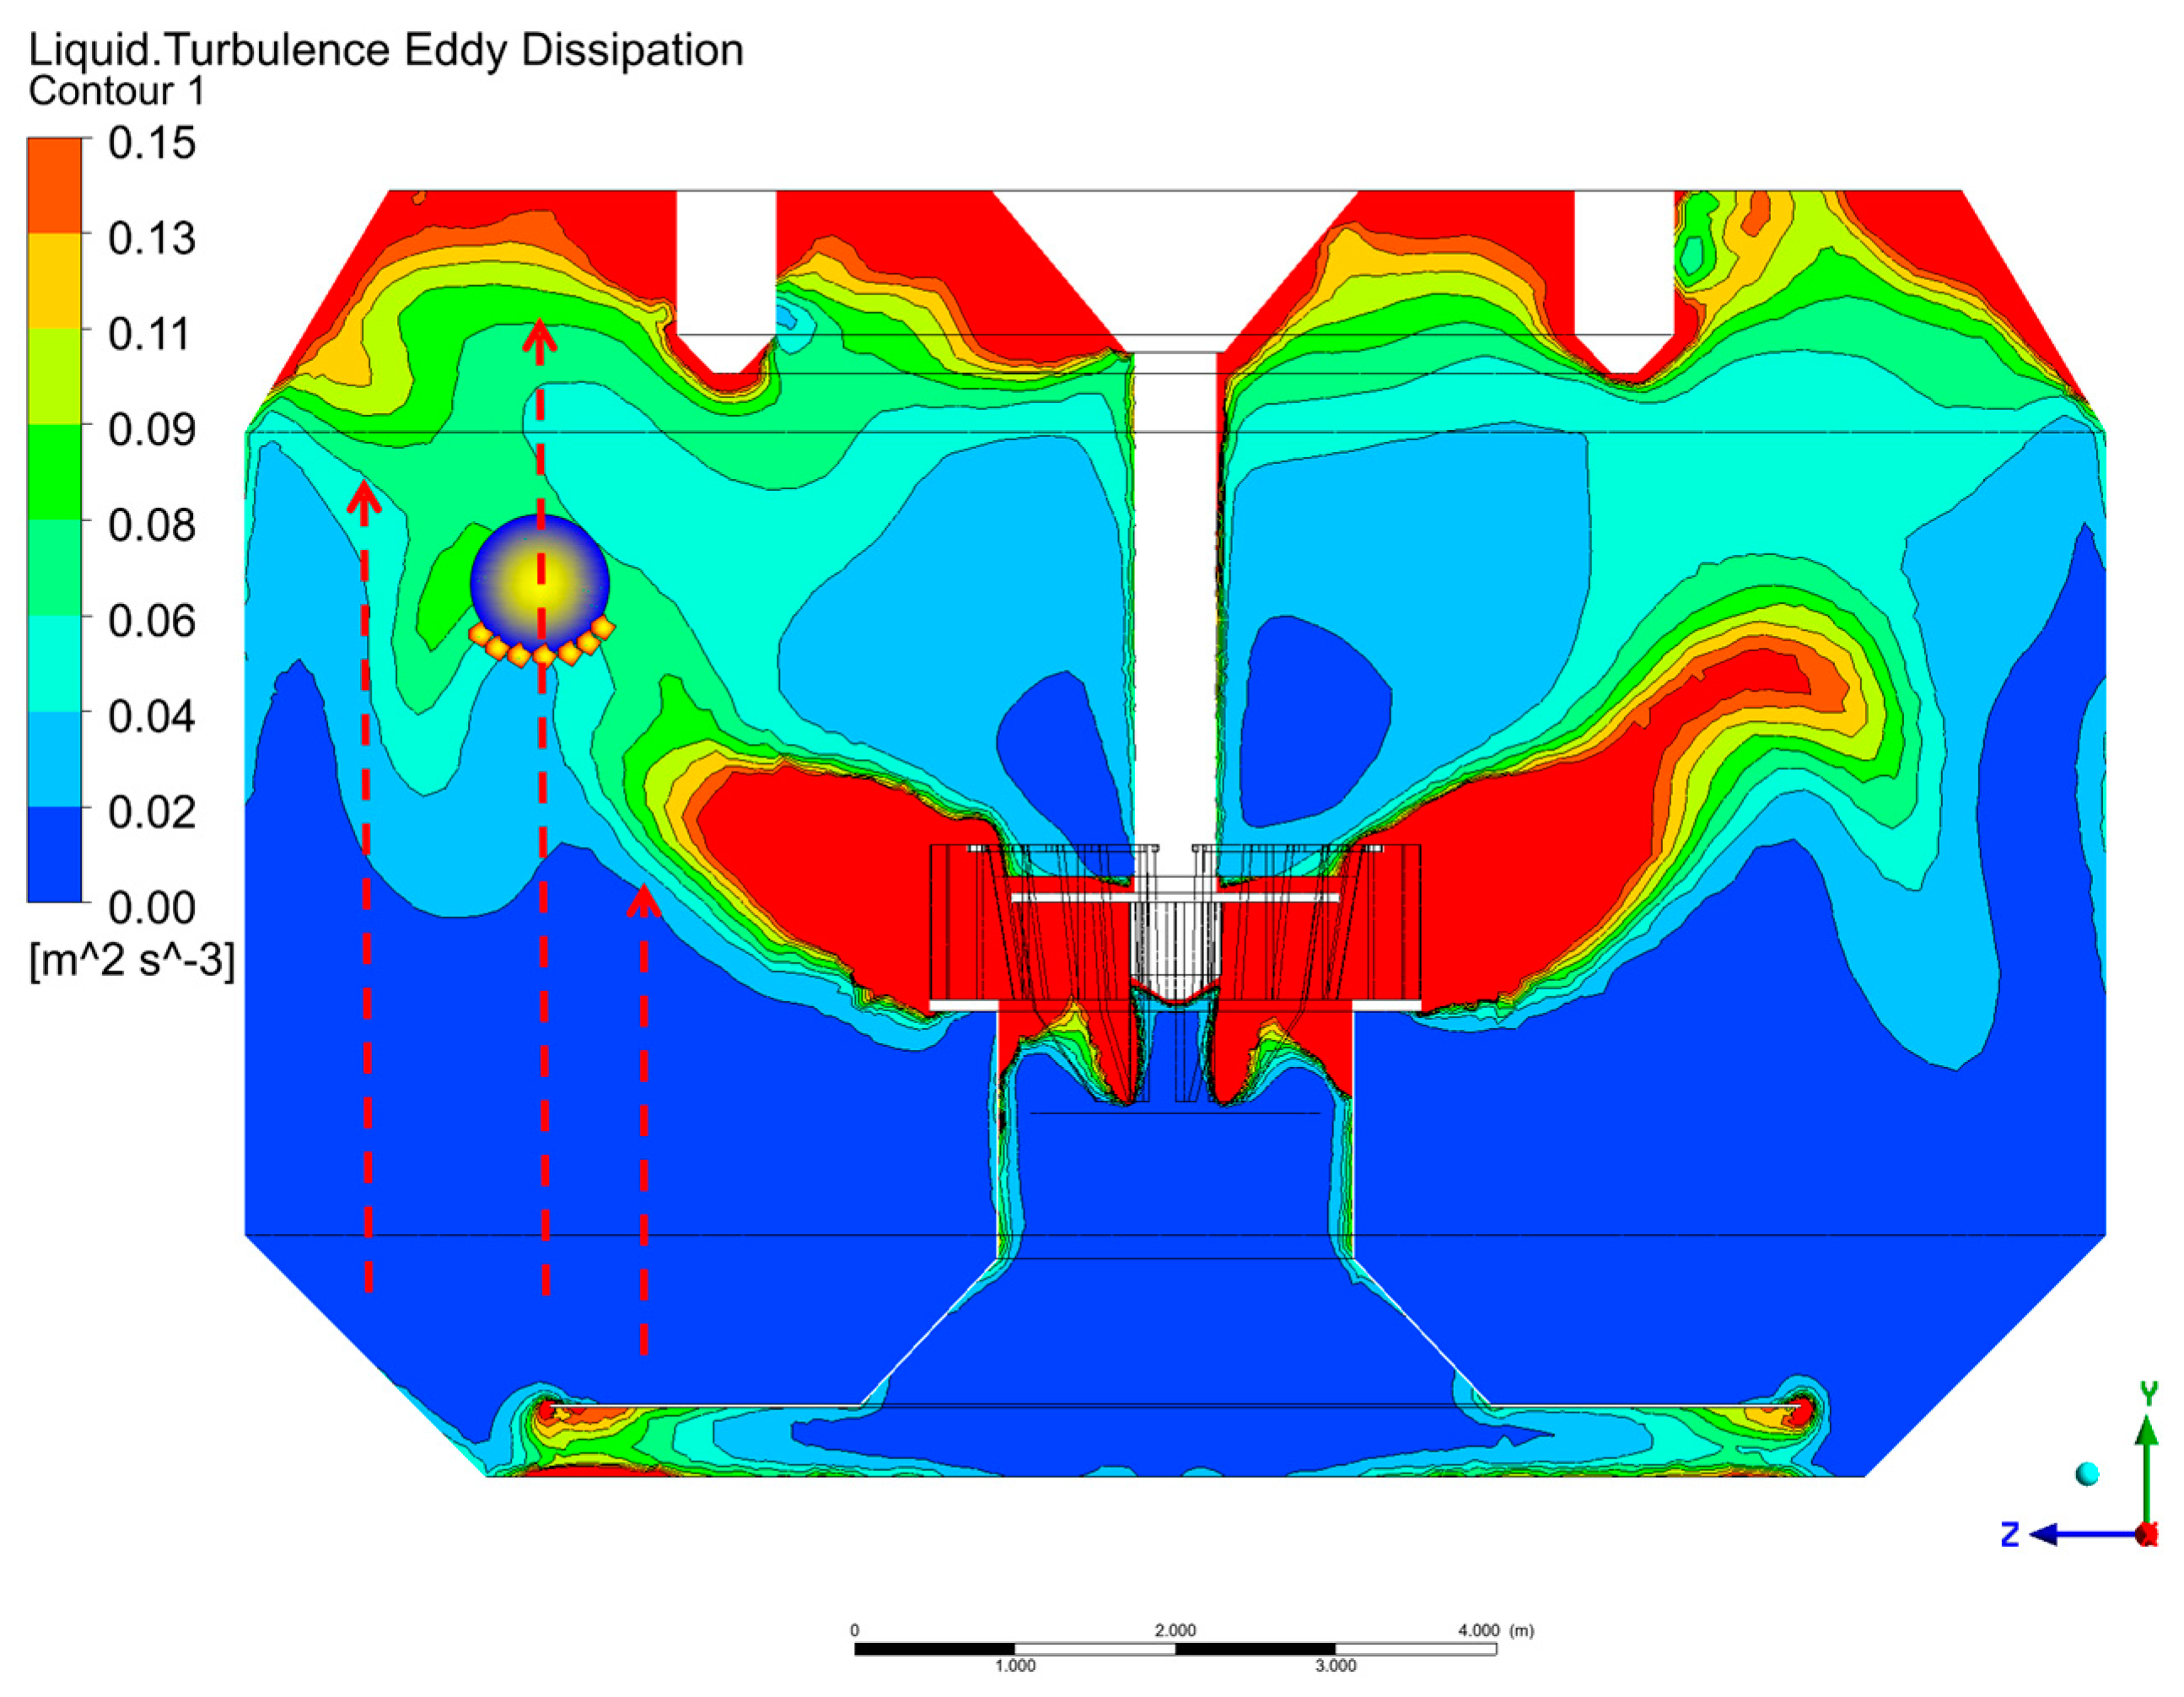
  • Data collection was restricted to fixed vertical planes within flotation cells neglects critical heterogeneous hydrodynamic field dynamics. Edge vortices and impeller zone turbulence significantly influence bubble load distribution patterns but remain undocumented.
  • Tests were conducted under identical sampling depths but divergent production scales and equipment specifications obscure relative trend interpretations. Observed differences in separation characteristics across stages and production lines lack validated optimization frameworks.

5. Conclusions

This study developed an enhanced bubble load measurement device that integrates equilibrium method stabilization and vacuum pump suction technology, applying it to analyze bubble load characteristics in an industrial flotation circuit. The following key findings were derived:
  • The improved device enables continuous and stable bubble load measurements through real-time liquid-level adjustment in the sampling chamber, significantly enhancing measurement accuracy and operational efficiency. Its systematic application across both rougher and scavenger stages has provided robust datasets for dynamic process characterization.
  • In the rougher stage, bubble load demonstrates progressive accumulation during vertical ascent, whereas the scavenger stage exhibits a proportional decline. This contrasting behavior underscores the hydrodynamic interplay between particle attachment and detachment mechanisms, directly governed by the stability of bubble–particle aggregates.
  • The progressive bubble load accumulation in the rougher stage predominantly originates from the attachment of coarse- and medium-grained fractions, whereas the scavenger stage undergoes preferential detachment of fines. Size distribution shifts within ascending bubble loads emerge as a critical determinant of scavenger circuit efficiency. Furthermore, dynamic metallurgical grade variations during vertical transport reveal differential separation efficiencies between line I and line II, highlighting targeted optimization potential through turbulence modulation.
This study enhances the understanding of bubble load dynamics and their correlations with particle size distribution and metallurgical grade, providing data-driven insights for precision control of flotation processes. Optimization of flow-field characteristics combined with mineral particle property adjustments could further enhance both recovery rates and concentrate grades.
By advancing bubble load measurement methodologies, this research establishes a novel framework for performance evaluation and optimization in industrial flotation operations.

Author Contributions

Conceptualization, S.S. and D.H.; methodology, C.S.; validation, D.H. and J.Z.; formal analysis, D.H.; investigation, T.S.; resources, S.S.; data curation, J.Z.; writing—original draft preparation, D.H.; writing—review and editing, S.S.; visualization, J.Z.; supervision, C.S.; project administration, S.S. All authors have read and agreed to the published version of the manuscript.

Funding

This research was funded by the National Key Research and Development Program of China, grant number 2021YFC2902702, and the Key Fund of BGRIMM Technology Group, grant number Y-JDFX-02-2022.

Data Availability Statement

The data presented in this study are available on request from the corresponding author.

Acknowledgments

We extend our sincere gratitude to Jiangxi Copper Corporation for providing testing facilities and to Sun and Hu from the University of Science and Technology Beijing for their expert guidance in manuscript development. We also acknowledge the professional support from colleagues during experimental testing and paper preparation.

Conflicts of Interest

Authors Dengfeng Han, Chuanyao Sun, Jingpeng Zhao and Shuaixing Shi were employed by the BGRIMM Machinery & Automation Technology Co., Ltd. The remaining authors declare that the research was conducted in the absence of any commercial or financial relationships that could be construed as a potential conflict of interest. The BGRIMM Machinery & Automation Technology Co., Ltd. had no role in the design of the study; in the collection, analyses, or interpretation of data; in the writing of the manuscript, or in the decision to publish the results.

References

  1. Kyzas, G.Z.; Matis, K.A. Flotation in Water and Wastewater Treatment. Processes 2018, 6, 116. [Google Scholar] [CrossRef]
  2. Kyzas, G.Z.; Mitropoulos, A.C.; Matis, K.A. From Microbubbles to Nanobubbles: Effect on Flotation. Processes 2021, 9, 1287. [Google Scholar] [CrossRef]
  3. Tao, D.; Sobhy, A. Nanobubble effects on hydrodynamic interactions between particles and bubbles. Powder Technol. 2019, 346, 385–395. [Google Scholar] [CrossRef]
  4. Wills, B.A.; Finch, J.A. Wills’ Mineral Processing Technology; Butterworth-Heinemann: Oxford, UK, 2016; ISBN 978-0-08-097053-0. [Google Scholar]
  5. Wang, G.; Nguyen, A.V.; Mitra, S.; Joshi, J.; Jameson, G.J.; Evans, G.M. A review of the mechanisms and models of bubble-particle detachment in froth flotation. Sep. Purif. Technol. 2016, 170, 155–172. [Google Scholar] [CrossRef]
  6. Bournival, G.; Ata, S.; Jameson, G.J. Bubble and Froth Stabilizing Agents in Froth Flotation. Min. Proc. Ext. Met. Rev. 2017, 38, 366–387. [Google Scholar] [CrossRef]
  7. Seaman, D.R.; Franzidis, J.P.; Manlapig, E.V. Bubble load measurement in the pulp zone of industrial flotation machines—A new device for determining the froth recovery of attached particles. Int. J. Miner. Process. 2004, 74, 1–13. [Google Scholar] [CrossRef]
  8. Bhondayi, C. Use of bubble load to interpret particle transport across the pulp-froth interface in a flotation cell. Physicochem. Probl. Mi 2019, 56, 54–63. [Google Scholar] [CrossRef]
  9. Koh, P.; Schwarz, M. CFD modelling of bubble-particle attachments in flotation cells. Min. Eng. 2006, 19, 619–626. [Google Scholar] [CrossRef]
  10. Ostadrahimi, M.; Gharibi, K.; Dehghani, A.; Farrokhpay, S. Estimating Bubble Loading in Industrial Flotation Cells. Minerals 2019, 9, 222. [Google Scholar] [CrossRef]
  11. Hemmati Chegeni, M.; Abdollahy, M.; Khalesi, M.R. Bubble loading measurement in a continuous flotation column. Min. Eng. 2016, 85, 49–54. [Google Scholar] [CrossRef]
  12. Eskanlou, M.; Khalesi, M.R.; Abdollahy, M. Bubble loading profiles in a flotation column. Physicochem. Probl. Miner. Process. 2018, 54, 355–362. [Google Scholar] [CrossRef]
  13. Bhondayi, C.; Moys, M.H. Determination of sampling pipe (riser) diameter for a flotation bubble load measuring device. Min. Eng. 2011, 24, 1664–1676. [Google Scholar] [CrossRef]
  14. Bhondayi, C.; Moys, M.H. Measurement of a proxy for froth phase bubble sizes as a function of froth depth in flotation machines Part 1. Theoretical development and testing of a new technique. Int. J. Miner. Process. 2014, 130, 8–19. [Google Scholar] [CrossRef]
  15. King, L.; Evans, G.; Moreno-Atanasio, R. Computational analysis of bubble loading. In Chemeca 2018; Institution of Chemical Engineers: Queenstown, New Zealand, 2018. [Google Scholar]
  16. Xing, Y.; Gui, X.; Pan, L.; Pinchasik, B.-E.; Cao, Y.; Liu, J.; Kappl, M.; Butt, H.-J. Recent experimental advances for understanding bubble-particle attachment in flotation. Adv. Colloid. Interfac. 2017, 246, 105–132. [Google Scholar] [CrossRef] [PubMed]
  17. Seaman, D.R.; Manlapig, E.V.; Franzidis, J.P. Selective transport of attached particles across the pulp–froth interface. Min. Eng. 2006, 19, 841–851. [Google Scholar] [CrossRef]
  18. Yianatos, J.B.; Moys, M.H.; Contreras, F.; Villanueva, A. Froth recovery of industrial flotation cells. Min. Eng. 2008, 21, 817–825. [Google Scholar] [CrossRef]
  19. Dyer, C. An investigation into the Properties of the Froth Phase in the Flotation Process. Master’s Thesis, University of the Witwatersrand, Johannesburg, South Africa, 1995. [Google Scholar]
  20. Moys, M.H.; Yianatos, J.; Larenas, J. Measurement of particle loading on bubbles in the flotation process. Min. Eng. 2010, 23, 131–136. [Google Scholar] [CrossRef]
  21. Ata, S. Phenomena in the froth phase of flotation—A review. Int. J. Miner. Process. 2012, 102–103, 1–12. [Google Scholar] [CrossRef]
  22. Nissinen, A.; Lehikoinen, A.; Mononen, M.; Lähteenmäki, S.; Vauhkonen, M. Estimation of the bubble size and bubble loading in a flotation froth using electrical resistance tomography. Min. Eng. 2014, 69, 1–12. [Google Scholar] [CrossRef]
  23. Ge, L.; Evans, G.M.; Moreno-Atanasio, R. CFD-DEM investigation of the interaction between a particle swarm and a stationary bubble: Particle-bubble collision efficiency. Powder Technol. 2020, 366, 641–652. [Google Scholar] [CrossRef]
  24. Mesa, D.; Quintanilla, P.; Reyes, F. Bubble Analyser—An open-source software for bubble size measurement using image analysis. Min. Eng. 2022, 180, 107497. [Google Scholar] [CrossRef]
  25. Junbo, P. The Practice of Improving the Recovery of Sulfur in Chengmenshan Copper Mine. Hunan Nonferrous Met. 2011, 27, 5–8. [Google Scholar] [CrossRef]
  26. Eskanlou, A.; Chegeni, M.H.; Khalesi, M.R.; Abdollahy, M.; Huang, Q. Modeling the bubble loading based on force balance on the particles attached to the bubble. Colloids Surf. A Physicochem. Eng. Asp. 2019, 582, 123892. [Google Scholar] [CrossRef]
  27. Schulze, H.J. Hydrodynamics of Bubble-Mineral Particle Collisions. Min. Proc. Ext. Met. Rev. 1989, 5, 43–76. [Google Scholar] [CrossRef]
  28. Bloom, F.; Heindel, T.J. Modeling flotation separation in a semi-batch process. Chem. Eng. Sci. 2003, 58, 353–365. [Google Scholar] [CrossRef]
  29. Yianatos, J.; Vinnett, L.; Carrasco, C.; Alvarez-Silva, M. Effect of entrainment in bubble load measurement on froth recovery estimation at industrial scale. Miner. Eng. 2015, 72, 31–35. [Google Scholar] [CrossRef]
Figure 1. Mineral processing circuit (Arrows indicate the direction of slurry flow).
Processes 13 01218 g001
Figure 2. Diagram of bubble load measurement system.
Processes 13 01218 g002
Figure 3. Testing location distribution.
Processes 13 01218 g003
Figure 4. Analysis of particle forces on mineralized bubbles.
Processes 13 01218 g004
Figure 5. Mineralized bubbles rise through regions with different turbulent energy dissipation rates.
Processes 13 01218 g005
Figure 6. Bubble load in rougher and scavenger flotation cells of line I (g/L).
Processes 13 01218 g006
Figure 7. Bubble load in rougher and scavenger flotation cells of line II (g/L).
Processes 13 01218 g007
Figure 8. The particle size distribution of the bubble load. (a) Rougher of line I. (b) Scavenger of line I. (c) Rougher of line II. (d) Scavenger of line II.
Processes 13 01218 g008
Figure 9. Sulfur grade in bubble load.
Processes 13 01218 g009
Figure 10. The sulfur content of sulfide in each sample point.
Processes 13 01218 g010
Table 1. Results of multi-element analysis of raw ore (%).
ElementCuSSiO2Al2O3FeAuAg
Content1.115.1262.528.438.570.0466.12
Table 2. Results of chemical phase analysis of raw ore (%).
PhaseTotal CopperPrimary Copper SulfideSecondary Copper SulfideCopper Oxide
Content1.1160.2510.7170.148
Proportion10022.49 64.25 13.26
Disclaimer/Publisher’s Note: The statements, opinions and data contained in all publications are solely those of the individual author(s) and contributor(s) and not of MDPI and/or the editor(s). MDPI and/or the editor(s) disclaim responsibility for any injury to people or property resulting from any ideas, methods, instructions or products referred to in the content.

