Research on the Thermodynamic Simulation Model of Antimony–Lead Synergistic Side-Blown Oxidation Smelting Process Based on MetCal

 , ,
, ,
Abstract
:1. Introduction
2. Process Mechanism and Model Establishment
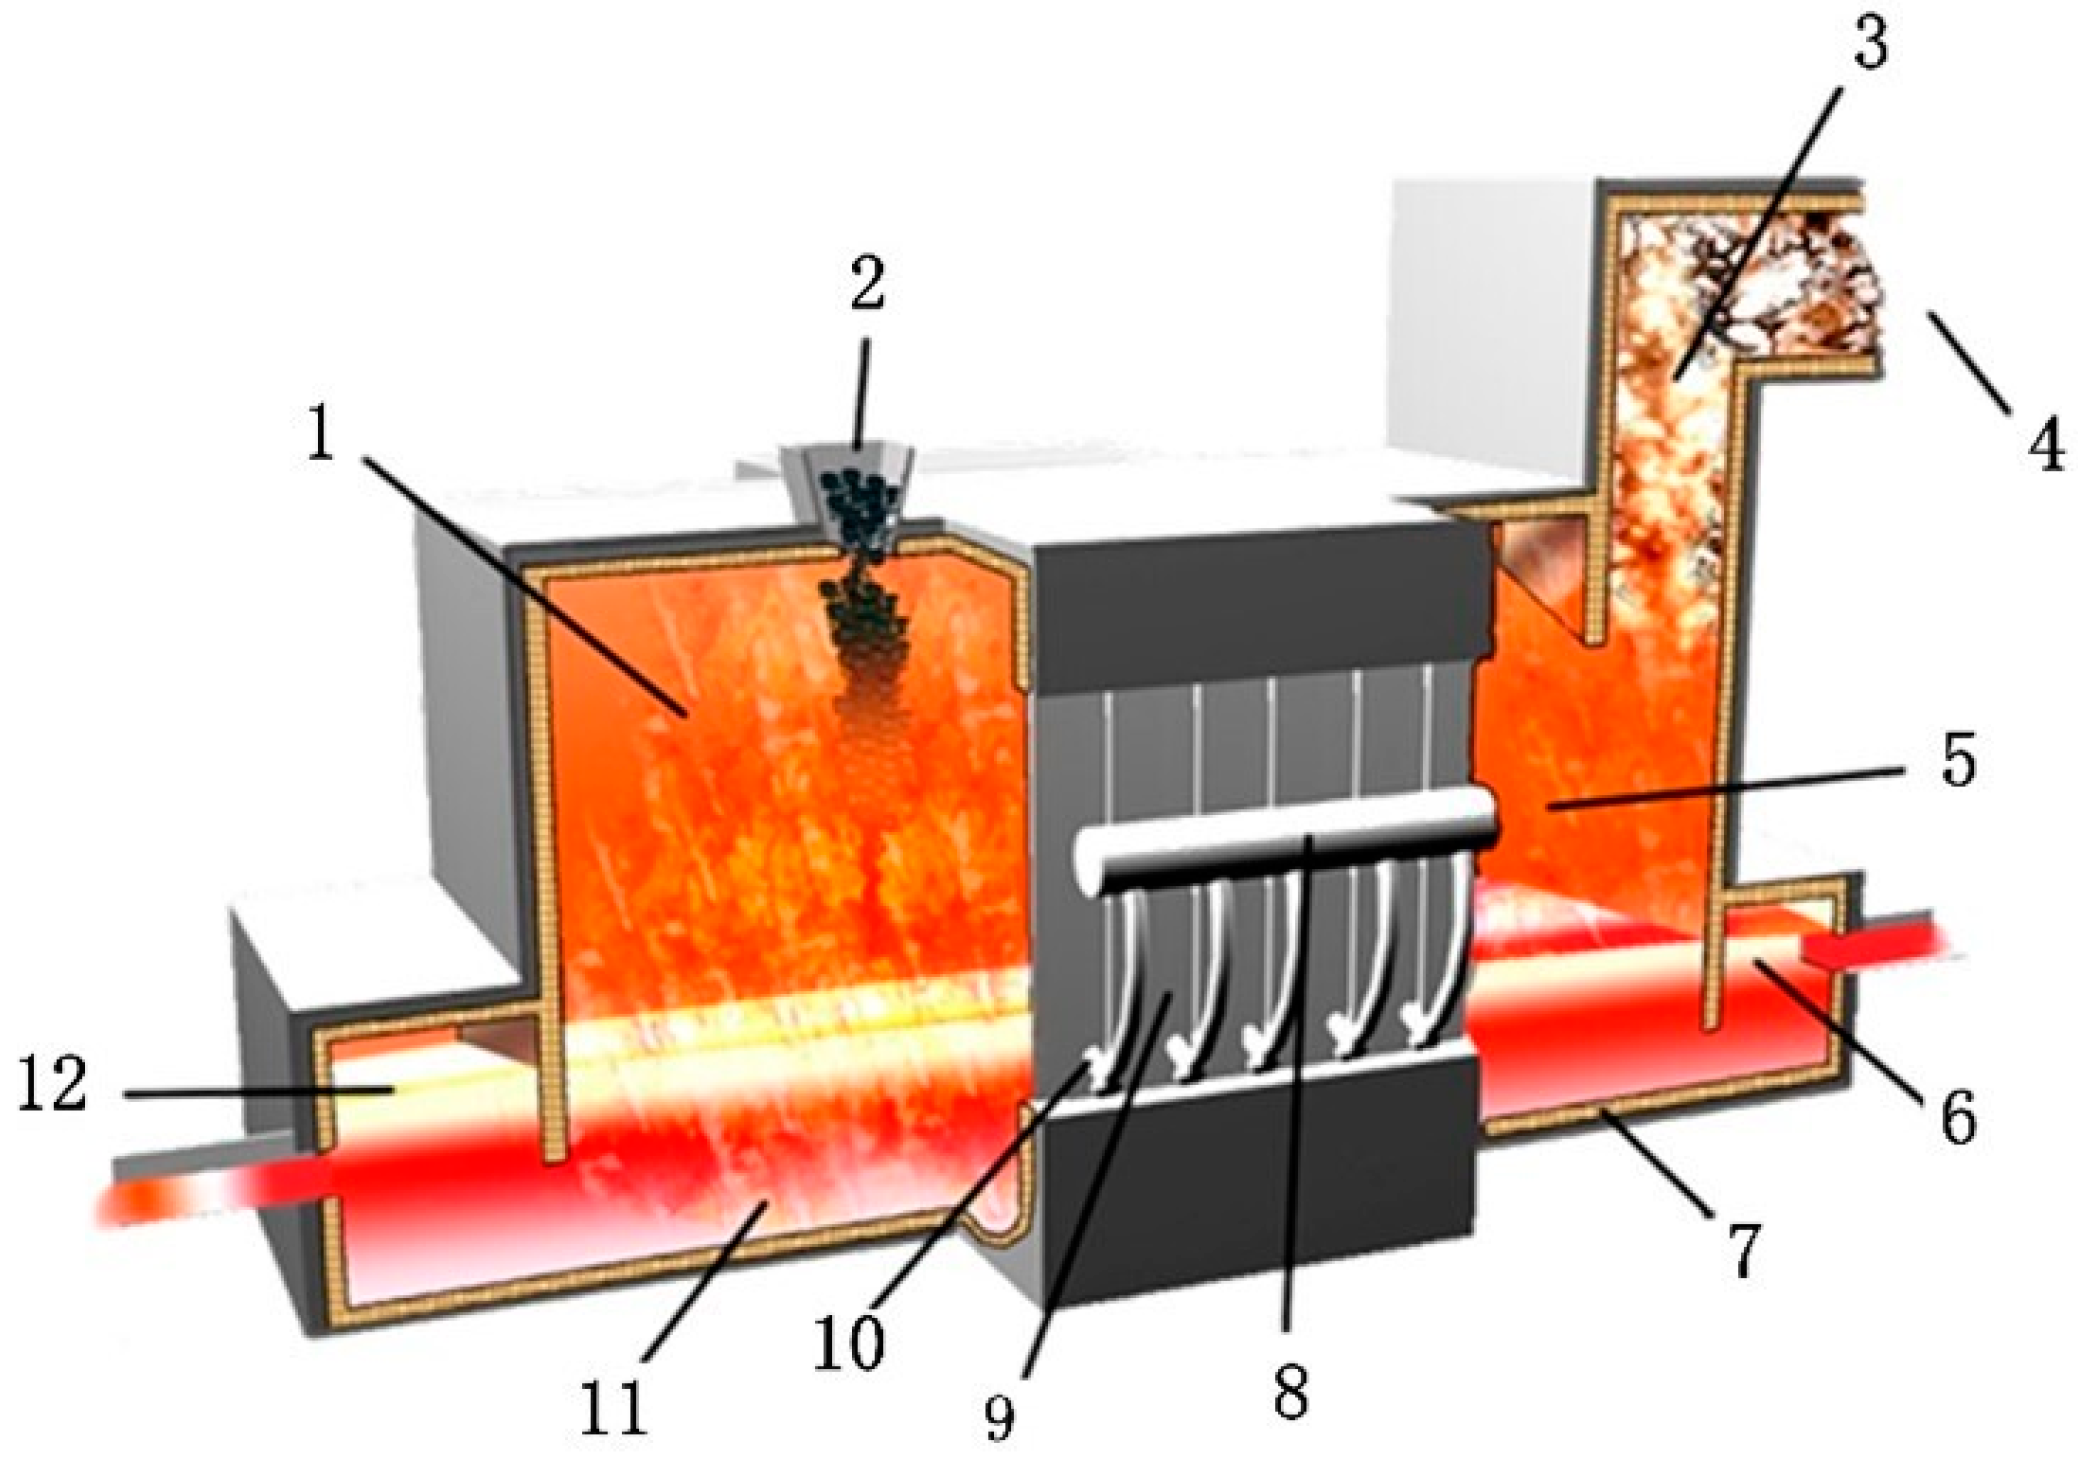
2.1. Process Mechanism
2.2. Model Assumption
- (1)
- antimony-rich crude lead (ALd): Pb, PbS, Bi, Sb, Zn, Cu2S, FeS, As, Ag, and Other1;
- (2)
- smelting slag (Sl): PbO, PbSO4, PbS, ZnO, Cu2O, Cu2S, As2O3, Bi2O3, Sb2O3, Sb2O5, FeO, Fe3O4, FeS, CaO, Al2O3, MgO, SiO2, Ag, and Other2;
- (3)
- flue gas (gas): O2, Sb2O3, Sb2S3, Pb, PbO, PbS, As2O3, As2S3, Zn, ZnO, ZnS, SO2, S2, CO, CO2, N2, and H2O;
- (4)
- flue dust (Dt): Bi2S3, Sb2S3, As2S3, FeS, SiO2, Ag, Al2O3, H2O, FeS2, PbS, ZnS, Cu2S, Fe2O3, CaCO3, MgO, CaO, Pb, Bi, Zn, As, Sb, PbO, PbSO4, ZnO, Cu2O, Bi2O3, Sb2O3, Sb2O5, FeO, Fe3O4, As2O3, and Other3.
2.3. Modeling Principles
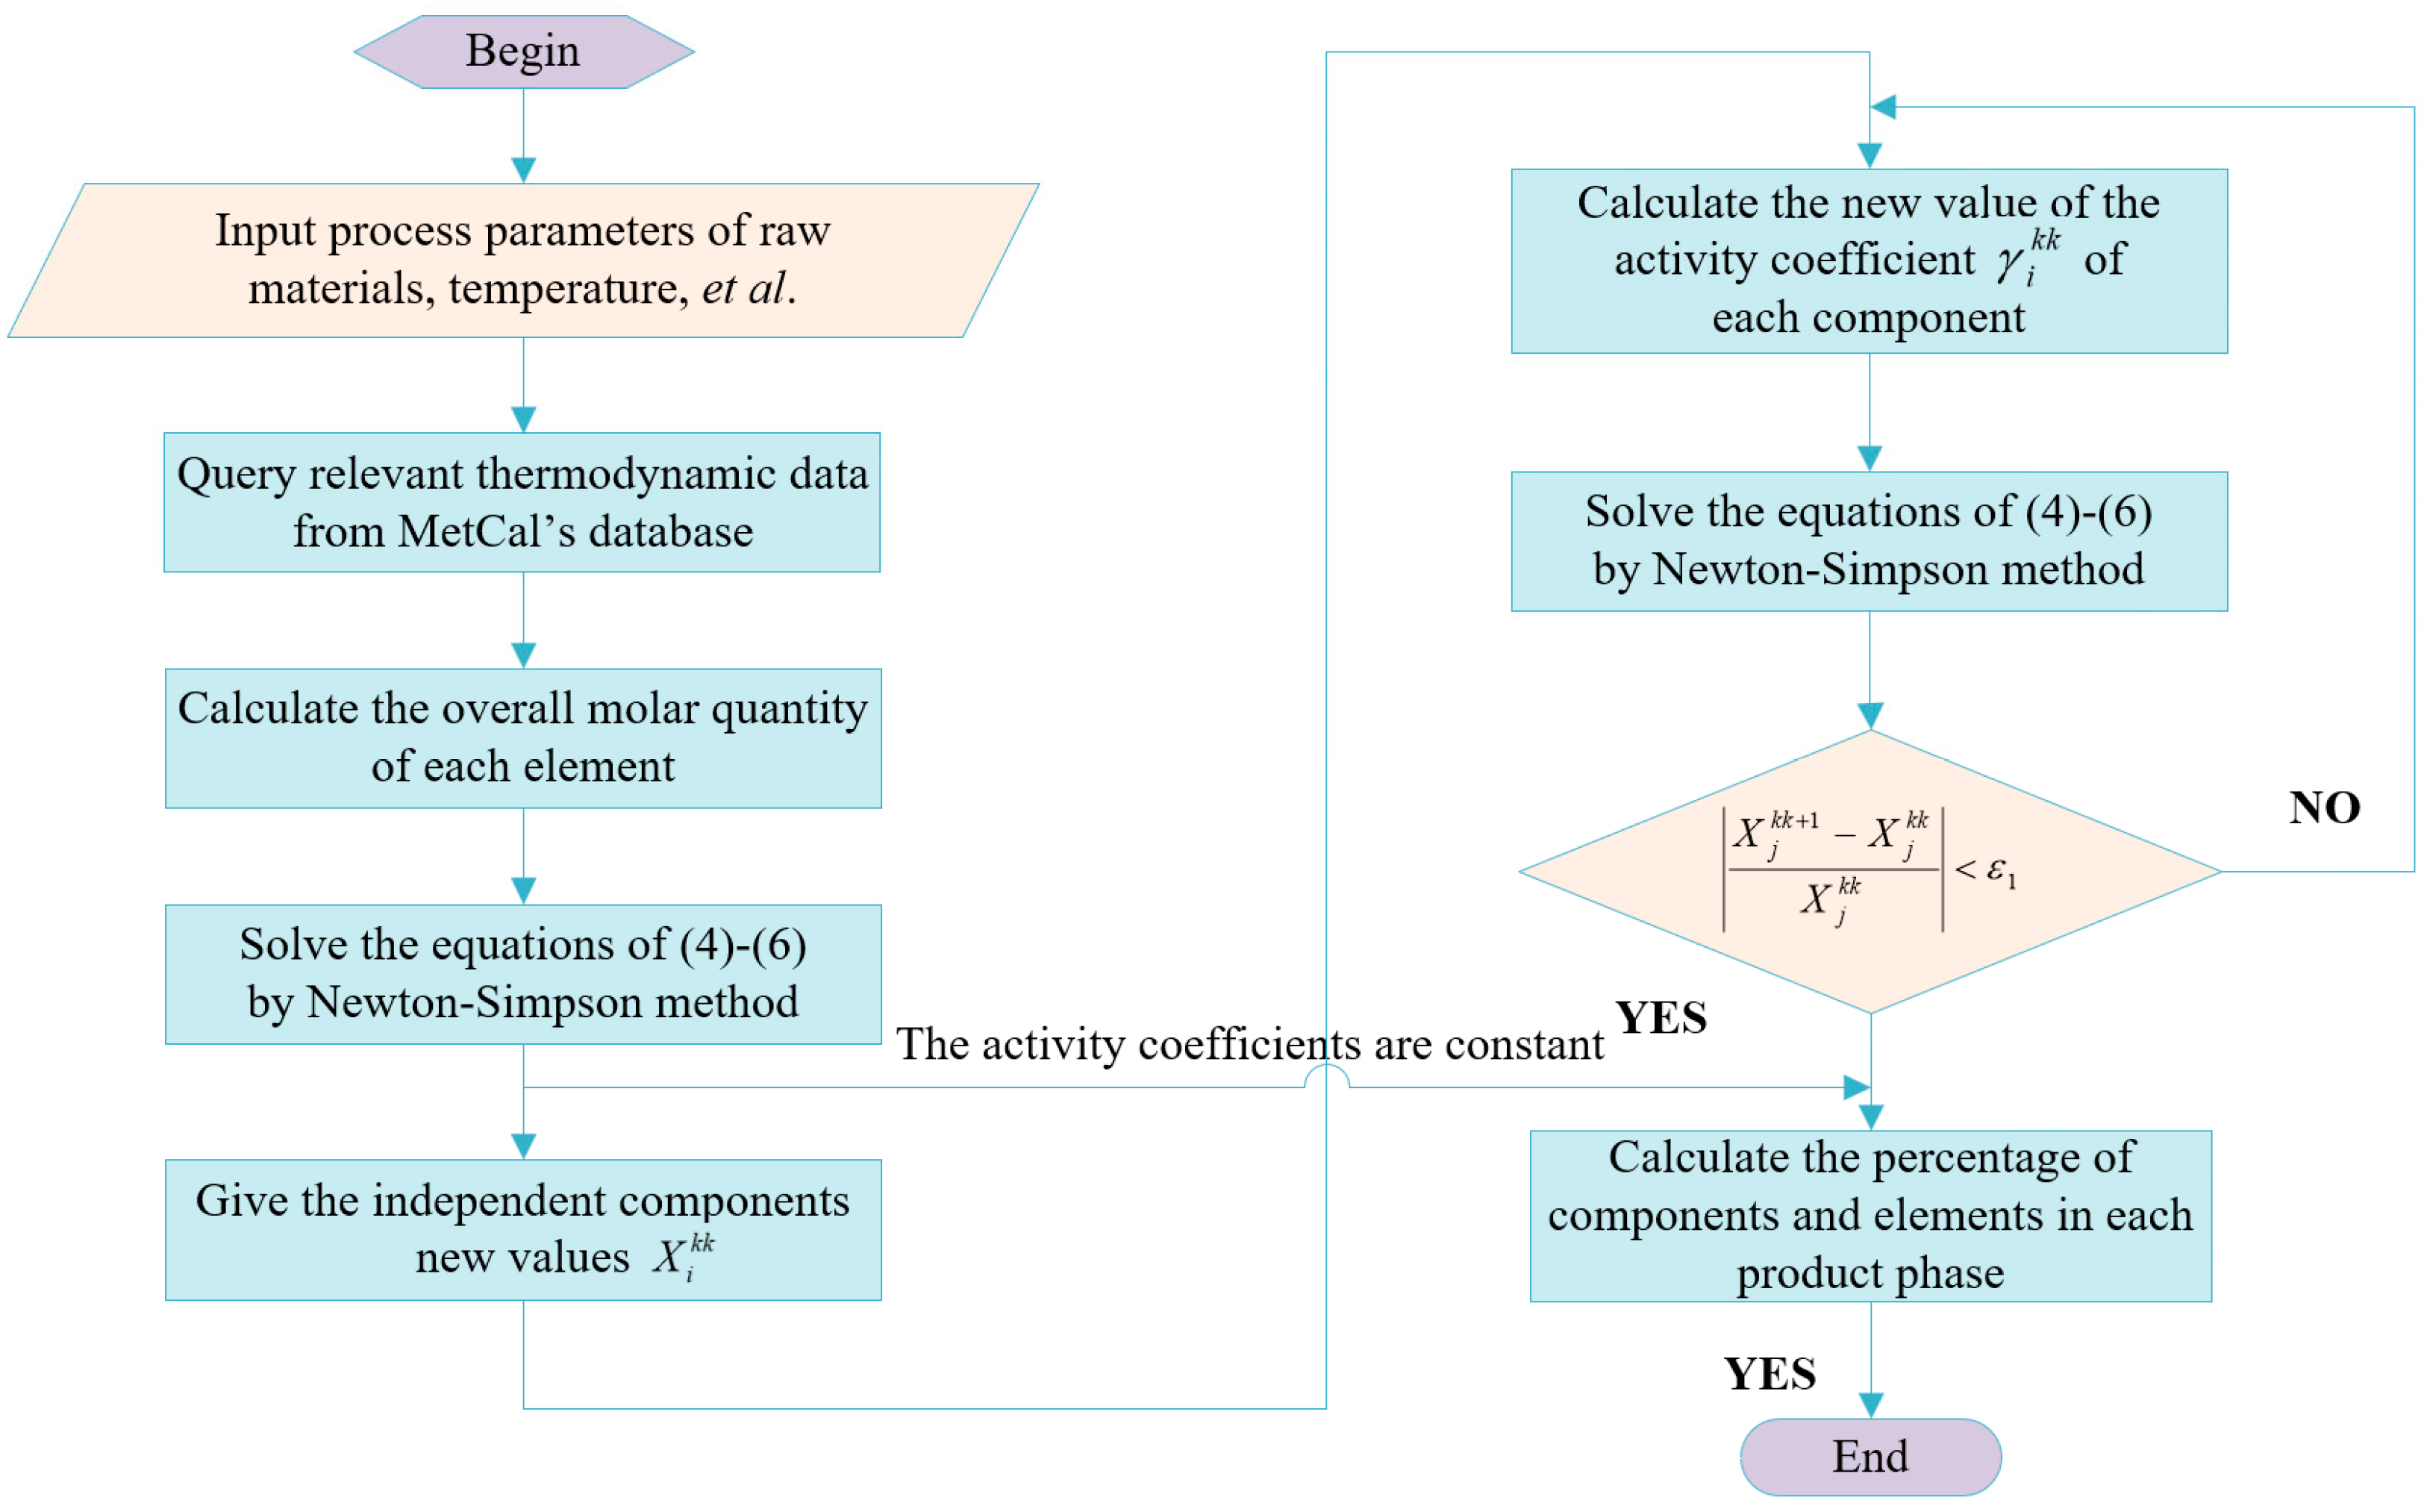
2.4. Mathematical Models and Computing Systems
3. Materials and Methods
3.1. Raw Material Composition
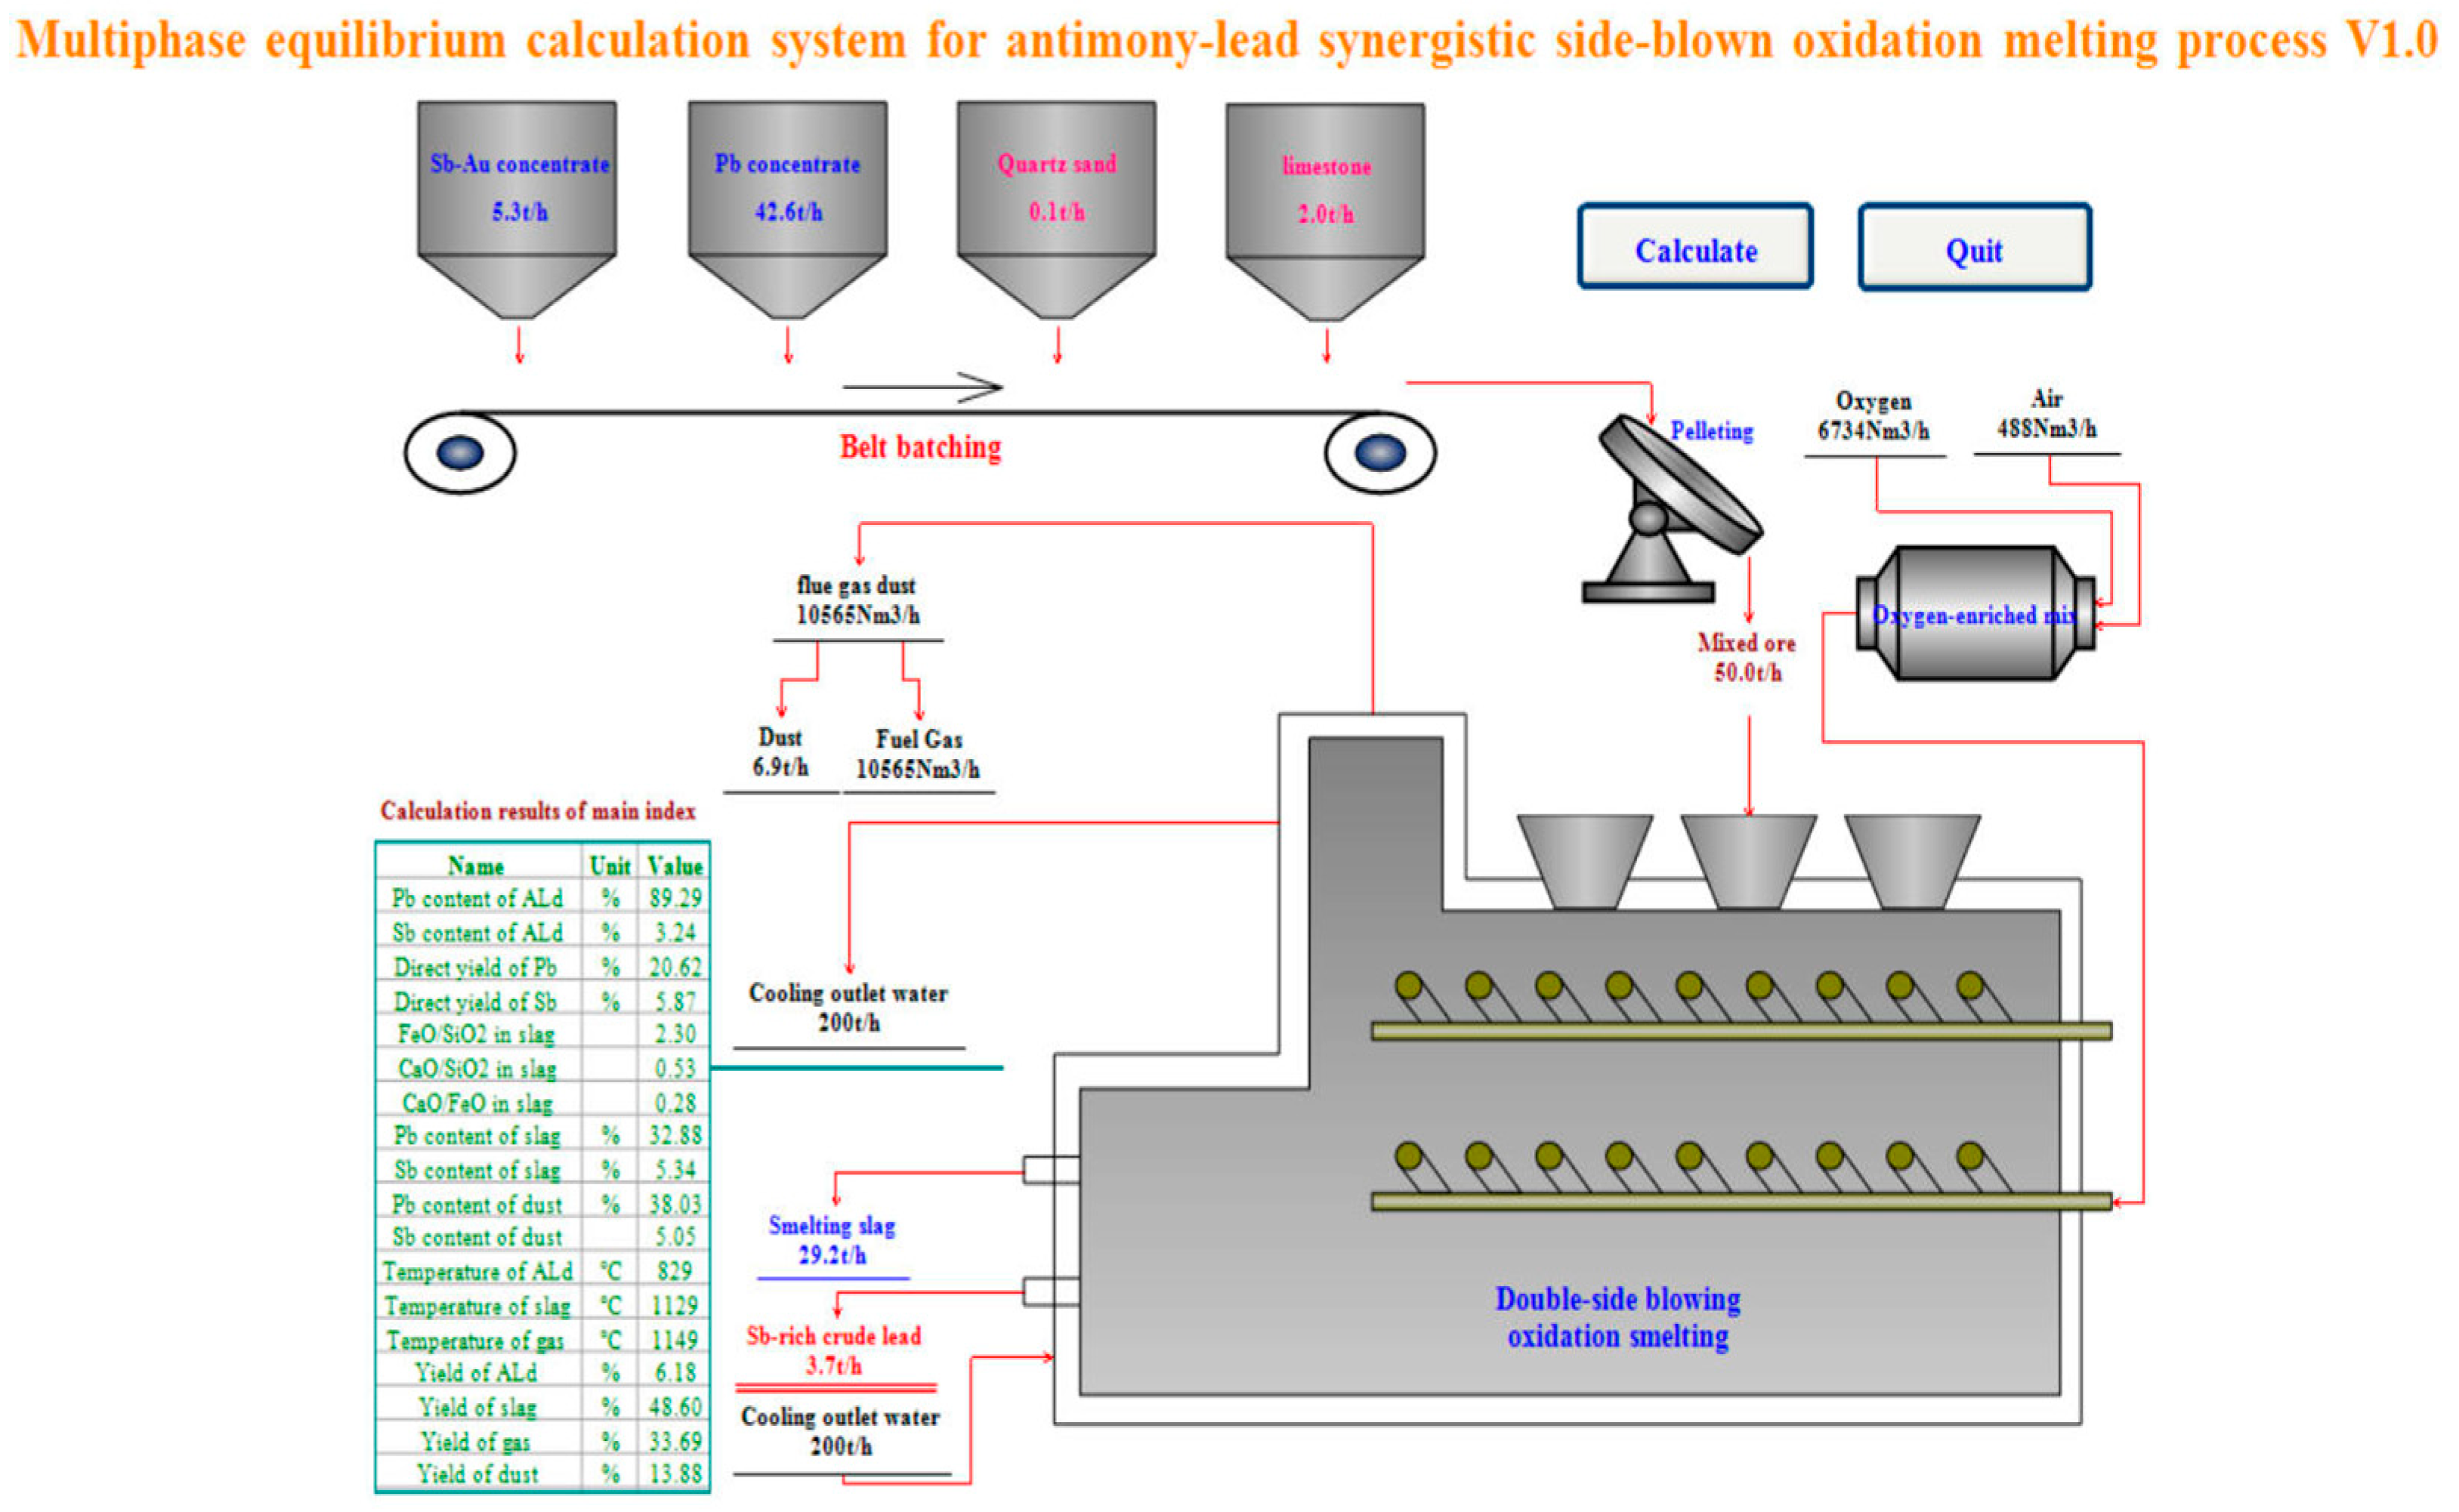
3.2. Calculation Condition and Mixed Ore Composition
3.3. Thermodynamic Data
4. Result and Discussion
4.1. Calculated Result
4.2. Results Comparison
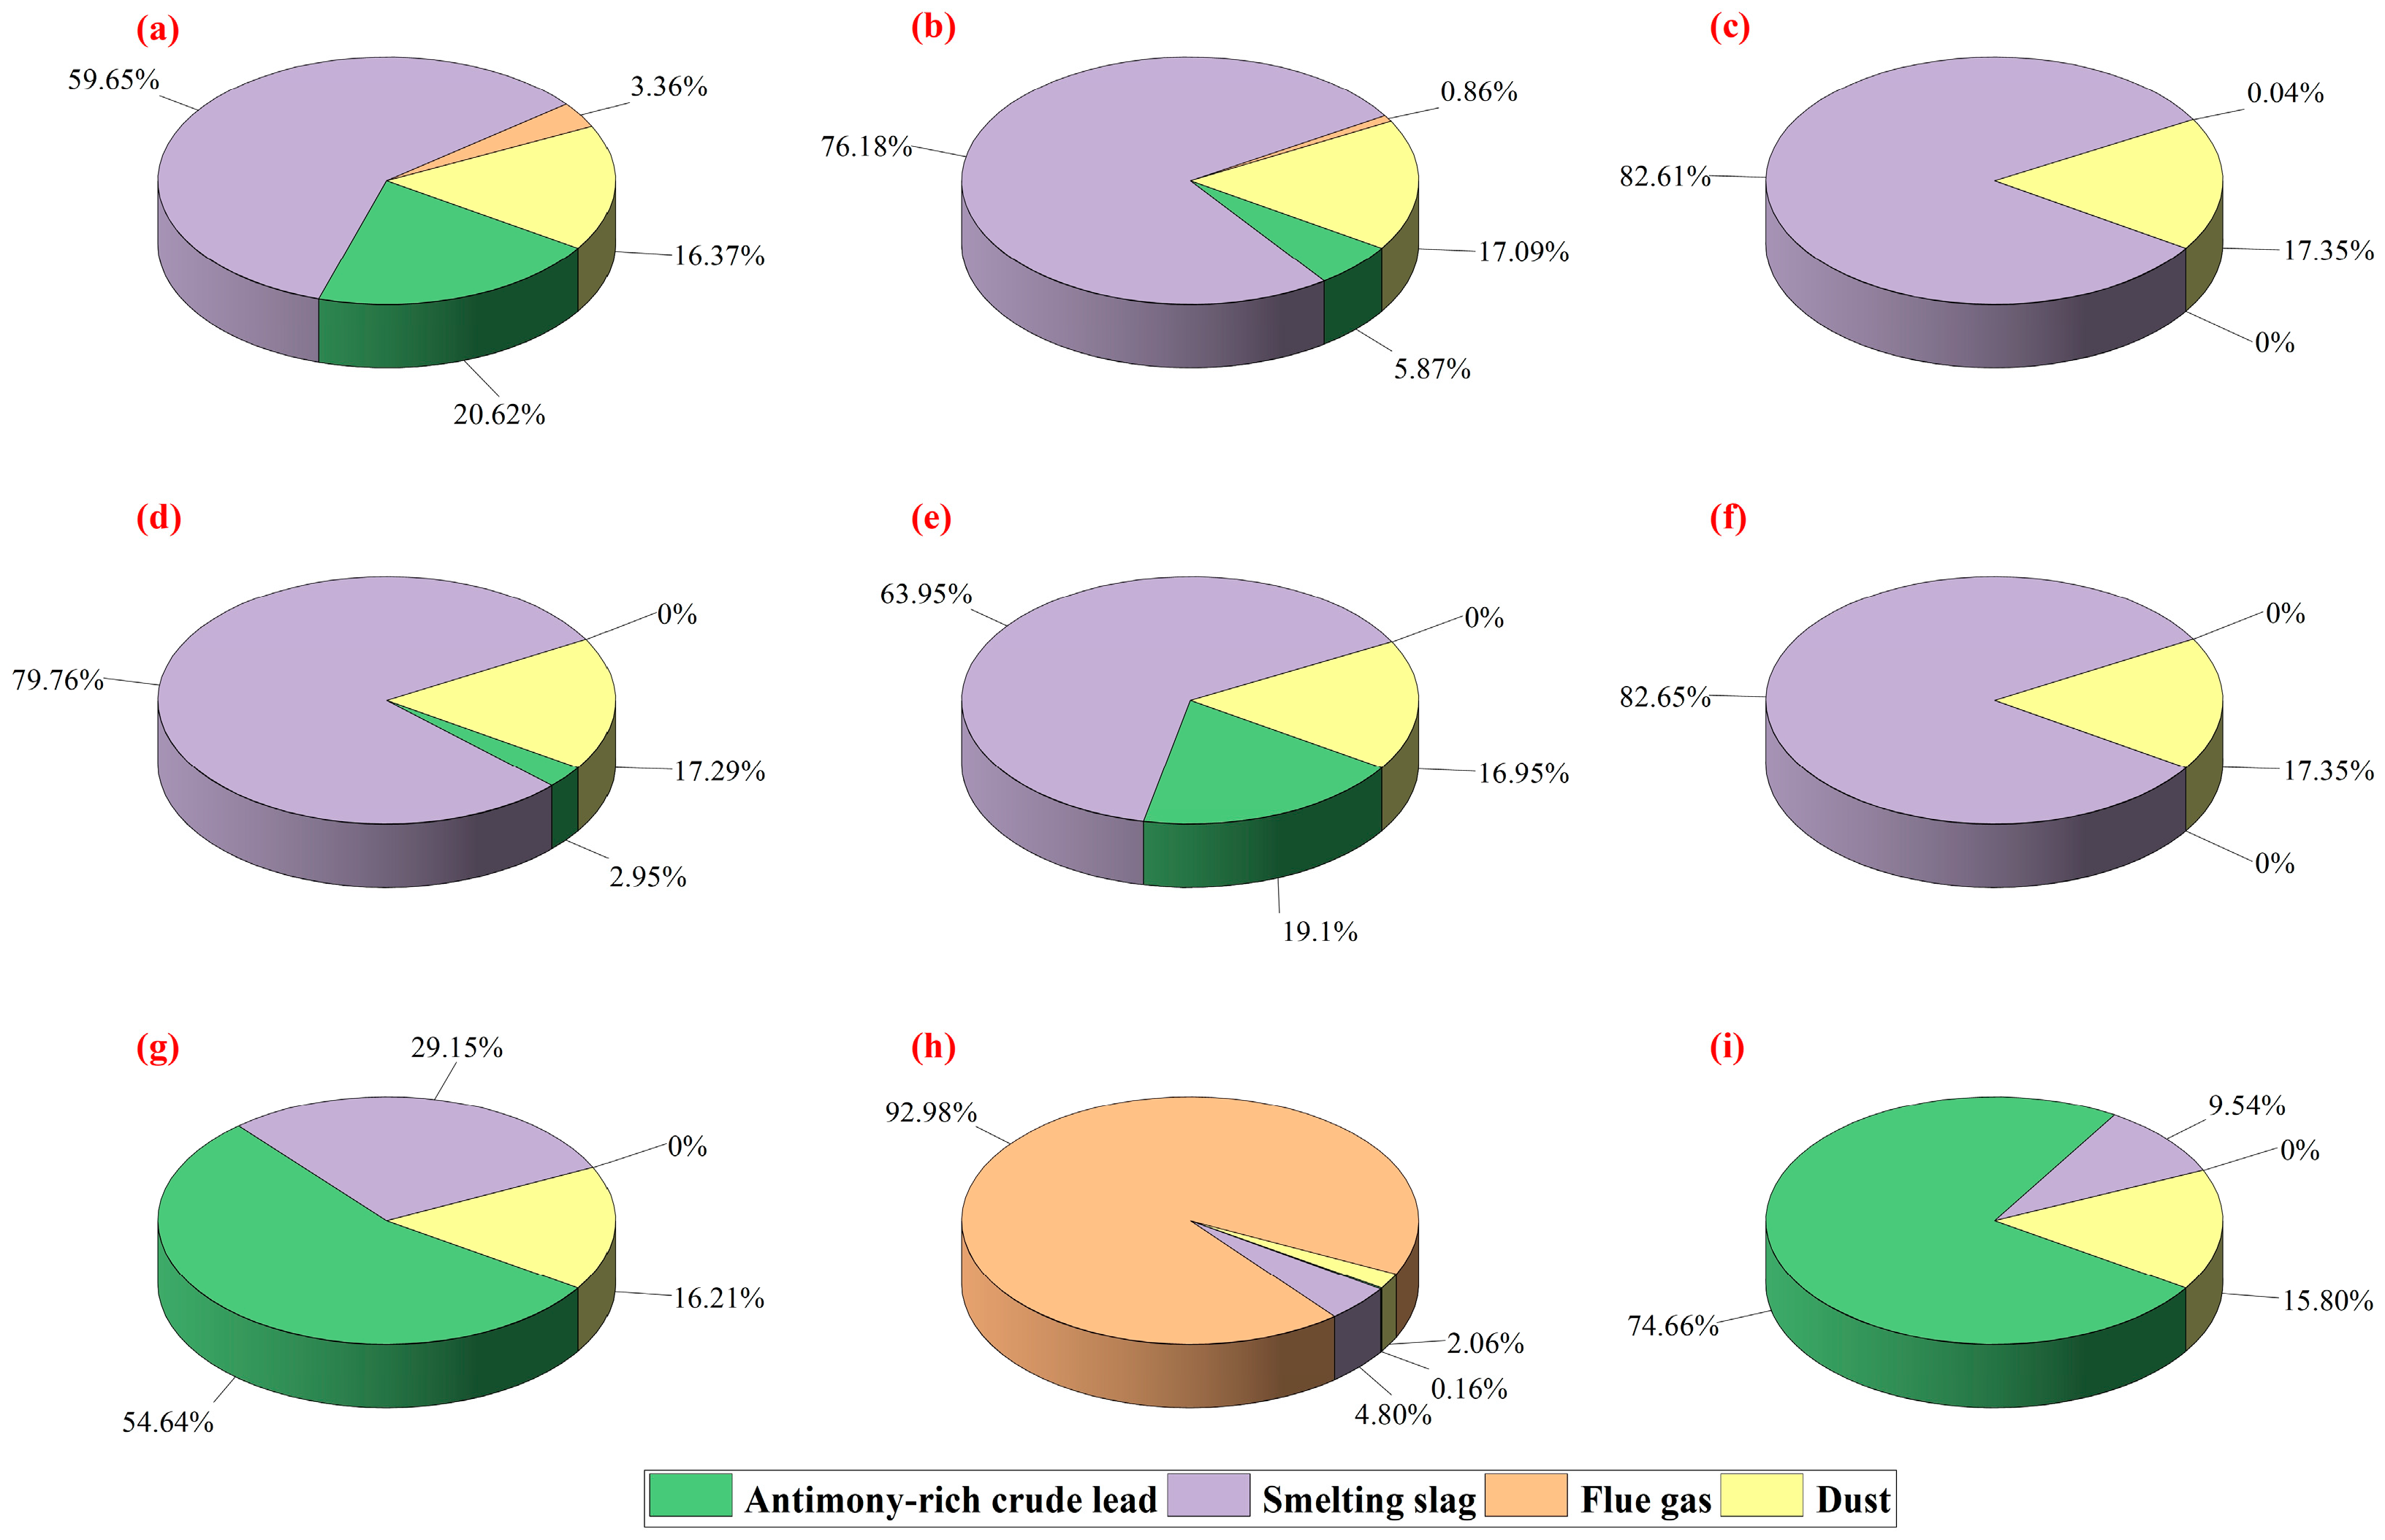
4.3. Discussion
5. Conclusions
- On the basis of the multiphase reaction mechanism and features of the antimony–lead synergistic side-blown oxidation smelting process, we constructed a thermodynamic simulation model and calculation system of the antimony–lead synergistic side-blown oxidation smelting process using the chemical equilibrium constant approach and MetCal software platform (MetCal v7.81), which provided a software-based tool for the thermodynamic calculation and analysis of the smelting process. The model is based on the MetCal platform (MetCal v7.81), which has high accuracy, low error predictions and fast computation speed.
- Using the established calculation system, we conducted an instance validation under the typical production conditions of a domestic enterprise. The outcomes from the product composition closely matched the actual manufacturing outcomes, demonstrating that the constructed model effectively embodied the multiphase reaction features of the antimony–lead synergistic side-blown oxidation smelting process and possessed the ability to accurately forecast the output of this process.
- Through verification and contrast experiments, we found that the calculated values of the main technical index for the antimony–lead synergistic side-blown oxidation smelting process had a small relative error compared with the average measured values from industrial production during the same period. The relative errors of the calculated mass fractions of Pb, Sb, Zn, Cu, Fe, CaO, SiO2, S, As, Bi, and Ag in antimony-rich crude lead and smelting slag are less than 10%. Although there is an error margin, it is acceptable. In the future, the constructed model and calculation system can be used to carry out conditional experiments to optimize and regulate different process parameters, so as to provide a model basis for the subsequent on-line optimization and regulation of the antimony and lead synergistic side-blowing oxidation smelting process.
Author Contributions
Funding
Data Availability Statement
Acknowledgments
Conflicts of Interest
Appendix A

| Component | Phase | Pb | Zn | Cu | Fe | S | As | Sb | Mg | Al | Bi | Ag | SiO2 | CaO | O | C | H | N |
|---|---|---|---|---|---|---|---|---|---|---|---|---|---|---|---|---|---|---|
| Pb | Ld | 1 | 0 | 0 | 0 | 0 | 0 | 0 | 0 | 0 | 0 | 0 | 0 | 0 | 0 | 0 | 0 | 0 |
| PbS | Ld | 1 | 0 | 0 | 0 | 1 | 0 | 0 | 0 | 0 | 0 | 0 | 0 | 0 | 0 | 0 | 0 | 0 |
| Zn | Ld | 0 | 1 | 0 | 0 | 0 | 0 | 0 | 0 | 0 | 0 | 0 | 0 | 0 | 0 | 0 | 0 | 0 |
| Cu2S | Ld | 0 | 0 | 2 | 0 | 1 | 0 | 0 | 0 | 0 | 0 | 0 | 0 | 0 | 0 | 0 | 0 | 0 |
| FeS | Ld | 0 | 0 | 0 | 1 | 1 | 0 | 0 | 0 | 0 | 0 | 0 | 0 | 0 | 0 | 0 | 0 | 0 |
| As | Ld | 0 | 0 | 0 | 0 | 0 | 1 | 0 | 0 | 0 | 0 | 0 | 0 | 0 | 0 | 0 | 0 | 0 |
| Sb | Ld | 0 | 0 | 0 | 0 | 0 | 0 | 1 | 0 | 0 | 0 | 0 | 0 | 0 | 0 | 0 | 0 | 0 |
| Bi | Ld | 0 | 0 | 0 | 0 | 0 | 0 | 0 | 0 | 0 | 1 | 0 | 0 | 0 | 0 | 0 | 0 | 0 |
| Ag | Ld | 0 | 0 | 0 | 0 | 0 | 0 | 0 | 0 | 0 | 0 | 1 | 0 | 0 | 0 | 0 | 0 | 0 |
| Al2O3 | Sl | 0 | 0 | 0 | 0 | 0 | 0 | 0 | 0 | 2 | 0 | 0 | 0 | 0 | 3 | 0 | 0 | 0 |
| MgO | Sl | 0 | 0 | 0 | 0 | 0 | 0 | 0 | 1 | 0 | 0 | 0 | 0 | 0 | 1 | 0 | 0 | 0 |
| SiO2 | Sl | 0 | 0 | 0 | 0 | 0 | 0 | 0 | 0 | 0 | 0 | 0 | 1 | 0 | 0 | 0 | 0 | 0 |
| CaO | Sl | 0 | 0 | 0 | 0 | 0 | 0 | 0 | 0 | 0 | 0 | 0 | 0 | 1 | 0 | 0 | 0 | 0 |
| O2 | Gas | 0 | 0 | 0 | 0 | 0 | 0 | 0 | 0 | 0 | 0 | 0 | 0 | 0 | 2 | 0 | 0 | 0 |
| CO | Gas | 0 | 0 | 0 | 0 | 0 | 0 | 0 | 0 | 0 | 0 | 0 | 0 | 0 | 1 | 1 | 0 | 0 |
| H2O | Gas | 0 | 0 | 0 | 0 | 0 | 0 | 0 | 0 | 0 | 0 | 0 | 0 | 0 | 1 | 0 | 2 | 0 |
| N2 | Gas | 0 | 0 | 0 | 0 | 0 | 0 | 0 | 0 | 0 | 0 | 0 | 0 | 0 | 0 | 0 | 0 | 2 |
| Component | Phase | Pb | Zn | Cu | Fe | S | As | Sb | Bi | Ag | SiO2 | CaO | O | C | H | N |
|---|---|---|---|---|---|---|---|---|---|---|---|---|---|---|---|---|
| PbO | Sl | 1 | 0 | 0 | 0 | 0 | 0 | 0 | 0 | 0 | 0 | 0 | 1 | 0 | 0 | 0 |
| PbSO4 | Sl | 1 | 0 | 0 | 0 | 1 | 0 | 0 | 0 | 0 | 0 | 0 | 4 | 0 | 0 | 0 |
| PbS | Sl | 1 | 0 | 0 | 0 | 1 | 0 | 0 | 0 | 0 | 0 | 0 | 0 | 0 | 0 | 0 |
| ZnO | Sl | 0 | 1 | 0 | 0 | 0 | 0 | 0 | 0 | 0 | 0 | 0 | 1 | 0 | 0 | 0 |
| Cu2O | Sl | 0 | 0 | 2 | 0 | 0 | 0 | 0 | 0 | 0 | 0 | 0 | 1 | 0 | 0 | 0 |
| Cu2S | Sl | 0 | 0 | 2 | 0 | 1 | 0 | 0 | 0 | 0 | 0 | 0 | 0 | 0 | 0 | 0 |
| FeO | Sl | 0 | 0 | 0 | 1 | 0 | 0 | 0 | 0 | 0 | 0 | 0 | 1 | 0 | 0 | 0 |
| Fe3O4 | Sl | 0 | 0 | 0 | 3 | 0 | 0 | 0 | 0 | 0 | 0 | 0 | 4 | 0 | 0 | 0 |
| FeS | Sl | 0 | 0 | 0 | 1 | 1 | 0 | 0 | 0 | 0 | 0 | 0 | 0 | 0 | 0 | 0 |
| As2O3 | Sl | 0 | 0 | 0 | 0 | 0 | 2 | 0 | 0 | 0 | 0 | 0 | 3 | 0 | 0 | 0 |
| Sb2O3 | Sl | 0 | 0 | 0 | 0 | 0 | 0 | 2 | 0 | 0 | 0 | 0 | 3 | 0 | 0 | 0 |
| Bi2O3 | Sl | 0 | 0 | 0 | 0 | 0 | 0 | 0 | 2 | 0 | 0 | 0 | 3 | 0 | 0 | 0 |
| Sb2O5 | Sl | 0 | 0 | 0 | 0 | 0 | 0 | 2 | 0 | 0 | 0 | 0 | 5 | 0 | 0 | 0 |
| Ag | Sl | 0 | 0 | 0 | 0 | 0 | 0 | 0 | 0 | 1 | 0 | 0 | 0 | 0 | 0 | 0 |
| Pb | Gas | 1 | 0 | 0 | 0 | 0 | 0 | 0 | 0 | 0 | 0 | 0 | 0 | 0 | 0 | 0 |
| PbO | Gas | 1 | 0 | 0 | 0 | 0 | 0 | 0 | 0 | 0 | 0 | 0 | 1 | 0 | 0 | 0 |
| PbS | Gas | 1 | 0 | 0 | 0 | 1 | 0 | 0 | 0 | 0 | 0 | 0 | 0 | 0 | 0 | 0 |
| Zn | Gas | 0 | 1 | 0 | 0 | 0 | 0 | 0 | 0 | 0 | 0 | 0 | 0 | 0 | 0 | 0 |
| ZnO | Gas | 0 | 1 | 0 | 0 | 0 | 0 | 0 | 0 | 0 | 0 | 0 | 1 | 0 | 0 | 0 |
| ZnS | Gas | 0 | 1 | 0 | 0 | 1 | 0 | 0 | 0 | 0 | 0 | 0 | 0 | 0 | 0 | 0 |
| As2O3 | Gas | 0 | 0 | 0 | 0 | 0 | 2 | 0 | 0 | 0 | 0 | 0 | 3 | 0 | 0 | 0 |
| As2S3 | Gas | 0 | 0 | 0 | 0 | 3 | 2 | 0 | 0 | 0 | 0 | 0 | 0 | 0 | 0 | 0 |
| Sb2O3 | Gas | 0 | 0 | 0 | 0 | 0 | 0 | 2 | 0 | 0 | 0 | 0 | 3 | 0 | 0 | 0 |
| Sb2S3 | Gas | 0 | 0 | 0 | 0 | 3 | 0 | 2 | 0 | 0 | 0 | 0 | 0 | 0 | 0 | 0 |
| SO2 | Gas | 0 | 0 | 0 | 0 | 1 | 0 | 0 | 0 | 0 | 0 | 0 | 2 | 0 | 0 | 0 |
| S2 | Gas | 0 | 0 | 0 | 0 | 2 | 0 | 0 | 0 | 0 | 0 | 0 | 0 | 0 | 0 | 0 |
| CO2 | Gas | 0 | 0 | 0 | 0 | 0 | 0 | 0 | 0 | 0 | 0 | 0 | 2 | 1 | 0 | 0 |
| Component | State | / (kJ·mol−1) | (J·K−1·mol−1) | cp = a + b × 10−3T + c × 105T−2 + d × 10−6T2 | |||
|---|---|---|---|---|---|---|---|
| a | b | c | d | ||||
| Pb | Liquid | 3.873 | 70.506 | 27.159 | 1.029 | 0 | 0 |
| PbS | Liquid | −93.143 | 84.129 | 66.946 | 0 | 0 | 0 |
| Bi | Liquid | 9.271 | 71.980 | 27.197 | 0 | 0 | 0 |
| Sb | Liquid | 17.531 | 62.712 | 31.381 | 0 | 0 | 0 |
| Zn | Liquid | 5.727 | 48.549 | 31.381 | 0 | 0 | 0 |
| Cu2S | Liquid | −68.100 | 132.462 | 89.665 | 0 | 0 | 0 |
| FeS | Liquid | −64.631 | 91.208 | 62.552 | 0 | 0 | 0 |
| As | Liquid | 21.568 | 53.284 | 28.833 | 0 | 0 | 0 |
| Ag | Liquid | 6.393 | 43.220 | 33.473 | 0 | 0 | 0 |
| PbO | Liquid | −202.249 | 73.379 | 65.000 | 0 | 0 | 0 |
| PbSO4 | Liquid | −923.159 | 148.494 | 186.004 | 0 | 0 | 0 |
| ZnO | Liquid | −309.542 | 47.920 | 60.669 | 0 | 0 | 0 |
| Cu2O | Liquid | −130.224 | 96.402 | 99.916 | 0 | 0 | 0 |
| As2O3 | Liquid | −643.439 | 128.125 | 152.720 | 0 | 0 | 0 |
| Sb2O3 | Liquid | −675.490 | 143.628 | 156.904 | 0 | 0 | 0 |
| Sb2O5 | Liquid | −971.925 | 125.105 | 141.331 | −3.732 | −20.113 | 0 |
| Bi2O3 | Liquid | −578.024 | 149.814 | 202.005 | 0 | 0 | 0 |
| FeO | Liquid | −257.276 | 57.591 | 68.201 | 0 | 0 | 0 |
| Fe3O4 | Liquid | −993.334 | 198.385 | 213.389 | 0 | 0 | 0 |
| SiO2 | Liquid | −927.548 | 9.310 | 85.774 | 0.000 | 0.000 | 0.000 |
| CaO | Liquid | −572.908 | 40.980 | 62.762 | 0.000 | 0.000 | 0.000 |
| MgO | Liquid | −561.018 | 12.833 | 66.946 | 0.000 | 0.000 | 0.000 |
| Al2O3 | Liquid | −595.568 | 45.145 | 144.866 | 0.000 | 0.000 | 0.000 |
| Pb | Gas | 195.205 | 175.377 | 28.063 | −11.029 | −9.310 | 4.728 |
| PbO | Gas | 68.139 | 240.048 | 41.612 | −3.526 | −20.136 | 1.014 |
| PbS | Gas | 127.959 | 251.416 | 37.350 | 0.194 | −2.096 | 0.140 |
| Zn | Gas | 130.403 | 16.992 | 20.898 | −0.133 | −0.067 | 0.034 |
| ZnO | Gas | 136.518 | 242.811 | 37.671 | −0.286 | −1.985 | 0.735 |
| ZnS | Gas | 204.322 | 236.404 | 166.350 | −85.742 | −166.125 | 21.952 |
| As2O3 | Gas | −322.845 | 371.925 | 82.134 | 6.444 | −5.356 | 0 |
| As2S3 | Gas | 27.042 | 314.289 | 96.201 | 1.071 | −8.213 | 0 |
| Sb2O3 | Gas | −708.564 | 129.903 | 180.004 | 0 | 0 | 0 |
| Sb2S3 | Gas | 119.661 | 409.820 | 107.636 | 0.209 | −7.255 | 0 |
| O2 | Gas | 0 | 205.154 | 34.860 | 1.312 | −14.141 | 0.163 |
| SO2 | Gas | −296.820 | 248.226 | 54.781 | 3.350 | −24.745 | −0.241 |
| S2 | Gas | 128.603 | 228.169 | 34.672 | 3.286 | −2.816 | −0.312 |
| CO | Gas | −110.544 | 197.665 | 29.932 | 5.415 | −10.814 | −1.054 |
| CO2 | Gas | −393.515 | 213.774 | 54.437 | 5.116 | −43.579 | −0.806 |
| N2 | Gas | 0 | 191.615 | 23.529 | 12.117 | 1.210 | −3.076 |
| H2O | Gas | −241.832 | 188.837 | 31.438 | 14.106 | −24.952 | −1.832 |
| Component | Phase | Activity Coefficient |
|---|---|---|
| PbO | Sl | 1 |
| PbSO4 | Sl | 0.8 |
| PbS | Sl | 0.5 |
| ZnO | Sl | 0.1 |
| Cu2O | Sl | 0.002 |
| Cu2S | Sl | 50 |
| FeO | Sl | 0.0001 |
| Fe3O4 | Sl | 0.1 |
| FeS | Sl | 0.0001 |
| As2O3 | Sl | 0.003 |
| Sb2O3 | Sl | 0.002 |
| Sb2O5 | Sl | MQC |
| Bi2O3 | Sl | 1.64 |
| CaO | Sl | 0.1 |
| MgO | Sl | 1 |
| Al2O3 | Sl | 1 |
| SiO2 | Sl | 0.1 |
| Ag | Sl | 1.351 |
| Pb | ALd | 0.35 |
| PbS | ALd | 20 |
| Sb | ALd | 0.0078 |
| CuS | ALd | 0.028 |
| FeS | ALd | 100 |
| Zn | ALd | 0.066 |
| As | ALd | 0.058 |
| Bi | ALd | 18 |
| Ag | ALd | 0.045 |
References
- Li, J.; Xu, D.; Zhu, Y. Global antimony supply risk assessment through the industry chain. Front. Energy Res. 2022, 10, 1007260. [Google Scholar] [CrossRef]
- Zhao, G.; Li, W.; Geng, Y.; Bleischwitz, R. Uncovering the features of global antimony resource trade network. Resour. Policy 2023, 85, 103815. [Google Scholar] [CrossRef]
- U.S. Geological Survey. Mineral Commodity Summaries 2024; U.S. Geological Survey: Reston, VA, USA, 2024; 212p.
- Tang, M.T.; Tang, C.B.; Yang, J.M.; Chen, Y.M.; Yang, S.H. Development Trend of Antimony Industry in China under Dual Carbon Strategy. Nonferrous Met. 2024, 11, 110–116. [Google Scholar]
- Multani, R.S.; Feldmann, T.; Demopoulos, G.P. Antimony in the metallurgical industry: A review of its chemistry and environmental stabilization options. Hydrometallurgy 2016, 164, 141–153. [Google Scholar] [CrossRef]
- Wu, Q.J.; Lv, Z.; Cao, J.C. Distribution and supply of antimony resources in China and abroad and development status of antimony industry Chain. Multipurp. Util. Miner. Resour. 2022, 43, 77–82. [Google Scholar]
- Zhong, D.P.; Li, L.; Tan, C. Recovery of antimony from antimony-bearing dusts through reduction roasting process under CO—CO2 mixture gas atmosphere after firstly oxidation roasted. J. Cent. South Univ. 2018, 25, 1904–1913. [Google Scholar] [CrossRef]
- Dembele, S.; Akcil, A.; Panda, S. Technological trends, emerging applications and metallurgical strategies in antimony recovery from stibnite. Miner. Eng. 2022, 175, 107304. [Google Scholar] [CrossRef]
- Ding, J.; Zhang, Y.; Ma, Y.; Wang, Y.; Zhang, J.; Zhang, T. Metallogenic characteristics and resource potential of antimony in China. J. Geochem. Explor. 2021, 230, 106834. [Google Scholar] [CrossRef]
- Kanellopoulos, C.; Sboras, S.; Voudouris, P.; Soukis, K.; Moritz, R. Antimony’s Significance as a Critical Metal: The Global Perspective and the Greek Deposits. Minerals 2024, 14, 121. [Google Scholar] [CrossRef]
- Huang, M.; Li, Z.; Wang, Q.; Guo, X.; Li, W. Antimony and gold substance flows analysis of pyrometallurgical process for antimony-gold concentrates. J. Clean. Prod. 2023, 420, 138385. [Google Scholar] [CrossRef]
- Ding, L.F.; Liu, Y.C.; Fu, J.G.; Zhang, Y.R.; Lin, Y.; Zhao, Y.C.; Hua, X.Y. Sulfur Reduction and Upgrading of High-Sulfur Antimony-Gold Bulk Concentrate from Russia. Min. Metall. Eng. 2023, 43, 77–79. [Google Scholar]
- Ma, D.; Li, D.B.; Chen, X.G.; Pei, Z.Y. Research progress of antimony concentrate smelting technology. China Nonferrous Metall. 2020, 49, 49–54. [Google Scholar]
- Zhu, Q.; Yang, J.G.; Tang, S.Y.; Man, T.X.; Liu, J.; Ye, W.L.; Tang, C.B. Current Development Status of Clean Metallurgical Technologiesfor Antimony. Nonferrous Met. (Extr. Metall.) 2025, 04, 30–38. [Google Scholar]
- Yu, Z.; Wang, L.; Zheng, Q.; Che, X.; Cui, X.; Wei, S.; Li, H.; Shi, X. Present Situation and Research Progress of Comprehensive Utilization of Antimony Tailings and Smelting Slag. Sustainable 2023, 15, 13947. [Google Scholar] [CrossRef]
- Wang, K.; Wang, Q.M.; Chen, Y.L.; Li, Z.C.; Guo, X.Y. Antimony and arsenic substance flow analysis in antimony pyrometallurgical process. Trans. Nonferrous Met. Soc. China 2023, 33, 2216–2230. [Google Scholar] [CrossRef]
- Ling, H.; Malfliet, A.; Blanpain, B.; Guo, M. A review of the technologies for antimony recovery from refractory ores and metallurgical residues. Miner. Process. Extr. Metall. Rev. 2024, 45, 200–224. [Google Scholar] [CrossRef]
- Celep, O.; Alp, İ.; Deveci, H. Improved gold and silver extraction from a refractory antimony ore by pretreatment with alkaline sulphide leach. Hydrometallurgy 2011, 105, 234–239. [Google Scholar] [CrossRef]
- Krenev, V.; Dergacheva, N.; Fomichev, S. Hydrometallurgical processes of antimony extraction from ores and concentrates. Theor. Found. Chem. Eng. 2016, 50, 613–619. [Google Scholar] [CrossRef]
- Yang, T.; Rao, S.; Liu, W.; Zhang, D.; Chen, L. A selective process for extracting antimony from refractory gold ore. Hydrometallurgy 2017, 169, 571–575. [Google Scholar] [CrossRef]
- Solozhenkin, P.M.; Alekseev, A.N. Innovative Processing and Hydrometallurgical Treatment Methods for Complex Antimony Ores and Concentrates. Part II: Hydrometallurgy of Complex Antimony Ores. J. Min. Sci. 2010, 46, 446–452. [Google Scholar] [CrossRef]
- Zhang, Y.; Wang, C.; Ma, B.; Jie, X.; Xing, P. Extracting antimony from high arsenic and gold-containing stibnite ore using slurry electrolysis. Hydrometallurgy 2019, 186, 284–291. [Google Scholar] [CrossRef]
- Wang, Y.; Liu, C.; Li, Y.; Ye, Y.; Xu, F.; Li, Y. Metallic antimony preparation by carbothermic reduction of stibnite concentrates: Strategies, mechanisms, and comparison of microwave and conventional roasting. Miner. Eng. 2024, 208, 108584. [Google Scholar] [CrossRef]
- Zhou, A.; Zhang, L.; Zhou, Y.; Li, Y.; Wu, X.; Xia, L.; Liu, Z. Co-Smelting Process of Pb Concentrate and Zn Leaching Residues with Oxygen-Rich Side Blowing Furnaces: Industrial Application and Material Balance. JOM 2023, 75, 5833–5846. [Google Scholar] [CrossRef]
- Mao, Q.H.; Gang, Y.; Chong, Y.; Long, H. Dynamic soft sensor modeling of matte grade in copper oxygen-rich side blow bath smelting process. Measurement 2023, 223, 113792. [Google Scholar]
- Bian, Z.; Chen, D.; Sun, L.; Wang, L.; Zhao, H.; Zhen, Y.; Qi, T. Numerical Simulation and Experimental Investigation of Multiphase Flow in an Oxygen-Rich Side-Blown Bath Smelting Furnace. JOM 2023, 75, 3962–3974. [Google Scholar] [CrossRef]
- Jiang, X.; Cui, Z.; Chen, M.; Zhao, B. Mixing behaviors in the horizontal bath smelting furnaces. Metall. Mater. Trans. B 2019, 50, 173–180. [Google Scholar] [CrossRef]
- Boyle, R.; Jonasson, I. The geochemistry of antimony and its use as an indicator element in geochemical prospecting. J. Geochem. Explor. 1984, 20, 223–302. [Google Scholar] [CrossRef]
- Zhang, Z.T.; Liu, L.J.; Li, Y.H.; Nie, H.P.; Wang, R.X.; Xu, Z.F. Thermodynamic Study on Synergistic Smelting Process of Complex Antimony Gold Concentrate and Lead Concentrate. Nonferrous Met. (Extr. Metall.) 2023, 12, 9–17. [Google Scholar]
- Leal, A.M.M.; Kulik, D.A.; Kosakowski, G. Computational methods for reactive transport modeling: A Gibbs energy minimization approach for multiphase equilibrium calculations. Adv. Water Resour. 2016, 88, 231–240. [Google Scholar] [CrossRef]
- Wang, J.; Chen, Y.; Zhang, W.; Zhang, C. Furnace structure analysis for copper flash continuous smelting based on numerical simulation. Trans. Nonferrous Met. Soc. China 2013, 23, 3799–3807. [Google Scholar] [CrossRef]
- Feng, Y.C.; Li, M.Z.; Dao, Y.Q.; Huang, J.D.; Xie, J.C.; Li, J.B. Thermodynamic Simulation Analysis of Copper Flash Smelting Process with Oxidized Ore Addition. Nonferrous Met. (Extr. Metall.) 2025, 3, 10–20. [Google Scholar]
- Zhang, Z.K.; Li, M.; LLiu, K.; LI, X.X. Analysis on the Influence Law of Key Parameters for Double Bottom Blowing Continuous Copper Smelting Process Based on MetCal Calculation Model. Sci. Technol. Eng. 2022, 22, 8652–8659. [Google Scholar]
- Wang, B.R.; Yang, H.Y.; Jin, Z.N.; Tong, L.L.; Ma, Z.Y. Arsenic distribution and phase structure in oxygen-enriched bottom blown copper smelting process. Chin. J. Nonferrous Met. 2024, 34, 908–922. [Google Scholar]
- Wang, J.S.; Qin, J.; Tao, J.; Huang, T.; Shi, X.X.; Cao, Z.M. Thermodynamic simulation and optimization of lead side blowing oxidation smelting process. Nonferrous Met. Sci. Eng. 2020, 11, 7–15. [Google Scholar]
- Wu, X.Y.; Chen, F.Y.; Chen, Z.H.; He, E.; Zhang, X.X.; Hou, Y.Q.; Xie, G. Optimization of copper slag type in double-furnace continuous smelting with top and side blowing. Chin. J. Nonferrous Met. 2024, 34, 3476–3489. [Google Scholar]
- Shen, Z.; Li, Y.; Xu, N.; Sun, B.; Du, W.; Xu, M.; Chang, L. Investigation on the chemical equilibrium products for CnHmOlNk type fuels using equilibrium constants database. Fuel 2022, 310, 122325. [Google Scholar] [CrossRef]
- Crerar, D.A. A method for computing multicomponent chemical equilibria based on equilibrium constants. Geochim. Cosmochim. Acta 1975, 39, 1375–1384. [Google Scholar] [CrossRef]
- Li, M.Z.; Zhou, J.M.; Tong, C.R.; Zhang, W.H.; Chen, Z.; Wang, J.L. Thermodynamic Modeling and Optimization of the Copper Flash Converting Process Using the Equilibrium Constant Method. Metall. Mater. Trans. B-Process Metall. Mater. Process. Sci. 2018, 49, 1794–1807. [Google Scholar] [CrossRef]
- Li, M.; Feng, Y.; Chen, X. Thermodynamic Simulation Model of Copper Side-Blown Smelting Process. Metals 2024, 14, 840. [Google Scholar] [CrossRef]
- Chen, X.Z.; Li, M.Z.; Liu, F.P.; Huang, J.D.; Yang, M.H. Multi-Phase Equilibrium Model of Oxygen-Enriched Lead Oxidation Smelting Process Based on Chemical Equilibrium Constant Method. Processes 2023, 11, 3043. [Google Scholar] [CrossRef]
- Chen, S.; Zhang, J.; Wang, Y.; Wang, T.; Li, Y.; Liu, Z. Thermodynamic Study of H2-FeO Based on the Principle of Minimum Gibbs Free Energy. Metals 2023, 13, 225. [Google Scholar] [CrossRef]
- Wang, J.; Wen, X.; Zhang, C. Thermodynamic model of lead oxide activity in PbO–CaO–SiO2–FeO–Fe2O3 slag system. Trans. Nonferrous Met. Soc. China 2015, 25, 1633–1639. [Google Scholar] [CrossRef]
- Maruoka, N.; Ueda, S.; Shibata, H.; Yamaguchi, K.; Kitamura, S.-y. Thermodynamic properties of lead oxide in a mixture of stainless steelmaking and nonferrous smelting slags. High Temp. Mater. Process. 2012, 31, 273–279. [Google Scholar] [CrossRef]
- Tan, P.; Zhang, C.; Zhang, R. Computer model of QSL lead smelting process. J. Cent. South Univ. Technol. 1996, 27, 543–546. [Google Scholar]
- Wang, J.; Zhang, C.; Zhang, W. Multi-phase equilibrium model of lead flash smelting process. J. Cent. South Univ. Sci. Technol 2012, 43, 429–434. [Google Scholar]
| Equilibrium Reaction | Kj | Equilibrium Reaction | Kj |
|---|---|---|---|
| 2Pb(ALd) + O2(Gas) = 2PbO(Sl) | K1 | As2O3(Sl) = As2O3(Gas) | K15 |
| PbS(ALd) + O2(Gas) = Pb(Sl) + SO2(Gas) | K2 | Sb2O3(Sl) = Sb2O3(Gas) | K16 |
| 2Zn(ALd) + O2(Gas) = 2ZnO(Sl) | K3 | 6FeO(Sl) + O2(Gas) = 2Fe3O4(Sl) | K17 |
| 4Sb(ALd) + 3O2(Gas) = 2Sb2O3(Sl) | K4 | 2FeS(Sl) + 3O2(Gas) = 2FeO(Sl) + 2SO2(Gas) | K18 |
| 4As(ALd) + 3O2(Gas) = 2As2O3(Sl) | K5 | 2Cu2S(Sl) + 3O2(Gas) = 2Cu2O(Sl) + 2SO2(Gas) | K19 |
| Pb(ALd) = Pb(Gas) | K6 | 2PbO(Sl) + O2(Gas) + 2SO2(Gas) = 2PbSO4(Sl) | K20 |
| Ag(ALd) = Ag(Sl) | K7 | 2ZnS(Gas) + 3O2(Gas) = 2ZnO(Gas) + 2SO2(Gas) | K21 |
| 2Cu2S(Sl) + 3O2(Gas) = 2Cu2O(Sl) + 2SO2(Gas) | K8 | 2Zn(Gas) + O2(Gas) = 2ZnO(Gas) | K22 |
| 2FeS(ALd) + 3O2(Gas) = 2FeO(Sl) + 2SO2(Gas) | K9 | 2As2S3(Gas) + 9O2(Gas) = 2As2O3(Gas) + 6SO2(Gas) | K23 |
| 2Pb(Gas) + O2(Gas) = 2PbO(Gas) | K10 | 2Sb2S3(Gas) + 9O2(Gas) = 2Sb2O3(Gas) + 6SO2(Gas) | K24 |
| PbS(Sl) + 2PbO(Sl) = 3Pb(ALd) + SO2(Gas) | K11 | S2(Gas) + 2O2(Gas) = 2SO2(Gas) | K25 |
| PbS(Sl) = PbS(Gas) | K12 | 2CO(Gas) + O2(Gas) = 2CO2(Gas) | K26 |
| ZnO(Sl) = ZnO(Gas) | K13 | 4Sb(ALd) + 5O2(Gas) = 2Sb2O5(Sl) | K27 |
| 4Bi(ALd) + 3O2(Gas) = 2Bi2O3(Sl) | K14 |
| Pb | Zn | Bi | Cu | Fe | Ca | SiO2 |
| 40.76 | 5.90 | 0.54 | 0.65 | 14.80 | 2.1 | 8.58 |
| S | Mg | Al | C | O | Other | |
| 16.30 | 1.14 | 0.26 | 0.63 | 7.31 | 1.03 |
| Sb | Fe | S | SiO2 | As | Al | Ag | O | Other |
|---|---|---|---|---|---|---|---|---|
| 40.55 | 3.50 | 27.00 | 12.34 | 13.82 | 0.36 | 1.22 | 0.32 | 0.90 |
| SiO2 | CaO | FeO | O | Other |
|---|---|---|---|---|
| 85.00 | 5.00 | 2.64 | 0.29 | 7.07 |
| FeO | CaO | SiO2 | O | Other |
|---|---|---|---|---|
| 0.49 | 53.00 | 1.04 | 0.43 | 45.04 |
| PbS | ZnS | Cu2S | Fe2O3 | FeS | CaCO3 | SiO2 | Ag | Al2O3 |
| 37.23 | 6.96 | 0.64 | 10.05 | 0.53 | 4.15 | 8.18 | 0.12 | 0.46 |
| As2S3 | Sb2S3 | Bi2S3 | MgO | H2O | FeS2 | CaO | Other | |
| 2.30 | 5.73 | 0.53 | 4.15 | 6.95 | 10.12 | 1.98 | 2.60 |
| Name | Unit | Value | Name | Unit | Value |
|---|---|---|---|---|---|
| Pb content of ALd | % | 89.29 | Pb content of dust | % | 38.03 |
| Sb content of ALd | % | 3.24 | Sb content of dust | % | 5.05 |
| Direct yield of Pb | % | 20.62 | Temperature of ALd | °C | 829 |
| Direct yield of Sb | % | 5.87 | Temperature of slag | °C | 1129 |
| FeO/SiO2 in slag | 2.30 | Temperature of gas | °C | 1149 | |
| CaO/SiO2 in slag | 0.53 | Yield of dust | % | 13.88 | |
| CaO/FeO in slag | 0.28 | Yield of ALd | % | 6.18 | |
| Pb content of slag | % | 32.88 | Yield of slag | % | 48.60 |
| Sb content of slag | % | 5.34 | Yield of gas | % | 33.69 |
| Type | Heat Type | Material Name | Temperature (°C) | Heat Quantity (MJ/h) | Ratio of Heat (%) |
|---|---|---|---|---|---|
| Heat income | Physical heat | Mixed ore | 25 | 0.00 | 0.00 |
| Industrial oxygen | 25 | 0.00 | 0.00 | ||
| Air | 25 | 0.00 | 0.00 | ||
| Chemical heat | 25 | 59,250.37 | 100.00 | ||
| Exchange heat | Cooling inlet water | 37 | |||
| Total | 55,250.37 | 100.00 | |||
| Heat outcome | Physical heat | Antimony-rich crude lead | 829 | 480.12 | 0.81 |
| Smelting slag | 1129 | 23,199.92 | 39.16 | ||
| Flue gas | 1149 | 24,207.03 | 40.86 | ||
| Dust | 1149 | 5186.27 | 8.75 | ||
| Exchange heat | Cooling outlet water | 38 | 836.39 | 1.41 | |
| Natural heat dissipation | 60 | 5340.64 | 9.01 | ||
| Total | 59,250.37 | 100.00 |
| Value | Phase | Pb | Sb | Zn | Cu | Fe | CaO | SiO2 | S | As | Bi | Ag |
|---|---|---|---|---|---|---|---|---|---|---|---|---|
| Calculated | ALd | 89.292 | 3.238 | 0.002 | 1.319 | 0 | - | - | 0.348 | 0.555 | 4.284 | 0.903 |
| Measured | 85.176 | 3.370 | - | 1.318 | - | - | - | - | 0.553 | 4.366 | 0.892 | |
| Calculated | Sl | 32.875 | 5.275 | 6.590 | 0.562 | 17.062 | 6.083 | 11.558 | 1.282 | 2.06 | 0.07 | 0.061 |
| Measured | 33.351 | 5.815 | 7.160 | 0.519 | 17.525 | 6.050 | 11.797 | 1.226 | 2.064 | 0.070 | 0.058 |
Disclaimer/Publisher’s Note: The statements, opinions and data contained in all publications are solely those of the individual author(s) and contributor(s) and not of MDPI and/or the editor(s). MDPI and/or the editor(s) disclaim responsibility for any injury to people or property resulting from any ideas, methods, instructions or products referred to in the content. |
© 2025 by the authors. Licensee MDPI, Basel, Switzerland. This article is an open access article distributed under the terms and conditions of the Creative Commons Attribution (CC BY) license (https://creativecommons.org/licenses/by/4.0/).
Share and Cite
Zhong, Z.; Li, M.; Feng, Y.; Ma, B.; Chen, X.; Zhang, Z. Research on the Thermodynamic Simulation Model of Antimony–Lead Synergistic Side-Blown Oxidation Smelting Process Based on MetCal. Processes 2025, 13, 1244. https://doi.org/10.3390/pr13041244
Zhong Z, Li M, Feng Y, Ma B, Chen X, Zhang Z. Research on the Thermodynamic Simulation Model of Antimony–Lead Synergistic Side-Blown Oxidation Smelting Process Based on MetCal. Processes. 2025; 13(4):1244. https://doi.org/10.3390/pr13041244
Chicago/Turabian StyleZhong, Zhenquan, Mingzhou Li, Yuchen Feng, Baozhong Ma, Xinzhou Chen, and Zhongtang Zhang. 2025. "Research on the Thermodynamic Simulation Model of Antimony–Lead Synergistic Side-Blown Oxidation Smelting Process Based on MetCal" Processes 13, no. 4: 1244. https://doi.org/10.3390/pr13041244
APA StyleZhong, Z., Li, M., Feng, Y., Ma, B., Chen, X., & Zhang, Z. (2025). Research on the Thermodynamic Simulation Model of Antimony–Lead Synergistic Side-Blown Oxidation Smelting Process Based on MetCal. Processes, 13(4), 1244. https://doi.org/10.3390/pr13041244