Article

Research on the Effect of Damping Grooves on the Pressure and Cavitation Characteristics of Axial Piston Pumps

by
Ruichuan Li
1,2,
Dongrun Li
1,
Zhengyu Li
3,*,
Tong Wu
1 and
Jikang Xu
4
1
School of Mechanical Engineering, Qilu University of Technology (Shandong Academy of Sciences), Jinan 250353, China
2
Shandong Province Key Laboratory of Intelligent Electro Hydraulic Control, Rizhao 276800, China
3
Weichai Lovol Intelligent Agricultural Technology Co., Ltd., Weifang 261206, China
4
Faculty of Mechanical and Electrical Engineering, Qingdao Agricultural University, Qingdao 266109, China
*
Author to whom correspondence should be addressed.
Processes 2025, 13(5), 1274; https://doi.org/10.3390/pr13051274
Submission received: 15 March 2025 / Revised: 1 April 2025 / Accepted: 21 April 2025 / Published: 22 April 2025
(This article belongs to the Special Issue Application of Refrigeration and Heat Pump Technology)

Abstract

:
The damping groove structure of the port plate plays a crucial role in the pulsation suppression, vibration reduction, and noise optimization of the piston pump. Different damping groove structures have a significant impact on the flow distribution process during the normal operation of the port plate, affecting the pump outlet flow and pressure pulsations, which in turn influence the noise level of the piston pump. Therefore, the damping groove in the piston pump is one of the key structures influencing the pump’s pressure and cavitation behavior. To address the pressure shocks and oscillations caused by the distribution process in the piston pump, this study proposes a novel damping groove and performs CFD simulations on the non-damped groove. The analysis focuses on the pressure pulsation characteristics in the plunger chamber and the cavitation behavior of the pump. Additionally, an optimization analysis of the structural parameters of the new damping groove is conducted, which effectively reduces pressure shocks and cavitation in the swash plate axial piston pump. This study provides a theoretical foundation for improving the performance and lifespan of piston pumps.

1. Introduction

The axial piston pump, due to its high volumetric efficiency, high maximum pressure, and high power density, is widely used in construction machinery and equipment. With the current trend of hydraulic systems developing towards high speed, high pressure, and large flow rates, there are higher performance requirements for axial piston pumps. The impact and pulsation issues inside the piston pump are major causes of unstable operational performance. These phenomena are closely related to pressure fluctuations within the piston chambers and cavitation. The pressure variation in the piston chamber and the formation of cavitation bubbles are influenced by the internal pump structure. The damping groove is a key structure on the port plate of the axial piston pump. A well-designed damping groove configuration and structural parameters can effectively mitigate pressure shocks within the piston chamber and suppress cavitation bubble formation, thereby ensuring the pump’s operational reliability and improving the stability of its performance. Therefore, the design of the structural parameters of the port plate damping groove has become a key focus in axial piston pump research [1,2].
In order to improve the performance of axial piston pumps, scholars and research institutions both domestically and internationally have focused on reducing pressure pulsations and cavitation as key research objectives. G. L. Berta et al. [3] collected pressure pulsation data from the plunger chamber by modifying the structure of the axial piston pump. They used a cavitation-inclusive axial piston pump model to conduct a structural optimization analysis of the damping groove. Professor Noah. D. Manring [4] analyzed the law that the flow pulsation changes with the size of the staggered supporting role and concluded that when the plunger moves to the internal or external dead center, the axial movement speed of the plunger reaches the minimum. Liu X [5] put forward that to determine whether a hydraulic component will experience cavitation and the difficulty of cavitation occurrence, it is not sufficient to rely solely on the minimum pressure. The jet angle of the fluid within the component must also be considered. The jet angle affects the local flow conditions and the potential for vapor bubble formation, influencing the onset and severity of cavitation. S. Kumar et al. [6] proposed that to reduce cavitation in the piston pump, grooves could be introduced in the middle of the piston stroke and near the pressure side of the piston. Shi X et al. [7] analyzed the flow pulsation generation mechanism of the port plate structure for a specific model of aviation axial piston pump. They established a mathematical model for the oil discharge flow of the axial piston pump and proposed an optimization plan for the transition zone structure of the port plate. Wang J et al. [8] performed an optimization design of the port plate structure and conducted a comparative analysis of the volumetric efficiency before and after optimization. The optimized port plate structure significantly improved the volumetric efficiency of the axial piston pump under heavy-load, low-flow conditions. Shan Le et al. [9] performed a comparative analysis by combining the damping groove structure of the port plate with the sliding valve. They conducted a detailed study on the cavitation jet characteristics of the damping groove at the suction port of the piston pump. Wang C et al. [10] conducted a comparative study between the triangular groove and U-shaped groove, exploring the structural characteristics of both and their relationship with pressure and cavitation characteristics. They investigated the influence of different operating conditions on pressure characteristics and cavitation behavior. M. Kunkis et al. [11] conducted experimental research on the speed limitations of piston pumps, pointing out that inlet pressure and the volume fraction of dissolved gases are the main factors affecting the speed limitations and cavitation in piston pumps. M. Stosiak et al. [12] pointed out that the positive displacement pump is a source of pressure pulsations. The reduction in pressure pulsation amplitudes is achieved by using a pressure pulsation damper(Bosch Rexroth AG, Lohr am Main, Germany), which operates over a wide frequency range. The pressure pulsation damper also acts as an acoustic filter. They proposed an improvement plan that addresses insufficient oil supply during the piston chamber suction process and the radial pressure unevenness caused by centrifugal force.
Due to the need to consider complex shapes of local resistances inside the pump, CFD numerical methods are useful [13]. This study develops a CFD simulation model for an axial piston pump and proposes a novel damping groove structure for the port plate. The pressure pulsation characteristics and cavitation behaviors of the plunger chamber are analyzed through simulations for both the new damping groove and a non-damped groove. Given the significant impact of the distribution process on the pressure pulsation characteristics of the plunger chamber, the influence of the structural parameters of the new damping groove on these characteristics is examined. The key parameters include the length, width, and depth of the damping groove. The mechanism of each parameter’s effect is explored, and the relatively optimal parameters for achieving favorable pre-pressurization/pressure relief and cavitation reduction effects are identified.

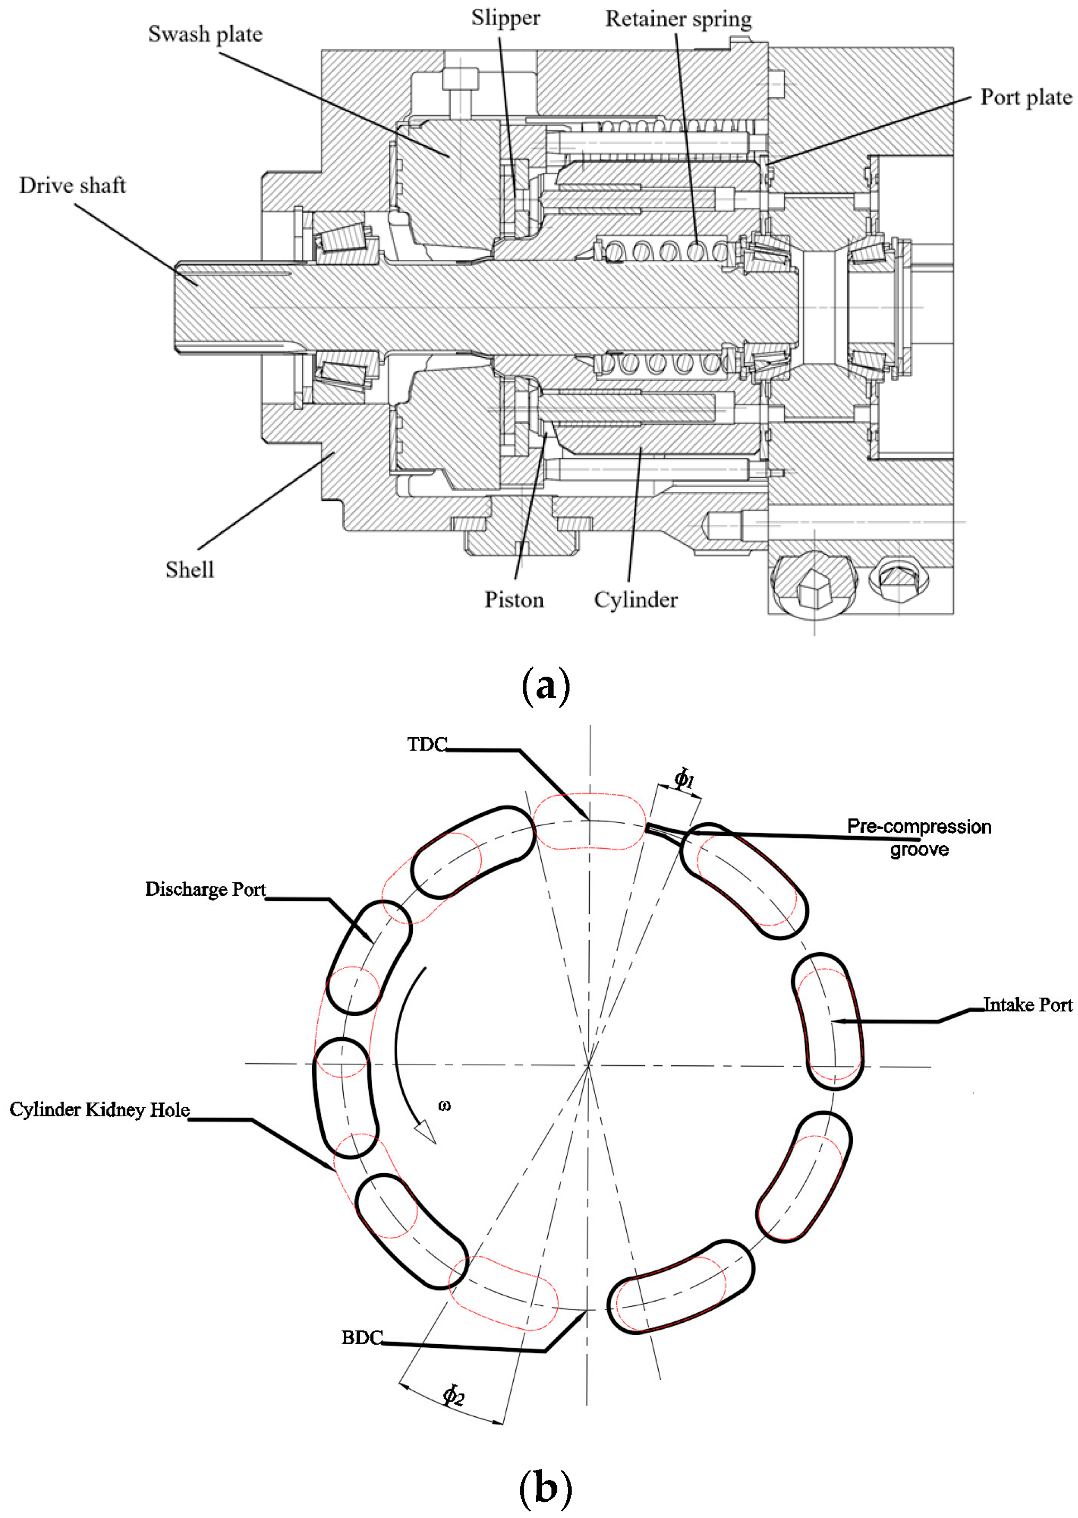
2. The Three-Dimensional Model of the Axial Piston Pump

The structure of the swash plate axial piston pump is shown in Figure 1a. The swash plate axial piston pump mainly consists of the swash plate, slipper, piston, cylinder block, drive shaft, port plate, and other components. The slipper is hinged to the piston ball head, and it is pressed against the swash plate under the action of the central spring. The pistons are installed in the piston holes of the cylinder block and are evenly distributed along the axial circumference. The port plate is fixed to the bottom of the housing by positioning pins, and it has a pair of keyhole-shaped openings that are used for the pump’s suction and discharge functions. The extreme position of the discharge chamber is defined as the top dead center (TDC), as illustrated in Figure 1b. During the operation of the axial piston pump, the high- and low-pressure chambers of the port plate connect to the pump’s inlet and outlet passages, respectively, forming a complete hydraulic circuit. The working process can be divided into three distinct phases: First, when the piston moves toward the intake chamber, working fluid enters the piston chamber through the pump inlet. Second, the piston moves toward the discharge chamber to complete fluid compression. Finally, the high-pressure fluid is discharged through the pump outlet. To enhance system performance, damping grooves are machined into the port plate to effectively mitigate pressure pulsations. This cyclic suction–discharge design ensures efficient fluid energy transfer and guarantees the stable operation of the axial piston pump.
The pre-compression angle (ϕ1) and pre-decompression angle (ϕ2) serve as critical structural parameters of the port plate, governing the compression and release processes of hydraulic oil within the piston chamber, thereby influencing the operational characteristics of the axial piston pump. To mitigate pressure pulsations during transition phases, ϕ1 and ϕ2 can be calculated using the following formula:
cos ϕ 1 = 1 2 P d P i K e 1 + 2 V o π d p 2 R tan α
cos ϕ 2 = 1 4 V o P d P i π K e d 2 R tan α
In the formula, Pd is the piston pump outlet pressure, Pi is the piston pump inlet pressure, Ke is the volume modulus of water, Vo is the gap volume, dp is the plunger diameter, R is the plunger pitch radius, and α is the swashplate angle. According to the main structural parameters of the axial piston pump, and the calculation results of the pre-compression angle and pre-unloading angle are ϕ1 = 13° and ϕ2 = 17°, respectively.
The port plate structure of an axial piston pump is a crucial component that significantly affects the overall operational stability of the pump [14]. In this study, a novel damping groove structure is adopted, as shown in Figure 2. The proposed damping groove features a triangular prism-shaped front end and a trapezoidal rear end (referred to as a T-shaped damping groove). The front-end structure is smooth, and the overall design is wide, which facilitates a gradual transition of stress along the length of the groove. This design helps to better control vibrations, enhances the damping effect, and effectively suppresses cavitation during the rotation of the cylinder. To investigate the impact of the damping groove on pump performance, both a non-damped groove and a T-shaped damping groove are selected as research subjects. By varying three parameters, namely the T-shaped damping groove length (L), width (B), and depth (H), the influence of the damping groove on the flow characteristics of the axial hydraulic pump is analyzed.

3. CFD Modeling of the Axial Piston Pump

3.1. Turbulence Model

Compared to the standard k-ε model, the key feature of the RNG k-ε model is that the mainstream time-averaged strain rate is introduced in the calculation of the coefficient ε in the equation, increasing the influence of the average strain rate. Additionally, the constants in the RNG k-ε model equation are derived from theoretical analysis. Furthermore, another advantage of the RNG k-ε turbulence model over the standard k-ε model is its ability to compensate for the latter’s overestimation of turbulence kinetic energy generation in regions with strong strain, as well as its ability to simulate fluid flow separation, recirculation, and secondary motions. In this paper, the RNG k-ε turbulence model is used for cavitation flow simulation analysis of the axial piston pump and the throttling groove [15,16].
ρ d k d t = x i μ + μ t σ k k x i + G k + G b ρ ε Y M
ρ d ε d t = x i μ + μ t σ ε ε x i + C 1 ε ε k G k + C 3 ε G b C 2 ε ρ ε 2 k
Among them, G k represents the turbulence kinetic energy generated by the mean velocity gradient; G b represents the turbulence kinetic energy generated by buoyancy effects; Y M represents the effect of compressible turbulence fluctuation expansion on the total dissipation rate; and μ t models parameters in the turbulence viscosity equation, where C 2 ε = 1.68 and C 3 ε = 0.085. The turbulence Prandtl number for kinetic energy k and its dissipation rate ε are, respectively: σ k = 0.7179 and σ ε = 0.7179. C 1 ε   is not a constant:
C 1 ε = 1.42 η 1 η / η 0 1 + β η 3  
where η 0 = 4.377 ; β = 0.012 ; β = S k / ε ;   S = 2 S i j S i j 1 / 2 ;   S i j = 1 2 u i x j + u j x i   .

3.2. Cavitation Model

The use of a full cavitation model provides a more reasonable explanation of the factors influencing cavitation and offers a more comprehensive description of the cavitation phenomenon. In the full cavitation model, the fluid density ρ m is a function of the mixture fluid mass fraction f , derived from the momentum conservation equation and the mass conservation equation [17,18].
Assuming the fluid is compressible and considering the fluid’s viscosity and turbulence, the transport equation is obtained as follows:
t ρ m f + ρ m f = I f + R e R r
In the above equation, R e and R r represent the rate of vapor generation and condensation, respectively. These are functions of pressure, flow velocity, gas phase density, liquid phase density, saturation pressure, and the surface tension of the liquid phase.
In the simulation process, considering the physical properties of the mixture fluid and the interaction between the gas and liquid phases, as well as factors such as bubble dynamics, the phase change rate, turbulence, and incompressible gases, the final form of the full cavitation model is established as follows:
1 ρ m = f v ρ V + f g ρ G + 1 f v f g ρ L
In the equation, f v represents the vapor mass fraction and f g represents the oil mass fraction.
For the correction of the liquid–gas volume fraction α g and the vapor gas volume fraction α v , the following relationships hold:
α g = f g ρ m ρ G
α v + α g = 1
Considering the impact of incompressible gas, the solution for R e   and   R r can be expressed as follows:
R e = C e 1 f ρ V ρ L σ 2 K p v p 3 ρ L
R r = C r f ρ V ρ L σ 2 K p v p 3 ρ L
Among them, K represents the turbulence kinetic energy, in m2/s2. C e and C r are empirical constants, typically taken as C e   = 0.02 and C r   = 0.01.

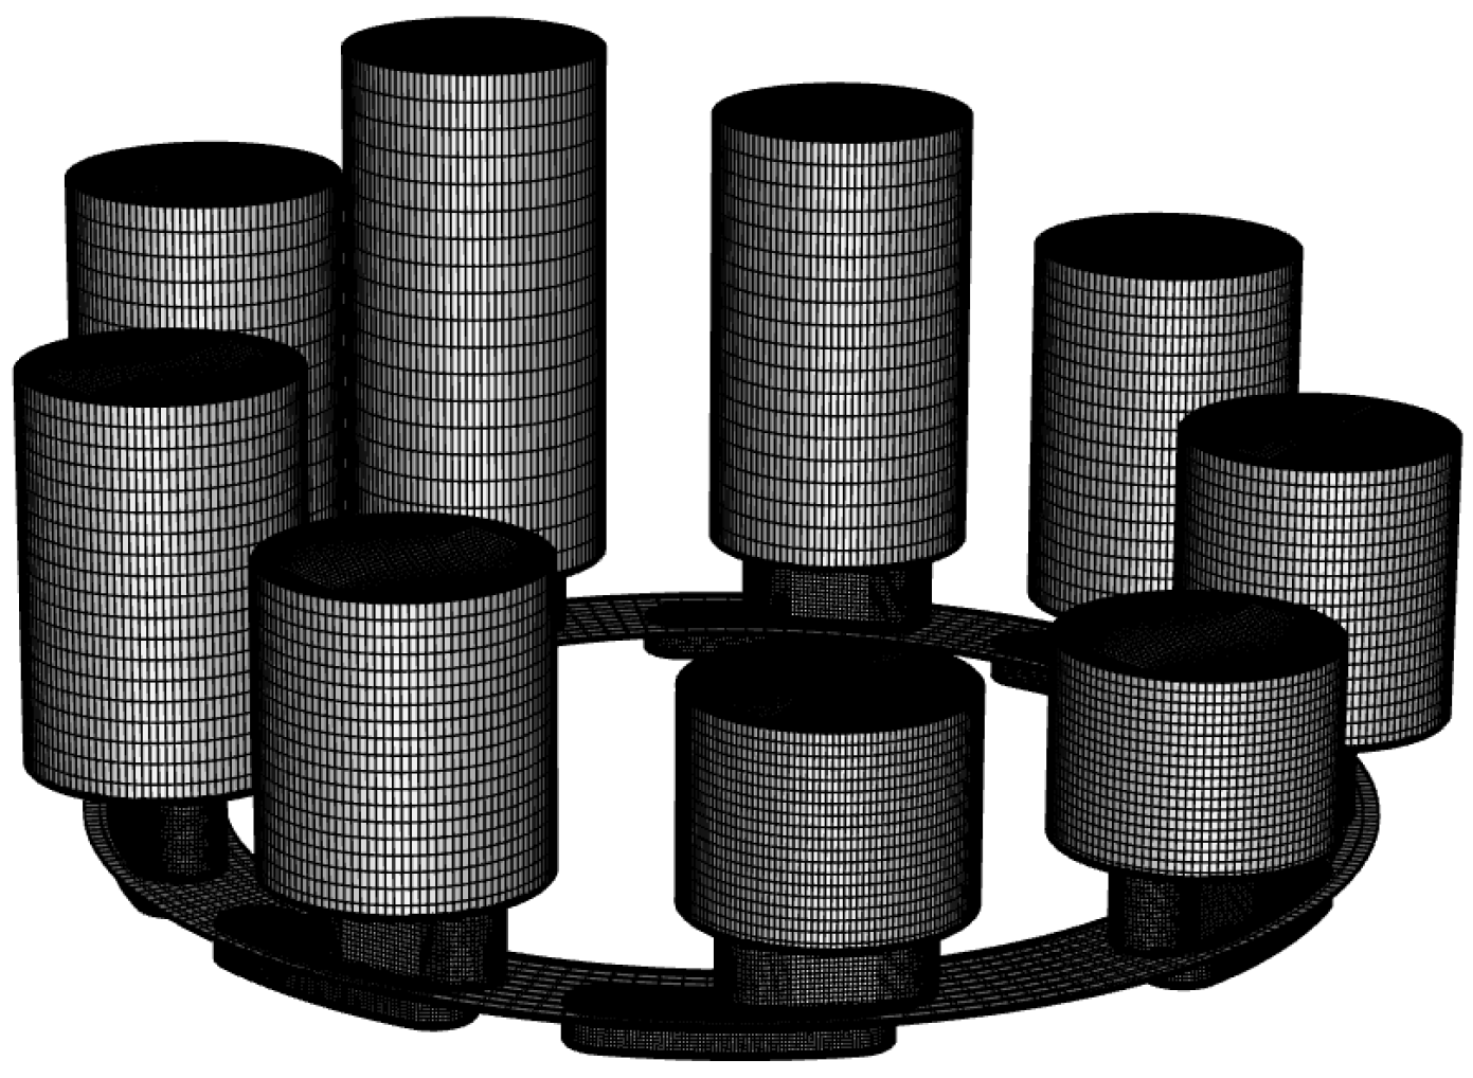
3.3. CFD Model Grid Generation

In the actual operation of the piston pump, there are two primary movements [19]. The cylinder block rotates with the main shaft, driving the nine pistons to perform rotational motion, while reciprocating under the constraint of the swash plate. The sliding mesh technique sets a non-conformal interface between the rotating and stationary regions, allowing for data exchange between regions with different motion states. This method enables the effective simulation of the interaction between the two regions under varying speed conditions without requiring global mesh updates at every time step.
Meshes can be categorized into structured and unstructured grids. Structured grids offer better quality, higher computational accuracy, and fewer grid cells, but they are more challenging and time-consuming to generate for complex geometries. To ensure simulation accuracy and stability, this study uses only structured grids. The processed model is imported into icem CFD for grid generation. Each component is discretized, and boundary layer grids are set according to simulation requirements. Local grid refinement is applied where necessary, based on solution and quality criteria. Faces and regions requiring data extraction and interaction are named for ease of subsequent work. Using icem’s grid assembly functionality, a modular grid model is built, allowing for the substitution of grids corresponding to different structural parameters to improve simulation efficiency. The grid division results are shown in Figure 3 [20].

3.4. Mesh Independence Verification

The quality of the generated mesh is a key factor affecting the accuracy of simulation analysis. A high-quality mesh ensures that the simulation results are closer to real-world conditions. In general, the smaller the mesh size and the larger the number of cells, the more accurate the simulation results will be. However, too many mesh cells will increase the computational cost and significantly slow down the simulation process. Therefore, mesh independence verification must be conducted to ensure accurate results while minimizing the number of mesh cells and improving the simulation speed.
In this study, simulations were conducted under operational conditions of a maximum rotational speed of 1500 r/min, with inlet and outlet pressures set at 0.1 MPa and 30 MPa. Four sets of mesh data are selected for the simulation (with a lubricant film thickness set to 12 µm), using the outlet pressure of the piston pump as the evaluation index. The results are shown in Table 1. When the number of mesh cells reaches 1,766,814, the outlet pressure is already close to 30 MPa. Further increasing the number of mesh cells does not significantly affect the results. Considering the computational resources, the parameter combination labeled 3 is selected for the simulation.

3.5. Initialization and Boundary Conditions

The pump inlet is set as the pressure inlet, and the pump outlet is set as the pressure outlet. Commercial FLUENT software is used for the simulation, employing the mixture model, RNG k-ε turbulence model, dynamic mesh, sliding mesh, and user-defined functions (UDFs) to define the piston speed in the plunger chamber and the compressibility of both liquid and gaseous fluids. The finite volume method and non-structured grids are applied for the spatial discretization of the governing equations [21]. The simulation time step is set to 0.0002 s, with a total of 200 time steps and 200 iterations. The structural parameters of the piston pump, fluid properties, and other boundary conditions are summarized in Table 2.

4. Simulation Structure and Analysis

This study conducts a comparative simulation between two structures: the non-damped groove and the novel damping groove. By analyzing the pressure characteristics and cavitation characteristic distribution of the axial piston pump, the advantages of the T-shaped damping groove are identified. Additionally, a parameter sensitivity analysis of the T-shaped damping groove is performed to explore its impact on the pump’s performance.

4.1. Transient Analysis of Damping Groove Flow Field Characteristics

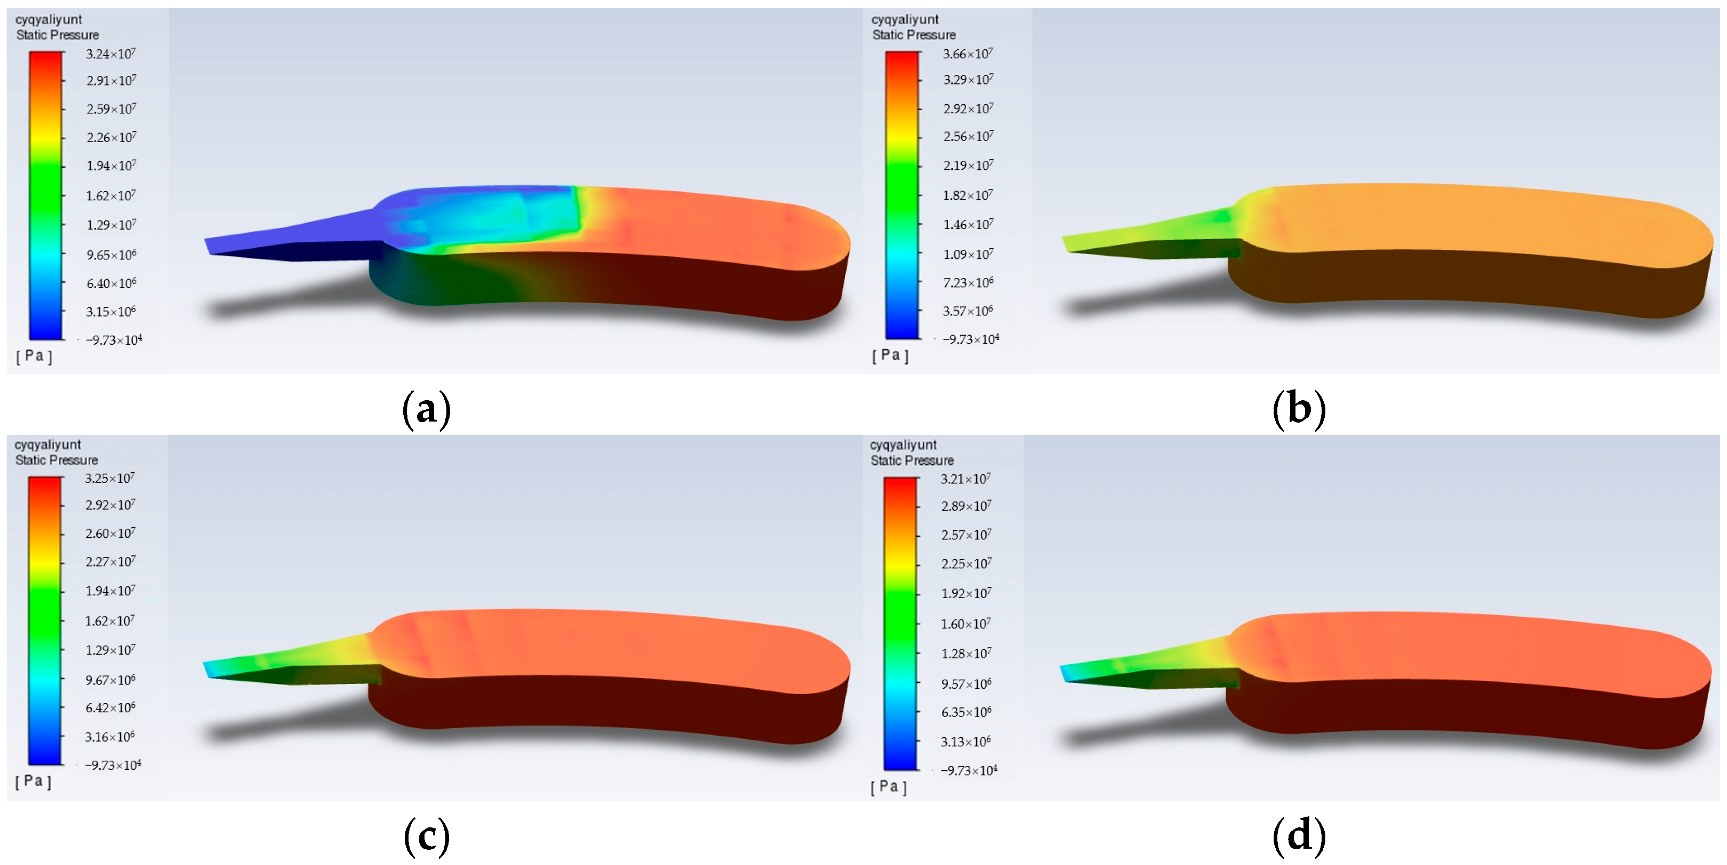
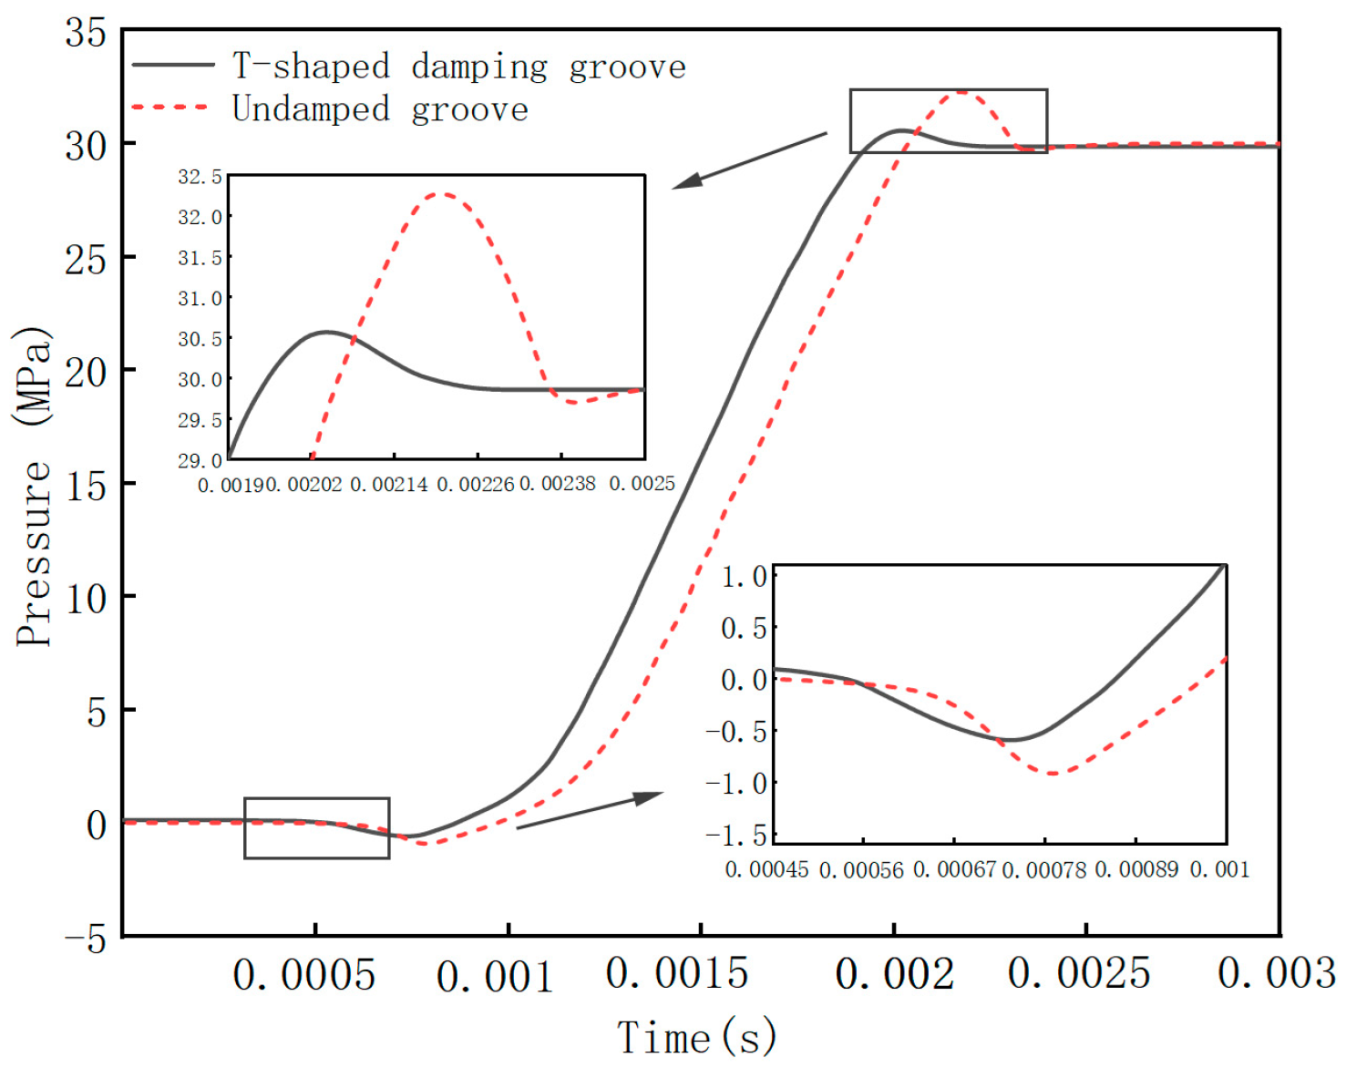
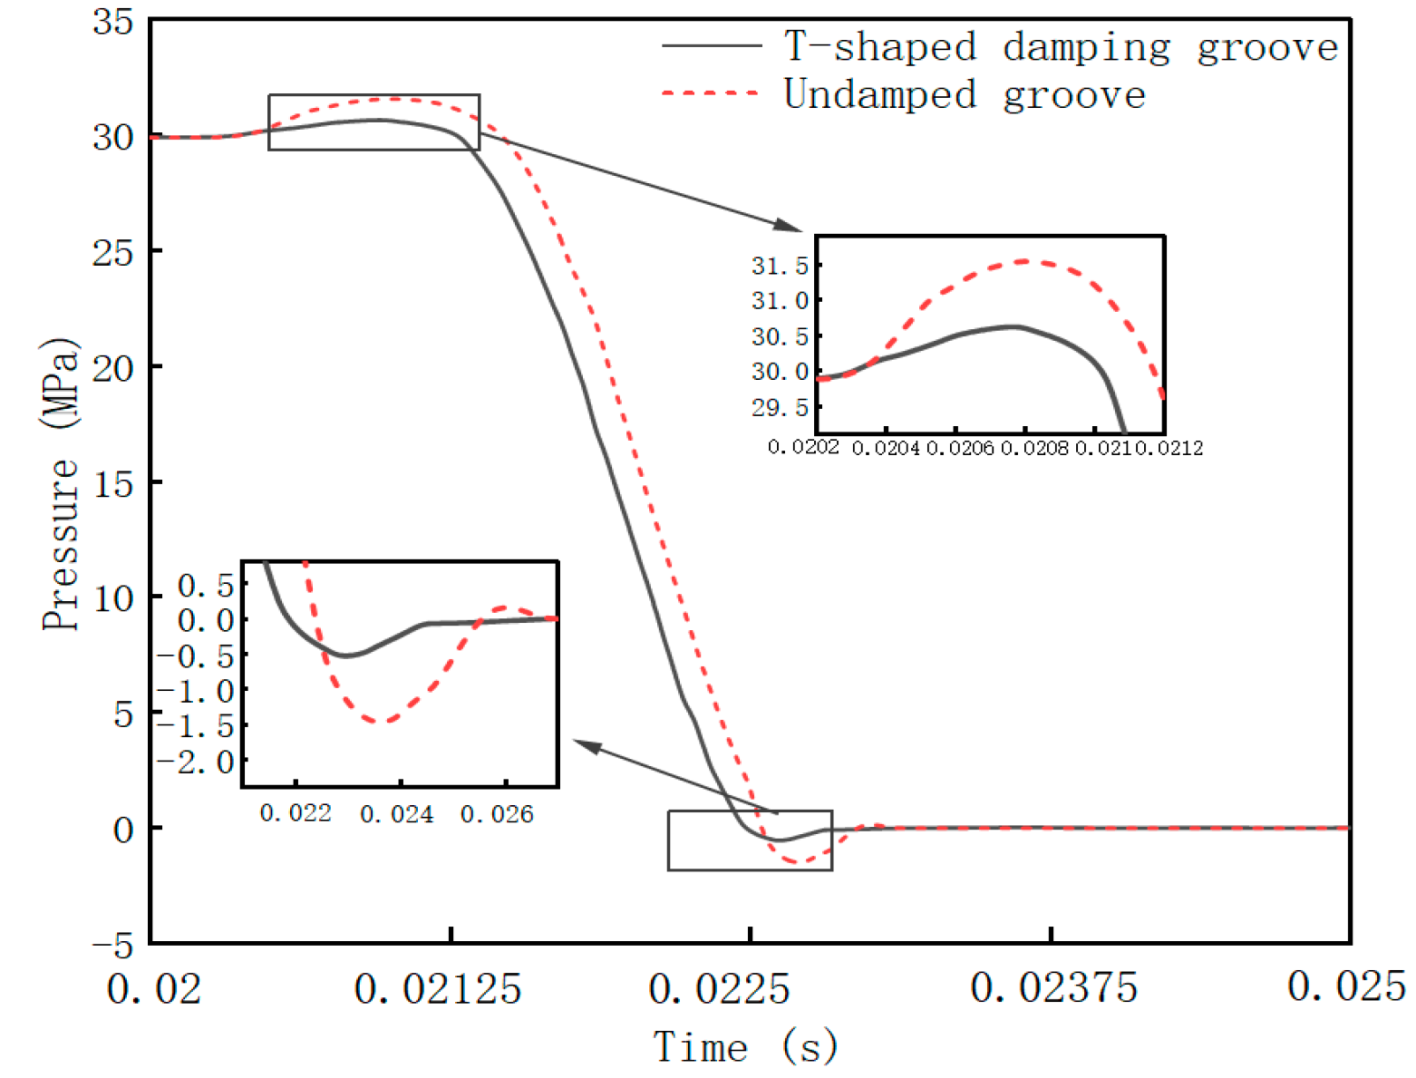
4.1.1. Pressure Characteristic Analysis

The fluid pressure distribution of the piston pump with and without the damping groove during one operating cycle is shown in Figure 4 and Figure 5. In Figure 4, the pressure of the pump without the damping groove reaches 43.8 MPa, which is nearly 46% higher than the nominal working pressure. In contrast, Figure 5 shows that the pressure with the T-shaped damping groove is 36.6 MPa, approximately 22% higher than the nominal working pressure. This indicates that the T-shaped damping groove reduces the pressure by 24% compared to the non-damped groove. Therefore, the T-shaped damping groove effectively suppresses the pressure fluctuations generated during the operation of the piston pump, and during piston movement, it can effectively control pressure pulsations and hydraulic shocks.
Figure 6 illustrates the oil discharge phase when the damping groove parameters are set to L = 10 mm, B = 1.25 mm, and H = 1 mm. During this phase, the pressure in the damping groove begins to rise, with high pressure predominantly distributed within the chamber. The maximum pressure reaches 36.6 MPa, while the minimum pressure is −9.73 × 10⁻² MPa, which is consistent with the overall pressure profile shown in Figure 5. Additionally, the highest pressure values in both Figure 5 and Figure 6 are in agreement.
Figure 7 shows the pressure variation curve in the piston chamber with the damping groove. It is evident that within one intake and discharge cycle, the pressure in the piston chamber undergoes some changes, with two high-to-low pressure transitions, resulting in four pressure shocks. At the beginning, the piston chamber moves away from the low-pressure region of the keyhole groove, causing the flow area between the two chambers to rapidly decrease, leading to a significant damping effect. Additionally, the viscosity and inertia of the fluid cause throttling effects, which cause the piston chamber pressure to fall below the high-pressure region, resulting in a negative pressure overshoot. As the piston chamber enters the closed dead pre-boost zone, the pressure increases rapidly. However, the rate of increase in the flow area does not match the rate of increase in piston velocity, and under the influence of throttling effects and fluid backflow inertia, the pressure exceeds that of the high-pressure zone, causing a positive pressure overshoot. When the piston chamber moves away from the high-pressure region of the keyhole groove, the flow area between the two chambers decreases. The rate of decrease in the flow area does not match the rate of decrease in piston velocity, causing throttling effects, resulting in the piston chamber pressure being higher than the high-pressure region, resulting in a positive pressure overshoot. As the piston chamber enters the closed dead pre-unloading zone, the pressure decreases rapidly, and the piston chamber pressure drops to the low-pressure zone. However, the rate of decrease in the flow area does not match the rate of decrease in piston velocity, and under the influence of throttling effects and fluid backflow inertia, the pressure falls below the low-pressure zone, resulting in a negative pressure overshoot of about 0.54 MPa.
Figure 8 and Figure 9 show the pressure curves of the piston chamber in the transition zone for both with and without damping grooves. It can be observed that from the initial stages of pre-boost and pressure relief, the negative pressure overshoot in the new groove is almost nonexistent, and the start of the pre-boost pressure has been advanced. Similarly, in the pre-unloading pressure curve, the positive pressure overshoot of the new groove is smaller than that of the undamped groove, and the start of the pre-unloading pressure has been advanced as well. The pressure rise and relief performance of the undamped groove are poorer than those of the new damping groove. In the pre-boost pressure curve, the positive pressure overshoot of the undamped groove is approximately 1.92 MPa higher than that of the new groove, while in the pre-unloading curve, the negative pressure overshoot of the undamped groove is approximately 0.89 MPa higher than that of the new groove.

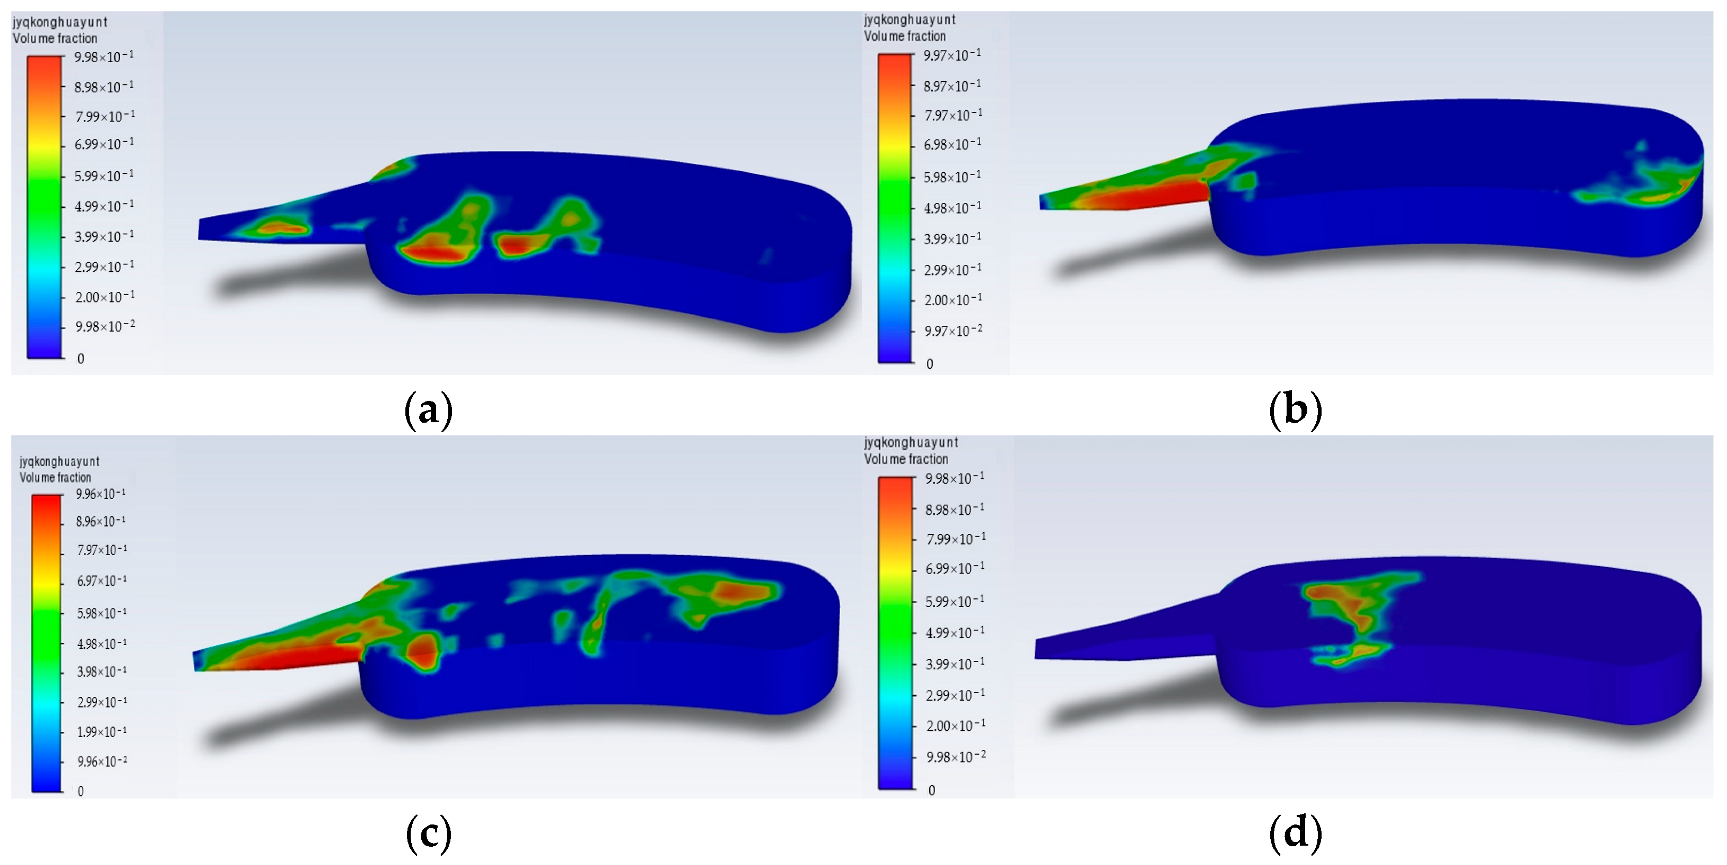
4.1.2. Cavitation Characteristic Analysis

This paper introduces a cavitation model for an in-depth analysis of the cavitation phenomenon. From the overall pressure distribution of the port plate flow passages in Figure 4 and Figure 5, it is evident that the minimum pressure reaches −9.73 × 10⁻² MPa, which is significantly lower than the absolute zero pressure. Therefore, cavitation occurs during the operation of the axial piston pump. Cavitation leads to intense vibrations and noise in the hydraulic system, which not only causes noise interference but also reduces the system’s efficiency and reliability. It shortens the lifespan of hydraulic components and pipelines, induces pulsations in flow and pressure, and subsequently affects the overall performance of the hydraulic system.
Figure 10 and Figure 11 show the gas volume fraction distribution of hydraulic oil for both the non-damped groove and the T-shaped damping groove. It can be clearly seen that in the oil suction region, the gas volume inside the plunger chamber is greater than that on the outside. This is due to the centrifugal force generated by the piston’s high-speed rotation, causing the oil pressure on the inner side of the plunger chamber to be lower than that on the outer side. During the process of oil suction to oil discharge, the plunger chamber undergoes four distinct stages: high-pressure to low-pressure, low-pressure suction, low-pressure to high-pressure, and high-pressure discharge. Cavitation in the axial piston pump primarily occurs during the oil suction phase of the plunger chamber. As shown in Figure 12, once the suction phase begins, with the rotation of the pump cylinder, the piston performs variable-speed motion along the Z-axis of the plunger chamber. This leads to a rapid increase in plunger chamber volume and a rapid decrease in pressure. When the pressure drops below the fluid’s saturation vapor pressure or the gas separation pressure, gas bubbles will nucleate, and cavitation will occur in the fluid.
Furthermore, by comparing the cavitation contour maps of the undamped groove and the T-shaped damping groove, it can be observed that after adopting the T-shaped damping groove, both the gas volume fraction and the cavitation area in the cavitation region are reduced. This indicates that the T-shaped damping groove alleviates the cavitation phenomenon in the pump to some extent. Its optimized design can effectively improve the cavitation performance of the piston pump, which is of significant importance for extending the pump’s service life.
As shown in Figure 13, both with and without the damping groove, the cavitation level reaches its maximum between 0.02 s and 0.025 s, with values of 0.56 and 0.41, respectively. However, the peak gas volume fraction for the T-shaped damping groove is noticeably lower than that of the non-damped groove, indicating that the T-shaped damping groove effectively reduces the peak gas volume fraction and suppresses cavitation. The T-shaped damping groove causes the gas volume fraction to decrease more rapidly, and the subsequent fluctuation amplitude is smaller. This demonstrates that the T-shaped damping groove can more effectively suppress gas accumulation, which, in practical applications, helps reduce undesirable phenomena such as vibrations or cavitation.

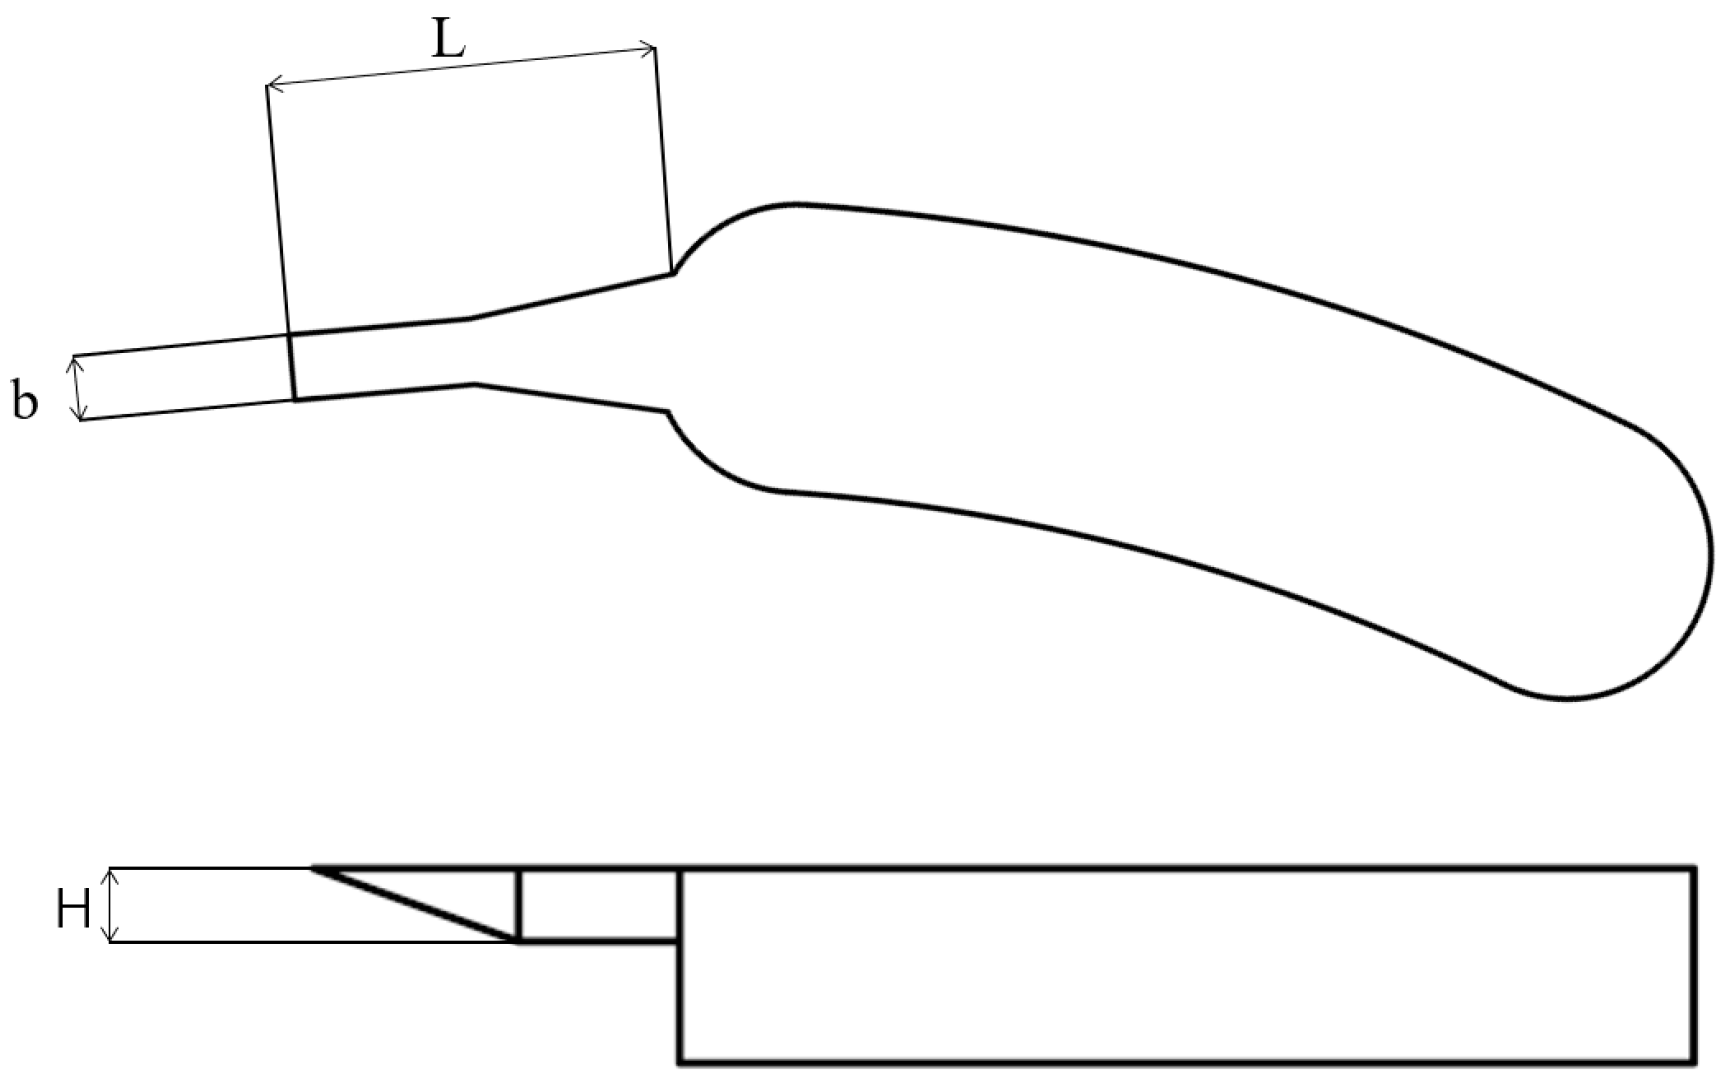
4.2. Study on the Structural Parameters of the T-Shaped Damping Groove

The port plate controls the flow distribution process in the piston pump, and its structural parameters have a significant impact on the pressure pulsation characteristics of the plunger chamber. In the piston pump, it plays a crucial role in reducing negative phenomena such as pressure fluctuations, hydraulic shocks, noise, and cavitation, thereby improving the pump’s performance, efficiency, and stability. This paper analyzes and studies three structural parameters of the new damping groove: length (L), width (B), and depth (H). If the damping groove is too small, it will not effectively smooth out fluid pressure fluctuations, leading to significant pressure pulsations and hydraulic shocks during the pump’s operation, which can damage its performance and service life. On the other hand, if the damping groove is too large, it can cause instability in fluid flow, weakening the suppression of pressure fluctuations and potentially leading to cavitation under certain operating conditions. Therefore, the damping groove must be optimized to avoid both excessive size, which may cause undesirable effects, and insufficient size, which may lead to performance issues, ensuring the pump’s performance, stability, and reliability. The range of each parameter is shown in Table 3.

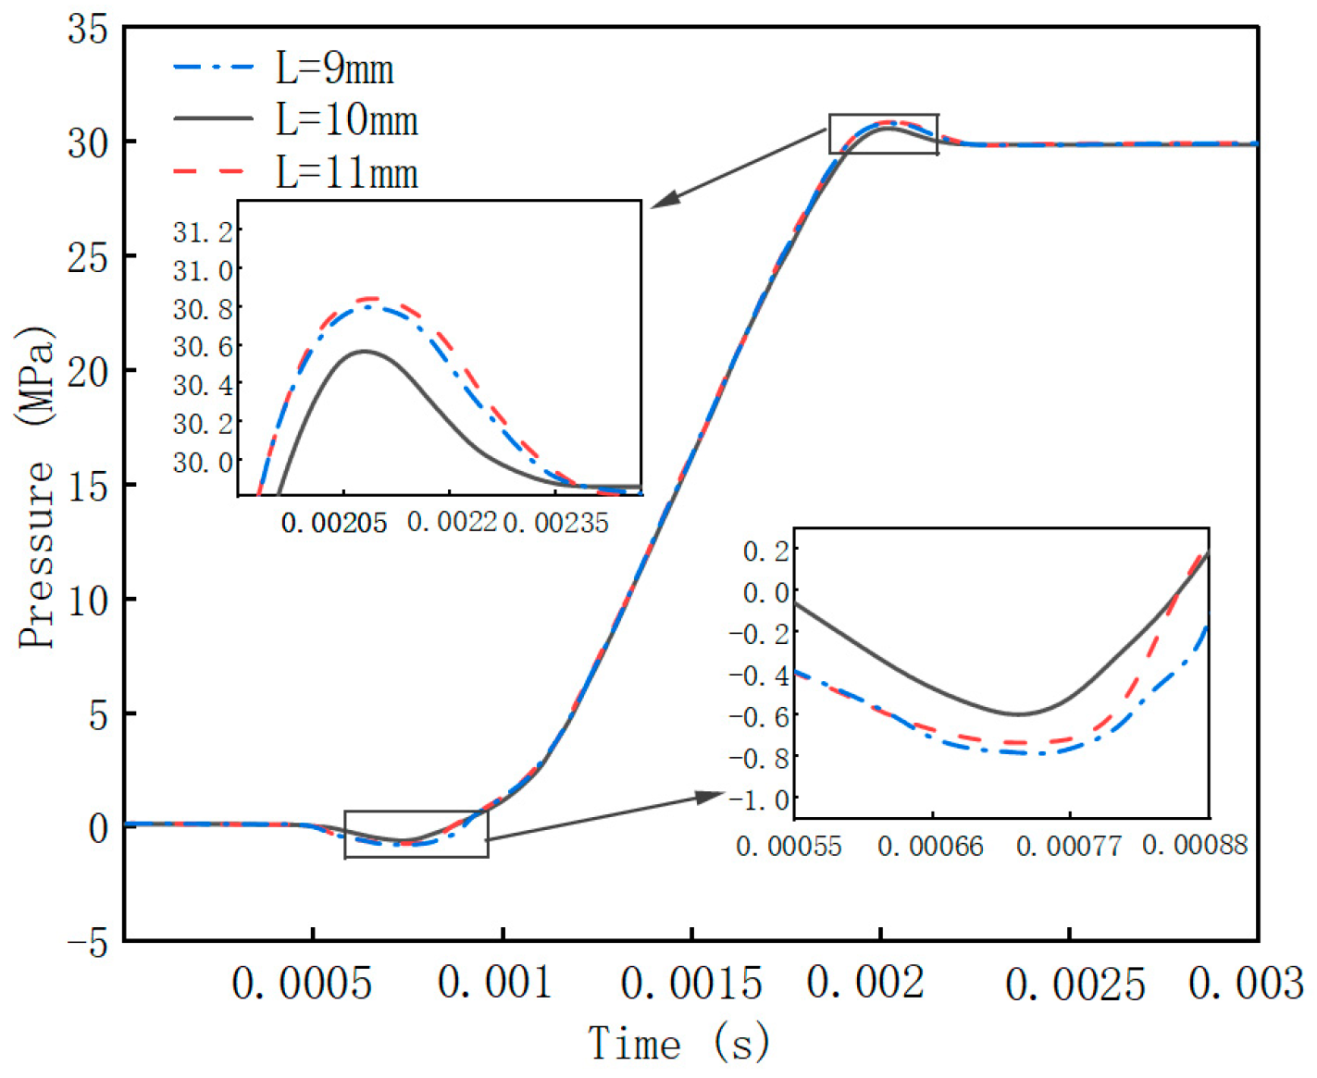
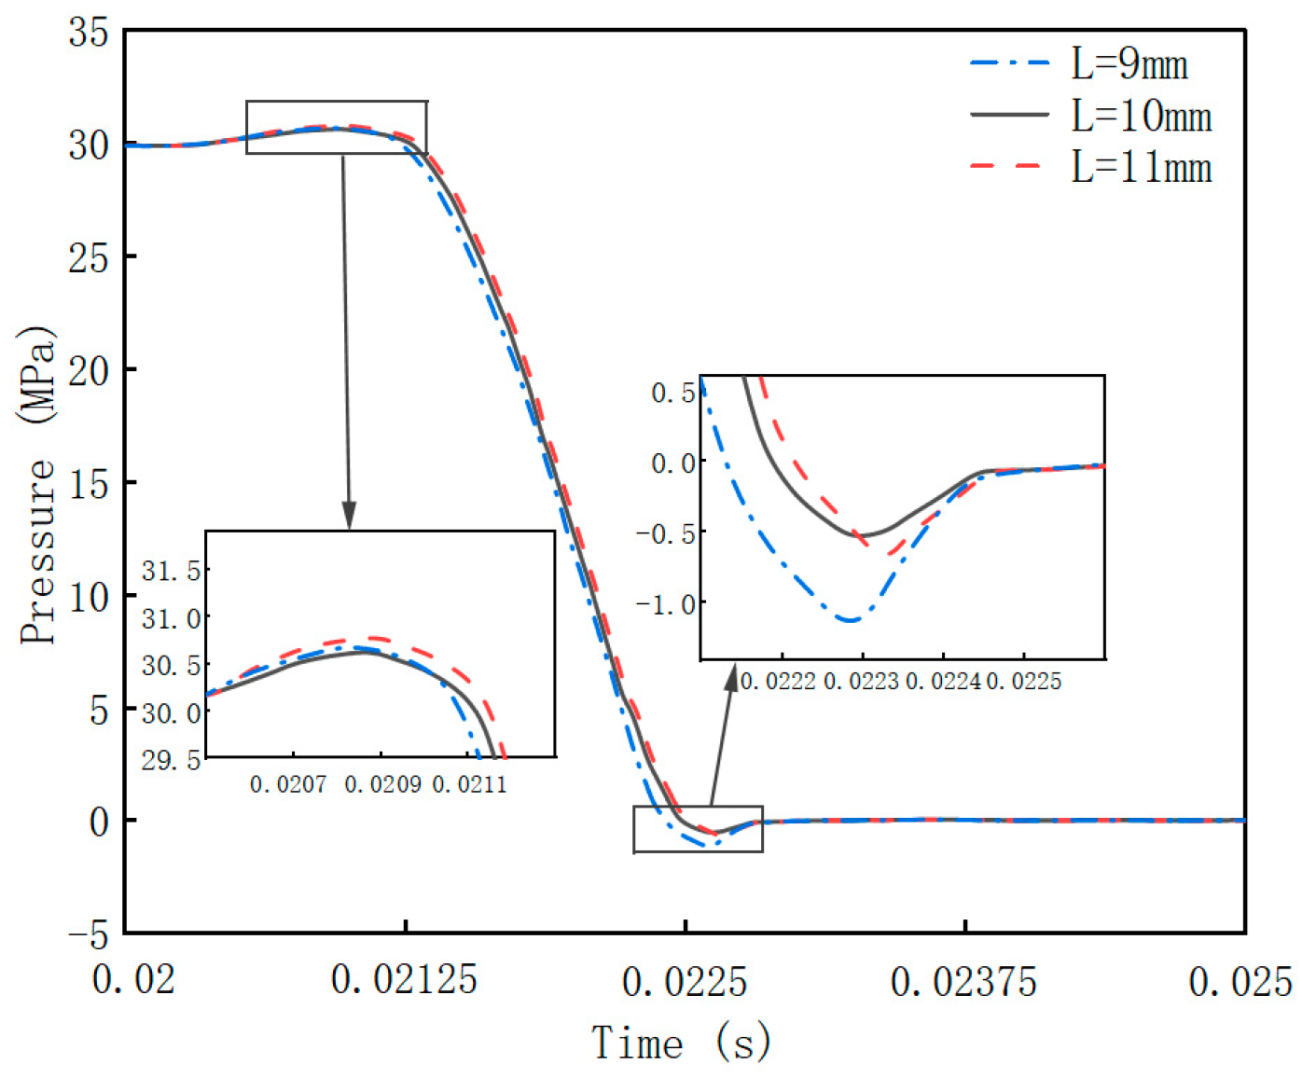
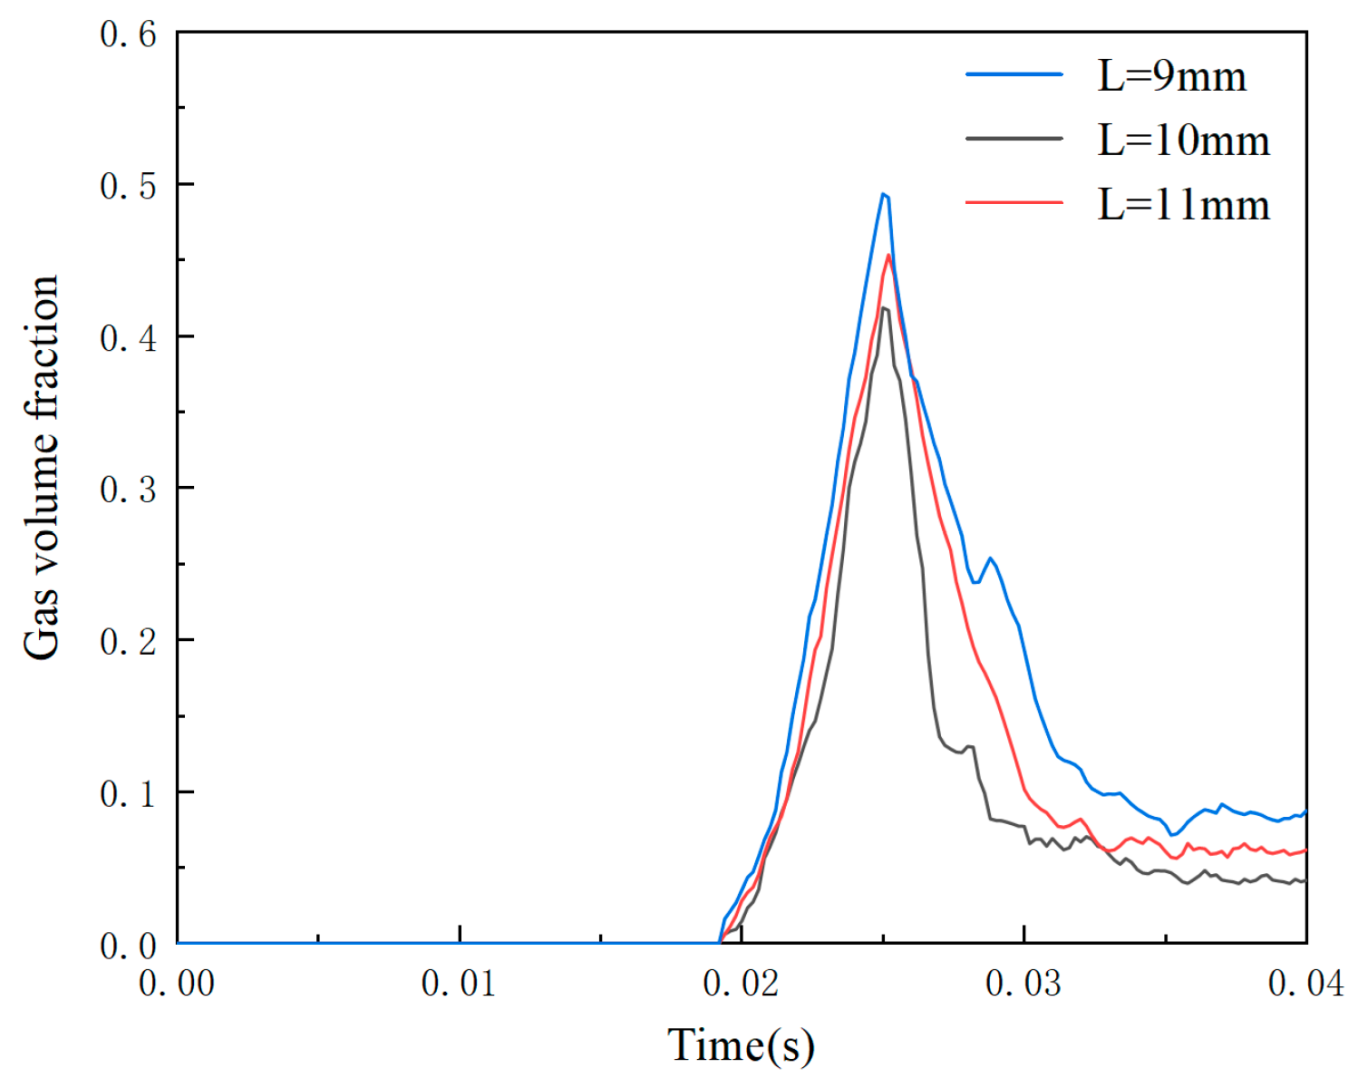
4.2.1. Effect of the T-Shaped Damping Groove Length (L) on Flow Field Performance

During the simulation process with the operating parameters, as well as the width and depth of the damping groove, held constant, different length control groups were modeled in 3D and incorporated into the simulation model. The analysis focuses on the pre-pressurization process by examining the pressure curve in the plunger chamber and the variation in volume fraction.
Figure 14 and Figure 15 show the pressure pulsation variation in the piston chamber for different damping groove lengths. During the pre-boost process, the curve corresponding to L = 11 mm shows a higher positive pressure overshoot due to the increased flow area, which allows more oil to flow into the piston chamber. The pre-boost pressure is higher. The curve corresponding to L = 10 mm shows an appropriately set pre-boost pressure. The curve corresponding to L = 9 mm shows an increase in the negative pressure overshoot before the pre-boost process, which increases the pre-boost pressure target and results in a higher positive pressure overshoot at the end of the pre-boost process.
During the pre-unloading process, when L = 11 mm, the increased flow area allows more oil to flow through, thereby increasing the negative pressure overshoot. When L = 9 mm, the increased pre-unloading pressure target leads to a higher negative pressure overshoot at the end of the pre-unloading process.
Figure 16 illustrates the effect of different damping groove lengths (L = 9 mm, 10 mm, and 11 mm) on the variation in the gas volume fraction over time. As the length of the damping groove increases, the peak time of the gas volume fraction is delayed. This indicates that longer damping grooves contribute to smoother changes in the gas volume fraction, effectively reducing pressure pulsations and cavitation. Notably, when the damping groove length is 10 mm, the best balance is achieved, as it suppresses cavitation while avoiding excessive pressure fluctuations. The average gas volume fractions for damping groove lengths of 9 mm, 10 mm, and 11 mm are 8.32%, 5.73%, and 7.15%, respectively, which aligns with the pressure distribution analysis shown in Figure 15 and Figure 16.

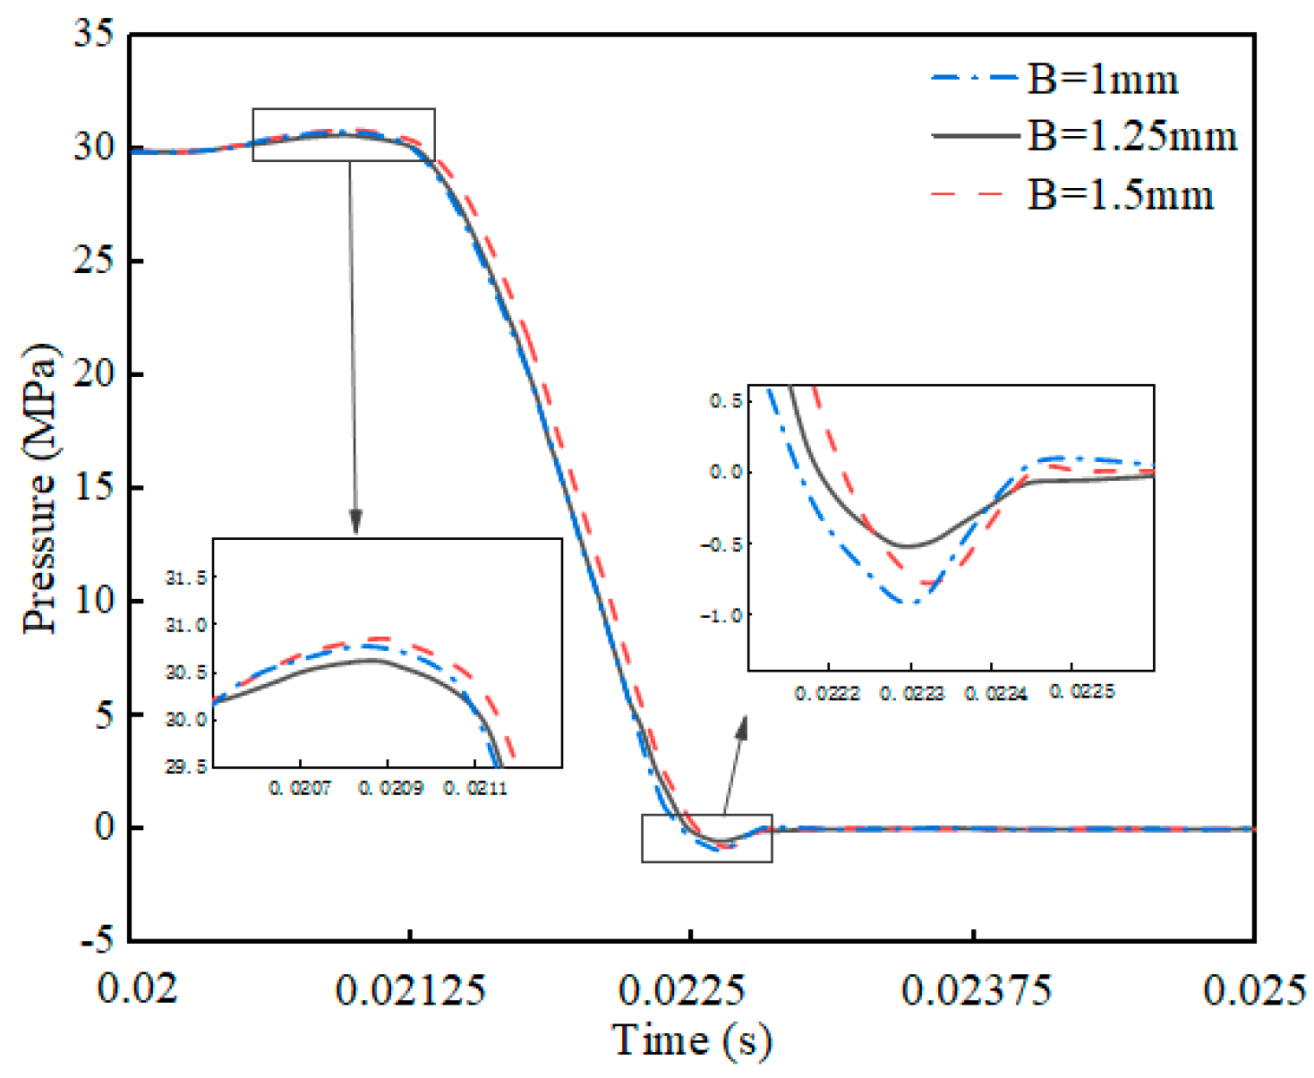
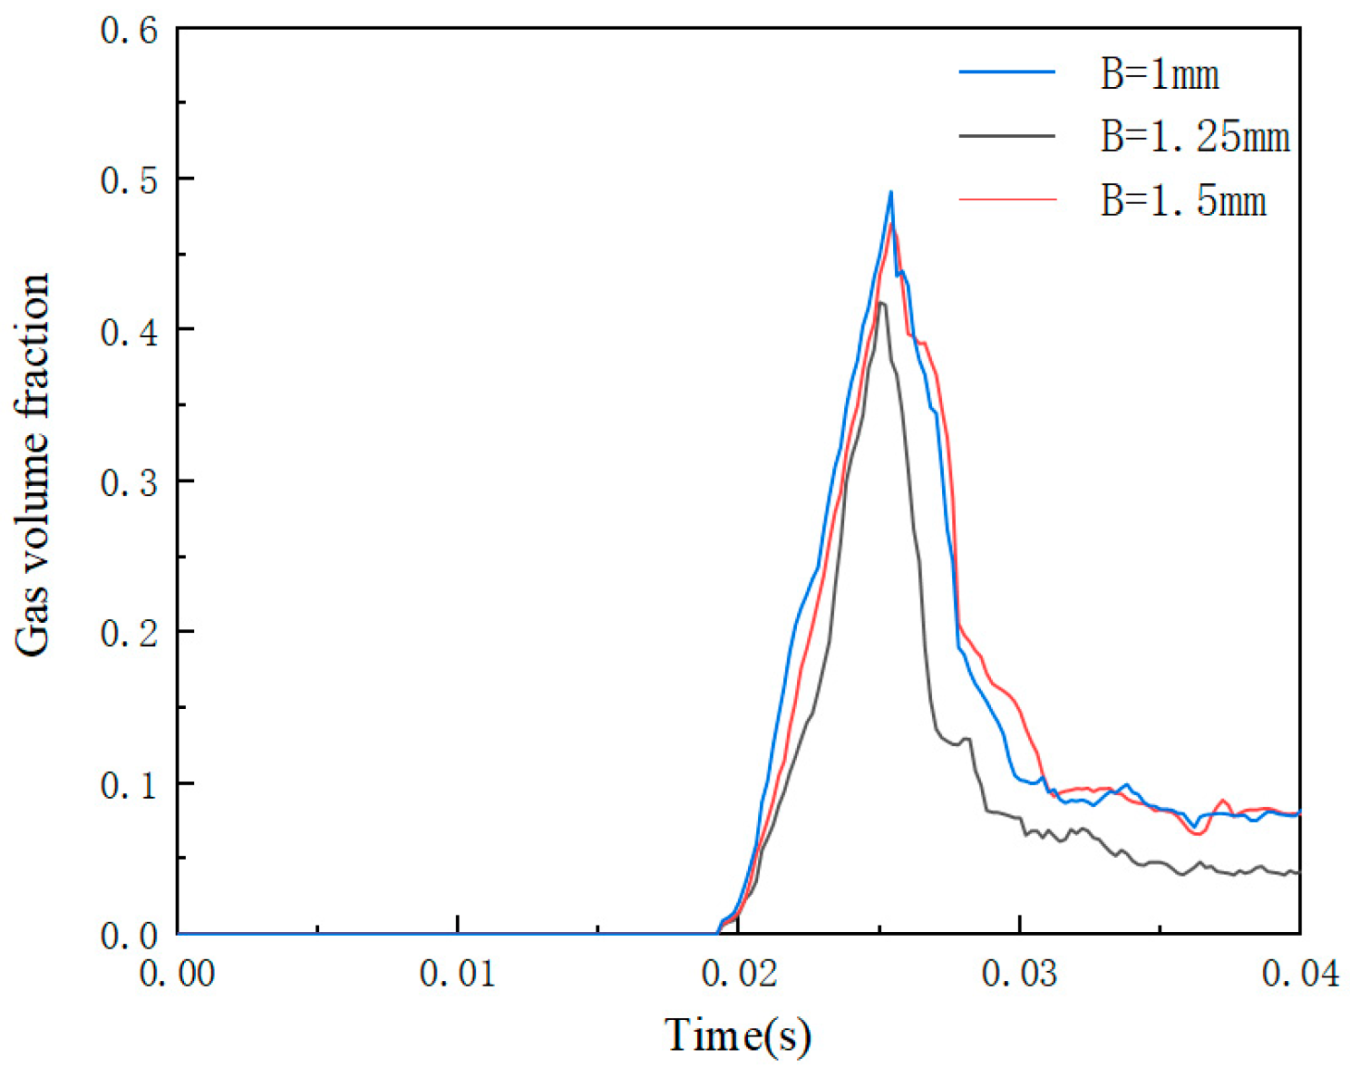
4.2.2. Effect of the T-Shaped Damping Groove Width (B) on Flow Field Characteristics

Similarly, three sets of control groups with different damping groove widths were set up to analyze their effect on the pre-pressurization process by examining the pressure curve and the volume fraction change curve in the plunger chamber.
From Figure 17 and Figure 18, it can be observed that during the pre-boost process, if the step width of the damping groove is small, the tip effect is enhanced, leading to brief “cavitation” and an increase in the negative pressure overshoot. If the step width of the damping groove is large, although the negative pressure overshoot decreases, the increased width results in a larger flow area, allowing more oil to flow into the piston chamber, which in turn leads to a higher positive pressure overshoot. During the pre-unloading process, as the throttling groove width decreases, the backflow volume of the damping groove reduces, and the pre-unloading pressure transitions from excessive to appropriate and then to insufficient. When the width is 1.5 mm, the flow area is larger, allowing more oil to flow through, which also increases the negative pressure overshoot. When the width is 1 mm, the further reduction in width leads to insufficient pre-unloading pressure, and during the later stage, when it connects to the low-pressure region keyhole groove, a significant backflow occurs, slightly increasing the negative pressure overshoot. The goal of pre-unloading is to relieve the high pressure within the piston chamber. The effectiveness of this process is mainly reflected in the magnitude of the negative pressure overshoot at the end stage. When the step width is 1.25 mm, the effect is the best.
As shown in Figure 19, the effect of damping groove width on the gas volume fraction is quite significant. As the width increases, the peak of the gas volume fraction gradually decreases, and the fluctuations become smoother. This suggests that a wider damping groove helps to better control the variation in the gas volume fraction, reducing hydraulic shocks and cavitation, thereby improving the stability and performance of the system. By calculating the gas volume fraction at different widths, the average values for widths of 1 mm, 1.25 mm, and 1.5 mm are 8.51%, 5.73%, and 8.44%, respectively.

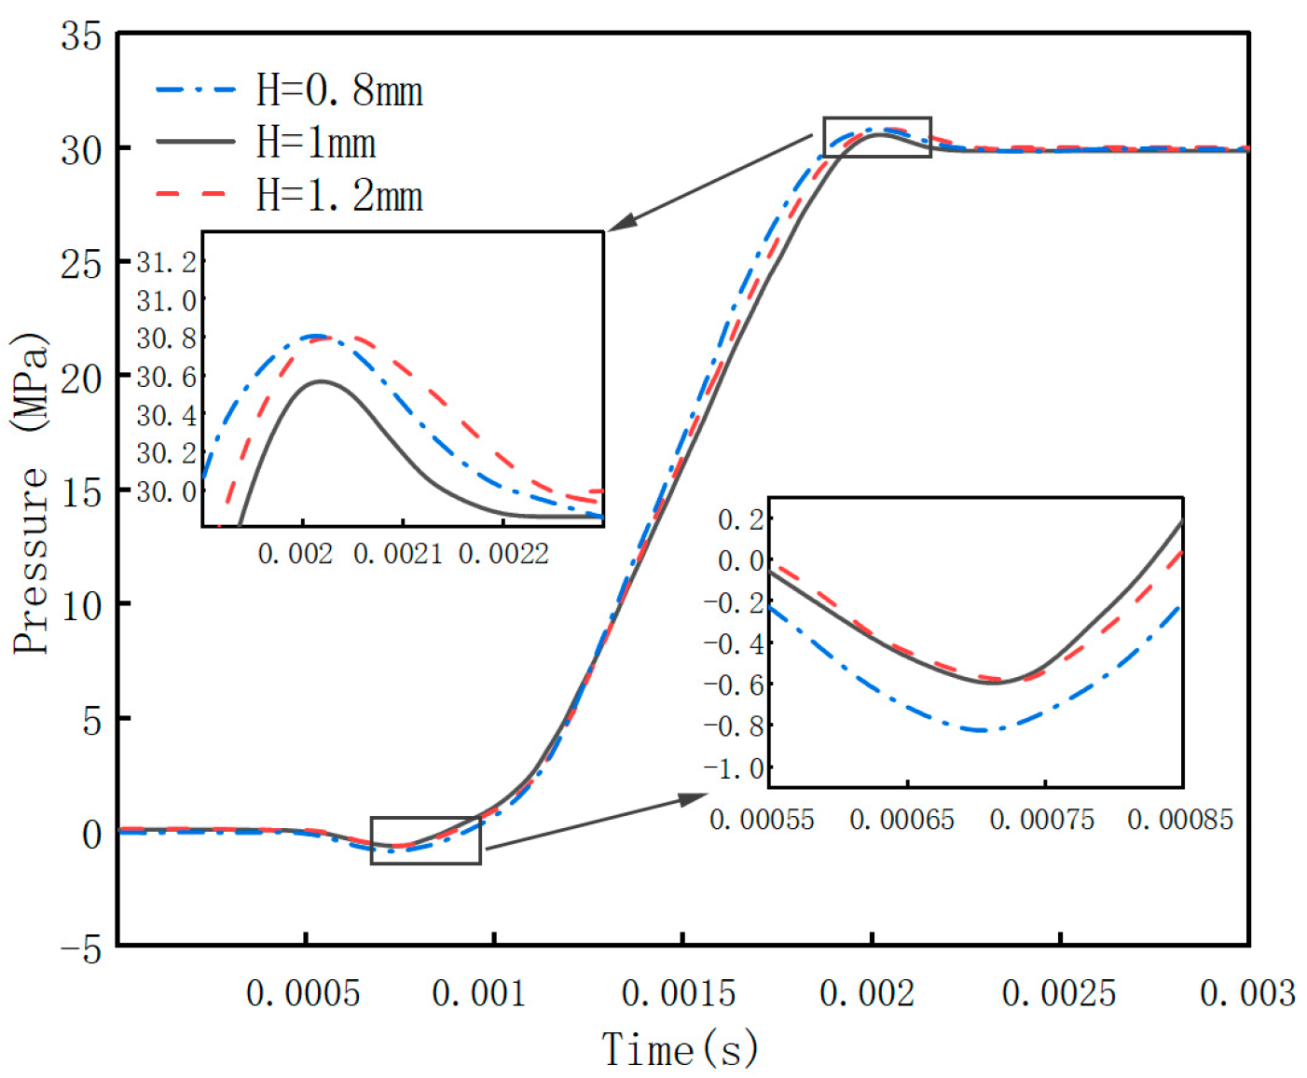
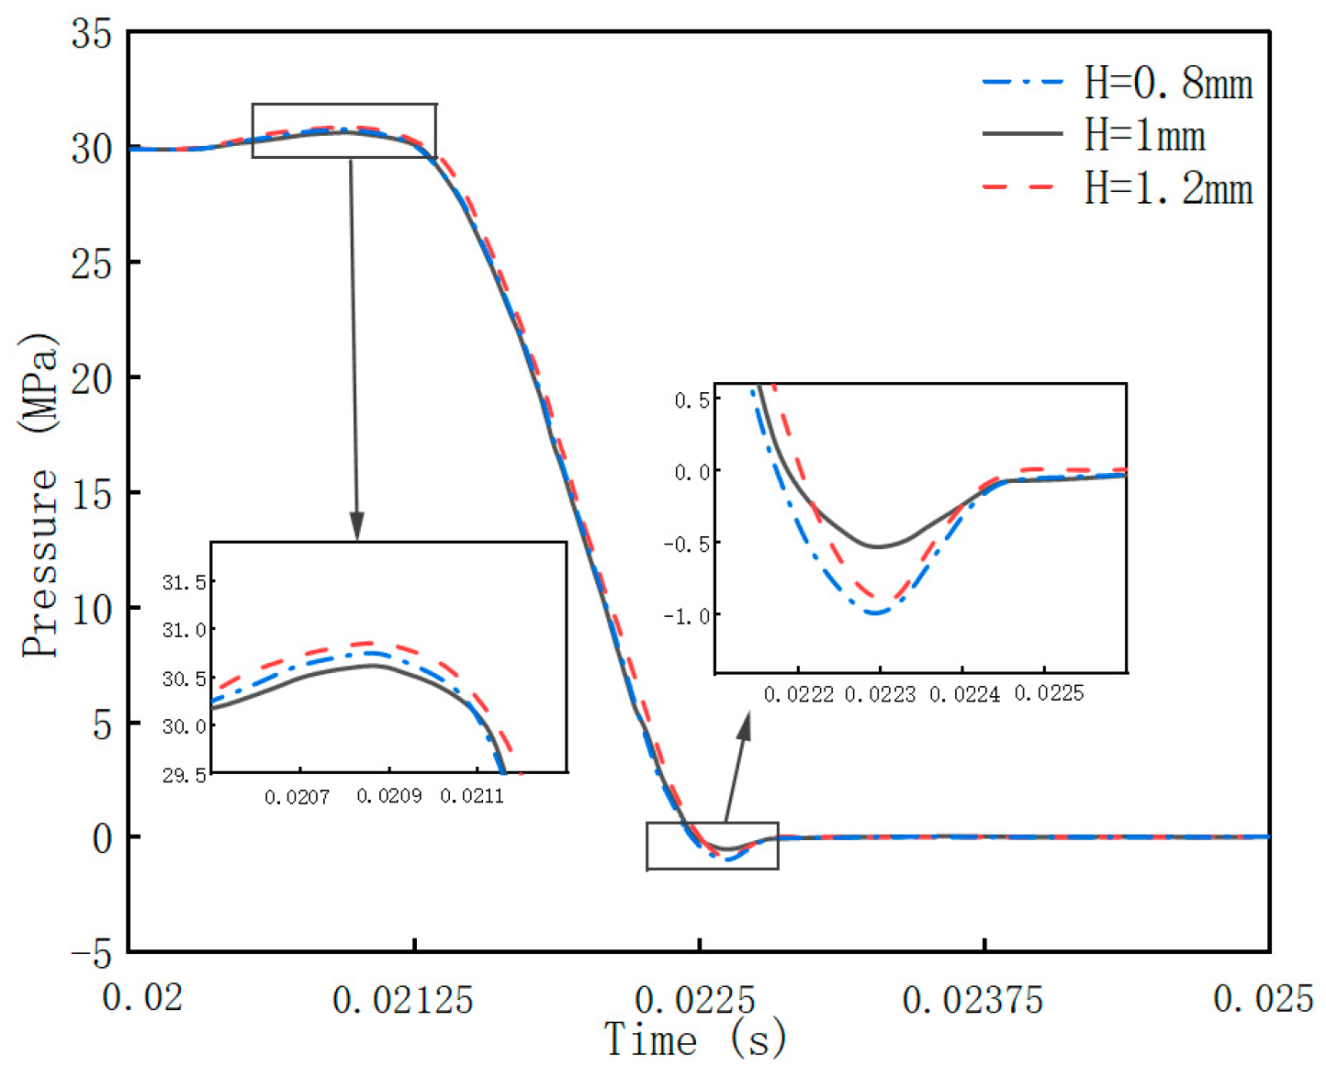
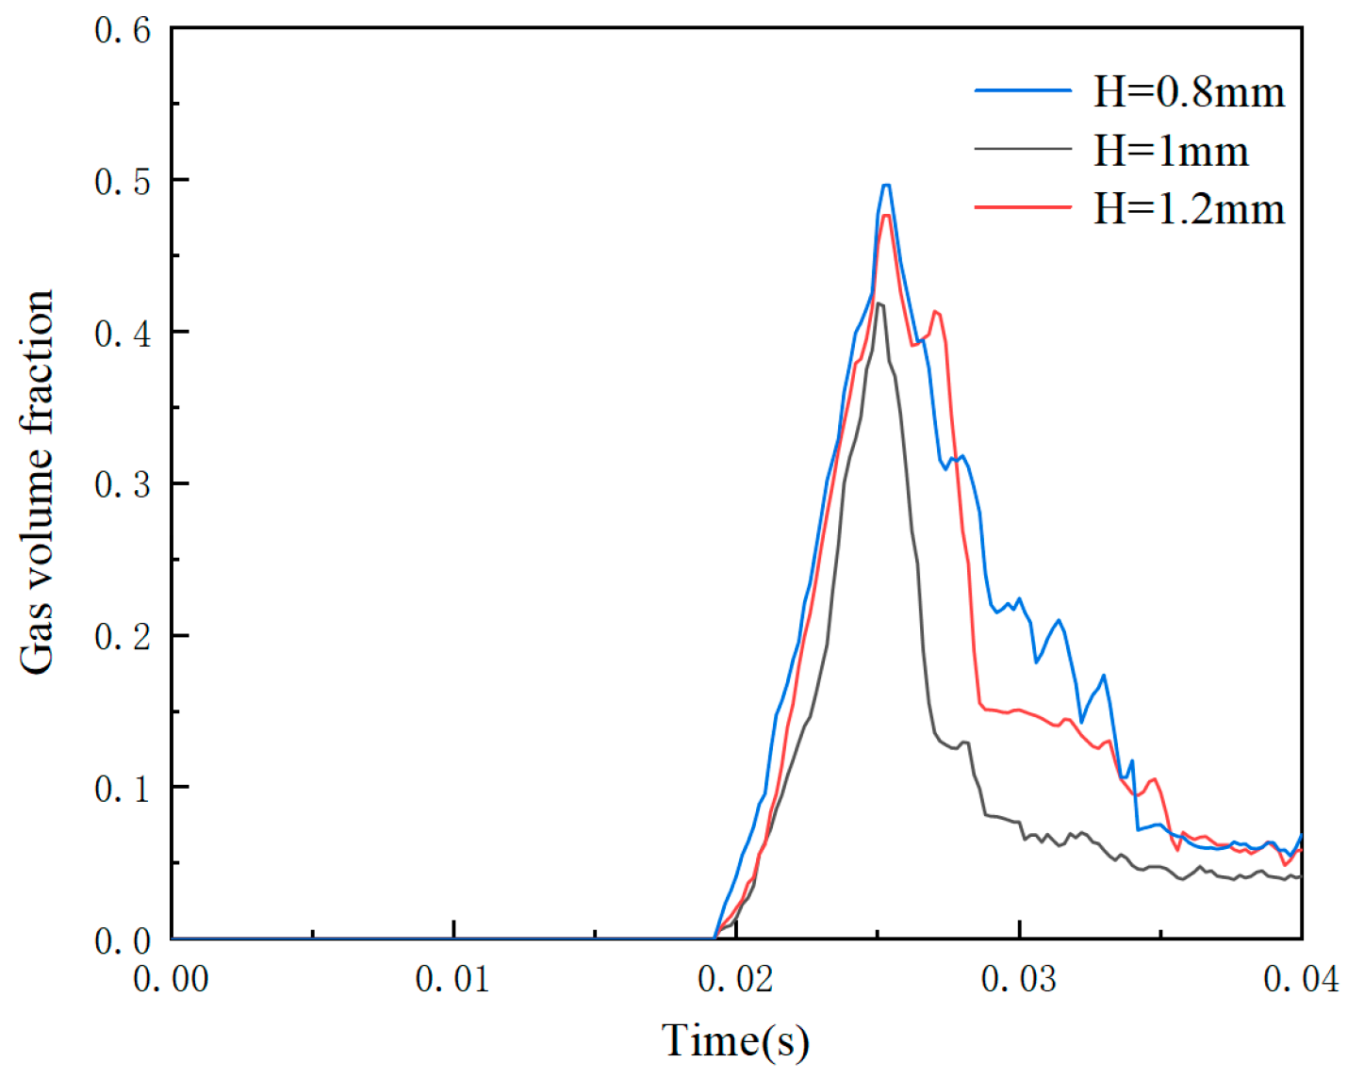
4.2.3. Effect of the T-Shaped Damping Groove Depth (H) on Flow Field Characteristics

Figure 20 and Figure 21 show the pressure pulsation variation in the piston chamber for different damping groove depths (H). During the pre-boost process, as the depth of the throttling groove decreases, the flow area significantly reduces, which leads to a decrease in the backflow volume during the initial stage. As a result, the pre-boost pressure transitions from excessive to appropriate and then increases. When the piston chamber enters the high-pressure region of the keyhole groove, the curve corresponding to a depth of H = 1.2 mm shows an excessive pre-boost pressure, while the curve corresponding to a depth of H = 1 mm indicates an appropriate pre-boost pressure. At H = 0.8 mm, due to the tip effect, the pressure overshoot at the start of the pre-boost process increases. During the pre-unloading process, if the depth is too large, the flow area increases, allowing more oil to flow through. Although the tip effect is weakened, the reduction in the damping effect is stronger, leading to a larger pressure overshoot. When the depth is too small, the pre-unloading pressure becomes insufficient, resulting in an increase in the negative pressure overshoot and a sharp rise in the backflow peak.
As shown in Figure 22, the height of the damping groove significantly affects the variation in the gas volume fraction. A higher damping groove effectively reduces the peak value of the gas volume fraction, making the variation smoother and demonstrating better control over the gas volume fraction. The height of H = 1 mm performs well in balancing the fluctuations in the gas volume fraction, making it an ideal choice. When the groove depths are 0.8 mm, 1 mm, and 1.2 mm, the average gas volume fractions are 9.87%, 5.73%, and 8.89%, respectively, which aligns with the pressure distribution analysis in Figure 20 and Figure 21.

5. Conclusions

This study aims to reduce pressure fluctuations and cavitation in axial piston pumps, with the optimization of the port plate damping groove structure as the breakthrough approach. CFD simulations of the internal flow characteristics of the axial piston pump were conducted using the Fluent platform. The pressure and gas volume fraction flow field characteristics of the axial piston pump were studied under conditions with and without a damping groove, as well as for different damping groove structural parameters. The following conclusions were drawn:
(1) A structural improvement plan for the swash plate axial piston pump port plate was proposed, and a CFD simulation model of the axial piston pump with a T-shaped damping groove was established. Through the analysis of pressure and cavitation characteristic variation curves, it was concluded that the T-shaped damping groove better reduces hydraulic shocks and suppresses cavitation phenomena.
(2) An analysis of the impact mechanism of port plate structural parameters on the piston chamber’s dynamic pressure characteristics was conducted, focusing on the effects of the T-shaped damping groove structural parameters—length L, width B, and depth H—on pressure pulsations and the gas volume fraction. Therefore, within the studied parameter range, when L = 10 mm, B = 1.25 mm, and H = 1 mm, the T-shaped damping groove structure exhibits good pre-boost/pre-unloading performance and effective cavitation reduction.

Author Contributions

Conceptualization, T.W.; methodology, T.W.; software, J.X.; validation, D.L.; formal analysis, D.L.; investigation, Z.L.; resources, Z.L.; data curation, J.X.; writing—original draft preparation, D.L.; writing—review and editing, D.L.; visualization, J.X.; supervision, R.L.; project administration, R.L.; funding acquisition, R.L. All authors have read and agreed to the published version of the manuscript.

Funding

1. Key R & D plan of Shandong Province, grant number 2022SFGC0201. 2. Key R&D plan of Shandong Province, China, grant number 2022CXGC020702.

Data Availability Statement

Data are contained within the article.

Acknowledgments

I would like to thank my tutor for all his support and guidance. I would like to thank my colleagues for their care and help in my daily work.

Conflicts of Interest

Zhengyu Li was employed by Weichai Lovol Intelligent Agriculture Technology Co., Ltd.; Jikang Xu was employed by Qingdao Agricultural University; the remaining authors declare that the research was conducted in the absence of any commercial or financial relationships that could be construed as a potential conflict of interest.

References

  1. Bergada, J.M.; Kumar, S.; Davies, D.L.; Watton, J. A complete analysis of axial piston pump leakage and output flow ripples. Appl. Math. Model. 2012, 36, 1731–1751. [Google Scholar] [CrossRef]
  2. Li, R.; Liu, J.; Ding, X.; Liu, Q. Study on the influence of flow distribution structure of piston pump on the output of pulsation pump. Processes 2022, 10, 1077. [Google Scholar] [CrossRef]
  3. Berta, G.L.; Casoli, P.; Vacca, A.; Guidetti, M. Simulation model of an axial piston pump inclusive of cavitation. In Proceedings of the ASME International Mechanical Engineering Congress and Exposition, New Orleans, LA, USA, 17–22 November 2002; Volume 36312, pp. 29–37. [Google Scholar]
  4. Manring, N.D. The control and containment forces on the swash plate of an axial piston pump utilizing a secondary swash-plate angle. In Proceedings of the 2002 American Control Conference (IEEE Cat. No. CH37301), Anchorage, AK, USA, 8–10 May 2002; IEEE: Piscataway, NJ, USA, 2002; Volume 6, pp. 4837–4842. [Google Scholar]
  5. Liu, X.; Yu, L.; Liu, H.; Ke, J. Cavitation erosion mechanism of port plate of hydraulic axial planger pump. Chin. J. Mech. Eng. 2008, 44, 203–208. [Google Scholar] [CrossRef]
  6. Kumar, S.; Bergada, J.M. The effect of piston grooves performance in an axial piston pumps via CFD analysis. Int. J. Mech. Sci. 2013, 66, 168–179. [Google Scholar] [CrossRef]
  7. Shi, X.; Zhao, D. Structure Optimization of the valve plate of aviation piston pump. Mach. Tool Hydra Lics 2015, 43, 57–60. [Google Scholar]
  8. Wang, J.; Liu, Y. Design of distribution tray for improving volumetric efficiency of axial piston pump. Chin. Hydraul. Pneum. Seal. 2022, 42, 79–83. [Google Scholar]
  9. Shan, L.; Wang, J.; Ji, H.; Guo, H.; Zhao, T. Influence of relief groove of spherical valve plate on axial Ppston pump flow ripple. Chin. Hydraul. Pneum. 2015, 2, 31–36. [Google Scholar]
  10. Wang, C. Research on the Effect of Unloading Groove on the Output Pressure and Cavitation Characteristics of Axial Piston Pumps. Master’s Thesis, Central South University, Shanxi, China, 2023. [Google Scholar]
  11. Kunkis, M.; Weber, J. Experimental and numerical assessment of an axial piston pump’s speed limit. In Proceedings of the BATH/ASME 2016 Symposium on Fluid Power and Motion Control, Bath, UK, 7–9 September 2016; American Society of Mechanical Engineers: New York, NY, USA, 2016; p. 50060. [Google Scholar]
  12. Stosiak, M.; Yatskiv, I.; Prentkovskis, O.; Karpenko, M. Reduction of Pressure Pulsations over a Wide Frequency Range in Hydrostatic Systems. Machines 2025, 13, 25. [Google Scholar] [CrossRef]
  13. Karpenko, M. Aircraft hydraulic drive energy losses and operation delay associated with the pipeline and fitting connections. Aviation 2024, 28, 1–8. [Google Scholar] [CrossRef]
  14. Wang, D.; Chen, C.; Dong, H. Investigation of the Pressure Fluctuation of Piston Chambers with Variable Slot Geometry. Machines 2023, 11, 225. [Google Scholar] [CrossRef]
  15. Guan, C.; Jiao, Z.; He, S. Theoretical study of flow ripple for an aviation axial-piston pump with damping holes in the valve plate. Chin. J. Aeronaut. 2014, 27, 169–181. [Google Scholar] [CrossRef]
  16. Wu, T.; Zhang, J.; Li, R.; Yuan, W.; Sun, Q.; Chen, S.; Li, D.; Sun, Y. Analysis and optimization of flow field characteristics of axial piston motor based on CFD. Flow Meas. Instrum. 2024, 99, 102669. [Google Scholar] [CrossRef]
  17. Tan, D.; Li, Y.; Wilkes, I.; Vagnoni, E.; Miorini, R.L.; Katz, J. Experimental Investigation of the Role of Large Scale Cavitating Vortical Structures in Performance Breakdown of an Axial Waterjet Pump. J. Fluids Eng. 2015, 137, 317–320. [Google Scholar] [CrossRef]
  18. Song, X.; Wang, L.; Park, Y.C. Analysis and optimization of butterfly valve disc. J. Process Mech. Eng. 2009, 223, 81–89. [Google Scholar] [CrossRef]
  19. Hong, H.; Zhao, C.; Zhang, B.; Bai, D.; Yang, H. Flow Ripple Reduction of Axial-Piston Pump by Structure Optimizing of Outlet Triangular Damping Groove. Processes 2020, 8, 1664. [Google Scholar] [CrossRef]
  20. Pei, Y.; Liu, Q.; Wang, C.; Wang, G. Energy efficiency prediction model and energy characteristics of subsea disc pump based on velocity slip and similarity theory. Energy 2021, 229, 120690. [Google Scholar] [CrossRef]
  21. Wang, Z.; Li, J.; Fan, K.; Ma, W.; Lei, H. Prediction method for low speed characteristics of compressor based on modified similarity theory with genetic algorithm. IEEE Access 2018, 6, 36834–36839. [Google Scholar] [CrossRef]
Figure 1. Axial piston pump and port plate: (a) cross sectional area view of the axial piston pump and (b) port plate structural diagram.
Processes 13 01274 g001
Figure 2. Structure diagram of the T-shaped damping groove.
Processes 13 01274 g002
Figure 3. Axial piston pump CFD grid generation.
Processes 13 01274 g003
Figure 4. Pressure distribution contour map of the piston chamber with the undamped groove: (a) 0.01 s; (b) 0.02 s; (c) 0.03 s; (d) 0.04 s.
Processes 13 01274 g004
Figure 5. Pressure distribution contour map of the piston chamber with the T-shaped damping groove: (a) 0.01 s; (b) 0.02 s; (c) 0.03 s; (d) 0.04 s.
Processes 13 01274 g005
Figure 6. Pressure distribution contour map of the oil discharge chamber with the T-shaped damping groove: (a) 0.01 s; (b) 0.02 s; (c) 0.03 s; (d) 0.04 s.
Processes 13 01274 g006
Figure 7. Piston chamber pressure curve with the T-shaped damping groove.
Processes 13 01274 g007
Figure 8. Pre-boost pressure stage.
Processes 13 01274 g008
Figure 9. Pre-unloading pressure stage.
Processes 13 01274 g009
Figure 10. Gas volume fraction distribution map of the piston pump with the undamped groove: (a) 0.01 s; (b) 0.02 s; (c) 0.03 s; (d) 0.04 s.
Processes 13 01274 g010
Figure 11. Gas volume fraction distribution map of the piston pump with the T-shaped damping groove: (a) 0.01 s; (b) 0.02 s; (c) 0.03 s; (d) 0.04 s.
Processes 13 01274 g011
Figure 12. Gas volume fraction distribution map of the oil discharge with the T-shaped damping groove: (a) 0.01 s; (b) 0.02 s; (c) 0.03 s; (d) 0.04 s.
Processes 13 01274 g012
Figure 13. Volume fraction change curve with and without the damping groove.
Processes 13 01274 g013
Figure 14. Variation in pre-boost pressure in the piston chamber for different lengths.
Processes 13 01274 g014
Figure 15. Variation in pre-unloading pressure in the piston chamber for different lengths.
Processes 13 01274 g015
Figure 16. Volume fraction variation curve for different lengths.
Processes 13 01274 g016
Figure 17. Variation in pre-boost pressure in the piston chamber for different widths.
Processes 13 01274 g017
Figure 18. Variation in pre-unloading pressure in the piston chamber for different widths.
Processes 13 01274 g018
Figure 19. Variation curve of the gas volume fraction for different widths.
Processes 13 01274 g019
Figure 20. Variation in pre-boost pressure in the piston chamber for different depths.
Processes 13 01274 g020
Figure 21. Variation in pre-unloading pressure in the piston chamber for different depths.
Processes 13 01274 g021
Figure 22. Variation curve of the gas volume fraction for different depths.
Processes 13 01274 g022
Table 1. Axial piston pump fluid domain model grid combination.
NumbersMinimum Size/mmTotal Number of Mesh CellsOutlet Pressure/MPa
10.0081,259,53224.9
20.0071,455,03427.6
30.0061,766,81429.8
40.0052,045,77829.9
Table 2. Structural parameters and boundary conditions.
CategoryParameters Before OptimizationParameters After Optimization
Number of Pistons9
Rotation speed1500r/min
Swash Plate Angl15deg
Inlet Pressure0.1MPa
Outlet Pressure30MPa
Initial Fluid Density870Kg/m3
Initial Fluid Viscosity0.0457N·s/m2
Saturated Vapor Pressure4000Pa
Vapor Density of Hydraulic Oil0.483Kg/m3
Vapor Viscosity of Hydraulic Oil8.25 × 10−5N·s/m2
Initial Fluid Temperature298K
Table 3. Damping groove structural parameters.
ParametersValue RangeUnit
L9–11mm
b1–1.5mm
H0.8–1.2mm
Disclaimer/Publisher’s Note: The statements, opinions and data contained in all publications are solely those of the individual author(s) and contributor(s) and not of MDPI and/or the editor(s). MDPI and/or the editor(s) disclaim responsibility for any injury to people or property resulting from any ideas, methods, instructions or products referred to in the content.

