3E (Energy–Exergy–Environmental) Performance Analysis and Optimization of Seawater Shower Cooling Tower for Central Air Conditioning Systems


Abstract
1. Introduction
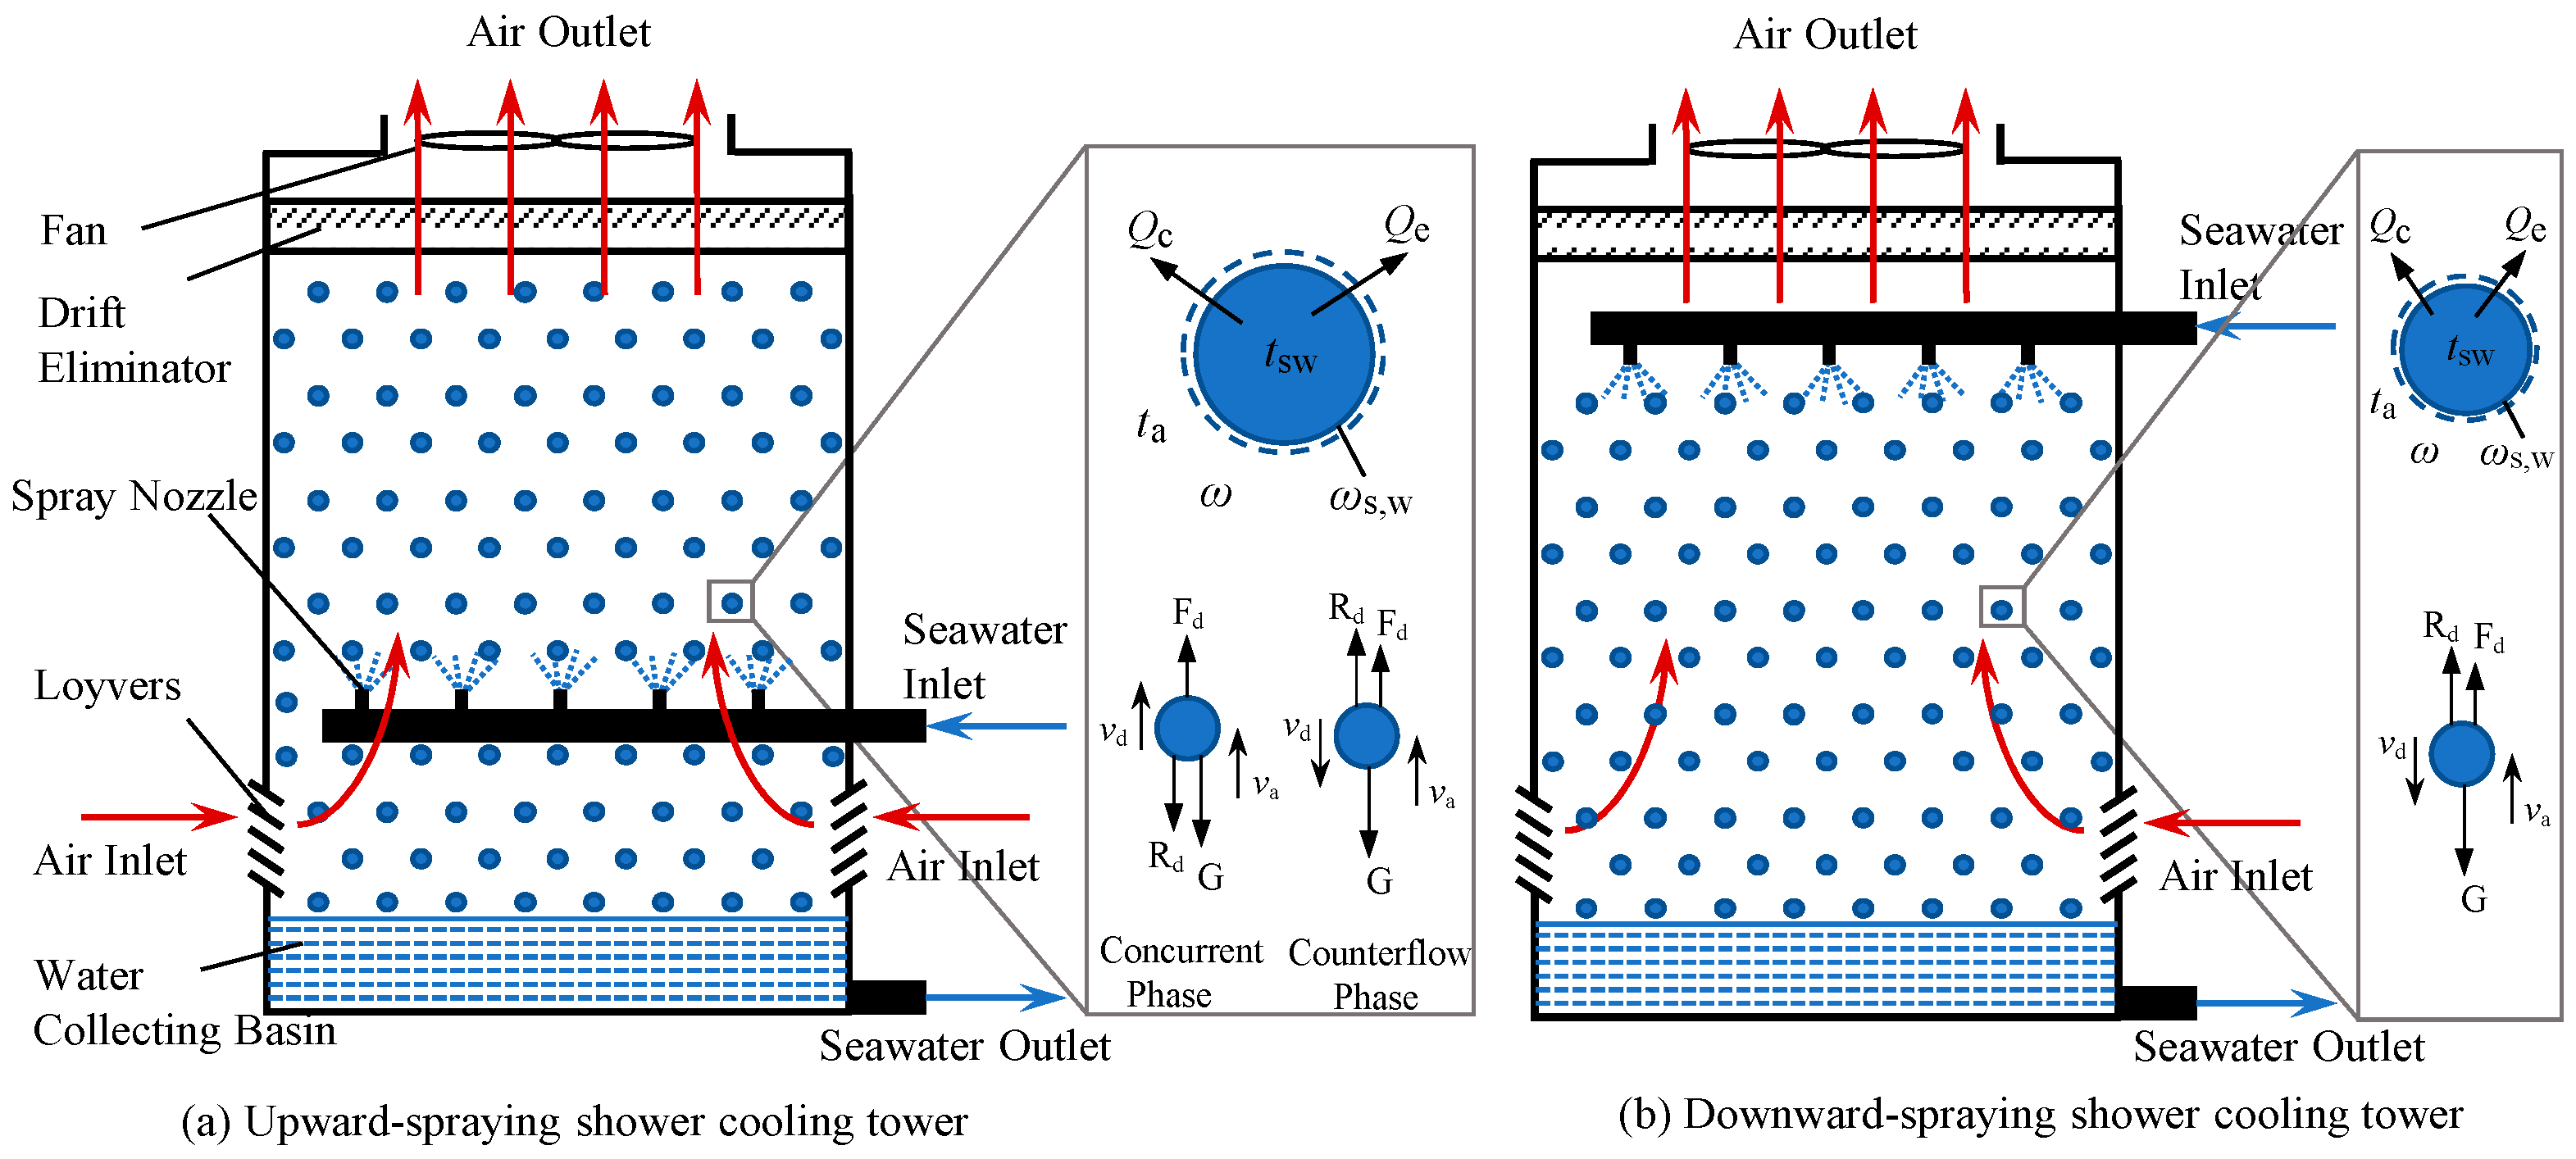
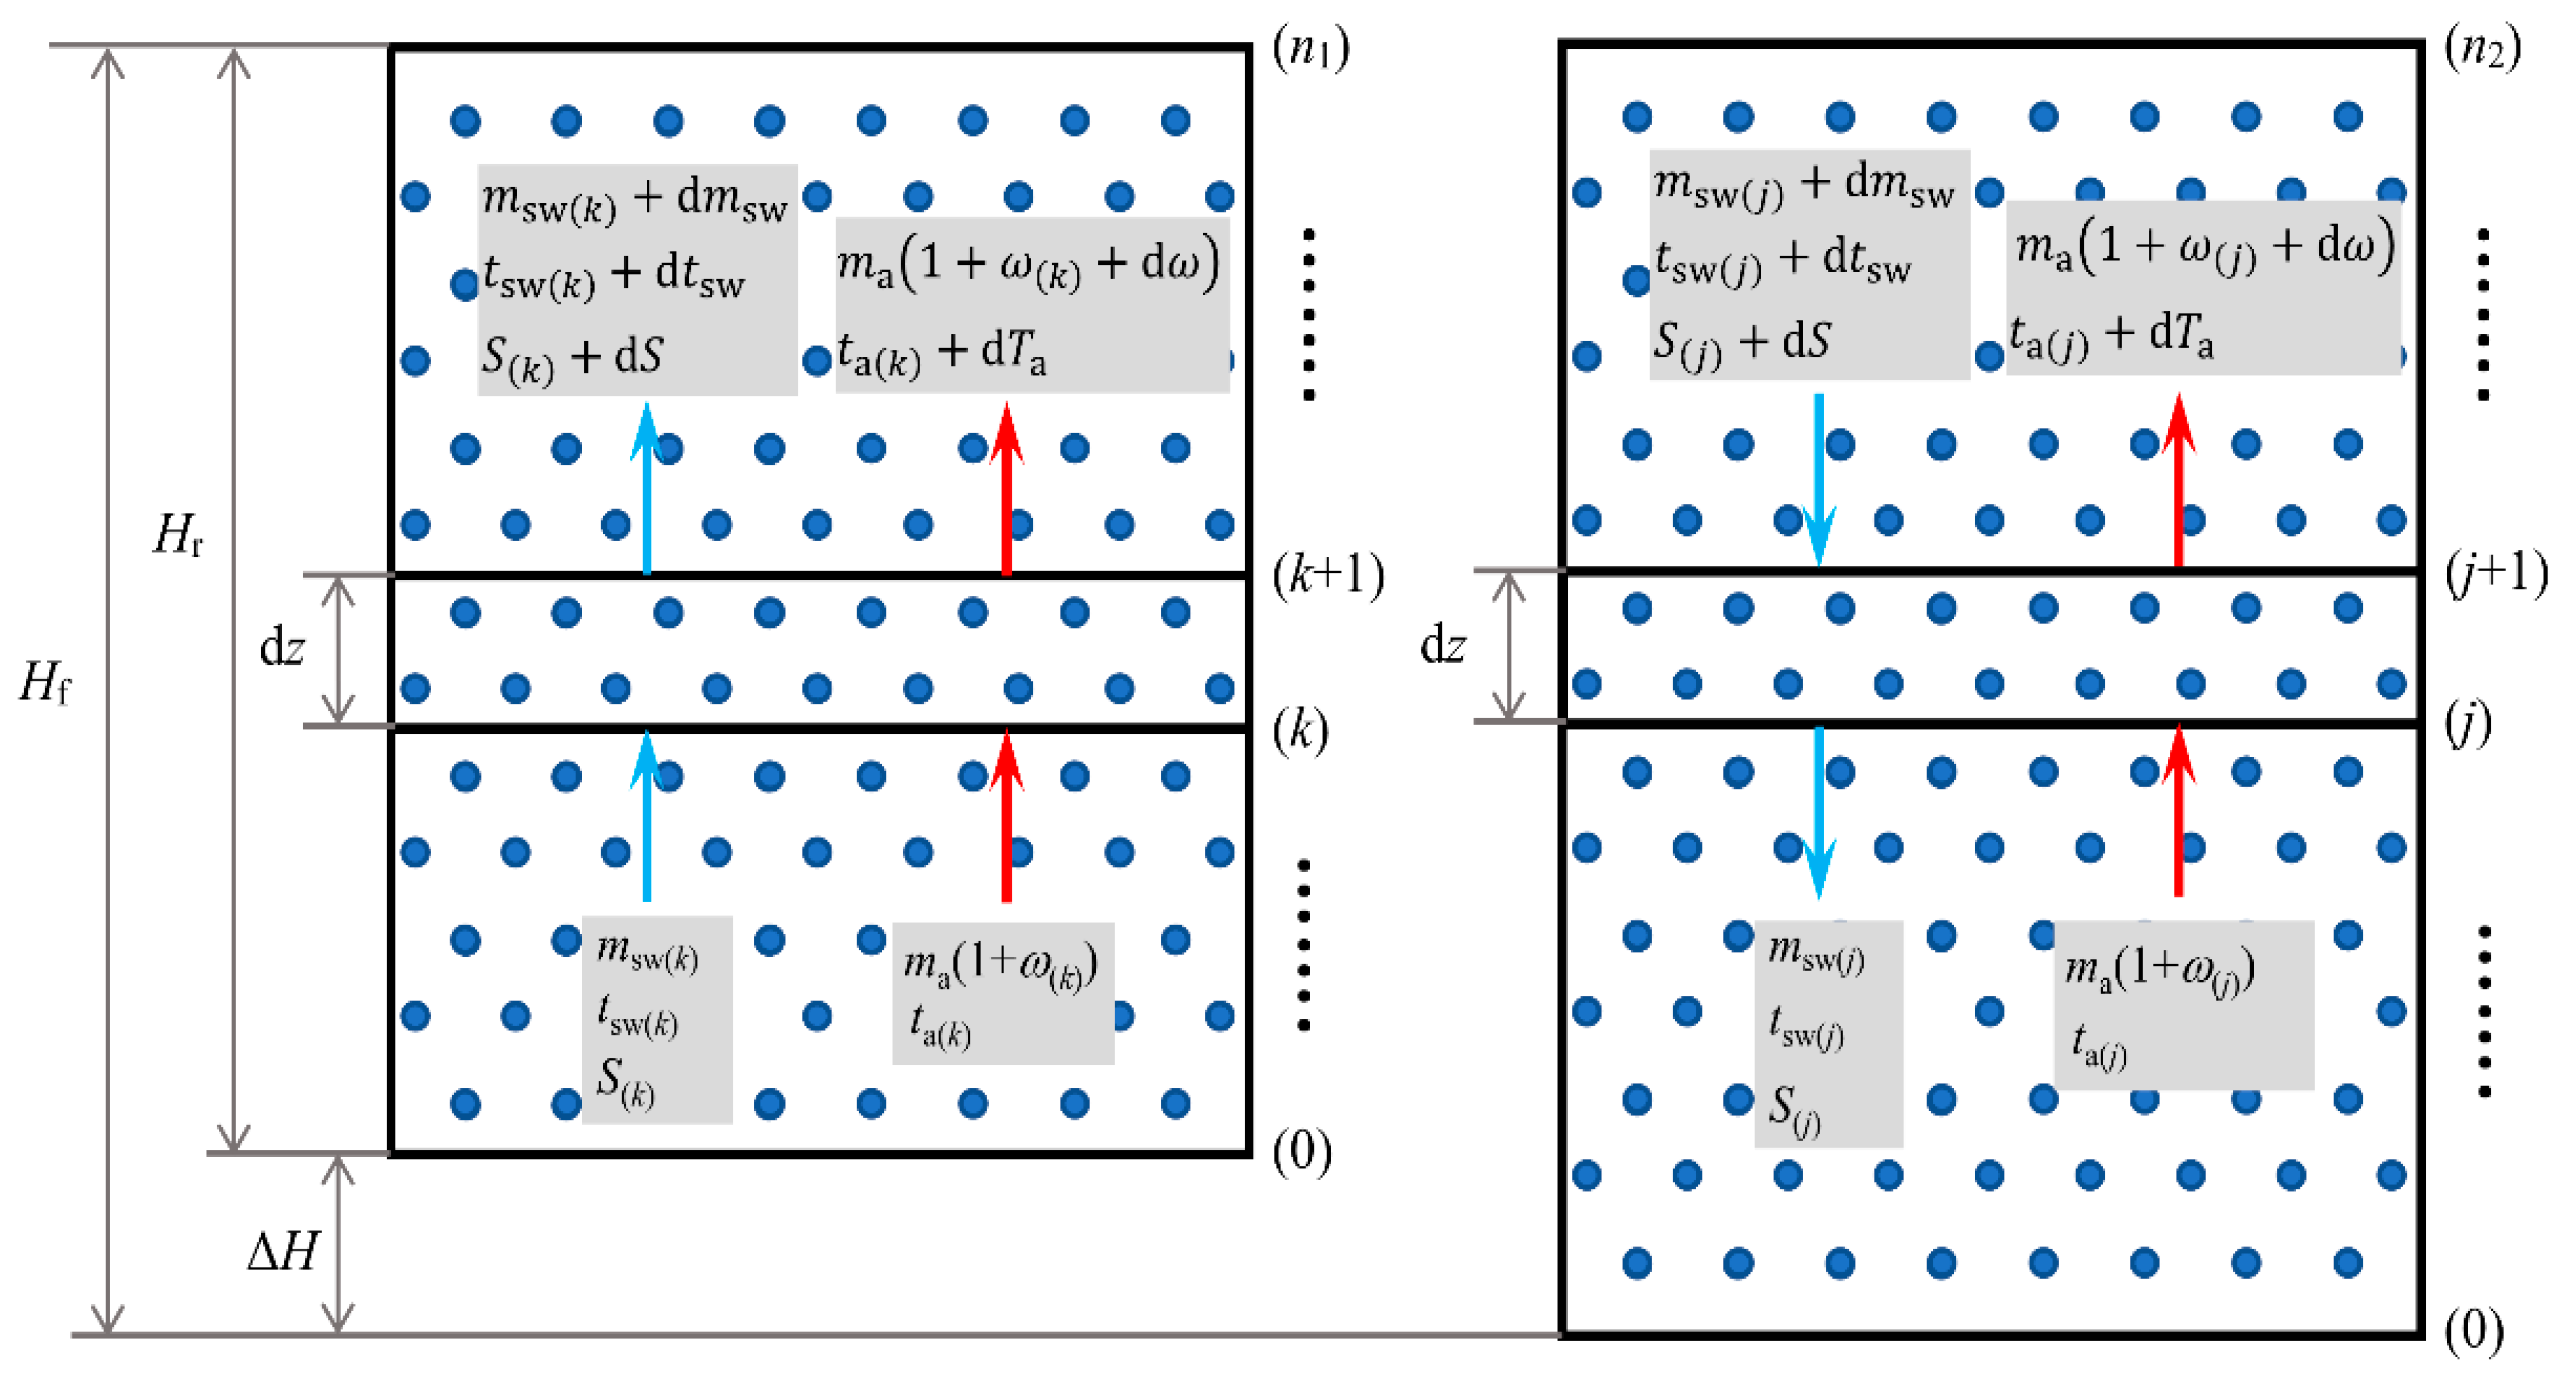
2. Physical Model
3. Mathematical Model
3.1. Governing Equations
3.2. Exergy Calculation
4. Cooling Tower Performance Evaluation Index
4.1. Cooling Efficiency
4.2. Thermal Efficiency
4.3. Exergy Efficiency
4.4. Heat Dissipation
5. Solution and Verification of the Mathematical Model
5.1. Solution Methodology
5.2. Stability and Accuracy Analysis for the Model
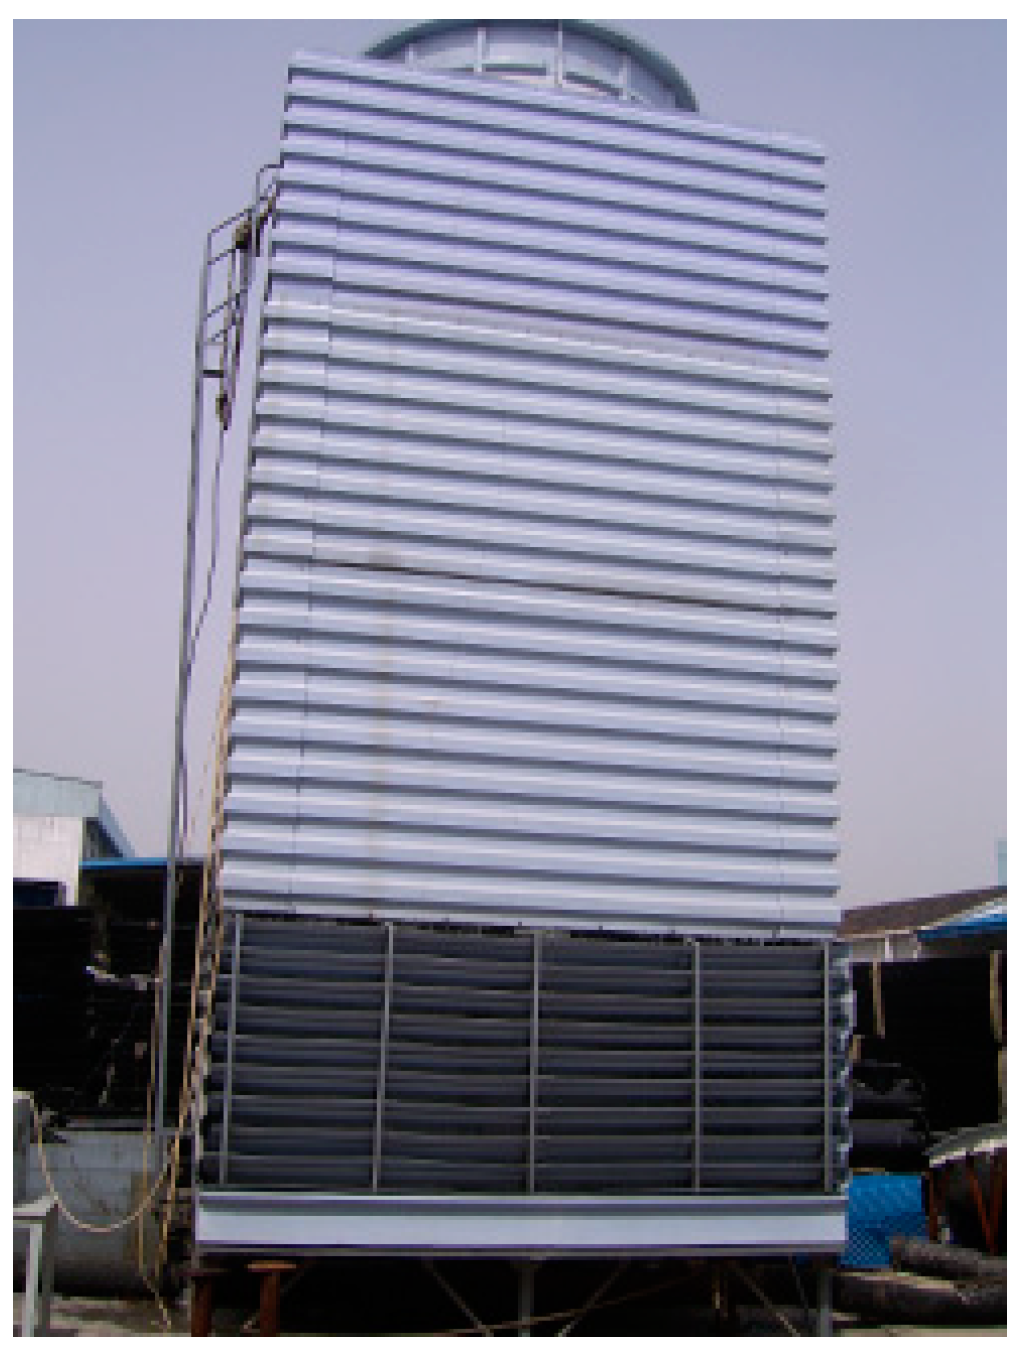
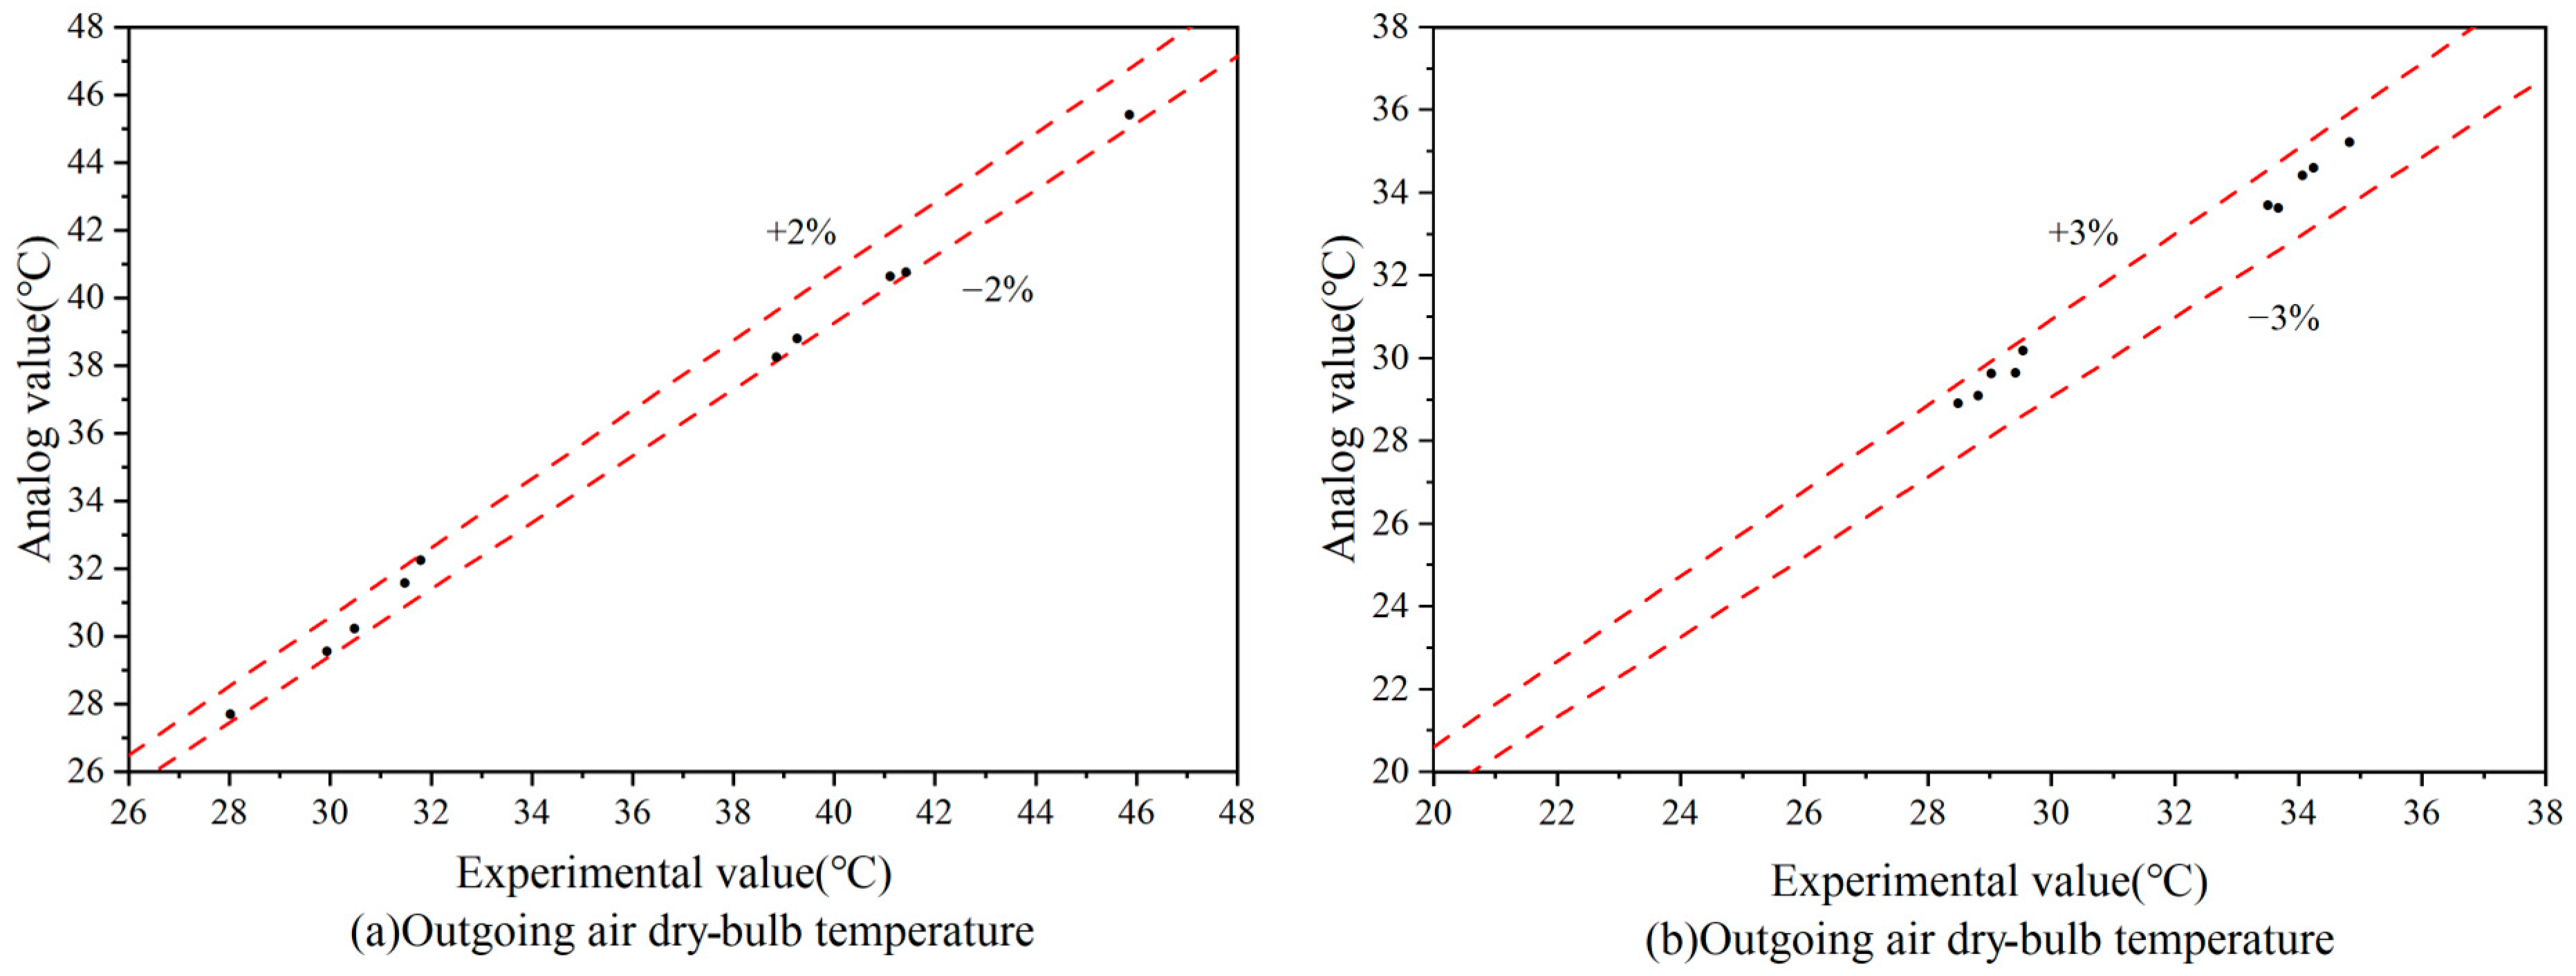
5.3. Mathematical Model Validation
5.4. Numerical Simulation Calculation Conditions
6. Analysis and Discussion
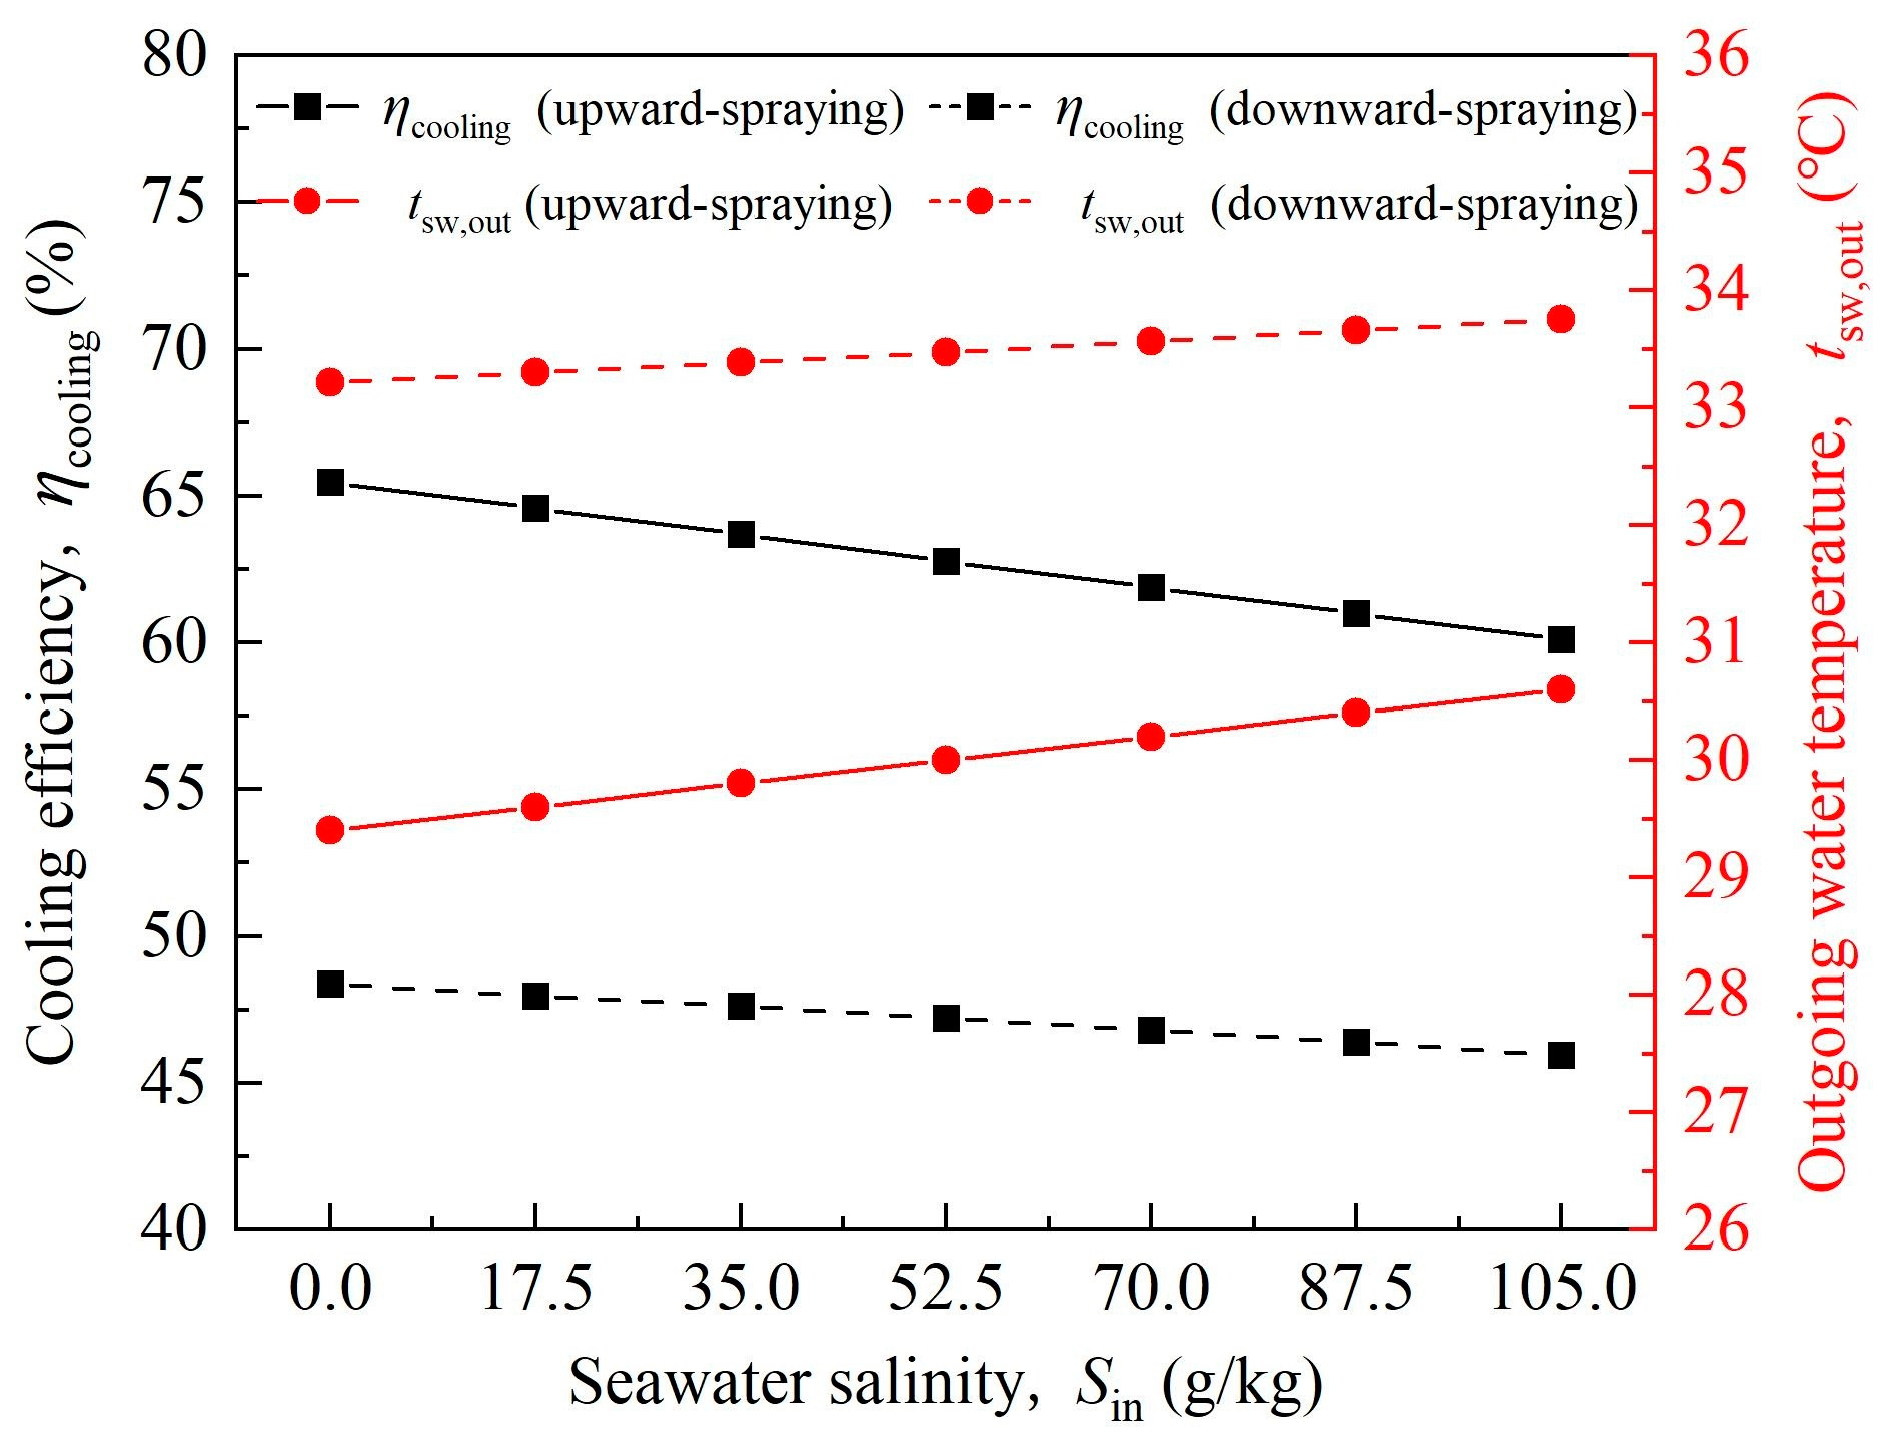
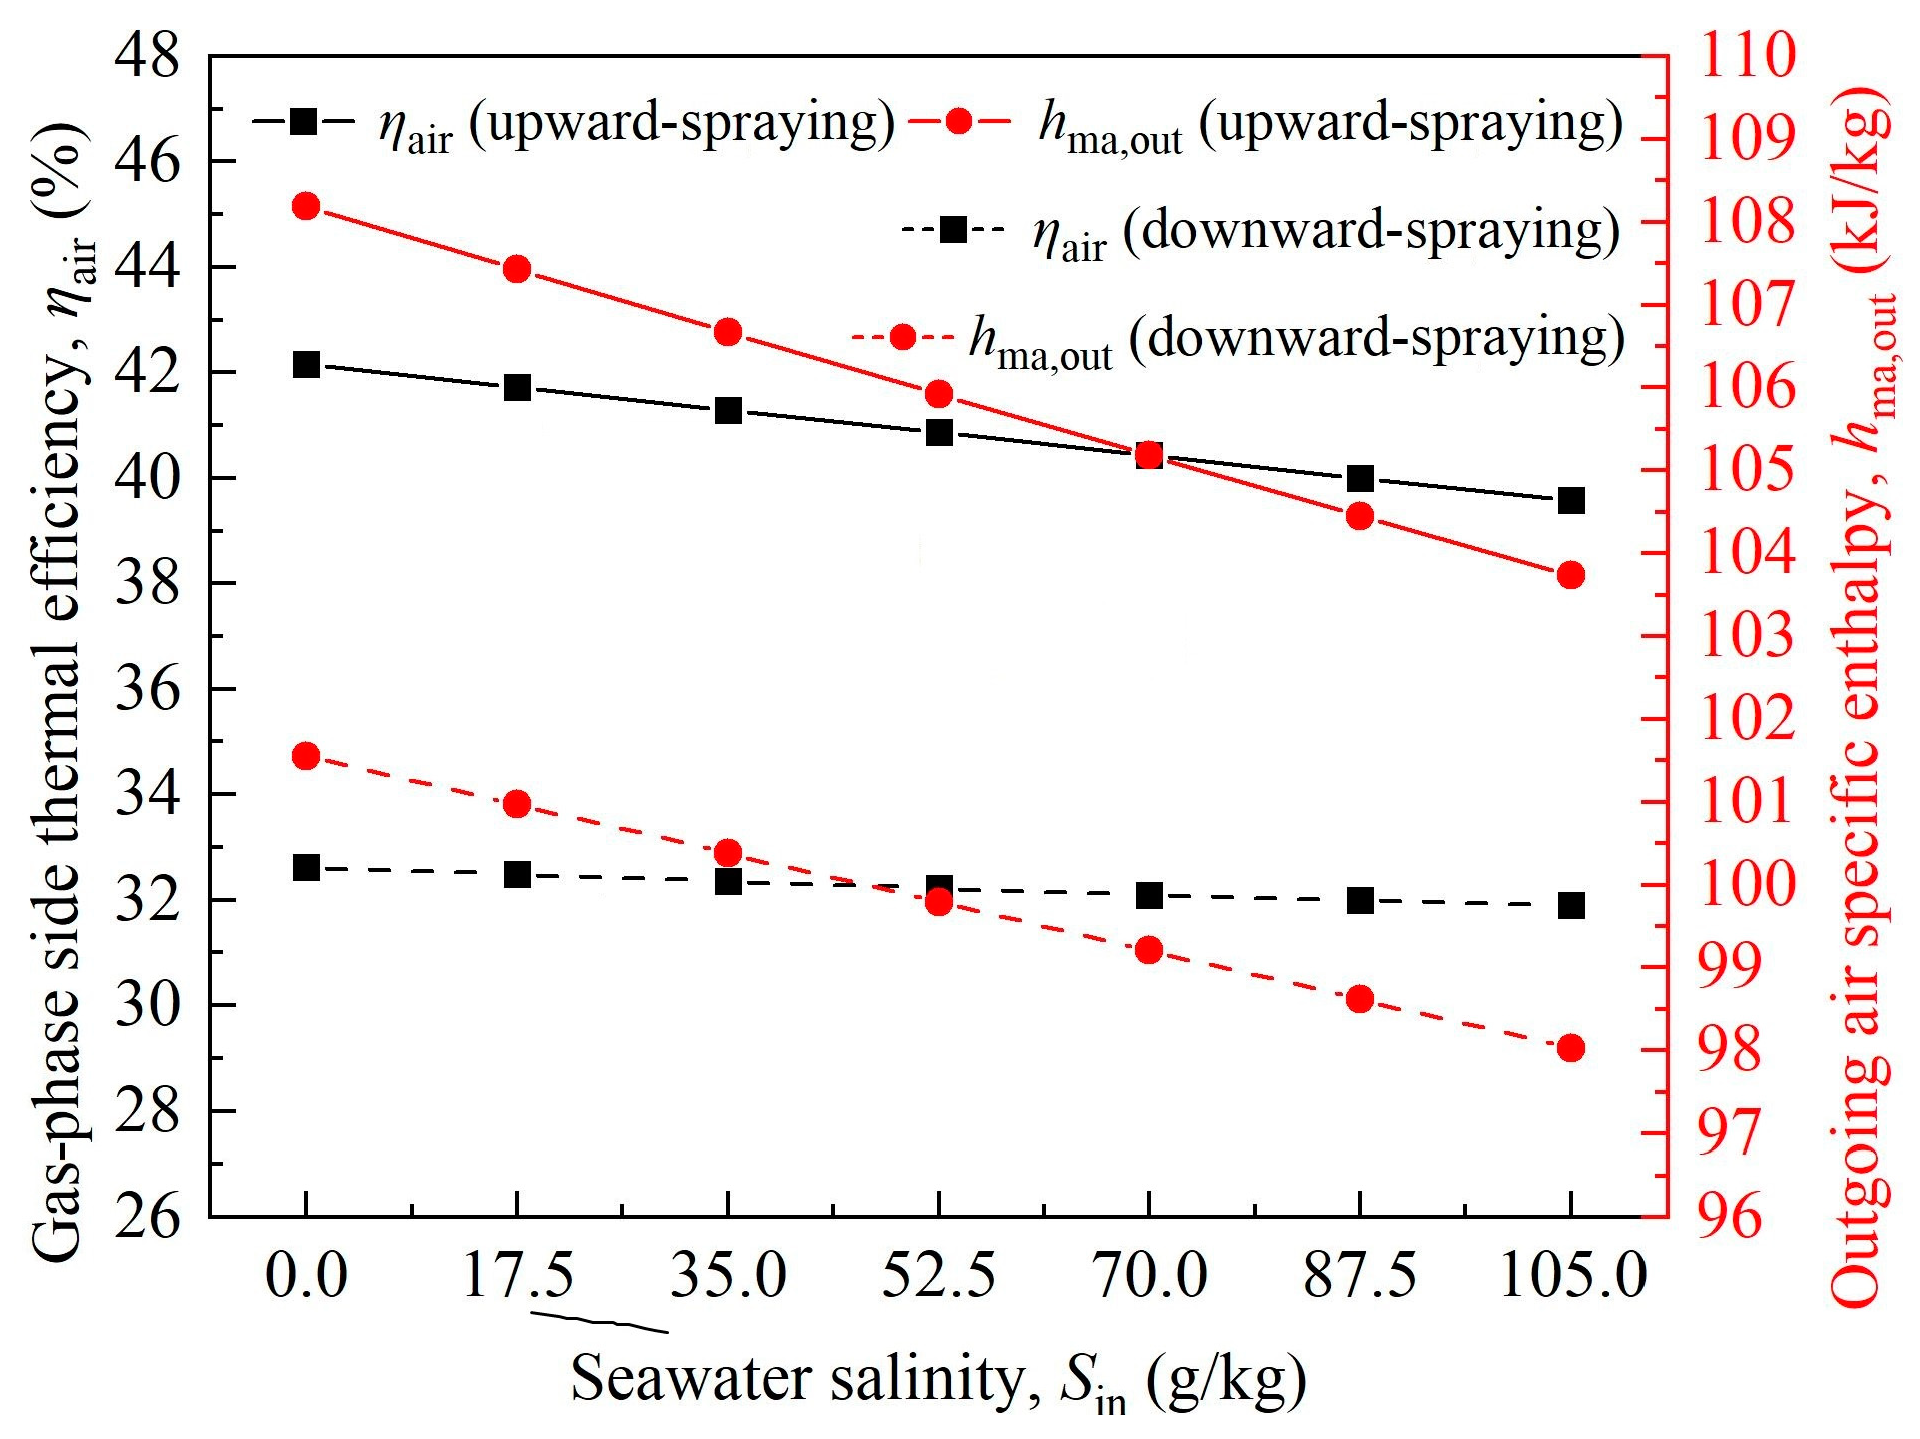
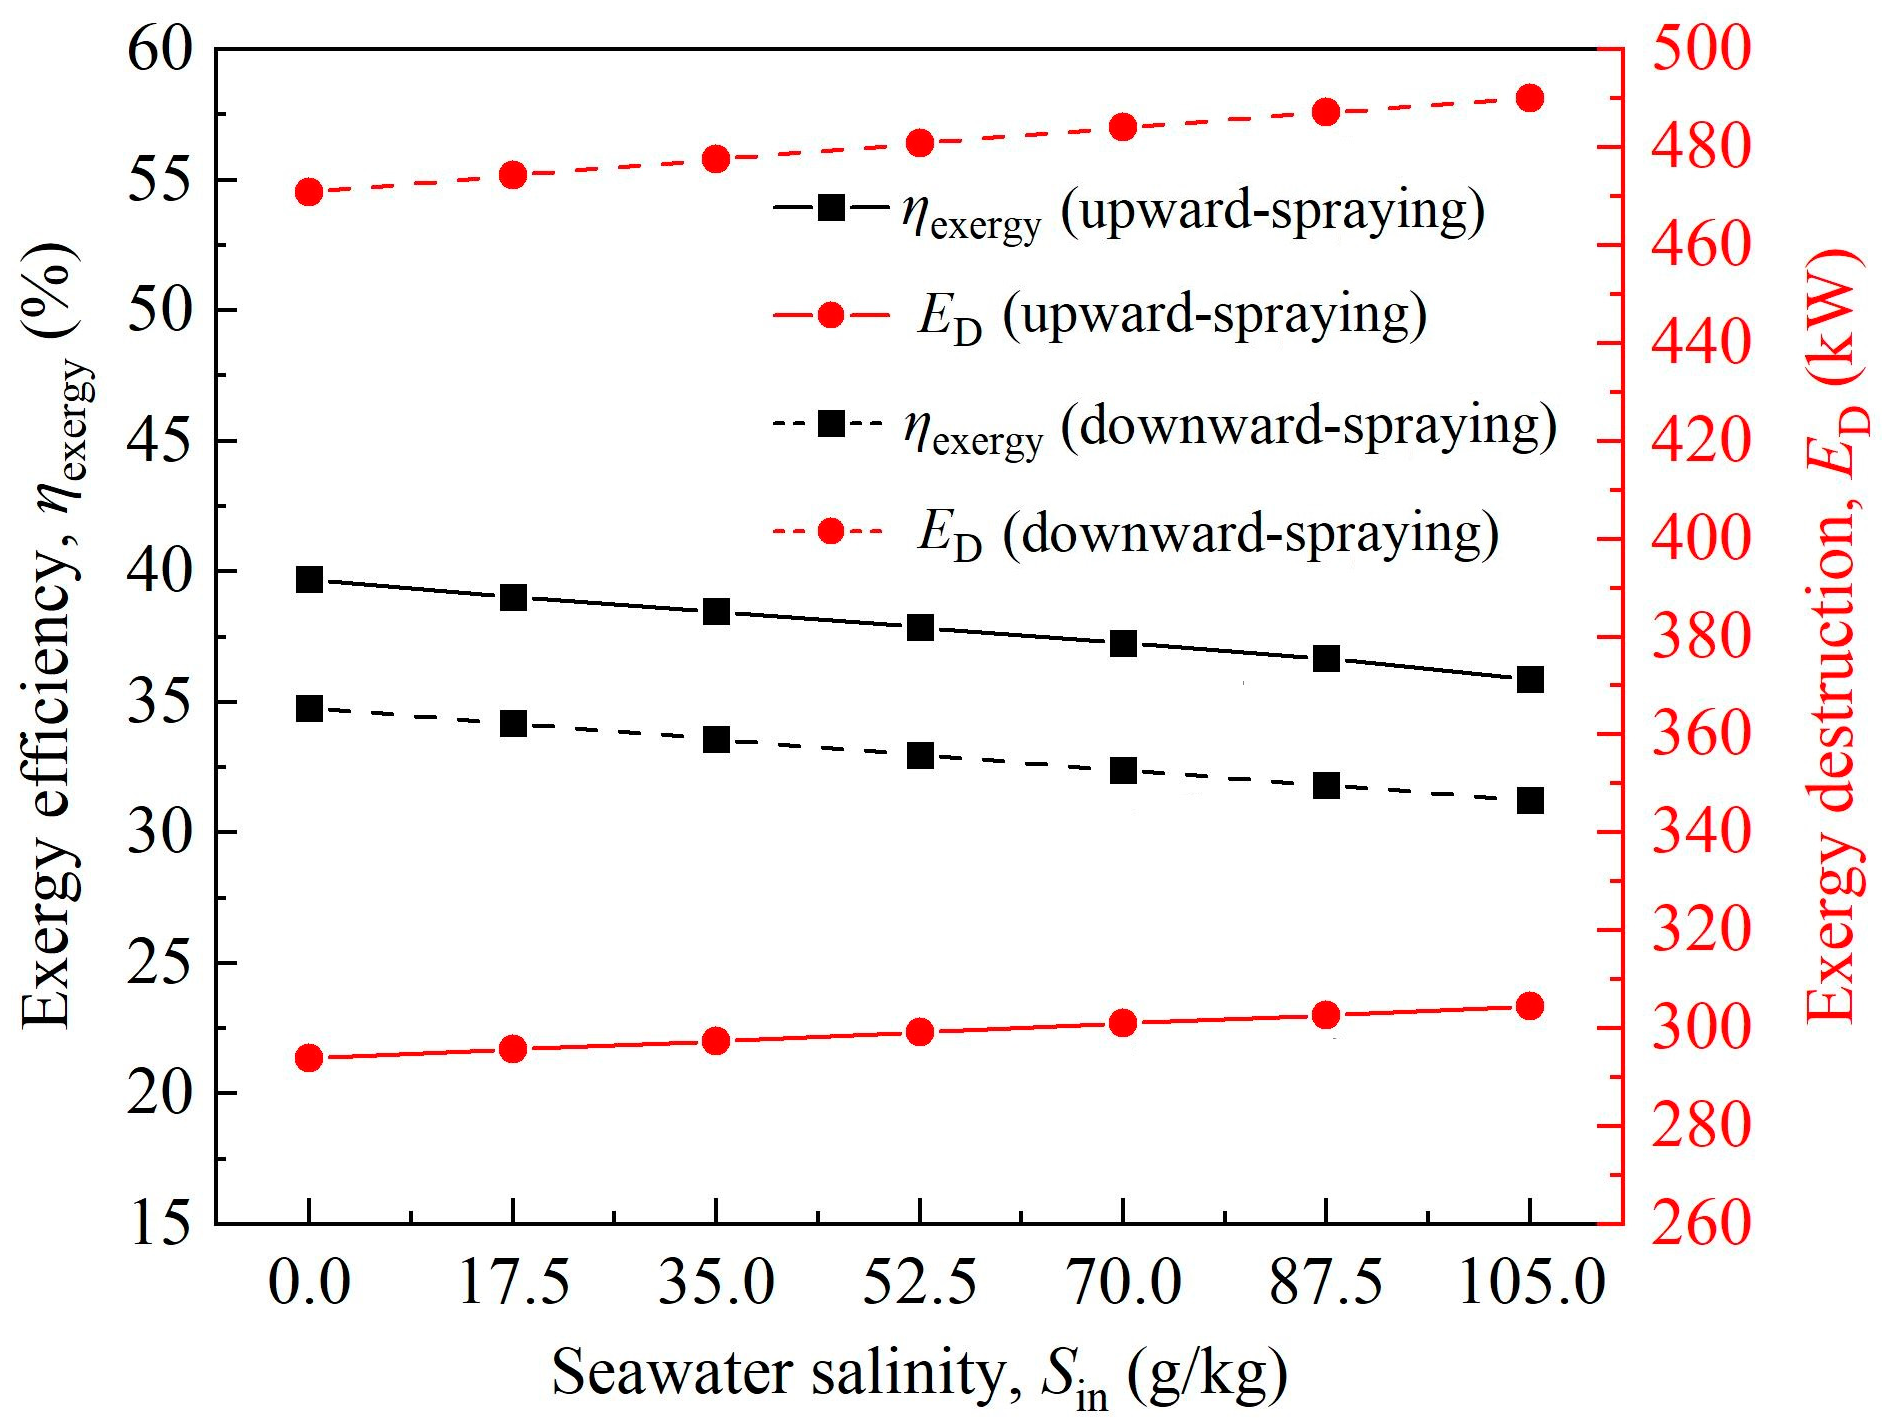
6.1. Comparison of Heat and Moisture Exchange Characteristics Between Upward-Spraying Tower and Downward-Spraying Shower Cooling Tower Under Different Salinity Conditions
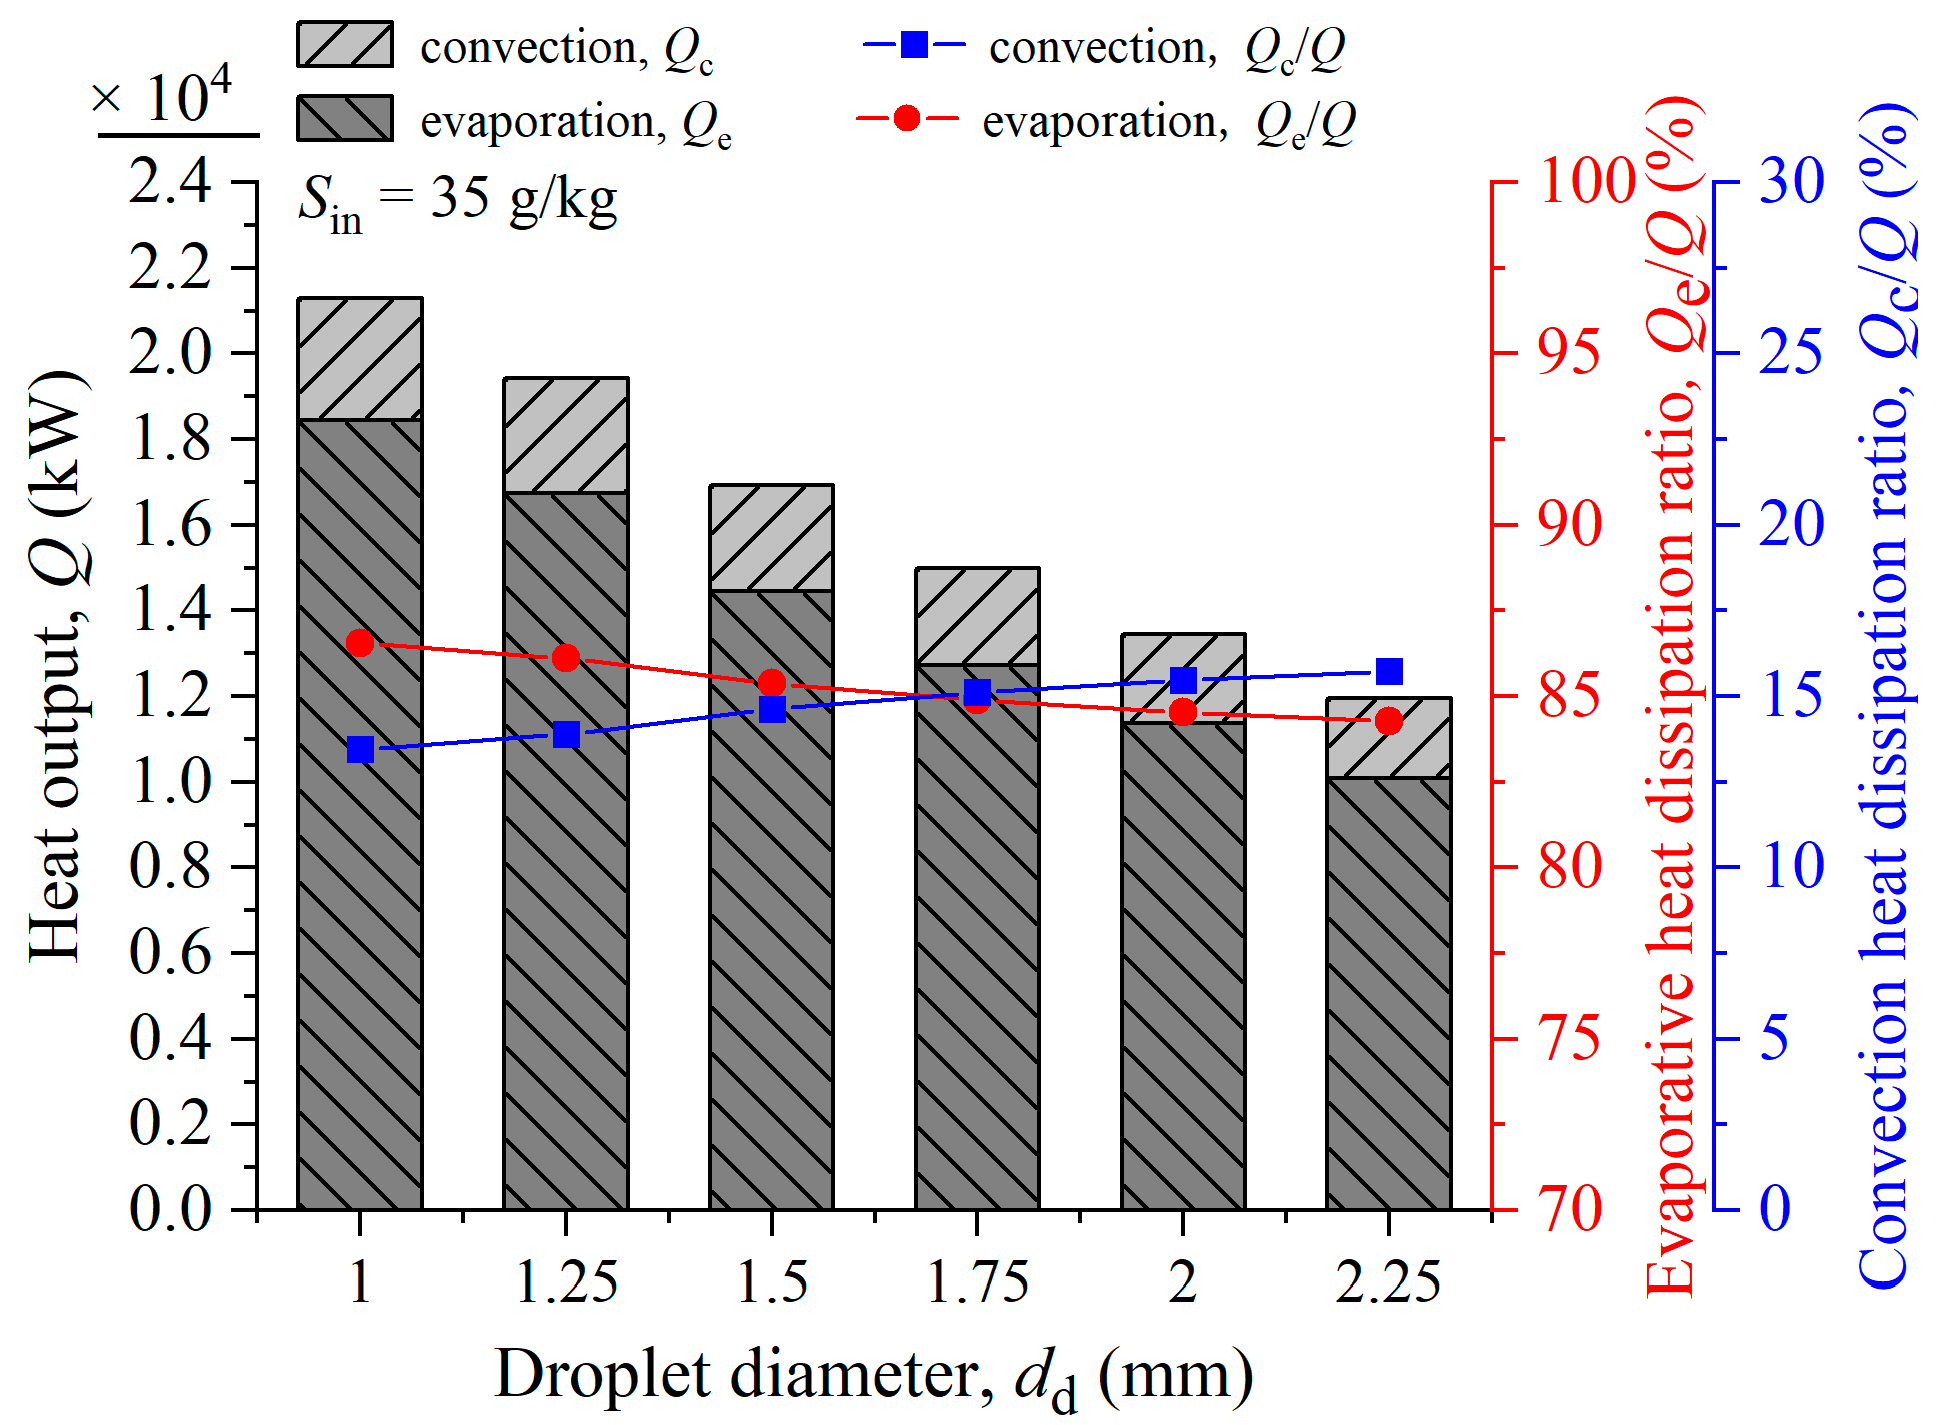
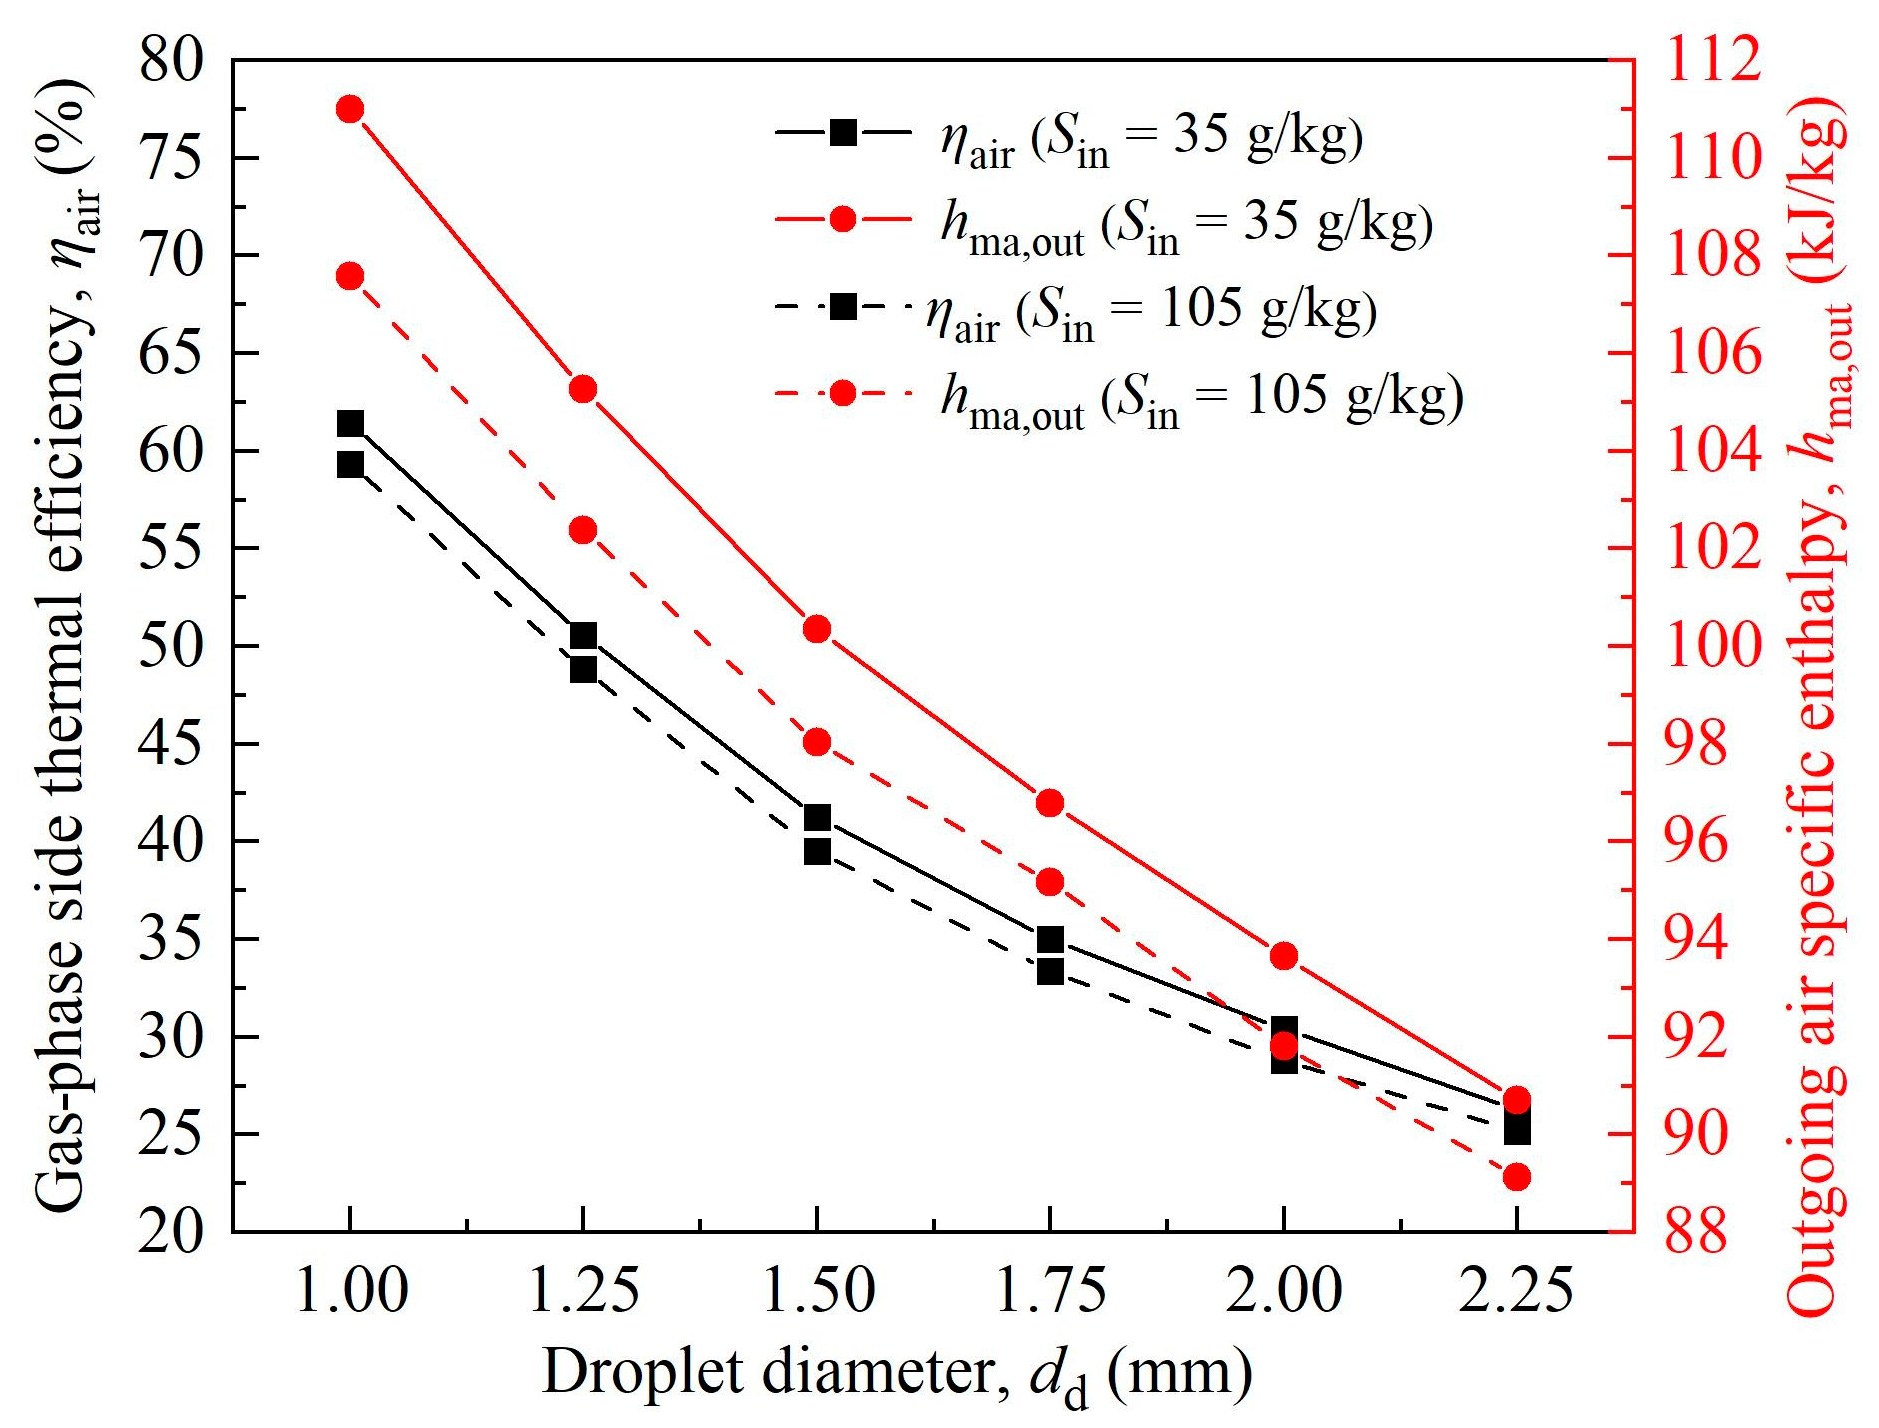
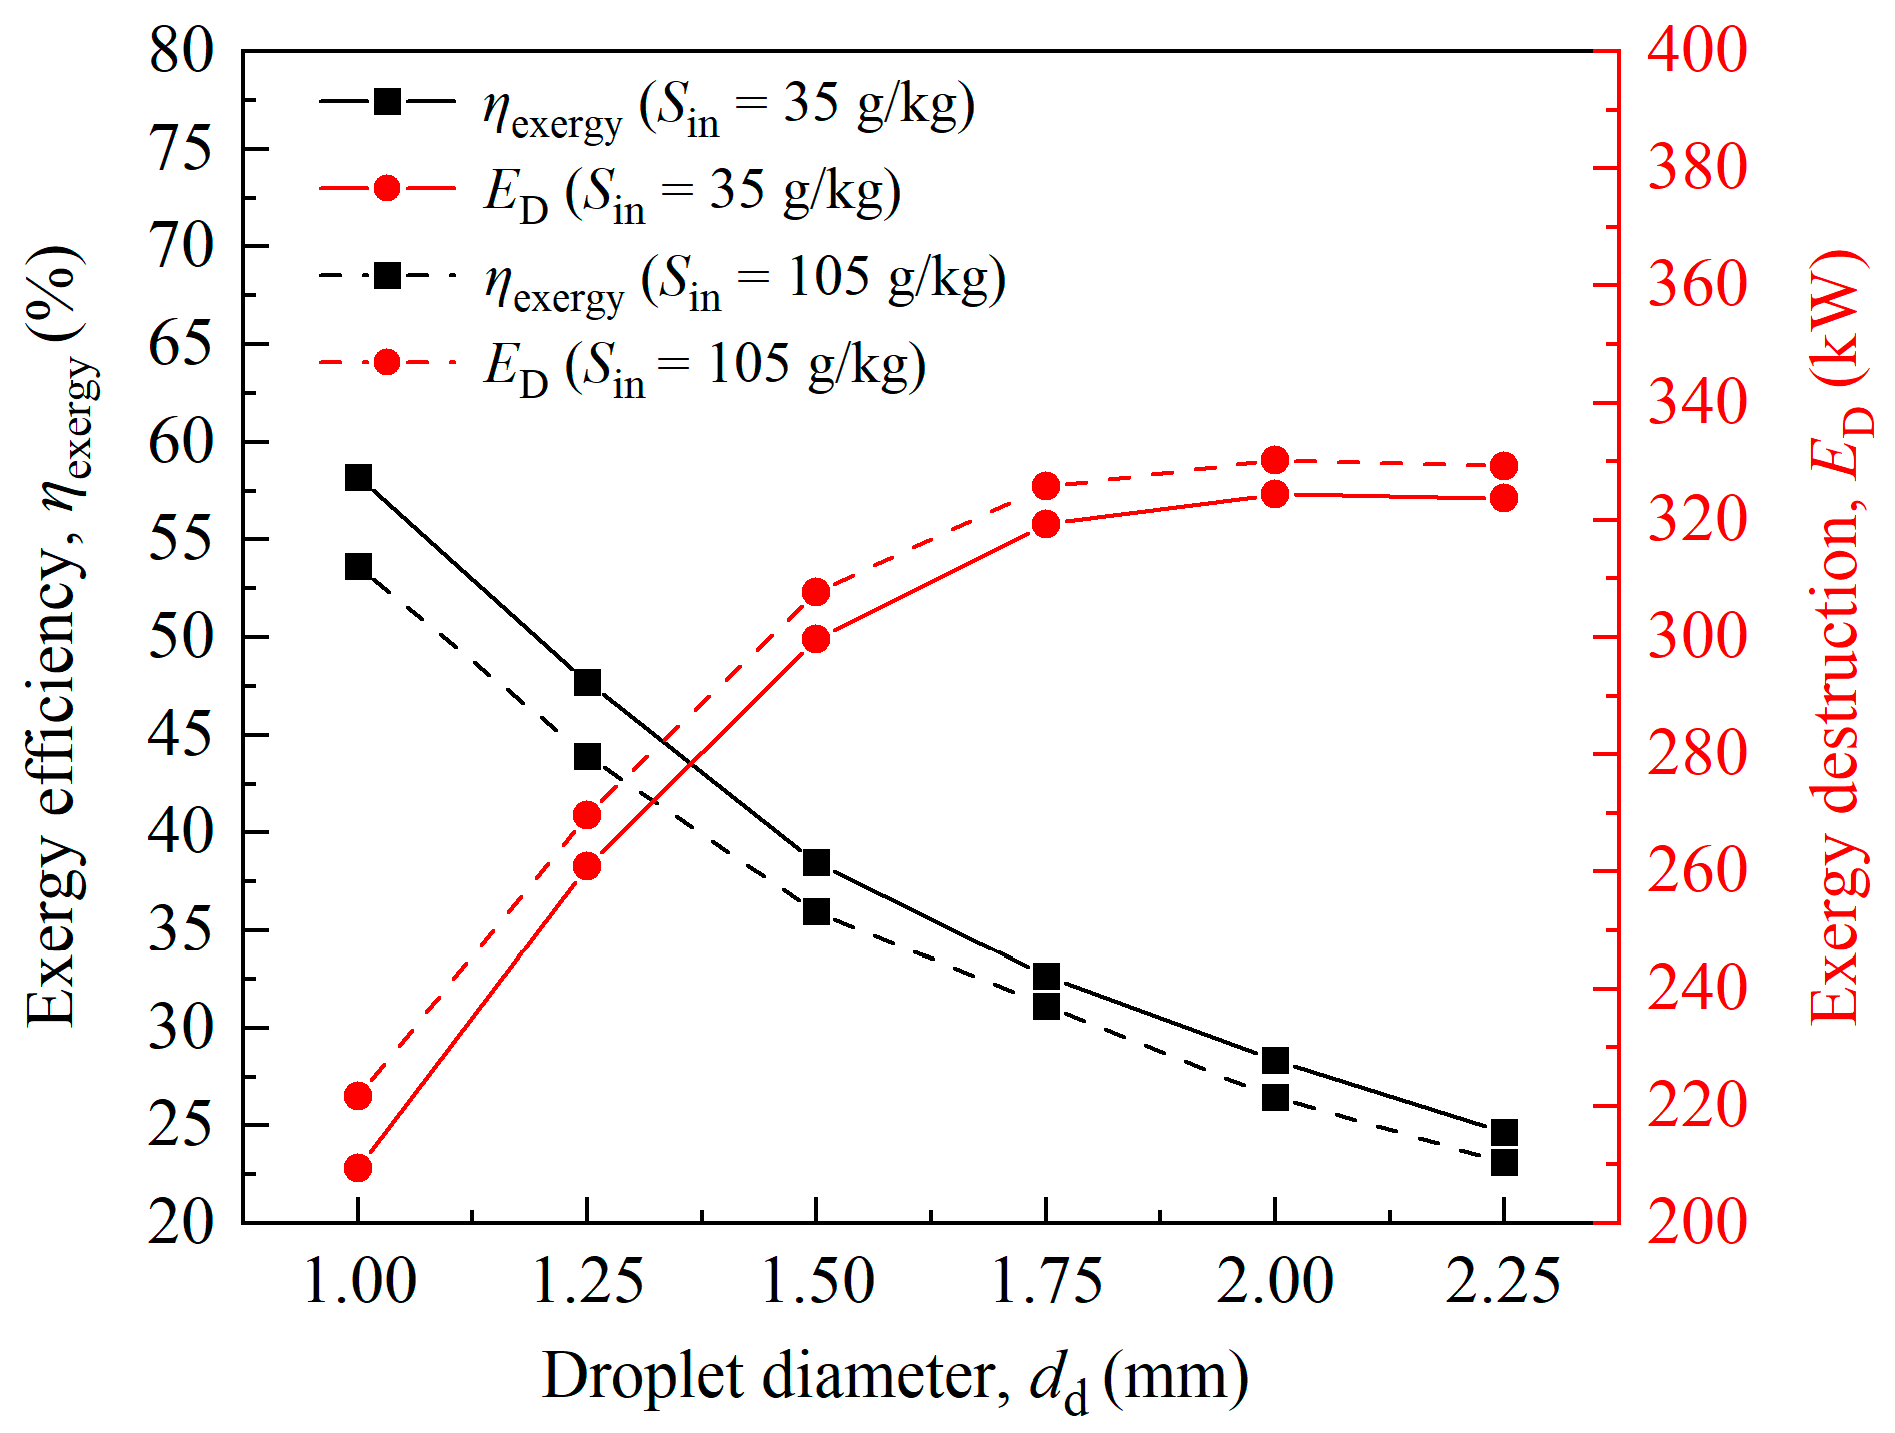
6.2. Influence Rule of Droplet Diameter of Upper-Spray Tower on Heat and Moisture Exchange Characteristics
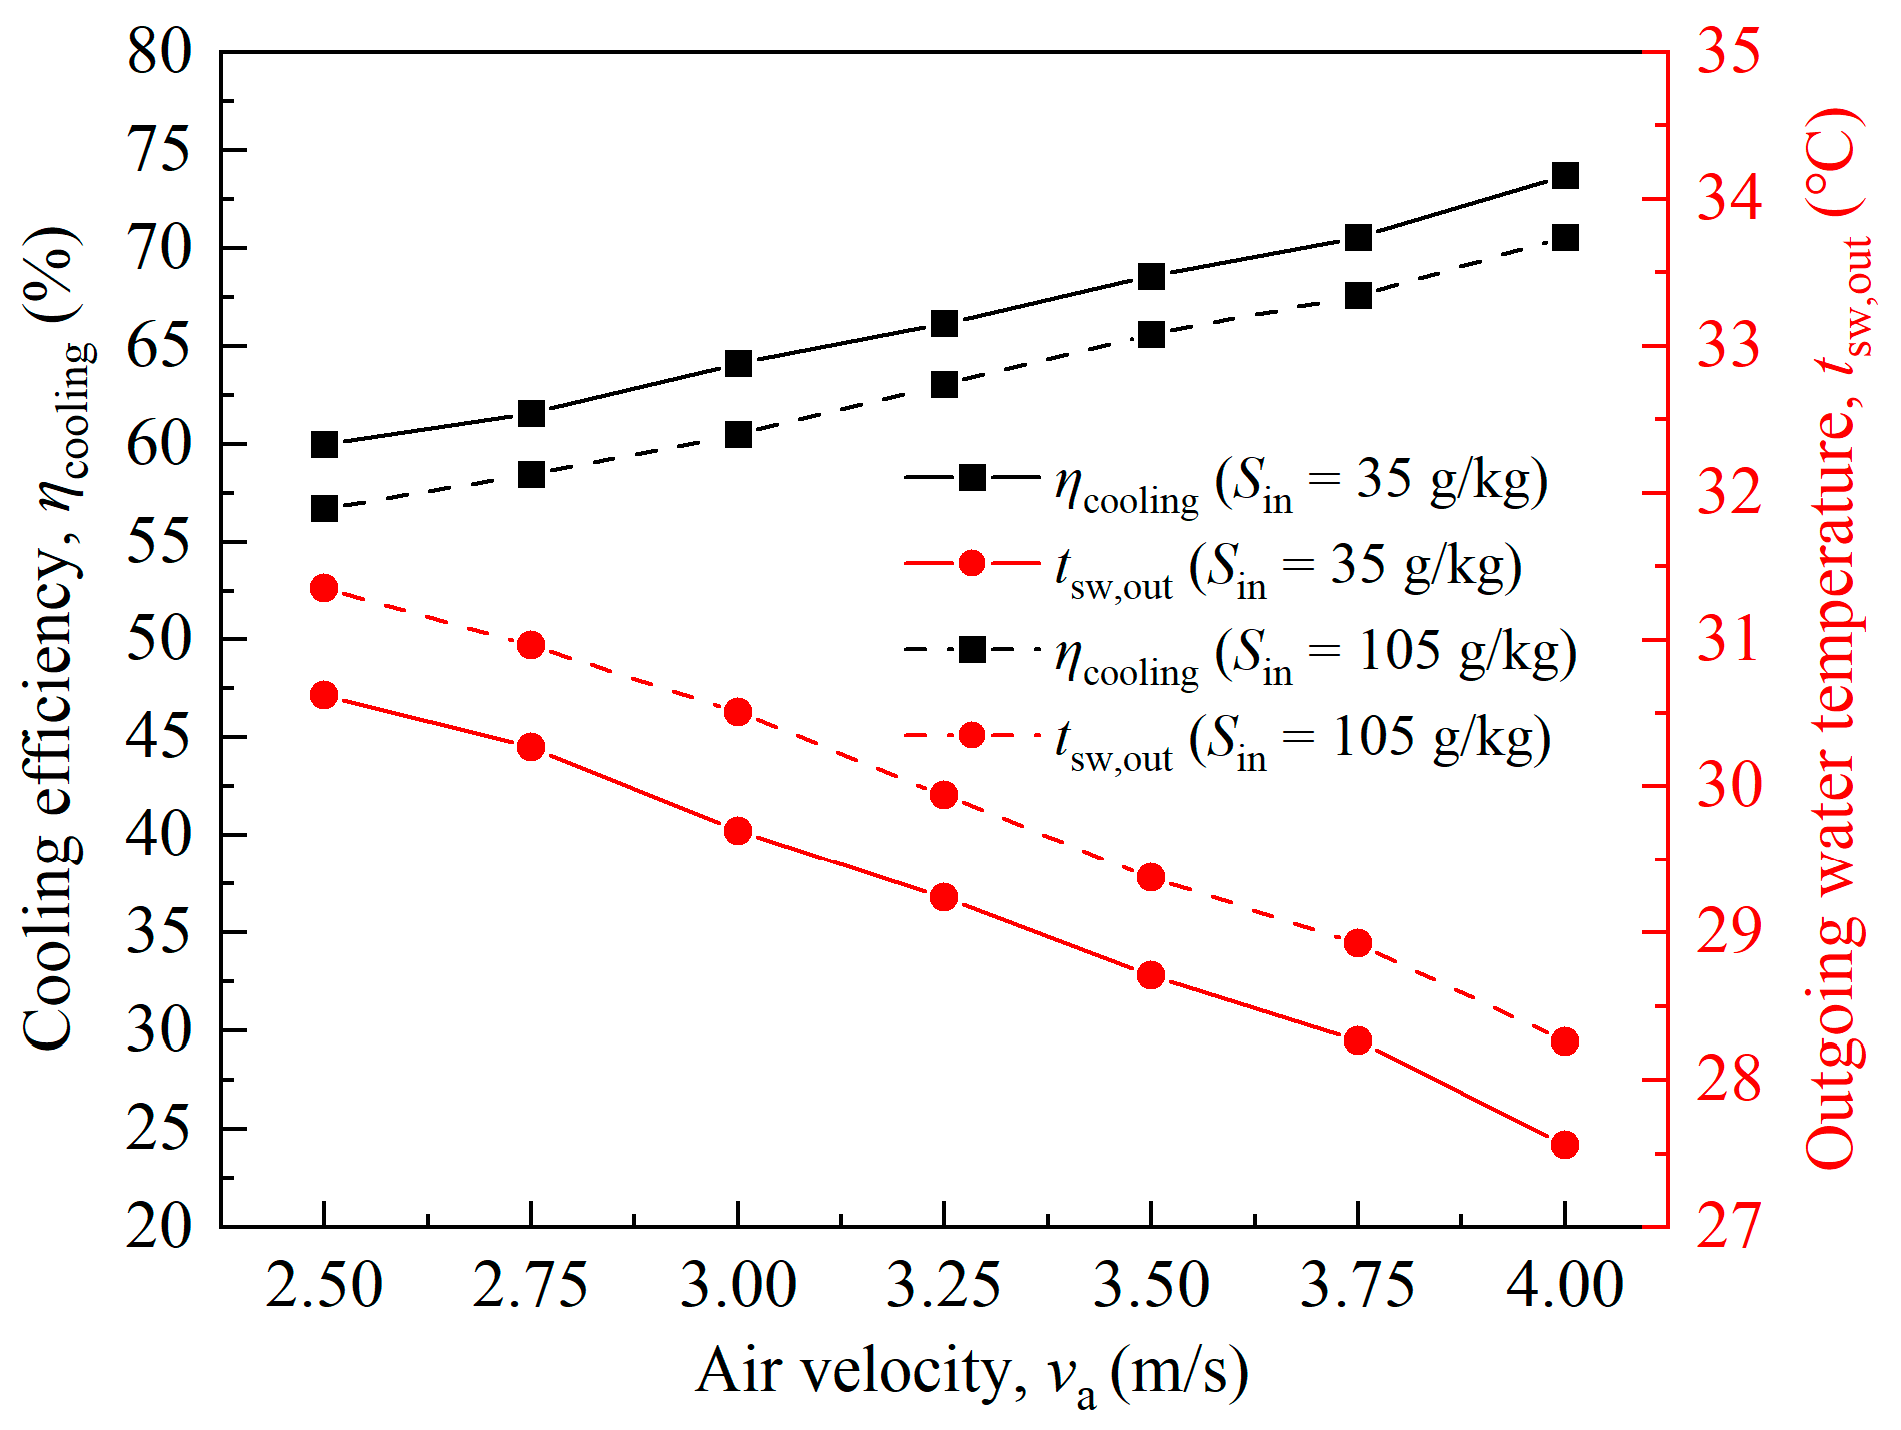
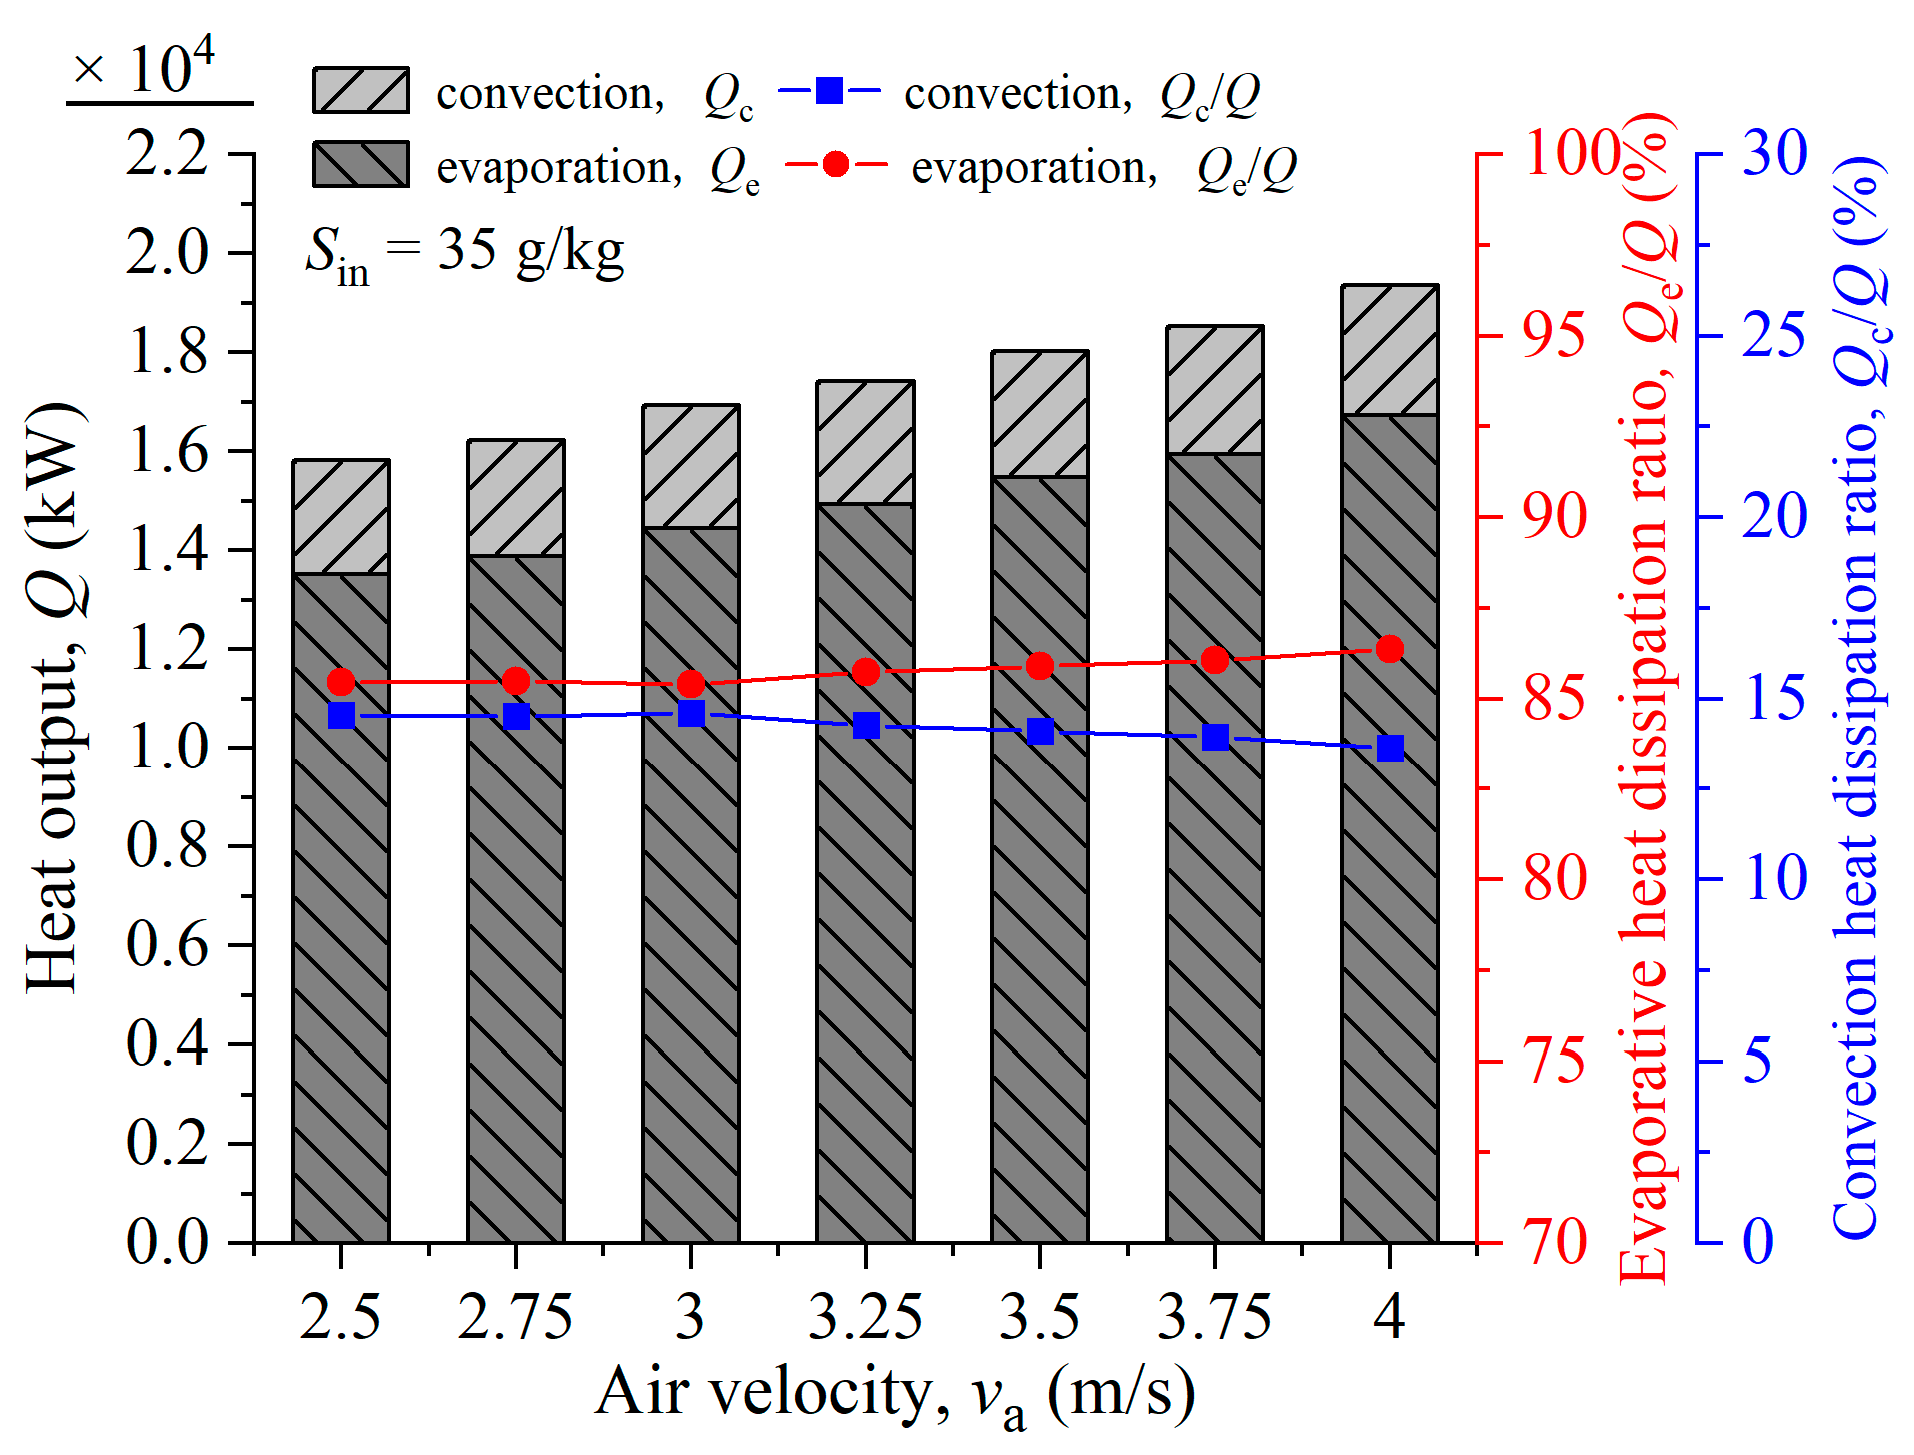
6.3. Influence of the Air Velocity of the Upward-Spray Tower on the Heat and Moisture Exchange Characteristics
6.4. Optimal Analysis of Up-Spray Cooling Tower
6.5. Implications and Applications for Central Air Conditioning Systems
6.6. Carbon Emission Reduction Potential
6.7. Brine Discharge and Salinity Impacts
7. Conclusions
Author Contributions
Funding
Institutional Review Board Statement
Informed Consent Statement
Data Availability Statement
Conflicts of Interest
Nomenclature
| Symbol | Description | Unit |
| A | Heat transfer area | m2 |
| Ad | Droplet cross-sectional area | m2 |
| CD | Drag coefficient | - |
| cp,a | Specific heat of air at constant pressure | kJ/(kg·°C) |
| cp,w | Specific heat of seawater | kJ/(kg·°C) |
| D | Diffusion coefficient of water vapor in air | m2/s |
| dd | Droplet diameter | mm |
| Ex | Exergy | kW |
| g | Gravitational acceleration | m/s2 |
| h | Specific enthalpy of humid air | kJ/kg |
| hfg | Latent heat of vaporization | kJ/kg |
| H | Tower height | m |
| Le | Lewis factor | - |
| ma | Mass of air | kg |
| md | Mass of droplet | kg |
| mw | Mass of seawater | kg |
| Nu | Nusselt number | - |
| Pr | Prandtl number | - |
| Q | Heat dissipation | kW |
| q | Volumetric flow rate of seawater | m3/h |
| Re | Reynolds number | - |
| Sc | Schmidt number | - |
| Sh | Sherwood number | - |
| t | Temperature | °C |
| tsw,in | Inlet seawater temperature | °C |
| tsw,out | Outlet seawater temperature | °C |
| ta,in | Inlet air dry-bulb temperature | °C |
| twb,in | Inlet air wet-bulb temperature | °C |
| va | Air velocity | m/s |
| vd | Initial droplet velocity | m/s |
| ηc | Cooling efficiency | % |
| ηex | Exergy efficiency | % |
| ηth | Gas-phase thermal efficiency | % |
| λ | Thermal conductivity of air | kW/(m·°C) |
| ρa | Air density | kg/m3 |
| ρw | Seawater density | kg/m3 |
| σ | Salinity of seawater | g/kg |
| ΔH | Distance between nozzle and tower bottom | m |
| ΔT | Cooling water temperature difference | °C |
| Abbreviations | ||
| ST-UD | Upward-spraying tower with downward airflow | |
| ST-DU | Downward-spraying tower with upward airflow | |
| ST-UU | Upward-spraying tower with upward airflow | |
| Subscripts | ||
| a | Air | |
| c | Contact | |
| d | Droplet | |
| e | Evaporation | |
| ex | Exergy | |
| in | Inlet | |
| ma | Moist air | |
| out | Outlet | |
| sw | Seawater | |
| th | Thermal | |
| v | Vapor | |
| wb | Wet-bulb | |
References
- Asghari, A.; Kordani, N.; Hallajisani, A. Effect of Physical Parameters on the Outlet Temperature of the Shower Cooling Tower. Jordan J. Mech. Ind. Eng. 2022, 16, 421–428. [Google Scholar]
- Cui, L.; Zhang, X.; Zhang, J.; Zhang, Y. A novel energy management strategy for hybrid electric vehicles based on model predictive control. Appl. Energy 2018, 231, 12–21. [Google Scholar] [CrossRef]
- Belarbi, R.; Lemoine, D.; Riviere, P. Solar cooling system using a hybrid desiccant-air conditioning process. Sol. Energy 2006, 80, 705–717. [Google Scholar]
- Givoni, B.; Al-Hemiddi, N. Applicability of a shower passive cooling tower in a hot dry climate. In Proceedings of the 20th National Passive Solar Conference, Minneapolis, MN, USA, 15–20 July 1995; Volume 15, pp. 143–148. [Google Scholar]
- Yajima, S.; Givoni, B. Experimental performance of the shower cooling tower in Japan. Renew. Energy 1997, 10, 179–183. [Google Scholar] [CrossRef]
- Givoni, B. Performance of the “shower” cooling tower in different climates. Renew. Energy 1997, 10, 173–178. [Google Scholar] [CrossRef]
- Qi, X.; Liu, Y.; Guo, Q.; Yu, S.; Yu, J. Performance prediction of a shower cooling tower using wavelet neural network. Appl. Therm. Eng. 2016, 108, 475–485. [Google Scholar] [CrossRef]
- Qi, X.; Liu, Z. Further investigation on the performance of a shower cooling tower. Energy Convers. Manag. 2008, 49, 570–577. [Google Scholar] [CrossRef]
- Qi, X.; Liu, Z.; Li, D. Performance characteristics of a shower cooling tower. Energy Convers. Manag. 2007, 48, 193–203. [Google Scholar] [CrossRef]
- Anbazhaghan, N.; Karthikeyan, A.; Jayaprabakar, J.; Appavu, P. Assessment on effectiveness of a shower type cooling tower. Int. J. Ambient. Energy 2022, 43, 4239–4246. [Google Scholar] [CrossRef]
- Asghari, A.; Kordani, N. Effect of Ambient Condition on the Shower Cooling Tower in Four Type of Climates Condition. Int. J. Eng. 2018, 31, 841–846. [Google Scholar]
- Cui, H.; Li, N.; Peng, J.; Yin, R.; Li, J.; Wu, Z. Investigation on the thermal performance of a novel spray tower with upward spraying and downward gas flow. Appl. Energy 2018, 231, 12–21. [Google Scholar] [CrossRef]
- Cui, H.; Li, N.; Wang, X.; Peng, J.; Li, Y.; Wu, Z. Optimization of reversibly used cooling tower with downward spraying. Energy 2017, 127, 30–43. [Google Scholar] [CrossRef]
- Cui, H.; Li, N.; Peng, J.; Cheng, J.; Li, S. Study on the dynamic and thermal performances of a reversibly used cooling tower with upward spraying. Energy 2016, 96, 268–277. [Google Scholar] [CrossRef]
- Qi, X.; Liu, Y.; Liu, Z. Exergy based performance analysis of a shower cooling tower. Stroj. Vestn.-J. Mech. Eng. 2013, 59, 251–259. [Google Scholar] [CrossRef]
- Yu, Y.; Qi, X.; Hou, X.; Qu, X.; Guo, Q.; Zhu, H. Heat and mass transfer performance and exergy performance evaluation of seawater cooling tower considering different inlet parameters. Therm. Sci. 2022, 26, 3715–3728. [Google Scholar] [CrossRef]
- Fisenko, S.; Kasyanov, I.; Khodakov, Y. Heat and mass transfer in a horizontal gas-solid fluidized bed with solid particles of different sizes. Int. J. Heat Mass Transf. 2002, 45, 4683–4694. [Google Scholar] [CrossRef]
- Kloppers, J.; Kröge, D. The effect of particle size distribution on the performance of a gas-solid fluidized bed. Int. J. Heat Mass Transf. 2005, 48, 2071–2079. [Google Scholar]
- Teodori, S.; Zanchini, E.; Lippiello, V. Optimal control strategies for hybrid renewable energy systems: A review. Energies 2017, 10, 790. [Google Scholar] [CrossRef]
- Sureshkumar, R.; Shanmugasundaram, M.; Suresh, S. Experimental investigation of heat transfer and pressure drop in a finned tube heat exchanger. Appl. Therm. Eng. 2008, 28, 349–360. [Google Scholar] [CrossRef]
- Sureshkumar, R.; Shanmugasundaram, M.; Suresh, S. Effect of surface roughness on the heat transfer performance of a heat exchanger. Appl. Therm. Eng. 2008, 28, 889–900. [Google Scholar]
- Kapilan, N.; Arun, M.I.; Shashikantha, K. A comprehensive review on evaporative cooling systems. Results Eng. 2023, 18, 101059. [Google Scholar] [CrossRef]
- Khan, J.R.; Zubair, S.M. An improved design and rating analyses of counter flow wet cooling towers. J. Heat Transf. 2001, 123, 770–778. [Google Scholar] [CrossRef]
- ASTM D1141-98; Standard Practice for the Preparation of Substitute Ocean Water. ASTM International: West Conshohocken, PA, USA, 2021.
- Chen, X.; Sun, F.; Lyu, D. Field test study on water droplet diameter distribution in the rain zone of a natural draft wet cooling tower. Appl. Therm. Eng. 2019, 162, 114252. [Google Scholar] [CrossRef]
- Singh, K.; Das, R. Exergy optimization of cooling tower for HGSHP and HVAC applications. Energy Convers. Manag. 2017, 136, 418–430. [Google Scholar] [CrossRef]
- Khan, J.R.; Yaqub, M.; Zubair, S.M. Performance characteristics of counter flow wet cooling towers. Energy Convers. Manag. 2003, 44, 2073–2091. [Google Scholar] [CrossRef]
- Yuan, W.; Sun, F.; Chen, X.; Liu, R. Effect of thermal load on evaporation loss of natural draft counter-flow wet cooling towers. J. Therm. Sci. Eng. Appl. 2020, 12, 051019. [Google Scholar] [CrossRef]
- Yuan, W.; Sun, F.; Liu, R.; Chen, X.; Li, Y. The effect of air parameters on the evaporation loss in a natural draft counter-flow wet cooling tower. Energies 2020, 13, 6174. [Google Scholar] [CrossRef]
- ASHRAE Standard 133; Method of Testing Direct Evaporative Air Coolers. American National Standards Institute: Atanta, GA, USA, 2015.


| Parameter | Symbol | Value | Unit | Source/Description |
|---|---|---|---|---|
| Droplet diameter | dd | 1.0–2.25 | mm | Experimental range [5] |
| Air velocity | va | 2.5–4.0 | m/s | Measured |
| Seawater salinity | σ | 35 (standard) | g/kg | ASTM D1141-98 [24] |
| Drag coefficient | CD | 0.44 (spherical) | – | Assumed for spherical droplets |
| Latent heat | hfg | 2257 | kJ/kg | At 100 °C [16] |
| Lewis factor | Le | 0.865–0.905 | – | Le = hmcp,ahc |
| Variable | Symbol | Inlet Value | Outlet Value | Unit |
|---|---|---|---|---|
| Seawater temperature | tsw,in | 44 | tsw,out | °C |
| Air dry-bulb temperature | ta,in | 28 | ta,out | °C |
| Air wet-bulb temperature | twb,in | 21.7 | – | °C |
| Seawater flow rate | q | 1000 | – | m3/h |
| Air flow rate | G | 878,000 | – | m3/h |
| Parameter | Symbol | Value | Unit |
|---|---|---|---|
| Tower height (nozzle to basin) | H | 3.2 | m |
| Cross-sectional area | A | 1.8 × 1.8 | m2 |
| Nozzle arrangement | N | 4 × 4 grid | – |
| Nozzle spacing | S | 0.45 | m |
| Adjustable spray height | Hspray | 1.5–2.5 | m |
| Basin volume | Vbasin | 0.8 | m3 |
| Compliance standard | – | ASHRAE 133-2021 [30] | – |
| Measurement Point | Measured Parameters | Instrument | Accuracy |
|---|---|---|---|
| Air Inlet | Dry-bulb temperature (ta,in) Wet-bulb temperature (twb,in) Air velocity (va) | Vane anemometer Psychrometer | ±0.5 °C ±3% FS |
| Air Outlet | Dry-bulb temperature (ta,out) Humidity ratio (wa,out) | Hygrometer (capacitive sensor) | ±1.5% RH ±0.2 g/kg |
| Seawater Inlet | Temperature (tsw,in) Salinity (σin) Flow rate (q) | RTD sensor Conductivity meter | ±0.1 °C ±0.5 g/kg |
| Seawater Outlet | Temperature (tsw,out) Salinity (σout) | RTD sensor Conductivity meter | ±0.1 °C ±0.5 g/kg |
| Tower Mid-Height (z = 1.6 m) | Air temperature (ta(z)) Droplet diameter (dd(z)) | Thermocouples High-speed camera | ±0.3 °C ±0.05 mm |
| Experimental Conditions | ||||||||||
|---|---|---|---|---|---|---|---|---|---|---|
| 1 | 2 | 3 | 4 | 5 | 6 | 7 | 8 | 9 | 10 | |
| Spray height (m) | 1.7 | 1.7 | 1.7 | 1.7 | 1.7 | 2.5 | 2.5 | 2.5 | 2.5 | 2.5 |
| tsw,in (°C) | 34.5 | 35.0 | 32.2 | 32.9 | 33.5 | 50.4 | 40.5 | 43.6 | 45.5 | 43.4 |
| ta,in (°C) | 28.5 | 28.2 | 29.4 | 27.5 | 27.9 | 33.1 | 32.8 | 32.6 | 32.0 | 31.8 |
| twb,in (°C) | 20.5 | 20.5 | 19.5 | 19.6 | 19.7 | 28.6 | 28.0 | 28.0 | 27.9 | 27.8 |
| q (l/min) | 124.0 | 124.0 | 140.0 | 155.0 | 155.0 | 107.0 | 107.0 | 132.5 | 162.5 | 162.5 |
| v (kg/s) | 2.34 | 2.34 | 2.21 | 2.20 | 2.20 | 1.16 | 0.81 | 2.08 | 2.54 | 3.12 |
| dd (mm) | 1.3 | 1.3 | 1.0 | 1.3 | 1.3 | 2.2 | 2.2 | 2.0 | 1.8 | 1.8 |
| vd (m/s) | 6.58 | 6.58 | 7.43 | 8.22 | 8.22 | 2.90 | 2.90 | 3.50 | 4.30 | 4.30 |
| va (m/s) | 1.81 | 1.81 | 1.72 | 1.70 | 1.70 | 1.00 | 0.70 | 1.80 | 2.20 | 2.70 |
| Working Conditions | Parameter Value | Working Conditions | Parameter Value |
|---|---|---|---|
| p | 102,100 Pa | dd | 1.5 mm |
| q | 1000 m3/h | vd | 8.3 m/s |
| g | 878,000 m3/h | va | 3 m/s |
| tsw,in | 44 °C | λ | 1.0 |
| ta,in | 28 °C | tsw,out | 30 °C |
| twb,in | 21.7 °C |
| Impact Factor | Response Variable | |||||||||
|---|---|---|---|---|---|---|---|---|---|---|
| (mm) | (m/s) | (m/s) | (°C) | (%) | (kW) | (kW) | (°C) | (°C) | (°C) | |
| Reference condition | 1.5 | 8.3 | 3 | 44 | 64.13 | 299.67 | 16,930 | 29.70 | 14.30 | 8.00 |
| Optimized conditions | 1 | 6.59 | 3.2525 | 39.8182 | 78.33 | 183.82 | 16,932.67 | — | — | — |
| Simulation verification | 1 | 6.6 | 3.3 | 39.8 | 78.82 | 186.18 | 17,055.67 | 25.53 | 14.27 | 3.83 |
| Indicator | Upward-Spraying Tower | Downward-Spraying Tower | Freshwater Tower |
|---|---|---|---|
| CO2 emissions (tonnes/year) | 624 | 732 | 766 |
| Freshwater use (m3/year) | 0 | 0 | 12,600 |
| Brine discharge salinity (g/kg) | 38 (with dilution) | 45 (with dilution) | – |
Disclaimer/Publisher’s Note: The statements, opinions and data contained in all publications are solely those of the individual author(s) and contributor(s) and not of MDPI and/or the editor(s). MDPI and/or the editor(s) disclaim responsibility for any injury to people or property resulting from any ideas, methods, instructions or products referred to in the content. |
© 2025 by the authors. Licensee MDPI, Basel, Switzerland. This article is an open access article distributed under the terms and conditions of the Creative Commons Attribution (CC BY) license (https://creativecommons.org/licenses/by/4.0/).
Share and Cite
Luo, L.; Guo, P.; Wang, G. 3E (Energy–Exergy–Environmental) Performance Analysis and Optimization of Seawater Shower Cooling Tower for Central Air Conditioning Systems. Processes 2025, 13, 1336. https://doi.org/10.3390/pr13051336
Luo L, Guo P, Wang G. 3E (Energy–Exergy–Environmental) Performance Analysis and Optimization of Seawater Shower Cooling Tower for Central Air Conditioning Systems. Processes. 2025; 13(5):1336. https://doi.org/10.3390/pr13051336
Chicago/Turabian StyleLuo, Lincong, Pengjiang Guo, and Gang Wang. 2025. "3E (Energy–Exergy–Environmental) Performance Analysis and Optimization of Seawater Shower Cooling Tower for Central Air Conditioning Systems" Processes 13, no. 5: 1336. https://doi.org/10.3390/pr13051336
APA StyleLuo, L., Guo, P., & Wang, G. (2025). 3E (Energy–Exergy–Environmental) Performance Analysis and Optimization of Seawater Shower Cooling Tower for Central Air Conditioning Systems. Processes, 13(5), 1336. https://doi.org/10.3390/pr13051336