Article

Gasification Applicability of Korean Municipal Waste Derived Solid Fuel: A Comparative Study

1
Department of Environmental Engineering, Yonsei University, Wonju, Gangwon-do 26493, Korea
2
Department of Chemical Engineering, Monash University, Clayton, VIC 3800, Australia
3
Environment & Sustainable Resources Center, Korea Research Institute of Chemical Technology, Daejeon 34114, Korea
*
Author to whom correspondence should be addressed.
Processes 2020, 8(11), 1375; https://doi.org/10.3390/pr8111375
Submission received: 27 September 2020 / Revised: 21 October 2020 / Accepted: 26 October 2020 / Published: 29 October 2020
(This article belongs to the Special Issue Gasification Processing of Biomass and Refuse Derived Fuel)

Abstract

:
Gaining energy independence by utilizing new and renewable energy resources has become imperative for Korea. Energy recovery from Korean municipal solid waste (MSW) could be a promising option to resolve the issue, as Korean MSW is highly recyclable due to its systematic separation, collection and volume-based waste disposal system. In this study, gasification experiments were conducted on Korean municipal waste-derived solid fuel (SRF) using a fixed bed reactor by varying the equivalence ratio (ER) to assess the viability of syngas production. Experiments were also conducted on coal and biomass under similar conditions to compare the experimental results, as the gasification applicability of coal and biomass are long-established. Experimental results showed that Korean SRF could be used to recover energy in form of syngas. In particular, 50.94% cold gas efficiency and 54.66% carbon conversion ratio with a lower heating value of 12.57 MJ/Nm3 can be achieved by gasifying the SRF at 0.4 ER and 900 °C. However, compared to coal and biomass, the syngas efficiency of Korean SRF was less, which can be resolved by operating the gasification processes at high temperatures. If proper research and development activities are conducted on Korean SRF, it could be a good substitute for fossil fuels in the future.

1. Introduction

1.1. Background

Korea is known as a country that consumes 9.4 times more energy than the gross national product (GNP) and 7.5 times more energy than the United States [1]. Moreover, Korea is representative of an energy resource importer due to its lack of natural resources and very low energy independence. In these situations, the utilization of new and renewable energy resources has become a necessity for Korea. The most common types of new and renewable energy resources are solar, small hydro-power, wind power, geothermal, tidal power, biomass and waste [2]. However, Korea has a small land area with a 70% mountainous region, which limits the utilization of many new and renewable energy resources.
Energy generation from municipal solid waste (MSW) could be a promising option for Korea. Korea is currently generating 48,934 tons of MSW per day, which has increased by 5 times during the last 30 years [3]. MSW can be converted into an energy resource through various treatments. Moreover, it will serve the purpose of processing waste at the same time. Korean waste is highly recyclable due to its systematic separation, collection and volume-rate waste disposal system [4]. In the case of energy recovery from MSW, there is strong evidence that high-quality fuel can be produced from it [5].
The typical disposal of MSW in Korea can be divided into recycling, landfill and incineration. Except for material recycling, most of them are disposed of in the landfill or incinerated. As previously stated, the disposal in the landfill is deemed to be limited due to the nation’s small land area. In the case of incineration, waste treatment and energy recovery are carried out by recovering heat generated by the combustion of waste in an oxidizing environment at high temperatures. The thermal process involving incineration has been developed in various ways over time, and studies on advanced technologies including pyrolysis and gasification have been actively studied in recent years. Among these technologies, gasification has several advantages over others. The main advantage of gasification is that any type of feedstock can be used [6]. Moreover, gasification converts the entire carbon content of the feedstock into syngas. The second advantage is that the product gas can be converted into a variety of fuels (biogas, H2, gasoline, synthetic diesel) and chemicals (methanol, urea) [7]. The other benefit of the gasification process is the lower CO2 emission rate compared with incineration [8]. The current status of gasification technology and its applicability for different feedstocks have been discussed briefly in the following sections.

1.2. The Status of Gasification for Different Feedstocks

There are more than 272 operating gasification plants worldwide with 686 gasifiers [9]. These gasification plants are mostly operated using coal and few of them use biomass and waste. Coal gasification plants have already been commercialized worldwide and are currently in operation in many countries. However, more research concerning the use of biomass and non-fossil fuel wastes is necessary for commercialization.
Figure 1 shows the status of energy from syngas and market compound annual growth rate (CAGR) for different feedstocks [10]. Among all the operational factors, the feedstock is the most important one. Coal is still the most popular feedstock used in the gasification process and is expected to be actively used in the near future. On the other hand, biomass and waste are showing slow development due to their lack of homogeneity in the application of the gasification process. However, problems such as climate change and the depletion of fossil fuels are expected to lead to the commercialization of the gasification process using biomass and waste.

1.3. Main Feedstocks of Gasification

1.3.1. Coal

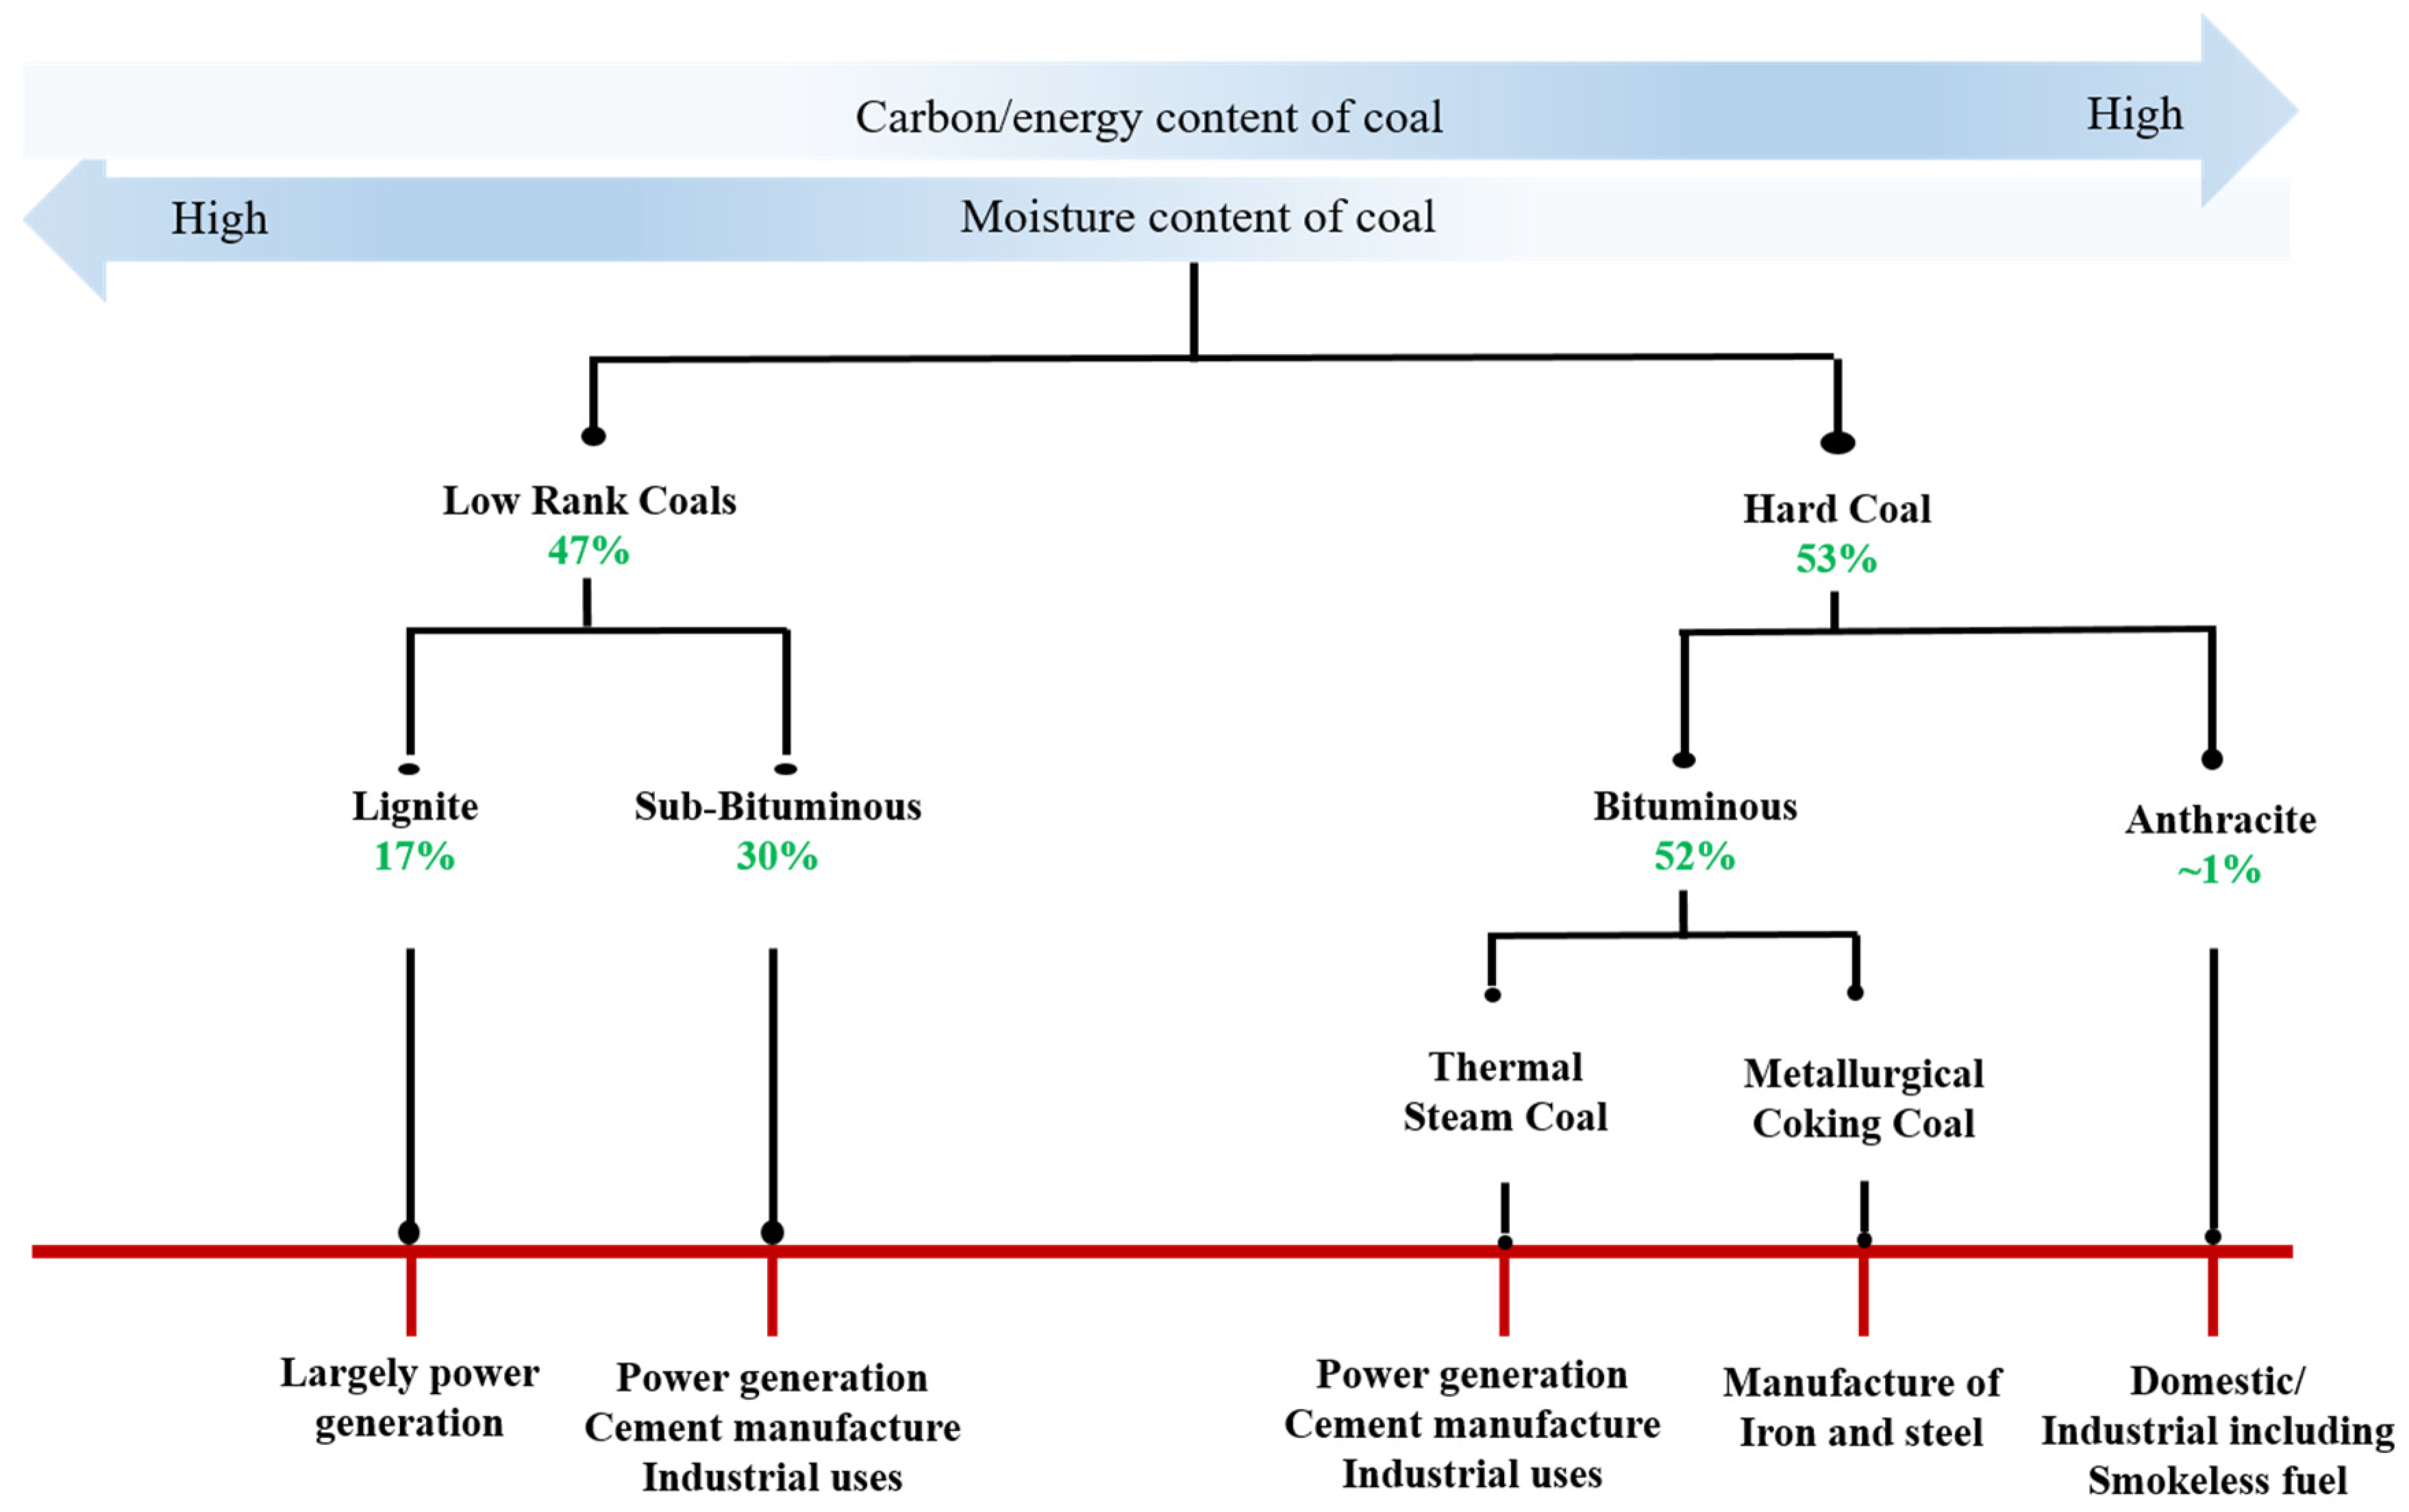
Coal is a strong representative of solid fossil fuel for the thermal process due to its high heating value and its uniform characteristics as feedstock. Coal comes in several varieties, including peat, lignite, brown coal, bituminous coal, sub-bituminous coal and anthracite [11]. Figure 2 shows a summary of the classifications, uses and reserves of coal [12]. The typical elemental composition of coal includes 65–95 wt.% of carbon, 2–7 wt.% of hydrogen, up to 25 wt.% of oxygen and 10 wt.% sulfur and 1–2 wt.% of nitrogen [13].

1.3.2. Biomass

The term biomass refers to any organic materials that are derived from plants or animals that are living or have lived in the recent past [14]. Generally, biomass has advantages as a feedstock for thermal processes due to its high volatility and reactivity [15]. In addition, generally, woody biomass has a high oxygen content due to photosynthesis using CO2. Furthermore, the contents of sulfur and nitrogen which were known as a precursor of pollutants like nitrogen oxide and sulfur oxide are low in woody biomass. These are the major advantages with respect to the application to the thermal process. Table 1 shows the elemental analysis results (dry basis) for certain varieties of biomass as compared with coal and wastes [15,16,17,18]. The chemical composition of typical biomass includes 40–58 wt.% of cellulose, 10–40 wt.% of hemicellulose and 18–27 wt.% of lignin.

1.3.3. Solid Waste

Solid waste is primarily the result of human or animal activity and is commonly referred to as anything that is thrown away when it is no longer useful, which includes organic and inorganic materials. MSW is a major source of solid waste which is generated in a municipality, encompassing heterogeneous and homogeneous waste from urban and peri-urban areas [17]. According to the World Bank report, 1.3 billion tons of MSW are currently being generated worldwide and this is predicted to increase to 2.2 billion tons in 2025 [19]. Energy can be recovered from MSW using various waste to energy technologies. Figure 3 shows the pathways of various waste energy conversion technologies [6]. Waste to energy technologies can be divided into thermal, mechanical and biological conversion technologies. These technologies are known to be more efficient than incineration and landfill targeting treatment or reduction.

1.4. Scope of the Study

From the above discussion, it can be clearly seen that the gasification of MSW could be a propitious route of energy recovery from Korean MSW. Thus, in this study efforts were made to assess the gasification applicability of Korean municipal waste-derived solid fuel (SRF) by conducting gasification experiments under different conditions. Moreover, initiatives were taken to compare the experimental results with long-established gasification technologies like that of coal and biomass by the conduction of similar experiments under similar conditions and through literature reviews. One of the key objectives of this work is to provide a direction to the researchers for future research and development purpose.

2. Materials and Methods

2.1. Characterization of Feedstocks

In this study, sawdust, fluff SRF and coal were selected as being representative of biomass, solid waste and fossil fuels, respectively, due to their availability and operational flexibility during gasification. Later, basic characteristic analyses such as elemental analysis, proximate analysis, heating value analysis and thermogravimetric analysis were conducted on these selected feedstocks as they play a crucial role in different thermochemical conversion processes. Moreover, these characteristics determine various experimental parameters such as temperature and air ratio. Table 2 tabulates the experimental methods and equipment used for the physiochemical characteristic analyses.

2.2. Experimental Section

2.2.1. Gasification Reactor

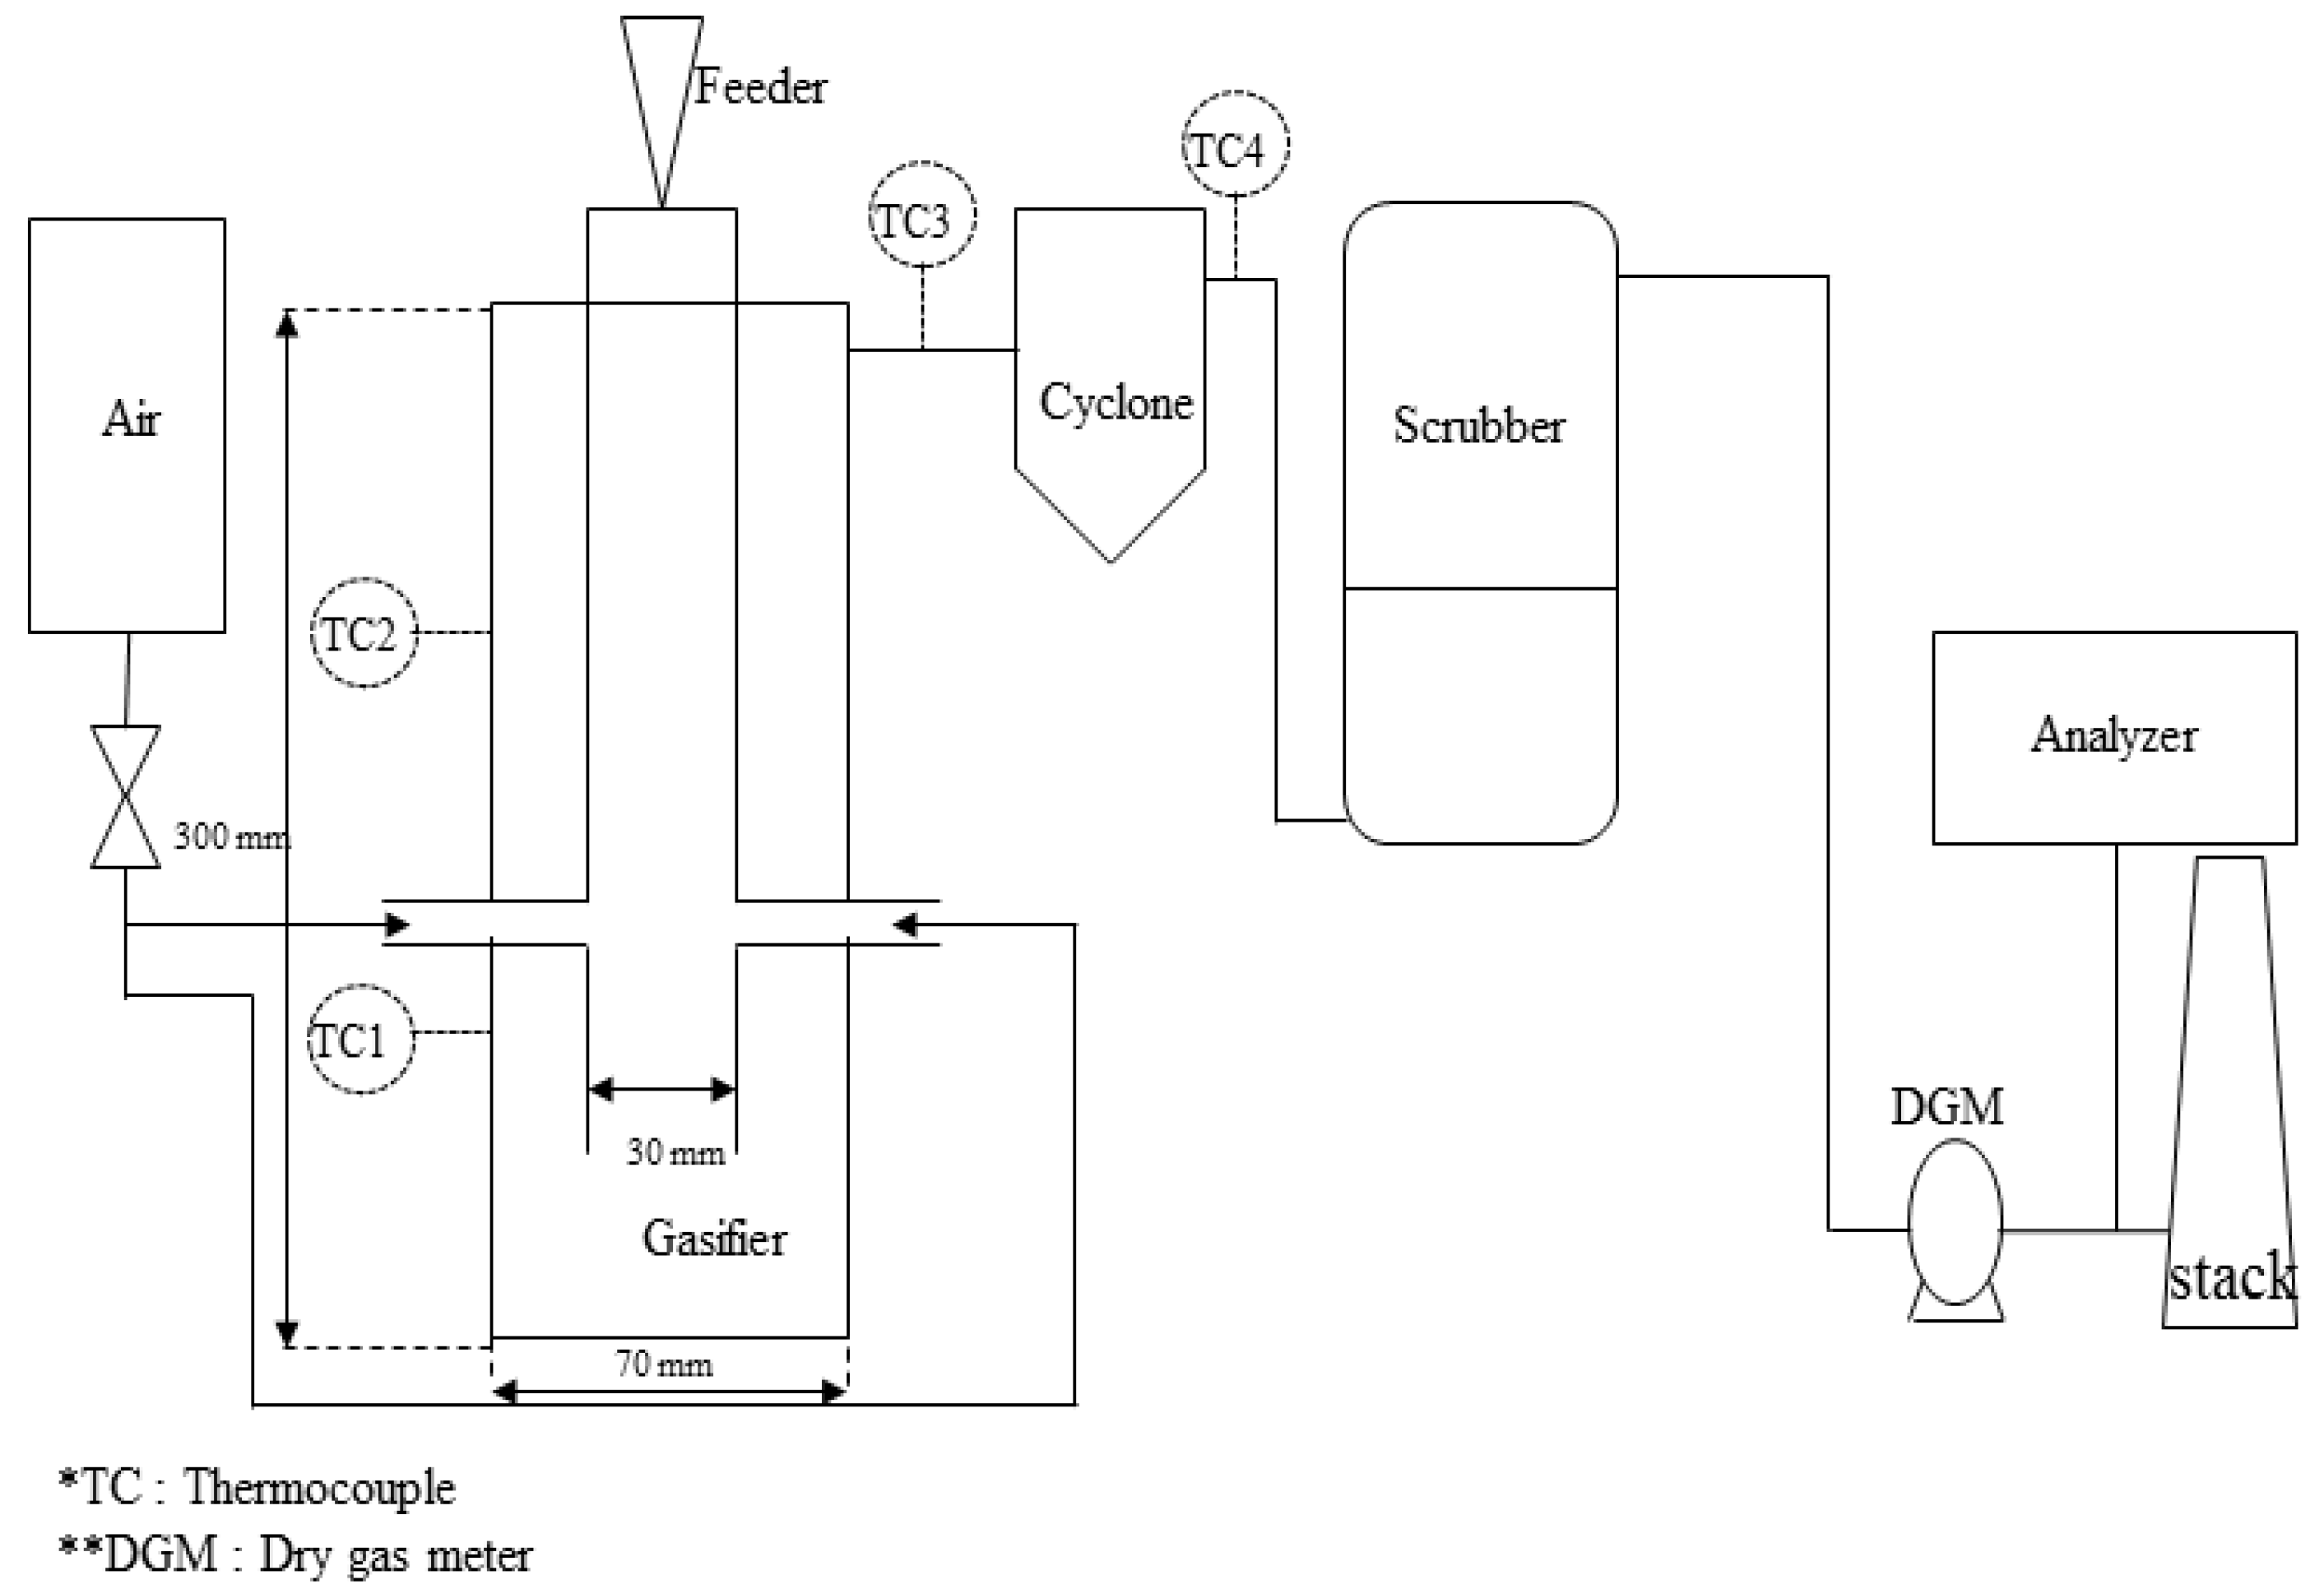
In this study, experiments were conducted using a lab-scale downdraft fixed bed gasifier. The capacity of the gasifier was 2 g/min. For operating flexibility, the particle size of the feedstocks was crushed to <10 mm by using a crusher machine. Figure 4 shows a schematic diagram of the gasification unit used in this study. The lab-scale gasification system consists of a furnace, a purification system containing a cyclone and a wet scrubber, an analysis section utilizing a micro gas chromatography (Micro-GC 3000A, Agilent, Santa Clara, CA, USA) and a real-time gas analyzer (VARIO PLUS, MRU, Neckarsulm-Obereisesheim, Germany). The sample was fed into the gasifier by maintaining negative pressure inside the gasifier and the feeding method was a semi-batch type. The gasifier was a dual-tube system consisting of an inner tube and an exterior. An electric furnace was used to heat the gasifier and the gasifier temperature was controlled through TC1 of the inner tube. The product gas purification system consists of a cyclone (to remove fly ash) and a wet scrubber (to remove water-soluble gaseous contaminants and particulate contaminants). The total gas flow rate was measured using a dry gas meter (DC-5A, Shinagawa, Tokyo, Japan). Product gas compositions were analyzed using Micro-GC and a real-time analyzer. Later, experimental results were cross-checked by using an emission monitoring system (MRU GmbH, Neckarsulm-Obereisesheim, Germany) to ensure the reliability of the analysis.
However, the fixed bed gasification process inherits a drawback. During gasification, it creates a dead zone inside the gasifier and reduces the experimental reactivity. Thus, in this study, an initiative was taken to overcome the low reactivity by introducing oxidizing agents orally. Figure 5 represents the schematic diagram of the swirl flow type fixed bed reactor used in this study. In previous studies, swirl flow was utilized for the improvement of heat exchange between feedstock and the oxidant [20,21].

2.2.2. Experimental Conditions

Table 3 shows the experimental conditions used in this study. The temperature condition was selected based on the results of the thermogravimetric analysis. Typically, the air is used as an oxidizing agent for the gasification process. Therefore, it was selected for this study as well. Experiments were conducted at the equivalence ratio (ER) of 0.2, 0.4 and 0.6, considering the fact that the general gasification process is operated between ER 0.2 and 0.6. The sample was fed at a rate of 1 g/min in a semi-batch feeding system. The inlet was composed of a two-stage slider, in order to prevent leakage while feeding the sample.

2.2.3. Gasification Efficiency

In order to evaluate the gasification performance, conversion rates in both calorific and chemical aspects must be calculated. In this study, cold gas efficiency was calculated with comparison to raw feedstock. Furthermore, the carbon conversion efficiency was evaluated, which shows how much carbon components in the feedstock are converted to carbon-based gases in the product gas. Moreover, the gasification characteristics were compared by utilizing lower heating value (LHV)gas, which is the low heat generated by-product gas and yield of product gas from feedstock (Ygas), which indicates the gas yield. Many studies [2,19,22,23,24] have used the following formulas (1)–(4) to evaluate the gasification characteristics. Here, Qgas represents the total flow rate of the product gas and mfeeding denotes the mass of the injected feedstock.
LHVgas(kJ/Nm3) = (CO × 127.05) + (H2 × 103.39) + (CH4 × 358.74) + (C2H6 × 643.81) + (C3H8 × 935.57)
Ygas (Nm3/kg) = Qgas (L/min) ÷ mfeeding(g/min)
ηCGE(%) = (LHVgas(kJ/m3) × Ygas(m3/kg) ÷ LHV of feedstock(kJ/kg)) × 100
ηCCR(%) = 12 × Ygas × (CO + CO2 + CH4 + 2 × C2H6 + 2 × C3H8) ÷ (22.4 × C)

3. Results and Discussion

3.1. Characteristics of Feedstocks

Table 4 shows the experimental results of physicochemical characteristic analyses on different feedstocks. In the case of sawdust, typical woody biomass characteristics such as high oxygen content, low moisture and low ash content were observed. The volatile component of sawdust was highest among the feedstocks. As a basic characteristic that directly affects the gas yield by gasification. However, the lower heating value (LHV) was 14.73 MJ/kg, which was the lowest among the three feedstocks.
Fluff type SRF showed the highest sulfur content, which is known as a source of gaseous pollutants in the gasification process. The results of elemental analysis depicted high oxygen and carbon content, similar to those of wood-based biomass. This is because one of the main composition of waste SRF’s is woody biomass such as waste wood, paper, etc. Proximate analysis results showed a drawback in the form of moisture content, as high moisture content reduces the gasification applicability. However, the LHV of the SRF was higher than biomass.
In the case of coal, higher carbon and fixed carbon content were observed compared to the other two feedstocks. As a result, the highest calorific value was observed for coal. However, characteristics such as low volatile components are expected to act as a disadvantage when applying the gasification process.
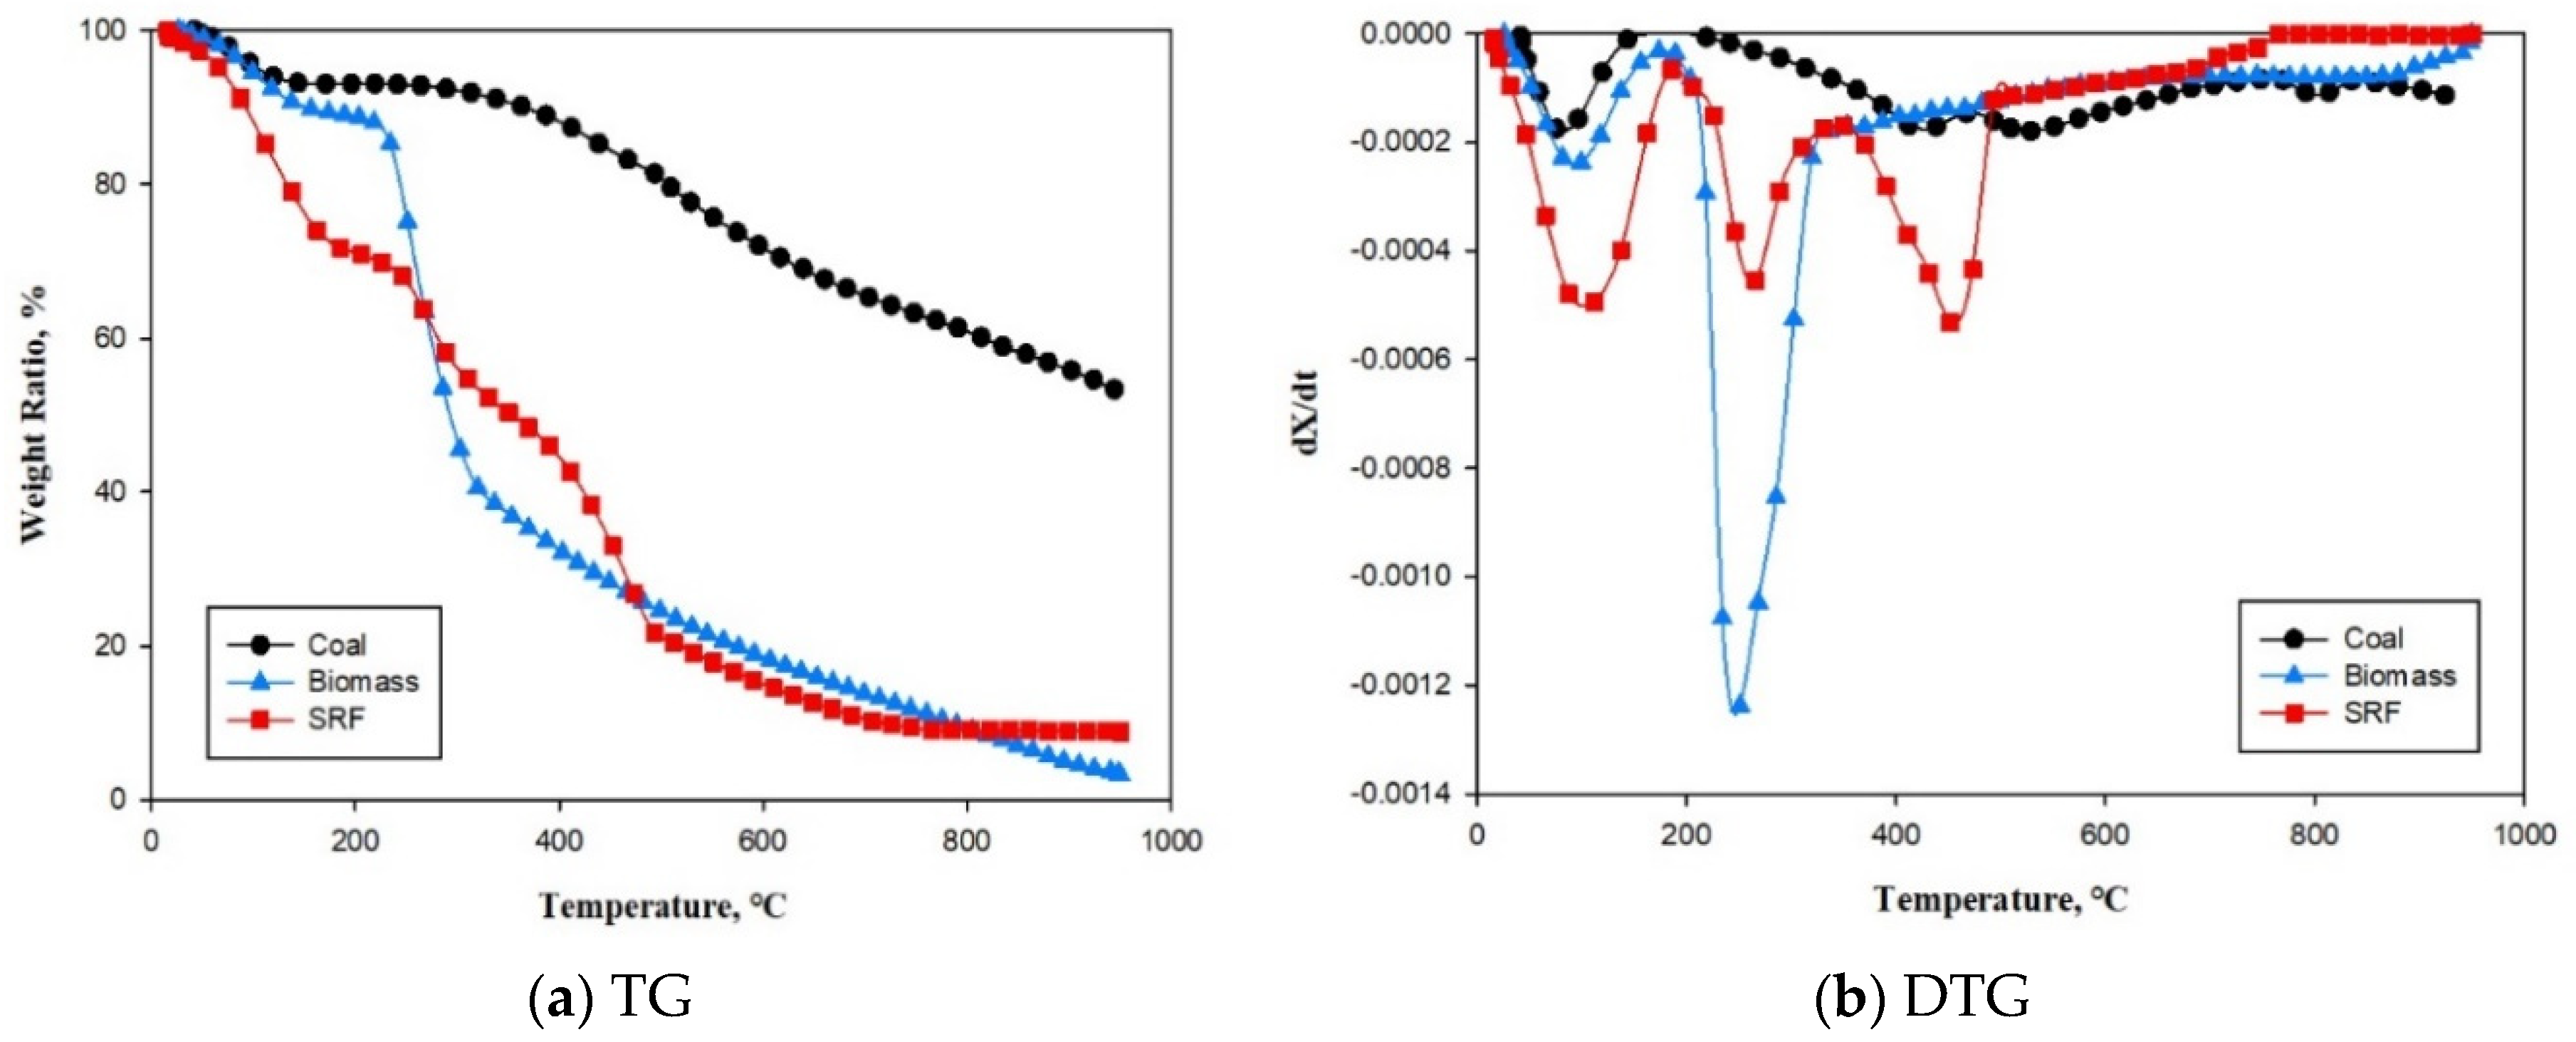
Figure 6 illustrates the thermo-gravimetric (TG) and derivatives of TG (DTG) curves obtained through TG analysis of sawdust, SRF and coal. In the case of sawdust, due to the vaporization of moisture, the drying peak was observed around 100 °C, and the de-volatilization section appeared between 200 and 400 °C temperature ranges. Overall, sawdust showed relatively homogeneous properties as a single sample. However, for fluff SRF, a high moisture peak was observed due to its high moisture content, and a loss section has appeared at different temperatures zone. Thus, it was expected to have a relatively wide range of operating temperatures when applying the gasification process. In the case of coal, compared with other samples, the reduction rate was not high, but there were three reduction peaks. The DTG curve shows a peak in moisture reduction around 100 °C, and it appears that primary de-volatilization occurs at 420 °C and secondary de-volatilization occurs at 590 °C. Furthermore, the volatile substance in the form of C, H, O compounds and light species was mainly emitted in the 350–500 °C temperature ranges. Besides, the release of tar and hydrocarbons were observed between the 500 and 600 °C temperature zone. The third peak, occurring at temperatures higher than 650 °C corresponds mainly to condensation of the carbon matrix, with the evolution of secondary gases leading to the formation of char [25].

3.2. Syngas Composition

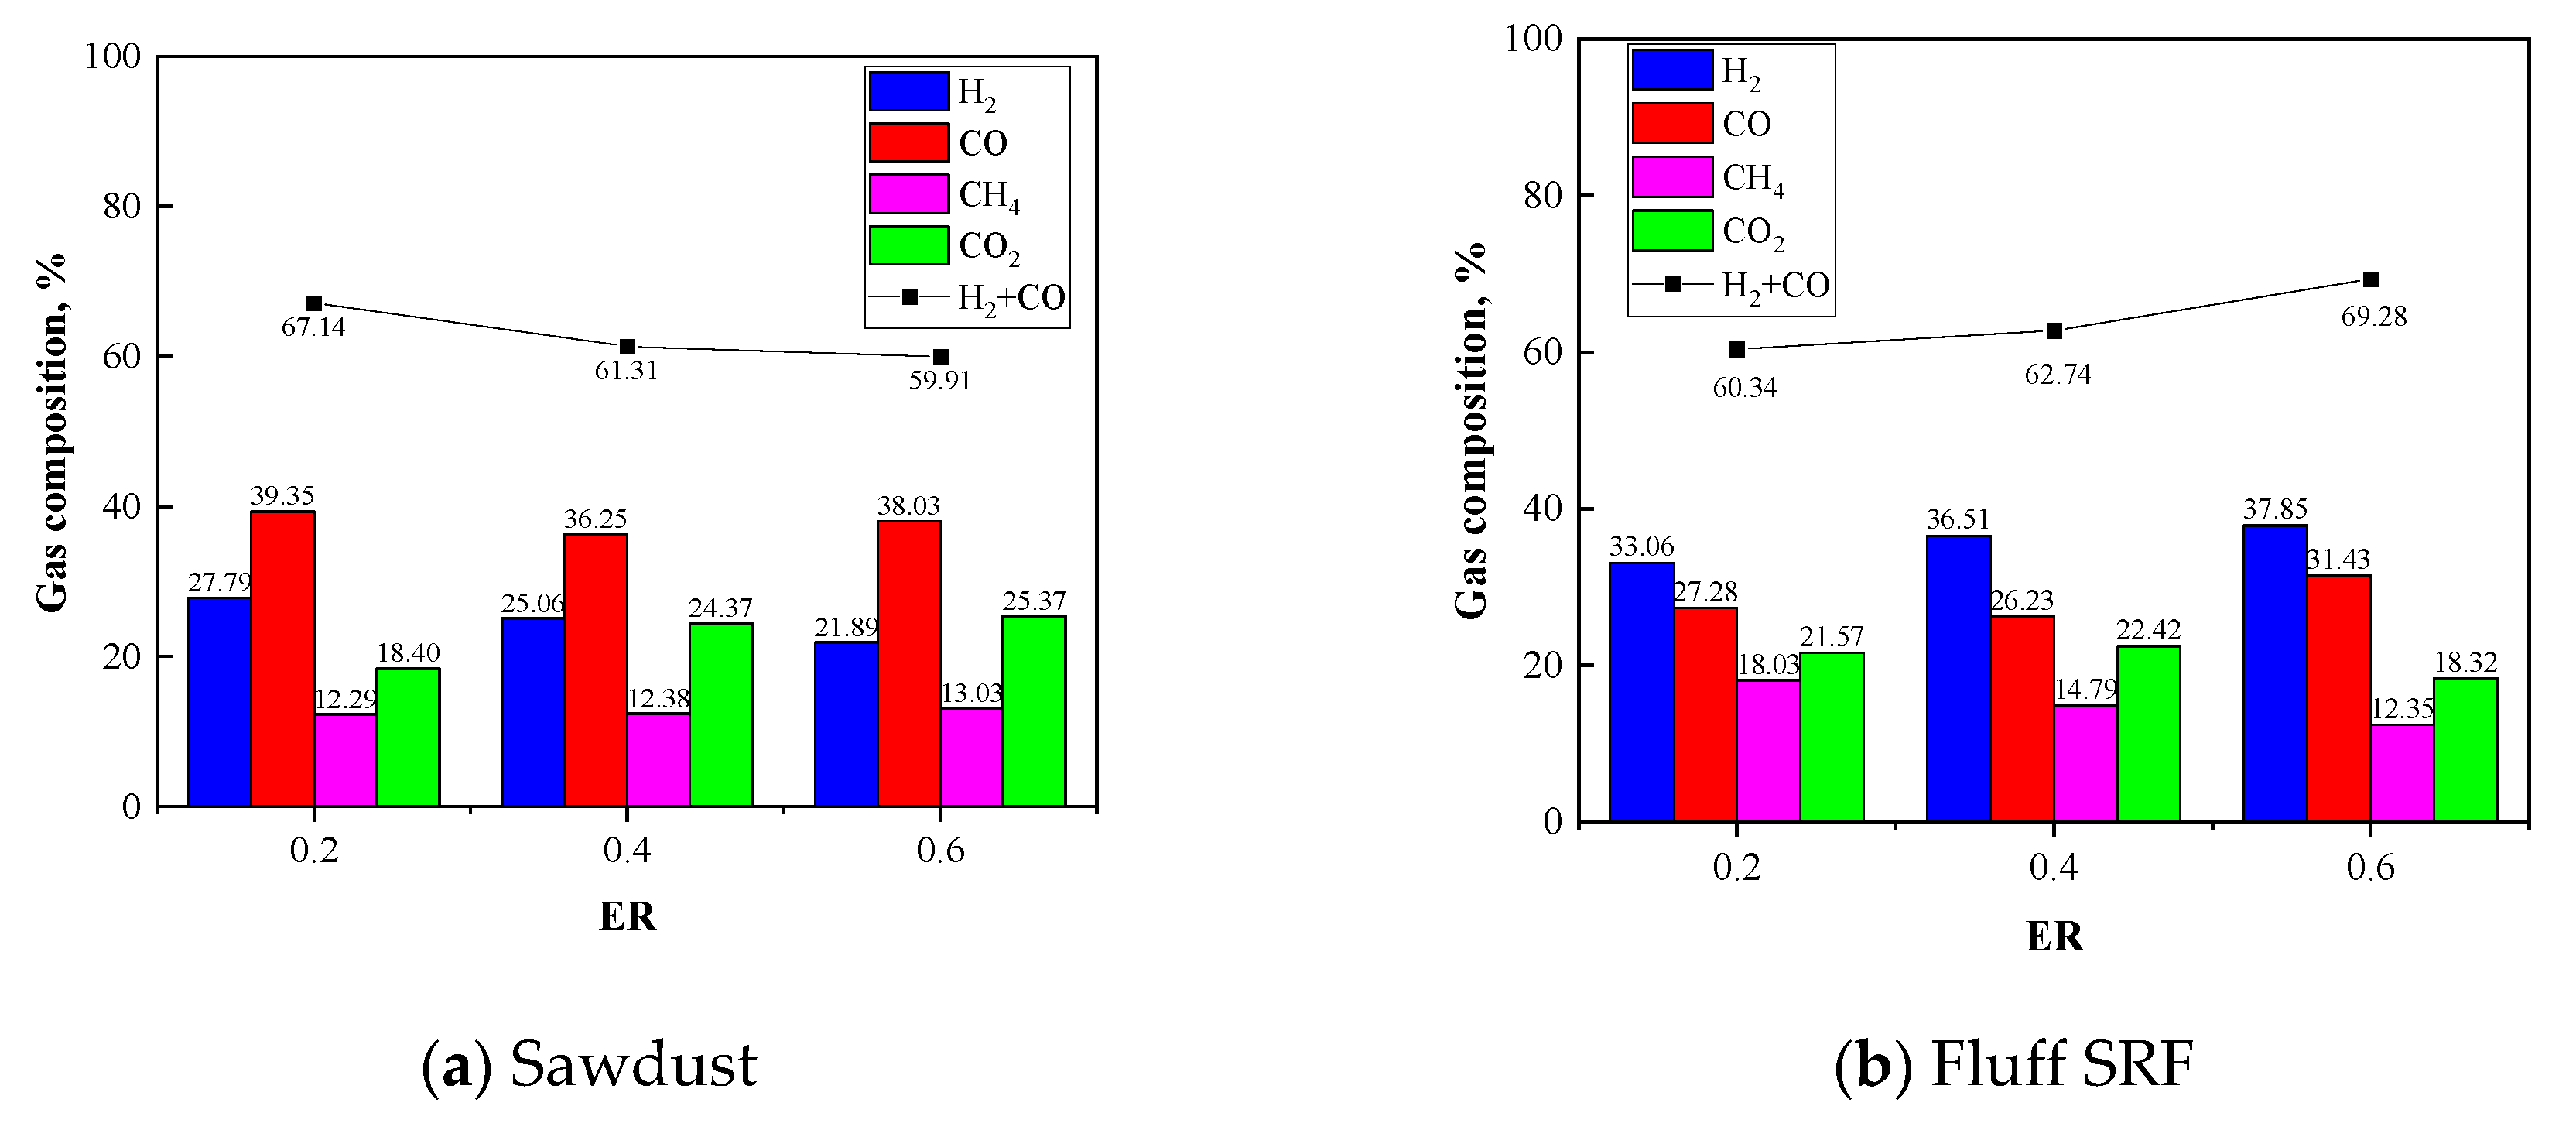
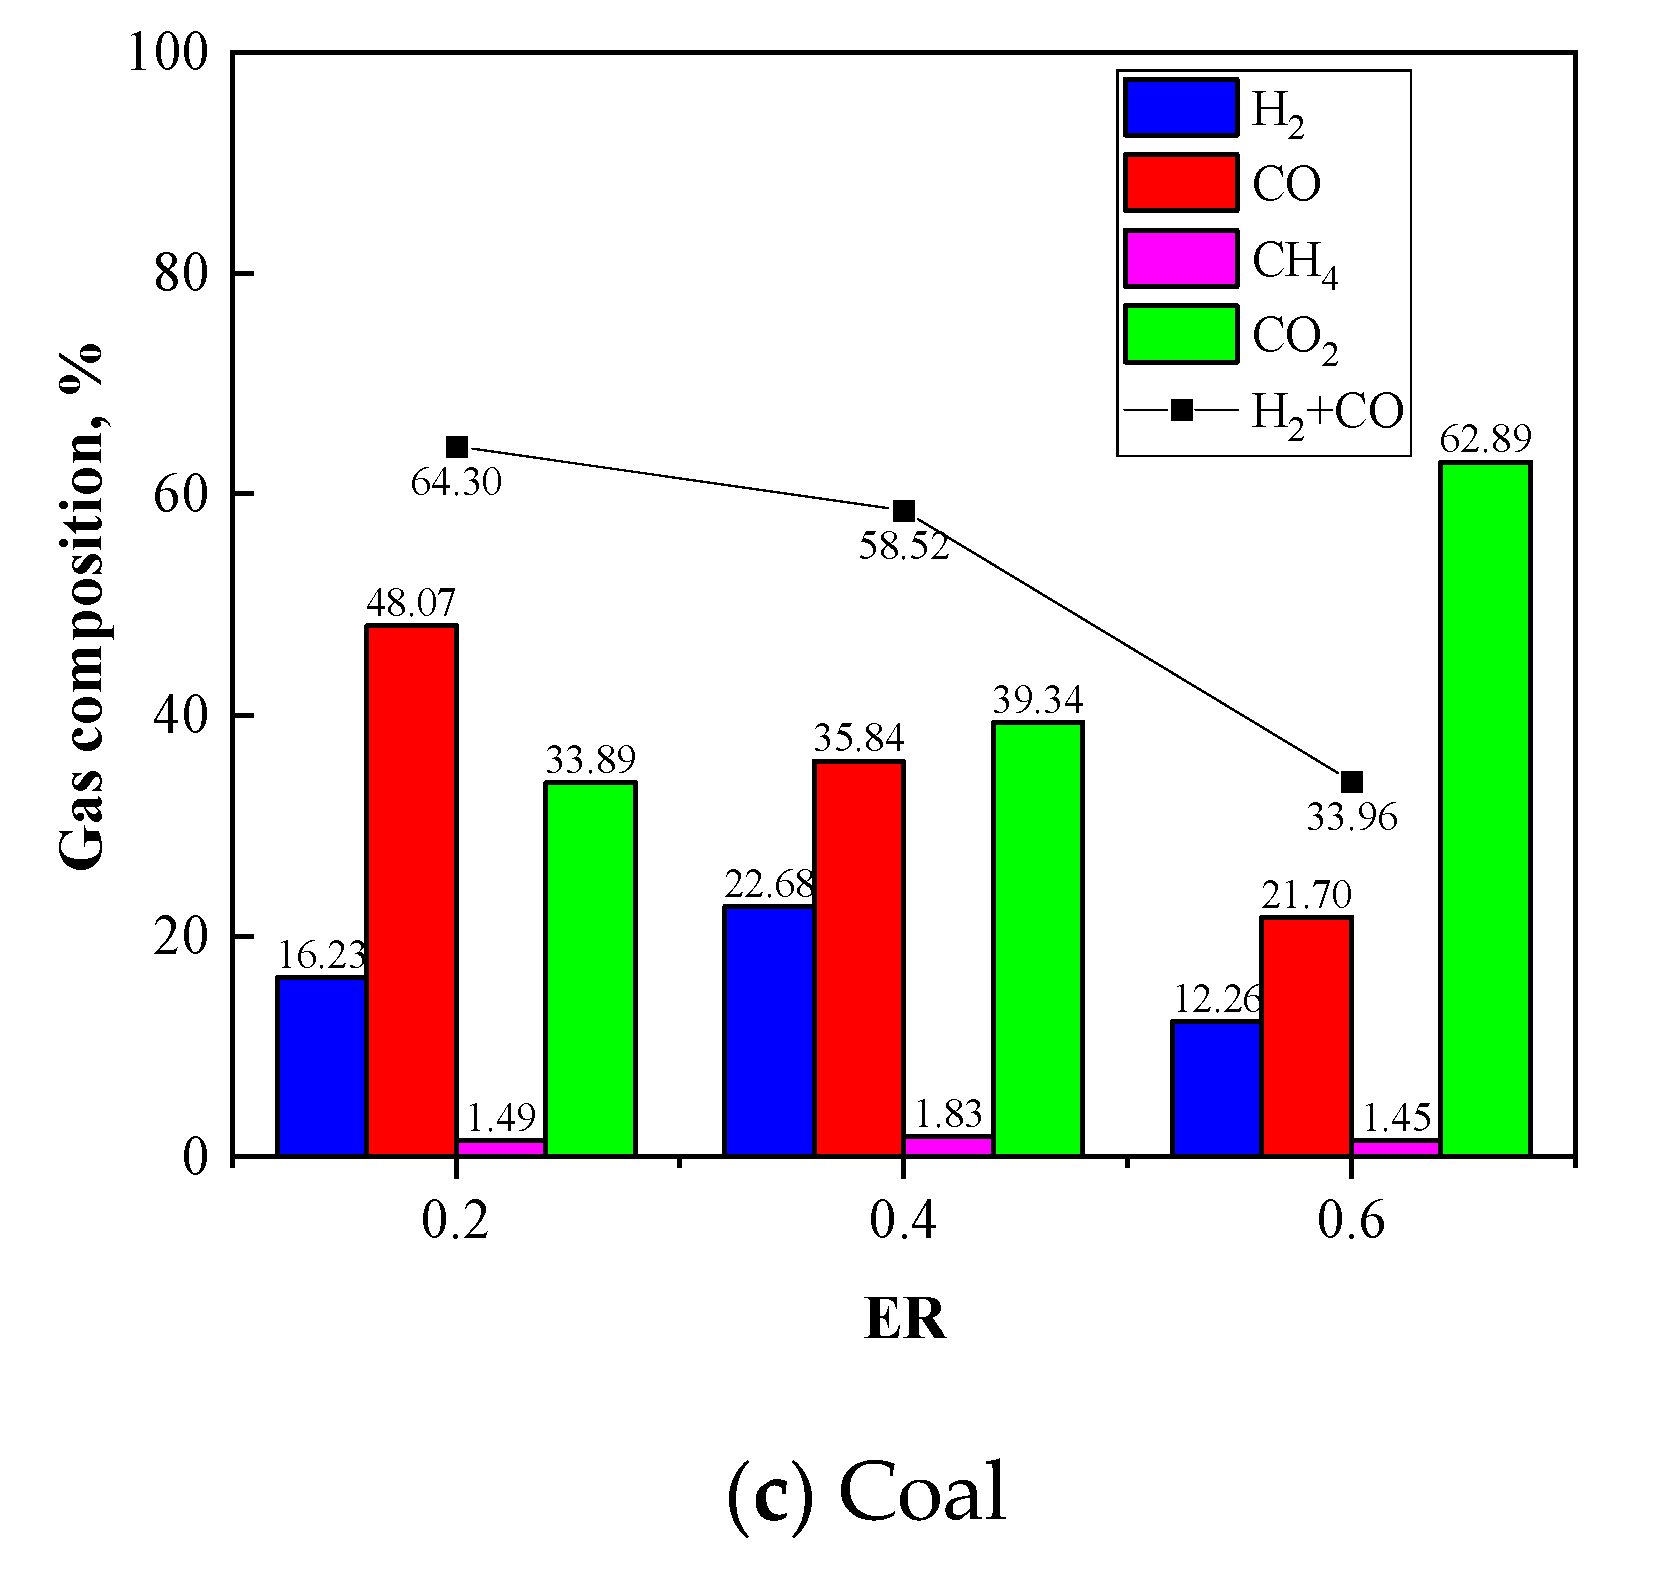
Figure 7 shows the composition of the syngas (H2 + CO) and remaining gases (N2 free base) for the sawdust, coal and fluff SRF gasification process. The content of the syngas produced in the gasification process using sawdust showed a similar value to that of the gasification process using SRF. Moreover, compared to coal gasification, the gasification process using SRF showed more stable syngas production. The average syngas content was 62.79 vol.% in sawdust gasification, 52.26 vol.% in coal gasification and 64.12 vol.% in SRF gasification. Generally, efficiencies and syngas production rate from coal gasification with entrained flow gasifier shows higher value compared to other feedstocks [26,27]. However, in this study coal gasification showed lower syngas yield and efficiencies than typical coal gasification. This is because a fixed bed gasifier was used in this study instead of a fluidized bed gasifier. Following the detailed results of the syngas composition, the H2 concentration of syngas was higher than CO in the case of SRF only. This is because SRF had high moisture contents and this point influenced the water gas shift reaction (CO + H2O → CO2 + H2). Thus, the above-mentioned result was observed. In the case of coal gasification, the H2/CO ratio was the lowest value due to the high carbon contents of coal. Besides, the CO content in the syngas showed a higher value than that of sawdust, and the opposite tendency was observed in the case of H2. These results could be elucidated by the C/H (carbon to hydrogen) ratio of the feedstocks. C/H ratio of sawdust was 7.86 which was similar to general woody biomass and the C/H ratio of fluff SRF was 6.75, respectively.
The oxygen content of sawdust was higher than that of fluff SRF, thus, it can be predicted that more carbon monoxide would be produced by enhanced partial oxidation during the gasification process. The oxygen content of the sawdust is 47.23 vol.%, a relatively high value compared to the fluff SRF with 30.83 vol.% oxygen content. This shows that R1 (C + CO2 ↔ 2CO + 172 kJ/mol, Boudouard reaction) and R4 (C + 0.5O2 → CO − 111 kJ/mol) occur strongly during the gasification reaction, indicating high CO and CO2 composition in sawdust gasification. As the ER was changed, it was found that the variation in the results of coal gasification was considerably larger than that of sawdust and SRF. Besides, biomass gasification showed a higher concentration of CO than other feedstocks. This is because CO produces more predominantly than H2 during biomass gasification.
In the case of coal gasification, it can be seen that the variation is quite large compared to other feedstock as the ER changes. Besides, the overall tendency of coal gasification showed worse syngas production viability compared to biomass and SRF. This is due to the limitation of the gasifier used in this study for coal gasification. This could be seen as the dominant generation of CO over H2 among synthetic gases by a higher C/H ratio than biomass and SRF.
Figure 8 depicts the product gas composition from the typical biomass gasification process with the alteration of the ER. In this study, each feedstock shows a different tendency with the alteration of the ER. In the case of typical biomass gasification (as shown in Figure 8), the hydrogen and carbon monoxide contents were decreased, and the carbon dioxide was increased with increasing ER. Similar results were observed in this study for sawdust gasification. However, the results from SRF gasification showed reverse tendencies; this is because the fluff SRF had low reactivity in thermal conversion. Thus, it could be assumed that the optimum ER of the gasification process was higher than the typical gasification process for overcoming low reactivity.

3.3. Gasification Efficiency

As previously stated, ηCGE, ηCCE and Ygas were calculated using various equations to evaluate gasification performance. Figure 9 illustrates the gasification characteristics of sawdust, coal and fluff SRF. However, the results of coal gasification were substituted with the reference data, whose experimental condition was similar to our study [12]. Generally, for coal gasification, an entrained flow gasifier or fluidized bed gasifier has been used. Fixed bed gasifiers are not preferred in coal gasification, due to its low product gas yield by low reactivity of coal. Because of these reasons, experimental data from fixed bed coal gasification were not reported in Figure 9, rather a standard coal gasification result was reported from reference [26].
When compared, the gasification characteristics of sawdust showed a higher Ygas yield compared to the other feedstocks and the efficiency is high because it directly affects ηCGE and ηCCE. However, in this study, the efficiency of waste gasification was found relatively lower compared to commercial waste gasification facilities. This is because the gasification process utilized in this study was conducted in a fixed bed reactor rather than a reactor designed considering high moisture and low reactivity of waste [28]. However, in the case of ηCGE, it can be assumed that there will be sufficient applicability as it shows a difference of 10% or less depending on the feedstock. Thus, if the goal is to produce electricity using gas engines and turbines that utilize syngas heating rather than processes that require high carbon conversion rates, such as chemical production, this plant can be utilized for power generation.
Again, as the ER increases, the amount of the oxidizing agent increases, and the overall gas yield increases as a result of these effects. However, as the amount of N2 in the product gas increases, the overall LHVgas tends to decrease. The optimum ER condition showed the optimum result under the ER value 0.4, which is similar for both sawdust and SRF gasification. In the case of coal gasification, it shows similar efficiencies between ER 0.4 and 0.6 from reference data [26].
Tar can be defined as condensable heavy hydrocarbon gases and it damages pipe or purification systems [29]. Therefore, C2 and C3 gases have similar characteristics to the emission characteristics of tar during the gasification process [23]. The gas content of C2 and C3 was 1.94 vol.% for sawdust gasification and 0.05 vol.% for fluff SRF, showing a significant difference. This shows that the lignin component, which was the main component of woody biomass, helps to combine C and H, resulting in a large amount of tar [30,31,32]. LHVgas was able to identify only minor differences in the sawdust and fluff SRF gasification, with 12.17 MJ/Nm3 and 12.61 MJ/Nm3, respectively. In the case of coal gasification from reference, LHVgas was 5.31−6.03 MJ/m3 including N2 composition in the product gas.
As ERs increased, C2 and C3 gas composition tended to decrease, and LHVgas showed the same trend. These results suggest that as ER increases, the oxidation response during the gasification reaction is dominant, helping to degrade the tar containing C2 and C3. Thus, it can be said that the relatively continuous decrease in LHVgas is due to the reduction of gas from high hydrocarbon components.
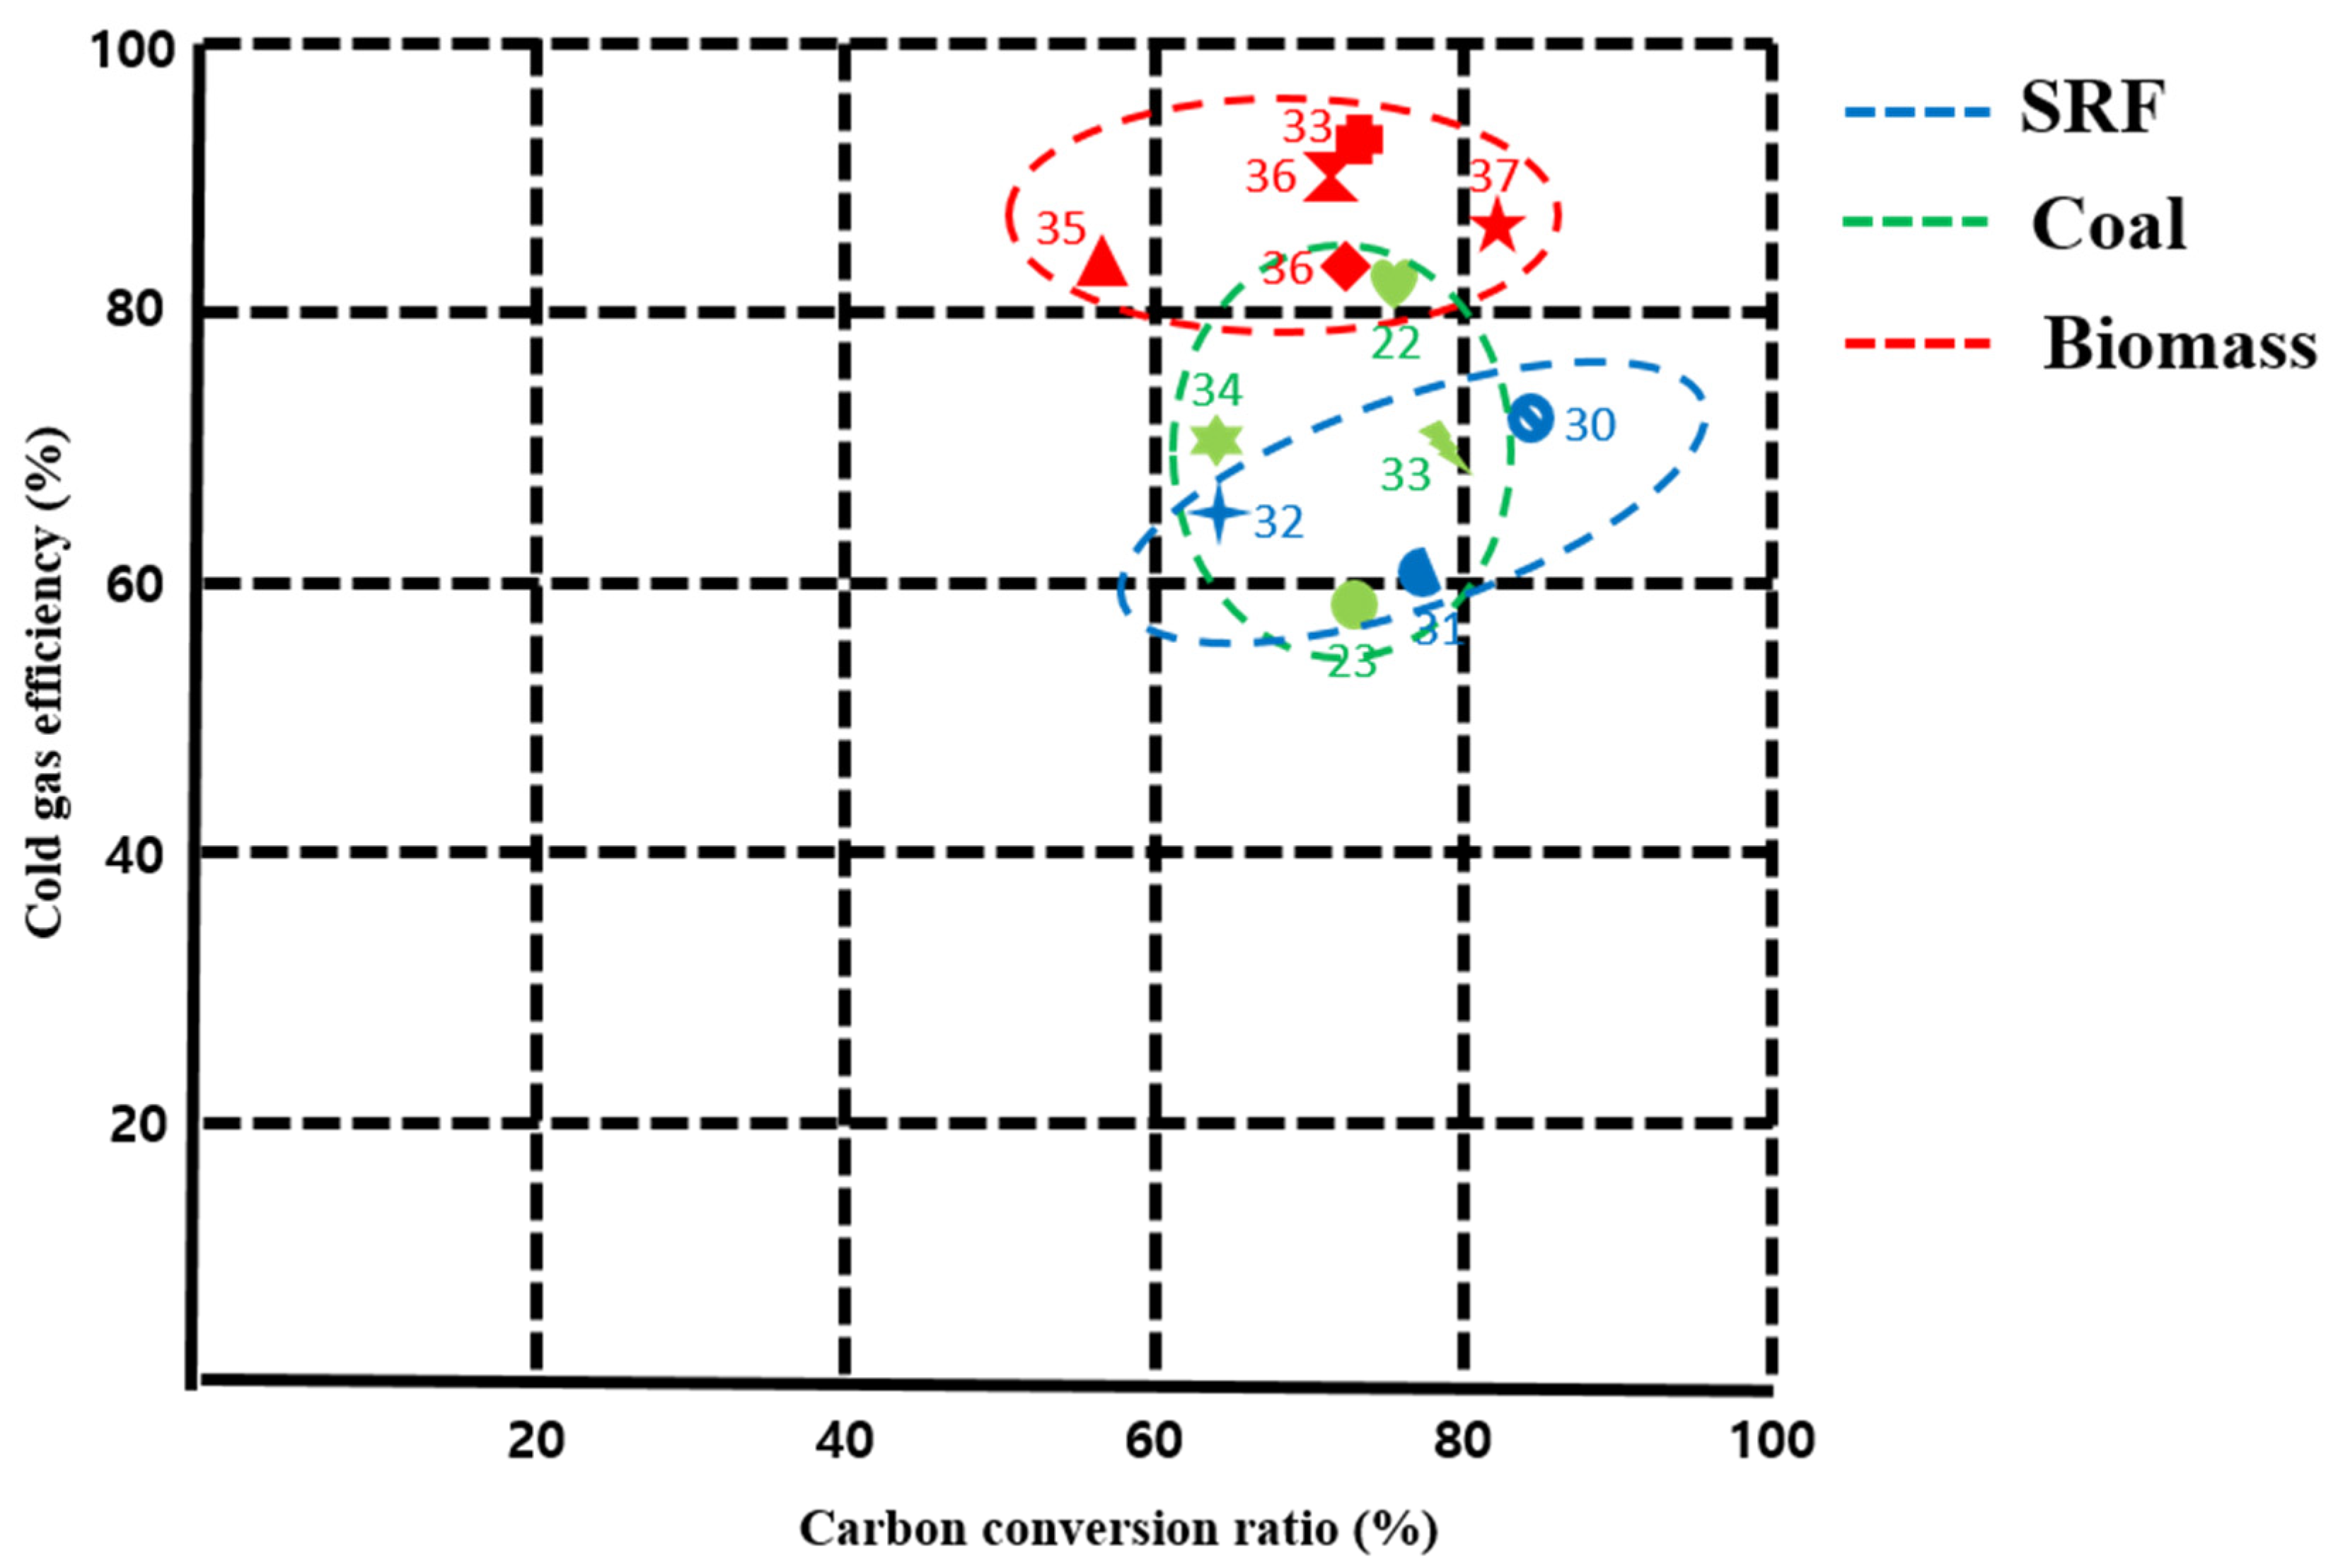
Figure 10 illustrates the results of gasification efficiencies observed in this study, as well as comparing the results with previous studies. The ηCGE ranged between 80% and 95% for biomass gasification, 60% and 80% for fluff SRF, and 60% and 80% for coal. Furthermore, the ηCCE range of biomass gasification was 60–80%, for fluff SRF 60–85% and 60–80% for coal, respectively. Following these results, biomass was found to be the prevalent feedstock for the gasification process. Furthermore, for some cases of SRF manufactured from MSW showed better efficiencies than coal gasification. Of course, SRF gasification has drawbacks including economic feasibility and is considered to be an undesired facility by local residents. However, the SRF gasification process involved in this study can be operated as a substitution of the traditional thermal process like an incinerator. To verify the repeatability of this work, we have also conducted experiments in a semi-commercial scale gasification process and operated it for 14 days continuously. Similar results were observed in the continuous operation process, which justifies the repeatability of this work. Further information about the continuous operation process can be found in the following reference [33].

4. Conclusions

In this study, the gasification characteristics of Korean municipal waste derived SRF was assessed and compared with other solid fuels (coal and biomass). To evaluate the gasification performance, a lab-scale gasification process was operated at elevated temperatures by varying ERs. Various gasification performance parameters were also analyzed and compared with the commercialized facilities. The key findings that came through this study are summarized below.
Korean municipal waste derived SRF showed relatively a good performance during gasification as compared with other feedstocks. In particular, 50.94% cold gas efficiency and 54.66% carbon conversion ratio with a lower heating value of 12.57 MJ/Nm3 was achieved by gasifying the SRF at 900 °C and ER 0.4. However, it was less efficient than the biomass gasification process, due to the heterogeneity of the samples used for gasification. Despite these shortcomings, it is clear that if proper research and development (R&D) activities are conducted on the SRF gasification, there would be a possibility of commercialization in the near future. Certainly, gasification of MSW-derived SRF would serve the purpose of energy harvesting from waste as well as reducing the problem of proper waste disposal. However, two drawbacks (tar and low syngas efficiency) must be resolved in order to commercialize the gasification process for the SRF. By operating the gasification processes at high temperatures both problems can be resolved at the same time. High-temperature operation of the gasifier would destruct the tar emitted during the gasification as well as increase the syngas efficiency. Finally, it can be concluded that MSW derived SRF could be a good substitute for fossil fuels in the future if the proper emphasis is given.

Author Contributions

All the authors have contributed substantially to the work reported. The project was designed by S.Y.L. and S.W.P.; experimentation was done by S.Y.L., D.H.C., G.H.H. and S.W.P. The initial manuscript was prepared by S.Y.L., M.T.A., and S.W.P., revised by M.T.A. and S.W.P. This work was supervised by S.W.P. All the authors were equally responsible for finalizing the manuscript for submission. All authors have read and agreed to the published version of the manuscript.

Funding

This research received no external funding.

Acknowledgments

The authors would like to thank Anthony De Girolamo for his constructive comments and suggestion on the manuscript.

Conflicts of Interest

The authors declare no conflict of interest.

References

  1. Lee, S.K.; Mogi, G.; Kim, J.W. Energy technology roadmap for the next 10 years: The case of Korea. Energy Policy 2009, 37, 588–596. [Google Scholar] [CrossRef]
  2. Park, S.-W.; Lee, J.-S.; Yang, W.-S.; Alam, M.T.; Seo, Y.-C. A Comparative Study of the Gasification of Solid Refuse Fuel in Downdraft Fixed Bed and Bubbling Fluidized Bed Reactors. Waste Biomass Valorization 2020, 11, 2345–2356. [Google Scholar] [CrossRef]
  3. Yang, W.-S.; Park, J.-K.; Park, S.-W.; Seo, Y.-C. Past, present and future of waste management in Korea. J. Mater. Cycles Waste Manag. 2015, 17, 207–217. [Google Scholar] [CrossRef]
  4. Bourtsalas, A.T.; Seo, Y.; Alam, M.T.; Seo, Y.-C. The status of waste management and waste to energy for district heating in South Korea. Waste Manag. 2019, 85, 304–316. [Google Scholar] [CrossRef] [PubMed]
  5. Park, S.; Lee, J.; Yang, W.; Kang, J.; Sung, J.; Alam, M.; Seo, Y.; Rao, C.; Saravanakumar, A.; Kumar, K.V. For waste to energy, assessment of fluff type solid refuse fuel by thermal characteristics analyses. Procedia Environ. Sci. 2016, 35, 498–505. [Google Scholar] [CrossRef]
  6. Seo, Y.-C.; Alam, M.T.; Yang, W.-S. Gasification of municipal solid waste. Gasif. Low-Grade Feedstock 2018. [Google Scholar] [CrossRef] [Green Version]
  7. Shahabuddin, M.; Alam, M.T.; Krishna, B.B.; Bhaskar, T.; Perkins, G. A review of producing renewable aviation fuels from the gasification of biomass and residual wastes. Bioresour. Technol. 2020. [Google Scholar] [CrossRef] [PubMed]
  8. Rezaiyan, J.; Cheremisinoff, N.P. Gasification Technologies: A Primer for Engineers Scientists; CRC Press: Boca Raton, FL, USA, 2005. [Google Scholar]
  9. Ansa, J.R. Gasification of Biomass and Solid Recovered Fuels (SRFs) for the Synthesis of Liquid Fuels. Ph.D. Thesis, Universitat Rovira i Virgili, Tarragona, Spain, 2017. [Google Scholar]
  10. Higman, C. State of the Gasification Industry: Worldwide Gasification and Syngas Databases 2016 Update. Available online: https://www.globalsyngas.org/uploads/downloads/2016-Wed-Higman.pdf (accessed on 20 September 2020).
  11. Alam, M.T.; Dai, B.; Wu, X.; Hoadley, A.; Zhang, L. A critical review of ash slagging mechanisms and viscosity measurement for low-rank coal and bio-slags. Front. Energy 2020. [Google Scholar] [CrossRef]
  12. Oh, G.; Jang, J.Y.; Ra, H.W.; Seo, M.W.; Mun, T.Y.; Lee, J.-G.; Yoon, S.J. Gasification of Coal and Torrefied Biomass Mixture. Trans. Korean Hydrog. New Energy Soc. 2017, 28, 190–199. [Google Scholar]
  13. Smoot, L.D.; Smith, P.J. Coal Combustion and Gasification; Springer: Berlin/Heidelberg, Germany, 2013. [Google Scholar]
  14. Tekin, K.; Karagöz, S.; Bektaş, S. A review of hydrothermal biomass processing. Renew. Sustain. Energy Rev. 2014, 40, 673–687. [Google Scholar] [CrossRef]
  15. Corey, R.C. Principles and Practices of Incineration; John Wiley & Sons: Hoboken, NJ, USA, 1969. [Google Scholar]
  16. Tillman, D.A. Wood as an Energy Resource; Elsevier: Amsterdam, The Netherlands, 2012. [Google Scholar]
  17. Basu, P. Biomass Gasification and Pyrolysis: Practical Design and Theory; Academic Press: Cambridge, MA, USA, 2010. [Google Scholar]
  18. Constantinescu, M.; Bucura, F.; Ionete, E.I.; Ion-Ebrasu, D.; Sandru, C.; Zaharioiu, A.; Marin, F.; Miricioiu, M.G.; Niculescu, V.C.; Oancea, S. From Plastic to Fuel-New Challenges. Mater. Plast. 2019, 56, 721. [Google Scholar] [CrossRef]
  19. Alam, M.T.; Park, S.-W.; Lee, S.-Y.; Jeong, Y.-O.; Girolamo, A.D.; Seo, Y.-C.; Choi, H.S. Co-Gasification of Treated Solid Recovered Fuel Residue by Using Minerals Bed and Biomass Waste Blends. Energies 2020, 13, 2081. [Google Scholar] [CrossRef] [Green Version]
  20. Machin, E.B.; Pedroso, D.T.; Proenza, N.; Silveira, J.L.; Conti, L.; Braga, L.B.; Machin, A.B. Tar reduction in downdraft biomass gasifier using a primary method. Renew. Energy 2015, 78, 478–483. [Google Scholar] [CrossRef]
  21. Bockelie, M.J.; Denison, M.K.; Chen, Z.; Linjewile, T.; Senior, C.L.; Sarofim, A.F.; Holt, N. CFD Modeling for Entrained Flow Gasifiers. In Proceedings of the ACERC Annual Conference, Provo, UT, USA, 17–18 February 2005; pp. 18–19. [Google Scholar]
  22. Lee, S.Y.; Park, S.W.; Alam, M.T.; Jeong, Y.O.; Seo, Y.-C.; Choi, H.S. Studies on the gasification performance of sludge cake pre-treated by hydrothermal carbonization. Energies 2020, 13, 1442. [Google Scholar] [CrossRef] [Green Version]
  23. Park, S.-W.; Lee, J.-S.; Yang, W.-S.; Alam, M.T.; Seo, Y.-C.; Lee, S.-Y. Gasification characteristics of biomass for tar removal by secondary oxidant injection. J. Mater. Cycles Waste Manag. 2018, 20, 823–831. [Google Scholar] [CrossRef]
  24. Yang, W.-S.; Lee, J.-S.; Park, S.-W.; Kang, J.-J.; Alam, T.; Seo, Y.-C. Gasification applicability study of polyurethane solid refuse fuel fabricated from electric waste by measuring syngas and nitrogenous pollutant gases. J. Mater. Cycles Waste Manag. 2016, 18, 509–516. [Google Scholar] [CrossRef]
  25. Vamvuka, D.; Kastanaki, E.; Lasithiotakis, M. Devolatilization and combustion kinetics of low-rank coal blends from dynamic measurements. Ind. Eng. Chem. Res. 2003, 42, 4732–4740. [Google Scholar] [CrossRef]
  26. Xiao, X.; Wang, X.; Zheng, Z.; Qin, W.; Zhou, Y. Catalytic coal gasification process simulation with alkaline organic wastewater in a fluidized bed reactor using Aspen Plus. Energies 2019, 12, 1367. [Google Scholar] [CrossRef] [Green Version]
  27. Zhang, H.; Guo, X.; Zhu, Z. Effect of temperature on gasification performance and sodium transformation of Zhundong coal. Fuel 2017, 189, 301–311. [Google Scholar] [CrossRef]
  28. Li, X.; Grace, J.; Lim, C.; Watkinson, A.; Chen, H.; Kim, J. Biomass gasification in a circulating fluidized bed. Biomass Bioenergy 2004, 26, 171–193. [Google Scholar] [CrossRef]
  29. Cao, Y.; Wang, Y.; Riley, J.T.; Pan, W.-P. A novel biomass air gasification process for producing tar-free higher heating value fuel gas. Fuel Process. Technol. 2006, 87, 343–353. [Google Scholar] [CrossRef]
  30. Hosoya, T.; Kawamoto, H.; Saka, S. Pyrolysis gasification reactivities of primary tar and char fractions from cellulose and lignin as studied with a closed ampoule reactor. J. Anal. Appl. Pyrolysis 2008, 83, 71–77. [Google Scholar] [CrossRef]
  31. Yu, H.; Zhang, Z.; Li, Z.; Chen, D. Characteristics of tar formation during cellulose, hemicellulose and lignin gasification. Fuel 2014, 118, 250–256. [Google Scholar] [CrossRef]
  32. Palma, C.F. Modelling of tar formation and evolution for biomass gasification: A review. Appl. Energy 2013, 111, 129–141. [Google Scholar] [CrossRef]
  33. Park, S.-W.; Seo, Y.-C.; Lee, S.-Y.; Yang, W.-S.; Oh, J.-H.; Gu, J.-H. Development of 8 ton/day gasification process to generate electricity using a gas engine for solid refuse fuel. Waste Manag. 2020, 113, 186–196. [Google Scholar] [CrossRef]
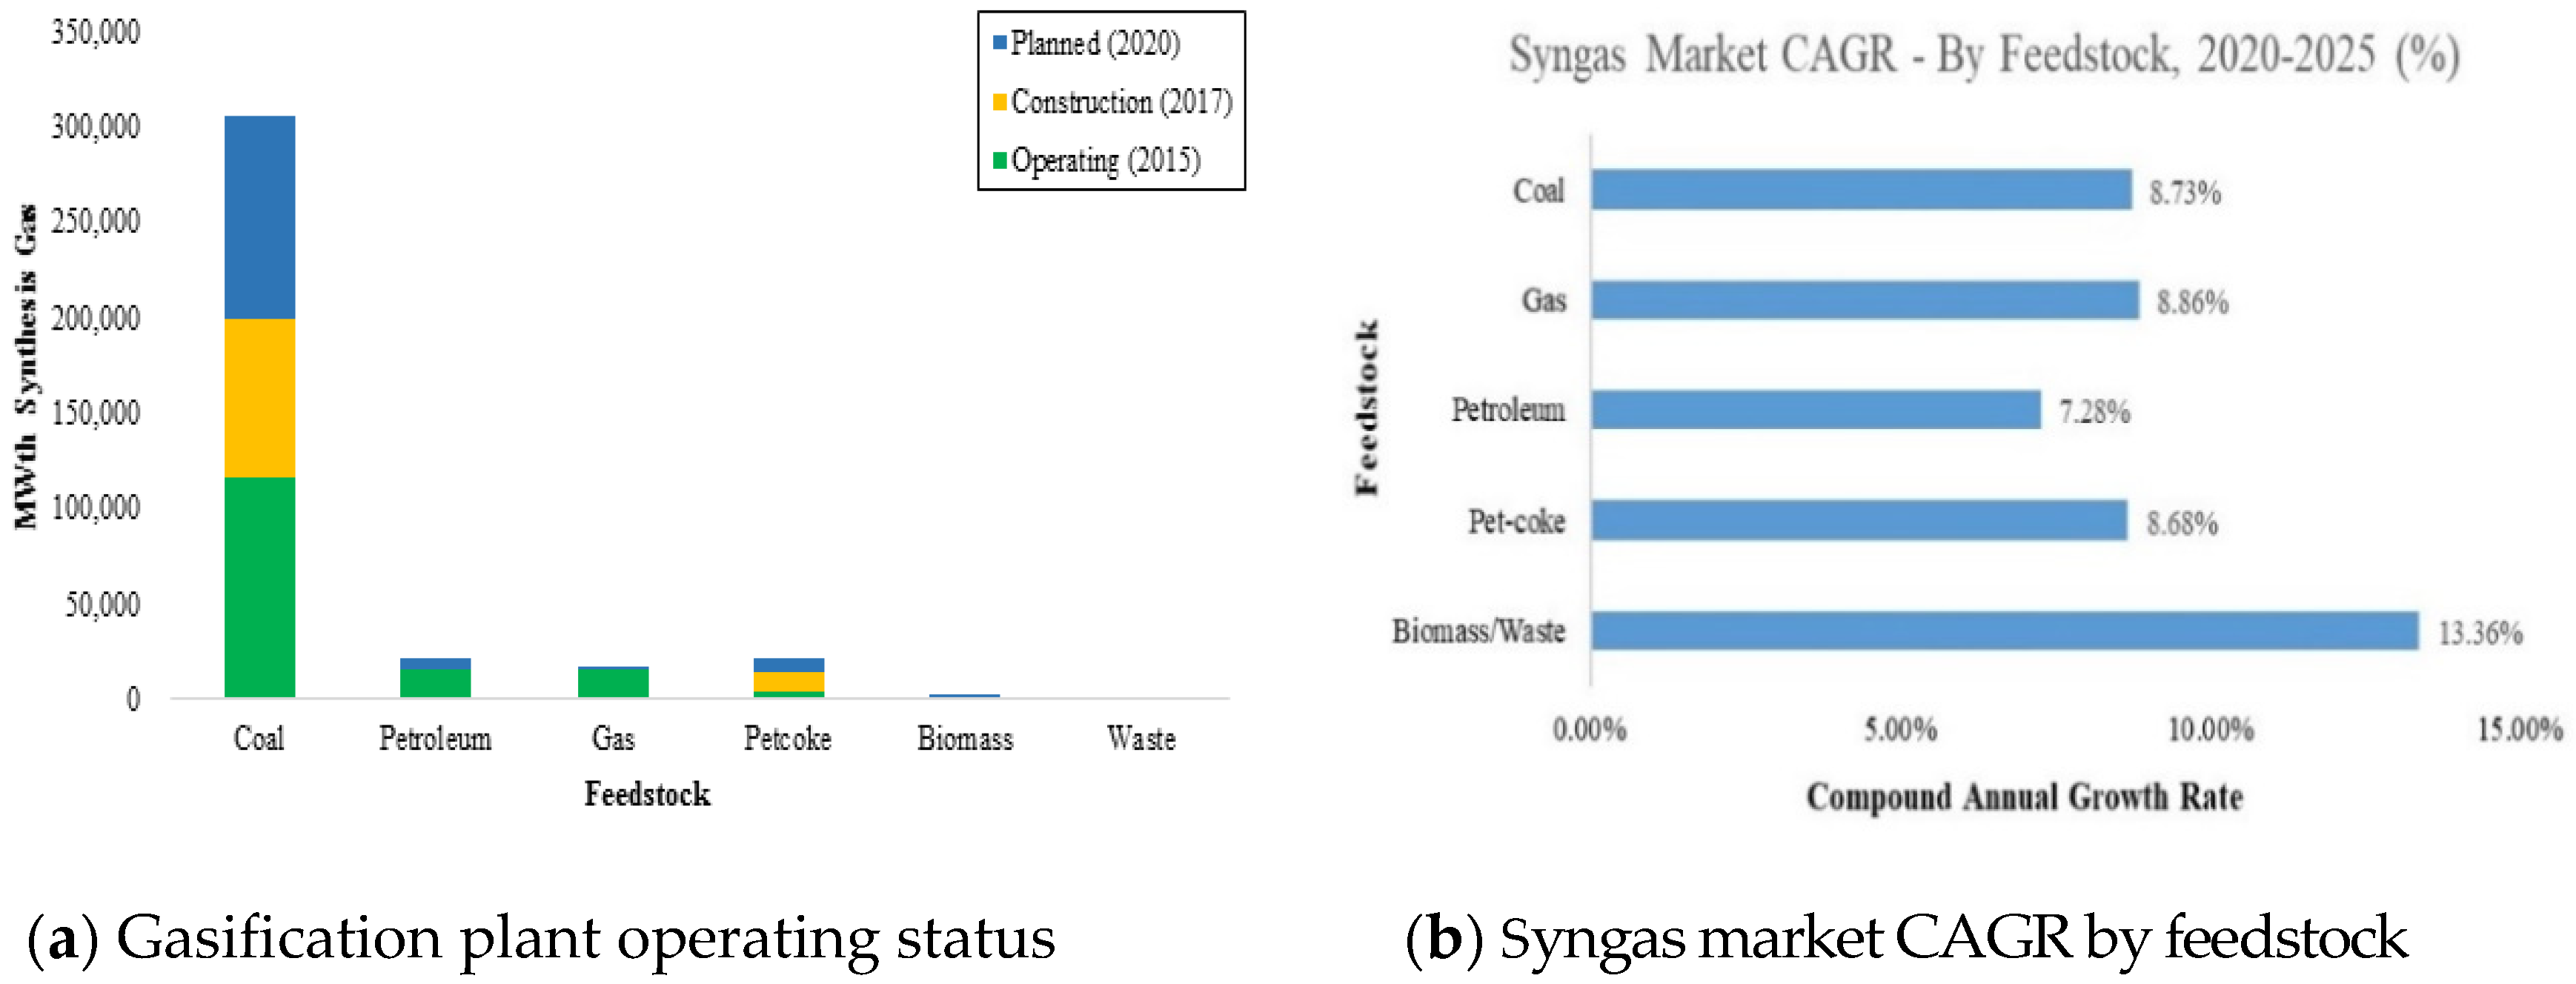
Figure 1. Status of gasification process by feedstock: (a) gasification plant operating status and (b) syngas market CAGR by feedstock.
Processes 08 01375 g001
Figure 2. Summary of classification of coal [12].
Processes 08 01375 g002
Figure 3. Outline of waste to energy technologies.
Processes 08 01375 g003
Figure 4. Schematic diagram of a lab-scale gasification unit.
Processes 08 01375 g004
Figure 5. Oxidant injection by swirl flow in fixed bed gasifier.
Processes 08 01375 g005
Figure 6. Thermal characteristics of sawdust, fluff solid recovered fuel (SRF), and coal: (a) thermogravimetric (TG) curve and (b) derivatives of thermogravimetric (DTG) curves.
Processes 08 01375 g006
Figure 7. Product gas compositions from (a) sawdust, (b) fluff solid recovered fuel (SRF) and (c) coal gasification process (N2-free basis).
Processes 08 01375 g007aProcesses 08 01375 g007b
Figure 8. Variation of equilibrium gas composition with air ratio (ER) for representative sawdust composition at a pressure of 1 atm (no steam was added). Note, solid lines denote 1000 K, dashed lines denote 1100 K. (Adapted from [28] with permission).
Processes 08 01375 g008
Figure 9. Gasification efficiency of (a) sawdust, (b) fluff SRF and (c) coal under different parameters [25].
Processes 08 01375 g009aProcesses 08 01375 g009b
Figure 10. Cold gas efficiency comparison between fluff SRF, biomass and coal.
Processes 08 01375 g010
Table 1. Elemental analysis of various feedstocks as compared with other fossil fuels [15,16,17,18].
ContentCHNSOHHV
Unit%MJ/kg
Maple50.606.000.300041.719.96
Douglas fir52.306.309.100040.521.05
Redwood53.505.900.100040.321.03
Straw-rice39.205.100.600.1035.815.21
Husk-rice38.505.700.500039.815.38
Paper43.405.800.300.2044.317.61
MSW47.606.001.200.3032.919.88
Animal waste42.705.502.400.3031.317.17
Peat54.505.101.650.4533.119.88
Lignite62.504.380.941.4117.217.17
Powder river basin coal65.804.880.861.0016.226.44
Anthracite83.701.900.900.7010.527.66
Pet coke82.000.500.700.8010.028.38
HDPE *86.209.550.160.0054.0946.13
LDPE **85.0714.270.160.0050.4946.08
PP ***85.4114.370.180.0050.0446.22
PS ****91.858.060.140.0050.1741.67
* HDPE—High density polyethylene, ** LDPE—Low density polyethylene, *** PP—Polypropylene, **** PS—Polystyrene.
Table 2. Physicochemical characteristic analyses methodologies and equipment.
AnalysisTargetEquipmentMethod
Elemental analysisC, H, N, SEA 1112
(Thermo Fisher Scientific)
* ASTM D 5373
Proximate analysisMoisture, Volatile, Fixed carbon, AshTGA-701 (LECO)ASTM D 3172
Heating value analysisHigher heating valueAC-600 (LECO)ASTM D 4809
Thermogravimetric analysisWeight changing by temperatureTGA-701 (LECO)ASTM E 1131
* ASTM—American society for testing and materials.
Table 3. Experimental conditions for gasification experiments.
ParameterUnitCondition
Feedstock-Sawdust, fluff SRF, coal
Temperature°C900
Gasifier type-Downdraft fixed bed
ER-0.2, 0.4, 0.6
Feeding rateg/min1
Particle size mm<10
Gasification agent-Air
Table 4. Physicochemical characteristics of different feedstocks used in this study.
AnalysisTargetSawdustFluff SRFCoal
Elemental analysis a
(wt.%)
C45.6651.8164.66
H5.817.684.35
N0.110.071.15
O47.2330.8311.64
SND0.070.59
Proximate analysis b
(wt.%)
Moisture3.1918.674.08
Volatile78.5770.8834.40
Fixed carbon17.092.9450.59
Ash1.157.5110.93
Lower heating value b
(MJ/kg)
Instrument14.7316.0226.92
Dulong’s equation14.2815.5525.18
a dry-basis; b as-received, ND—not detected.
Publisher’s Note: MDPI stays neutral with regard to jurisdictional claims in published maps and institutional affiliations.