Article

Nano-Intermediate of Magnetite Nanoparticles Supported on Activated Carbon from Spent Coffee Grounds for Treatment of Wastewater from Oil Industry and Energy Production

Grupo de Investigación en Fenómenos de Superficie Michael Polanyi, Facultad de Minas, Universidad Nacional de Colombia Sede Medellín, Kra 80 No. 65-223, Medellín 050034, Colombia
*
Authors to whom correspondence should be addressed.
Processes 2021, 9(1), 63; https://doi.org/10.3390/pr9010063
Submission received: 25 November 2020 / Revised: 16 December 2020 / Accepted: 19 December 2020 / Published: 30 December 2020
(This article belongs to the Special Issue Redesign Processes in the Age of the Fourth Industrial Revolution)

Abstract

:
This work focused on evaluating the adsorptive removal of crude oil using a nano-intermediate based on magnetite nanoparticles supported on activated carbon synthesized from spent coffee grounds and the subsequent catalytic oil decomposition to recover by-products and regenerate the support material. The magnetite nanoparticles were synthesized by the co-precipitation method and were used as active phases on prepared activated carbon. The amount of crude oil adsorbed was determined by adsorption isotherms. In addition, dynamic tests were performed on a packed bed to evaluate the efficiency of the removal process. Thermogravimetric analysis and mass spectrometry were used to evaluate the catalytic powder and the quantification of by-products. Contrasting the results with commercial carbon, the one synthesized from the coffee residue showed a greater affinity for the oil. Likewise, the adsorption capacity increased by doping activated carbon with magnetite nanoparticles, obtaining an efficiency greater than 10%. The crude oil decomposition was carried out successfully by thermal cracking, obtaining a 100% removal. The gas produced after decomposition contains light hydrocarbons such as C2H4 and CH4 and shows a decrease in polluting species such as CO and CO2, leading to greater environmental sustainability of the process.

1. Introduction

There is substantial water production during hydrocarbons extraction, attaining nine barrels of water per barrel of crude oil (water cut ≥ 0.9) [1,2]. Generally, this water reaches the surface contaminated by solids and emulsified oil [3,4]. The produced water cannot be stored for long periods due to costs and space availability. Therefore, its reinjection or dumping into water sources should be considered, while international standards for dumping and reinjection require low crude oil concentrations (≤10 mg L−1) [5,6]. Correct water treatment is required to comply with these requirements and reduce the damage to ecosystems and human health caused by the waste’s poor disposal [7,8]. In addition, many agents (natural or artificial) present in the reservoirs can stabilize oil-in-water emulsions (O/W) [9,10,11,12]. When stabilizing the emulsions, secondary and tertiary treatment stages are required for removing large, medium, small, and ultra-small oil droplets [3,13,14,15,16]. These stages include physical [13,17], chemical [3], biological [18], membranes [3,16,17], and adsorption treatments. In Colombia, for the adsorption of crude oil, agro-industrial residues are used, such as walnut or rice husks [19]. These materials present serious disadvantages during their implementation due to their complex cleaning and fast saturation system. To find an efficient and reusable treatment system, studies have been carried out to determine the viability of nanointermediates as adsorbents since they allow the removal of a more significant number of contaminants to traditional adsorbents [19,20].
Recently, carbon-based materials with superhydrophobic and super-oleophilic properties have been used as adsorbents of oily particles due to their excellent properties, such as easy surface modification, the large number of sources for its synthesis, high surface area, high selectivity for crude oil, and highly developed pore structure [21,22]. A great variety of carbon-based materials have been employed in oil removal, such as sponges [23], films [24], fiber [25,26], graphenes [27], xerogels, activated carbon [22,28], carbon nanotubes [29], and microspheres [30]. Among those materials, activated carbons (AC) have been shown to have the greatest ability to remove oil from O/W emulsions. AC fabrication can be done from different vegetable origin precursors (seeds, husk, oils, and wood) and polymeric materials [31]. Agricultural residues have considerable advantages due to their low cost, and consequently, in recent years, research interest in its production from these sources has grown.
Coffee is a product known and produced around the world. According to the “International Coffee Organization”, during 2019, the total coffee production was more than 170 million tons, and Colombia produced 13 million tons, being the country with the third highest production after Brazil and Vietnam [32]. Nevertheless, the coffee residue is approximately 50% by mass of the total raw material, meaning that it is a crucial biological resource and is representative of the coffee-derived production process [33]. In addition, coffee residues, given the amount of oxygen required to be degraded, are considered highly polluting [33,34]. In this context, given the high availability and low cost, coffee waste is an alternative for producing activated carbon for giving a circular economy [35].
Fabrication of activated carbons includes carbonization under an inert atmosphere and subsequent activation. During the first step, eliminating non-carbon species and forming a fixed carbon mass with a well-defined pore structure occurs [34]. Meanwhile, activation can be done by physical (steam, CO2) between 800 and 1100 °C or by chemical processes (NaOH, ZnCl2, H3PO4) at 300–700 °C [31]. Later, AC’s surface modification can increase the crude fraction’s selectivity and provide self-regenerative properties. In particular, metallic oxide nanoparticles have shown excellent adsorptive and catalytic results [36,37,38,39,40]. Among these, nickel, iron, and cobalt oxides have stood out. In addition, iron-based materials have high selectivity towards crude oil aromatic fractions, such as pyridines, pyrroles, and thiophenes [41].
Despite the good results in the removal step by adsorption, there are still several limitations regarding the desorption process [42]. Some of the methods used for the regeneration of the materials posterior to the oil removal can be physical (using a solvent for washing [43,44,45], biotechnological (bacteria) [18], and chemical (reactions). Water treatments by using organic solvents for washing have been reported to present several limitations. In the first instance, oil traces are required to be removed from large volumes of water, obtaining low efficiencies, and making the process economically unviable [3]. Combining solvents with adsorbents results in alterations in adsorbents’ chemical nature, decreasing their adsorptive capacity. In addition, these treatments have been reported to be highly sensitive to changes in pH, exposure times, temperature, total acidity, and water salinity [43,44,45].
Our research group has recently developed biofilms for crude oil biodegradation, obtaining efficiencies of 100% for oil concentrations lower than 8000 mg L−1 and reuses until ten cycles [18]. Nevertheless, these materials are susceptible to pH alterations since good results are only achieved for neutral waters (pH between 6 and 8), and as it is well known, this condition can be easily affected during enhanced oil recovery processes, such as waterflooding and alkali-surfactant-polymer (ASP), among others [46].
Regarding chemical processes, Villegas et al. [42], evaluated nanointermediates of functionalized silica with magnetic nanoparticles for crude oil decomposition by pyrolysis reactions after the adsorption process. The thermal experiments showed that synthesized materials decompose crude oil adsorbed at temperatures below 400 °C, whereas virgin crude oil ends the thermal cracking up to 600 °C. Although these materials show a considerable reduction in crude oil decomposition temperature, this is still too high to carry out in a field application.
Currently, this last stage is considered one of the technologies with the greatest potential for the final crude oil disposal [42]. The thermal applications that are assisted by the indicated catalysts can not only generate a 100% decomposition of the adsorbed crude oil, but they also allow the self-regeneration of the material with low energy costs.
Several works have evaluated the combination of carbon-based materials and metal oxide nanoparticles for crude oil adsorption. Liu et al. [47] conjugated magnetite nanoparticles with carbonaceous nanomaterials such as graphene oxide films to create graphene-based magnetic polymer foams to carry out oil/water separation. Synthesized magnetic polymer-based graphene foams (MPG) exhibit superhydrophobicity and super-oil philia with a water and oil contact angle of 158 and a 0° ± 1°, respectively. Haitao Wang et al. [48] synthesized carbon nanotubes coated with superparamagnetic iron oxide nanoparticles to separate oil from a mixture of water and oil. The authors managed to eliminate almost 100% of the free oil present in the mixture. These methods report excellent adsorption capacity for both oils and organic solvents, maintaining their performance after several adsorption/desorption cycles, which makes them recyclable and stable materials under cyclical operations and, therefore, an easy alternative for cleaning contamination by crude oils, petroleum derivatives and toxic organic solvents [27,48].
This work focused on developing activated carbon from coffee residues—specifically, spent coffee grounds—considering the importance of reusing these resources, and their surface modification with magnetite nanoparticles, to improve their adsorptive and catalytic properties. This is the first time a nano-intermediate with these characteristics has been designed to remove crude oil from O/W emulsions. Besides, the application of thermal treatment is proposed as a final stage, given useful by-products in energy production. This work is envisioned to open a new landscape for the fabrication of materials from agro-industrial waste, with more significant oil adsorptive capacity, and that require a lower temperature in the decomposition process by thermal cracking (pyrolysis) reactions, which implies a recovery of total activated carbon and possible use of gases (CO, H2, CH4) derived from crude oil.

2. Materials and Methods

2.1. Materials

Spent coffee grounds (Urbania coffee shop, Colombia) were used as a raw material for carbon synthesis, and industrial-grade nitrogen gas was used for the carbonization process. Carbon activation was done using ethanol (C2H5OH 98%) and zinc chloride (ZnCl2 95%) provided by Panreac (Barcelona, Spain). In contrast, surface modification was done with magnetite nanoparticles, which were synthesized using iron (III) chloride hexahydrate (FeCl3∙6H2O) and iron (II) chloride tetrahydrate FeCl2∙4H2O, NH3 (25%), HCl (33%) and deionized water, all purchased from Merck KGaA (Darmstadt, Germany).
A heavy Colombian crude oil of 19.2 °API (saturated 19.17%, aromatics 13.3%, resins 62.10% and asphaltenes 5.70%) and 732.60 cP viscosity, freshwater, KCl supplied by R.A. Chemicals (Gujarat, India), and Tween 80 surfactant (Panreac, Barcelona, Spain) were used to elaborate synthetic oil-in-water emulsions.

2.2. Methods

2.2.1. Preparation of Oil-in-Water Emulsions

An emulsion with a fixed concentration of crude oil was prepared. For this, a brine was prepared with freshwater and 2.0 wt.% KCl. The brine was vigorously stirred and filtered. Subsequently, 500 mg L−1 of crude oil and 0.2 wt.% of Tween 80 surfactant were added, maintaining stirring at 16,000 rpm for 45 min. For the adsorption tests, solutions of 50, 100, 200, and 300 mg L−1 were prepared. The emulsions’ stability was determined through the oil drop size, measured through an optical microscope at 40X for seven (7) days [19,20,49], as shown in Figure 1.
It was concluded that O/W emulsions have high stability and an average size between 0.47 and 0.75 µm. During the days of analysis, the emulsions presented a standard deviation of <0.044 µm in hydrodynamic size.

2.2.2. Synthesis and Characterization of Magnetite Nanoparticles

The co-precipitation method was used to synthesize magnetite nanoparticles [50]. The FeCl3∙6H2O was dissolved in deionized water and mixed with a solution of FeCl2∙4H2O in 0.2wt.% HCl. The molar ratio employed was 4:1 Fe+3:Fe+2. Then, NH4OH was added in excess, and the systems were vigorously stirred for 10 min. Subsequently, the mixture was filtered and washed with deionized water and ethanol to remove excess ferric ions and ammonia. Finally, the filtrate was dried for 24 h at a temperature of 75 °C [50].
The morphology and size of the synthesized magnetite nanoparticles were analyzed by scanning electron microscopy (SEM) and the dynamic light scattering technique using an FEI microscope (Quanta 400 model) (SEM) (Eindhoven, The Netherlands) and a Nanoplus-3 (Micromeritics, Norcross, GA, USA), respectively. The size data were obtained through statistical analysis. The population of particles was fixed for each sample, the confidence level was established at 95%, the confidence interval was calculated, and finally, the size of the population was calculated using the MiniTab17 statistical software (Minitab Inc., State College, PA, USA). Each point was analyzed using the morphometric software tpsDig 2.1 7 (SUNY, Stony Brook, NY, USA) [39,51]. Fourier transform infrared spectroscopy was performed to corroborate the presence of iron and oxygen as central components of magnetite nanoparticles.

2.2.3. Synthesis of Activated Carbon

The first step to prepare activated carbon was to remove impurities and contaminants from the coffee residue. The material was dried for 24 h at a temperature of approximately 100 °C. The dry residue was divided into two parts. The first one was mixed with ZnCl2 in powder form and sufficient deionized water maintaining a ratio of 1:2 coffee residue/ZnCl2. Then, the material was dried for 24 h at a temperature of 100 °C. The second part was left intact. Then, a pyrolysis process was carried out in a stainless-steel tube (Thermo Scientific Lindberg/Blue M, Waltham, MA, USA) under an inert atmosphere of nitrogen and constant flow of 80 mL min−1 to the two parts obtained. The pyrolysis heating rate was 10 °C min−1, and the activation temperature was kept constant at 600 °C for 2 h. Then, the activated coffee carbon was cooled at a temperature of 25°C. The activated carbons impregnated with ZnCl2 were washed sequentially with ethanol, hydrochloric acid (0.1 M), and deionized water to remove the Zn+2 and Cl- ion residues. Finally, AC materials were dried for 12 h by a stream of air at 100 °C [52,53]. The samples thus obtained were labeled as PCR (pyrolyzed coffee residue) and AC (activated carbon).

2.2.4. Functionalization of Activated Carbon with Magnetite Nanoparticles

The activated carbon was dried at 120 °C for 2 h to remove the remaining water content. For the impregnation process with the synthesized magnetite nanoparticles, the AC has pretreated in a 45.75%v v−1 deionized water solution, with 8.50%v v−1 ammonium hydroxide and 45.75%v v−1 ethanol, using 4 mL of solution per gram of AC. The system was magnetically stirred at 1500 RPM for 1 h. Then, 5.0 wt% of magnetite nanoparticles were added and left stirring for 4 h at 1500 RPM. Finally, the mixture was heated to 150 °C to evaporate the NH4OH and ethanol. Finally, the functionalized material was dried to remove the remaining liquid from the process [54]. The nano-intermediate was named ACM (activated carbon modified with 5.0 wt.% of magnetite nanoparticles).

2.2.5. Textural and Chemical Characterization

The iodine number was calculated following the ASTM D4607 standard to obtain the relative activation level by adsorption of iodine from an aqueous solution. This parameter is strongly related to the surface area and porosity structure of AC. The porous texture was assessed by nitrogen physisorption at −196 °C and CO2 adsorption at 0 °C using a Micromeritic ASAP2020 instrument (Micromeritics Instruments Corporation, Norcross, GA). The Brunauer–Emmett–Teller method with N2 adsorption data was used to quantify the synthesized samples’ surface area [55]. The final content of magnetite nanoparticles after the impregnation process was obtained by thermogravimetric analysis in a thermogravimetric analyzer Q50 (TA Instruments, New Castle, DE, USA) by flowing air at 100 mL min−1 and heating the sample from 30 to 700 °C.
The samples’ size and morphology were determined by dynamic light scattering technique and scanning electron microscopy (SEM) in an FEI microscope (Quanta 400 model) (Eindhoven, The Netherlands). Besides, Energy-dispersive X-ray spectroscopy was executed to establish the Fe dispersion in the sample.
To specify the surface composition of synthesized nano-intermediates, Fourier transform infrared spectroscopy was done in an IRAffinity-1 spectrophotometer by mixing potassium chloride (KCl) and sample in a 3:7 ratio [56].

2.2.6. Adsorption Isotherms

Batch adsorption experiments were carried out to evaluate the crude oil adsorption over magnetite nanoparticles, coffee residue (CR), pyrolyzed coffee residue (PCR), activated carbon (AC), and activated carbon modified with magnetite nanoparticles (ACM).
Initially, oil-in-water emulsions with oil concentrations between 50 and 300 mg L−1 were prepared. Then, adsorbents were added into the O/W emulsions at a fixed solution volume adsorbent mass ratio of 1 g L−1. The mixtures were stirred for 12 h at room temperature to ensure adsorption equilibrium. Next, the solutions were centrifuged at 4500 rpm for 1 h. The amount of crude oil adsorbed was determined by colorimetry analysis. A UV-Visible spectrophotometer (Thermo Fisher Scientific MA, USA) was used, using a wavelength of 300 nm. The amount of crude oil adsorbed ( Q ) (mg g−1) was calculated using Equation (1).
Q = C o C e W V
where C o (mg L−1) is the initial concentration of crude oil in the solution, C e (mg L−1) is the equilibrium concentration of crude oil, V (L) is the volume of solution in, and W (mg) is the weight of the adsorbent.
The solid–liquid equilibrium model (SLE) was used to determine the adsorption mechanism in terms of selectivity and adsorptive capacity and to obtain thermodynamic insights about the adsorption phenomenon. Equations (2)–(7) show the models used for this purpose.
C E = H Ψ 1 + K Ψ exp ( Ψ Q m )
Ψ = 1 + 4 K ξ + 1 2 K
ξ = Q m Q Q m Q
Δ H a d s 0 = K 1 R
Δ S a d s 0 = K 0 R
Δ G a d s 0 = R T ln K
where H (mg g−1) is the inverse of adsorption affinity, K (mg g−1) the crude oil self-association over the material surface, Q m (mg g−1) is the maximum amount adsorbed, C E is the crude oil concentration at the equilibrium from the SLE fitting, Ψ and ξ are constants, R (J mol−1 K−1) is the universal gas constant, and K 1 K 0 are related to the values of enthalpy and entropy, respectively; Further, Δ H a d s 0 is the enthalpy, Δ S a d s 0 is the entropy, Δ G a d s 0 is the change of the Gibbs free energy of the adsorption process. The error definition used is the root mean square error R S M E % .
R S M E % = i p ( X exp , i X mod , i ) 2 p 1 100
where, X exp , i and X mod , i are the values of Q for experimental and modeled data, respectively, and p is the number of data used in the model.

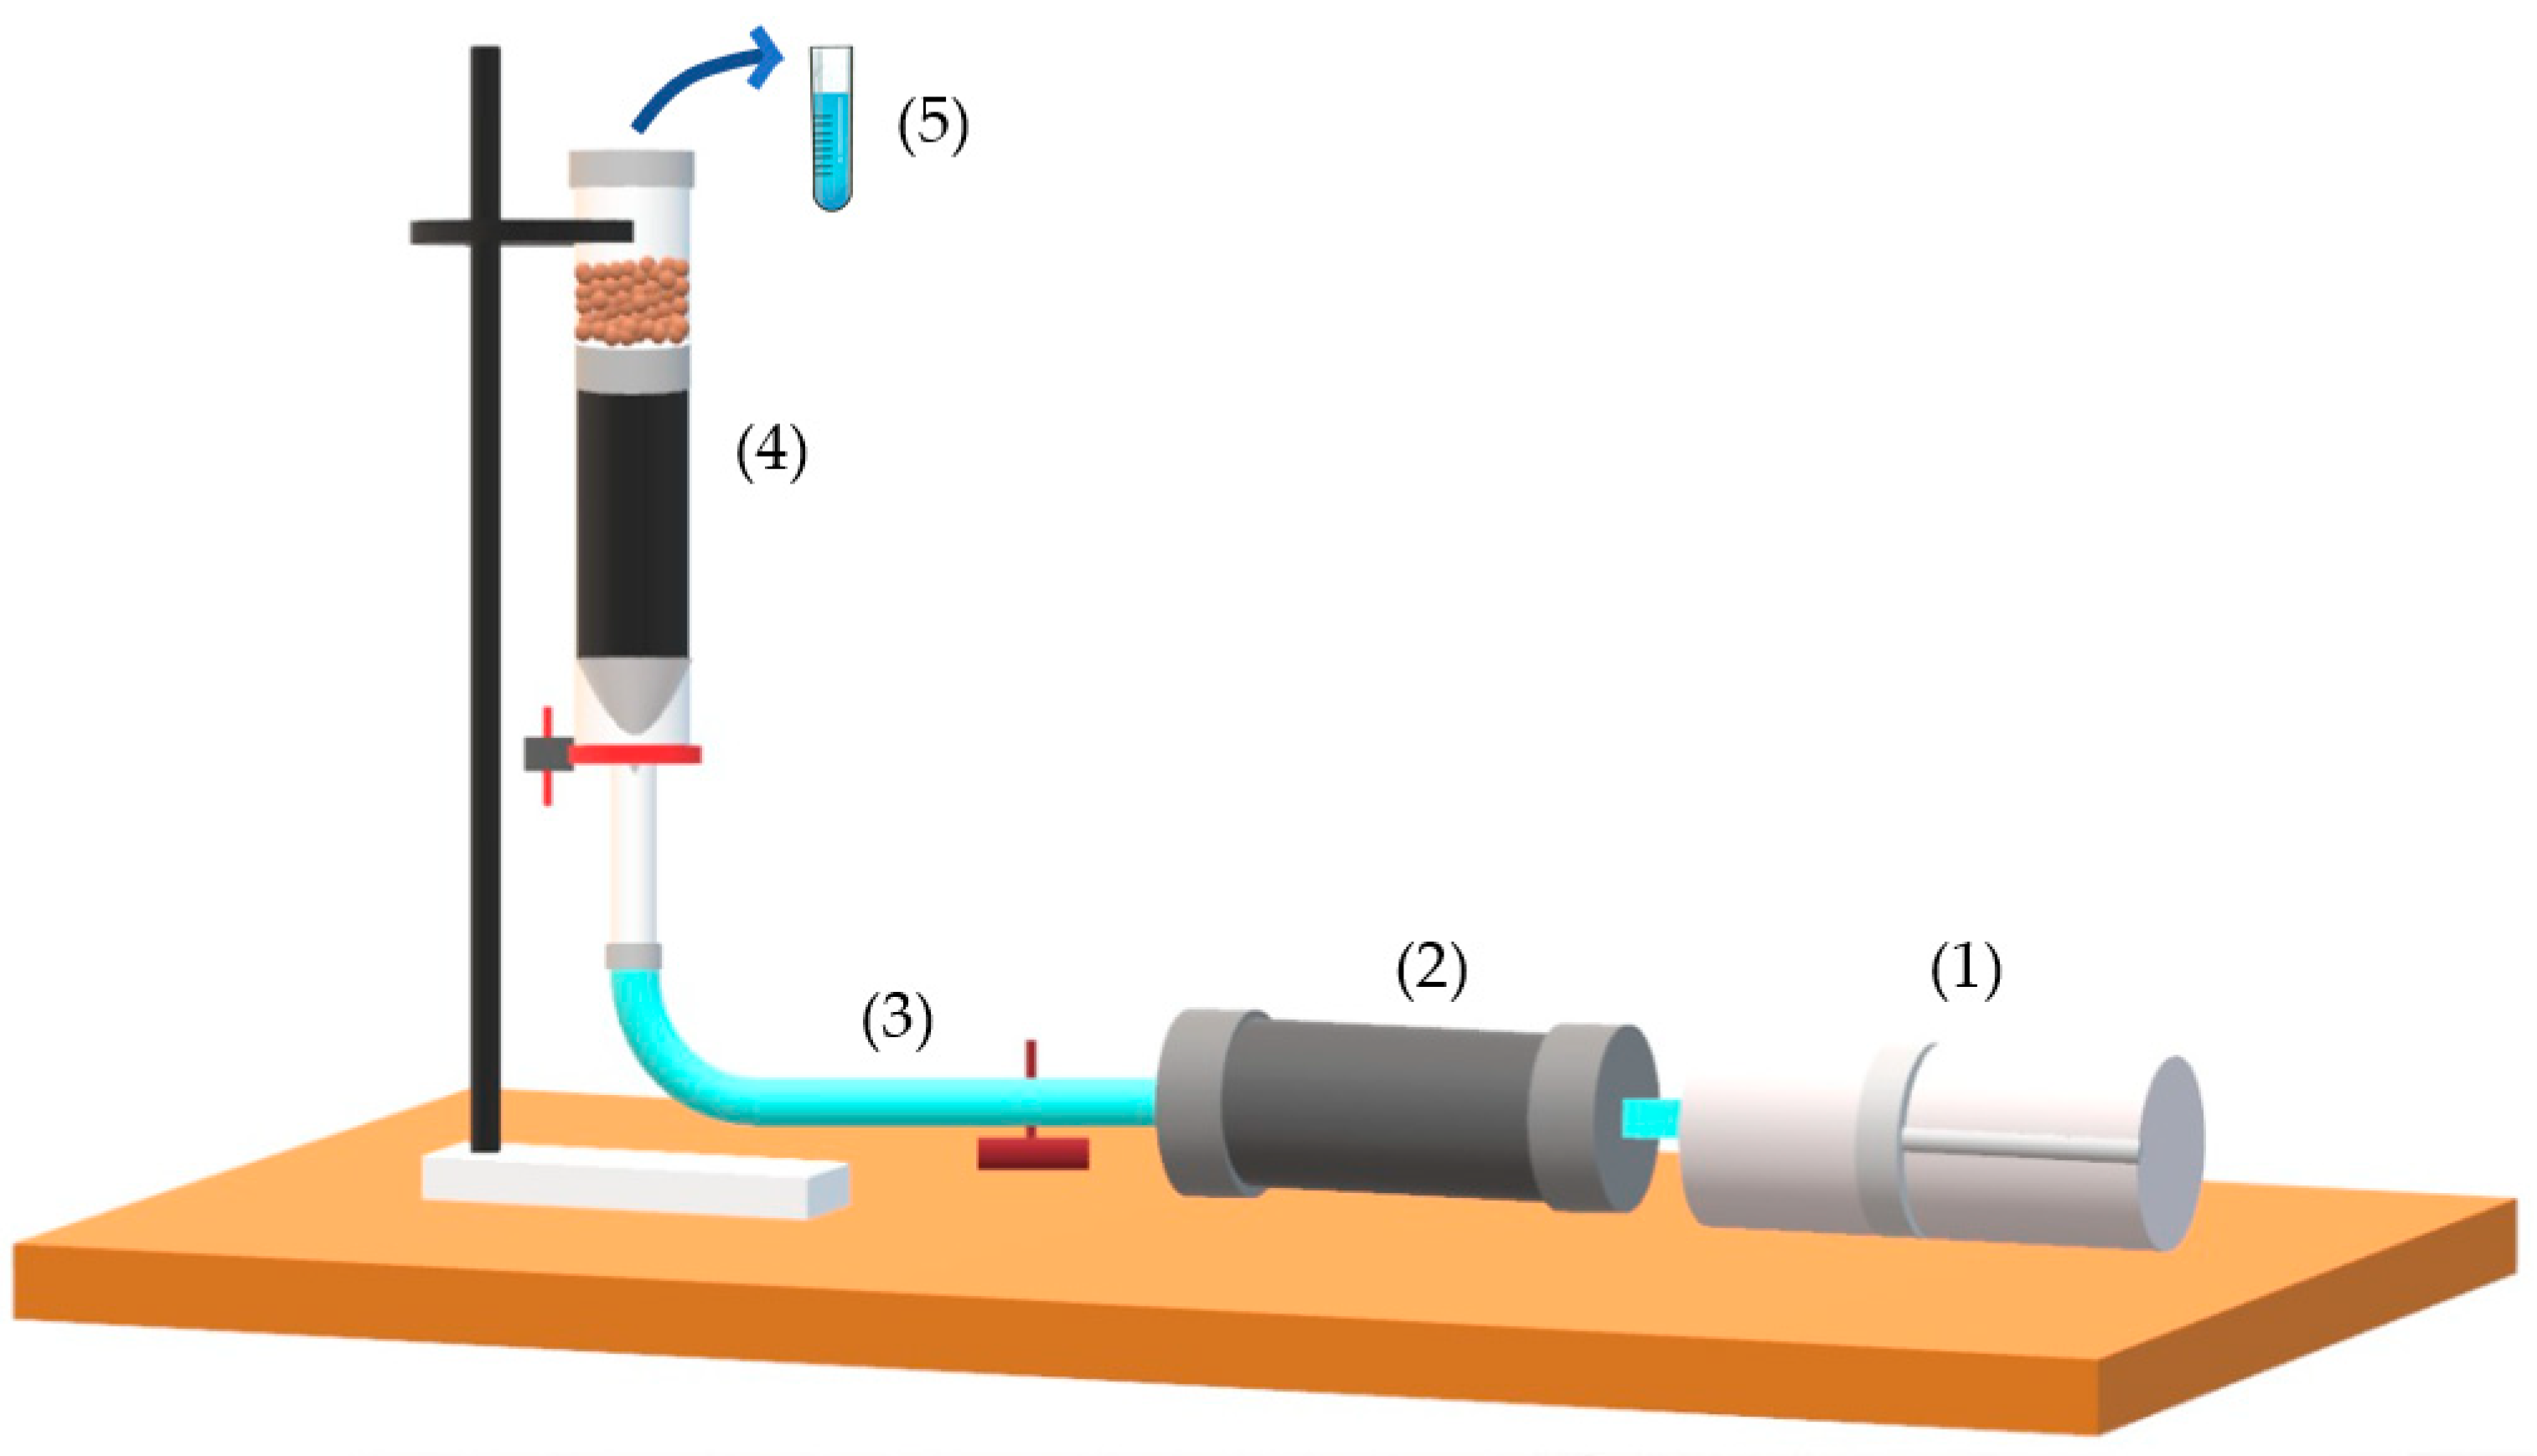
2.2.7. Dynamic Tests

Dynamic adsorption tests were performed on a fixed-bed column, as shown in Figure 2. The experimental setup consists of a positive displacement pump, an emulsion containing cylinder, regulating valves, and an open packed-bed system. The oil concentration in the O/W emulsion was fixed at 100 mg L−1 and was injected under a flow rate of 10 mL min−1 at room conditions of pressure and temperature. The established flow was kept uniform with flow throttle valves, guaranteeing a uniform and complete saturation of the bed and avoiding the formation of preferential channels. The diameter and height of the packed bed were 6.5 cm and 19.5 cm, respectively. The adsorption process was done by mass transfer mechanisms between a mobile phase (emulsion) and a fixed phase (adsorbent). The effluents produced by the upper part of the bed were collected and characterized by UV-vis to determine the quantity of crude oil removed. The test provides information about the adsorption capacity and speed of saturation of the packed bed.

2.2.8. Thermogravimetric Analysis (TGA)

Catalytic thermal cracking of adsorbed crude oil over ACM nano-intermediate was assessed in a Q50 thermogravimetric analyzer coupled to an IR-Affinity-1 FTIR device. The system had a gas cell, which allowed the analysis of the gases produced. The tests were executed under a nitrogen flow of 100 cm3 min−1, using a heating ramp of 20 °C min−1 from 30 to 600 °C. The mass sample was maintained ~5 mg to avert diffusional mass and heat effects [57,58]. In addition, the loading of crude oil per unit of the adsorbent surface area was 0.2 mg m−2. FTIR operates in transmission mode with ten scans per minute at a resolution of 2 cm−1 in the range between 400 and 100 cm−1. The characteristic intensities of each of the gas absorption bands were used, considering the data reported in previous works [38].

3. Results

This section compiles the results obtained for the characterization of magnetite nanoparticles, the pyrolyzed coffee residue (PCR), the synthesized activated carbon (AC), and the nano-intermediate activated carbon modified with 5.0 wt.% of magnetite nanoparticles (ACM). In these tests, the size of the nano-intermediates, composition, morphology, and surface area were determined. Subsequently, adsorption tests were carried out through batch and dynamic experiments to determine the absorptive capacity of the synthesized nano-intermediates. For the static tests, the adsorption of crude oil was carried out at temperatures of 25, 40, and 50 °C. The experiment was carried out for the materials walnut shell (WH), coffee residue (CR), pyrolyzed coffee residue (PCR), the synthesized activated carbon (AC), and activated carbon modified with 5.0 wt.% of magnetite nanoparticles (ACM). The dynamic packed bed test was carried out for the WH material and the newly synthesized ACM nano-intermediate. WH is usually used in the oil industry to remove crude from production waters. Then, the best material was selected to evaluate crude oil decomposition through thermal cracking reactions.

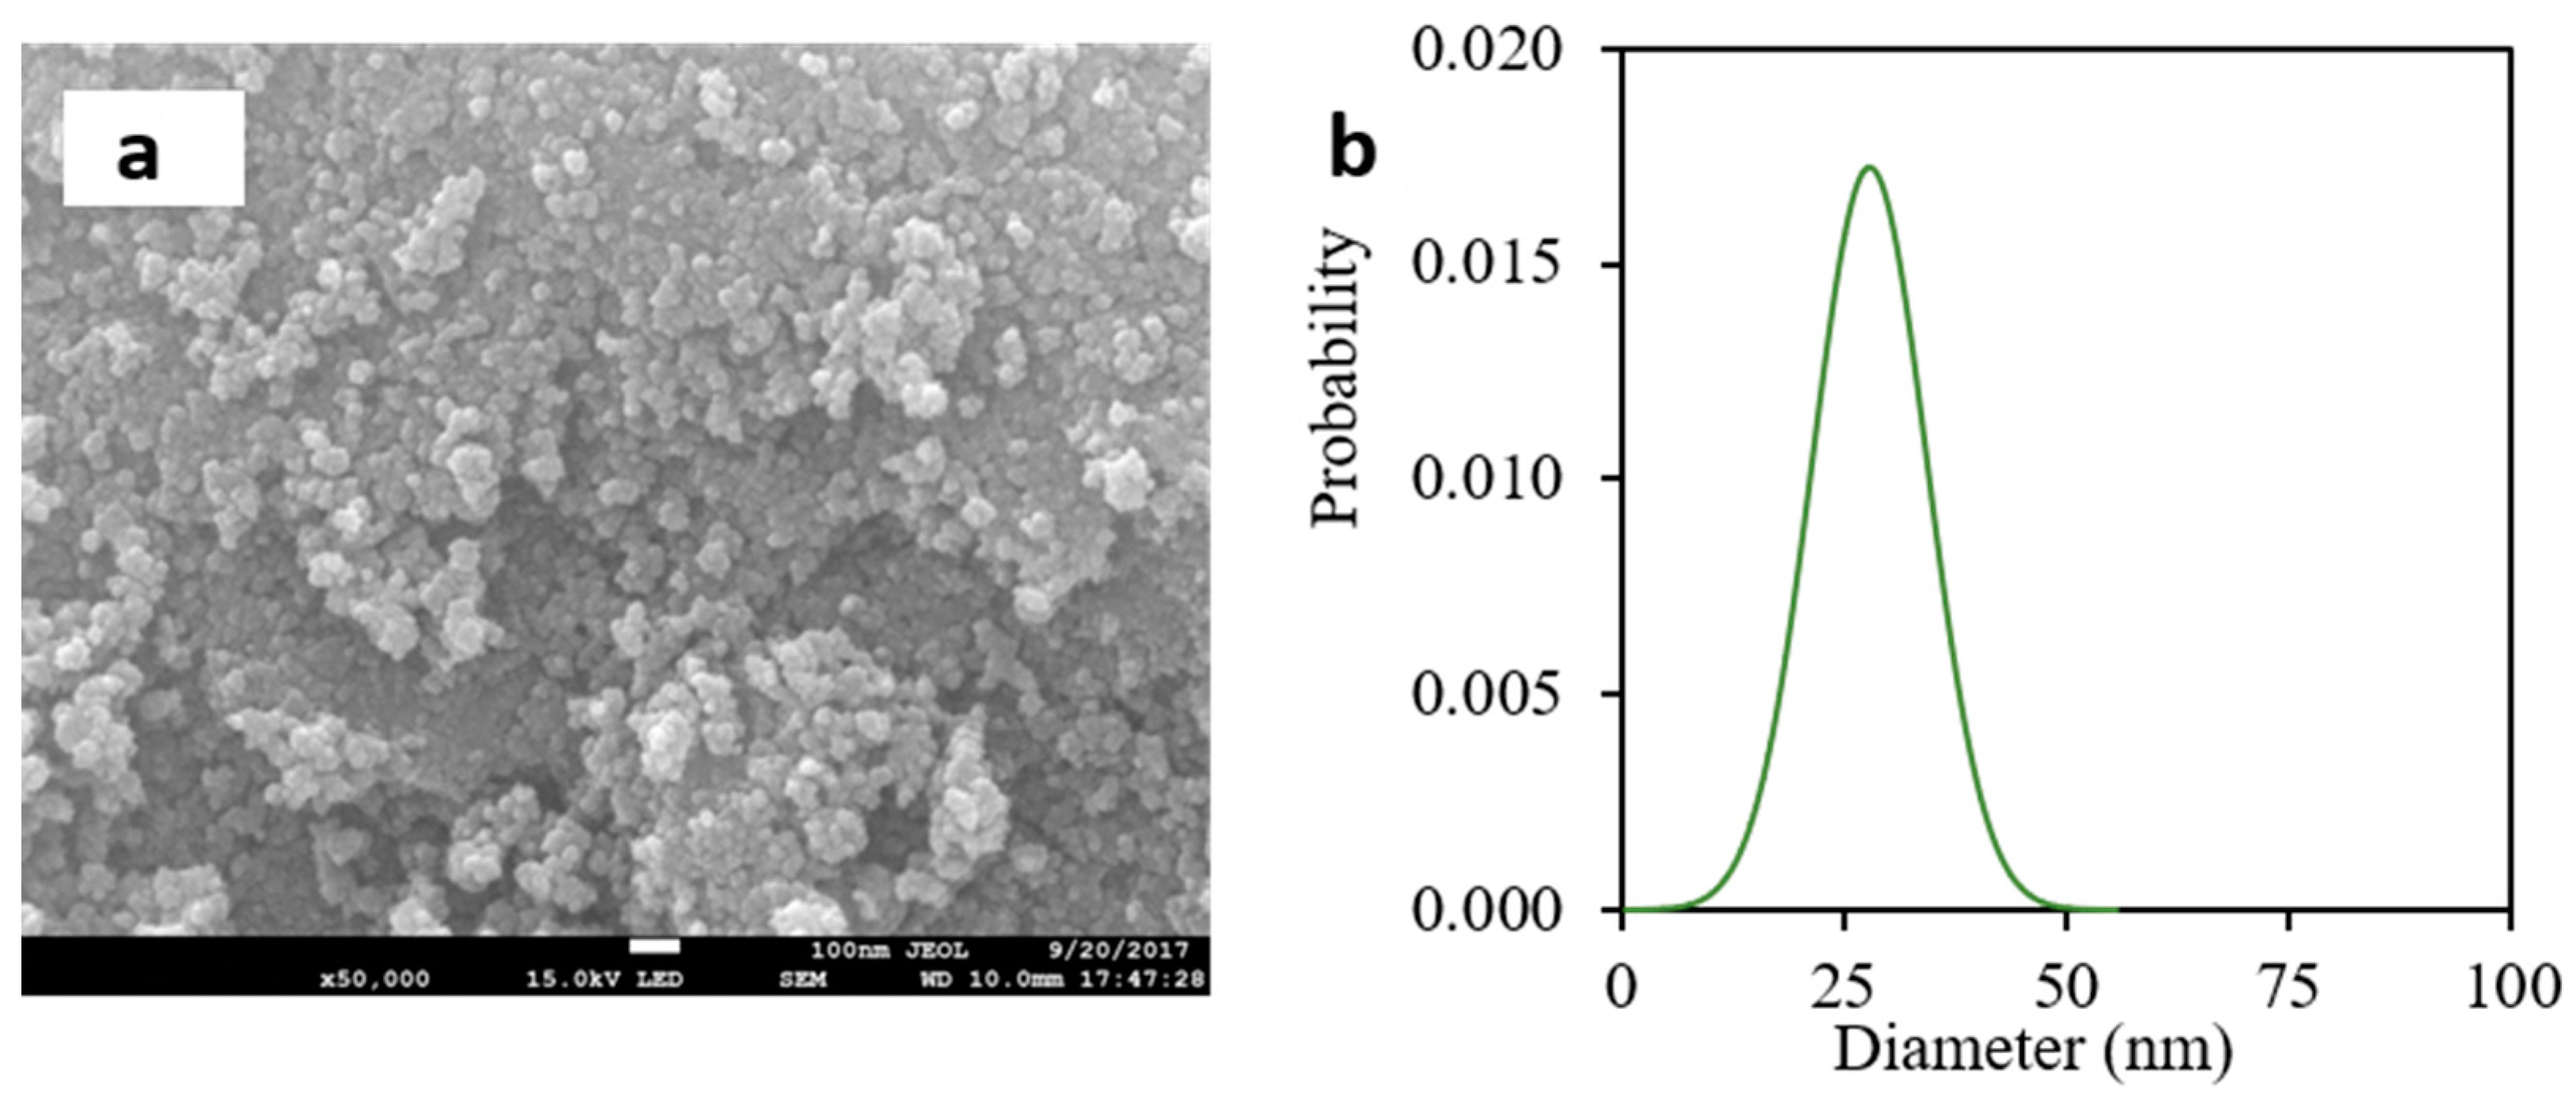
3.1. Characterization of Magnetite Nanoparticles

It is worth mentioning that the magnetic nanoparticles were synthesized by the co-precipitation method and were used to modify the surface of the activated carbon obtained from the coffee residues. This functionalization aims to obtain a greater adsorptive and regenerative capacity of the material. Characterization of magnetite nanoparticles was carried out by Fourier transform infrared spectroscopy (FTIR), dynamic light scattering (DLS), and scanning electron microscopy (SEM).
Figure 3 shows a representative image from the SEM analysis and the particle size distribution for the synthesized nanoparticles. The particles exhibited an irregular and agglomerated structure and a nanometric particle size of about 28 nm, following the same results reported in the literature [59]. The size distribution obtained from the SEM images agrees with the size obtained using the dynamic light scattering technique, where an average hydrodynamic size of about 30 nm was obtained.
Figure 4 shows the FTIR spectrum for magnetite nanoparticles. A band intensity was observed between 3500 and 3000 cm−1, which corresponds to the hydroxyl groups bound to the surface of the iron oxide by hydrogen bonds and water molecules adsorbed chemically in the nanoparticles’ surface. The bands at 1757 and 1678 cm−1 show low intensities attributed to H-O–H groups’ stretching. Finally, the predominant band between 640 and 580 cm−1 confirms Fe-O vibration [60].

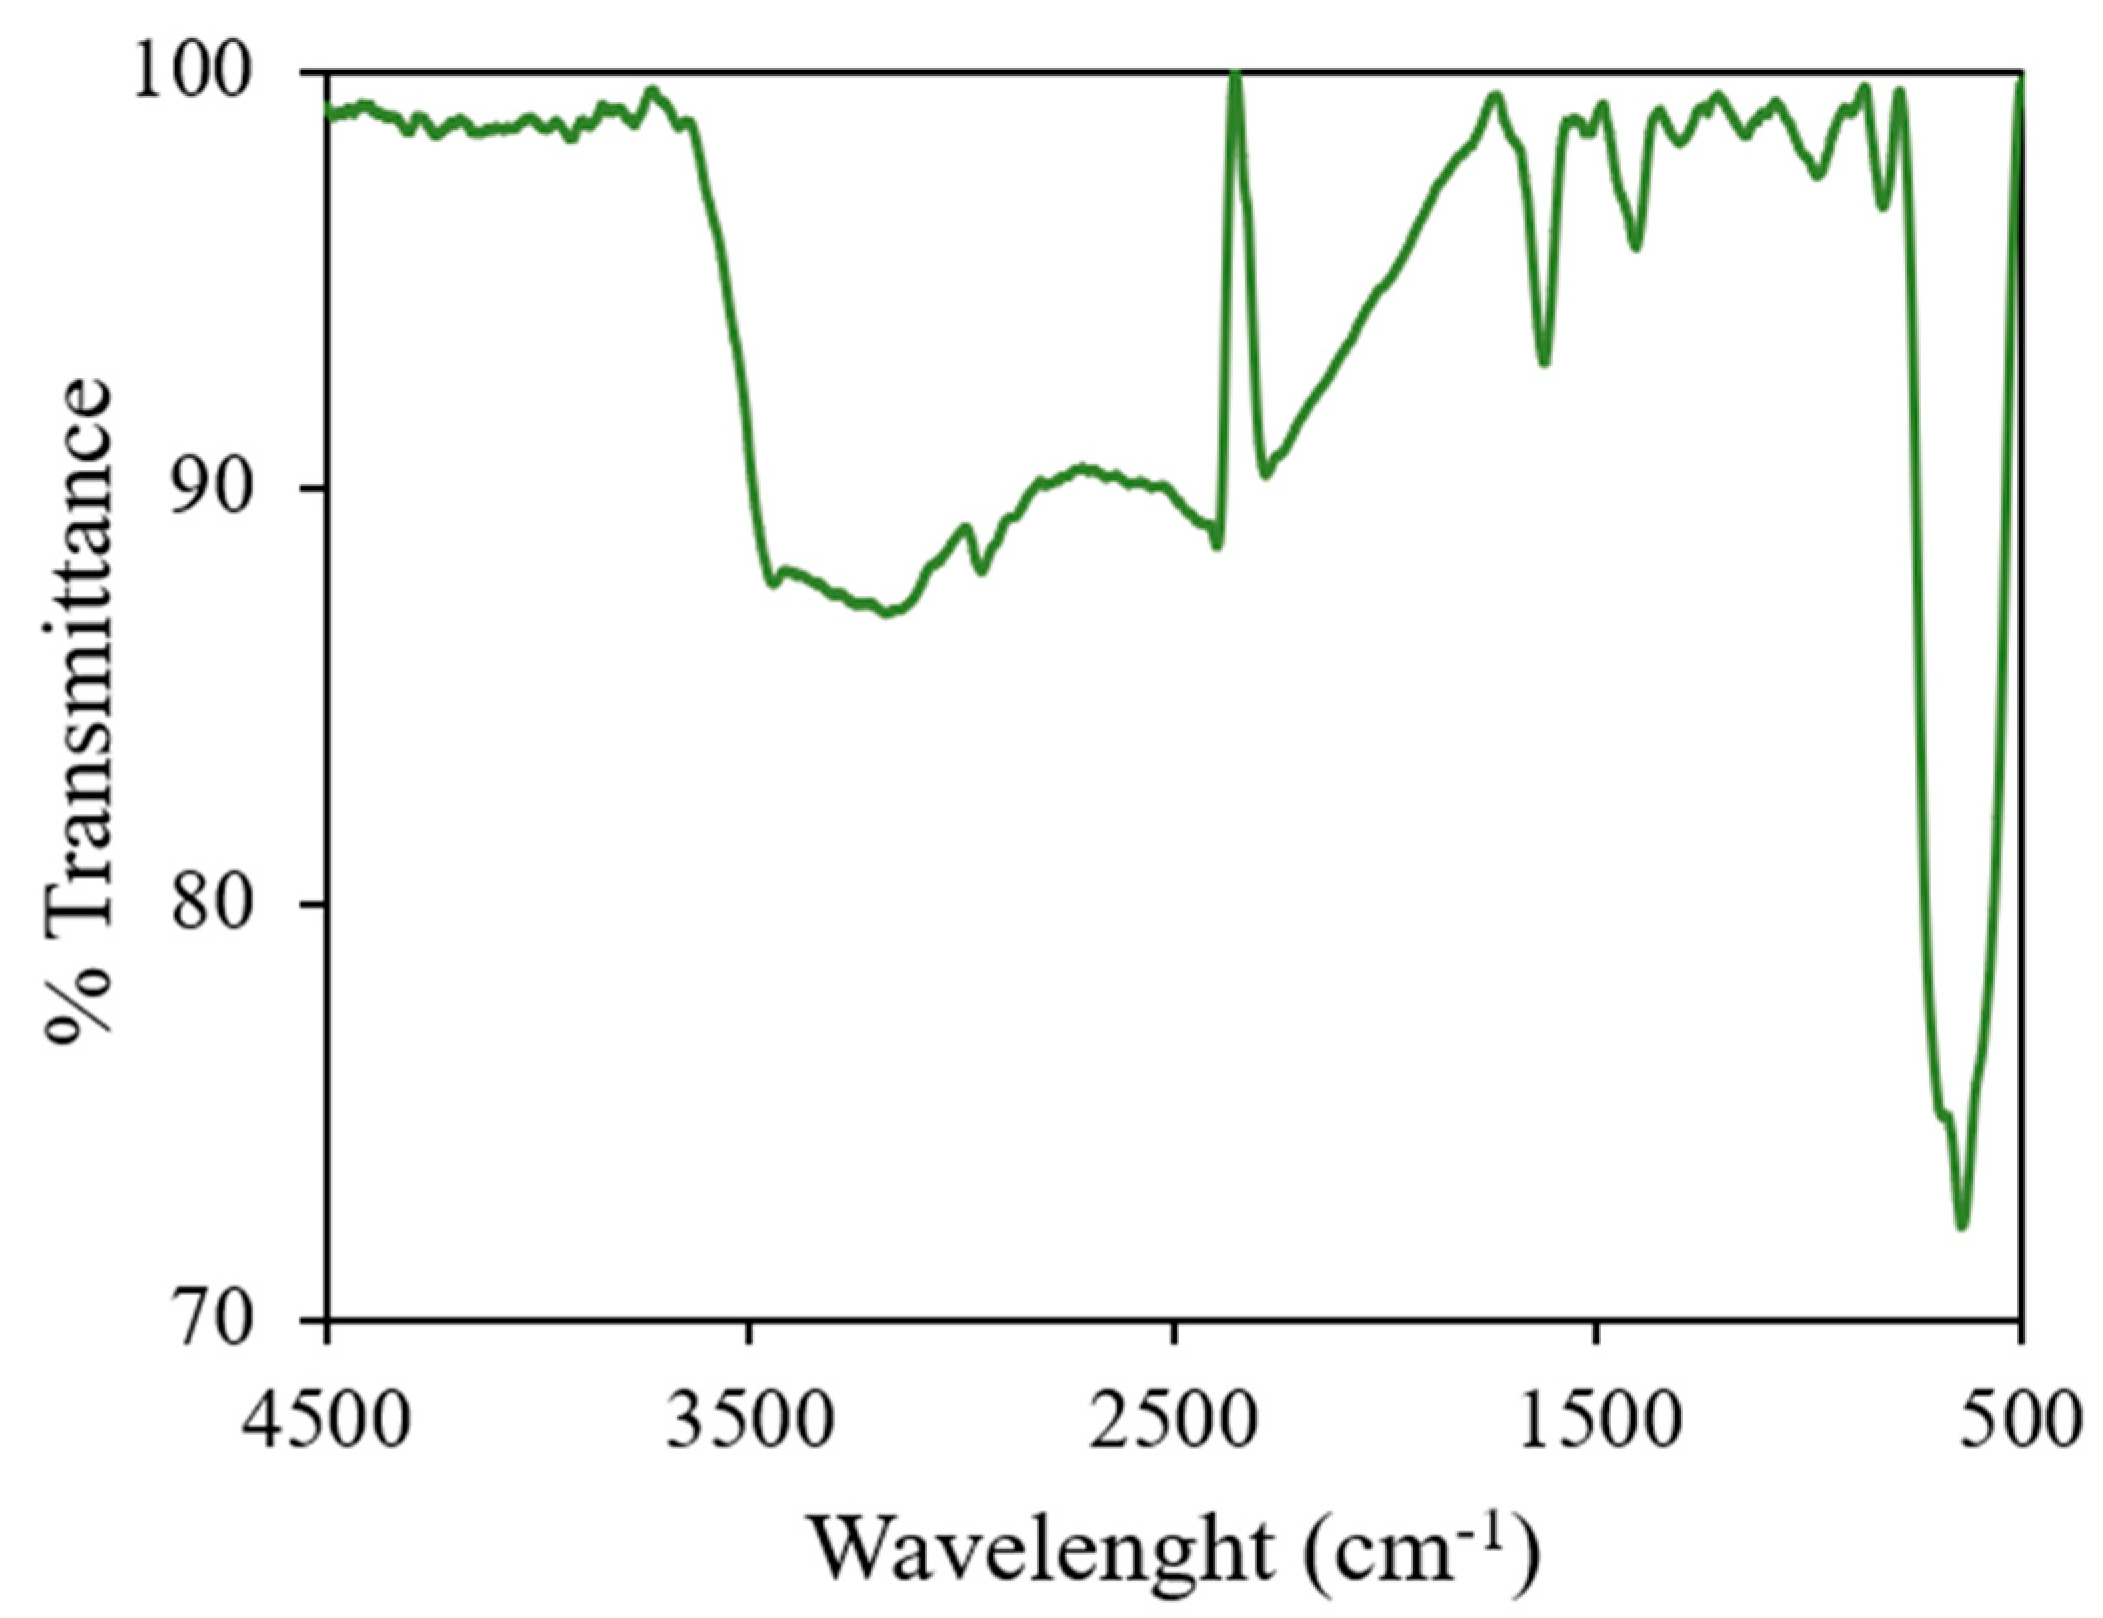
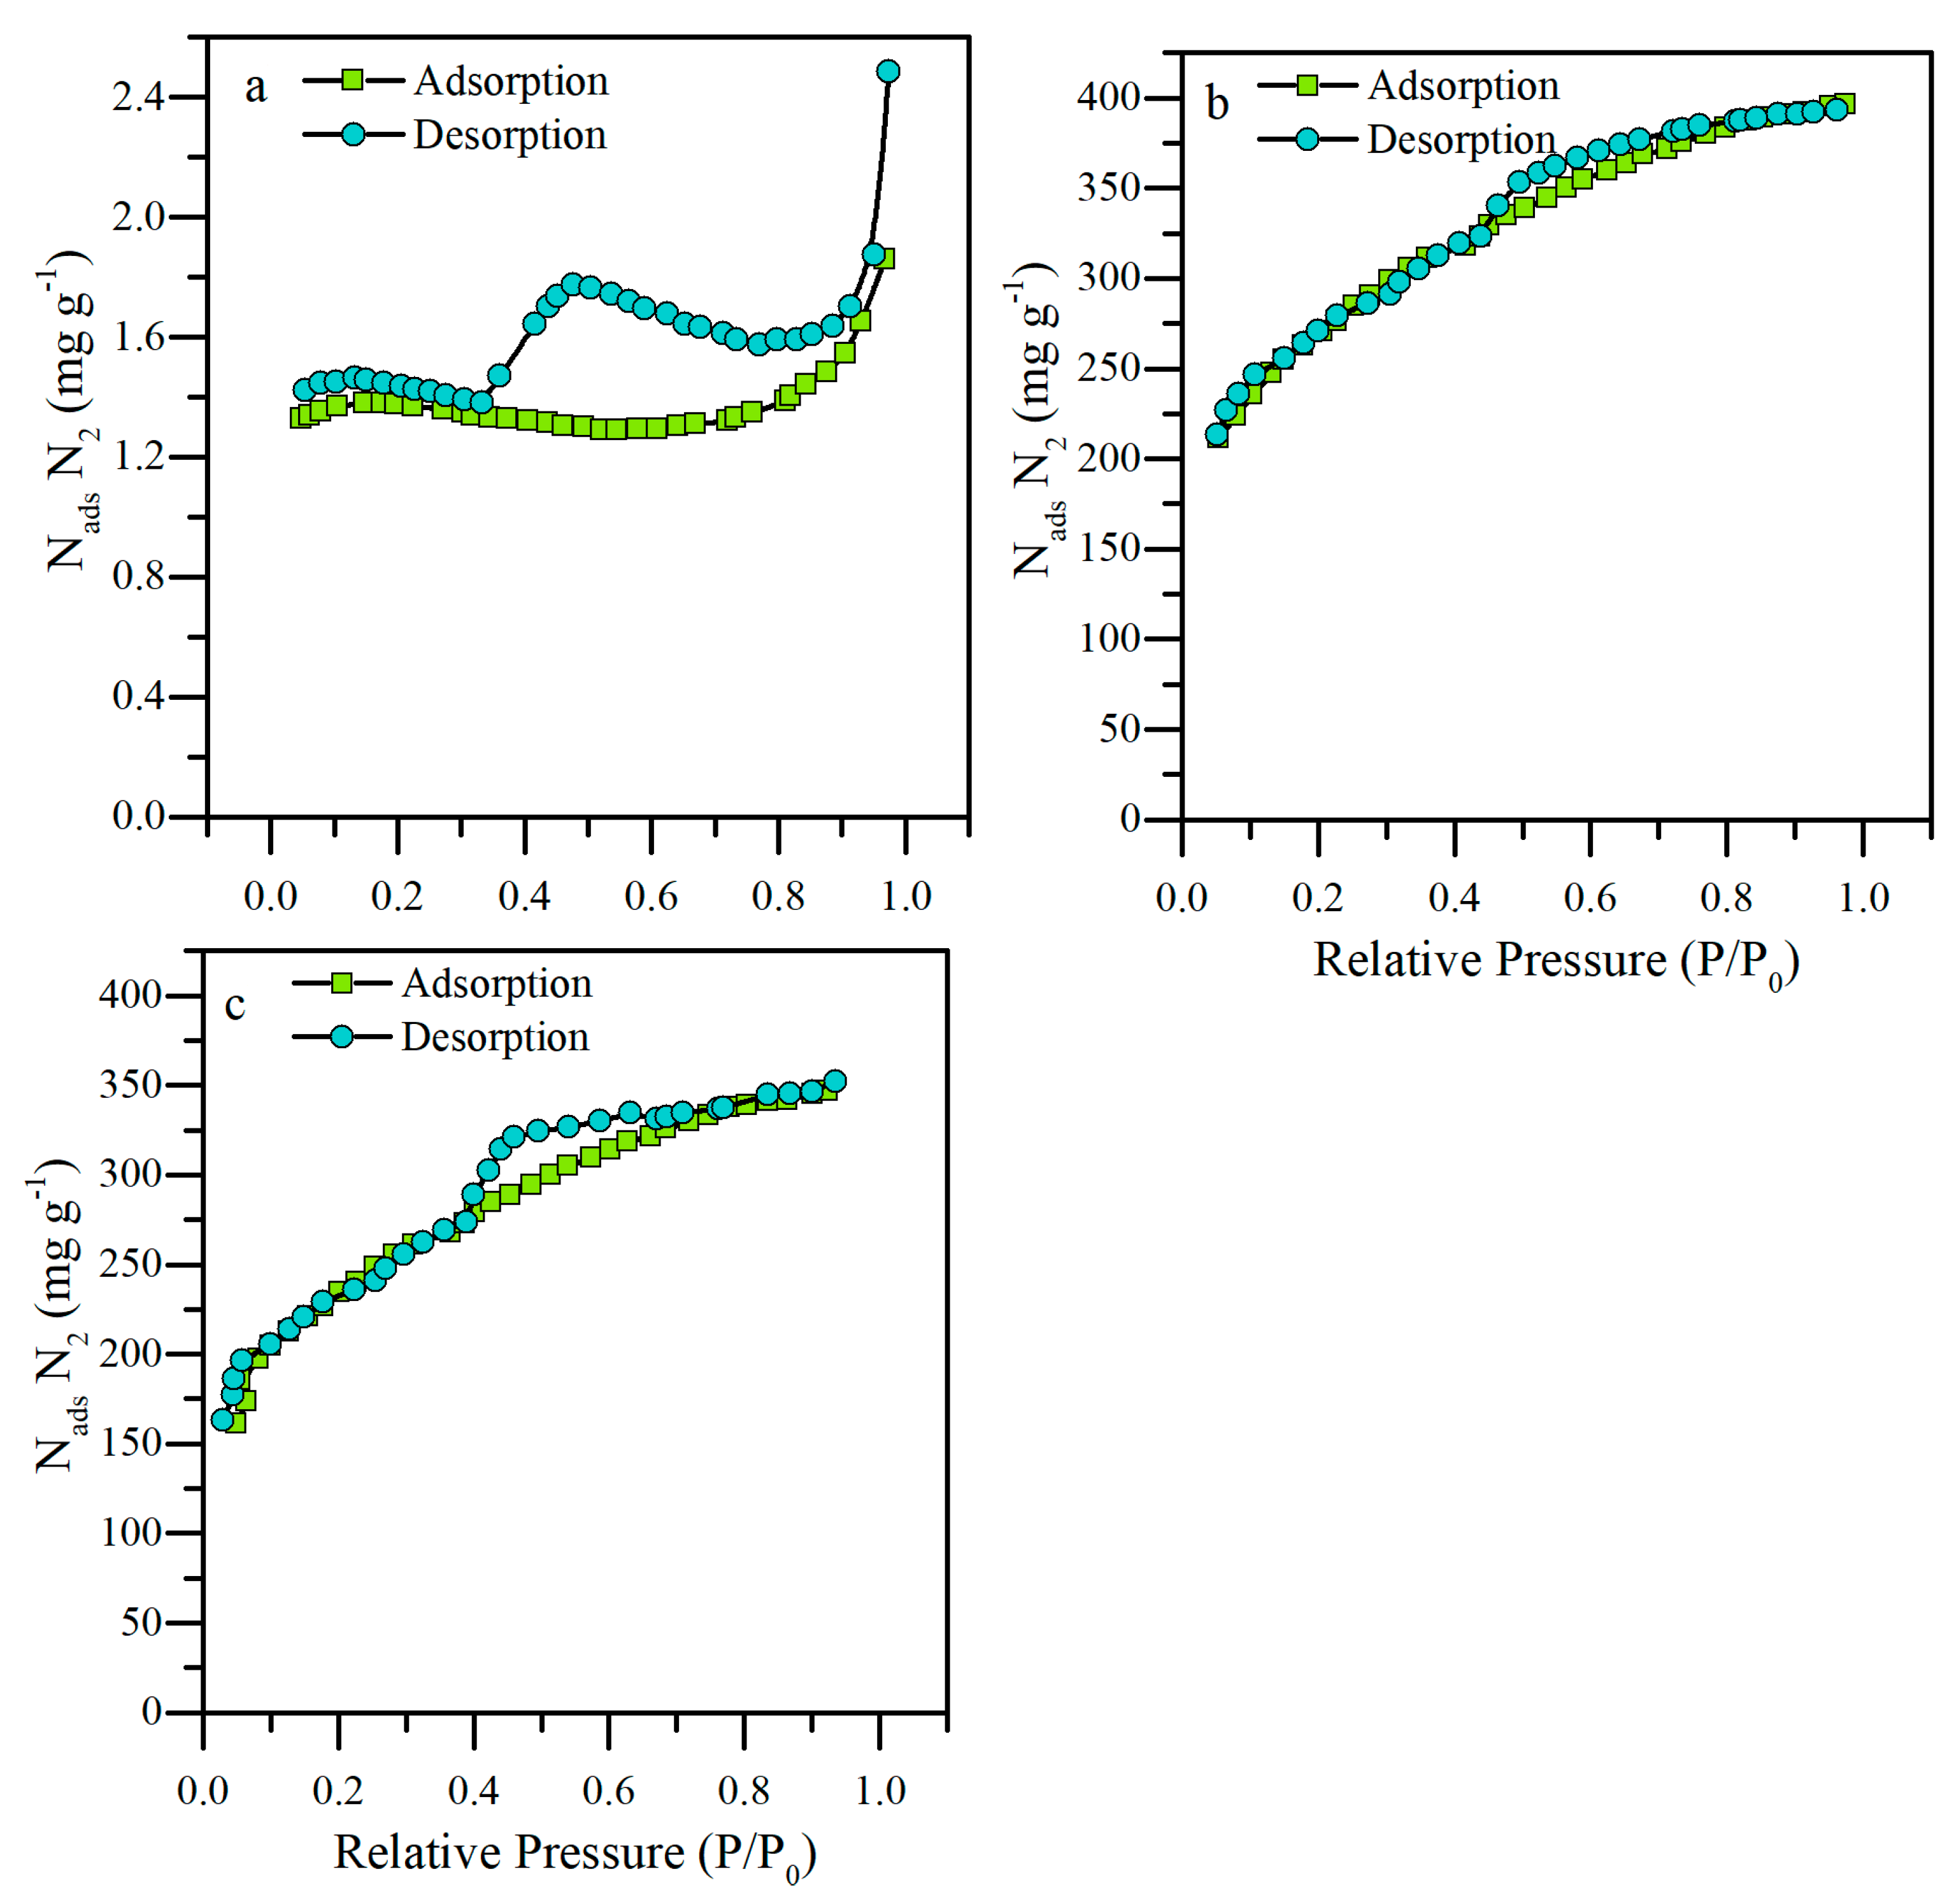
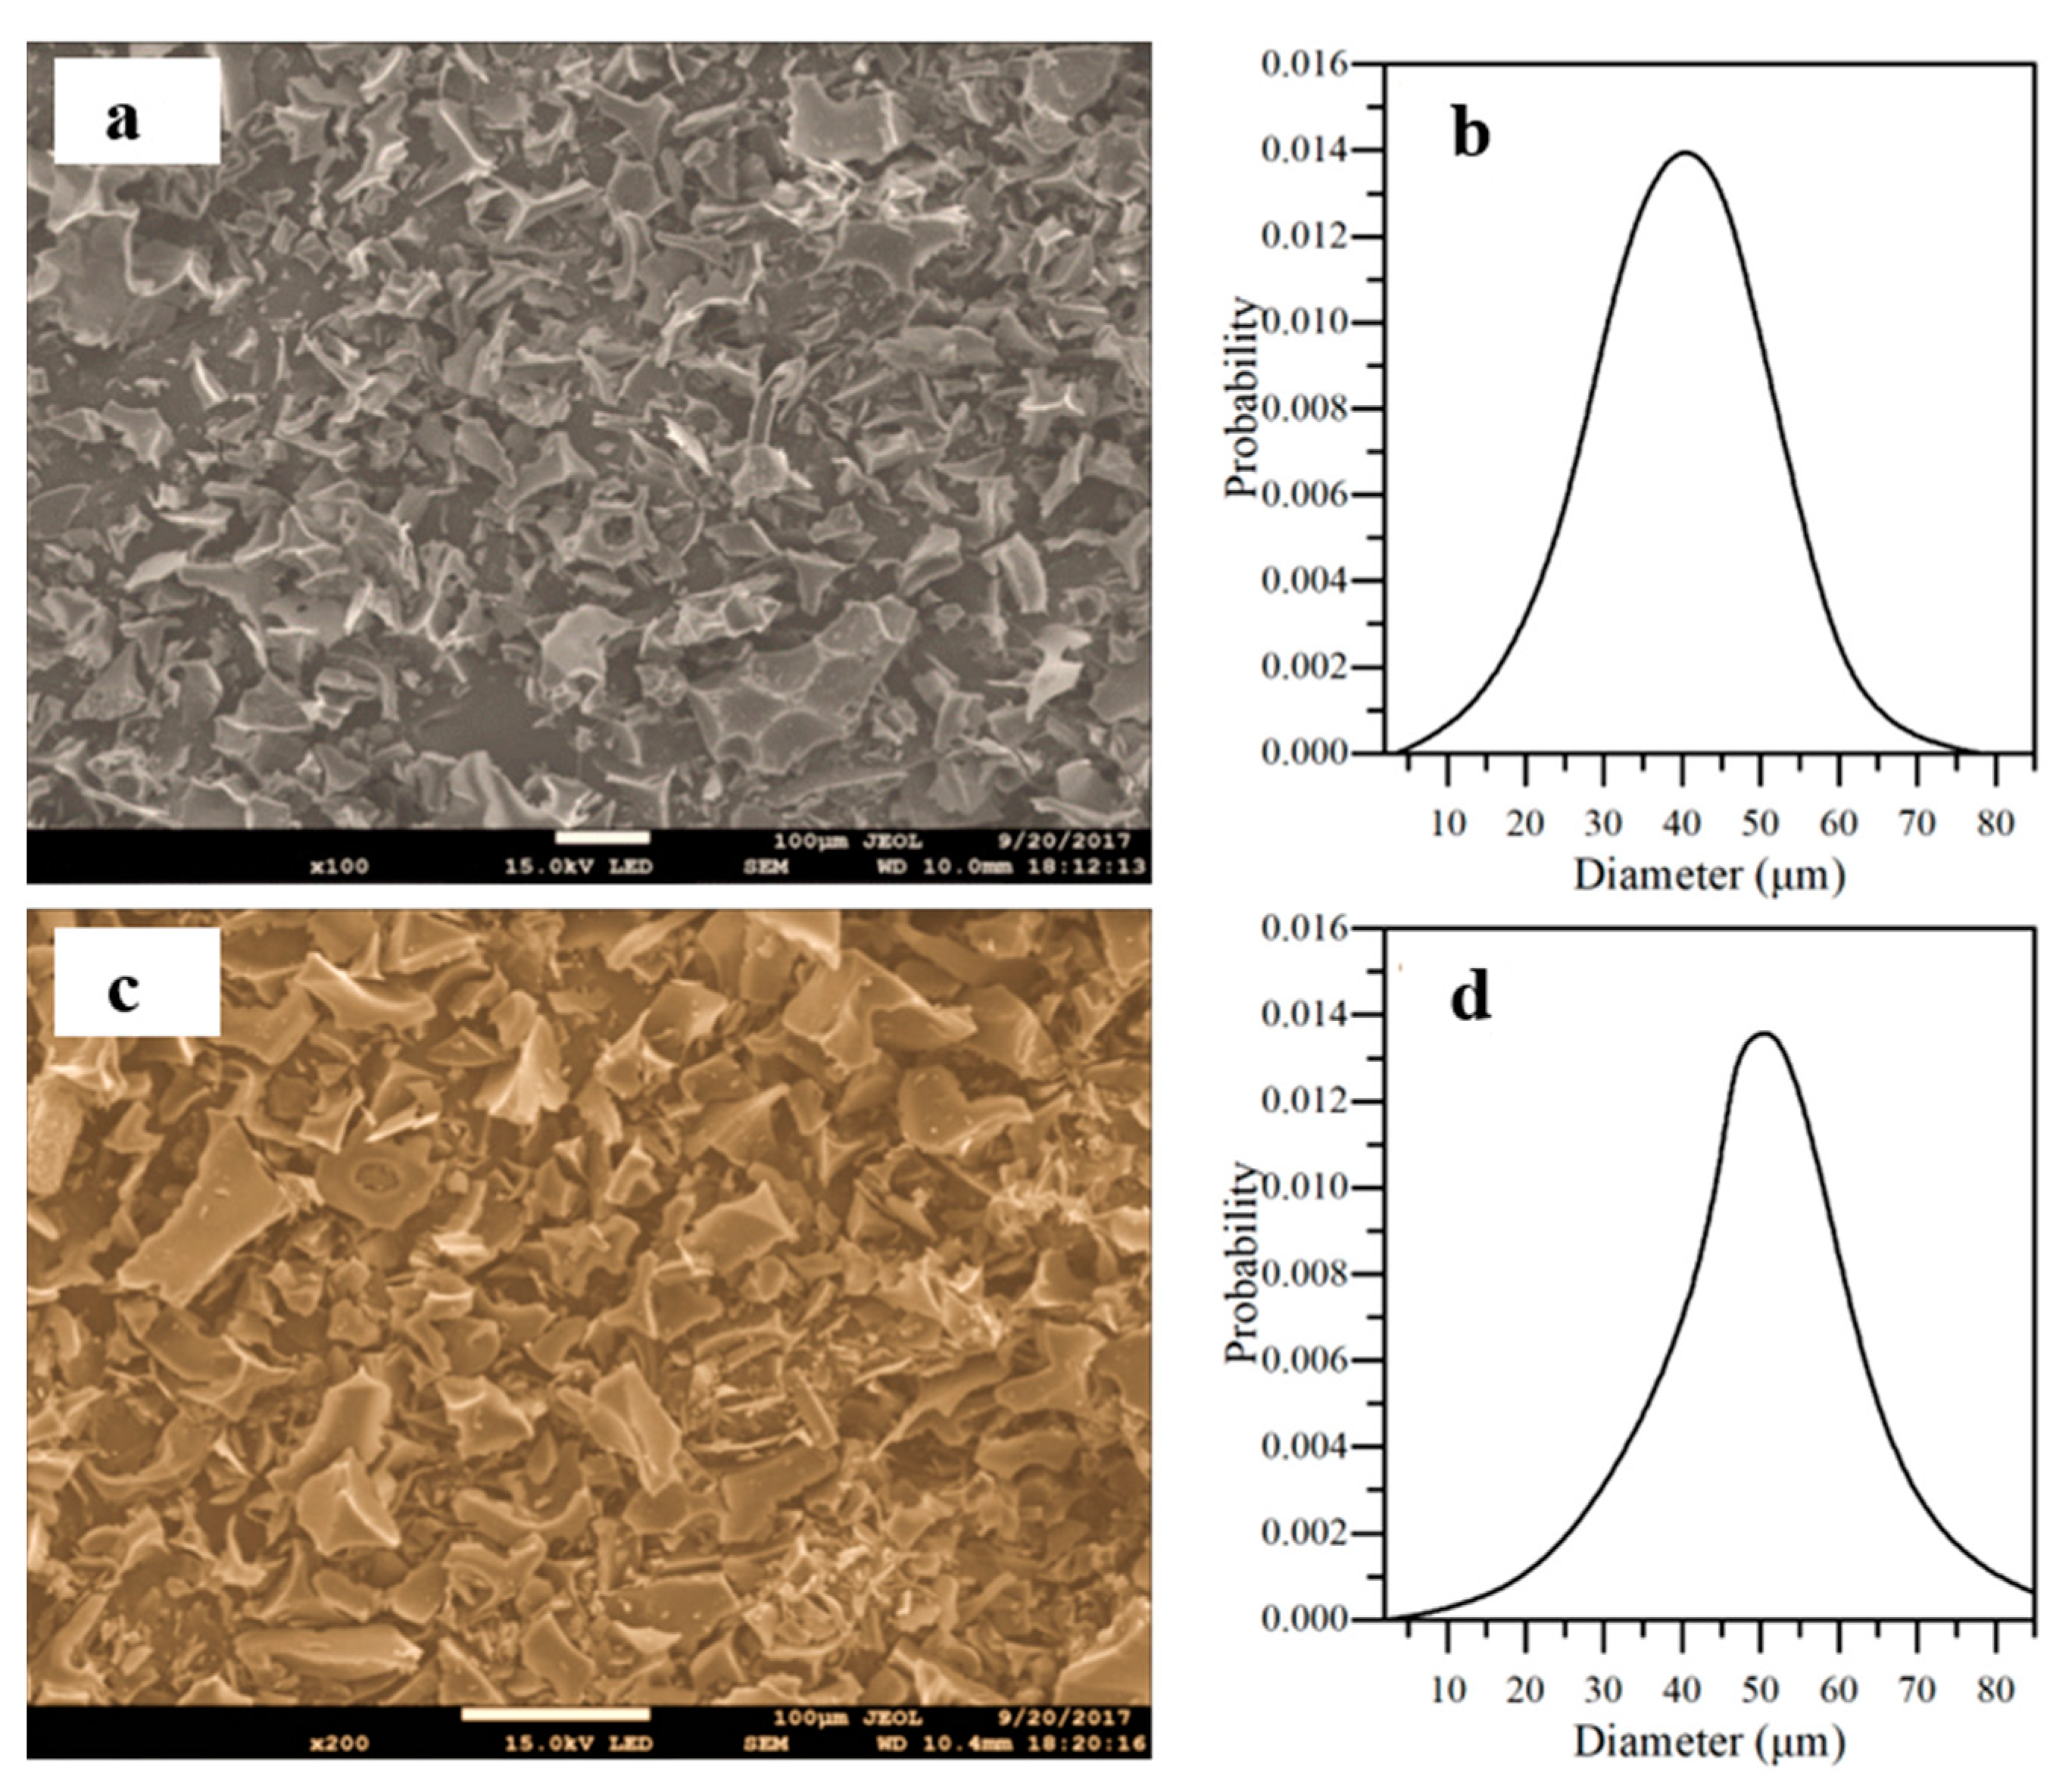
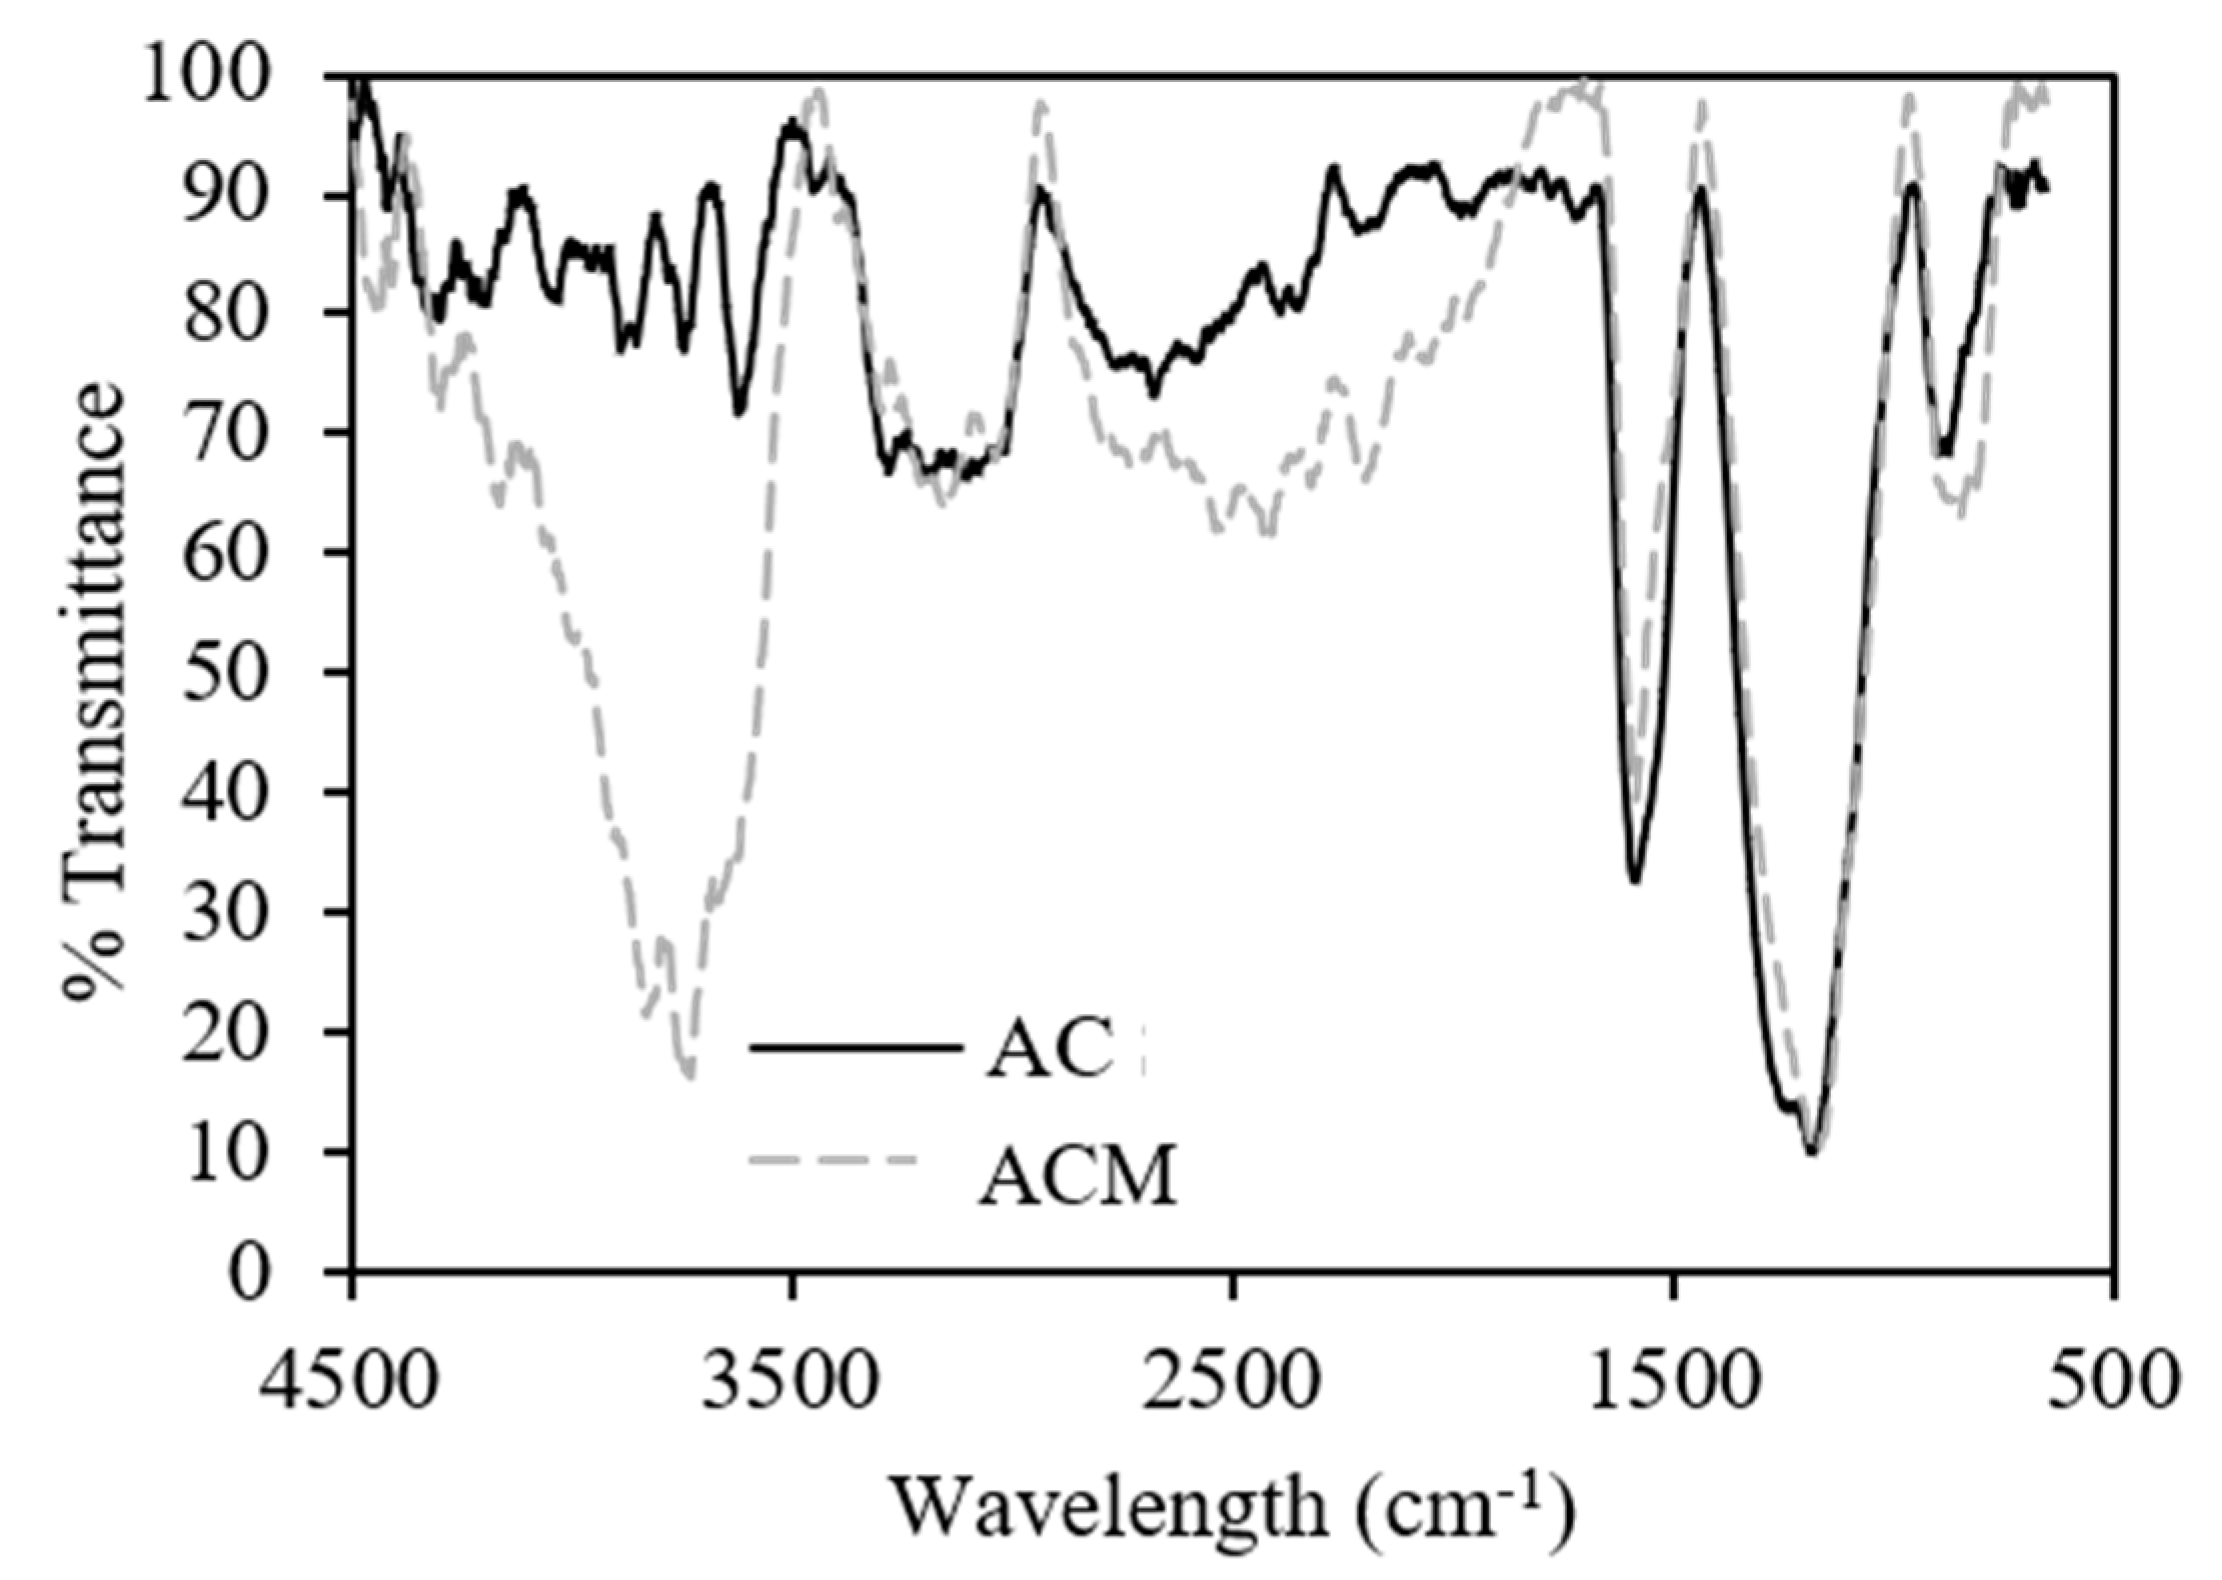
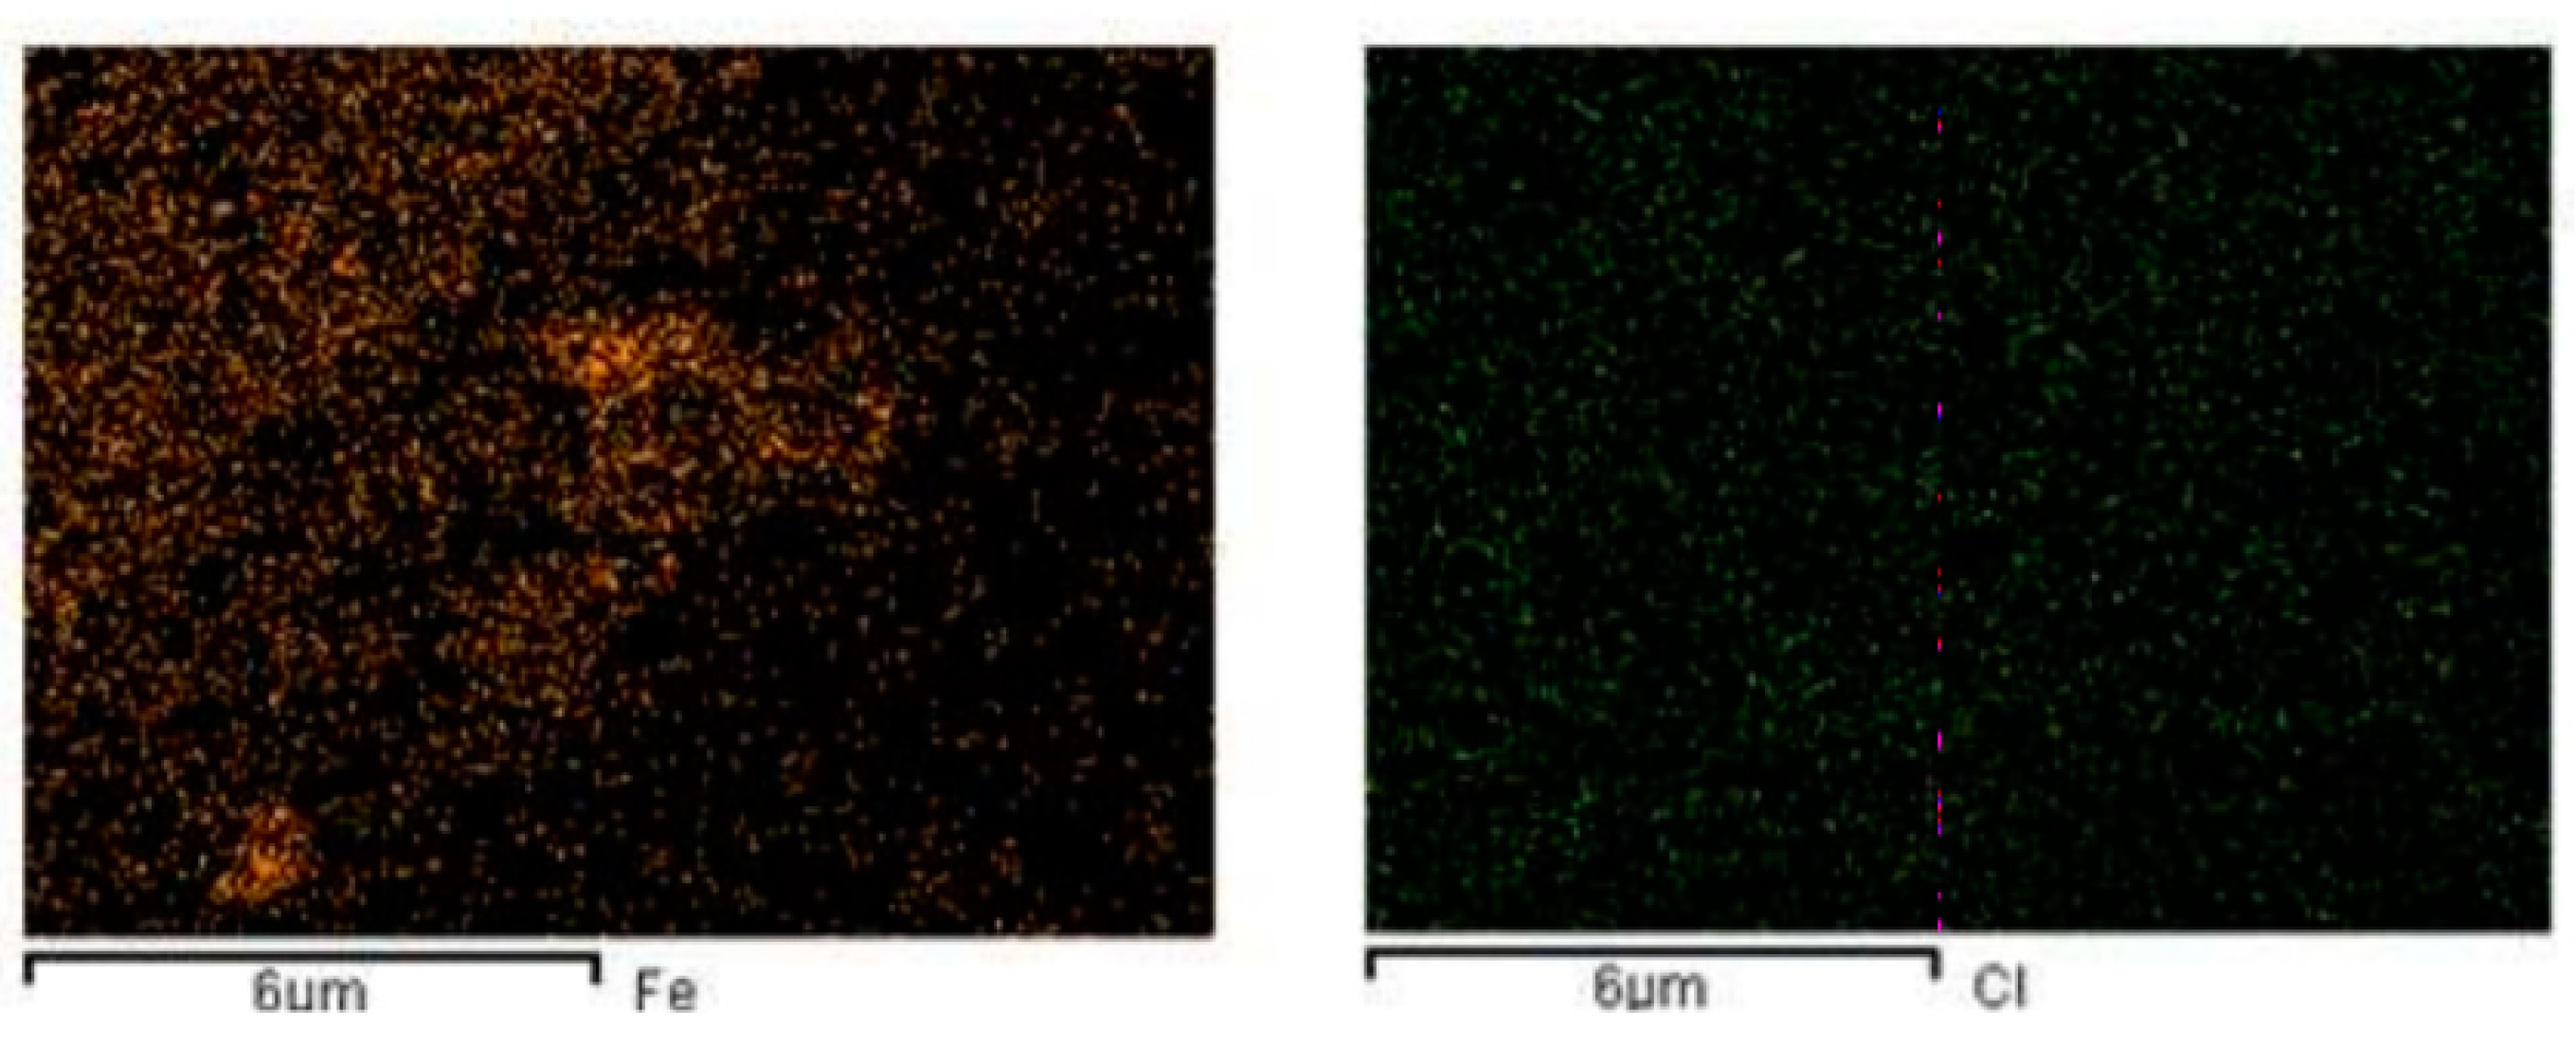
3.2. Activated Carbon Characterization

The pyrolyzed coffee residue (PCR) and the synthesized activated carbon (AC) were analyzed to determine the iodine value. The highest iodine value corresponds to AC (821 mg g−1), which agrees with the reported values for activated carbons (500–1200 mg g−1) [61]. By contrast, PCR shows a low iodine number of 6 mg g−1. The considerable difference in both results is because of the ZnCl2 action in the activation process. Zinc chloride is an agent that can modify the pyrolysis mechanism of carbon-based materials because it is a dehydrating compound. Once the coffee residue has been mixed with ZnCl2, the latter can intermingle into the carbon matrix and remove hydrogen and oxygen atoms during pyrolysis. After carbonization, an interaction between the Zn compounds and the C atoms begins. Thus, the atomic layers of carbon can widen, and pores can form in the carbon matrix [52,53]. The final content of magnetite nanoparticles over AC was verified by TGA, obtaining a content of 5.0%, which indicates the high efficiency of the synthesis process.
Table 1 shows the textural parameters for PCR and AC. As observed, the iodine number is congruent with the materials’ surface area, which was higher for AC than PCR. The area is increased excessively by the activation process with ZnCl2, promoting a well-developed porous structure, thus increasing the surface area estimated by the BET equation (SBET). In this order, the porous texture was studied by nitrogen adsorption. Figure 5 shows the nitrogen adsorption/desorption isotherms for PCR and AC, and their porous characteristics were summarized in Table 1. Micropore volume, W0(N2), and the mean micropore width, L0(N2), were obtained using Dubinin–Radushkevich equations, as well as mesoporous volume, Vmeso(BJH), which was calculated with the Barrette–Joynere–Halenda (BJH) method.
Following the International Union of Pure and Applied Chemistry (IUPAC) classification, the PCR sample exhibits a type II isotherm, typical for macroporous materials. The adsorbed amount is relatively low, which can be due to the small surface area and the material’s adsorptive capacity. The volumes of micropore and mesopore for PCR were 0.0036 and 0.002 cm3 g−1, respectively. The activation of PCR leads to a change in the isotherm shape, obtaining a type I behavior. These isotherms are characteristic of microporous materials with a predominant micropore structure, responsible for the high surface area due to their high porosity. In addition, in Figure 5c, the nitrogen adsorption curve for the ACM material is observed. After AC impregnation, the nanointermediate retains the type I isotherm of nitrogen adsorption, which suggests that it still retains its micro and macroporous properties. The surface area (SBET) obtained was 862 m2 g−1. This result suggests a slight reduction in the surface area due to its functionalization with the magnetite nanoparticles due to the AC material’s porosity.
The morphology and particle size of AC material and ACM nano intermediate were analyzed through SEM images. Figure 6 shows the results obtained. First, it was appreciated that the synthesized materials have an amorphous structure with a presence of blows and pores inherent in the synthesis process used [61]. According to Figure 6b–d, AC has a particle size of about 40 µm and ACM of about 50 µm. This means that the materials comply with the ASTM D5158 standard, stating that synthesized activated carbons must be smaller than 180 μm. The error associated with the measurement was calculated and was equal to 2.32% for the synthesized magnetite nanoparticles, 4.11% for the AC material and 6.81% for the ACM material.
The infrared spectrum was shown in Figure 7. For the activated carbon, the peaks formed in the wavelength ranges of 3890–3500 cm−1 and 3200–2900 cm−1 suggest the presence of O–H stretching vibrations of phenols and moisture on the carbon surface, respectively. The bands between 2800 and 3000 cm−1 indicate the presence of aliphatic stretching. The band at 2312 cm−1 is an indication of the presence of alkyne C≡C groups. The 1560–1530 cm−1 band indicates the presence of an aromatic C=C ring stretching. At 1153 cm−1, the band shows the C–O stretching vibrations in ether, alcohols, ester, or phenols groups [52,53,61]. Likewise, the chemical composition of the activated carbon modified with magnetite nanoparticles (ACM) nano-intermediate was analyzed, in which bands similar to those obtained by the individual systems (activated carbon and magnetite nanoparticles) were obtained.
The elemental composition of the AC and ACM samples was determined by EDX analysis. Figure 8 shows EDX results for the ACM sample, and Table 2 depicts the atomic content for both systems. As a first instance, it was obtained that ACM has an iron content of 5.42%, while AC has no iron in its matrix. For the two samples, a significant chlorine content was evidenced due to the activation process. These results agree with the FTIR analysis.

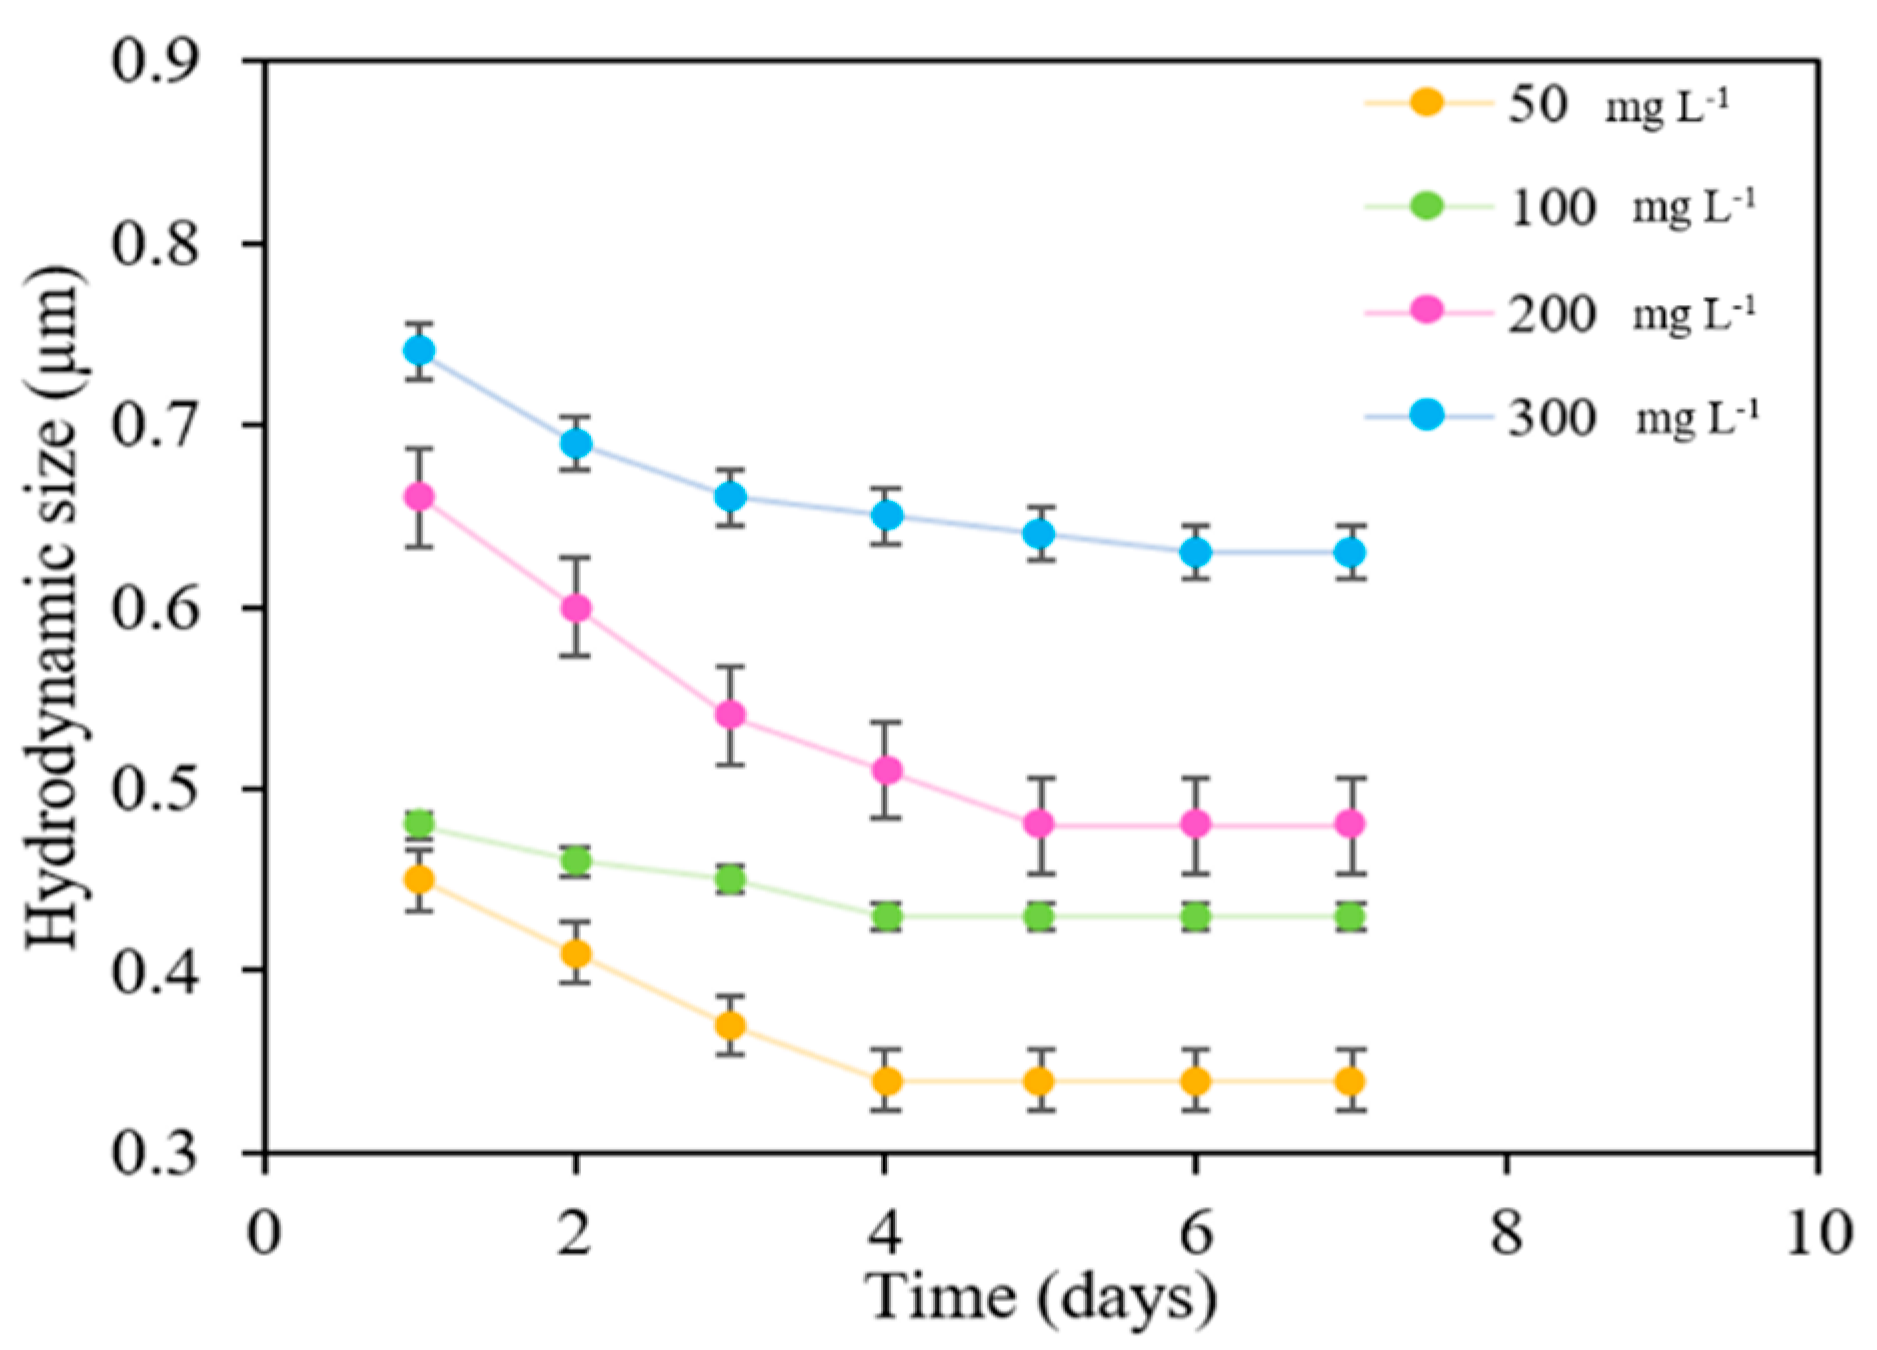
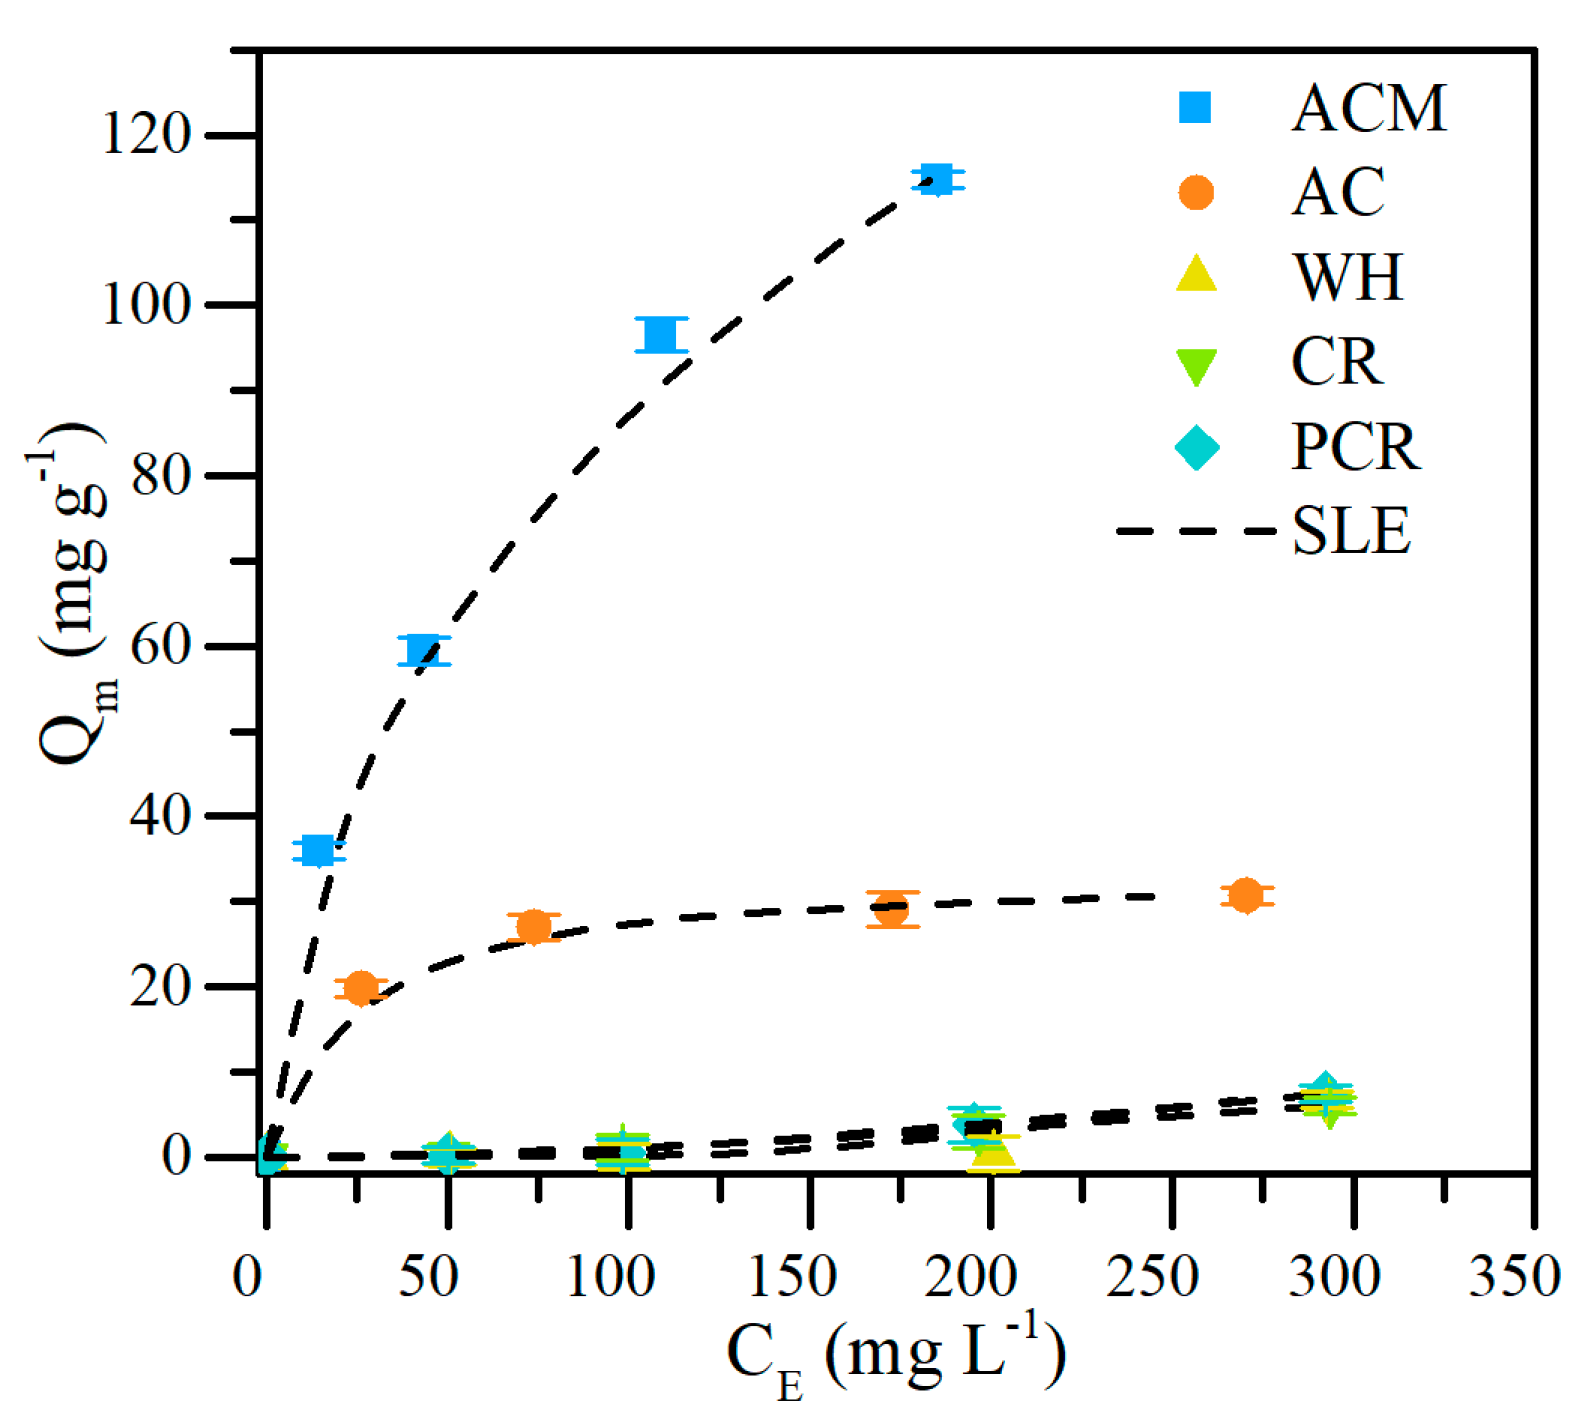
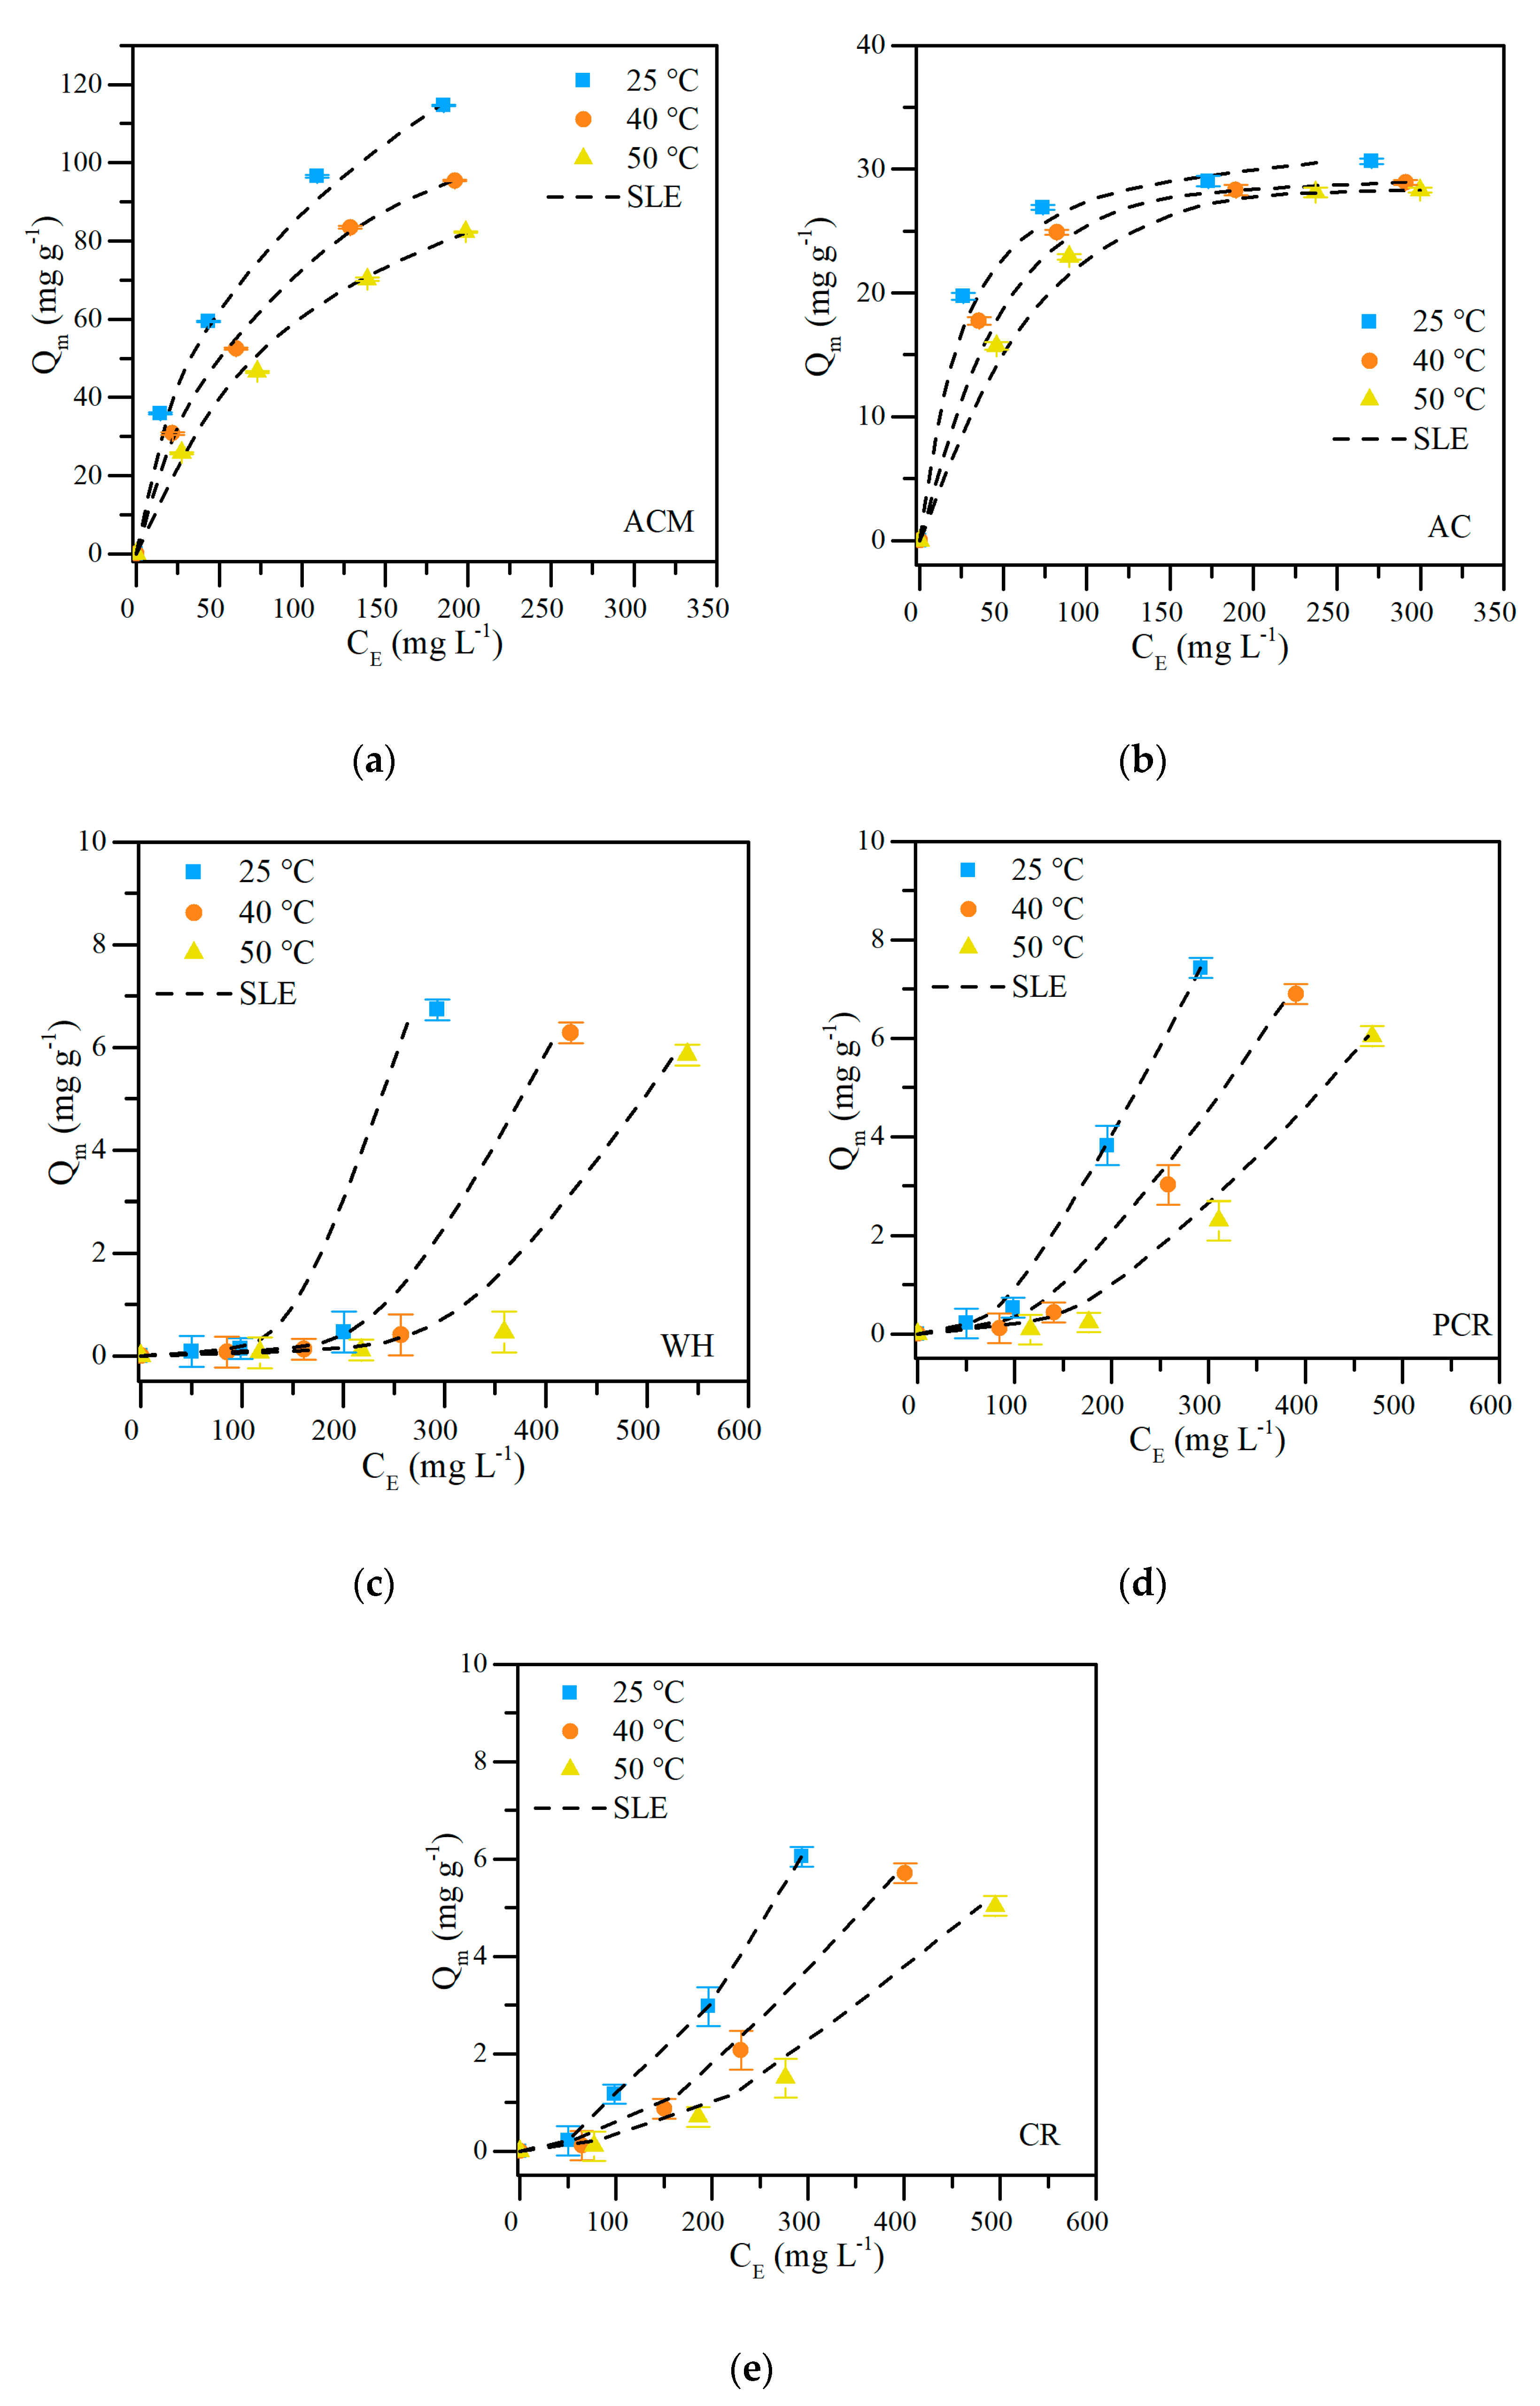
3.3. Adsorption Tests: Batch and Dynamic Experiments

Figure 9 shows the crude oil adsorption isotherms at 25 °C over WH, CR, PCR, AC, and ACM, as well as SLE fitting. Considering the IUPAC classification, it was concluded that crude oil adsorption over AC and ACM behaves like Type Ib isotherm, corresponding to high affinity adsorption systems (liquid–solid), whereas on WH, CR, and PCR it has a type III behavior, typical in solid–liquid systems with relatively weak adsorbent–adsorbate interactions [62]. In AC and ACM, adsorption affinity is higher than WH, CR, and PCR. This suggestion was corroborated by the estimated solid–liquid equilibrium (SLE) parameters, where H decreases in the order WH < CR < PCR < AC < ACM (Table 3). Besides, for a fixed initial crude oil concentration, the adsorbed amount increases as follows: WH < CR < PCR < AC < ACM, showing a higher adsorptive capacity when the samples were activated and modified with the magnetic particles due to the functional groups in the samples (see Figure 7). This result is in agreement with the research of Xiaobing et al. [63], which focused on exploring the potential application of coal to purification of oily waste water. The authors concluded that the absorption mechanism consists of two kinds of absorption, a physical process assisted by a chemical one. In addition, the results follow a similar behavior that surface area. The higher the surface area, the higher the amount adsorbed. In addition, the great capacity of AC and ACM materials to adsorb non-polar substances such as hydrocarbon chains in petroleum is due to the large number of unpaired electrons that these materials contain [64], which, together with the porous structure generated by the randomly joined basal planes [65], provide AC and ACM materials with a high affinity and adsorptive capacity for crude oil.
The excellent result for the ACM sample reflects the beneficial effect of magnetite addition on the AC surface in the current context. It is reported that iron-based nanoparticles present a higher affinity for adsorption of crude oil fractions, based on the selectivity of heteroatoms’ like sulfur, nitrogen, and oxygen, resulting from σ and π bonding with the functional groups on nanoparticles [66].
In general, the oil adsorption mechanism over AC and ACM was based on different steps, including: (i) crude oil adsorption on the external surface of the material, (ii) intraparticle diffusion through the pores of the adsorbent, and (iii) the final stage of adsorption equilibrium.
The effect of temperature on the crude oil adsorption was evaluated by building adsorption isotherms at 25, 40, and 50 °C. Figure 10 shows the results obtained, and Table 4 summarizes the adjustment parameters of the SLE model. For all the ACM and AC systems, type I isotherms were obtained, typical of microporous materials with a great affinity for the organic molecules of crude oil [19,20,67]. For equilibrium crude oil concentrations, the amount of adsorbed crude oil increases as the temperature decreases. For example, at a fixed concentration of 100 mg L−1, the amount of adsorption on the ACM material decreases from 90.2 mg g−1 at 25 °C, to 71.4 mg g−1 and 58.3 mg g−1, at 40 °C and 50 °C, respectively.
The results obtained show that temperature influences the adsorbate/adsorbent attraction and/or repulsion forces. Temperature influences the interaction forces between adsorbate and adsorbent, and this agrees with what was reported in the literature [68]. Furthermore, the parameters H K and Q m support these results, showing a lower affinity (higher constant of Henrys’s Law H ), a higher degree of self-association (higher K ), and a lower amount adsorbed (less Q m ) as temperature increases. Between the type Ib isotherm systems (ACM and AC), the ACM presents the higher value for H as a response of the high affinity for crude oil compounds, whereas, for the type III systems, the H value increases in the order WH < PCR < CR, indicating that CR has a higher affinity for crude oil compared with the other two systems. The K values follow the same trend regardless of the temperature used, increasing in the following order: WH < PCR < CR < AC < ACM. In other words, the ACM system has a greater capacity to reduce the self-association degree of crude oil molecules on its surface than the rest of the systems.
In addition, the thermodynamic parameters were calculated concerning the adsorption results at different levels. They were shown in Table 5. Δ S a d s ° > 0 shows a behavior of molecular disorder (randomness) of the crude molecules’ adsorption on the ACM nano-intermediate’s surface. Furthermore, the values of Δ H a d s ° < 0 and Δ G a d s ° < 0 show that the adsorption process is exothermic and spontaneous. The behavior was maintained for all three (3) evaluated temperatures.
The oil adsorption mechanism was thermodynamically more favorable in the AC system with the lowest values for Δ H a d s ° and Δ G a d s ° of 4.51 kJ mol−1 and 1.27 J (mol K)−1, respectively. On the other hand, this system’s entropy was much lower than the others (0.019 J (mol K)−1). The results agree with the SLE fitting parameters. The system with the lowest K value agrees with the one with the lowest Δ S a d s ° , since by inhibiting the crude oil molecules’ self-association, the molecular disorder in the interface is reduced.

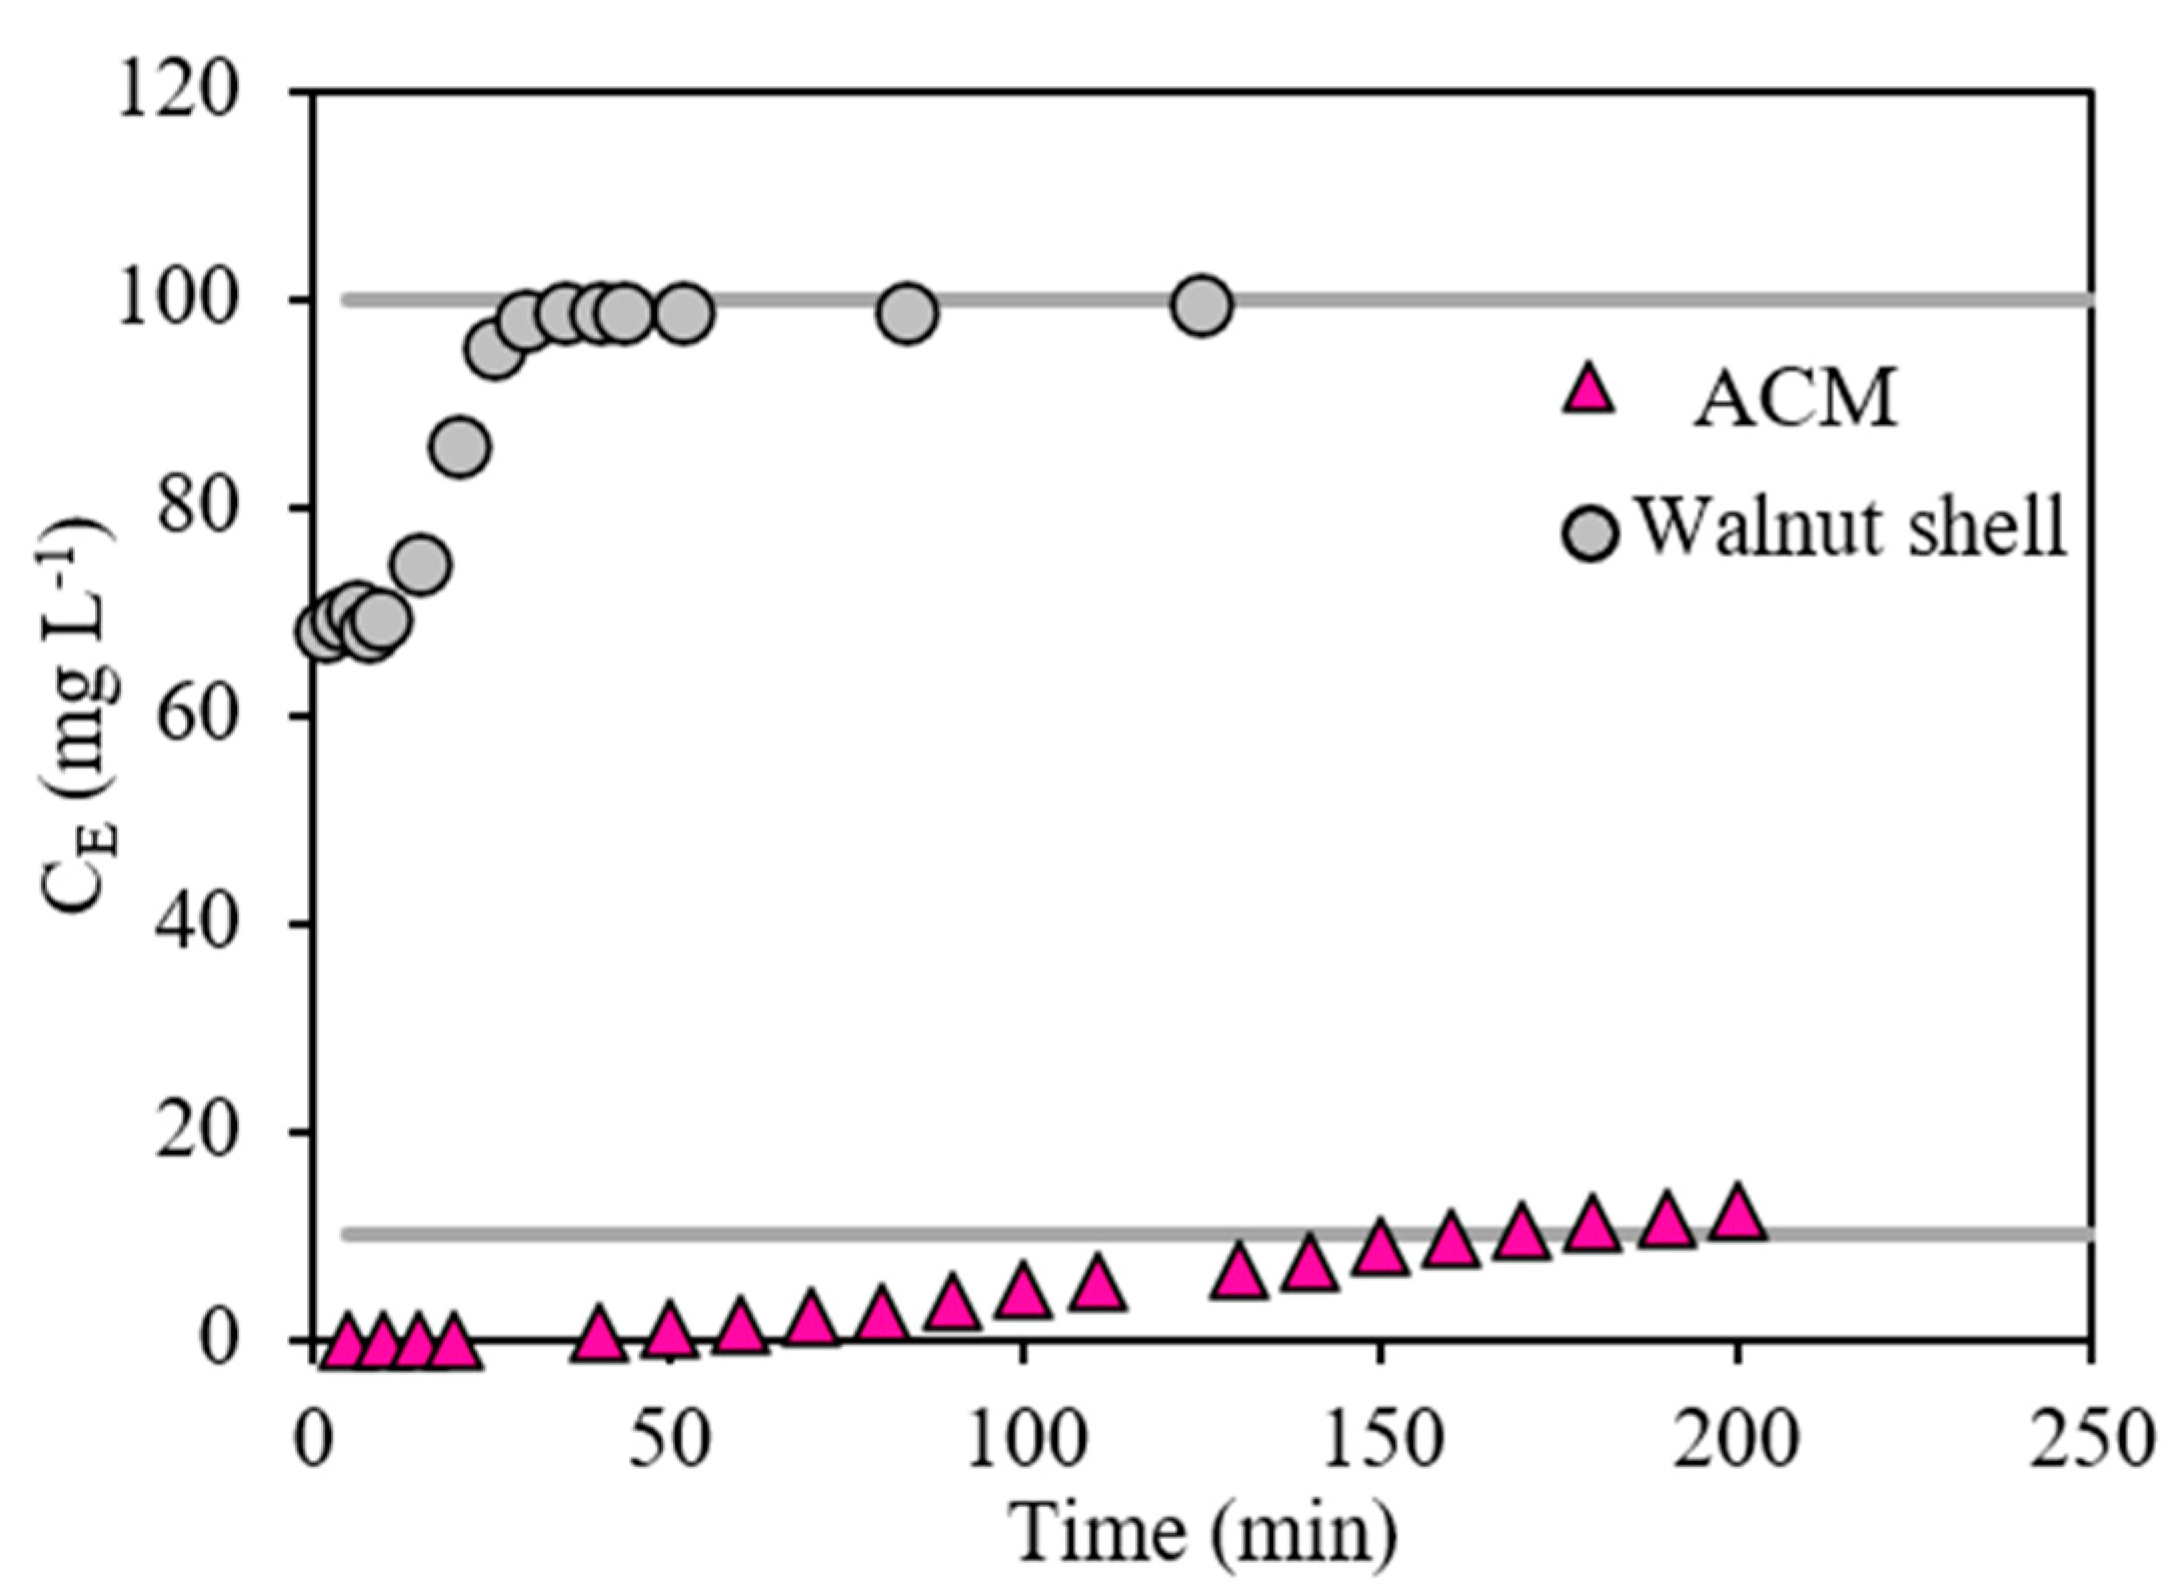
3.4. Dynamic Packed Bed Adsorption Tests

Dynamic tests were done to evaluate the selected material’s (ACM) adsorption capacity under a continuous flow of emulsified crude oil at 100 mg L−1. For comparative purposes, this experiment was also carried out on the walnut shell [5], considered one of the most used agro-industrial products in the oil and gas industry for water treatment. Figure 11 exposes the breakthrough curves. These curves allow visualization through the flow of crude oil through packed beds of ACM and walnut shell, which affects the trapping of hydrocarbon particles. The walnut shell observed that the bed is almost 100% saturated from the first 30 min. Furthermore, from the first recovered effluent, a crude oil concentration of 68 mg L−1 is observed, which does not comply with the limits established by Colombian regulations, where the concentration cannot exceed 10 mg L−1.
On the other hand, the ACM packed bed shows completely different results. The effluents recovered until 170 min present concentrations lower than 10 mg L−1, and the system reached a maximum saturation percentage of 12% when the test was completed. These results show that the removal percentage for the ACM material is 68% more effective than a walnut shell for removing crude oil from O/W emulsions. It reaches almost 100% removal up to more than 1 L of injected emulsion.

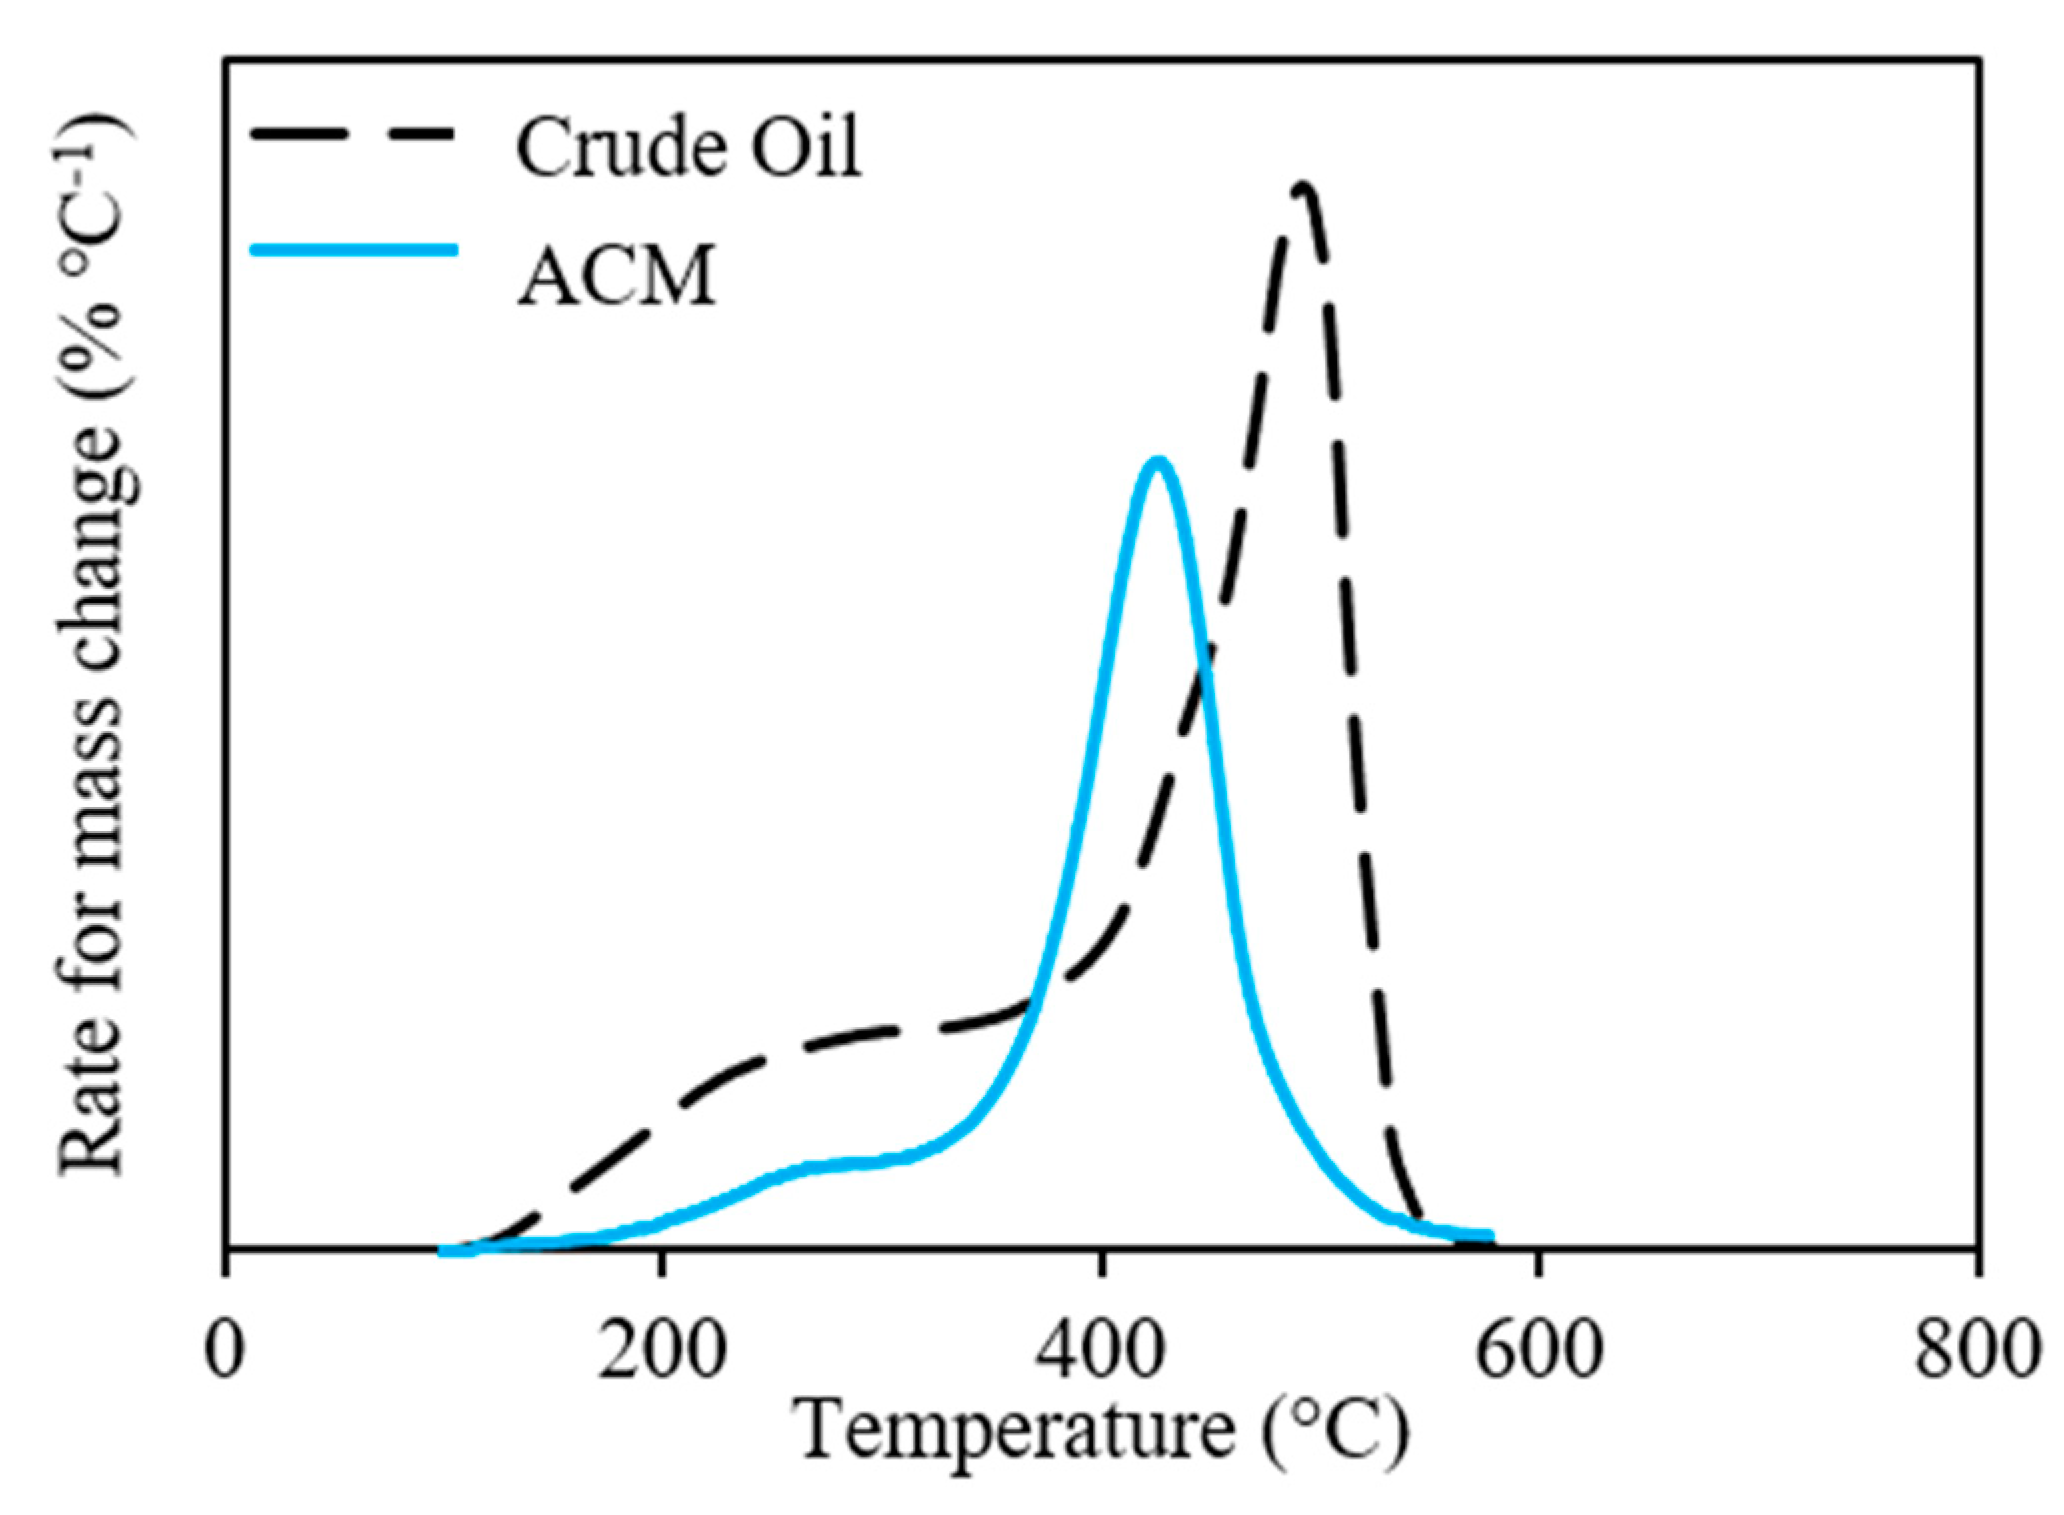
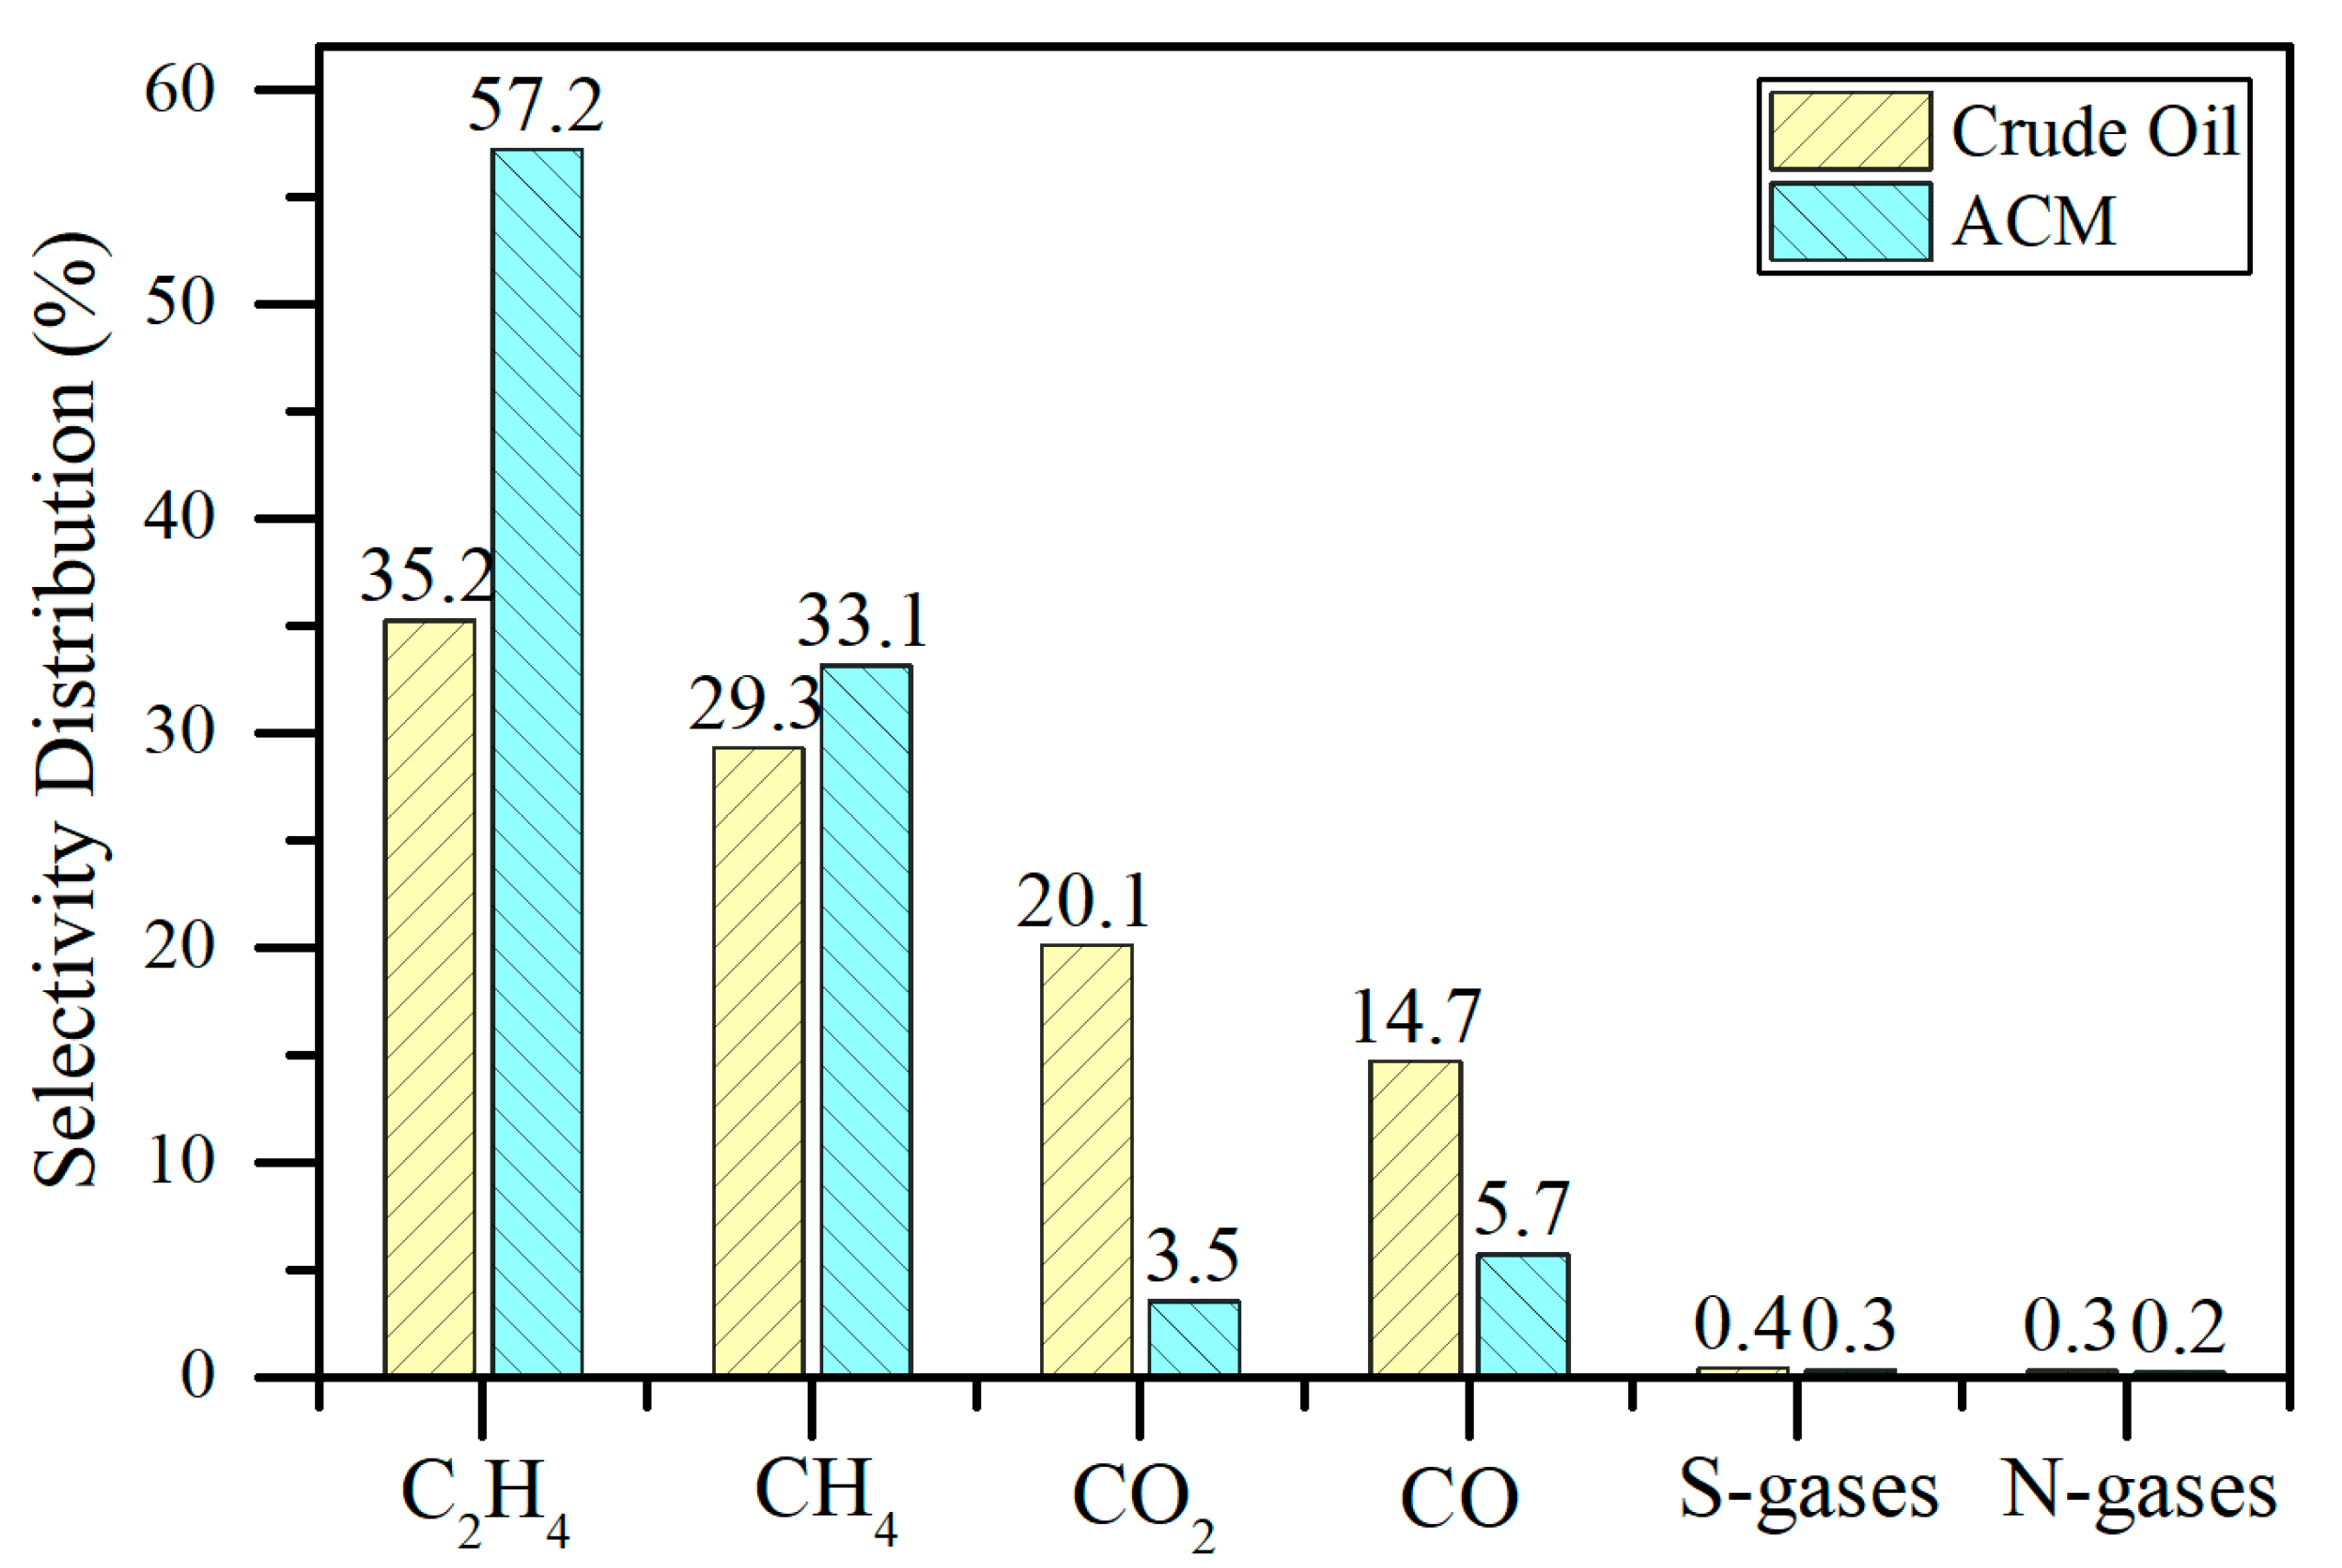
3.5. Crude Oil Decomposition Pyrolysis Process

The final removal of the adsorbed crude oil is a crucial stage in water treatment, as the regeneration of the adsorbent material depends on how efficient the system is to remove the adsorbed crude oil. In this sense, this work proposes heating in an inert atmosphere, simulated with nitrogen injection, to promote thermal and thermocatalytic cracking of hydrocarbons. According to the adsorption results, the ACM sample was selected to evaluate crude oil’s decomposition through pyrolysis processes. To fulfill this purpose, the ACM sample with an adsorbed crude oil load of 0.2 mg m−2 was subjected to heating through nitrogen injection in a wide temperature range (30–600 °C). Figure 12 shows the rate for mass change profiles for virgin crude oil and ACM containing crude oil. The results show that crude oil mass loss began at low temperatures (<200 °C).
Nevertheless, the maximum mass loss peak occurs at approximately 500 °C. In this order, two distinct regions related to distillation and cracking reactions were noted. Distillation is associated with the first mass loss observed at low temperatures. The second and narrower reaction region was extended up to 600 °C. Several authors have reported that distillation of low molecular weight compounds in the initial stages of pyrolysis occurs. However, as the temperature rises, some chemical reactions such as visbreaking and cracking of higher molecular weight species produce volatile compounds [69,70,71]. In addition, the volatilization rate due to progressive evaporation of larger molecules is associated with the transition between both regions. These results indicate the difficulties of removing crude oil at the surface level, generating coke deposition and adsorbents/catalysts poisoning.
When crude oil is adsorbed over on ACM, the onset temperature for pyrolysis reactions appeared to occur at lower temperatures, near 400 °C, which is 100 °C less than virgin crude oil. The deconvolution of this curve leads to crude oil decomposition in two main regions, like the system in the absence of ACM. The first one occurs below 350 °C, associated with alkyl side chains rupture and opening of polycyclic aromatic hydrocarbons (PAH) [72]. Then, at higher temperatures, the catalytic rupture of remaining heavy oil fractions occurs. The material’s catalytic power is noticeable when comparing both curves and was attributed to the presence of hexagonal graphite crystallites on the carbon matrix that acts as critical active sites for possible cracking of lower crude oil compounds [73]. In contrast, iron-sites could produce the breaking of stronger chemical bonds, mainly C-C and C-H. Thereby, magnetite nanoparticles supported on activated carbons present a synergistic effect in crude oil decomposition [74].
The amount of gaseous products evolved during the pyrolysis of virgin and adsorbed crude oil on ACM was obtained and showed in Figure 13. The results show significant differences between the selectivity distribution of the light gases in both scenarios. According to the literature, pyrolysis is dominated by the evaporation of hydrocarbons with a low boiling point, and weak chemical bonds rupture at low temperatures [69,72,75]. This leads to a higher production of LHC, as shown in Figure 13 for both systems. Simultaneously, the mass loss at higher temperatures produces the rupture of chemical bonds between carbon and heteroatoms (N, S, and O), reflected in the releasing of oxygen-, nitrogen-, and sulfur-based species. Contrasting both scenarios, ethylene (C2H4) and CH4 were the main LHC produced during thermal and catalytic thermal cracking of crude oil, and they have been increased by 25% and 8%, respectively, for virgin crude oil to the adsorbed-on ACM. Ethylene can be produced by the rupture of the penultimate β C-C bond in alkyl free radicals containing an unpaired electron, located at the end of the alkyl free radical. C-C bonds’ cleavage in macromolecular olefins generated from the ring-opening of naphthenic hydrocarbons and the dealkylation of the aromatic and naphthenic rings (Caromatic−Cα or Cnaphthenic−Cα) contributes to its emission. As for methane, it can be released at low and high temperatures. First, the cracking of methyl and methylene groups in aliphatic hydrocarbons and alkyl side chines attached to aromatic and naphthenic rings occurs at low temperatures. Then, when the temperature is high, enough reactions of demethylation of the methoxyl groups occur.
On the other hand, gases like CO and CO2 decreased in the catalytic scenario. The formation of CO2 could be attributed first to the decomposition of weak thermal groups like carboxyl and ester groups and second to the craking of ethers, ketones, and oxygen-containing heterocycles. Meanwhile, CO production can be ascribed to the reforming of oxygen-containing groups (carbonyl and ethers), especially those which are liked to aromatic rings. In addition, SOx and NOx gas emissions are reduced when crude oil is adsorbed on the ACM system. These results suggest a direct influence of the ACM material on the thermal cracking of crude oil by increasing the production of gases with added value and reducing polluting gas emissions. Considering the production of the different gases produced, the mixture’s calorific value resulting from the thermal cracking of the crude oil was estimated, obtaining that the virgin crude oil produces a mixture of around 8.59 kcal kg−1, while in the presence of ACM, it increases to 11.33 kcal kg−1. This suggests that the material is promising to generate added value to water treatment.

4. Conclusions

During this study’s development, activated carbon materials have been successfully synthesized from coffee residues in the presence and absence of magnetite nanoparticles. The characterization shows that the activation and functionalization at 5 wt.% of the magnetic nanoparticles were carried out successfully. Zinc chloride plays a vital role in the activation process since it has been shown that its function as a dehydrating agent is to expand the micro and mesopores. The synthesized AC material has better characteristics in terms of iodine number, surface area, and nitrogen adsorption and desorption than the other materials tested. The use of coffee residues to produce coal made it possible to obtain adsorption capacities of up to 38 mg g−1 in the absence of nanoparticles and up to 120 mg g−1 in the presence of magnetite nanoparticles. This is due to exposed functional groups (ferric chloride and iron chloride) that increase the affinity for specific substances in production waters, such as emulsified crude oil and phenols. Thus, this study provides a significant contribution to industrial efforts to carry out oil removal processes. The material has a great adsorptive capacity and affinity for crude oil and has a remarkable capacity for decomposing the adsorbed hydrocarbons at low temperatures. The latter shows the potential of the material for its reuse in several crude adsorption/desorption cycles. The gases produced during the pyrolysis stage can be recovered and used for energy production.

Author Contributions

Conceptualization and project administration, C.A.F., F.B.C., and L.A.; methodology, L.A.; formal analysis, D.G.-C. and O.E.M.; investigation, L.A., D.G.-C. and O.E.M.; data curation, D.G.-C., O.E.M., and L.A.; writing—original draft preparation, D.G.-C. and O.E.M.; writing—review and editing, all authors. All authors have read and agreed to the published version of the manuscript.

Funding

The authors thank COLCIENCIAS, Agencia Nacional de Hidrocarburos (ANH) and Universidad Nacional de Colombia for the financial and logistical support provided through the Agreement 272–2017.

Acknowledgments

The authors thank the research group Fenómenos de superficie-Michael Polanyi for their logistical and financial support. Additionally, the authors thank Urbania for granting us the coffee residue. Finally, the authors thank Maria Angelica Causil and Cesar A. Mora for their technical support in this study.

Conflicts of Interest

The authors declare no conflict of interest.

References

  1. Mohamed, A.-M.O.; El Gamal, M.; Zekri, A.Y. Effect of salinity and temperature on water cut determination in oil reservoirs. J. Pet. Sci. Eng. 2003, 40, 177–188. [Google Scholar] [CrossRef]
  2. ANH. Estadísticas de Producción de Petróleo en Colombia. Available online: http://www.anh.gov.co/Operaciones-Regalias-y-Participaciones/Sistema-Integrado-de-Operaciones/Paginas/Estadisticas-de-Produccion.aspx (accessed on 15 July 2019).
  3. Fakhru’l-Razi, A.; Pendashteh, A.; Abdullah, L.C.; Biak, D.R.A.; Madaeni, S.S.; Abidin, Z.Z. Review of technologies for oil and gas produced water treatment. J. Hazard. Mater. 2009, 170, 530–551. [Google Scholar] [CrossRef] [PubMed]
  4. Ebrahimi, M.; Willershausen, D.; Ashaghi, K.S.; Engel, L.; Placido, L.; Mund, P.; Bolduan, P.; Czermak, P. Investigations on the use of different ceramic membranes for efficient oil-field produced water treatment. Desalination 2010, 250, 991–996. [Google Scholar] [CrossRef] [Green Version]
  5. Srinivasan, A.; Viraraghavan, T. Removal of oil by walnut shell media. Bioresour. Technol. 2008, 99, 8217–8220. [Google Scholar] [CrossRef]
  6. Arthur, J.D.; Langhus, B.G.; Patel, C. Technical Summary of Oil & Gas Produced Water Treatment Technologies; All Consulting, LLC: Tulsa, OK, USA, 2005. [Google Scholar]
  7. Alkhudhiri, A.; Darwish, N.; Hilal, N. Produced water treatment: Application of air gap membrane distillation. Desalination 2013, 309, 46–51. [Google Scholar] [CrossRef]
  8. Ministerio de Medio Ambiente y Desarrollo sostenible. Por el cual se establecen los parámetros límites máximos permisibles en los vertimientos puntuales a cuerpos de aguas superficiales y a los sistemas de alcantarillado público y se dictan otras disposiciones. In Resolución 0631; Ministerio de Medio Ambiente y Desarrollo sostenible: Bogotá, Colombia, 2015; Volume 0631, p. 62. [Google Scholar]
  9. Dickinson, E. Biopolymer-based particles as stabilizing agents for emulsions and foams. Food Hydrocoll. 2017, 68, 219–231. [Google Scholar] [CrossRef]
  10. Lee, R.F. Agents which promote and stabilize water-in-oil emulsions. Spill Sci. Technol. Bull. 1999, 5, 117–126. [Google Scholar] [CrossRef]
  11. Seifriz, W. Studies in emulsions. J. Phys. Chem. 1925, 29, 738–749. [Google Scholar] [CrossRef]
  12. Yan, N.; Gray, M.R.; Masliyah, J.H. On water-in-oil emulsions stabilized by fine solids. Colloids Surf. A Physicochem. Eng. Asp. 2001, 193, 97–107. [Google Scholar] [CrossRef]
  13. Naranjo Agudelo, A.d.J. Manejo de producción en campos de petróleo. Fac. Minas 1989, 45, 26–85. [Google Scholar]
  14. Judd, S.; Qiblawey, H.; Al-Marri, M.; Clarkin, C.; Watson, S.; Ahmed, A.; Bach, S. The size and performance of offshore produced water oil-removal technologies for reinjection. Sep. Purif. Technol. 2014, 134, 241–246. [Google Scholar] [CrossRef]
  15. Saththasivam, J.; Loganathan, K.; Sarp, S. An overview of oil–water separation using gas flotation systems. Chemosphere 2016, 144, 671–680. [Google Scholar] [CrossRef] [PubMed]
  16. Alzahrani, S.; Mohammad, A.W. Challenges and trends in membrane technology implementation for produced water treat-ment: A review. J. Water Process Eng. 2014, 4, 107–133. [Google Scholar] [CrossRef]
  17. Mancilla Estupinan, R.A.; Mesa Nausa, H.O. Metodología Para el Manejo de Aguas de Producción en un Campo Petrolero; Universidad Industrial de Santander: Bucaramanga, Colombia, 2012. [Google Scholar]
  18. Zapata Acosta, K.; Carrasco-Marin, F.; Cortés, F.B.; Franco, C.A.; Lopera, S.H.; Rojano, B.A. Immobilization of P. stutzeri on activated carbons for degradation of hydrocarbons from oil-in-saltwater emulsions. Nanomaterials 2019, 9, 500. [Google Scholar] [CrossRef] [PubMed] [Green Version]
  19. Franco, C.A.; Cortés, F.B.; Nassar, N.N. Adsorptive removal of oil spill from oil-in-fresh water emulsions by hydrophobic alumina nanoparticles functionalized with petroleum vacuum residue. J. Colloid Interface Sci. 2014, 425, 168–177. [Google Scholar] [CrossRef] [PubMed]
  20. Franco, C.A.; Martínez, M.; Benjumea, P.; Patiño, E.; Cortés, F.B. Water remediation based on oil adsorption using nanosilicates functionalized with a petroleum vacuum residue. Adsorpt. Sci. Technol. 2014, 32, 197–207. [Google Scholar] [CrossRef]
  21. Yu, L.; Hao, G.; Gu, J.; Zhou, S.; Zhang, N.; Jiang, W. Fe3O4/PS magnetic nanoparticles: Synthesis, characterization and their application as sorbents of oil from waste water. J. Magn. Magn. Mater. 2015, 394, 14–21. [Google Scholar] [CrossRef]
  22. Okiel, K.; El-Sayed, M.; El-Kady, M.Y. Treatment of oil–water emulsions by adsorption onto activated carbon, bentonite and deposited carbon. Egypt. J. Pet. 2011, 20, 9–15. [Google Scholar] [CrossRef] [Green Version]
  23. Zhu, Q.; Pan, Q.; Liu, F. Facile removal and collection of oils from water surfaces through superhydrophobic and superoleo-philic sponges. J. Phys. Chem. C 2011, 115, 17464–17470. [Google Scholar] [CrossRef]
  24. Seeni Meera, K.M.; Murali Sankar, R.; Jaisankar, S.N.; Mandal, A.B. Physicochemical studies on polyurethane/siloxane cross-linked films for hydrophobic surfaces by the sol–gel process. J. Phys. Chem. B 2013, 117, 2682–2694. [Google Scholar] [CrossRef]
  25. Annunciado, T.; Sydenstricker, T.; Amico, S. Experimental investigation of various vegetable fibers as sorbent materials for oil spills. Mar. Pollut. Bull. 2005, 50, 1340–1346. [Google Scholar] [CrossRef] [PubMed]
  26. Rajaković-Ognjanović, V.; Aleksić, G.; Rajaković, L. Governing factors for motor oil removal from water with different sorption materials. J. Hazard. Mater. 2008, 154, 558–563. [Google Scholar] [CrossRef] [PubMed]
  27. Sudong Yanga, L.C.; Lei, M.; Ma, P.-C. Magnetic graphene foam for efficient adsorption of oil and organic solvents. Colloid Interface Sci. 2014, 430, 337–344. [Google Scholar] [CrossRef] [PubMed]
  28. da Costa Cunha, G.; Pinho, N.C.; Silva, I.A.A.; Silva, L.S.; Costa, J.A.S.; da Silva, C.M.; Romão, L.P. Removal of heavy crude oil from water surfaces using a magnetic inorganic-organic hybrid powder and membrane system. J. Environ. Man-Agement 2019, 247, 9–18. [Google Scholar] [CrossRef]
  29. Fard, A.K.; Rhadfi, T.; Mckay, G.; Al-marri, M.; Abdala, A.; Hilal, N.; Hussien, M.A. Enhancing oil removal from water using ferric oxide nanoparticles doped carbon nanotubes adsorbents. Chem. Eng. J. 2016, 293, 90–101. [Google Scholar] [CrossRef] [Green Version]
  30. Bakhshi, P.; Tavakol, H. Oil removal from water using highly hydrophobic, ultralight carbon microspheres. International J. Environ. Sci. Technol. 2020, 17, 1649–1656. [Google Scholar] [CrossRef]
  31. Lamine, S.M.; Ridha, C.; Mahfoud, H.-M.; Mouad, C.; Lotfi, B.; Al-Dujaili, A.H. Chemical activation of an activated carbon prepared from coffee residue. Energy Procedia 2014, 50, 393–400. [Google Scholar] [CrossRef] [Green Version]
  32. Bates, R.H. The International Coffee Organization. In Analytic Narratives; Princeton University Press: Princeton, NJ, USA, 1999; p. 194. [Google Scholar]
  33. Boudrahem, F.; Aissani-Benissad, F.; Aït-Amar, H. Batch sorption dynamics and equilibrium for the removal of lead ions from aqueous phase using activated carbon developed from coffee residue activated with zinc chloride. J. Environ. Manag. 2009, 90, 3031–3039. [Google Scholar] [CrossRef] [PubMed]
  34. Oliveira, L.C.; Pereira, E.; Guimaraes, I.R.; Vallone, A.; Pereira, M.; Mesquita, J.P.; Sapag, K. Preparation of activated carbons from coffee husks utilizing FeCl3 and ZnCl2 as activating agents. J. Hazard. Mater. 2009, 165, 87–94. [Google Scholar] [CrossRef] [PubMed]
  35. Hernándeza, M.A.; Gonzálezb, A.J.; Suárezb, F.; Ochoac, C.; Candelac, A.M.; Cabezab, I. Assessment of the biohydrogen production potential of different organic residues in Colombia: Cocoa waste, pig manure and coffee mucilage. Chem. Eng. 2018, 65. [Google Scholar] [CrossRef]
  36. Medina, O.E.; Caro-Vélez, C.; Gallego, J.; Cortés, F.B.; Lopera, S.H.; Franco, C.A. Upgrading of Extra-Heavy Crude Oils by Dispersed Injection of NiO–PdO/CeO2±δ Nanocatalyst-Based Nanofluids in the Steam. Nanomaterials 2019, 9, 1755. [Google Scholar] [CrossRef] [PubMed] [Green Version]
  37. Medina, O.E.; Gallego, J.; Restrepo, L.G.; Cortés, F.B.; Franco, C.A. Influence of the Ce4+/Ce3+ Redox-couple on the cyclic regeneration for adsorptive and catalytic performance of NiO-PdO/CeO2±δ nanoparticles for n-C7 asphaltene steam gasifi-cation. Nanomaterials 2019, 9, 734. [Google Scholar] [CrossRef] [PubMed] [Green Version]
  38. Medina, O.E.; Gallego, J.; Arias-Madrid, D.; Cortés, F.B.; Franco, C.A. Optimization of the load of transition metal oxides (Fe2O3, Co3O4, NiO and/or PdO) onto CeO2 nanoparticles in catalytic steam decomposition of n-C7 asphaltenes at low temperatures. Nanomaterials 2019, 9, 401. [Google Scholar] [CrossRef] [PubMed] [Green Version]
  39. Medina Erao, O.E.; Gallego, J.; Olmos, C.M.; Chen, X.; Cortés, F.B.; Franco, C.A. Effect of Multifunctional Nanocatalysts on n-C7 Asphaltene Adsorption and Subsequent Oxidation under High Pressure Conditions. Energy Fuels 2020. [Google Scholar] [CrossRef]
  40. Medina, O.E.; Hurtado, Y.; Caro-Velez, C.; Cortés, F.B.; Riazi, M.; Lopera, S.H.; Franco, C.A. Improvement of Steam Injection Processes Through Nanotechnology: An Approach through in Situ Upgrading and Foam Injection. Energies 2019, 12, 4633. [Google Scholar] [CrossRef] [Green Version]
  41. Arias-Madrid, D.; Medina, O.E.; Gallego, J.; Acevedo, S.; Correa-Espinal, A.A.; Cortés, F.B.; Franco, C.A. NiO, Fe2O3, and MoO3 Supported over SiO2 Nanocatalysts for Asphaltene Adsorption and Catalytic Decomposition: Optimization through a Simplex–Centroid Mixture Design of Experiments. Catalysts 2020, 10, 569. [Google Scholar] [CrossRef]
  42. Villegas, J.P.; Arcila, N.; Ortega, D.; Franco, C.A.; Cortés, F.B. Crude oil removal from production water using nano-intermediates of a SiO 2 support functionalized with magnetic nanoparticles. Dyna 2017, 84, 65–74. [Google Scholar] [CrossRef]
  43. Kilduff, J.E.; King, C.J. Effect of carbon adsorbent surface properties on the uptake and solvent regeneration of phenol. Ind. Eng. Chem. Res. 1997, 36, 1603–1613. [Google Scholar] [CrossRef]
  44. Carroll, D.; Starkey, H.C. Reactivity of clay minerals with acids and alkalies. Clays Clay Miner. 1971, 19, 321–333. [Google Scholar] [CrossRef]
  45. Shahadat, M.; Isamil, S. Regeneration performance of clay-based adsorbents for the removal of industrial dyes: A review. RSC Adv. 2018, 8, 24571–24587. [Google Scholar]
  46. Olajire, A.A. Review of ASP EOR (alkaline surfactant polymer enhanced oil recovery) technology in the petroleum industry: Prospects and challenges. Energy 2014, 77, 963–982. [Google Scholar] [CrossRef]
  47. Liu, C.; Yang, J.; Tang, Y.; Yin, L.; Tang, H.; Li, C. Versatile fabrication of the magnetic polymer-based graphene foam and applications for oil–water separation. Colloids Surf. A Physicochem. Eng. Asp. 2015, 468, 10–16. [Google Scholar] [CrossRef]
  48. Wang, H.; Lin, K.-Y.; Jing, B.; Krylova, G.; Sigmon, G.E.; McGinn, P.; Zhu, Y.; Na, C. Removal of oil droplets from contaminated water using magnetic carbon nanotubes. Water Res. 2013, 47, 4198–4205. [Google Scholar] [CrossRef] [PubMed]
  49. Franco, C.A.; Nassar, N.N.; Cortés, F.B. Removal of oil from oil-in-saltwater emulsions by adsorption onto nano-alumina functionalized with petroleum vacuum residue. J. Colloid Interface Sci. 2014, 433, 58–67. [Google Scholar] [CrossRef] [PubMed]
  50. Petcharoen, K.; Sirivat, A. Synthesis and characterization of magnetite nanoparticles via the chemical co-precipitation method. Mater. Sci. Eng. B 2012, 177, 421–427. [Google Scholar] [CrossRef]
  51. Llanos, S.; Acevedo, S.; Cortés, F.B.; Franco, C.A. Effect of the Asphaltene Oxidation Process on the Formation of Emulsions of Water in Oil (W/O) Model Solutions. Energies 2018, 11, 722. [Google Scholar] [CrossRef] [Green Version]
  52. Boonamnuayvitaya, V.; Sae-ung, S.; Tanthapanichakoon, W. Preparation of activated carbons from coffee residue for the adsorption of formaldehyde. Sep. Purif. Technol. 2005, 42, 159–168. [Google Scholar] [CrossRef]
  53. Khenniche, L.; Aissani, F. Preparation and characterization of carbons from coffee residue: Adsorption of salicylic acid on the prepared carbons. J. Chem. Eng. Data 2009, 55, 728–734. [Google Scholar] [CrossRef]
  54. Fang, M.; Volotinen, T.T.; Kulkarni, S.; Belova, L.; Rao, K.V. Effect of embedding Fe 3 O 4 nanoparticles in silica spheres on the optical transmission properties of three-dimensional magnetic photonic crystals. J. Appl. Phys. 2010, 108, 103501. [Google Scholar] [CrossRef]
  55. Naderi, M. Surface Area: Brunauer–Emmett–Teller (BET). In Progress in filtration and separation; Elsevier: Amsterdam, The Netherlands, 2015; pp. 585–608. [Google Scholar]
  56. Villegas, J.P.; Moncayo-Riascos, I.; Galeano-Caro, D.; Riazi, M.; Franco, C.A.; Cortés, F.B. Functionalization of γ-Alumina and Magnesia Nanoparticles with a Fluorocarbon Surfactant to Promote Ultra-Gas-Wet Surfaces: Experimental and Theoretical Approach. ACS Appl. Mater. Interfaces 2020, 12, 13510–13520. [Google Scholar] [CrossRef]
  57. Medina, O.E.; Gallego, J.; Rodríguez, E.; Franco, C.A.; Cortés, F.B. Effect of pressure on the oxidation kinetics of Asphaltenes. Energy Fuels 2019, 33, 10734–10744. [Google Scholar] [CrossRef]
  58. Medina, O.E.; Gallego, J.; Nassar, N.N.; Acevedo, S.A.; Cortés, F.B.; Franco, C.A. Thermo-Oxidative Decomposition Behaviors of Different Sources of n-C7 Asphaltenes at High-Pressure Conditions. Energy Fuels 2020. [Google Scholar] [CrossRef]
  59. Balamurugan, M.; Saravanan, S.; Soga, T. Synthesis of iron oxide nanoparticles by using Eucalyptus globulus plant extract. e-J. Surf. Sci. Nanotechnol. 2014, 12, 363–367. [Google Scholar] [CrossRef] [Green Version]
  60. El Ghandoor, H.; Zidan, H.; Khalil, M.M.; Ismail, M. Synthesis and some physical properties of magnetite (Fe3O4) nanoparti-cles. Int. J. Electrochem. Sci. 2012, 7, 5734–5745. [Google Scholar]
  61. Saka, C. BET, TG–DTG, FT-IR, SEM, iodine number analysis and preparation of activated carbon from acorn shell by chemical activation with ZnCl2. J. Anal. Appl. Pyrolysis 2012, 95, 21–24. [Google Scholar] [CrossRef]
  62. Czepirski, L.; Balys, M.R.; Komorowska-Czepirska, E. Some generalization of Langmuir adsorption isotherm. Internet J. Chem. 2000, 3, 1099–8292. [Google Scholar]
  63. Xiaobing, L.; ZHANG, C.; Jiongtian, L. Adsorption of oil from waste water by coal: Characteristics and mechanism. Min. Sci. Technol. (China) 2010, 20, 778–781. [Google Scholar]
  64. Marsh, H. Activated Carbon compendium: A Collection of Papers from the Journal Carbon 1996–2000; Elsevier: Amsterdam, The Netherlands, 2001. [Google Scholar]
  65. Gu, W.; Yushin, G. Review of nanostructured carbon materials for electrochemical capacitor applications: Advantages and limitations of activated carbon, carbide-derived carbon, zeolite-templated carbon, carbon aerogels, carbon nanotubes, on-ion-like carbon, and graphene. Wiley Interdiscip. Rev. Energy Environ. 2014, 3, 424–473. [Google Scholar] [CrossRef]
  66. Zhou, J.; Zhou, X.; Sun, X.; Li, R.; Murphy, M.; Ding, Z.; Sun, X.; Sham, T.-K. Interaction between Pt nanoparticles and carbon nanotubes–An X-ray absorption near edge structures (XANES) study. Chem. Phys. Lett. 2007, 437, 229–232. [Google Scholar] [CrossRef]
  67. Nassar, N.N. Iron oxide nanoadsorbents for removal of various pollutants from wastewater: An overview. In Application of Ad-Sorbents for Water Pollution Control; Bentham Science Publishers: Sharjah, UAE, 2012; pp. 81–118. [Google Scholar]
  68. Feng, Y.; Yang, F.; Wang, Y.; Ma, L.; Wu, Y.; Kerr, P.G.; Yang, L. Basic dye adsorption onto an agro-based waste material–Sesame hull (Sesamum indicum L.). Bioresour. Technol. 2011, 102, 10280–10285. [Google Scholar] [CrossRef]
  69. Liu, D.; Hou, J.; Luan, H.; Pan, J.; Song, Q.; Zheng, R. Coke yield prediction model for pyrolysis and oxidation processes of low-asphaltene heavy oil. Energy Fuels 2019, 33, 6205–6214. [Google Scholar] [CrossRef]
  70. Czajka, K.; Kisiela, A.; Moroń, W.; Ferens, W.; Rybak, W. Pyrolysis of solid fuels: Thermochemical behaviour, kinetics and compensation effect. Fuel Process. Technol. 2016, 142, 42–53. [Google Scholar] [CrossRef]
  71. Medina, O.E.; Olmos, C.; Lopera, S.H.; Cortés, F.B.; Franco, C.A. Nanotechnology Applied to Thermal Enhanced Oil Recovery Processes: A Review. Energies 2019, 12, 4671. [Google Scholar] [CrossRef] [Green Version]
  72. Rezaei, M.; Schaffie, M.; Ranjbar, M. Thermocatalytic in situ combustion: Influence of nanoparticles on crude oil pyrolysis and oxidation. Fuel 2013, 113, 516–521. [Google Scholar] [CrossRef]
  73. Orge, C.; Órfão, J.; Pereira, M. Carbon xerogels and ceria–carbon xerogel materials as catalysts in the ozonation of organic pollutants. Appl. Catal. B: Environ. 2012, 126, 22–28. [Google Scholar] [CrossRef]
  74. Rim, K.T.; Eom, D.; Chan, S.-W.; Flytzani-Stephanopoulos, M.; Flynn, G.W.; Wen, X.-D.; Batista, E.R. Scanning tunneling microscopy and theoretical study of water adsorption on Fe3O4: Implications for catalysis. J. Am. Chem. Soc. 2012, 134, 18979–18985. [Google Scholar] [CrossRef] [PubMed]
  75. Amrollahi Biyouki, A.; Hosseinpour, N.; Nassar, N.N. Pyrolysis and Oxidation of Asphaltene-Born Coke-like Residue Formed onto in Situ Prepared NiO Nanoparticles toward Advanced in Situ Combustion Enhanced Oil Recovery Processes. Energy Fuels 2018, 32, 5033–5044. [Google Scholar] [CrossRef]
Figure 1. Change in hydrodynamic size (d50) for 7 days for emulsions prepared at different crude oil concentrations between 50 and 300 mg L−1.
Processes 09 00063 g001
Figure 2. Experimental setup for dynamic adsorption tests consisting of (1) positive displacement pump, (2) cylinder, (3) regulating valves, (4) open packed-bed system and (5) effluent collection.
Processes 09 00063 g002
Figure 3. SEM micrograph (a) and the corresponding particle size probability distribution (b) for magnetite nanoparticles.
Processes 09 00063 g003
Figure 4. FTIR spectra of synthesized magnetite nanoparticles.
Processes 09 00063 g004
Figure 5. Adsorption/desorption isotherms N2 at −196 °C of (a) pyrolyzed coffee residue (PCR), (b) synthesized activated carbon (AC) and (c) activated carbon modified with 5.0 wt.% of magnetite nanoparticles (ACM)
Processes 09 00063 g005
Figure 6. SEM micrograph of synthesized activated carbon (AC) (a) and activated carbon modified with 5.0 wt.% of magnetite nanoparticles (ACM) (c), and the corresponding particle size probability distribution of synthesized activated carbon (AC) (b) and activated carbon modified with 5.0 wt.% of magnetite nanoparticles (ACM) (d).
Processes 09 00063 g006
Figure 7. FTIR of the synthesized and modified activated carbon. The continuous line indicates the FTIR for the synthesized activated carbon (AC) material, whereas the dotted line refers to the FTIR for the activated carbon modified with 5.0 wt.% of magnetite nanoparticles (ACM) material.
Processes 09 00063 g007
Figure 8. Mapping of elements present on the surface of the activated carbon modified with 5.0 wt.% of magnetite nanoparticles (ACM) sample by SEM-EDX analysis.
Processes 09 00063 g008
Figure 9. Comparison between adsorption isotherms of crude oil over walnut shell (WH), coffee residue (CR), the pyrolyzed coffee residue (PCR), the synthesized activated carbon (AC), and activated carbon modified with 5.0 wt.% of magnetite nanoparticles (ACM). pH = 7.15, temperature = 25 °C, and the adsorbent dose was 1 g L−1.
Processes 09 00063 g009
Figure 10. Crude oil adsorption isotherms in (a) activated carbon modified with 5.0 wt.% of magnetite nanoparticles (ACM), (b) synthesized activated carbon (AC), (c) walnut shell (WH), (d) pyrolyzed coffee residue (PCR), and (e) coffee residue (CR), at different temperatures of 25 °C, 40 °C and 50 °C. pH = 7.1 and the adsorbent dose was 1 g L−1.
Processes 09 00063 g010
Figure 11. Breakthrough curves for the walnut shell (WH) and activated carbon modified with 5.0 wt.% of magnetite nanoparticles (ACM), at room temperature conditions and with an initial concentration of 100 mg L−1 of crude oil in water.
Processes 09 00063 g011
Figure 12. The plot of the rate for mass loss of virgin crude oil and those in the presence of activated carbon modified with magnetite nanoparticles. Crude oil adsorbed was present at 0.2 mg m−2, nitrogen flow at 100 mL min−1, a heating rate of 20 °C min−1, and the temperature uncertainty was 0.1 °C.
Processes 09 00063 g012
Figure 13. Selectivity distribution of gaseous products released from pyrolysis of crude oil in the presence and absence of activated carbon modified with 5.0 wt.% of magnetite nanoparticles (ACM).
Processes 09 00063 g013
Table 1. Porous textural characteristics of the pyrolyzed coffee residue (PCR) and the synthesized activated carbon (AC).
SampleSBET
m2 g−1
W0 (N2)
cm3 g−1
L0 (N2)
nm
Vmeso (BJH)
cm3 g−1
PCR4.00.0036 0.290.002
AC905.10.5224.280.16
Table 2. Compositional analysis EDX of the activated carbon modified with 5.0 wt.% of magnetite nanoparticles (ACM) and without nanoparticles (AC).
ElementACACM
Cl0.421.96
Fe0.005.42
Table 3. Adjustment parameters of Solid Liquid Equilibrium (SLE) model for adsorption isotherms.
Adsorbent H ( mg   g 1 ) K ( g   g 1 ) Q m   ( mg   g 1 ) %RSME
ACM0.401.520.1910.002
AC0.549.000.0410.015
PCR505.762041.030.0080.002
CR223.01691.500.0090.014
WH1418.214000.800.0120.121
Table 4. SLE model parameters crude oil adsorption over at 25 °C, 40 °C, and 50°C for activated carbon modified with 5.0 wt.% of magnetite nanoparticles (ACM), the synthesized activated carbon (AC), the pyrolyzed coffee residue (PCR), coffee residue (CR), and walnut shell (WH).
MaterialTemperature (°C) H ±   0.02   ( mg   g 1 ) K ±   0.08   ( mg   g 1 ) Q m   ±   0.01   ( g   g 1 ) RSME (%)
ACM250.401.520.19000.0020
400.511.630.16000.0190
500.831.750.16000.0160
AC250.388.090.03730.0097
403.1912.030.03110.0001
504.4712.060.03120.0001
PCR25505.762041.030.00950.0020
40791.902319.070.00920.0033
501137.482579.590.00860.0062
CR25223.01691.500.01080.0135
40380.94934.260.00960.0270
50592.531208.320.00830.0455
WH251418.214000.800.01200.1209
402418.284366.360.19000.0599
503389.824771.230.21000.1054
Table 5. Thermodynamic parameters for the adsorption of crude oil in oil-in-water emulsions, for activated carbon modified with 5.0 wt.% of magnetite nanoparticles (ACM), the synthesized activated carbon (AC), The pyrolyzed coffee residue (PCR), coffee residue (CR), and Walnut shell (WH), for temperatures of 25 °C, 40 °C and 50 °C.
MaterialTemperature (°C) Δ S a d s °   ±   0.02   ( J   ( mol   K ) 1 ) Δ H a d s °   ±   0.01   ( kJ   mol 1 ) Δ G a d s °   ±   0.01   ( J   mol 1 )
ACM250.0194.521.04
401.27
501.50
AC250.06012.795.45
405.18
506.48
PCR250.0885.626.69
4021.82
5022.76
CR250.11417.8816.21
4017.81
5019.07
WH250.0897.5018.89
4020.18
5021.11
Publisher’s Note: MDPI stays neutral with regard to jurisdictional claims in published maps and institutional affiliations.

