1. Introduction
Biomass is a renewable raw material source of energy and chemical compounds. Biomass can be converted by biological and thermochemical processes. The most important thermochemical processes are combustion, gasification and pyrolysis. The pyrolysis process makes it possible to convert biomass into gas, liquid and solid products. The fast pyrolysis of biomass carried out at high heating rates, at a final temperature of 450–500 °C and very short contact time of products, maximizes the liquid fraction called bio-oil [
1]. The bio-oil, also called pyrolysis oil, can be separated into an aqueous fraction and nonaqueous (ligninic) fraction by adding water. The aqueous fraction contains mainly compounds derived from the depolymerisation of cellulose and hemicellulose, such as organic acids, including acetic acid; ketones, such as acetol, also named hydroxyacetone; and alcohols, among others. These oxygenated compounds can produce hydrogen and liquid compounds by reforming processes.
Catalytic steam reforming works at low atmospheric pressures and temperatures in the range of 550–800 °C. So, Chornet et al. studied the conversion of the aqueous fraction of bio-oil by catalytic steam reforming to hydrogen production and observed that nickel-based catalysts achieved a good conversion to H
2, although coke was produced which deactivated the catalyst [
2,
3,
4,
5]. Garcia et al. [
6] investigated the composition of the catalyst in this process using nickel catalysts modified with cobalt or chromium to decrease the amount of coke that formed on the catalyst. Other studies have been carried out in fixed and fluidized beds to improve the production of hydrogen by catalytic steam reforming of the aqueous fraction of bio-oil, varying the operating conditions, and the nickel catalyst has been supported on alumina, modified with cobalt, copper, cerium, magnesium or calcium [
7,
8,
9,
10]. However, this process requires a lot of energy to vaporize water, and the gas obtained is rich in CO.
Aqueous Phase Reforming (APR) is a process developed by Dumesic and co-workers, with its first reference in 2002 [
11]. This process is appropriate to convert aqueous streams with low organic content because it does not need to vaporize water, which reduces energy requirements for hydrogen production. The temperature is around 220–270 °C at moderate pressures of 25–50 bar. Another advantage of the APR process is that temperatures and pressures are favourable for water-gas shift (WGS) reaction, resulting in a gas with low CO content. More advantages can be found in the review of Davda et al. [
12]. A significant number of studies have focused on the APR of alcohols and polialcohols, such as ethylene glycol, glycerol and sorbitol. However, the studies of APR which have focused on the conversion of compounds derived from biomass pyrolysis are scarce [
13].
There are also some studies of the bio-oil aqueous fraction reforming under supercritical conditions. Supercritical water conditions require temperatures higher than 374 °C and pressures higher than 221 bar. Supercritical water reforming of model compounds of bio-oil aqueous fraction, such as acetic acid, acetol and butanol without and with catalyst, was studied by Ortiz and co-workers [
14,
15]. Chakinala et al. [
16] studied the effect of several catalysts for the conversion of the bio-oil aqueous fraction in supercritical water conditions. However, these are conditions considerably more exigent than those needed in the APR process. The corrosion of materials in supercritical water is a relevant aspect.
Arandia et al. [
17] studied the aqueous phase reforming of representative model compounds of a bio-oil aqueous fraction, such as acetic acid, ethanol, acetol and catechol, as well as a mixture of all of them. They studied the influence of different nickel-based catalysts at 230 °C and 32 bar. The experiments were performed in a continuous fixed-bed reactor with a catalyst weight/mass flow rate of organics of 7.5 g catalyst min/g organic. This work focused on gas production, and some qualitative analyses of the liquid phase were carried out with the purpose of identifying the product compounds in liquid phase after the APR reaction.
Lou’s group performed some studies focused on aqueous phase reforming of the low boiling fraction of rice husk pyrolyzed bio-oil. They employed a real feed obtained by evaporating of the crude oil under vacuum. The experiments were performed in a stainless-steel autoclave at 260 °C. They analysed the effect of a platinum catalyst [
18], the size of Pt/Al
2O
3 [
19] and the recyclability of Pt catalysts supported on mixed oxides [
20].
Vispute and Huber studied hydrogen and alkane production from the aqueous fraction of bio-oil by aqueous phase processing. A real aqueous fraction derived from oak wood was first hydrogenated. Then, APR was performed for hydrogen production with a Pt/Al
2O
3 catalyst at 265 °C and 55.1 bar [
21].
Oasmaa and Meier [
22] determined the presence of butanol in the alcohol fraction of bio-oil. Butanol has been considered a model compound of bio-oil and its conversion to hydrogen has been studied by steam reforming as the only compound and in mixtures [
23,
24,
25,
26]. The study of the APR of butanol is relevant both as a model compound of bio-oil and because n-butanol can be produced by biological processes and has been proposed as an alternative to conventional gasoline and diesel fuels.
This work presents an experimental study with the purpose of converting the aqueous fraction of bio-oil and some model compounds in valuable products by APR.
Nickel catalysts have been widely used in this process because they are inexpensive and have high activity and selectivity to hydrogen, but they can be deactivated by carbon deposits on their surface. Remón et al. developed a Ni-based catalyst prepared by coprecipitation, which modified the support with Mg and the active phase with Co. This catalyst has been employed in steam reforming process of glycerol and the aqueous fraction of bio-oil [
27,
28,
29,
30,
31] and has shown good results and the lowest coke production among all those tested. Thus, in the present work, the effect of catalyst loading in the APR process employing a Ni-Co/Al-Mg catalyst was studied. Experiments with catalyst weight/organic mass flow rate (W/m) ratio from 5–40 g catalyst min/g organic have been performed feeding acetol, butanol and acetic acid individually as model compounds of the aqueous fraction of bio-oil. Also, a mixture of acetol, butanol and acetic acid was also employed and was finally studied a real aqueous fraction of bio-oil. Operating conditions influence the conversion of the organic compounds to gas and liquid products. In this work, quantitative analyses of gas and liquid products of the model compounds were carried out. Qualitative analyses of liquid stream for the APR of the real aqueous fraction were performed. To the best of our knowledge, this is the first time that catalyst loading has been studied in the APR of model compounds of the bio-oil aqueous fraction. This work contributes to increasing the knowledge of converting the bio-oil aqueous fraction into valuable products, gases and liquids. The specific role of Ni-Co/Al-Mg catalyst on APR has been analysed and provides relevant results in academic fields, such as yields to products. Moreover, the observed catalyst deactivation is significant to perform the process in an industrial scale.
2. Materials and Methods
The experimental system was developed and manufactured by PID Eng&Tech (Madrid, Spain). This enabled the continuous feeding of the aqueous solution by means of a high-performance liquid chromatography (HPLC) pump. Temperature and pressure of the experiments were appropriately controlled. The catalyst, with a particle size between 160 m and 250 μm, was mixed with inert sand of the same size and placed inside the tubular reactor between quartz wool supports. The stainless steel tubular reactor had an inner diameter of 9 mm. More details about this installation can be found in previous works [
27,
28].
The gas flow was analyzed with an Agilent 3000 Micro GC equipped with a molecular sieve column, a Plot U column and Thermal Conductivity Detectors (TCD), where N2, H2, CH4, CO2, CO, C2H6 and C3H8 can be quantified. The liquid flow exiting from the reactor was depressurized, cooled and analysed with an Agilent 7820A GC equipped with an Agilent 7693A automatic injector, an HP-FFAP Agilent 19091F-105 capillary column and a Flame Ionization Detector (FID), where liquid products were quantified. Previously, the compounds in the liquid product were identified by Gas Chromatography-Mass Spectrometry (GC-MS). Due to the complexity of the real aqueous fraction its liquid effluent was qualitatively analysed by GC-MS/FID.
All the experiments were carried out at 40 absolute bar of system pressure, 227 °C of reaction temperature and a feeding flow rate of 1 mL/min. The amount of catalyst in the reaction bed was adjusted to obtain a catalyst weight/organic flow rate ratio (W/m) from 5 g to 40 g catalyst min/g organic. The experiments were performed mostly for 3 h.
The catalyst used was prepared by coprecipitation in the laboratory. This catalyst, Ni-Co/Al-Mg, had a Ni molar content of 28% expressed as Ni/(Ni+Al+Co+Mg) and Mg/Al and Co/Ni atomic ratios of 0.26 and 0.10, respectively. Thus, the molar composition of each metal in the catalyst was 54.91% Al, 28% Ni, 14.28% Mg and 2.8% Co. More explanations about its preparation and characterization have been described by Remón et al. [
8]. This catalyst has been employed in the steam reforming of glycerol and the aqueous fraction of bio-oil [
29,
30,
31]. The Ni-Co/Al-Mg catalyst was calcined in air atmosphere at a final temperature of 750 °C for 3 h. Before the APR reaction, the catalyst was in situ reduced with a hydrogen flow rate of 100 cm
3 (STP)/min at 650 °C for 1 h.
Acetol (purity: ≥97.5%, Sigma-Aldrich, St. Louis, MO, USA), 1-butanol (purity: ≥99.5%, Scharlau, Sentmenat, Spain) and acetic acid (purity: ≥99.5%, Panreac, Barcelona, Spain) were fed as only compound with 5 wt% in deionized water. A simulated aqueous fraction of bio-oil with 5 wt% of acetol, 5 wt% of butanol and 5 wt% of acetic acid in deionized water was also employed as feed. Moreover, a real aqueous fraction of bio-oil was also used as feed in the APR experiments.
The bio-oil generated from pine sawdust was supplied by Biomass Technology Group BV (BTG). The aqueous fraction was obtained by adding the bio-oil slowly to distilled water in 1:2 weight ratio with constant stirring. This was the same procedure employed in the work of Remón et al. [
8]. The ultimate analysis and Karl Fischer analysis of the aqueous fraction of bio-oil can be found in that work. The chemical analysis of the aqueous fraction of bio-oil carried out by GC-FID is shown in
Table 1.
The compound with highest area FID % was acetic acid (37.74), followed by ethanol (16.91) and acetol (15.29). These main components have been studied in other published works, such as the study by Pan et al. [
18], in which acetic acid and acetol were the compounds with the highest area percentage in low-boiling fraction by GC-MS. The authors also detected other compounds, such as ethanol, formic acid, furfural and phenol, 2-methoxy, among others. Vispute and Huber also identified hydroxyacetone (acetol) and acetic acid in the aqueous fraction of bio-oil [
21].
Mass balance and carbon balance were performed to validate the experiments. Mass balance was determined as the summation of the amount of gases and liquid effluents from the reactor divided by the amount of the aqueous solution fed. The mass balance was considered reliable if the result was 100 ± 5%. Gas products were determined from the gas analysis carried out by GC. Liquid products were determined by weight. Gas analysis was used to provide the average gas composition, yields to gas products and carbon conversion to gases.
The H
2 yield was calculated as follows:
where nH
2 are the moles of H
2 generated, nCfed are the moles of carbon atom fed and R is the ratio of reforming. R is the number of moles of H
2 per moles of carbon atom when the compound produces in the reforming reaction the maximum amount of H
2 and CO
2. R is 7/3 for acetol, 3 for butanol and 2 for acetic acid. nCfed was calculated as the moles of compound fed multiplied by the atoms of carbon in the compound.
Yields to gas products were calculated as follows:
where ni are the moles of gas i generated (CH
4, CO, CO
2, C
2H
6 or C
3H
8) and Ci is the number of carbon atoms in one molecule of gas i.
The carbon yield to gases was calculated as a percentage, dividing the moles of carbon in gases (CH4, CO, CO2, C2H6 and C3H8) by the moles of carbon in the feed.
Total Organic Carbon (TOC) analysis of the liquid effluent allowed us to determine the carbon in liquids, which was employed together with the carbon conversion to gases to calculate the carbon balance. The carbon in liquids contained all the organic compounds in the liquid effluent, as well as the unconverted organic compounds fed.
GC-FID analysis was employed to quantitatively determine the liquid products in the APR experiment. The carbon yield to liquids was calculated as the percentage of carbon moles in liquid products except the organic compound fed divided by the moles of carbon in the feed.
The yields to liquid products were calculated as follows:
where ni are the moles of liquid i generated (for example, ethanol in the APR of acetic acid) and Ci is the number of carbon atoms in one molecule of liquid i.
Global results of the phase gas are presented for the 3 h of experiment and the evolution of gas yields. Time-on-stream was studied in order to know the catalyst stability at the operating conditions of the APR process.
Liquid products were collected every hour of experiment. The quantitative results of liquids products analysed by GC-FID presented in tables correspond to the second hour of the experiment, which is considered more representative of the whole experiment.
3. Results
3.1. APR of Acetol
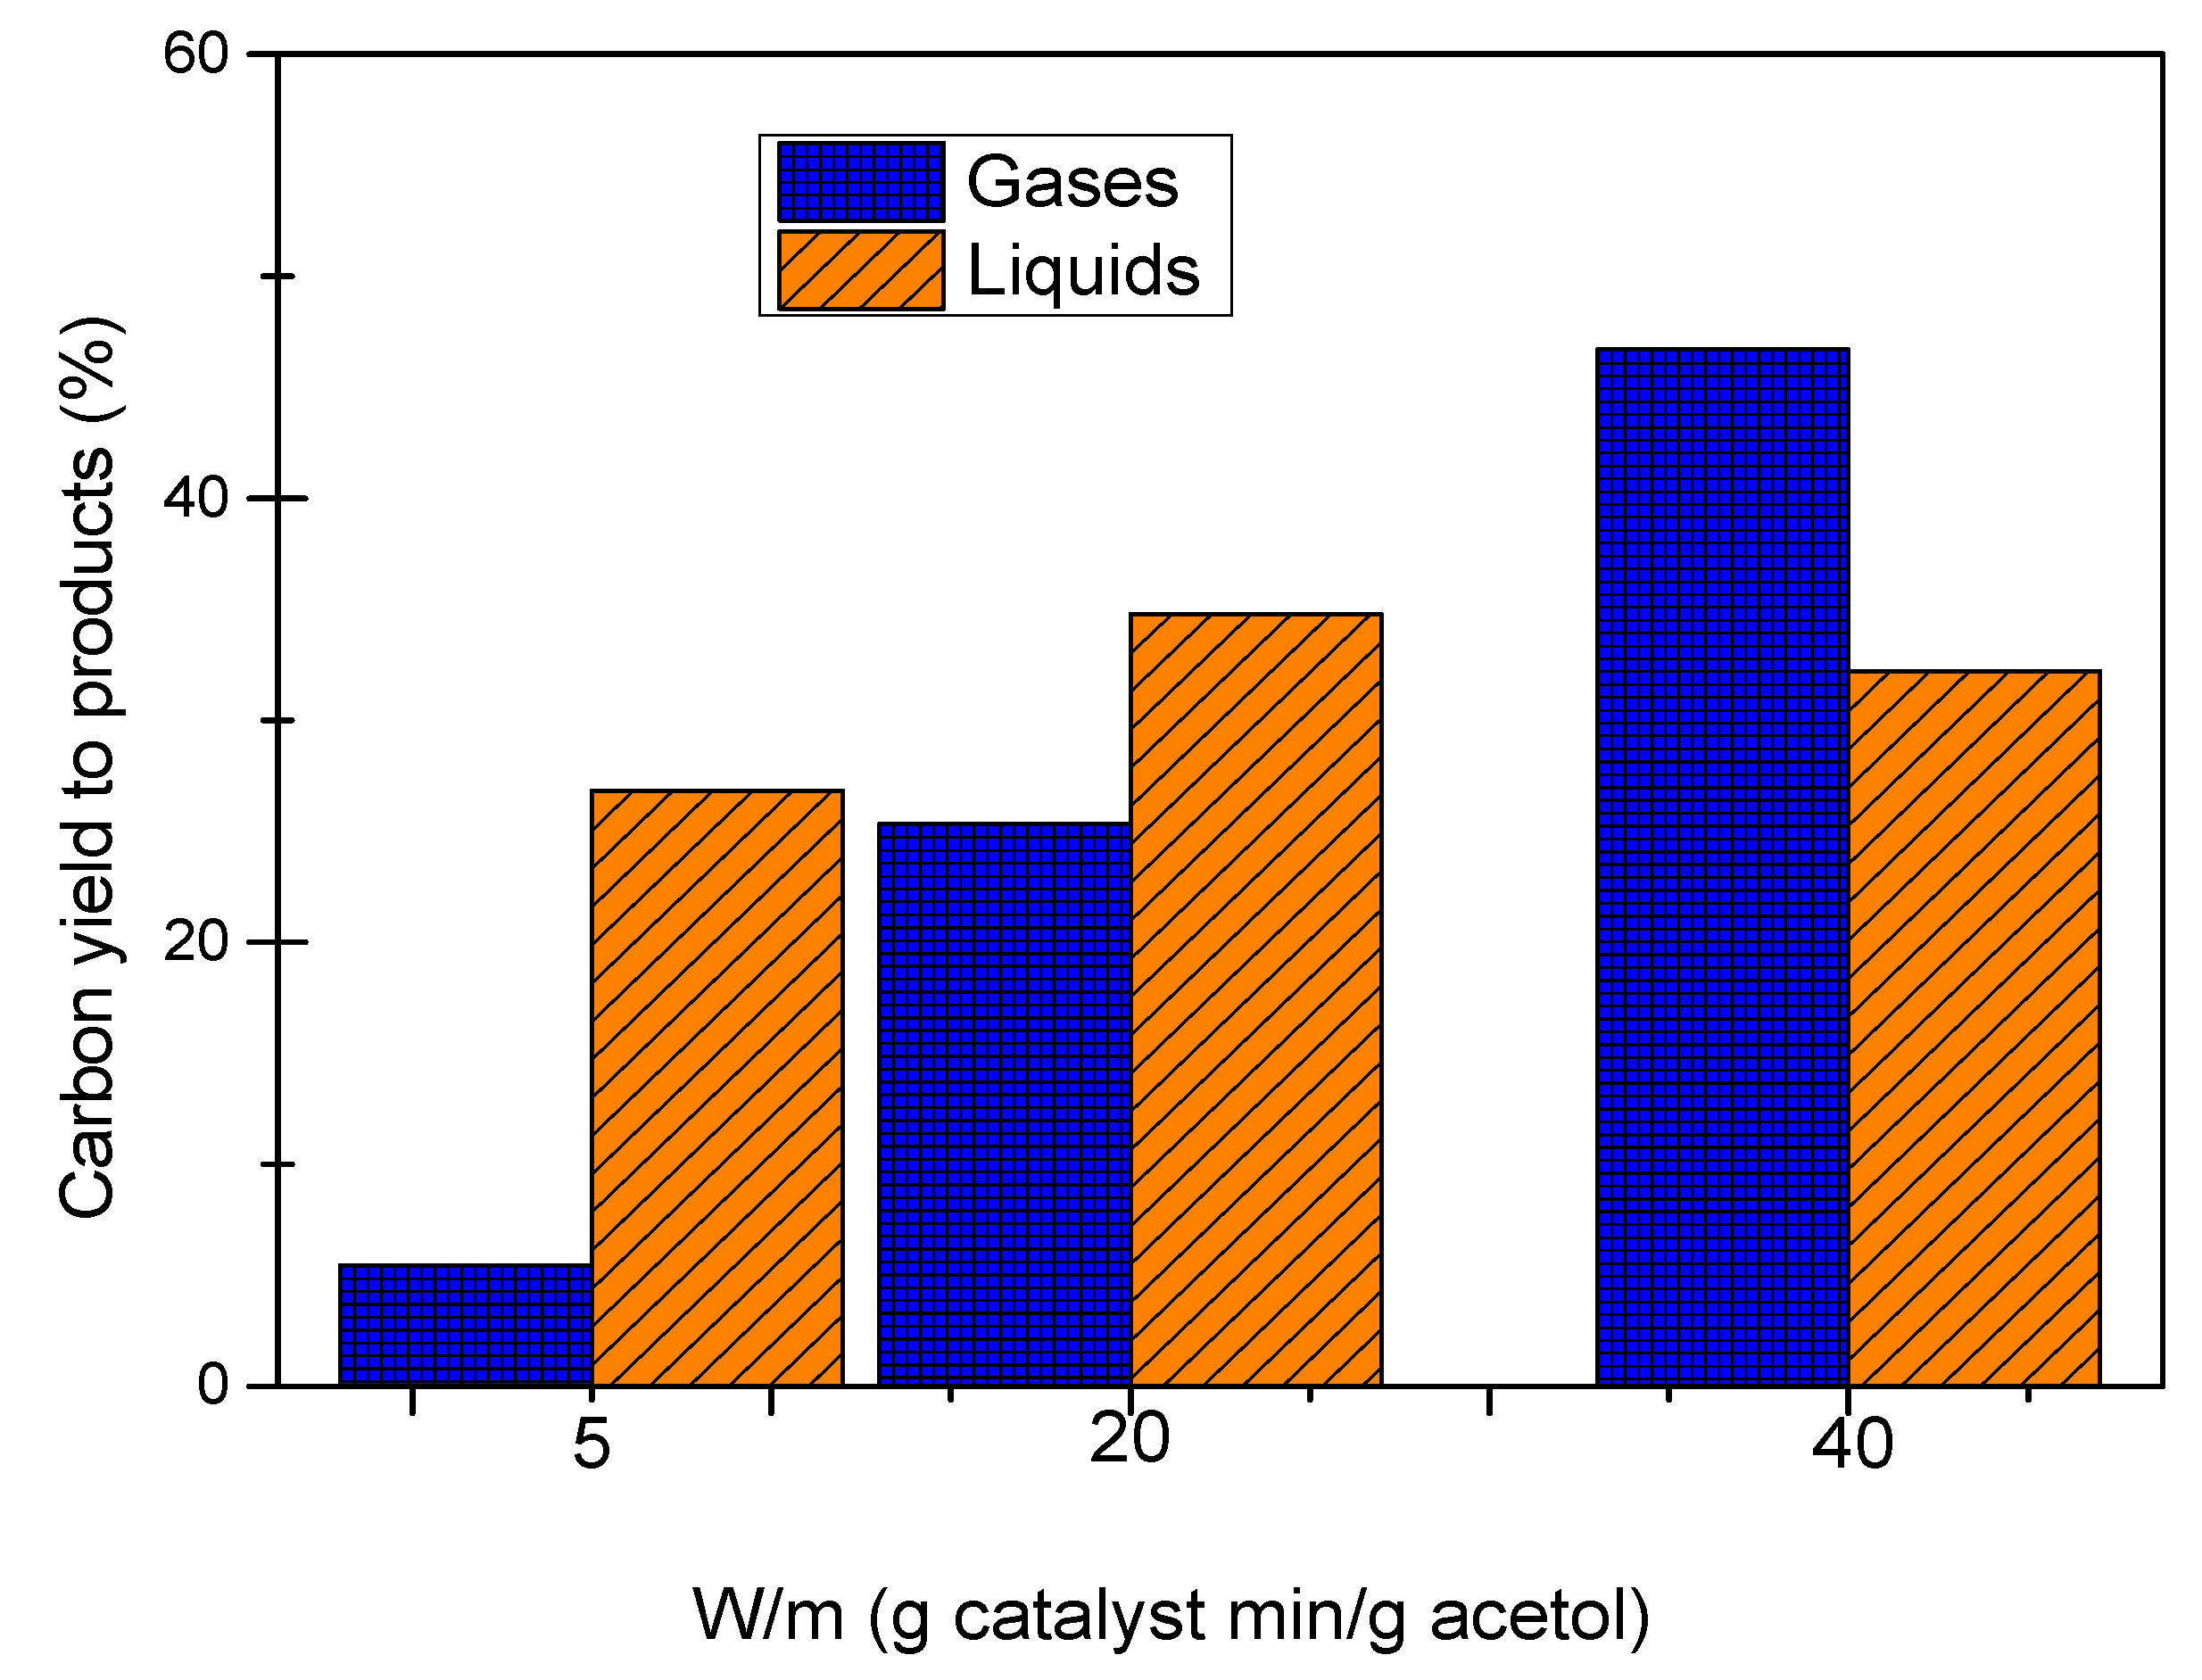
Figure 1 shows carbon yield to gases and carbon yield to liquids for the experiments of acetol APR with W/m of 5, 20 and 40 g catalyst min/g acetol.
We observed a significant increase in carbon yield to gases when the W/m ratio increased from 5 to 40 g catalyst min/g acetol. Thus, at 5 and 40 g catalyst min/g acetol, the carbon yield to gases was 5.46% and 46.69% respectively. The carbon yield to liquids showed a maximum at W/m ratio of 20 g catalyst min/g acetol with a value of 34.79%. At the highest W/m ratio (40 g catalyst min/g acetol), the catalyst favoured gas production, probably by breaking C-C bonds in the acetol molecule.
The results of gases and liquids products in the APR of acetol are shown in
Table 2. The gas with the highest content was CO
2, followed by CH
4 and H
2, since they were thermodynamically favoured at the APR conditions of low temperature while the content of C
2H
6 and CO was very small as thermodynamically expected. We observed a clear increase in H
2 content and a decrease in CO
2 content when the W/m ratio increased, as well as an increase in the content of methane, which indicates that reforming, cracking and methanation reactions were boosted by the catalyst. CO content showed a decrease when the W/m ratio increased. Alkanes content, CH
4 and C
2H
6, showed a significant increase when the W/m ratio increased from 5 g to 20 g catalyst min/g acetol, while the increase from 20 g to 40 g catalyst min/g acetol was small. The yields to all gases (H
2, CH
4, CO, CO
2 and C
2H
6) increased when the W/m ratio increased, which is in accordance with the increase of carbon yield to gases with W/m ratio (
Figure 1).
The catalyst influenced in the WGS reaction: increasing H2 content and decreasing CO content. This could have also favoured methanation and Fischer–Tropsch reactions to generate CH4 and C2H6, respectively. The gas yield evolution with time showed a stable performance, which indicates that no deactivation of the catalyst was observed in the APR of acetol.
The liquid products analysed in the APR of acetol were acetaldehyde, acetone, ethanol, acetic acid and 1,2-propanediol. Among them, ethanol and 1,2-propanediol were the ones with the highest yields in all conditions. The yield to ethanol increased significantly when the W/m ratio increased from 5 g to 40 g catalyst min/g acetol, with values of 29.2 and 165.0 mmol C/mol C fed, respectively. However, the yield to 1,2-propanediol showed a maximum at the W/m ratio of 20 g catalyst min/g acetol.
These results seem to indicate that 1,2-propanediol is an intermediate in the route to ethanol, and that the hydrogenation of the acetol first takes place to produce 1, 2-propanediol. Next, as the catalyst/organic ratio increases in a subsequent step, the cracking and breaking of C-C bonds are produced to generate ethanol. The reaction pathways for the conversion of 1,2-propanediol to ethanol have been proposed by Remón et al. [
27].
These results are in accordance with other works, which indicate that acetol is an intermediate in APR of glycerol, which is produced from the dehydration of glycerol in the acid centres of the catalyst support, and then acetol is hydrogenated to 1,2-propanediol in the metal centres of the catalyst [
32]. In the APR of acetol, the hydrogen needed to hydrogenate acetol is supplied by the conversion of acetol to gases products.
3.2. APR of Butanol
Figure 2 shows the carbon yield to gases and carbon yield to liquids for the experiments of butanol APR with the W/m ratios of 5, 10, 20 and 40 g catalyst min/g butanol.
We observed a significant increase in the carbon yield to gases with the increase of the W/m ratio. Thus, the carbon yield to gases were 2.28% and 34.67% at W/m ratios of 5 and 40 g catalyst min/g butanol, respectively. The carbon yield to liquids was smaller than 4% and did not present a clear tendency. Similarly to acetol, the increase of the W/m ratio favoured gas production, probably due to the breaking of C-C bonds in the butanol molecule. However, production of liquids was significantly lower than for acetol regardless of the amount of catalyst used. The lower yield to liquids obtained from butanol compared to acetol could be related to the lower reactivity of only one –OH group in butanol against the carbonyl and –OH groups in acetol.
Table 3 shows the results of gases and liquids products in the APR of butanol. The gases obtained in the APR of butanol were H
2, CH
4, CO, CO
2, C
2H
6 and C
3H
8. H
2 showed the highest content in the gas at all the W/m ratios studied. The content of H
2 decreased with the increase of W/m ratio, with values of 60.96% and 37.94% at 5 and 40 g catalyst min/g butanol, respectively. However, H
2 yield increased when the W/m ratio increased, that is, the catalyst loading increased. On the contrary, CH
4, CO
2, C
2H
6 and C
3H
8 content in the product gas increased with the increase of the W/m ratio. As expected in APR, the levels of CO were very low, and showed a trend toward lower levels as the W/m ratio increased. The yields to most of gases (H
2, CH
4, CO
2, C
2H
6 and C
3H
8) increased when the catalyst loading increased. CO yield did not show a clear tendency, with very low values. These values were a consequence of the participation of the catalyst in the WGS reaction. The most relevant result in the gas production was a significant amount of C
3H
8 produced. Gas production also showed the trend toward higher values as the catalyst/organic ratio increased. Gas composition showed some selectivity tendencies with the increase of catalyst loading: Butanol reforming to H
2 was not favoured, while C
3H
8 generation was promoted. Methanation and Fischer–Tropsch reactions were also promoted at high catalyst loading. No deactivation of the catalyst was observed in the APR of butanol. The highest yields of gases were generated at the highest W/m ratio, with values of 36.6 mmol H
2/mol H
2 max, 31 mmol CH
4/mol C fed and 248.1 mmol C in C
3H
8/mol C fed. H
2 yield and CH
4 yield presented values considerably smaller than those obtained in the APR of acetol at the same W/m ratio.
The liquids products identified in the APR of butanol (butaldehyde and 2-pentanone) differed substantially from the APR of acetol. The yield to butaldehyde was 37.2 mmol C/mol C fed at the W/m ratio of 5 g catalyst min/g butanol and decreased to 13.2 at the W/m ratio of 40 g catalyst min/g butanol. The yield to 2-pentanone increased from 2.6 to 18.7 mmol C/mol C fed when the W/m ratio increased from 5 to 40 g catalyst min/g butanol, respectively.
3.3. APR of Acetic Acid
Figure 3 shows carbon yield to gases and carbon yield to liquids for the experiments of acetic acid APR with W/m ratios of 5, 10, 20 and 40 g catalyst min/g acetic acid.
Like the other two model compounds, the production of gases was higher when it was used with the highest amount of catalyst per organic. However, a remarkable difference is that the acetic acid was less reactive with this catalyst than butanol and acetol, with values of carbon yields below 2%, regardless how much catalyst was used both for liquids and for gases.
A closer look at the results of the gases and liquids produced is shown in
Table 4. The gases detected by GC were H
2, CH
4, CO
2 and C
2H
6, with the C
2H
6 in residual amounts. The H
2 content decreased with the increase of W/m ratio from 50.13% to 34.68% at W/m ratios of 5 and 40 g catalyst min/g acetic acid, respectively. The contents of CH
4 and CO
2 in the produced gas increased when the W/m ratio increased. The yields to all gases (H
2, CH
4, CO
2 and C
2H
6) increased when the W/m ratio increased, except for W/m ratios of 5 and 10 g catalyst min/g acetic acid, which had very similar values. Gas composition showed some selectivity tendencies with the increase of catalyst loading: Acetic acid reforming to H
2 was not favoured, while methanation and Fischer–Tropsch reactions were promoted. These results can corroborate the tendency observed in the APR of acetol and butanol, which indicates that methanation was favoured using a high catalyst loading.
We also observed the decrease of gas yields with time-on-stream, which indicates the deactivation of catalyst in the APR of acetic acid.
The highest yields to H2 and CH4 were obtained using the highest W/m ratio, which was 4.5 mmol H2/mol H2 max and 6.7 mmol CH4/mol C fed. The H2 and CH4 yields were considerable smaller than those obtained with butanol.
Ethanol was the only liquid product analysed. The yields to ethanol were smaller than 17 mmol C/mol C fed. This low value of ethanol yield was a consequence of the low amount of carbon yield to liquids.
3.4. APR of a Simulated Aqueous Fraction of Bio-Oil
Besides the study of the individual model compounds, once the independent behaviour of the three compounds were established, we considered that it would be interesting to study a mixture of them closer to the composition of a real aqueous fraction of bio-oil to see if there was any synergistic effect. For this aim, a mixture of 5 wt% of acetic acid, 5 wt% butanol and 5 wt% acetol was employed.
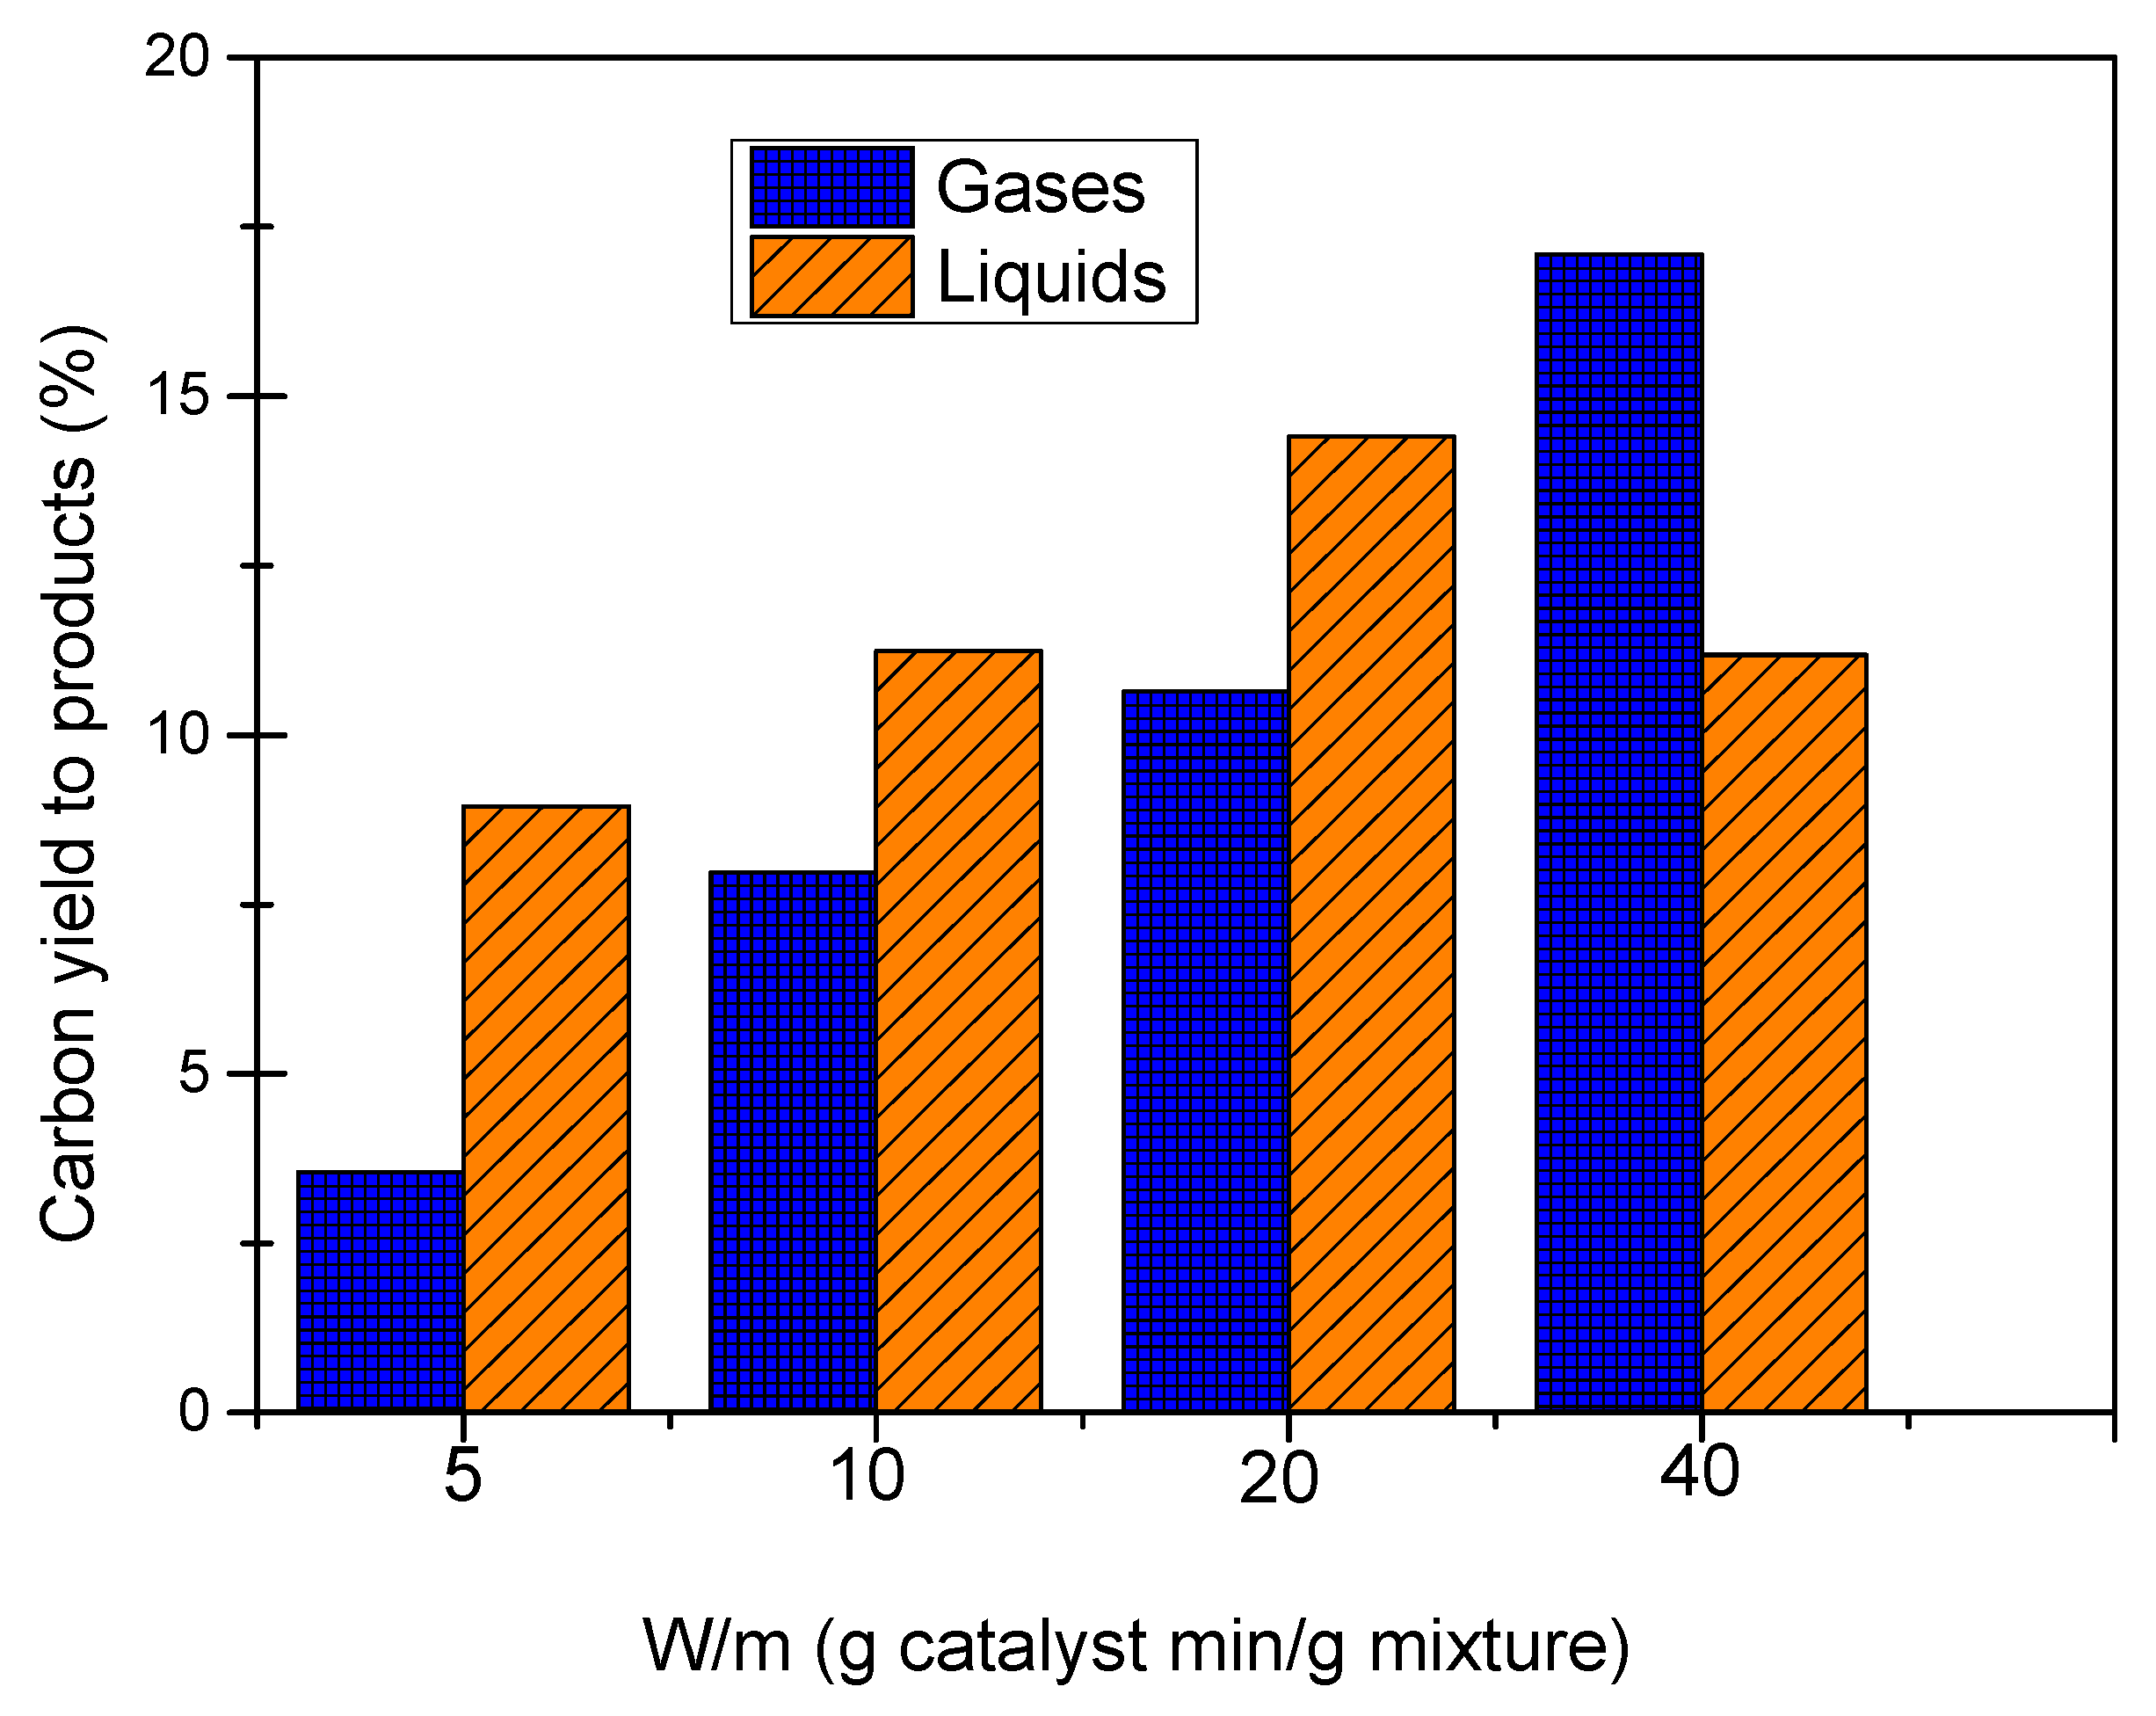
Figure 4 shows carbon yield to gases and carbon yield to liquids for the experiments of simulated aqueous fraction of bio-oil APR with W/m ratios of 5, 10, 20 and 40 g catalyst min/g mixture.
An increase in carbon yield to gases was observed when the W/m ratio increased. Thus, values of carbon yield to gases of 3.55% and 17.09% were obtained at 5 and 40 g catalyst min/g mixture, respectively. The carbon yield to liquids showed values around 11%, with a maximum of 14.41% at 20 g catalyst min/g mixture. The highest amount of catalyst produced the breaking of C-C bonds in the organic molecules, increasing gas production and decreasing carbon yield to liquids.
Table 5 presents the results of gases and liquids products in the APR of the simulated aqueous fraction of bio-oil. CO
2, H
2, CH
4 and C
3H
8 were the gases with high content, while CO and C
2H
6 showed low content in the product gas. The content of CO and CO
2 decreased when the W/m ratio increased, while the content of H
2, CH
4, C
3H
8 and C
2H
6 increased. C
3H
8 could have been generated from butanol because the APR of butanol produced a significant amount of this gas. The yields to most gases (H
2, CH
4, CO
2, C
2H
6 and C
3H
8) increased when the W/m ratio increased. CO yield did not show a clear tendency with the W/m ratio. Gas composition showed some selectivity tendencies with the increase of catalyst loading: Mixture reforming to H
2, methanation, Fischer–Tropsch reactions and C
3H
8 generation were favoured. The increase of H
2 content in the product gas when the W/m ratio increased was also observed in the APR of acetol. The decrease of gas yields versus the time-on-stream indicate catalyst deactivation, which can be a consequence of the presence of acetic acid in the simulated aqueous fraction of bio-oil used as feed. In next section,
Figure 5 presents the evolution of H
2 production versus the time-on-stream for the different feeds tested in order to show catalyst stability.
The product liquids detected included acetaldehyde, acetone, butaldehyde, ethanol, propanoic acid, 1,2-propanediol and 2-pentanone. Except for propanoic acid, all of these compounds were analysed in the APR of separated acetol, butanol and acetic acid, which indicates that there were no interactions in the routes of APR reactions of these compounds and that the behaviour of the mixture was similar to the individual results of the three model compounds. The liquid products with the highest yields were 1,2-propanediol and ethanol, which were liquids products derived from the APR of acetol. Acetol was the model compound from the aqueous fraction of bio-oil with the highest reactivity between all the compounds studied. The yield to ethanol increased when the W/m ratio increased, while the yield to 1,2-propanediol presented a maximum at 20 g catalyst min/g mixture. The tendency observed in the yield to 1,2-propanediol with the W/m ratio could have been due to the fact that, at low W/m ratios, the hydrogenation of acetol to 1,2-propanediol is favoured, but at high W/m ratios, high catalyst loading, cracking reactions and breaking of C-C bonds are favoured, converting acetol to gases and ethanol.
3.5. APR of a Real Aqueous Fraction of Bio-Oil
Finally, once the APR experiments of the simulated aqueous fraction of bio-oil were done, we carried out experiments using the real aqueous fraction (AF) of bio-oil APR with W/m ratios of 5 and 40 g catalyst min/g organics in the aqueous fraction. The experiment with W/m ratio of 5 g catalyst min/g organics lasted 2 h due some operating problems. The mass balances were higher than 92%, which is acceptable considering the complexity of the feedstock.
Table 6 and
Table 7 present the result of the gas product and liquid phase analysis, respectively.
The same patterns as the model compounds and the APR of the simulated mixture, in terms of gas yield with W/m, were observed with the real fraction. It is observed in
Table 6 that the carbon yields to gases increased when the W/m ratio increased, with hydrogen and carbon dioxide being the main components. H
2, CH
4, C
2H
6 and C
3H
8 contents in the gas increased when the W/m ratio increased, while CO and CO
2 contents decreased. The yields to all gases (H
2, CH
4, CO, CO
2, C
2H
6 and C
3H
8) increased from W/m = 5 g to 40 g catalyst min/g organics. A slightly increase in CO yield was determined. Gas yields to different gases are not present in
Table 6, but the calculation is easy from the gas composition and carbon yield to gases. Gas composition showed some selectivity tendencies with the increase of catalyst loading: The aqueous fraction of bio-oil reforming to H
2, methanation and Fisher–Tropsch reaction were favoured. Gas yield evolution with time-on-stream decreased, which could have been due to catalyst deactivation.
The main compounds in liquid effluent from the APR of the real aqueous fraction of bio-oil are acetic acid, ethanol and acetol, as in the feed. The area FID percentage of these compounds decreased when the W/m ratio increased, which could indicate they were converted in the APR reaction. The 1,2-propanediol area FID percentage increased when the W/m ratio increased, which indicates that it was a product of the APR reaction.
4. Discussion
The results obtained in the present work with the model compounds of the bio-oil aqueous fraction can be compared, to some extent, with other results of published works. This comparison is not straightforward since the experimental conditions are not exactly the same, with different catalysts, operating pressure and temperature, concentration of organic and W/m ratio, among others, but some similarities can be observed. The experiments of acetol APR performed by Arandia et al. [
17] at 230 °C, 32 bar and a W/m ratio of 7.5 g catalyst min/g acetol using nickel-based catalysts produced a gas with around 20% of hydrogen content, a carbon conversion to gas of 2% and a H
2/CO
2 ratio around 0.4. The present work, carried out at 227 °C, 40 bar and a W/m ratio of 5 g catalyst min/g acetol, produced a higher carbon conversion to gas, more than doubling the value (5.46%). However, on the contrary, the present work produced a smaller H
2 content (10.85%) and a lower H
2/CO
2 ratio (0.2). These differences, as mentioned, can be consequence of the different catalysts, W/m ratio and system pressure.
The comparison of our results with those of Roy et al. [
33], which were performed feeding butanol, is very difficult. In order to perform a reliable comparison, temperature, system pressure and catalyst weight/organic mass flow rate ratio must be adequately known. Moreover, the parameters, such as H
2 selectivity and C
3H
8 selectivity, among others, should be defined exactly. Roy et al. [
33] presented H
2 selectivity values of 65% and 42% with Ni/CeO
2 and Ni/Al
2O
3 catalysts, respectively, at 215 °C and 27.6 bar. In our work, a H
2 selectivity of 29% was obtained at 227 °C and 40 bar using a W/m ratio of 5 g catalyst min/g butanol. H
2 selectivity was calculated as the number of moles of H
2 in the effluent gas normalized by the number of moles of H
2 that would be made if each mol of C in the effluent gas had been reformed to CO
2 and H
2. The value of the W/m ratio employed in the work of Roy et al. is unclear. Thus, it is not possible to obtain some conclusions.
In the work of Roy et al. [
33], the APR of butanol showed a high carbon selectivity of alkanes in C
3H
8 both with Ni/Al
2O
3 and Ni/CeO
2. This result is also corroborated in the present work. Thus, around 90% of carbon in alkanes were in form of C
3H
8 for all of the W/m ratios studied.
Arandia et al. [
17] performed the APR of acetic acid at 230 °C and 32 bar using a W/m ratio of 7.5 g catalyst min/g acetic acid. They obtained around 62% of H
2 content in the gas, a carbon-to-gas conversion around 0.2% and a H
2/CO
2 ratio around 1.7, i.e., a low reactivity of acetic in APR, which is similar to this work, since we only found a carbon yield to gas around 0.4% and a H
2/CO
2 ratio around 1.5. Other similarities with the present work include the high hydrogen content in the gas, around 49%, even though the range of W/m ratios of 5 and 10 g catalyst min/g acetic acid is wider and the pressure is also higher.
Apart from gases, we also attempted to compare the results of the liquids produced in our work with other published works and to propose possible reaction pathways considering the compounds detected in liquids and the proposed pathways by some other authors.
Arandia et al. [
17] identified formaldehyde, ethanol and acetaldehyde in the liquid phase of the APR of acetol. They also proposed the reaction pathways of the APR of this model compound of the bio-oil aqueous fraction, which included the decomposition of acetol to acetaldehyde (C
2H
4O) and formaldehyde (CH
2O) (Equation (4)):
Other reaction considers the hydrogenation of acetaldehyde to ethanol, Equation (5):
These reactions seemed to occur in this work, since acetaldehyde and, to a greater extent, ethanol were detected in liquids, but it is also necessary to include one more step: The hydrogenation of acetol to 1,2-propanediol (C
3H
8O
2) (Equation (6)). The increase in the W/m ratio increases the ethanol yield. Then, high catalyst loading could favour acetol decomposition (Equation (4)) and hydrogenation of acetaldehyde to ethanol (Equation (5)).
In the case of the APR of butanol, Roy et al. [
33,
34] proposed a reaction step. In the first step, butanol (C
4H
9OH) is dehydrogenated and forms butaldehyde (C
3H
7CHO) (Equation (7)):
In the second step, the C-C bond of butaldehyde breaks to produce propane (C
3H
8) and CO (Equation (8)):
Butaldehyde was one of the liquid products quantified in the present work. Propane was the alkane gas with the highest content in the gas of this work. These facts are in accordance with the proposed reaction steps of Roy et al. However, these reactions are incomplete to describe the APR of butanol. Whereas 2-pentanone was also found and in increasing yield as the W/m became higher, butaldehyde had lower yield, which seems to indicate that 2-pentanone was produced from butaldehyde in a subsequent step. Because 2-pentanone is an organic compound with five carbon atoms, it is possible that the Ni-Co/Al-Mg catalyst could promote aldol condensation reaction and could produce an organic compound with more carbon atoms.
In the present work, ethanol was obtained in the liquid product of acetic acid APR. Based on the reaction pathways of ethanol APR proposed by Nozawa et al. [
35], the following reactions could occur:
In Equation (9), acetic acid (CH3COOH) is hydrogenated to acetaldehyde (CH3CHO) and one molecule of water is removed. In Equation (10), acetaldehyde is hydrogenated to ethanol (CH3CH2OH). Since, in our work, only ethanol was detected, the reaction step (10) has to be a very fast reaction, and acetaldehyde is hydrogenated to produce ethanol as it is produced from the hydrogenation of acetic (9).
The comparison of the three model compounds of the bio-oil aqueous fraction in the APR process indicates that acetol is the most reactive compound for butanol and the least reactive is acetic acid. The carbon conversions to gas using a W/m ratio of 40 g catalyst min/g organic are 46.69% for acetol, 34.67% for butanol and 1.69% for acetic acid. The conversion of acetol in APR produces 1,2-propanediol in the liquid effluent. The presence of this compound in the product of the APR of the simulated aqueous fraction of bio-oil and in the APR of a real aqueous fraction of bio-oil was clearly observed.
The results of the evolution of the hydrogen production over time shown in the APR of acetol, butanol, acetic and the simulated mixture and aqueous fraction of bio-oil are shown in
Figure 5 in order to show the deactivation of the catalyst that has been previously mentioned and to relate the behaviours of the individual components with the APR results of the simulated mixture and the aqueous fraction of the bio-oil.
As can be seen in
Figure 5, both acetol and butanol, in addition to presenting the highest hydrogen production values, as previously mentioned, had a quite stable production over time, not showing any catalyst deactivation. On the contrary, acetic acid had the lowest hydrogen production and, apart from that, a rapid decay over time. This deactivation effect was less pronounced, but with a constant decrease in hydrogen production in the simulated mixture, so this deactivation could be attributed to the presence of acetic acid. The aqueous fraction of bio-oil behaved in a similar way, so it could be concluded that the high presence of acidic species, particularly acetic acid, was the cause of catalyst deactivation, possibly due to leaching of the active metal from the catalyst, as it has been pointed out by other works [
17].
In order to avoid catalyst deactivation in the conversion of the bio-oil aqueous fraction by APR, two strategies could be proposed. The first one consists of the development of stable catalysts for this acid medium. The second one is based on the separation of the organic acids fraction from the bio-oil aqueous fraction.


