Article

A New Semi-Quantitative Process Safety Assessment Method and Its Application for Fluorochemical Industry

1
Guangdong Provincial Key Lab of Petrochemical Equipment Fault Diagnosis, Guangdong University of Petrochemical Technology, Maoming 525000, China
2
Elevator Safe Department, China Special Equipment Inspection and Research Institute, Beijing 100029, China
3
Electronic Information School, Guangdong University of Petrochemical Technology, Maoming 525000, China
4
Petroleum Engineering School, Guangdong University of Petrochemical Technology, Maoming 525000, China
5
Engineering School, University of Auckland, Auckland 1010, New Zealand
*
Authors to whom correspondence should be addressed.
Processes 2021, 9(10), 1695; https://doi.org/10.3390/pr9101695
Submission received: 2 August 2021 / Revised: 8 September 2021 / Accepted: 13 September 2021 / Published: 22 September 2021
(This article belongs to the Special Issue Recent Advances in Chemical Process Safety)

Abstract

:
Traditional hazard and operability analysis (HAZOP) is one of the most widely applied methods for process safety management in process enterprises. Due to its principles based on the conservative and qualitative judgment, it often leads to too conservative risk identification results for the fluorine chemical industry usually with high-risk processes to keep the continuity of production. Most of improved quantitative and semi-quantitative methods are based on the layer of protection analysis (LOPA) to resolve the over-conservative problem of traditional HAZOP with the database of LOPA. However, the improved model, taking LOPA as the main line and HAZOP only as the provider of scenarios and influencing factors, is limited to the fact that LOPA can only analyze complete and independent protection layers (IPLs). Therefore, in order to realize the quantitative or semi-quantitative analysis of disaster causes and consequences, a new semi-quantitative HAZOP method takes HAZOP as the main line to integrate LOPA, F&EI (fire and explosion index) for quantitatively calculating the reduction factors, probability on failure demand (PFD) of general protection layers (GPLs) and PFD of IPLs. With the case comparison of fluorine chemical industry, it is proved that this new method can effectively improve the problem that traditional HAZOP are too conservative in complex scenarios.

1. Introduction

“Danger” is almost taken as an attribute of processes [1], it usually happens as an “accident” or “incident”, an unplanned and harm event [2]. Additionally, the unplanned character means that “danger” usually possesses an uncertainty and its real impacts can be described by the “risk”, the variable expressing the degree of uncertainty of the objective and the source of “risk” is called the “hazard” [3], an unsafe condition having strong harm or damage potential. In general, a “hazard” is composed of “hazard cause” and “hazard consequence”, and the former is any possible cause of a hazard, the latter is a chain of occurrences caused by the “hazard” [4]. Therefore, the identification and scenario description on a “hazard” are beneficial to find out a series of essential events causing the potential “danger” to turn into a real “incident” or “accident”, it is helpful to integrate a complete process safety management. Generally, the most common methods include safety checklist (SCL) [5], preliminary hazard analysis (PHA) [6], fault tree analysis (FTA) [7], failure mode and effect analysis (FMEA) [8] and hazard and operability analysis (HAZOP) [9]. Even the ISO 31010 almost gathers all the popular analytical methods and points out their respective strengths and limitations [10], and in all of those, HAZOP is a qualitative one to focus on analyzing the “hazard” and its operability, developed by imperial chemical industries Ltd. (ICI) inin the 1960’s [11]. Due to its effective identification and assessment on the hazard, HAZOP is suitable for a large scale analysis and widely applied for hazard identification and assessment in process industry. After a long period of continuous improvement, HAZOP’s reliability and effectiveness have been approved by most of the process industry, such as NPPs [12], oil and gas industry [13] and bio-pharmaceutical industry [14]. The research on HAZOP is important on two issues, one is optimizing or automating the analysis process of HAZOP, for example optimizing the order of analysis nodes [15], optimizing the analysis on cause/consequence relation in a node [16], and the other is researching the limitation of conventional HAZOP and its improvement [17]. Typically, conventional HAZOP is less accurate in processes with complex relationships, and defaults equal weights to all various risk factors, regardless of their respective different influencing degrees on consequences and probabilities [18]. Therefore, researchers attempted to offset the limitation of conventional HAZOP. Sultana et al. [19] sought to use System Theoretical Process Analysis (STPA) improving HAZOP and found out that HAZOP is more suitable and possesses the most important advantage on its simplicity and less time requirement for a system with less software and simple interactions. M. Di Nardo et al. [20,21] tried to use System Dynamics (SD) quantifying the accident occurrence probability through analysis of interactions of all possible incidental scenarios with a causal loop diagram (CLD) for improving the layer of protection analysis (LOPA), and pointed out that the SD modeling is able to simulate the influences of changes in time and feedback mechanism, but SD is only very effective in evaluating the interaction effect of properly identified different incidental scenarios through any other risk analysis technique used. Hence, for more accurately and efficiently screening those high-risk incidental scenarios, it is necessary for a useful improvement on the HAZOP to keep its simplicity and less time requirement and then more accurately to analyze the scenarios, distinguish the respective weight differences between various risk factors and causes or consequences with regard to a complex cause/consequence relationship. For this purpose, the majority of researchers combined HAZOP with semi-quantitative LOPA, where HAZOP was applied to rapidly identify the deviations and their cause/consequence pairs and then LOPA selected a combination of a deviation and its consequence as an accident scenario to be analyzed one by one from those deviations and consequences [22], any potential cause of this deviation as an initiating event [23]. Finally, existing safeguards and recommendations in HAZOP were used to confirm the IPLs [24], LOPA gave PFD of any IPL to be quantitative or semi-quantitative [25] and the flow chart is shown as Figure 1. With the method in Figure 1, the respective order of magnitude can be determined about potential risk factors influencing causes or consequences. It is the effectiveness in which the method was to be performed and to avoid missing or over-conserving the assessment of high-risk hazards, so the method was widely being applied in petrochemical plants in China [26]. Essentially, in this method in Figure 1, LOPA is the main line for a hazard analysis to quantitatively or semi-quantitatively analyze every IPL and HAZOP is the assistant line and the provider to find scenarios and risk factors for any complex relationship of any potential process. However, in this method the attribute of LOPA, only good at analyzing a complete IPL, determines that it is difficult to effectively assess risk factors of non-IPLs despite severe influence of these factors on hazards. Therefore, as far as these issues are concerned, a new semi-quantitative method, with HAZOP as the main line and severity of any kind of identified risk factors quantified, is deeply researched and discussed for complex relationships about process safety in this paper.

2. Various Risk Factors in the Complex Cause/Consequence Correlation for a Process Hazard

2.1. Impacts of Reduction Factors (RFs)

For the practical process safety risk, even in the absence of any protective measures, the correlation between cause and consequence is not 100% or 1, but a probability. However, the traditional HAZOP procedure assumes that the weight between cause and consequence is equal to 1 in order to facilitate the analysis, that is, one cause must induce its corresponding consequence at all times or under any condition. This relatively conservative evaluation can improve the analysis efficiency for a simple system, but the design cost of the protection layer will not obviously be increased by the over-conservative risk. Especially for the fluorine chemical industry with high risk, this conservation may lead to significantly large design difficulty and expensive cost of the protective layer and SIS system, and the excessive protection also can affect the routine production to increase product cost. Hence the correlation probability between cause and consequence, the reduction factors, have to be used to quantitatively or semi-quantitatively analyze the magnitude of weight, so as to accurately identify probability correlating the cause and consequence in HAZOP, complete the necessary risk correction, and eliminate some over-conservative HAZOP results.
Generally, the reduction factors can be divided into two categories: the enabling conditions and the contributing conditions. Among them, the enabling conditions, also called enabling events, are only the necessary conditions or events to guide the occurrence of potential accidents, but not directly leading to the accidents. The enabling condition cannot be regarded as a protection layer (PL), but its real impacts can still be weighted by its occurrence probability, and then correct the initiating event frequency. On the other side, the contributing conditions are defined as the time proportion of the factory at a special point or time in the accident chain, generally including the ignition probability of a combustible substance and the exposure probability of personnel exposed to dangerous events, and also represented by a probability in the quantitative calculation.

2.2. Impacts of Protection Layers (PLs)

The general concept of protection layer is defined as any independent mechanism for risk reduction by means of control, prevention or mitigation [27,28,29]. Generally, it is divided into independent protection layers (IPLs) and general protection layers (GPLs). Additionally, it is widely considered that the definition of IPLs is more strict than GPLs, only when the following conditions are met at the same time can it be called the available IPLs:
(I)
the PFD of an IPL is less than or equal to 0.1, that is, its risk reduction ability cannot be less than one order of magnitude;
(II)
independence: the executive ability of an IPL will not be affected by the initiating event or other failure IPLs;
(III)
effectiveness: IPLs can detect and respond to the response conditions in time;
(IV)
auditability: IPLs shall have their respective information, documents or test and maintenance procedures that can be checked.
Correspondingly, a GPL usually meets the conditions (II), (III) and (IV), but the condition (I) cannot be met or often change between satisfied and unsatisfied due to various reasons. However, no matter what kind of a PL, its role is as an independent influencing factor to effectively weaken the actual risk degree of a hazard.

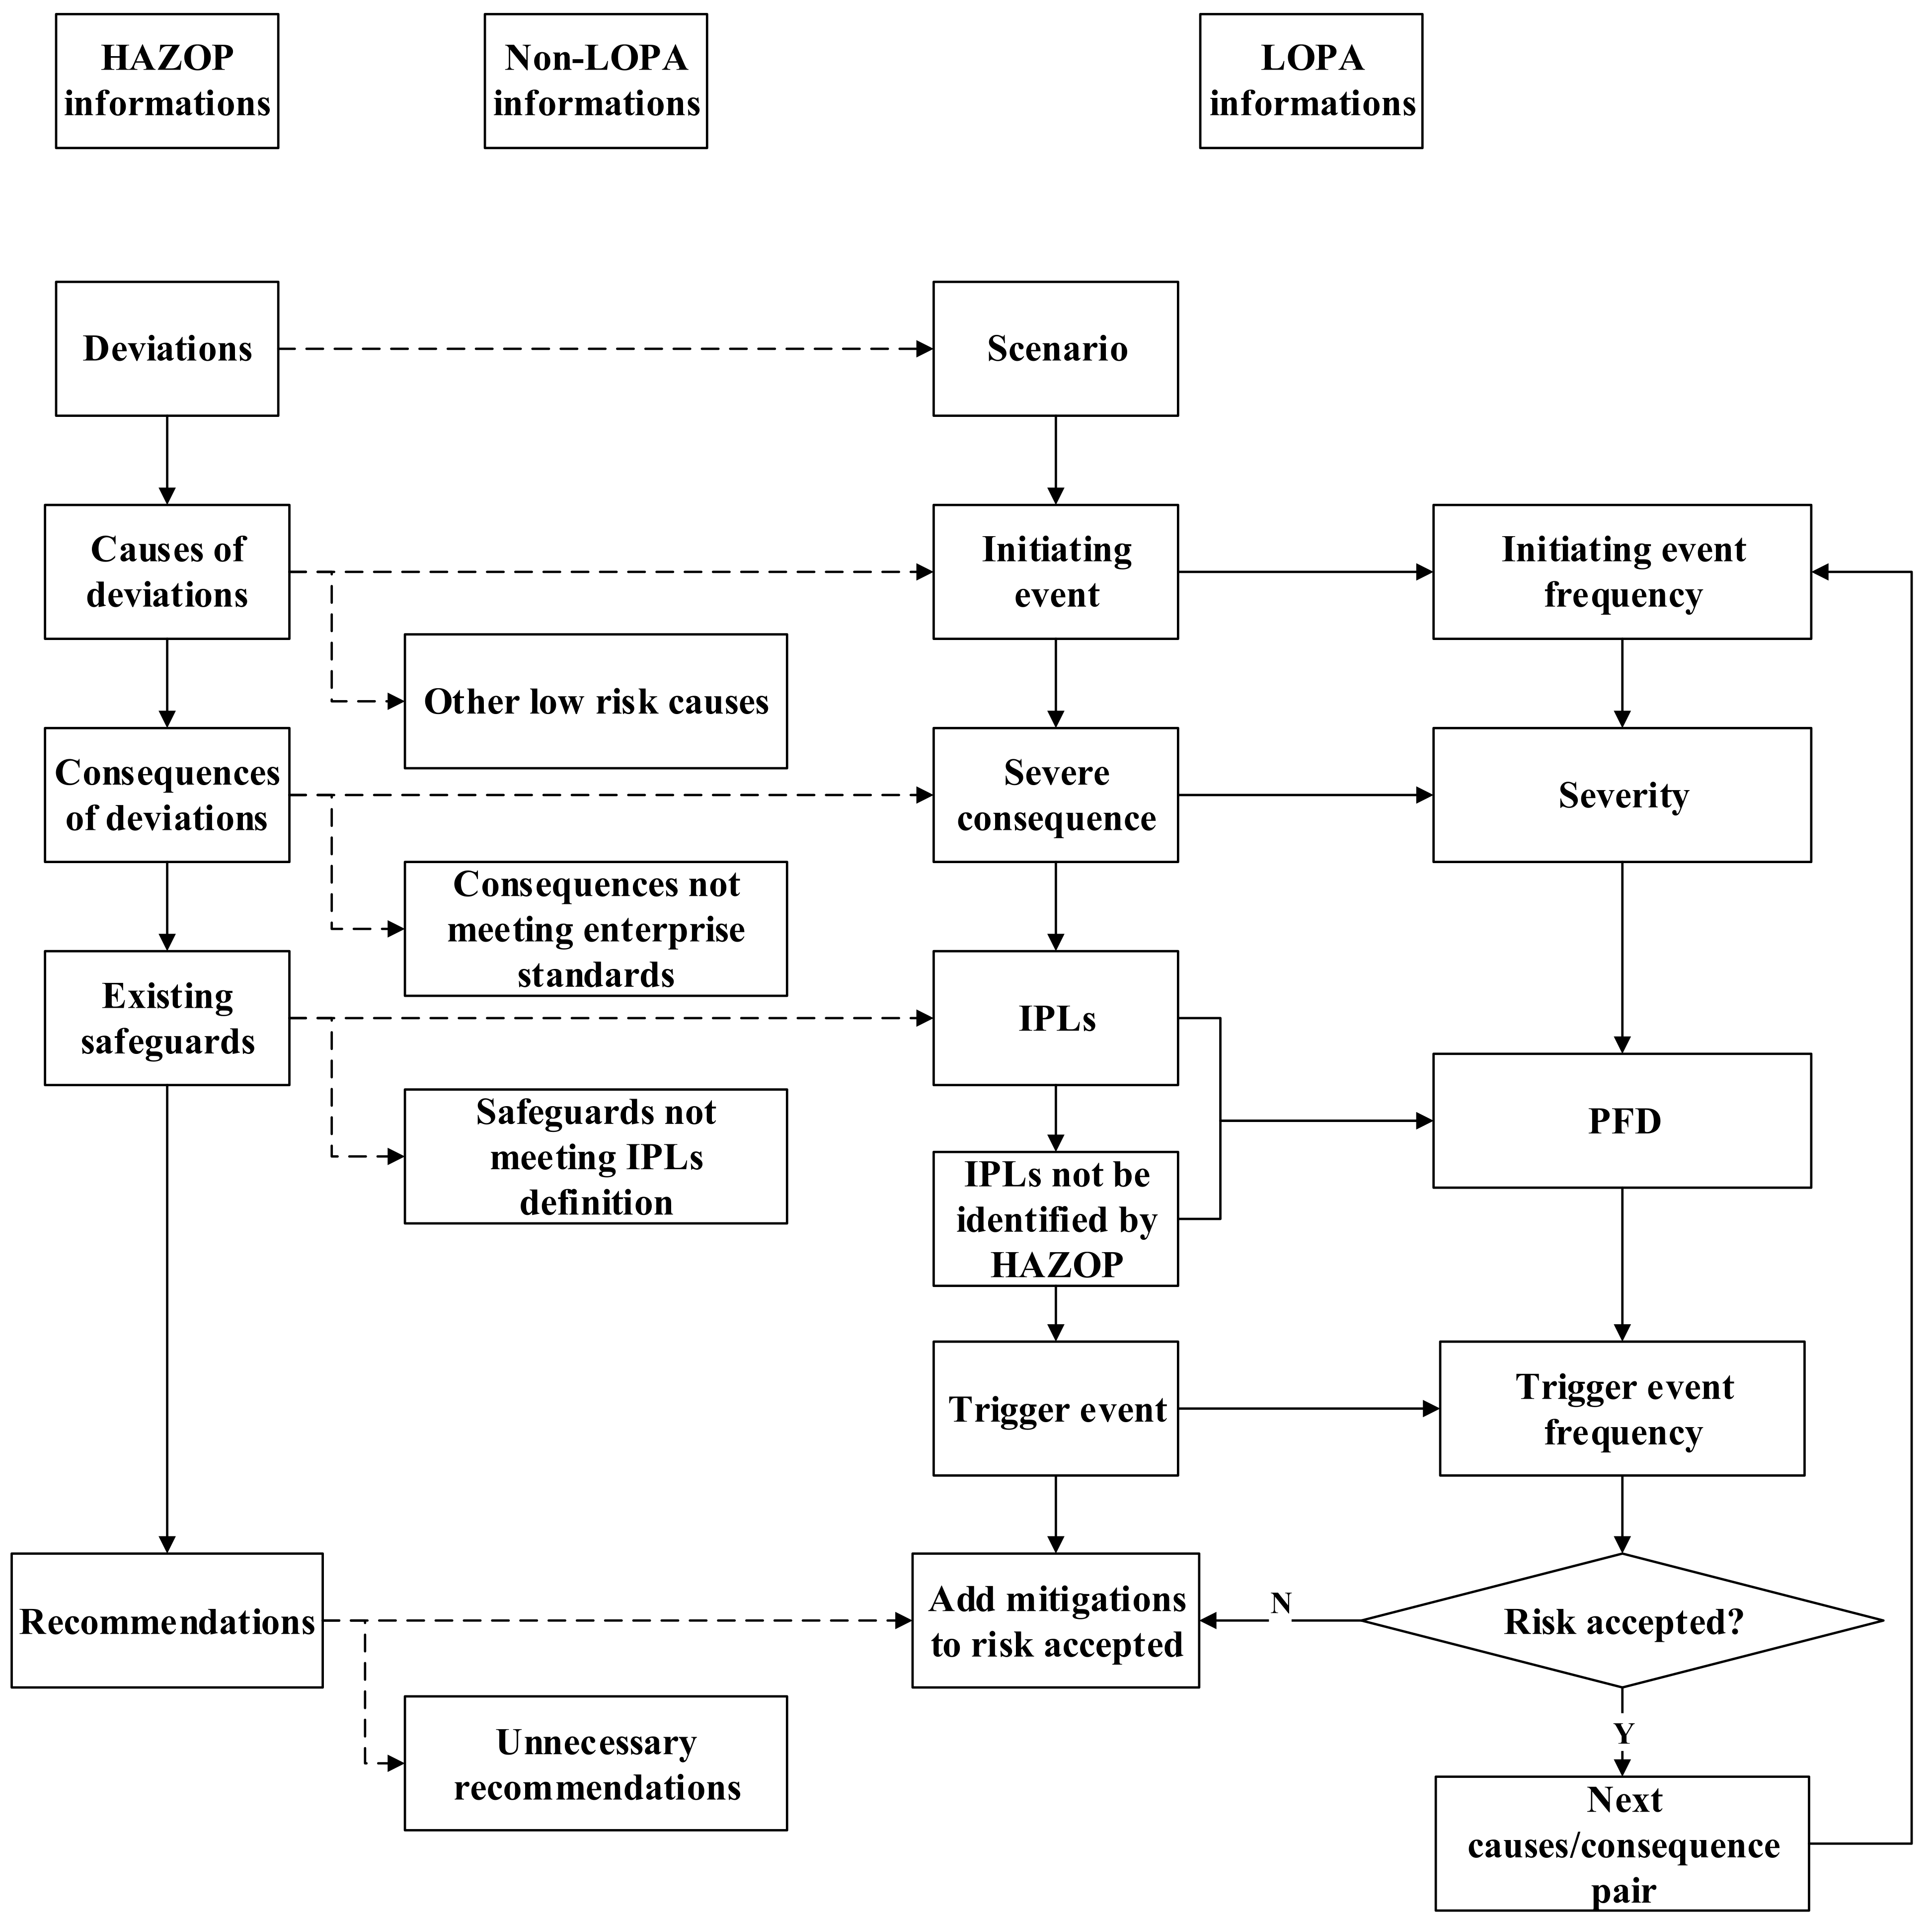
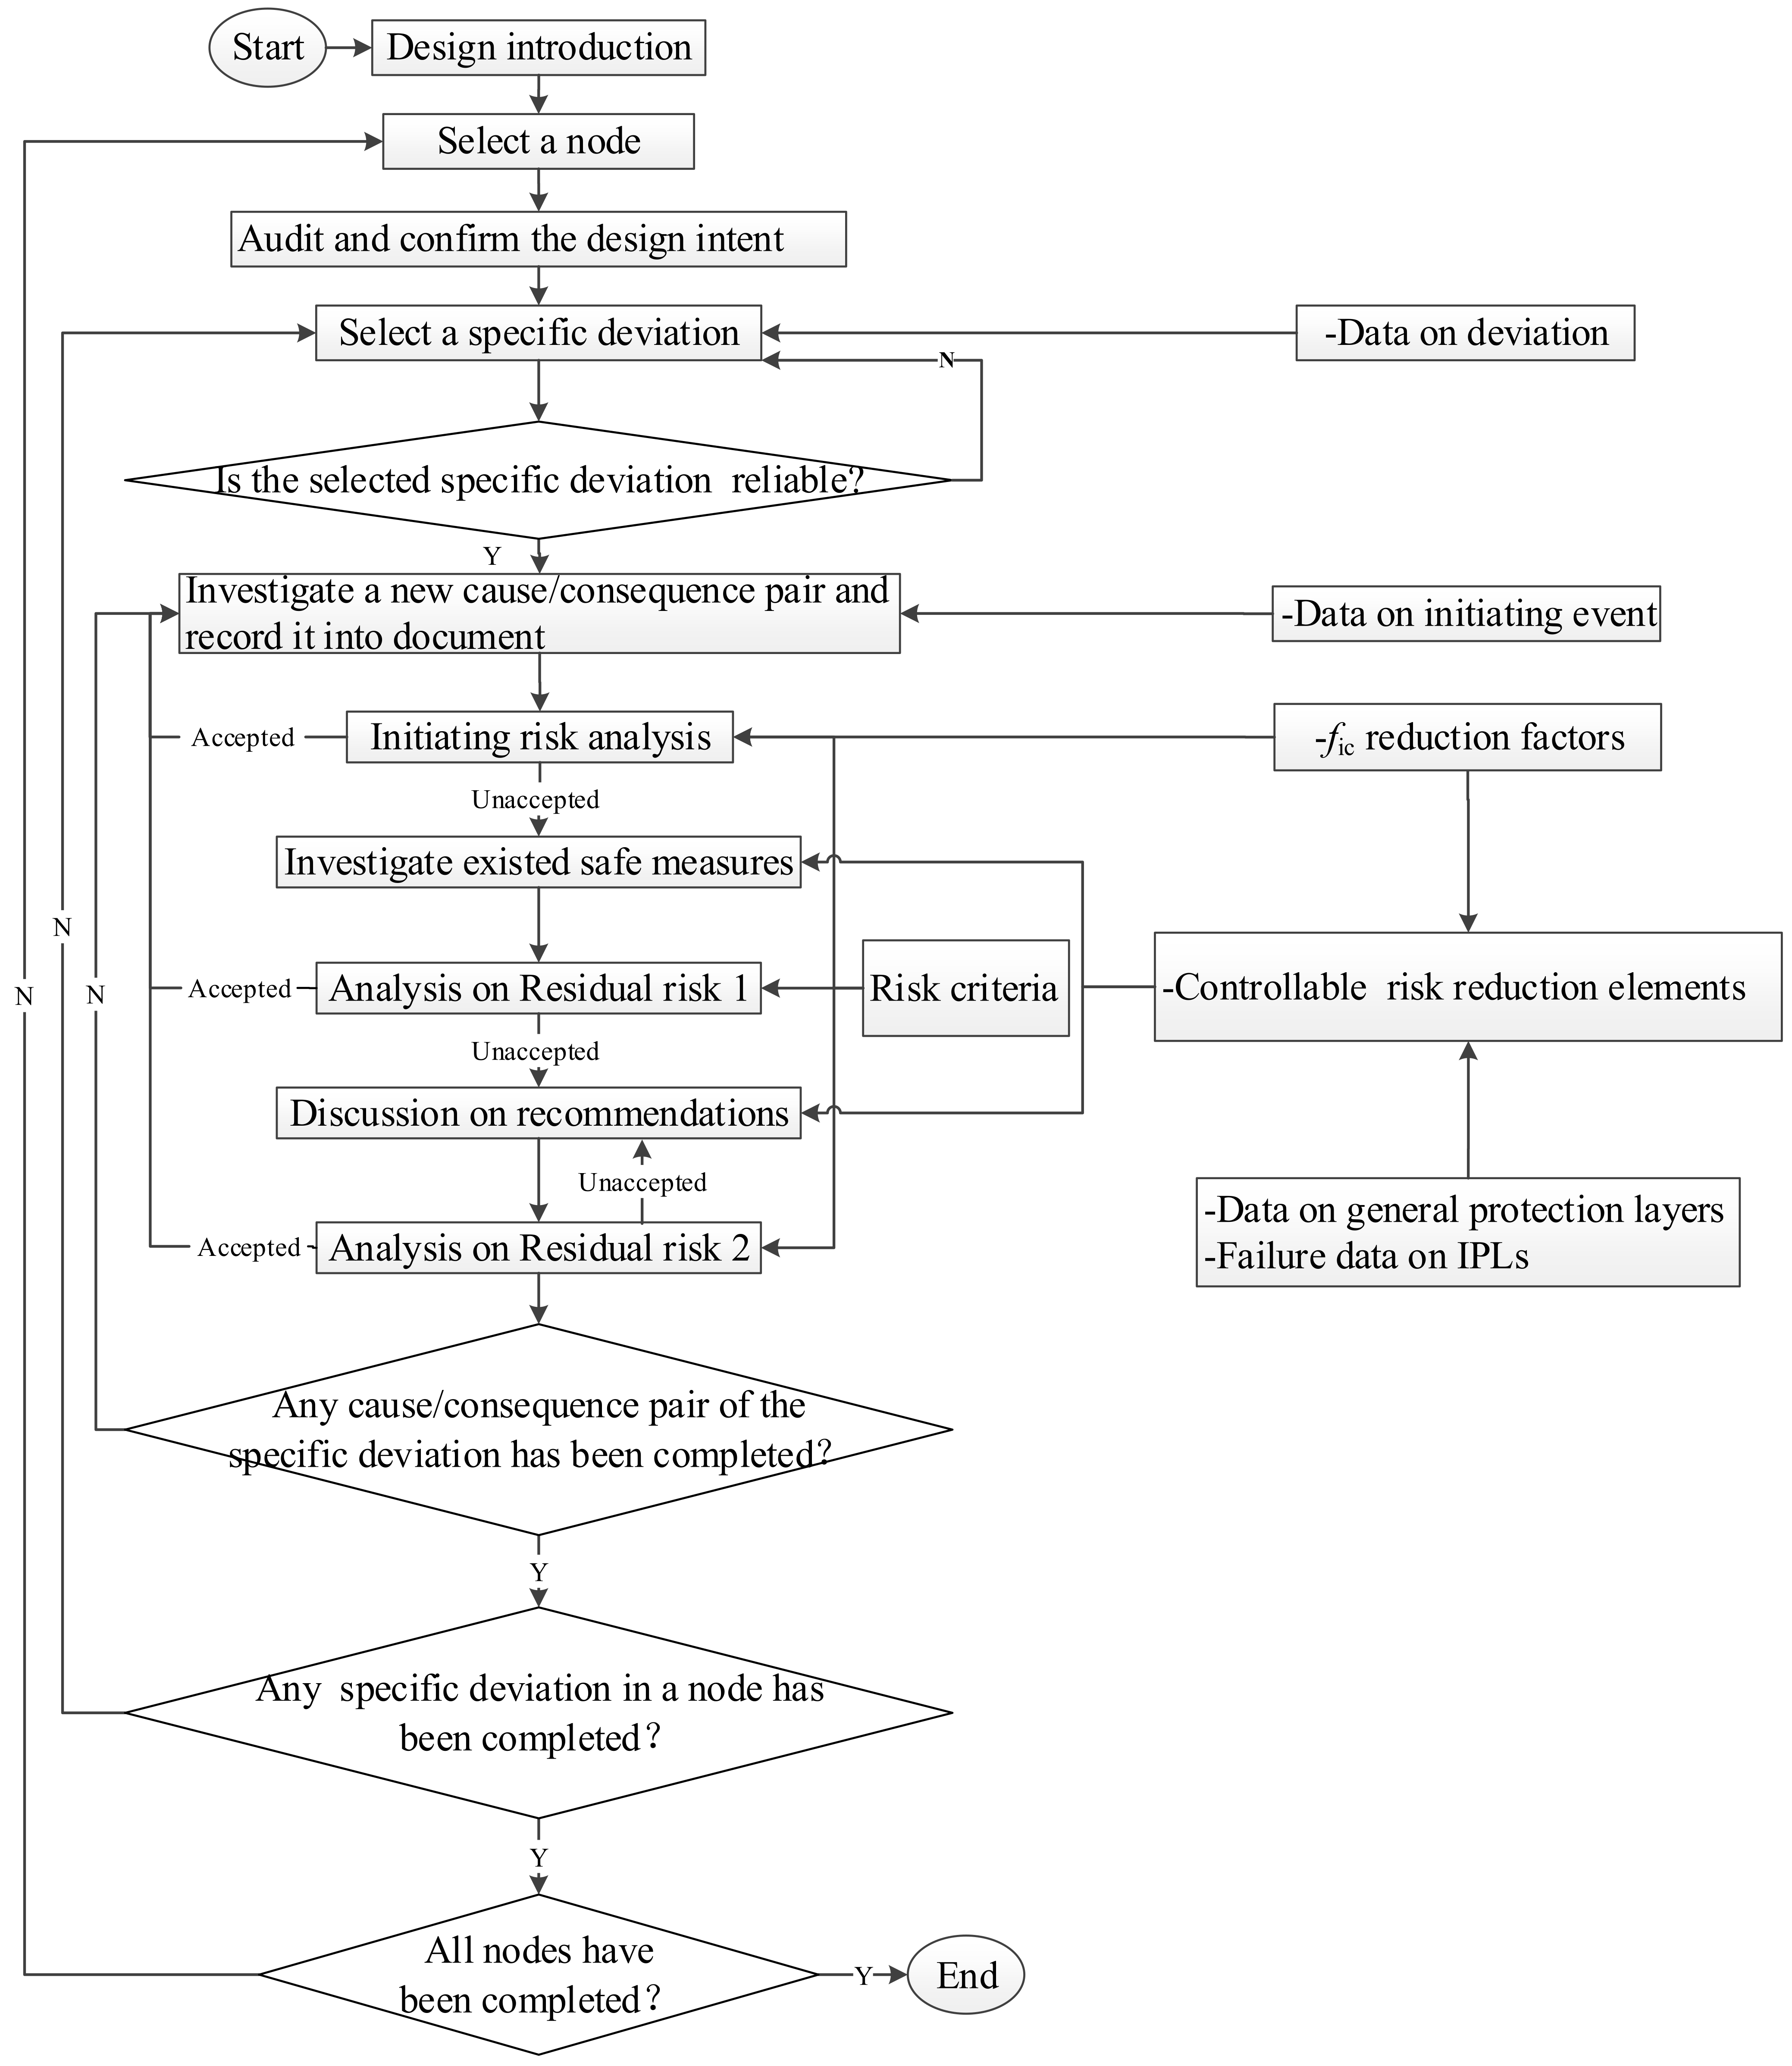
3. Semi-Quantitative HAZOP Analysis Model Based on Quantitative Correction Factors

In most complex cause/consequence correlations, the final risk from HAZOP is often affected by enabling conditions, contributing conditions, GPLs and IPLs. Therefore, the PFD of IPLs or GPLs, reduction factors can be used to quantitatively identify the final HAZOP risk at first, and then quantifying the risk magnitude determines the specific semi-quantitative risk ranking, so as to identify high-risk hazards more accurately and effectively. The semi-quantitative analysis model is shown in Figure 2.
The semi-quantitative HAZOP model is based on the traditional HAZOP and the improved HAZOP methods, and introduces the quantitative analysis method of PLs and reduction factors at the same time:
(I)
Node number and node description: the number and brief description of each node are determined by HAZOP analysts in the preparation stage. If the node is divided according to the process, it can be described as the name of the process unit. If the node is divided according to the specific equipment, it can be described as the name of the specific equipment (including the connected pipeline).
(II)
Design intent and drawing number: “design intent” refers to the design description of the node. According to the different division objectives of the node, the process design principle, starting and ending points of the node should be made clear in simplified sentences as far as possible. The design intent can be summarized from the management documents such as “operation procedures” or “process technical procedures” of the enterprise; “drawing number” refers to the drawing number of piping and instrument diagram (P and ID) involved in this node.
(III)
Deviation type and detailed deviation: “deviation type” refers to the process or operation deviation in this node determined by HAZOP analysts in the preparation stage. In order to avoid incomplete deviation analysis caused by insufficient capability of HAZOP analysts, the deviation type knowledge database is introduced to prompt HAZOP analysts to comprehensively check the deviations in each node during pre-analysis; “detailed deviation” is a detailed description of “deviation type”, for example, “high flow at pump outlet” is a detailed description of “high flow”.
(IV)
Cause: it is a detailed description of the causes of deviation. In the actual analysis process, there is more than one reason for a deviation. The cause-by-cause (CBC) recording method is mandatory to be adopted, that is, the one cause corresponding to one consequence during the recording. At the same time, the initiating causes database (including the type of any initiating cause and its failure probability) is introduced to allow HAZOP analysts to avoid data shortages caused by the lack of operation experience.
(V)
Consequence: it is a detailed description of the consequence caused by combination of cause with its detailed deviation. According to the different purposes of HAZOP, the description of consequence is also different. The consequence generally includes safety consequence, environmental consequence, financial consequence, reputation loss consequence, etc., for example, if HAZOP takes safety consequence as the major target, personnel casualty should be described as clearly as possible. In the conventional analysis, the description of “consequence” is a part of the qualitative hypothetical accidental scenarios, thus HAZOP analysts often have different opinions on the qualitative hypothetical consequence. Therefore, an efficient solution is proposed to rapidly determine the radius of medium leakage with Dow fire and explosion index (F and EI) evaluation to conduct semi-quantitative analysis on the safety consequences, environmental consequences and financial consequences.
(VI)
Risk type: one or more risk types can be determined, such as safety risk, environmental risk, financial risk, reputation loss risk, according to the different purposes of HAZOP, so that HAZOP reviewers can comprehensively acquire the real risk clearly.
(VII)
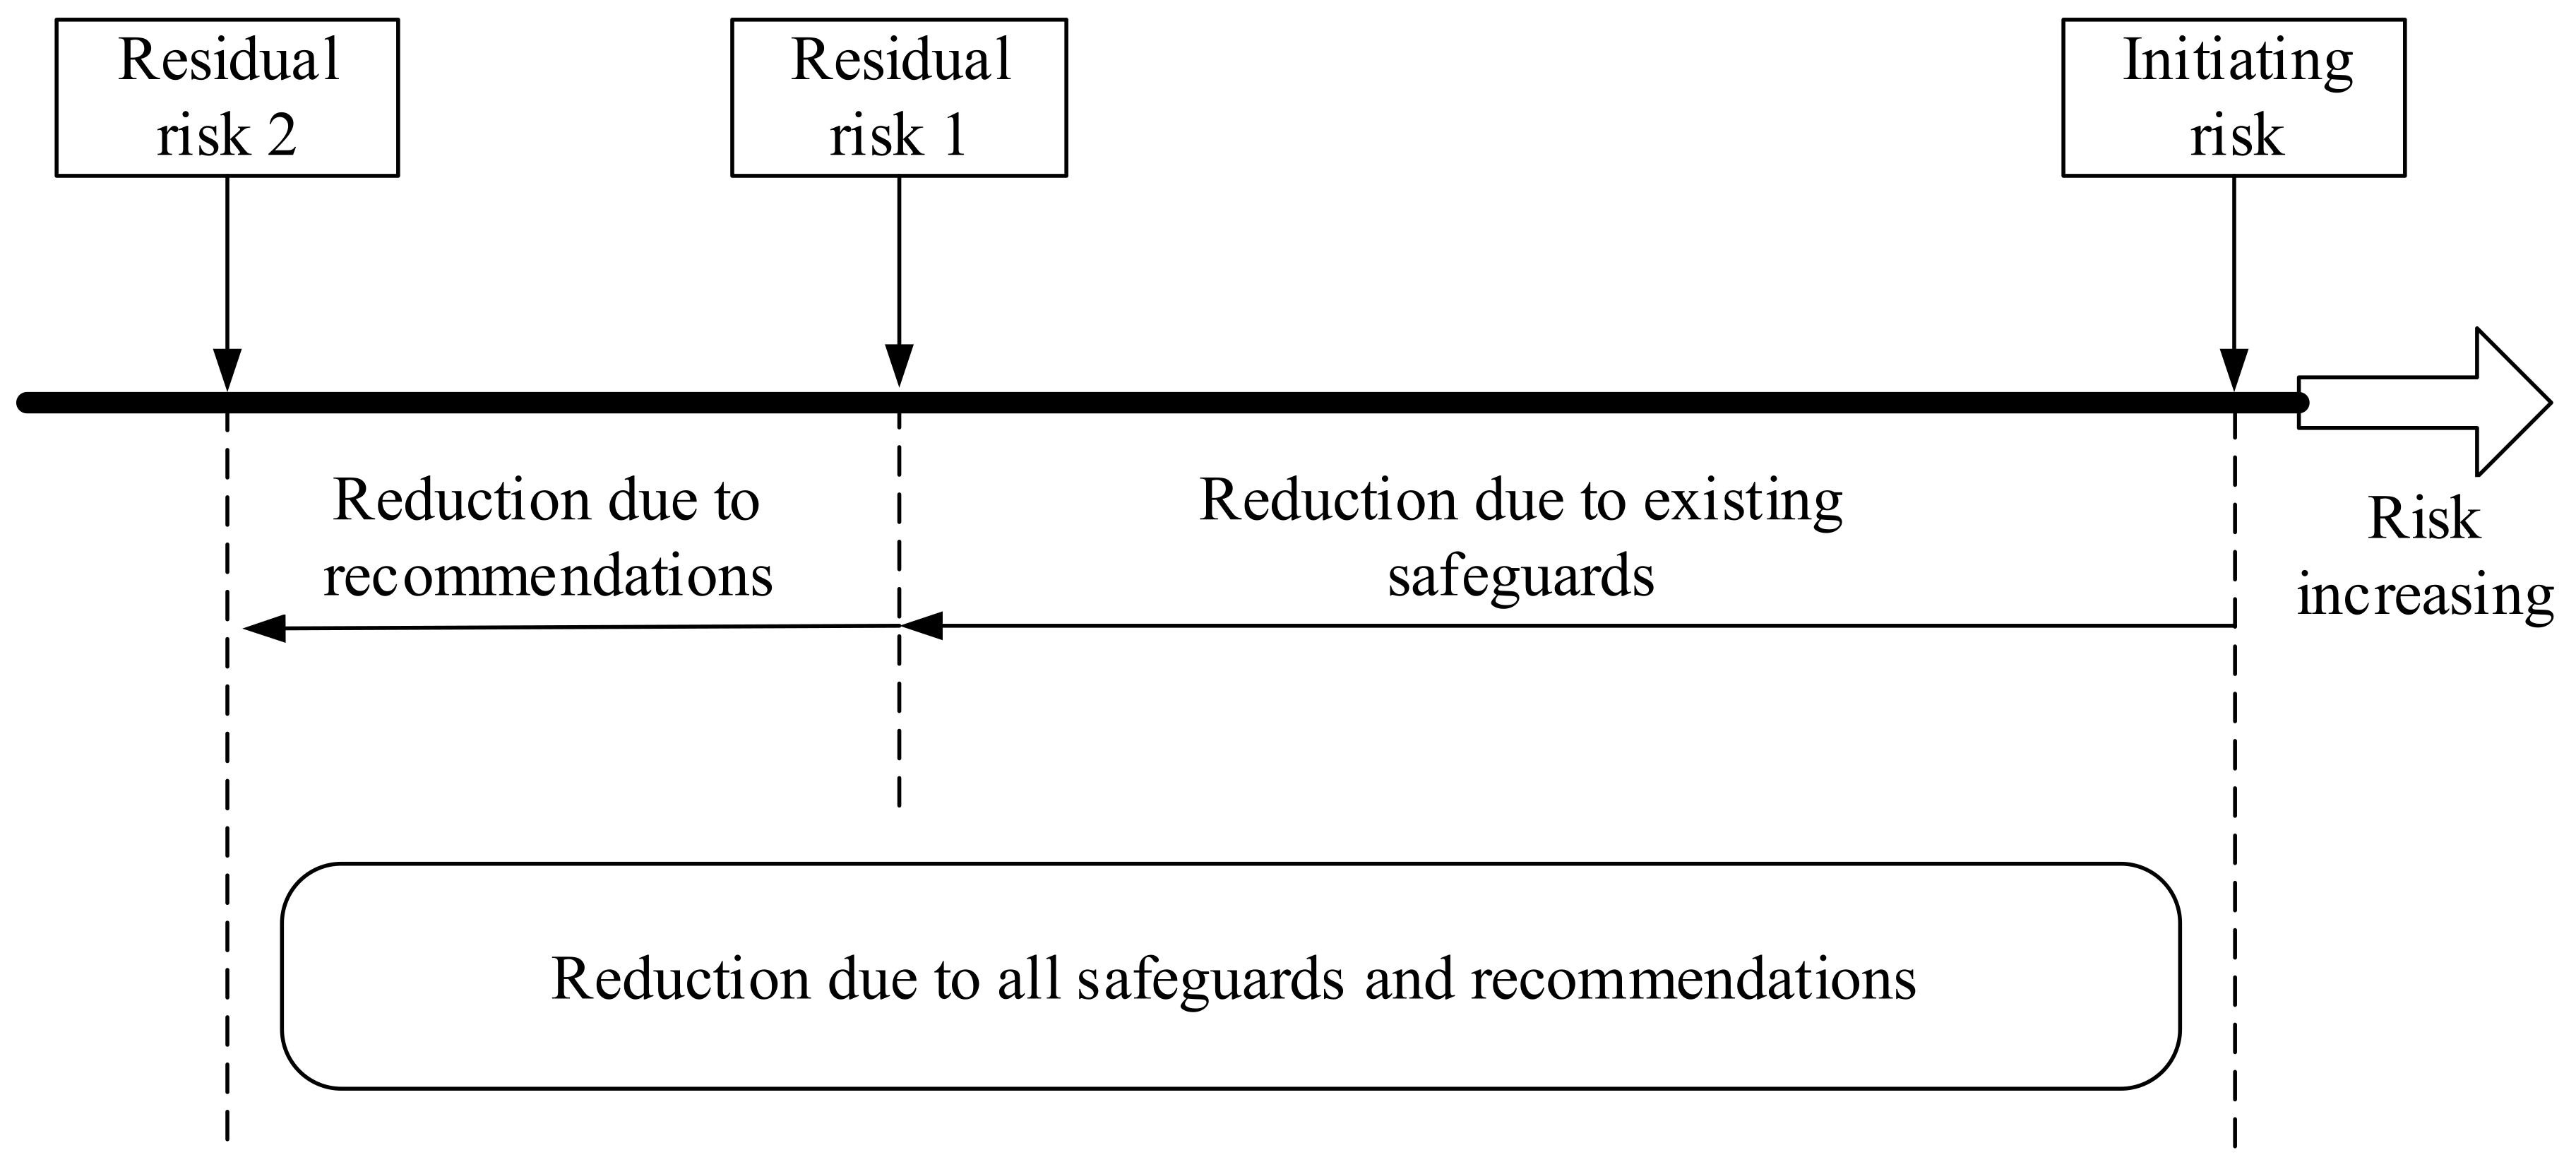
Initiating risk, residual risk 1, residual risk 2: “initiating risk” refers to the risk that the existing safeguards are not considered in HAZOP, that is, the inherent risk of a design. Additionally, “Residual risk 1” refers to the risk after considering the existing safeguards, that is, the current existing risk. “Residual risk 2” refers to the risk after considering the recommendations, that is, the future reduced risk. The relationship among the three types of risks is shown in Figure 3.
(VIII)
The existing safeguards/recommendations: the “types” of existing safeguards/recommendations in Figure 3 include IPLs, GPLs and reduction factors (enabling conditions and contributing conditions). The “description” of existing safeguards/recommendations is used to record the detailed description of the “type”. For example, “LIC liquid level control loop (DCS)” is the detailed “description” of “basic process control system (BPCS)”, a sort of IPLs.

4. Quantitative Model for Correction Factors

4.1. Enabling Condition Reduction Factor

The enabling condition cannot be regarded as a PL, nor a failure event or human error. It is only a necessary condition leading to the occurrence of unexpected scenarios, and its impact on risk can be described by a probability. Generally, the enabling condition can be taken as a correction of the frequency of the initiating events, often related to time, season and production mode.
In general, time-dependent enabling conditions refer to the fact that an accident or an initiating event will only occur in a specific period of time, that is, the initiating event will only lead to the occurrence of an accident in that specific period of time. The reduction probability of such enabling conditions is shown in Equation (1).
f i c t = j = 1 J t e c i j a N t o p
where fic(t) is the reduction factor caused by the time-dependent enabling conditions, 1/a; t(j)ec-i is the duration of the j-th occurrence of the i-th enabling condition, h; J is the total occurrence of the i-th enabling condition; top is total operation time per statistical process unit, h; a is the year spans when collecting all statistical data, year; N is the amount of similar process units when collecting all statistical data.
The enabling conditions related to the production mode refer to the fact that an accident or an initiating event is not periodic, but only occurs in a specific operation mode, such as unplanned start-up and shutdown, production equipment switching, etc. Generally, it is certain that this operation mode does not occur per year in similar process units, but the statistical frequency of the operation mode is extremely high and each duration is quite short. Therefore, the statistical frequency of this operation mode is obviously higher than its proportion of the operation time. Thus, the statistical frequency is more suitable for the calculation of the reduction probability of such enabling conditions, shown in Equation (2); on the contrary, its probability is calculated according to Equation (1).
f i c m = min n i a N , 1
where fic(m) is the reduction factor caused by the enabling conditions related to the production mode, 1/a; ni is the occurrence times of the i-th enabling condition.
Through the above assumptions, it can be eliminated that an enabling condition is both time-dependent and relating to production mode. At the same time, for a scenario, any triggered enabling condition is enough to lead to the occurrence of undesirable consequences, so it is the more rational selection than only the one with the largest probability among all enabling conditions that needs to be considered.
In addition, it is widely approved that the reduction degree of an enabling condition to the risk will not be stronger than that of an IPL [30], that is, the minimum probability of any enabling condition is in the range of [0.001, 0.1], and if the peak risk of casualties is abnormally high to exceed the peak risk standard (generally considered to be more than one death) in the scenario induced by an enabling condition, then the minimum probability of the enabling condition is 0.1, otherwise, the median probability, 0.01, is selected in the range of [0.001, 0.1]. Therefore, the reduction factor of a certain scene or initiating event can be obtained from Equations (3) and (4).
f i c = max f i c t , f i c m , 0.1 L o L i > 1 max f i c t , f i c m , 0.01 L o L i 1
f e c c = max f i c i = 1 , 2 , , M
where fic is the reduction factor of the i-th enabling condition, 1/a; LoLi is the death toll caused by the i-th enabling condition; fecc is the enabling condition reduction factor of an initiating event, 1/a; M is the total of enabling conditions for an initiating event to cause an accident.

4.2. Contributing Condition Reduction Factors

Contributing conditions is time dependent, reflecting the time proportion of a special point or time in an accident chain, generally including the ignition probability of combustible substances and the personnel exposure probability to dangerous events.
As one of universally accepted contributing condition reduction factors, the ignition probability refers to the probability that the combustible is ignited by ignition sources after leakage, generally divided into immediate ignition and delayed ignition. In terms of ignition form, immediate ignition often leads to jet fire, fireball or explosion, while delayed ignition leads to vapor cloud explosion (VCE), flash fire, pool fire, etc., [31].
Although many factors need to be considered in quantifying ignition probability, research on its algorithms are adequate, mainly including calculation models and statistical methods. Through comparative study [32], it is found that the model is mainly applicable to the situation with the same assumptions and lack of statistical data, while the statistical method is more universal and accurate due to mainly being based on industrial statistical data. Additionally, the ignition probability is generally divided into four types: immediate ignition probability of flammable liquid leakage, immediate ignition probability of gas leakage, delayed ignition probability of gas leakage, and vapor cloud explosion probability of gas leakage. There are many studies and databases on these ignition probabilities, even the calculation methods are given for some extreme cases, such as for liquid leakage under the high temperature, high pressure or caused by collision, the probability of immediate ignition can be taken as 1; similarly, the probability of immediate ignition can be taken as 1 for gas leakage caused by over temperature, over pressure and over energy; whether it is liquid or gas, when it has diffused to hundreds of meters, the ignition probability is at least 0.9 [33,34,35,36,37,38,39,40].
The personnel exposure probability refers to the time proportion of personnel exposed in the affected area when the leakage accident occurs. These personnel usually include routine or temporary operating personnel, start-up and shutdown operators, maintenance and repairing personnel and other short-term exposure personnel. If the accidental affected area is large enough, the personnel near the unit should also be considered. It should be noted that the exposure probability of personnel must be independent of the accident, that is, the personnel brought by the accident emergency are not considered. If the alarm and its response personnel are involved in the accident scenario, some operators have to go to the affected area for inspection, and the exposure probability of these personnel should be equal to 1. Similarly, when the initiating event is the operation error of the field operators, it is certain that these personnel appear in the affected area of the accident, then the exposure probability of these personnel is also 1. The exposure probabilities of various personnel are shown in Equations (5) and (6).
f e p s r c = i = 1 k t r c i 24
f e p s m = i = 1 n t m i c i a
where feps−rc is the personnel exposure probability of routine operating personnel in the accidental affected area; k is the total affected process units in the accident affected area; t(i)rc is the daily exposure time of routine operating personnel of the i-th process unit in the accidental affected area, h; feps−m is the exposure probability of maintenance personnel in the accidental affected area; n is the average of total maintenance process units per year in an assessment cycle in the accidental affected area; t(i)m is the annual average maintenance time of the i-th maintenance process unit in an assessment cycle in the accidental affected area, day; ci is the annual average running time of the i-th maintenance process unit in an assessment cycle in the accidental affected area, day, and for a fluorine chemical process, equal to 360.
Noteworthy is that if “restriction of personnel access to the i-th process unit area” is taken as a safeguard or recommendation, the exposure probability of personnel in the process unit is equal to 0, so as to evaluate the risk reduction of this protective measure.
From the above algorithms of the various personnel exposure probabilities, it is necessary to first determine the affected area of the accident, such as the area of toxic gas diffusion, the injured area of fire and explosion, etc. If the quantitative evaluation method, such as QRA, is adopted, the affected area can be more accurate, but it will extremely influence the availability and efficiency of HAZOP. Therefore, a semi-quantitative method is adopted for rapidly effective estimates [41], and the estimate method is shown in Equations (7)–(11).
F 3 = min F 1 × F 2 , 8
F   &   E I = F 3 × M F
F   &   E I = C × F   &   E I
C = C 1 × C 2 × C 3
R = 0.256   F E   &   I
where F3 is risk the process unit hazard factor (PUHF), its range is from 1 to 8; F1 is the general process factor (GPF); F2 is the special process factor (SPF); MF is the material factor; F & EI is the fire and explosion index, mainly used to evaluate the injured degree of exposure personnel; F & EI′ is the corrected F & EI after loss control credit factors, mainly used to determine the radius of exposure; C is the loss control credit factors; C1 is the process control credit factors; C2 is the material isolation credit factors; C3 is the fire protection credit factors; R is the radius of exposure, m.
Dow provided the detailed methods for the factors in Equations (7)–(11); moreover, they underlined that when FE&I ≥ 128, the hazard degree is “heavy“ and exceeds the acceptable level. The “heavy” level usually means the life loss is inevitable in HAZOP, so it is the assumption in this paper that 100% of personnel are dead within the radius of exposure R, and then the death toll under the i-th scenario, LoLi, can be calculated in the accidental affected area.
Moreover, generally, the probability of personnel exposure is only used to calculate the severity of accidental consequence (as shown in Figure 1). Therefore, the severity considering the probability of personnel exposure can be calculated by Equation (12).
S e v e r i t y = f e p s r c P S r c + f e p s m P S m + α P S a l + β P S o e
where Severity is the severity of accidental consequence; PSrc is the total routine operating personnel within the radius of exposure R; PSm is the total maintenance personnel within the radius of exposure R; α is the alarm response coefficient, when the alarm response is in an analyzed accident scenario, α is equal to 1, otherwise it is 0; PSal is the total response personnel to the alarm in an analyzed accident scenario; β is the operation error coefficient of field operator, when the initiating event of accident scenario is the operation error of field operators, β is equal to 1, otherwise it is 0; PSoe—the total field operating personnel in an accident scenario with operation error of field operator as the initiating event.

4.3. Failure Probability of Protection Layers (PLs)

The PLs are divided into IPLS and GPLs, and both of them have protection ability, but their protection effectiveness, PFD, are different. Therefore, the occurrence probability of consequence of an initiating event can be calculated by Equation (13).
f i s = f i I × j = 1 J P F D i j I P × l = 1 L P F D i l G P
where fis is the frequency of the consequence s of initiating event i, 1/a; fiI is frequency of initial event i, 1/a; PFD ij IP is the failure probability of the j-th IPL preventing the occurrence of consequence s in the initiating event i; J is the total IPLs in initiating event i; PFD il GP is the failure probability of the l-th GPL preventing the occurrence of consequence s in the initiating event i; L is the total GPLs in initiating event i.
Many references [27,28,29] can directly provide the values of PFD ij IP with high reliability due to theses from the industrial statistical data, while the PFD il GP needs some calculation. In general, a GPL is usually composed of multiple links, and if any of the links fail, the GPL will fail, so the protection ability of GPLS is relatively fragile. It is generally believed that the PL involving manual operation as a necessary link has relatively low reliability. It is necessary to calculate its failure frequency as GPLs in detail. The failure frequency of GPLs is shown in Equation (14).
P F D i l G P = v = 1 V P F D i l G P v
where PFD il GP ( v ) PFDGP(v)il is the failure probability of the v-th link in the l-th GPL in the initiating event i; V is the total necessary links in the l-th GPL in the initial event i.
When the failure frequency of GPLs is calculated with Equation (14), some statistical data of IPLs [30] can be found.

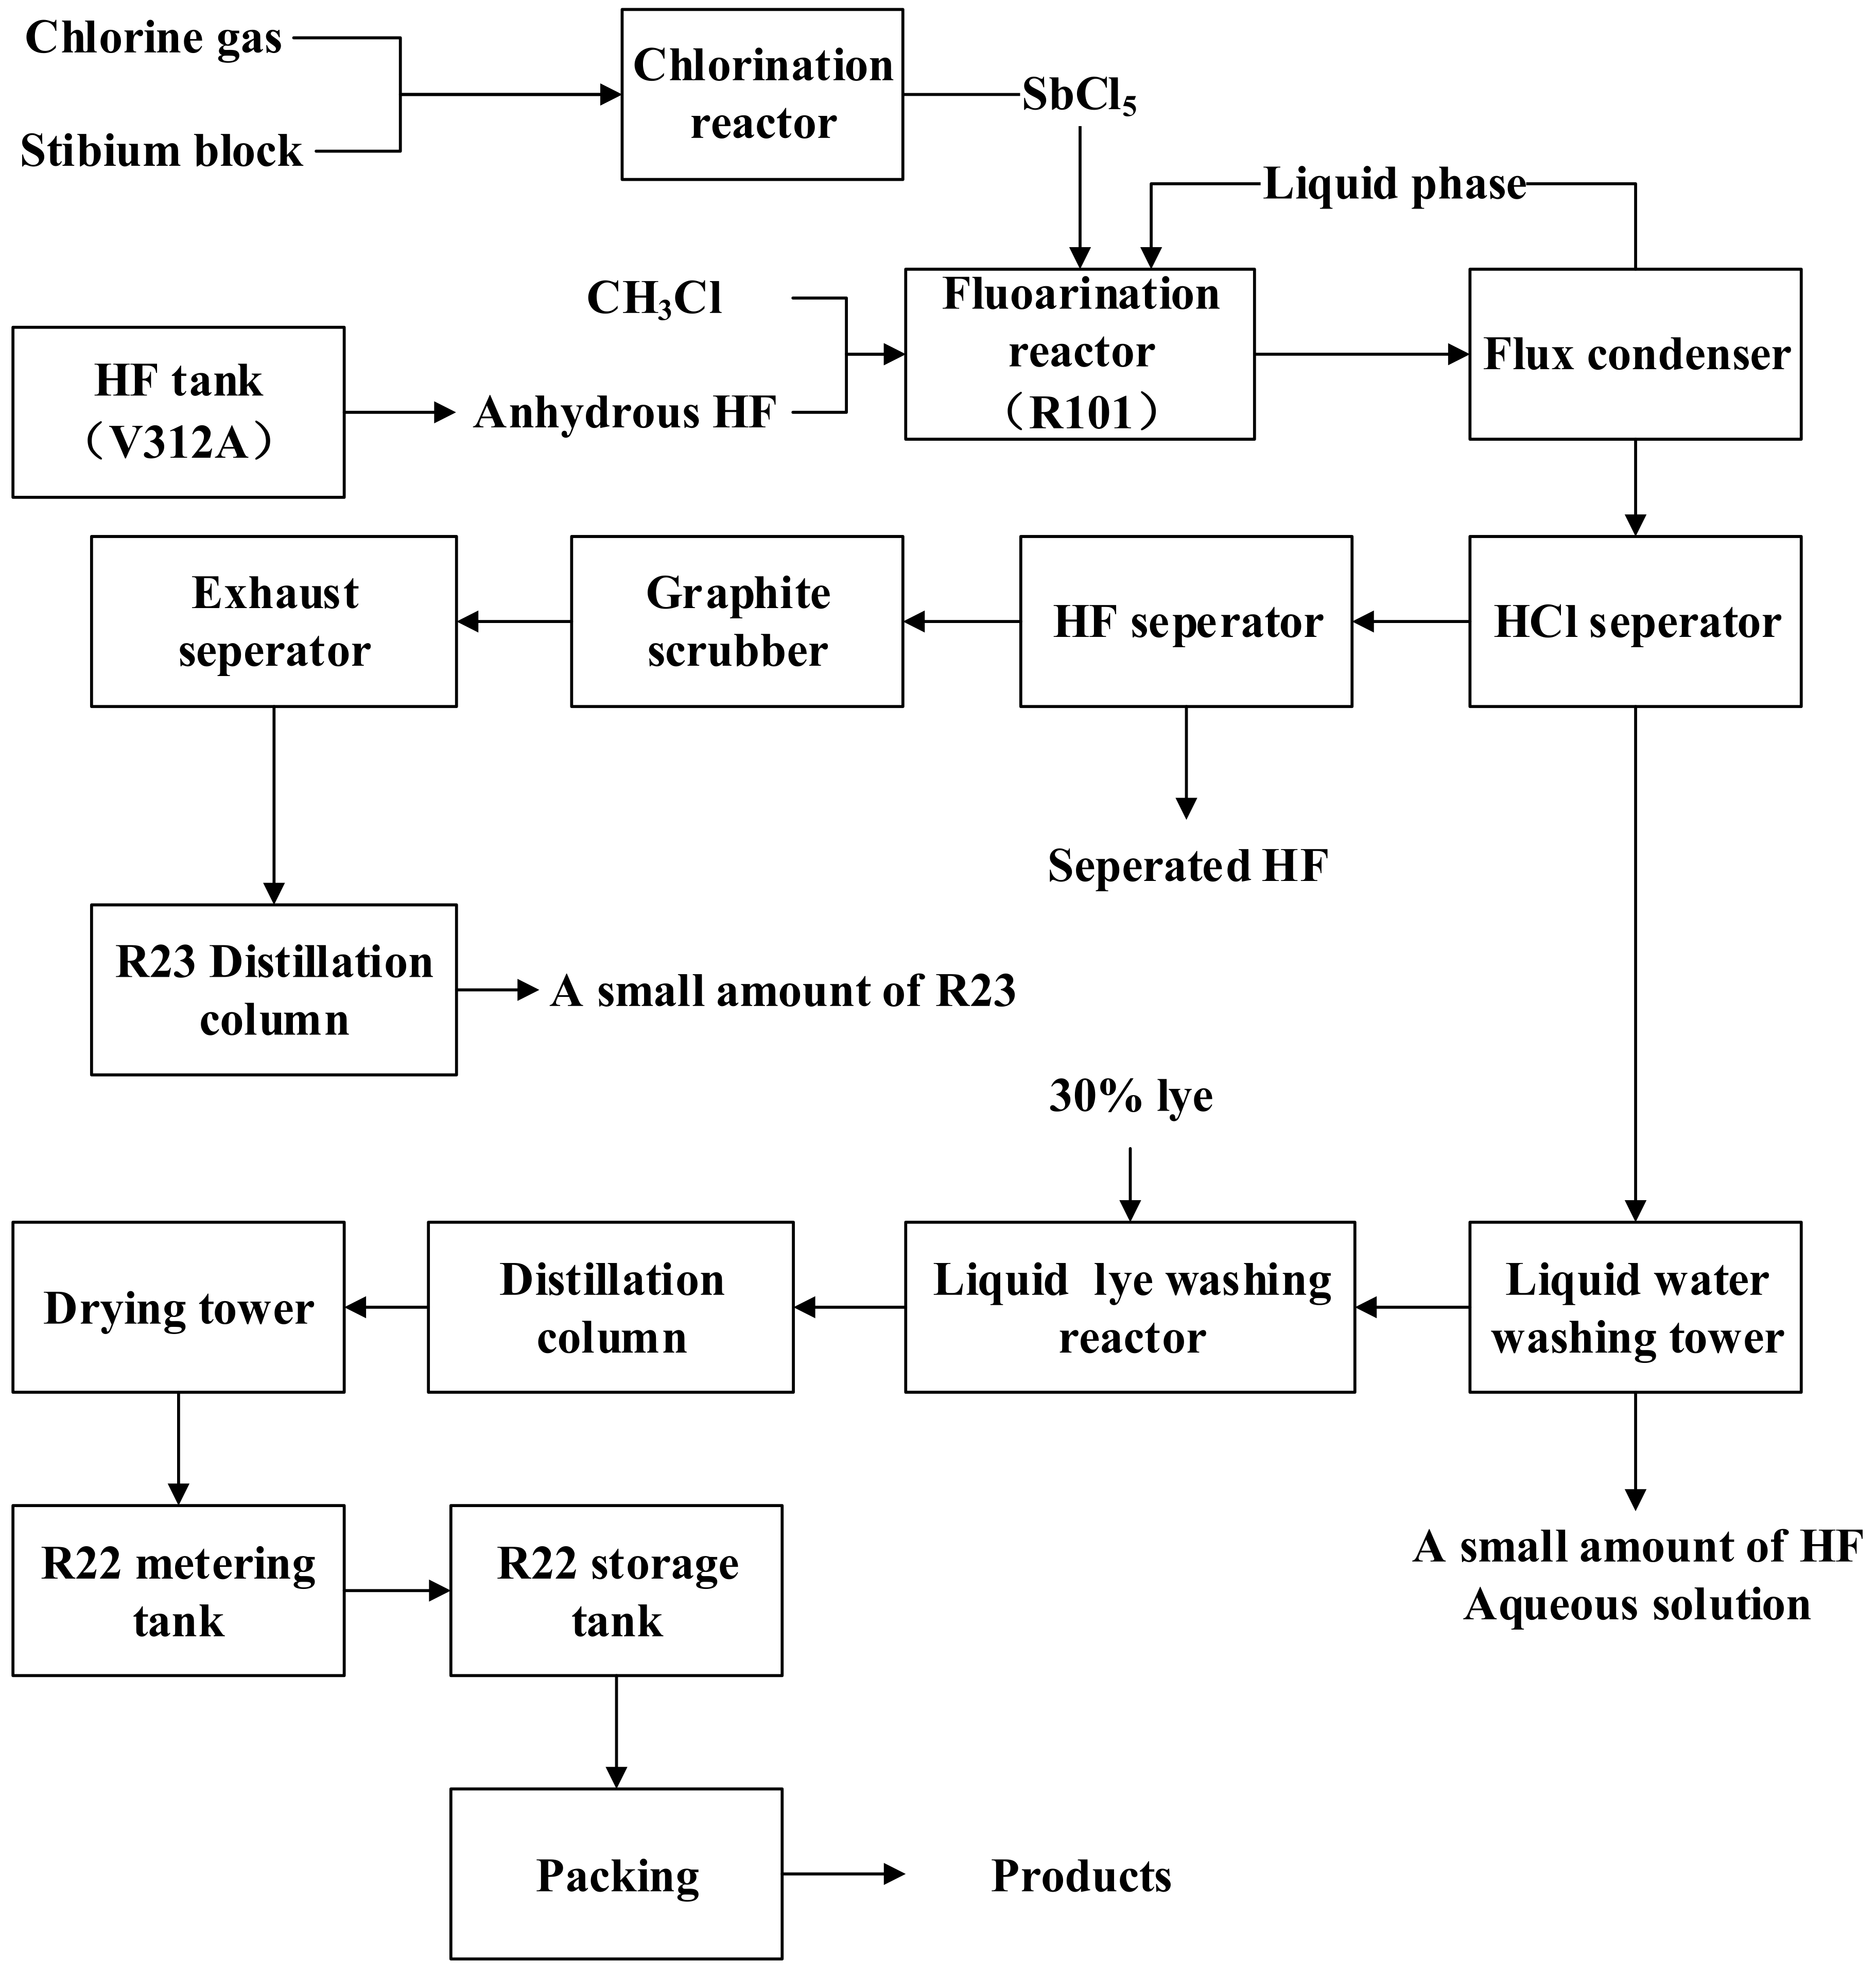
5. Application Cases in Fluorine Chemical Industry

5.1. Process Conditions of a Fluorine Chemical Unit and Its High-Risk Hazard Identification Results with Traditional HAZOP

A typical process unit of a fluorine chemical plant is mainly used to produce freon, with an annual output of 260,000 t. The main safety risks are the combustion and explosion risk of combustible substances such as propylene and the toxic risk of ammonia and hydrofluoric acid. Therefore, the traditional HAZOP analysis is carried out for the typical process. The two cases with high risk are shown in Table 1. Additionally, the generic process flow diagram is shown in Figure 4, the freon is produced as the chemical equation, Equation (15), in the process flow in Figure 4 [42]. “HV104 valve is closed by mistaking” only considers the failure probability of valve intrinsic safety design and type selection. According to the empirical data of fluorine chemical industry, its value is 0.01 (1/a), while the failure frequency of “LICA312A control loop fault”, a BPCS, is 0.1 (1/a). With the assumption of traditional HAZOP, the cause must lead to its corresponding consequences, and according to the risk assessment matrix shown in Figure 5, where the red means the “Very high” risk, orange means the “High” risk, yellow means the “Very high” risk and White means the “Low” risk. The risk results of the two cases are, respectively, “High” and “Very high”.
C H 3 Cl + 2 H F C H Cl F 2 + 2 H Cl

5.2. Risk Identification Based on the New Semi-Quantitative HAZOP Model

For the impact of the reduction factors of the two cases shown in Table 1, the calculation parameters are shown in Table 2. In case 1, “HV104 closed or opened” belongs to the routine operation, and its average operation frequency is 24 times/a. Moreover, the initiating event “HV104 valve is closed by mistake” only occurs when the valve needs to be operated, resulting in the consequences in Table 1, so it belongs to non-accidental operation, and can be regarded as the time enabling condition to be calculated quantitatively by Equation (1). For the initiating event “LICA312A control loop failure” in case 2, its necessary enabling condition is “instrument maintenance failure”. Generally, the sudden failure of DCS loop can be repaired in time. Therefore, “instrument maintenance failure” is an accidental event, so it can be regarded as the enabling condition related to production mode to be calculated quantitatively by Equation (2). In addition, case 1 takes the field operation error as the initiating event, so its α is 1, while the PLs in case 2 contains “personnel alarm response”, so its β is 1. In addition, the assessment cycle of each unit is 3 years, the total maintenance time in this cycle is 15 days, and the cumulative participants is 50. Additionally, HF acid is used as a dangerous process medium, considering the operation parameters and safety protection measures of this freon unit, the calculation parameters of enabling conditions of cases 1 and 2 are shown in Table 2. Additionally, considering the data in Table 2, except for MF, C1, C2, C3 from [41], all of the others came from the authors’ investigation.
The calculation results of items about the reduction factor obtained by using the parameters in Table 2 and Equations (1)–(12) are shown in Table 3.
In Table 3, the R of the two cases is about 16.79 m, involving only one process unit, so the k and n in Table 2 are both equal to 1. Meanwhile, the Severity (probability weighted death toll) in the affected area is equal to 2.768, so LoLi has to be equal to 3.
In addition, it can be seen from Table 1 that case 1 has two IPLs, while case 2 has one IPL and 1 GPL. According to the empirical data from fluorochemical industry in China, for the IPLs in cases 1 and 2, the failure probability of DCS system is 0.1, the failure probability of safety valve (SV) is 0.1, while for the GPL, the failure probability of the alarm system is 0.1, and the failure probability of personnel response ranges from 0.1 to 0.5 [30] because the reserved time from alarm to tank spillover is 15 min according to the general storage tank design specification. Therefore, the median value, 0.25, is adopted for the failure probability of personnel response. The PFD of IPLs and each link of GPLs is shown in Table 4 and Table 5. With Equation (14), the calculation results of GPL in case 2 are shown in Table 6. Finally, with the data in Table 4 and Table 6, the failure probability of the PLs in case 1 and case 2 is equal to 0.01 and 0.035, respectively, by using Equation (13).
With the semi-quantitative HAZOP analysis model, the risks of hazards are as shown in Table 7. In consequence respect, the reduction factor of personnel exposure does not reduce the safety severity level and keeps the S5 level. However, in likelihood respect, the reduction factor of enabling condition can reduce one likelihood level both in cases 1 and 2, and then with the existing safeguards the likelihood is reduced from L5 to L2 and residual risk is also reduced from “High” to “Medium” in case 1, while in case 2 the likelihood is reduced from L6 to L4 and residual risk is from “Very high” to “High”.

6. Conclusions

A new semi-quantitative HAZOP model was presented, different from the past improved model with LOPA as the main analytical line. The new model still regards HAZOP as the main line to keep the efficient analysis of traditional HAZOP at complex cause/consequence correlations. Moreover, the new one can be applied to the safety management of the fluorine chemical process to improve the over-conservative hazard identification from the traditional HAZOP at present. In this model, the quantitative reduction factors, IPLs and GPLs are introduced into the traditional HAZOP analytical process, and construct a new semi-quantitative HAZOP model. In addition, the quantitative algorithms of the reduction factor, PFDs of IPLs and GPLs are given, after fully considering the likely operation, maintenance, emergency scenarios and other influencing factors that may occur in fluorine chemical industry. Through a case from a typical process unit of fluorine chemical industry, comparing with the traditional HAZOP, the new model can complete the quantitative assessment on reduction factors and PLs, based on the semi-quantitative evaluation on consequence affect areas. It can determine the real process risk rank more efficiently and accurately than traditional HAZOP and eliminate the over-conservative high-risk identification to optimize the process safety management and reduce excessive protections in fluorine chemical industry.
Although the method proposed in this paper puts forward a more comprehensive quantitative model for failure likelihood, for consequence analysis, a compromise simplification has to be adopted to maintain the efficiency of risk screening with the empirical Dow index. Therefore, some omissions can exist in using this method to identify high-risk hazards, especially for the hazard scenarios with a more complex correlation or the scenarios with domino effects. For those scenarios, it may be the most reasonable method to apply the full quantitative simulation analysis model for more rigorous analysis for these few identified high-risk scenarios through the semi-quantitative method proposed in this paper screening out efficiently high-risk scenarios. Therefore, the next research needs to focus on effectively avoiding the screening omission or underestimation of such high-risk scenarios and better combination of more efficient screening analysis and more accurate simulation analysis methods.

Author Contributions

Funding acquisition, M.L.; Methodology, D.L. and W.Y.; Writing—original draft, G.C.; Writing—review and editing, Q.W. All authors have read and agreed to the published version of the manuscript.

Funding

This research was funded by THE NATIONAL NATURAL SCIENCE FOUNDATION OF CHINA, grant number 62073091, THE SCIENCE AND TECHNOLOGY PROGRAM OF MAOMING, grant number 2018015, and THE ACADEMIC TALENT INTRODUCTION PROGRAM OF GDUPT, grant number 2018RC17.

Institutional Review Board Statement

Not applicable.

Informed Consent Statement

Not applicable.

Data Availability Statement

Restrictions apply to the availability of these data. Data was obtained from CSEI and are available from Duhui Lu with the permission of CSEI.

Acknowledgments

The authors would like to acknowledge the data support for new method research provided by SCEI.

Conflicts of Interest

The authors declare no conflict of interest.

References

  1. Høj, N.P.; Kröger, W. Risk analyses of transportation on road and railway from a European Perspective. Saf. Sci. 2002, 40, 337–357. [Google Scholar] [CrossRef]
  2. Marhavilas, P.K. Risk Assessment Techniques in the Worksites of Occupational Health-Safety Systems with Emphasis on Industries and Constructions. Ph.D. Thesis, Democritus University of Thrace, Xanthi, Greece, 2015. [Google Scholar]
  3. Woodruff, J.M. Consequence and likelihood in risk estimation: A matter of balance in UK health and safety risk assessment practice. Saf. Sci. 2005, 43, 345–353. [Google Scholar] [CrossRef]
  4. Reniers, G.L.L.; Dullaert, W.; Ale, B.J.M.; Soudan, K. The use of current risk analysis tools evaluated towards preventing external domino accidents. J. Loss Prev. Process Ind. 2005, 18, 119–126. [Google Scholar] [CrossRef]
  5. Haeri, A. Comprehensive plan for assessing and improving safety level of commercial centers towards the prevention of social and economical consequences of accidents. Saf. Sci. 2016, 89, 263–273. [Google Scholar] [CrossRef] [Green Version]
  6. Mohammadfam, I.; Zarei, E. Safety risk modeling and major accidents analysis of hydrogen and natural gas releases: A comprehensive risk analysis framework. Int. J. Hydrog. Energy 2015, 40, 13653–13663. [Google Scholar] [CrossRef]
  7. Zhou, T.; Wu, C.; Zhang, J.; Zhou, T.; Wu, C.; Zhang, J.; Zhang, D. Incorporating CREAM and MCS into fault tree analysis of LNG carrier spill accidents. Saf. Sci. 2017, 96, 183–191. [Google Scholar] [CrossRef]
  8. Liu, H.C.; Chen, Y.Z.; You, J.X.; Li, H. Risk evaluation in failure mode and effects analysis using fuzzy digraph and matrix approach. J. Intell. Manuf. 2016, 27, 805–816. [Google Scholar] [CrossRef]
  9. Fuentes-Bargues, J.L.; González-Gaya, C.; González-Cruz, M.C.; Cabrelles-Ramírez, V. Risk assessment of a compound feed process based on HAZOP analysis and linguistic terms. J. Loss Prev. Process Ind. 2016, 44, 44–52. [Google Scholar] [CrossRef]
  10. International Electrotechnical Commission; International Organization for Standardization. Risk Management—Risk Assessment Techniques, 1st ed.; IEC: Geneva, Switzerland, 2009. [Google Scholar]
  11. Dunjó, J.; Fthenakis, V.; Vílchez, J.A.; Arnaldos, J. Hazard and operability (HAZOP) analysis. A literature review. J. Hazard. Mater. 2010, 173, 19–32. [Google Scholar] [CrossRef] [PubMed]
  12. Rimkevičius, S.; Vaišnoras, M.; Babilas, E.; Ušpuras, E. HAZOP application for the nuclear power plants decommissioning projects. Ann. Nucl. Energy 2016, 96, 461–471. [Google Scholar] [CrossRef]
  13. Cheraghi, M.; Eslami Baladeh, A.; Khakzad, N. A fuzzy multi-attribute HAZOP technique (FMA-HAZOP): Application to gas wellhead facilities. Saf. Sci. 2019, 114, 12–22. [Google Scholar] [CrossRef]
  14. de la O Herrera, M.A.; Luna, A.S.; da Costa, A.C.A.; Blanco Lemes, E.M. A structural approach to the HAZOP—Hazard and operability technique in the biopharmaceutical industry. J. Loss Prev. Process Ind. 2015, 35, 1–11. [Google Scholar] [CrossRef]
  15. Sauk, R.; Markowski, A.S.; Moskal, F. Application of the graph theory and matrix calculus for optimal HAZOP nodes order determination. J. Loss Prev. Process Ind. 2015, 35, 377–386. [Google Scholar] [CrossRef]
  16. Kościelny, J.M.; Syfert, M.; Fajdek, B.; Kozak, A. The application of a graph of a process in HAZOP analysis in accident prevention system. J. Loss Prev. Process Ind. 2017, 50, 55–66. [Google Scholar] [CrossRef]
  17. Baybutt, P. A critique of the Hazard and Operability (HAZOP) study. J. Loss Prev. Process Ind. 2015, 33, 52–58. [Google Scholar] [CrossRef]
  18. Basheer, A.; Tauseef, S.M.; Abbasi, T.; Abbasi, S.A. Methodologies for assessing risks of accidents in chemical process industries. J. Fail. Anal. Prev. 2019, 19, 623–648. [Google Scholar] [CrossRef]
  19. Sultana, S.; Okoh, P.; Haugen, S.; Vinnem, J.E. Hazard analysis: Application of STPA to ship-to-ship transfer of LNG. J. Loss Prev. Process Ind. 2019, 60, 241–252. [Google Scholar] [CrossRef]
  20. Di Nardo, M.; Madonna, M.; Gallo, M.; Murino, T. A Risk Assessment Proposal through System Dynamics. J. Southwest Jiaotong Univ. 2020, 55, 1–10. [Google Scholar]
  21. Di Nardo, M.; Madonna, M.; Murino, T.; Castagna, F. Modelling a Safety Management System Using System Dynamics at the Bhopal Incident. Appl. Sci. 2020, 10, 903. [Google Scholar] [CrossRef] [Green Version]
  22. Chengpu, L. Integration and application of HAZOP and LOPA analysis methods. Pet. Refin. Eng. 2017, 47, 60–64. [Google Scholar]
  23. Haiyang, Q.; Ji’an, L.; Xuanting, L. Application of Simplified HAZOP-LOPA Method in Petrochemical Plant. Saf. Health Environ. 2017, 17, 73–76. [Google Scholar]
  24. Gu-Jun, W.; Wen-Yi, D.; Guang-Wen, Z. Study on IPL identification of typical protection layers in chemical enterprise. J. Saf. Sci. Technol. 2013, 9, 106–110. [Google Scholar]
  25. Fang, Y.; Shu, Z.; Kaili, X. Research on quantitative layer of protection analysis for chemical industry hazards. China Saf. Sci. J. 2019, 29, 100–105. [Google Scholar]
  26. Xiong, Z.; Ye-Qing, G. Application of HAZOP and Layer of Protection in Safety Management of Hydrofining. Guangzhou Chem. Ind. 2019, 47, 201–204. [Google Scholar]
  27. CCPS. Layer of Protection Analysis: Simplified Process Risk Assessment; Wiley: New York, NY, USA, 2010. [Google Scholar]
  28. MEMC. Guidelines for Layer of Protection Analysis (LOPA) AQ/T3054; Ministry of Emergency Management of People’s Republic of China (MEMC): Beijing, China, 2015. [Google Scholar]
  29. SAC. Application Guide for Layer of Protection Analysis (LOPA) GB/T32857; Standardization Administration of the People’s Republic of China (SAC): Beijing, China, 2016. [Google Scholar]
  30. CCSAS. Guidelines on Quality Control and Review for Hazard and Operability (HAZOP) Analysis T/CCSAS 001; China Chemical Safety Association (CCSAS): Beijing, China, 2018. [Google Scholar]
  31. Sinopac Research Institute of Safety Engineering (SRISE). A Guidance for Quantitative Risk Assessment (QRA) in the Petrochemical Plant; Sinopac Press: Beijing, China, 2007. [Google Scholar]
  32. Yuan, X.J.; Zhu, C.L.; Ge, X.K.; Ren, C.X.; Wang, K.Q. Study on Values Taking of Ignition Probabilities in Hazardous Chemical Leakage Accidents. China Saf. Sci. J. 2011, 21, 39–45. [Google Scholar]
  33. Committee for the Prevention of Disasters (CPD). Guide Lines for Quantitative Risk Assessment (Purple Book), CPR 18E; PGS: The Hague, The Netherlands, 2005. [Google Scholar]
  34. Health and Safety Executive (HSE). Canvey: An Investgation of Potential Hazards from Operations in the Canvey Island/Thurrock Area; HMSO: London, UK, 1978. [Google Scholar]
  35. HSE. Available online: http://www.hse.gov.uk/infoserv/mhi-das.htm (accessed on 28 May 2007).
  36. Frank, L.P. Loss Prevention in the Process Industries; Butterworth Heinemann: Oxford, UK, 1996. [Google Scholar]
  37. Lannoy, A. Etudes Déterministe et Probabiliste du Scénario D’accident Prévision des Effets de Surpression; Electricité: Paris, France, 1984. [Google Scholar]
  38. Committee for the Prevention of Disasters (CPD). Risk Evaluation (IPO ProjectA73); Ministry of Housing: The Hague, The Netherlands, 1996. [Google Scholar]
  39. COVO Commission. Risk Analysis of Six Potentially Hazardous Industrial Objects in the Rijinmond Area; Central Environmental Control Agency: Rijinmond, The Netherlands, 1981. [Google Scholar]
  40. Cox, A.W.; Lees, F.P.; Ang, M.L. Classification of Hazardous Locations; IChemE: Warwickshire, UK, 1990. [Google Scholar]
  41. DOW. DOW’s Fire & Explosion Index Hazard Classification Guide, 7th ed.; American Institute of Chemical Engineers (AICE): New York, NY, USA, 1994. [Google Scholar]
  42. Jie, H. Occupational Hazards Detection and Precaution Measures in Freon (R22) Enterprise. Zhejiang Chem. Ind. 2014, 45, 6–9. [Google Scholar]
Figure 1. Interaction between HAZOP and LOPA in hazard analysis with a complex relationship.
Processes 09 01695 g001
Figure 2. Semi-quantitative HAZOP model based on quantitative correction factors.
Processes 09 01695 g002
Figure 3. Relationship between initiating risk, residual risk 1 and residual risk 2 in the new semi-quantitative HAZOP model.
Processes 09 01695 g003
Figure 4. Freon generic process flow diagram (PFD).
Processes 09 01695 g004
Figure 5. Risk assessment matrix on HAZOP.
Processes 09 01695 g005
Table 1. Cases of high-risk hazard identification results with traditional HAZOP for freon process unit.
CasesGuide WordsCausesConsequencesExisting SafeguardsRisk
1Pressure is high in Reactor R101Manual valve HV104 is closed by mistakeR101 is over-pressured, and HF acid leakage is toxic to personnel1. PRAS107 (DCS loop)High
2. Safety valve SV107
2Liquid level is high in HF acid tank V312ADCS loop LICA312A is faulty, not closing the control valve in timeV312A experiences spillover or over-pressure, and HF acid leakage is toxic to personnel1. PIA312A liquid level high alarm field operation of operatorsVery high
2. Safety valve SV312A
Table 2. The parameters of reduction factors and their values.
ParametersValues
Case 1Case 2
t(j)ec-i10
J7200
top24,0000
a33
N10100
ni01
k11
t(i)rc11
n11
t(i)m55
F12.552.55
F244
MF24 [41]24 [41]
C10.572 [41]0.572 [41]
C20.856 [41]0.856 [41]
C30.698 [41]0.698 [41]
PSrc22
PSm5050
α01
PSal22
β10
PSoe22
Table 3. The calculation results of reduction factors.
ItemsResults
Case 1Case 2
fic(t)0.0010
fic(m)00.003
LoLi33
fic0.10.1
fecc0.10.1
feps-rc0.0420.042
feps-m0.0140.014
F&EI192192
F388
F&EI’65.6065.60
C0.3420.342
R16.7916.79
Severity2.7682.768
Table 4. PFDs of IPLs and their values.
PFDs of IPLsValues
PFDIP110.1
PFDIP120.1
PFDIP220.1
Table 5. PFDs of necessary links of GPLS and their values.
PFDs of Necessary Links of GPLsValues
PFDGP(1)210.1
PFDGP(2)210.25
Table 6. PFDs of GPLS and their values.
PFDs of GPLsValues
PFDGP210.35
Table 7. Hazard risk identification results based on new semi-quantitative HAZOP model.
CasesInitiating RiskReduction FactorsResidual Risk 1Existing SafeguardsResidual Risk 2
SLrfeccSLrPFDSLr
1S5L5H0.1S5L4H0.01S5L2M
2S5L6VH0.1S5L5H0.035S5L4H
Publisher’s Note: MDPI stays neutral with regard to jurisdictional claims in published maps and institutional affiliations.

