Article

Application of Ultrasonic Atomization on a Micro Jet Engine Using Biofuel for Improving Performance

1
Public Authority for Applied Education and Training, Adailiyah 00965, Kuwait
2
Department of Mechanical and Manufacturing Engineering, Universiti Putra Malaysia, Serdang 43400, Malaysia
*
Author to whom correspondence should be addressed.
Processes 2021, 9(11), 1963; https://doi.org/10.3390/pr9111963
Submission received: 12 October 2021 / Revised: 25 October 2021 / Accepted: 28 October 2021 / Published: 3 November 2021

Abstract

:
Jet engines are commonly used in aeronautical applications, and are one of the types of gas turbine engines. The circulation of air releases heat energy to expand the volume of hot fluids and impact the turbine wheel to generate power of hot gases. The present study investigates the potential of using ultrasonic atomization technology to assist in the combustion process. An experimental rig was set up to determine the performance of jet engines using ultrasonic droplets. A gas analyzer was used to measure various greenhouse emissions of exhaust gas. The performance of the engine was tested under three load levels (high, medium, low), starting from 10 psi at a steady state, to the minimum value. A significant result was tested for a low value of nitrogen monoxide at the three levels of load, and a specific result was tested for an efficiency value of 2% at the three levels of load. Carbon dioxide was found to decrease at the low load level. The use of an ultrasonic atomization device to assist in the combustion process was useful in achieving engine efficiency of 1% and a reduction of 25% in carbon dioxide exhaust gas.

1. Introduction

A gas turbine is a type of internal combustion engine that is used to generate power [1]. It consists of an upstream rotating compressor coupled to the downstream turbine and a combustion chamber [2]. All gas turbines generate thrust by providing a change in momentum to the air that enters and leaves the gas turbine [3,4]. The higher the difference in momentum, the greater the thrust that the gas turbine produces [5]. For combustion to occur, the gas turbine requires a combustor. The combustor is a vital component of the gas turbine. Unlike automobiles, gas turbines have a continuous flame inside the combustor, which is lit for as long as the engine is running [6]. Once ignited, the flame is maintained by constantly mixing fuel with the high-pressure compressed air from the compressor, using a fuel nozzle. The primary purpose of every fuel nozzle is to atomize the fuel into small droplets in order to speed up the mixing process of fuel and air [7]. The differences between various fuel nozzle technologies lie in how exactly the droplets are produced. Thus, the size, d ≥ 15 µm, of the droplets affects the effectiveness of atomization of fuel in a gas turbine [8].
Atomization is the breakup of bulk liquid into small droplets using an atomizer or spray [9,10]. Atomizers are generally classified into pressure atomizers, air-blast atomizers, air-assist atomizers, pressure-swirl atomizers, twin-fluid atomizers, rotary atomizers, ultrasonic atomizers, whistle atomizers and electrostatic atomizers [11,12]. In gas turbines, the combustion efficiency is affected by the efficacy of the atomization process, which is designs by the various kinds of atomizers determined.
The atomization of fuel is crucial for the combustion and emission of a gas turbine since, through atomization, the surface area of fuel is increased 40,000 times to hasten combustion. Within this system, combustion is continuous [13]; therefore, the atomization in a gas turbine is continuous, without any strokes or cycles. In order to obtain this optimization amount of combustion, a good amount of fuel should be added and mixed with the high-pressure air exiting the compressor in suitable proportions. In order to make the engine small and lightweight, injection of fuel, mixing and combustion of the fuel in a small area is required. Practically, this is inefficient, and in the case of pressure atomizers, a major obstacle is the requirement of a high injection pressure, P ≥ 3, with a relatively small increase in the flow rate. For example, for a simplex nozzle, the flow rate varies, as the square root of the injection pressure differential (∆PF). Consequently, other alternative ways of atomization become indispensable in non-pressurized engines.
Generally, adequate atomization enhances mixing and complete combustion in a direct injection (DI) engine, and therefore, it is an important factor in engine emissions and efficiency. In the case of biodiesel, which has difficulty in the beginning stages due to the cold temperatures because of its crystallizing properties at the lower temperatures, other options for atomization will be needed in order to overcome to some of these challenges. The feasibility of biodiesel as a renewable fossil-fuel replacement for gas-turbine operations is currently being researched due to an earlier report on the emission levels of some oxides of nitrogen, oxides of sulfur and carbon monoxide. For the environment, combustion systems using biodiesel have not been completely improved yet to reduce their emissions. Biodiesel still needs to be evaluated in terms of its possible application for reducing emissions. With improved atomization (d ≥ 20 µm), gas turbine processes can achieve enhanced emissions levels as compared to those using conventional diesel [14,15]. The goals of this study are as follow: (1) to study proper atomization design for both ultrasonic and conventional applications, (2) to determine the performance of atomization using results from objective tests, and (3) to evaluate the effect on engine performance of different fluids for atomization of different fuels by means of emissions measurements (CO, CO2, NO, NO2).

2. Materials and Methods

2.1. Internal Combustion Engine Lab

An internal combustion engine laboratory was founded for the purposed of this study. The lab was equipped with the necessary systems and equipment for safe and integrated operation. The laboratory was equipped to be a project incubator. The lab is located in a 9 × 9 m covered area. Figure 1 explains the block diagrams of the engine for more clarity and a full understanding. The block diagram highlights the entrance of the fuels into the conventional fuel system before it is injected into the combustion chamber. Air enters the system under pressure, and then passes to the combustion chamber. The air passes through the nozzle prior to the combustion reaction, which occurs due to energy flow through the turbine wheel under high temperature, flow rate, pressure and thrust force. The engine properties of temperature, pressure, airflow rate, fuel flow rate and thrust force can be measured; these parameters of engine performance engine emissions data was were collected using sensors and measuring devices connected to a computer. The numbers listed in Figure 1 with different colors indicate the sensor positions used in this study. These sensors include an air-mass flow sensor located in front of the engine intake compressor inlet, indicated as number 2, and a mass fuel flow rate sensor, indicated as number 2. The pressure transducer (pressure sensor) was fixed in front of the intake area and the outlet of the compressor, as can be seen in blue and indicated as numbers 1 and 2. The temperature sensors were fixed at points 1, 2, 3, and 4, indicated in green, which are the compressor inlet, the compressor outlet, the combustion chamber outlet and the turbine outlet, respectively. All sensors, as well as the load-cell measuring thrust force, were connected to a control unit.

2.2. Micro Gas Turbine Setup

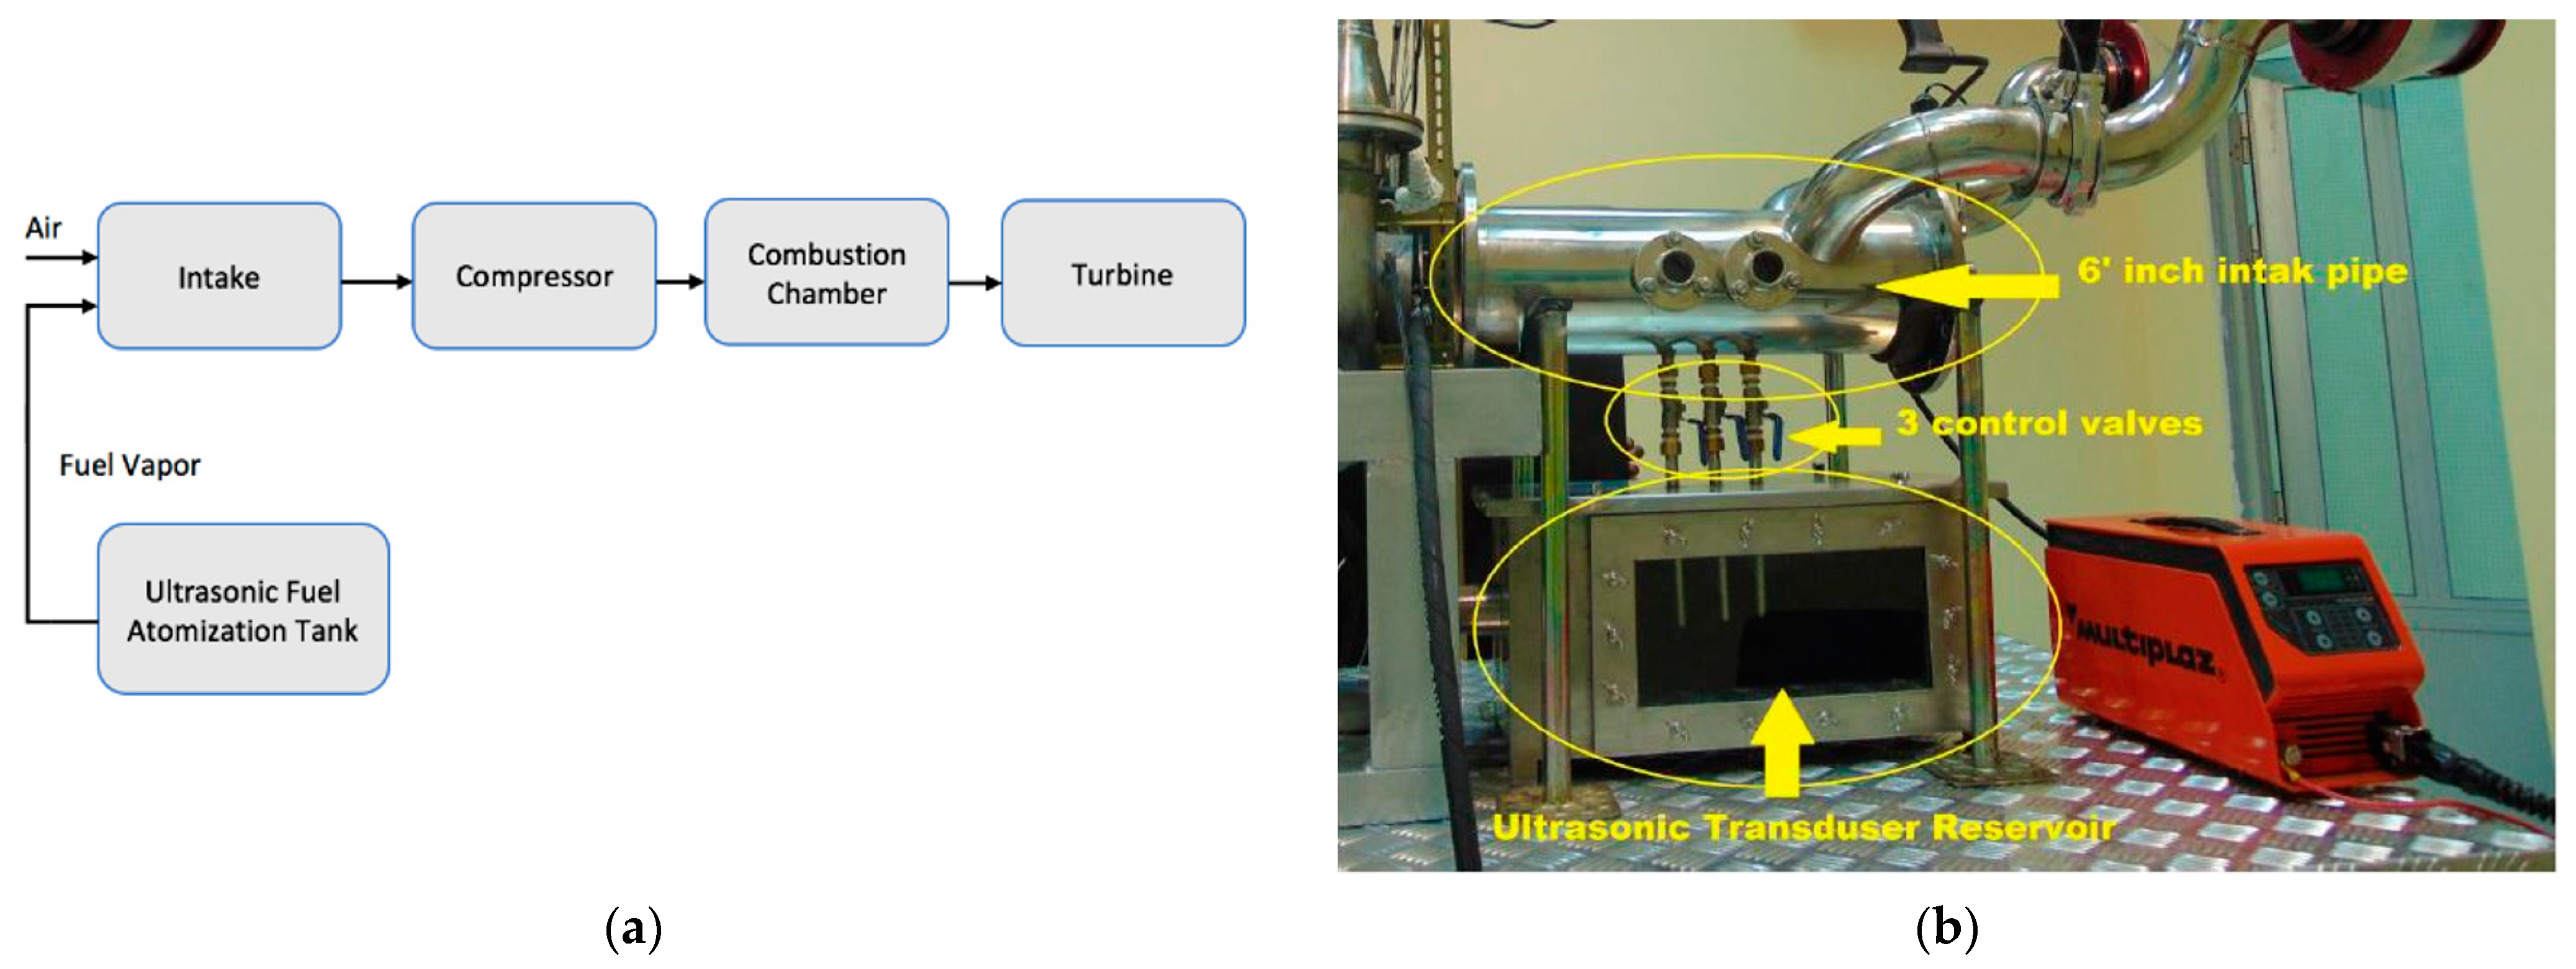
2.2.1. Gas Turbine Engine

The combustion chamber was designed with an airflow of 0.468 kg/s, as in the Garrett 100-82 engine (Cincinnati, OH, USA). The combustion chamber and its fittings were assembled with stainless steel and iron. Various types of welding were used for welding and soldering. The compressor map is a graph that illustrates the performance of the compressor properties in terms of efficiency, boost-pressure capability, mass-flow range and turbo speed. The findings of the compressor map depend on compressor-rig test results. Additionally, the map of a similar compressor can be suitably scaled. The compressor map is an integral part of predicting the performance of a gas turbine engine. To determine the combustion, a chamber the size of the combustor, 13.5 cm in diameter and 26 cm in height, was installed in a vertical position in case of accumulation fuel inside the combustor (Figure 2a). The fuel injector installed on top of the combustion chamber. In Figure 2b, the electric igniter is placed next to the inner part of the combustion chamber to ensure that the spark is within reach of the air-fuel mixture and that the electric igniter has a continuous spark for up to 4 min without interruption and a charge of more than 400,000 volts.

2.2.2. Gas Turbine Engine and Systems

The gas turbine engine was installed inside the insulated chamber, which was specially constructed to ensure thermal insulation and sound insulation. The base was made of steel metal to ensure the stability of the gas turbine engine when operating at high loads and also for ease of maintenance and inspection of the condition of the gas turbine engine after each operation or as needed. The engine’s systems were linked to a control unit to ensure a smooth and systematic operation, beginning with the starting of the engine, ensuring stability under variation of load through the monitoring phase and until the end of the operation. The control unit was designed to predict a state of instability or emergency operation.

2.3. Ultrasonic Atomization System

The ultrasonic atomization system is a part of the setup that contains a stainless-steel container that ensures a constant level of fuel to ensure the effective operation of the ultrasonic devices. Figure 3a depicts the block diagram of ultrasonic atomization techniques used in this study. Additionally, Figure 3b shows the container containing the ultrasonic devices. It is worth mentioning that each ultrasound devics has a fixed quantity-of-flow rate. The flow of whole system is controlled by running several ultrasound devices as needed. This container is connected by three tubes to the main header. The main header is a 6-inch tube attached to the engine directly on the compressor side. Three ultrasonic evaporators were placed inside the evaporator tank, as shown in Figure 3b. The liquid level can be checked through the side window of the tank. To calculate the evaporation rate of fuel that enters the engine, each ultrasonic evaporator is placed inside an enclosed indication bottle that can be read from outside. Table 1 illustrates the specifications of the ultrasonic atomization transducer.

2.4. Sensors

2.4.1. Thermocouples Sensor

The temperature sensors used in this study are varied according to the required temperature. Many types of temperature sensors were used, ranging from room temperature to high temperatures in the combustion chamber, as well as temperature control in the lubrication system. Sensors were installed on the outside of the laboratory, inside the engine room at the air inlet before evaporation, after the evaporation system, as well as main sensors on the engine. The temperature sensors used in this study were K-type, which is used at temperatures between 0 and 1300 °C. The temperature sensors are very important for measuring the efficiency of the engine. The temperature sensors were distributed in specific places to give the most accurate reading possible during the change in temperature under different operating conditions.

2.4.2. Pressure Sensor

In this study, a pressure probe from Honeywell was used with a reading range of 0 psi to 100 psi. The readings are displayed on the main control panel and digitally recorded by the computer. The pressure sensor was installed on the outlet of the compressor. This high-performance sensor uses piezo-resistive sensing technology and operates at temperatures ranging from −40 °C to 125 °C. If the temperature is more than 125 °C, there is an error rate of 2%, which is acceptable. This sensor is connected to the controller via a cable on the control panel of the engine.

2.4.3. Mass Flow Sensor

A portable mass flow device from SMART SENSOR was used in this study, model AR866A, hot wire anemometer. The maximum speed of air flow is 30 m/s. The device was fixed in front of the intake area of the micro gas turbine. The air inlet is designed to keep up with the speed of the air-mass measuring device. It can measure the air speed, quantity and temperature readings of the SI and British systems. The data is entered into the internal memory of the device or via a computer connection to the Excel program, indicating the time, speed, temperature and flow quantity.

2.4.4. Combustion Analyzer Device

The device used to study emissions from the engine is a NOVA 7466K, a mobile device running on DC batteries for easy mobility in critical places and containing many accessories, such as tubes for samples, sensors for heat and pressure. This device records readings and prints by radio. This device measures the gases of oxygen, carbon monoxide and carbon dioxide and can remove the proportion of air that did not enter the combustion and calculate the proportion of combustion efficiency. The combustion analyzer device works with different types of fuel, such as coal, wood, natural gas, fossil fuels and biofuels.

2.4.5. Load Scale

The force measured from the engine is in the form of jet thrust. This force was measured by the load scale, consisting of two parts: the load device, an OPTIMA OP-312, and the screen that records the data reading. The device is in compression mode and located in front of the sliding base of the engine. The capacity of the device is 450 kg.

2.4.6. Fuel Consumption

To calculate the consumption of fuel for the gas turbine engine, a weight-scale (Vacuum gauge 69086, Yellow jacket (Minneapolis, MN, USA) device was used to calculate the consumption of fuel for the engine by record the amount of fuel entering the system. This device can measure an amount of fuel equivalent to 50 kg. There is more than one unit to calculate the flow quantity according to the choice. The device and the process of work by using a quantity of fuel and then weighing in the device the beginning of engine consumption and again when the engine is shut down. The device then gives the amount of fuel flowing to the engine instantaneously. This is the method used to calculate the amount of fuel consumption during operation.

3. Results and Discussion

3.1. Standard Fuel Specification

In order to obtain the properties of different fuels (diesel, kerosene: Kerosene + Biodiesel (80:20); B20: Kerosene + Biodiesel (50:50); B50: Kerosene + Biodiesel (25:75); B75 and Pure Biodiesel B100) employed in the current study, all the necessary tests and data analyses were carried out in the Petroleum Research Center, Kuwait Institute for Scientific Research. It is worth noting that similar ASTM standards were employed to determine each property of the different fuels used in the current study. Table 2 presents the measured properties of the diesel, kerosene and biodiesel blends. A portion of the biodiesel fuel was compared with the standard specifications and regulations used worldwide. The B100 and B20 specifications were compared with petroleum specifications to investigate the performance of fuels generated from the ultrasonic atomizer applied in this study. Different physical characteristics were measured, like viscosity, flash point, water content, and sulfur content. The viscosity of B100 is (1.9–6.0) mm2/s, flash point (130 °C), water content (500 mg/kg), and sulfur content (0.500). The standards of the B100 found in this study are shown in Table 2. These values confirm that the fuels from the ultrasonic atomizer were within the international standards range. Therefore, ultrasonic atomizer is appropriate to be applied in a jet engine turbine.

3.2. Results of Engine Performance Analysis

3.2.1. Air-Flow Rate

The air-flow rate is the key feature parameter influencing the free cooling performance. In an engine, the air-flow rate quite significantly boosts the heat-transfer rate. Table 3 shows the results of the air-flow rate and the uncertainty against the engine load for all the different fuel types employed in the study. The investigation of the air-flow rate is very important to establish a comparison of the results with and without an ultrasonic atomization system for the different fuel types. As shown in Table 3, the fuel types tested exhibited an approximately similar air-flow rate of 260.00 ± 1.55, 397.80 ± 0.75, 515.10 ± 1.00, 263.20 ± 1.55, 399.30 ± 0.75, and 517.40 ± 1.00 for low, medium, and high load, respectively, using normal fuel atomization and both normal fuel and ultrasonic fuel atomization. It is also worth noting that Table 3 shows that the air-flow rate increased with rising engine load. Moreover, for all the fuels tested, it is evident that at an approximately similar air-flow rate, the engine load produced using the micro jet engine was significantly higher for the ultrasonic atomization process than the normal atomization process. Hence, the ultrasonic atomization process was helpful in attaining a better air-flow rate result as compared with the normal process.

3.2.2. Fuel Flow Rate

The Fuel flow rate is one of the necessary factors in engine turbines to be used to determine the engine’s specific fuel consumption. Table 4 shows the fuel flow rate against the engine load for all the different fuel types employed in the study. The investigation of the fuel flow rate is very important to establish a comparison between the spray characteristics of fuel in the normal and ultrasonic atomization systems for the different fuel types. Like the results measured for the air-flow rate and as shown in Table 3, the fuel types tested exhibited approximately similar fuel flow-rate results for both the normal and ultrasonic atomization. Also notable from the plots is that the fuel flow rate increased with rising engine load. Moreover, for all the fuels tested, it is evident that at an approximately similar fuel flow rate, the engine load generated increased more for the ultrasonic atomization process than the normal atomization process. Hence, the ultrasonic atomization process was effective in achieving a better fuel flow rate result as compared with the normal process. Meanwhile, slight differences can be observed in the normal and ultrasonic atomization systems for the different fuel types. This can best be explained by the decreasing density of the biodiesel with increasing addition of kerosene. A similar finding was reported by Park et al. [16] and Alajmi et al. [17].

3.3. Emission Data Measurements
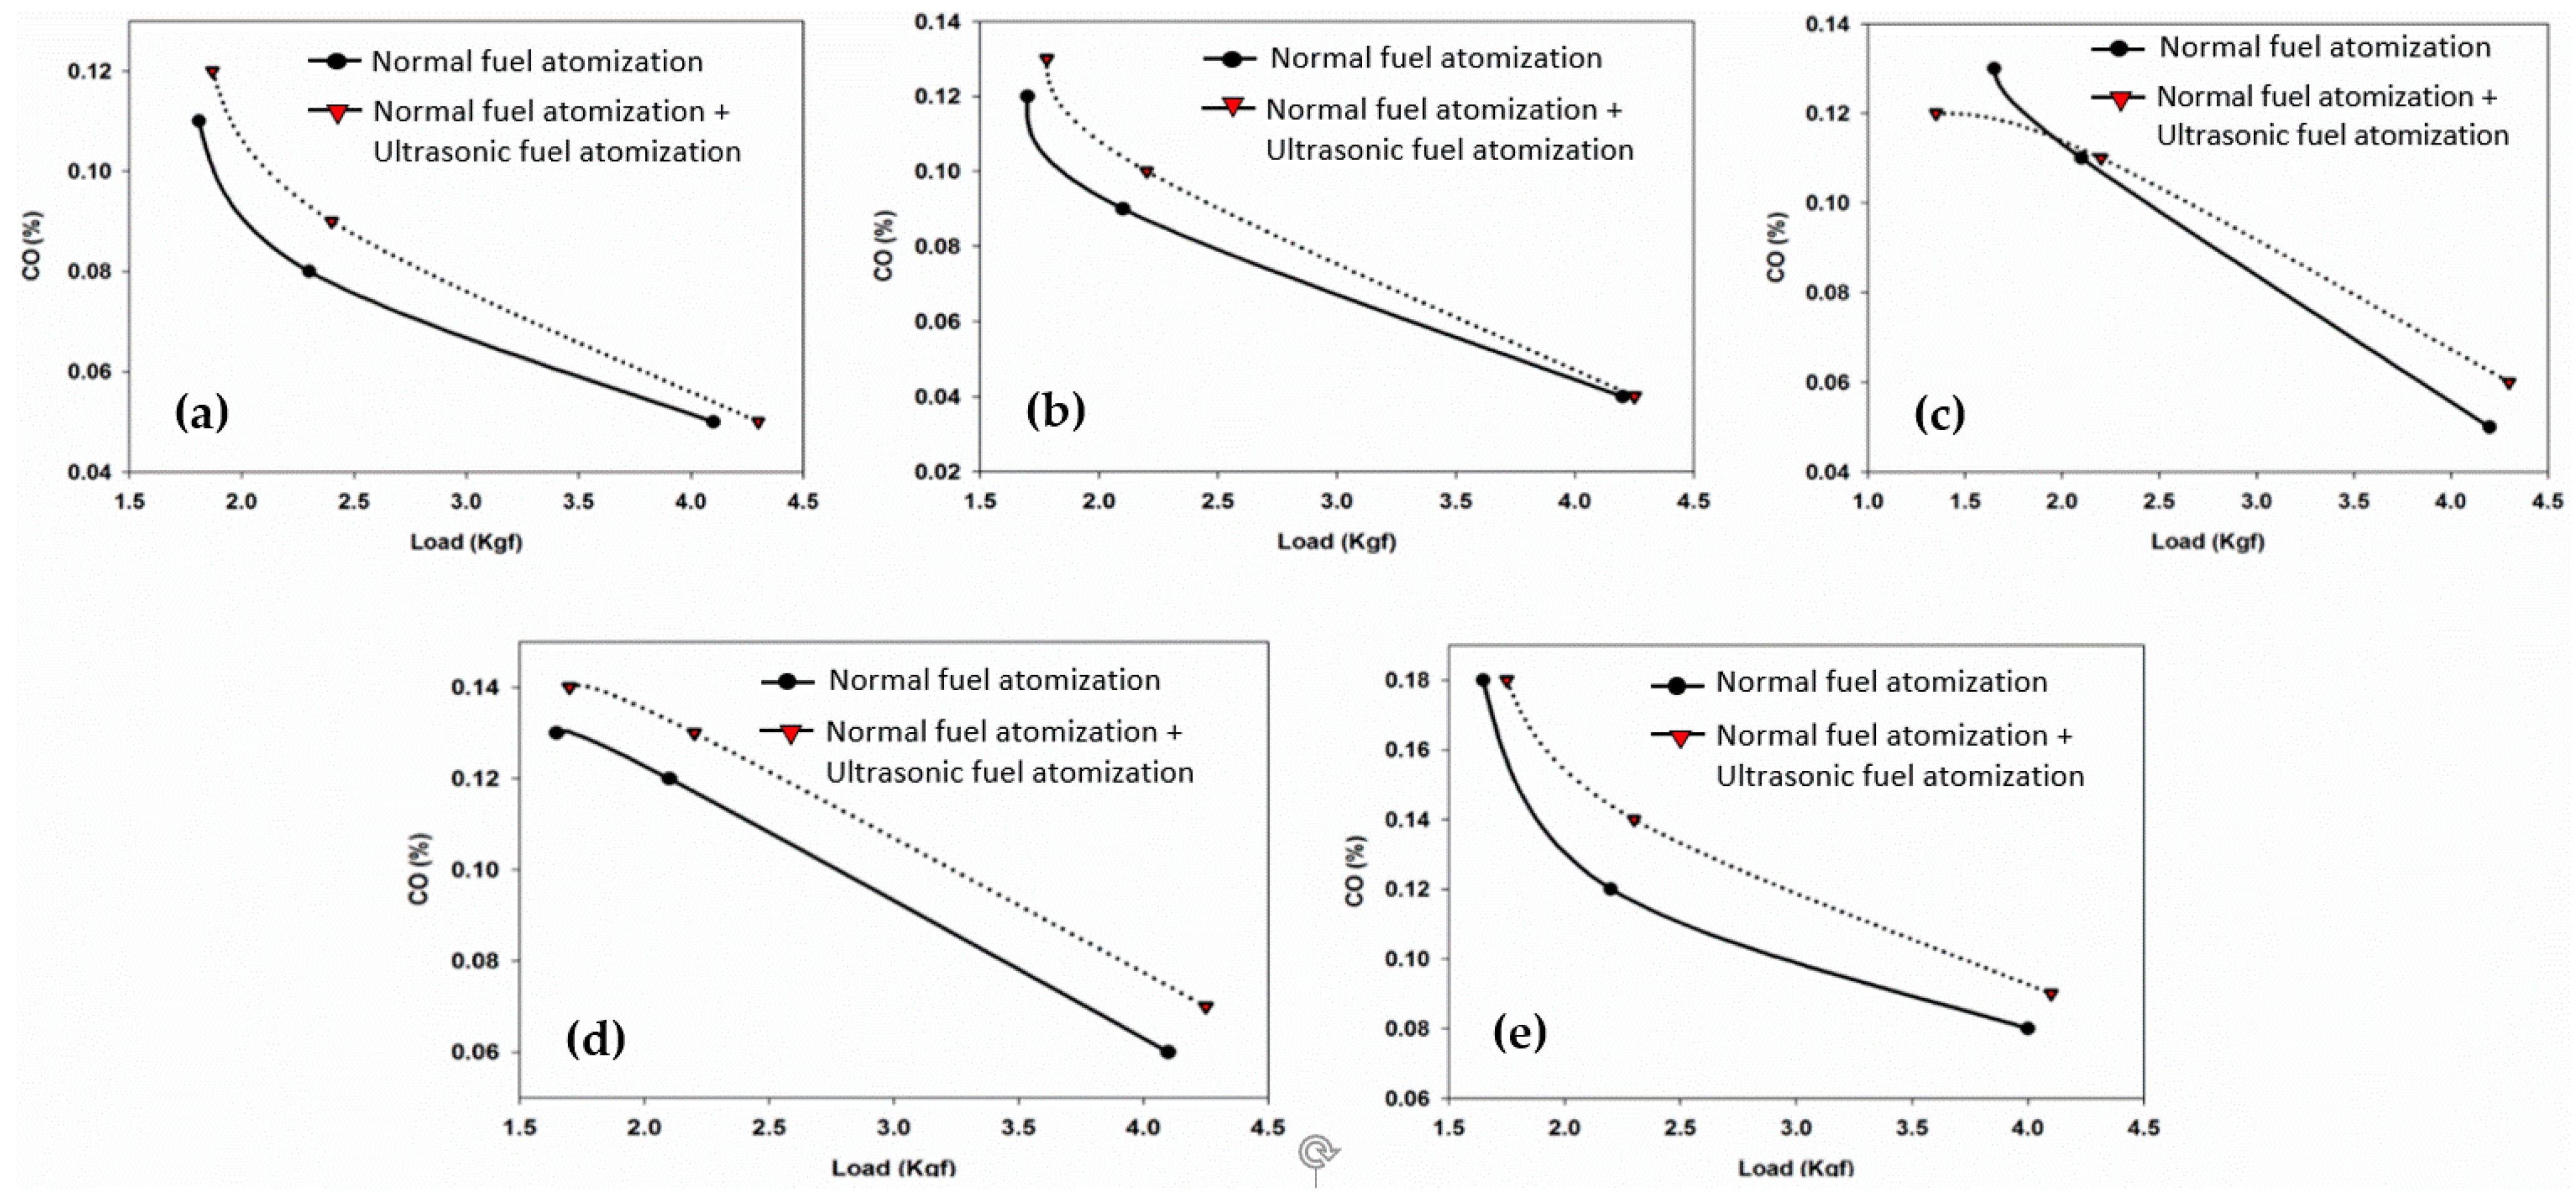
3.3.1. CO Emission

The formation of CO is caused due to the incomplete combustion of CO2, owing to air inhibition or due to low gas temperature. In general, many factors, such as fuel types, speed of engine, rate of air in fuel, injection time and pressure affect CO emissions [18]. Figure 4 shows the effect of variation of the different fuels injected through the ultrasonic and normal processes on CO emissions. As it can be seen in Figure 5, kerosene showed the lowest CO emission results as compared to all the biodiesel fuels in both the ultrasonic and normal fuel-atomization conditions. Thus, when the kerosene content in the biodiesel was decreased, CO emissions increased. This finding can be explained better by the high heat absorption produced from the kerosene evaporation as compared to biodiesel fuels. This has also been reported by a previous study [19], which stated that the higher kinematic viscosity and density of biodiesel can lead to poor fuel atomization, consequently causing an increase in exhaust-gas emissions. The results observed with the biodiesel fuels showed the highest CO emissions found in the ultrasonic atomization process as compared with the normal process. As the droplet size of fuels is reduced due to the ultrasonic process, the time required for combustion becomes shorter and causes less combustion to occur relative to the normal process. Therefore, the CO emissions of fuels using the ultrasonic atomization process were higher across the entire engine load compared to the CO emissions of fuels using the normal process.

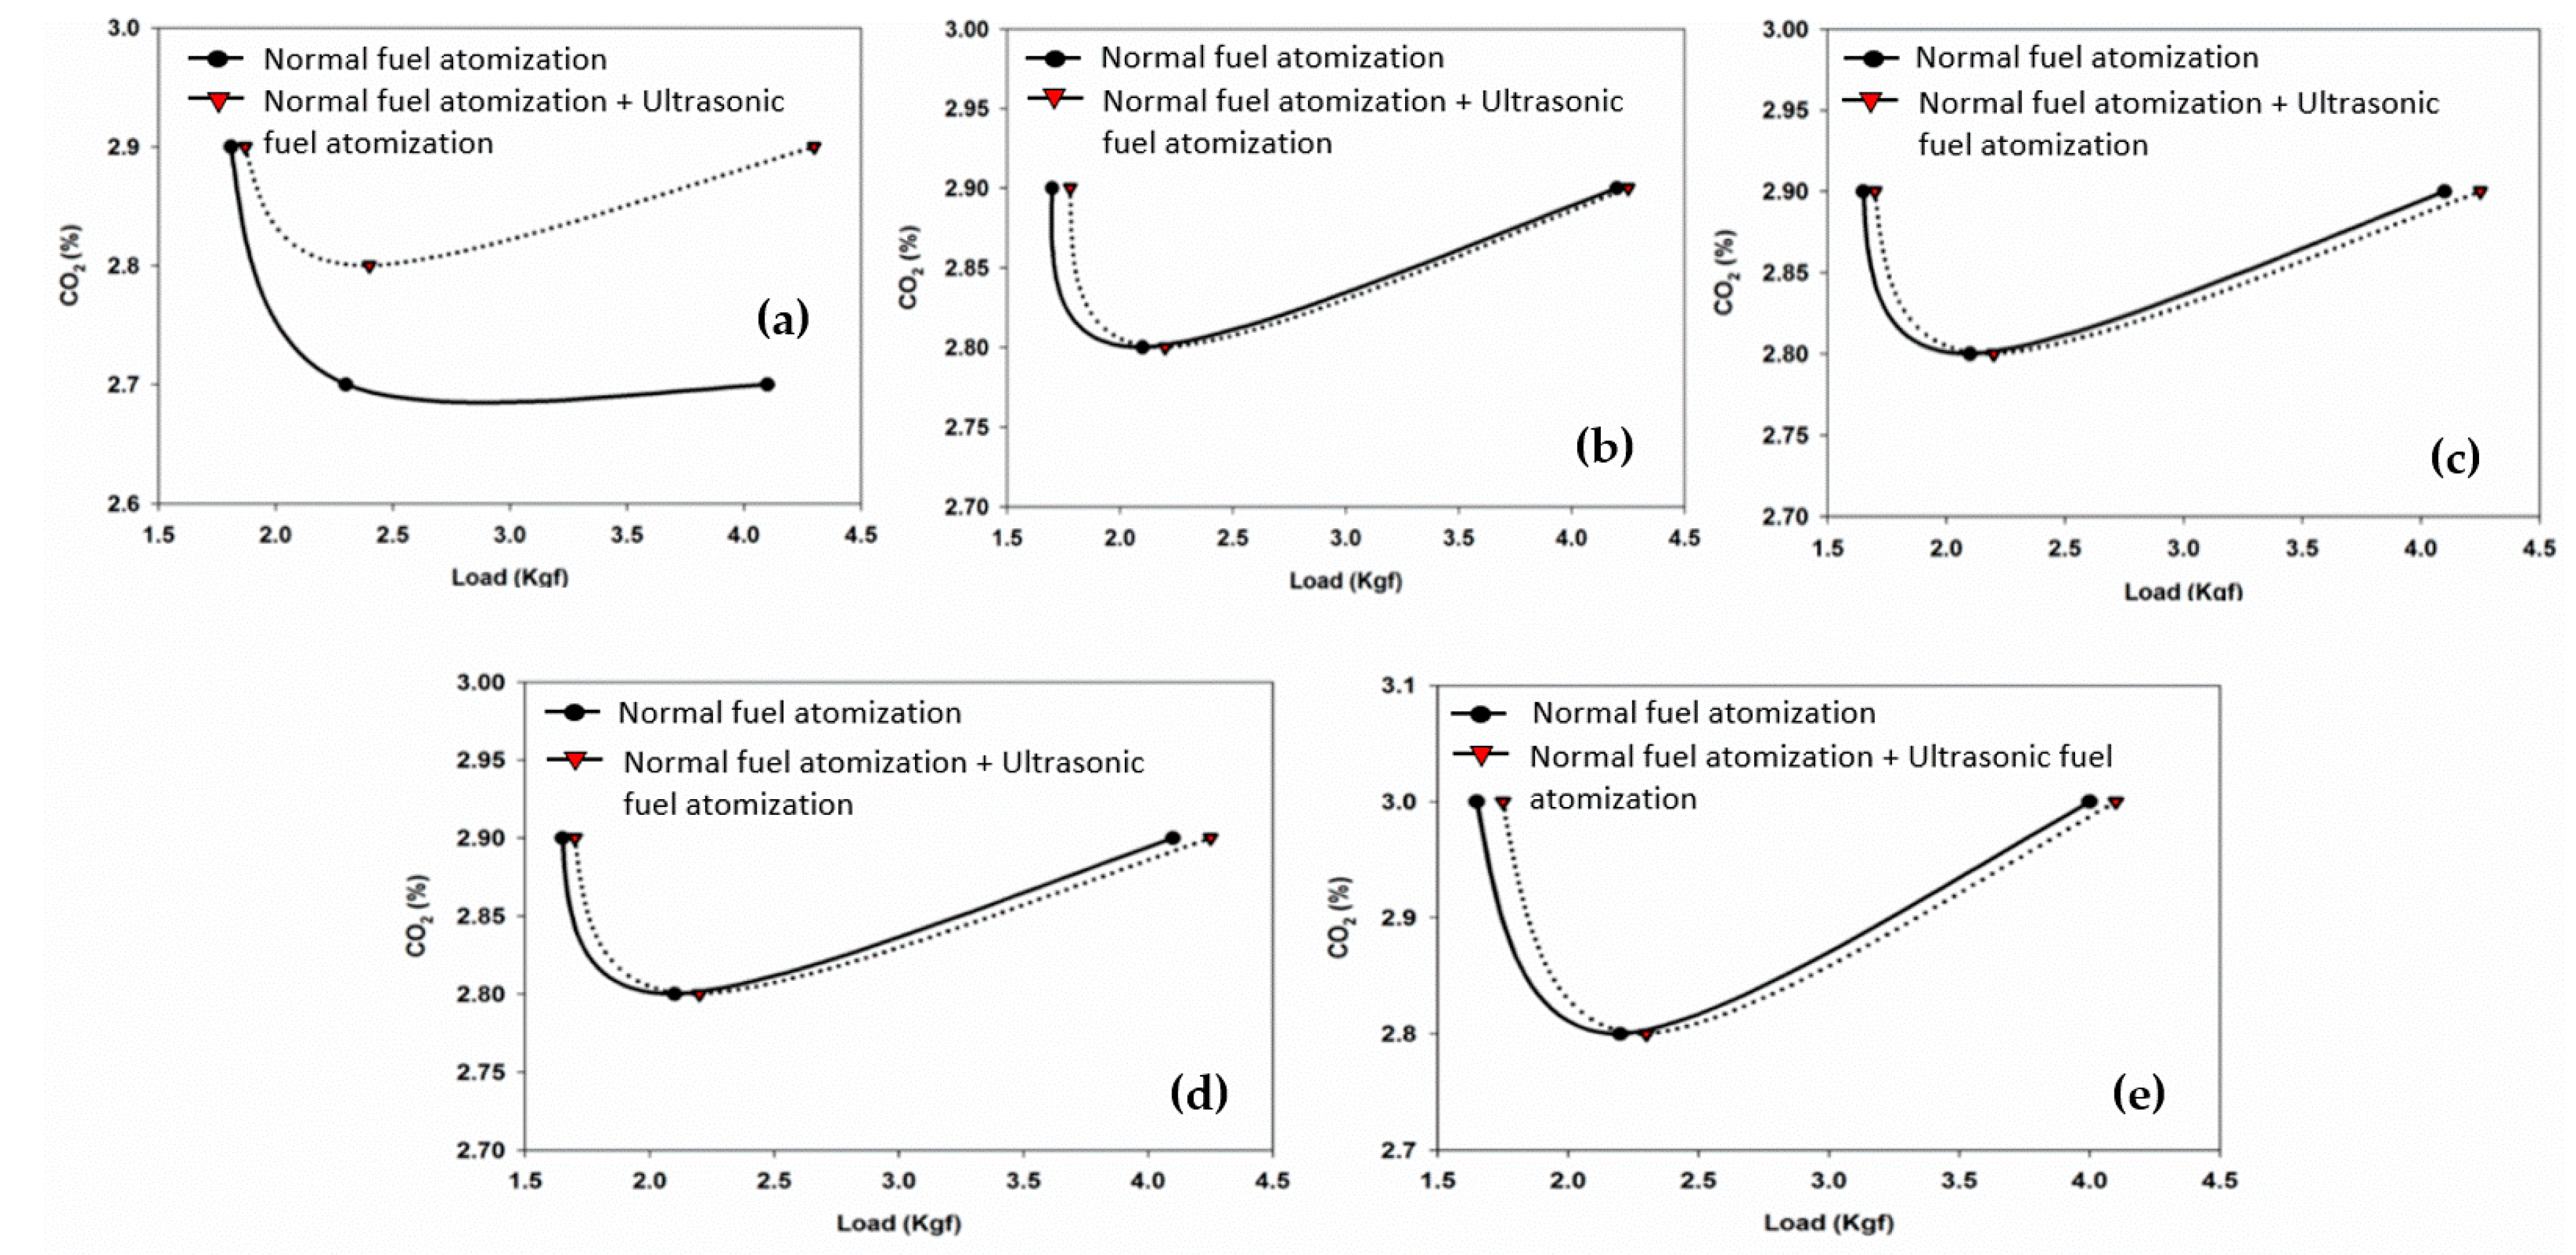
3.3.2. CO2 Emissions

In the exhaust, CO2 emission results from the complete combustion of fuel. The improvement of the combustion process led to a concentration of CO2 oppositely correlated to the trend of concentration of CO [20]. Figure 5 illustrates the variation of CO2 emissions for different fuels that have been injected by ultrasonic and normal processes. Similar to the results as found in CO emissions, the kerosene produced less CO2 emissions as compared to biodiesel fuels under both the ultrasonic and normal fuel atomization conditions. This can be explained due to the complete combustion that occurs because of the high oxygenation characteristic of biodiesel fuels. CO2 emissions increased as the kerosene content was reduced in biodiesel fuels in all processes. Gumus et al. [18] stated that the increase in oxygen content of biodiesel leads to improving the combustion quality. Therefore, pure biodiesel fuel has demonstrated the highest value of CO2 emissions as compared to other biodiesel fuels. This is the opposite of the CO emission trend, apart from in kerosene fuel. The ultrasonic atomization process using biodiesel produced greater emissions of CO2 compared to the normal atomization process. With engine loads ranging between 1.7 and 2.3. kgf, the CO2 emissions for the normal atomization process increased relative to the ultrasonic process. A similar explanation mentioned in relation to CO emissions is that with the reduced droplet size of the biodiesel fuels using the ultrasonic process, the time needed to complete combustion at a higher load was shortened. Thus, CO2 emissions for the biodiesel fuels was reduced at higher engine load for the ultrasonic atomization process compared to the normal process.

3.3.3. NO Emissions

Normally, oxygen and nitrogen produce NOx at increased temperatures during the combustion process. Nitric oxide (NO) and nitrogen dioxide (NO2) generally contain the oxides of nitrogen in exhaust emissions. The formation of NO depends on high temperatures inside the cylinder, focused oxygen and residence time for the reaction to occur [21]. Figure 6 indicates the difference in the NO emissions for several fuel types injected through the ultrasonic and normal atomization processes. Opposite to CO and CO2 emissions, NO emissions for kerosene fuel were high under both the ultrasonic and normal atomization conditions. This is because of the rescue of the decline in radiated heat transfer owing to reduced soot formation, sharper ignition delay and higher heat-release rate. Therefore, kerosene has higher NO emission values than biodiesel fuels for both the ultrasonic and normal fuel atomization conditions. The ultrasonic atomization process found biodiesel fuels produce less NO emissions, particularly in B100 that contains the lowest values across the entire engine load. For the kerosene, the NO emissions were lower than those associated with the normal process at 1.7 kgf. The NO emissions increased relative to the normal process for the ultrasonic atomization process.

3.3.4. NO2 Emissions

The variation of the NO2 emissions values for kerosene and biodiesel fuels injected through the ultrasonic and normal atomization processes is depicted in Figure 7. The NO2 emissions for kerosene under both the ultrasonic and normal fuel atomization conditions were less than the values found in biodiesel fuels. Thus, the reduction of kerosene mixture in biodiesel fuels increased NO2 emissions. It can be noted that the ultrasonic atomization process produced the highest NO2 emissions compared to the normal process. As the droplet dimensions decreased in fuel during the ultrasonic atomization process, the time needed for combustion shortened, and higher heat generation occurred relative to the normal process. Therefore, NO2 emissions were lower for the normal atomization process across the whole engine load for the various fuels than the NO2 emission generated by using the ultrasonic process. Similar observations were reported concerning nitrogen formation relying on high temperatures and reaction [18].

4. Conclusions

This study endeavored to enhance the fuel-atomization process in gas turbines through the implementation of ultrasonic wave technology as a promising alternative to the normal fuel atomization system. Different fuel types (kerosene, B20, B50, B75 and B100) were used to evaluate the performance, emissions measurements and combustion analyses of a micro jet engine under ultrasonic fuel atomization and normal fuel atomization. The properties of the kerosene and biodiesel blends, such as kinematic viscosity, density, cloud point, pour point, flash point, total acid number, sulfur content and water content met the required ASTM standards. Owing to the blending of the biodiesel fuels with kerosene fuel, the key properties, such as kinematic viscosity, density, cloud point, pour point and flash point were remarkably improved. Engine performance results showed that the ultrasonic atomization process was effective in achieving better air-flow rate and fuel-flow rate results as compared with the normal process. For emission measurements, the results of almost all fuel types for CO and NO2 emissions were lower for the normal fuel-atomization process than the ultrasonic process. For CO2 emissions, the normal fuel-atomization process demonstrated a higher amount near the 2.3 kgf engine-load mark relative to the ultrasonic process. For NO emissions, the normal fuel atomization process showed a higher value at the more than 1.7 kgf engine-load mark relative to the ultrasonic process. Combustion analysis findings exhibited that the ultrasonic atomization process was effective in obtaining a better combustion temperature and pressure than with the normal process. At the same time, at approximately a similar value, the engine load produced by the micro jet engine was much greater for the ultrasonic fuel-atomization process than the normal process.

Author Contributions

Conceptualization, A.A. (Amer Alajmi); methodology; validation, A.A. (Ahmed Alrashidi); investigation, F.A. and N.A.; resources, writing—original draft preparation, A.A. (Amer Alajmi); writing—review and editing, N.M.A. All authors have read and agreed to the published version of the manuscript.

Funding

This research received no external funding.

Data Availability Statement

The data presented in this study are openly available in request.

Acknowledgments

The authors gratefully appreciate the Public Authority for Applied Education and Training, Kuwait and Universiti Putra Malaysia (UPM) for providing places and facilitates to complete this project.

Conflicts of Interest

The authors declare no conflict of interest.

References

  1. Abbasi, M.; Chahartaghi, M.; Hashemian, S.M. Energy, exergy, and economic evaluations of a CCHP system by using the internal combustion engines and gas turbine as prime movers. Energy Convers. Manag. 2018, 173, 359–374. [Google Scholar] [CrossRef]
  2. Máša, V.; Bobák, P.; Vondra, M. Potential of gas microturbines for integration in commercial laundries. Oper. Res. Int. J. 2017, 17, 849–866. [Google Scholar] [CrossRef]
  3. Badeer, G.H. GE Aeroderivative Gas Turbines—Design and Operating Features. GE Power Syst. 2000, GER-3695E, 1–20. [Google Scholar]
  4. Habib, Z.; Parthasarathy, R.; Gollahalli, S. Performance and emission characteristics of biofuel in a small-scale gas turbine engine. Appl. Energy 2010, 87, 1701–1709. [Google Scholar] [CrossRef]
  5. Tanbay, T.; Durmayaz, A. Exergy-based ecological optimisation of a turbofan engine. Int. J. Exergy 2015, 16, 358–381. [Google Scholar] [CrossRef]
  6. Domen, S.; Gotoda, H.; Kuriyama, T.; Okuno, Y.; Tachibana, S. Detection and prevention of blowout in a lean premixed gas turbine model combustor using the concept of dynamical system theory. Proc. Combust. Inst. 2015, 35, 3245–3253. [Google Scholar] [CrossRef] [Green Version]
  7. Jiang, G.; Zhang, Y.; Wen, H.; Xiao, G. Study of the generated density of cavitation inside diesel nozzle using different fuels and nozzles. Energy Convers. Manag. 2015, 103, 208–217. [Google Scholar] [CrossRef]
  8. Zahmatkesh, I.; Emdad, H.; Alishahi, M.M. Navier-Stokes computation of some gas mixture problemsin the slip flow regime. Sci. Iran. 2015, 22, 187–195. [Google Scholar]
  9. Roudini, M.; Wozniak, G. Experimental investigation of spray characteristics of pre-filming air-blast atomizers. J. Appl. Fluid Mech. 2018, 11, 1455–1469. [Google Scholar] [CrossRef]
  10. Khan, M.A.; Katoch, A.; Gadgil, H.; Kumar, S. First step towards atomization at ultra-low flow rates using conventional twin-fluid atomizer. Exp. Therm. Fluid Sci. 2019, 109, 109844. [Google Scholar] [CrossRef]
  11. Gemci, T.; Chigier, N. Production, Handling and Characterization of Particulate Materials; Merkus, H.G., Meesters, G.M.H., Eds.; Springer International Publishing: Cham, Switzerland, 2016; Volume 25, pp. 257–289. [Google Scholar]
  12. Ma, R.; Dong, B.; Yu, Z.; Zhang, T.; Wang, Y.; Li, W. An experimental study on the spray characteristics of the air-blast atomizer. Appl. Therm. Eng. 2014, 88, 149–156. [Google Scholar] [CrossRef]
  13. Chong, C.T.; Hochgreb, S. Flame structure, spectroscopy and emissions quantification of rapeseed biodiesel under model gas turbine conditions. Appl. Energy 2015, 185, 1383–1392. [Google Scholar] [CrossRef] [Green Version]
  14. Senda, J.; Wada, Y.; Kawano, D.; Fujimoto, H. Improvement of combustion and emissions in diesel engines by means of enhanced mixture formation based on flash boiling of mixed fuel. Int. J. Engine Res. 2008, 9, 15–27. [Google Scholar] [CrossRef]
  15. Lefebvre, A.H.; McDonell, V.G. Atomization and Sprays; CRC Press: Boca Raton, FL, USA, 2017. [Google Scholar]
  16. Park, S.H.; Cha, J.; Lee, C.S. Spray and engine performance characteristics of biodiesel and its blends with diesel and ethanol fuels. Combust. Sci. Technol. 2011, 183, 802–822. [Google Scholar] [CrossRef]
  17. Alajmi, F.; Alajmi, A.; Alrashidi, A.; Alrashidi, N.; Adam, N.M.; Hairuddin, A.A. Development of Solar Powered Biodiesel Reactor for Kuwait Sheep Tallow. Processes 2021, 9, 1623. [Google Scholar] [CrossRef]
  18. Gumus, M.; Sayin, C.; Canakci, M. The impact of fuel injection pressure on the exhaust emissions of a direct injection diesel engine fueled with biodiesel–diesel fuel blends. Fuel 2012, 95, 486–494. [Google Scholar] [CrossRef]
  19. Enweremadu, C.C.; Rutto, H.L. Combustion, emission and engine performance characteristics of used cooking oil biodiesel—A review. Renew. Sustain. Energy Rev. 2010, 14, 2863–2873. [Google Scholar] [CrossRef]
  20. Gumus, M. A comprehensive experimental investigation of combustion and heat release characteristics of a biodiesel (hazelnut kernel oil methyl ester) fueled direct injection compression ignition engine. Fuel 2010, 89, 2802–2814. [Google Scholar] [CrossRef]
  21. Palash, S.M.; Masjuki, H.H.; Kalam, M.A.; Atabani, A.E.; Fattah, I.R.; Sanjid, A. Biodiesel production, characterization, diesel engine performance, and emission characteristics of methyl esters from Aphanamixis polystachya oil of Bangladesh. Energy Convers. Manag. 2015, 91, 149–157. [Google Scholar] [CrossRef] [Green Version]
Figure 1. The block diagram of designed engine test bed.
Processes 09 01963 g001
Figure 2. (a) Combustion chamber top view (cane type) and (b) electric igniter.
Processes 09 01963 g002
Figure 3. (a) Block diagram for ultrasonic atomization technique and (b) ultrasonic tank constructed with the system.
Processes 09 01963 g003
Figure 4. Plots of CO emissions against the engine load for all the different fuel types: (a) kerosene, (b) B20, (c) B50, (d) B75 and (e) B100.
Processes 09 01963 g004
Figure 5. Plots of CO2 emission against the engine load for all the different fuel types: (a) kerosene, (b) B20, (c) B50, (d) B75 and (e) B100.
Processes 09 01963 g005
Figure 6. Plots of NO emissions against the engine load for all the different fuel types: (a) kerosene, (b) B20, (c) B50, (d) B75 and (e) B100.
Processes 09 01963 g006
Figure 7. Plots of NO emissions against the engine load for all the different fuel types: (a) kerosene, (b) B20, (c) B50, (d) B75 and (e) B100.
Processes 09 01963 g007
Table 1. Specification and values of ultrasonic device.
SpecificationsValues
VoltageInput, AC 220 V; output, DC 48 V
Power250 W.L
Current5 A
Capacity4.5 kg/h
Frequency1.7 MHz
Operating temperature5 °C to 50 °C
Table 2. Properties of the diesel, kerosene and biodiesel blends.
PropertiesStandardsUnitsDieselKeroseneB20B50B75B100
Kinematic Viscosity @ 40 °CASTM D 445cSt3.58191.21441.58322.16772.16774.339
Density @ 25 °CASTMD4052g/cm30.83390.78220.80060.82190.85760.8649
Cloud pointASTMD5773°C0−53.8−3.56.56.911.2
Pour pointASTMD5949°C0−54−120615
Flash pointASTM D 93°C9047Insufficient sample896297
Total acid numberASTM D 664mgKOH/gm0.01100.01240.03210.05700.17780.1035
Sulfur contentASTMD5453mg/L620.1792.1773.9855.0230.079.06
Water contentASTMD6304ppm83.2887.48251.1419.41340790.2
Table 3. Results of air-flow rate against the engine load for all the different fuel types: (a) kerosene, (b) B20, (c) B50, (d) B75 and (e) B100.
MethodLoadFuel Types, L/s
KeroseneB20B50B75B100
Normal fuel atomizationLow260.00 ± 1.55260.10 ± 1.55260.10 ± 1.55260.10 ± 1.55260.10 ± 1.55
Medium397.80 ± 0.75397.80 ± 0.70397.80 ± 0.70397.80 ± 0.70397.80 ± 0.70
High515.10 ± 1.00515.10 ± 1.00515.10 ± 1.00515.10 ± 1.00515.10 ± 1.00
Normal fuel atomization + ultrasonic fuel atomizationLow263.20 ± 1.55263.20 ± 1.55263.20 ± 1.55263.20 ± 1.55263.20 ± 1.55
Medium399.30 ± 0.75399.10 ± 0.70399.10 ± 0.70399.10 ± 0.70399.30 ± 0.70
High517.40 ± 1.00517.40 ± 1.00517.40 ± 1.00517.40 ± 1.00517.40 ± 1.00
Table 4. Results of fuel flow rate against the engine load for all the different fuel types: (a) kerosene, (b) B20, (c) B50, (d) B75 and (e) B100.
MethodLoadFuel Types, mL/min at 8 Bar
KeroseneB20B50B75B100
Normal fuel atomizationLow360.00 ± 0.92360.00 ± 0.92360.00 ± 0.92360.00 ± 0.92360.00 ± 0.92
Medium460.00 ± 1.22460.00 ± 1.22460.00 ± 1.22460.00 ± 1.22460.00 ± 1.22
High565.00 ± 1.60565.00 ± 1.60565.00 ± 1.60565.00 ± 1.60565.00 ± 1.60
Normal fuel atomization + ultrasonic fuel atomizationLow360.00 ± 0.92360.00 ± 0.92360.00 ± 0.92360.00 ± 0.92360.00 ± 0.92
Medium460.00 ± 1.22460.00 ± 1.22460.00 ± 1.22460.00 ± 1.22460.00 ± 1.22
High565.00 ± 1.60565.00 ± 1.60565.00 ± 1.60565.00 ± 1.60565.00 ± 1.60
Publisher’s Note: MDPI stays neutral with regard to jurisdictional claims in published maps and institutional affiliations.

