Article

Numerical Modelling and Multi Objective Optimization Analysis of Heavy Vehicle Chassis

Department of Mechanical Engineering, University of South Africa, Science Campus, Private Bag X6, Florida 1710, South Africa
*
Author to whom correspondence should be addressed.
Processes 2021, 9(11), 2028; https://doi.org/10.3390/pr9112028
Submission received: 20 August 2021 / Revised: 16 September 2021 / Accepted: 17 September 2021 / Published: 13 November 2021
(This article belongs to the Special Issue Big Data in Manufacturing, Biology, Healthcare and Life Sciences)

Abstract

:
The primary supporting structure of an automobile and its other vital systems is the chassis. The chassis structure is required to bear high shock, stresses, and vibration, and therefore it should possess adequate strength. The objective of current research is to analyze a heavy motor vehicle chassis using numerical and experimental methods. The CAD design and FE analysis is conducted using the ANSYS software. The design of the chassis is then optimized using Taguchi design of Experiments (DOE); the optimization techniques used are the central composite design (CCD) scheme and optimal space filling (OSF) design. Thereafter, sensitivity plots and response surface plots are generated. These plots allow us to determine the critical range of optimized chassis geometry values. The optimization results obtained from the CCD design scheme show that cross member 1 has a higher effect on the equivalent stresses as compared to cross members 2 and 3. The chassis mass reduction obtained from the CCD scheme is approximately 5.3%. The optimization results obtained from the OSF scheme shows that cross member 2 has a higher effect on equivalent stress as compared to cross members 1 and 3. The chassis mass reduction obtained from optimal space filling design scheme is approximately 4.35%.

1. Introduction

The two important parts of a vehicle body are the chassis and bodywork, which constitute the maximum volume and weight. The chassis structure is comprised of longitudinal and lateral members placed at critical stress concentration regions [1]. All the components and loads of the vehicle are supported by the chassis. Such loads include the weight of the components and loads due to motion of vehicle (acceleration and retardation and cornering). Vehicle chassis should be rigid enough to absorb the shocks, twists, vibrations, and other stresses experienced by a vehicle when in operation. The critical considerations for a good chassis design is its ability to resist bending, to have torsional stiffness and strength for good handling characteristics [2,3].
Commercial vehicle chassis are designed to bear heavy payloads and are meant to provide durability and versatility. The design of the chassis should be based on various load considerations (payload), laden weight and dynamic loading conditions as mentioned above. The fatigue loads acting on the chassis (caused by road conditions and engine weight) also affect its life and durability and thereby its necessary to analysis chassis under fatigue loading conditions [4]. The three major types of chassis used in the automobile industry are spaceframe chassis, ladder frame chassis and Monocoque chassis [5]. That said, heavy-duty trucks (e.g., the TATA1612) employ ladder frame type chassis shown in Figure 1 [6].
The structure is comprised of longitudinal and transverse members arranged systematically in the given ladder form. The longitudinal and transverse members are made of channeled sections (C shape or square shape).
In last two decades, the advancement in safety features has steadily increased the weight of the chassis [7]. By using advanced optimization techniques, significant improvements in the design of chassis could be achieved in the early design stage [8,9]. Many researchers like Chiandussi et al. [10], Pedersen [11], and Duddeck [12] have worked in optimizing the design of vehicle suspensions and other body parts, which aided in reducing the weight of the vehicle. The FEA analysis conducted on heavy vehicle chassis has shown the zones of high stresses that are induced by the applied heavy loads when vehicles are in operation. The self-weight of chassis frames also adds to the stresses [13]. Thus, the vehicle chassis design should also include self-weight considerations [14].
Yang and Chahande [15] have conducted a space frame analysis using NASTRAN FEA simulation package. Kang et al. [16] have optimized the design of heavy vehicle chassis using the analytical target cascading (ATC) method. The findings have shown that the ATC method is a viable tool in improving the design of existing chassis. E.R. Deore et al. [17] conducted numerical investigations on low-loader chassis to reduce the weight and cost of chassis by optimizing the side member thickness and positional variation of cross members. Their findings show that the chassis cross member thickness has significant effects on the deformation and stresses generated on chassis.
Patel et al. [18] optimized the TATA 2516TC truck chassis by reducing the weight using the Pro Mechanica software. The research would serve as base model for further research. P. K. Sharma et al. [19] conducted FE simulation on the TATA turbo SE 1613 chassis to determine stresses and deformation under heavy loading conditions. The numerical results obtained from the simulation were in close agreement with analytical results. Rajasekar et al. [20] optimized the design of an on-road heavy vehicle using the genetic algorithm (GA) by varying dimensions of cross sections, and this resulted in a reduced weight of chassis.
Guosheng Feng [21] conducted vibrational analysis on a chassis using FEA tool. The modal and response spectrum analysis conducted on the chassis enabled them to determine the natural frequency, deformation mode shape and maximum amplitude of the chassis. Marathe and Tadamalle [22] optimized the chassis of a trolley, under heavy loading conditions, using numerical methods. It was observed that web thickness, upper flange thickness and lower flange thickness have significant effects on the equivalent stresses and the deformation of the chassis. Jay Prakash Srivastava [23] conducted FE simulation on a go-kart chassis using ANSYS 16 FEA software. Their findings show that by changing the material and design of the chassis, the safety factor can be significantly improved. S. Prabhakaran et al. [24] conducted analytical and numerical investigation on a chassis to reduce its weight. The analytical calculations were based on beam bending theory and the results obtained were validated with FE simulation results. Based on FE simulation results, the necessary modifications were made on the chassis structure, which resulted in a 6.7% weight reduction. Fernando et al. [25] worked on the optimization of a 3D vehicular structure using MATLAB® and ANSYS® software. The author looked at variables like the position of the center of gravity, the dynamic and manufacture constraints in their design criteria. A multi-objective function was defined which considered mass reduction and chassis stiffness as objectives. They were able to reduce the weight of 3D structure by 5.31 kg [25].
It has been observed that the determination of the stresses on a truck chassis before production/manufacturing is key to future design improvements as per user requirements and quality purposes. A limited number of studies have been conducted on the design and optimization of heavy commercial vehicles chassis frames. With the increase in fuel costs, the automotive industry demands lighter weighing components. The designing of components is quite a critical process. It requires optimization, which is often a trade-off between weight savings and the dynamic performance of those components.
The objective of this current research is to analyze a heavy vehicle (truck) chassis using numerical and experimental methods. We then seek to optimize this chassis by looking at a number of chassis variables. The next section describes the methodology we followed in achieving the above.

2. Methodology

The chassis is firstly designed in a CAD software. The FEA on the designed chassis is then conducted in ANSYS® software. The modelled chassis is then optimized using the Taguchi design of Experiments (D.O.E). The optimization techniques used are the central composite design (CCD) scheme and the optimal space filling (OSF) design. Sensitivity plots and response surface plots are then generated. The critical range of optimized variables is then determined. The equivalent stress, deformation, mass and surface response are evaluated for each design points. The optimization techniques used in this research have not been implemented in chassis design and could be helpful in the development of future chassis designs.
The FEA pre-processing stage CAD modeling, meshing, applying loads and boundary conditions on the model [26]. The solution stage involves element matrix formulations, assemblage of global stiffness elements, followed by inversions and multiplications. The final stage is the post-processing, which involves the interpretation of the analysis results. The chassis specifications were obtained from [27].

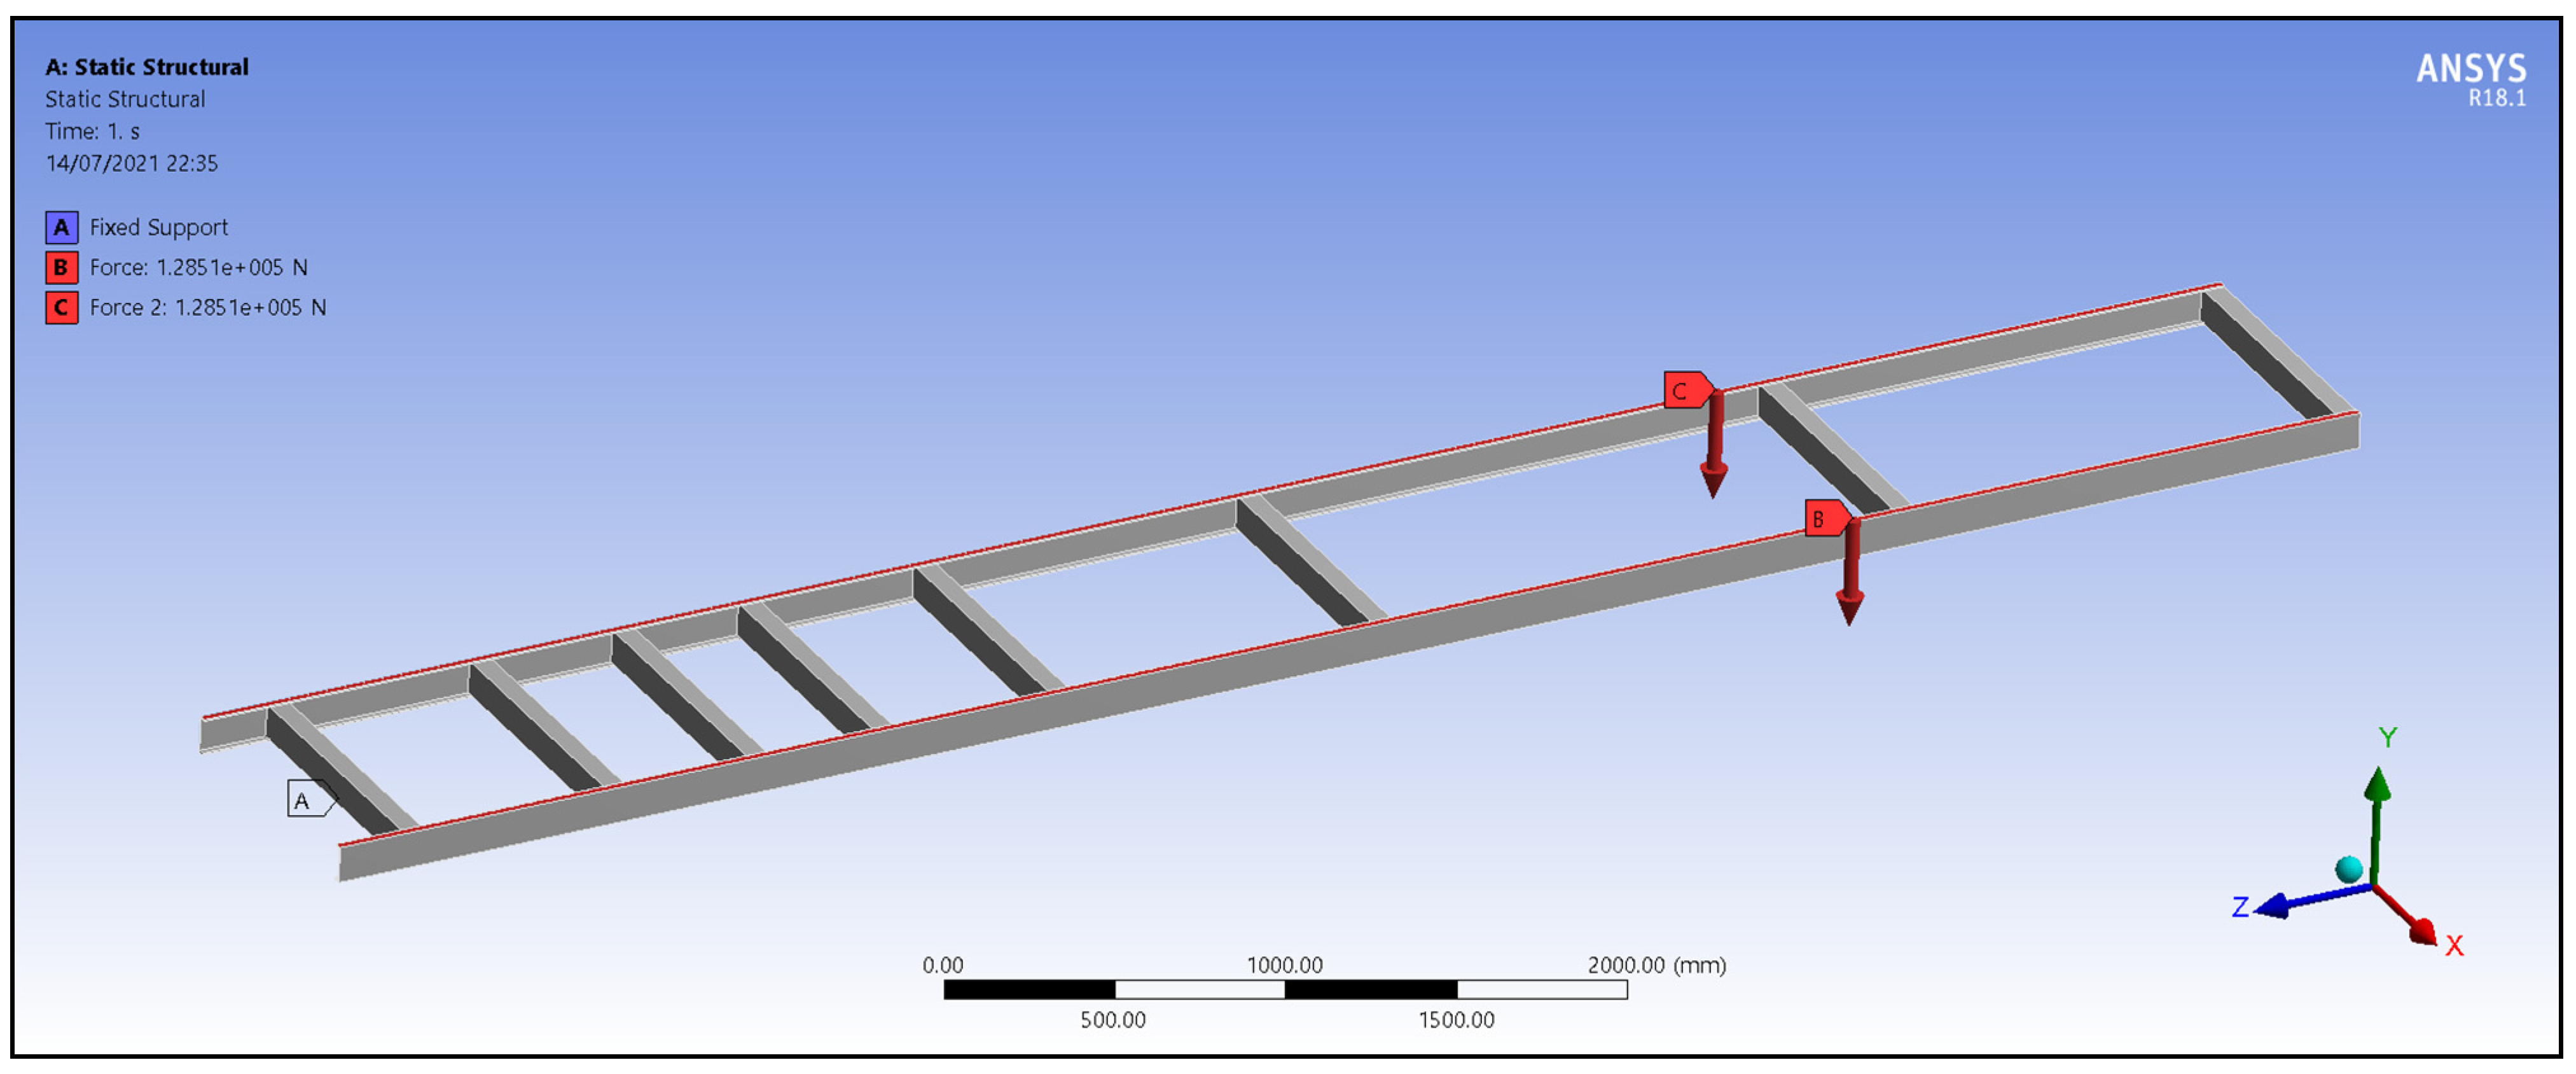
2.1. The Simulation Environment

The simulation package is ANSYS® V18.1. The interaction with the software is through graphical user interface (GUI). However, the inbuilt language of the software is C++. The chassis is analyzed as a static structure. A finite element model analysis of the chassis is then performed. We initially evaluate the chassis deformations and the stress distributions on a given standard chassis [27]. We then optimize this chassis, in terms of reducing the deformations and the stress distributions, using the Taguchi design of experiments method. The next subsection details the chassis geometry, loading, and boundary conditions.

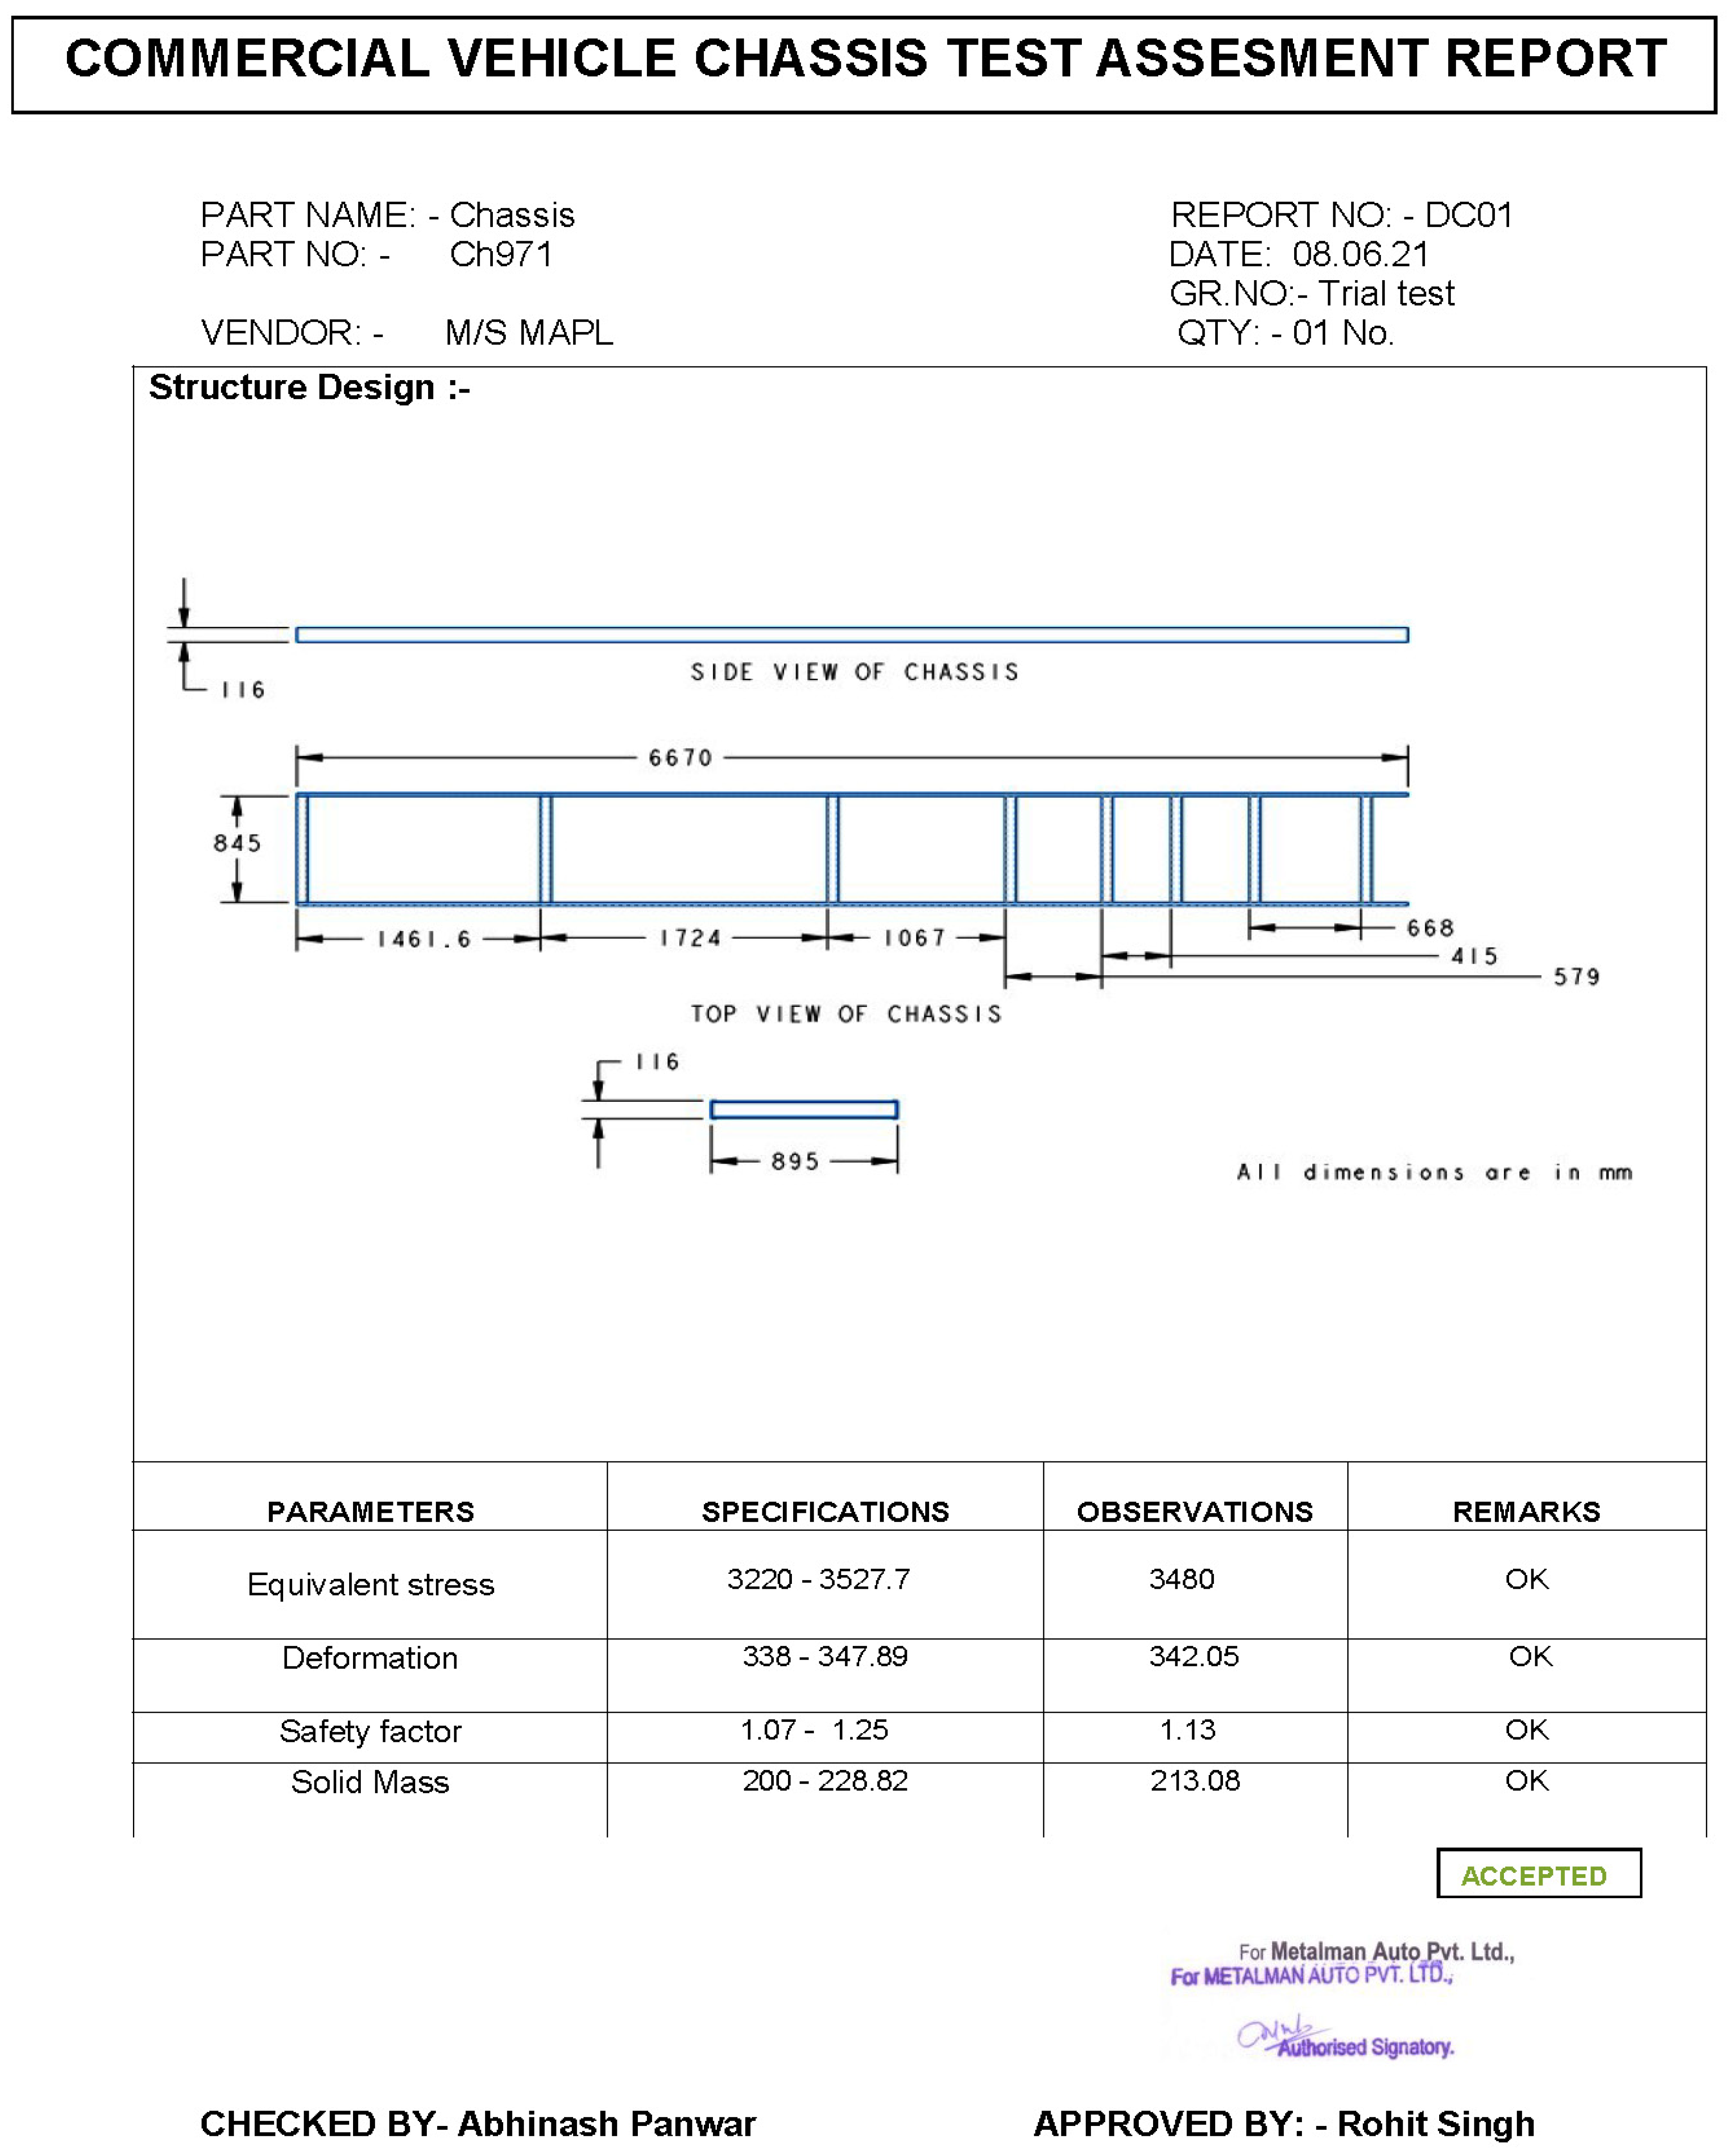
2.2. Chassis Specifications
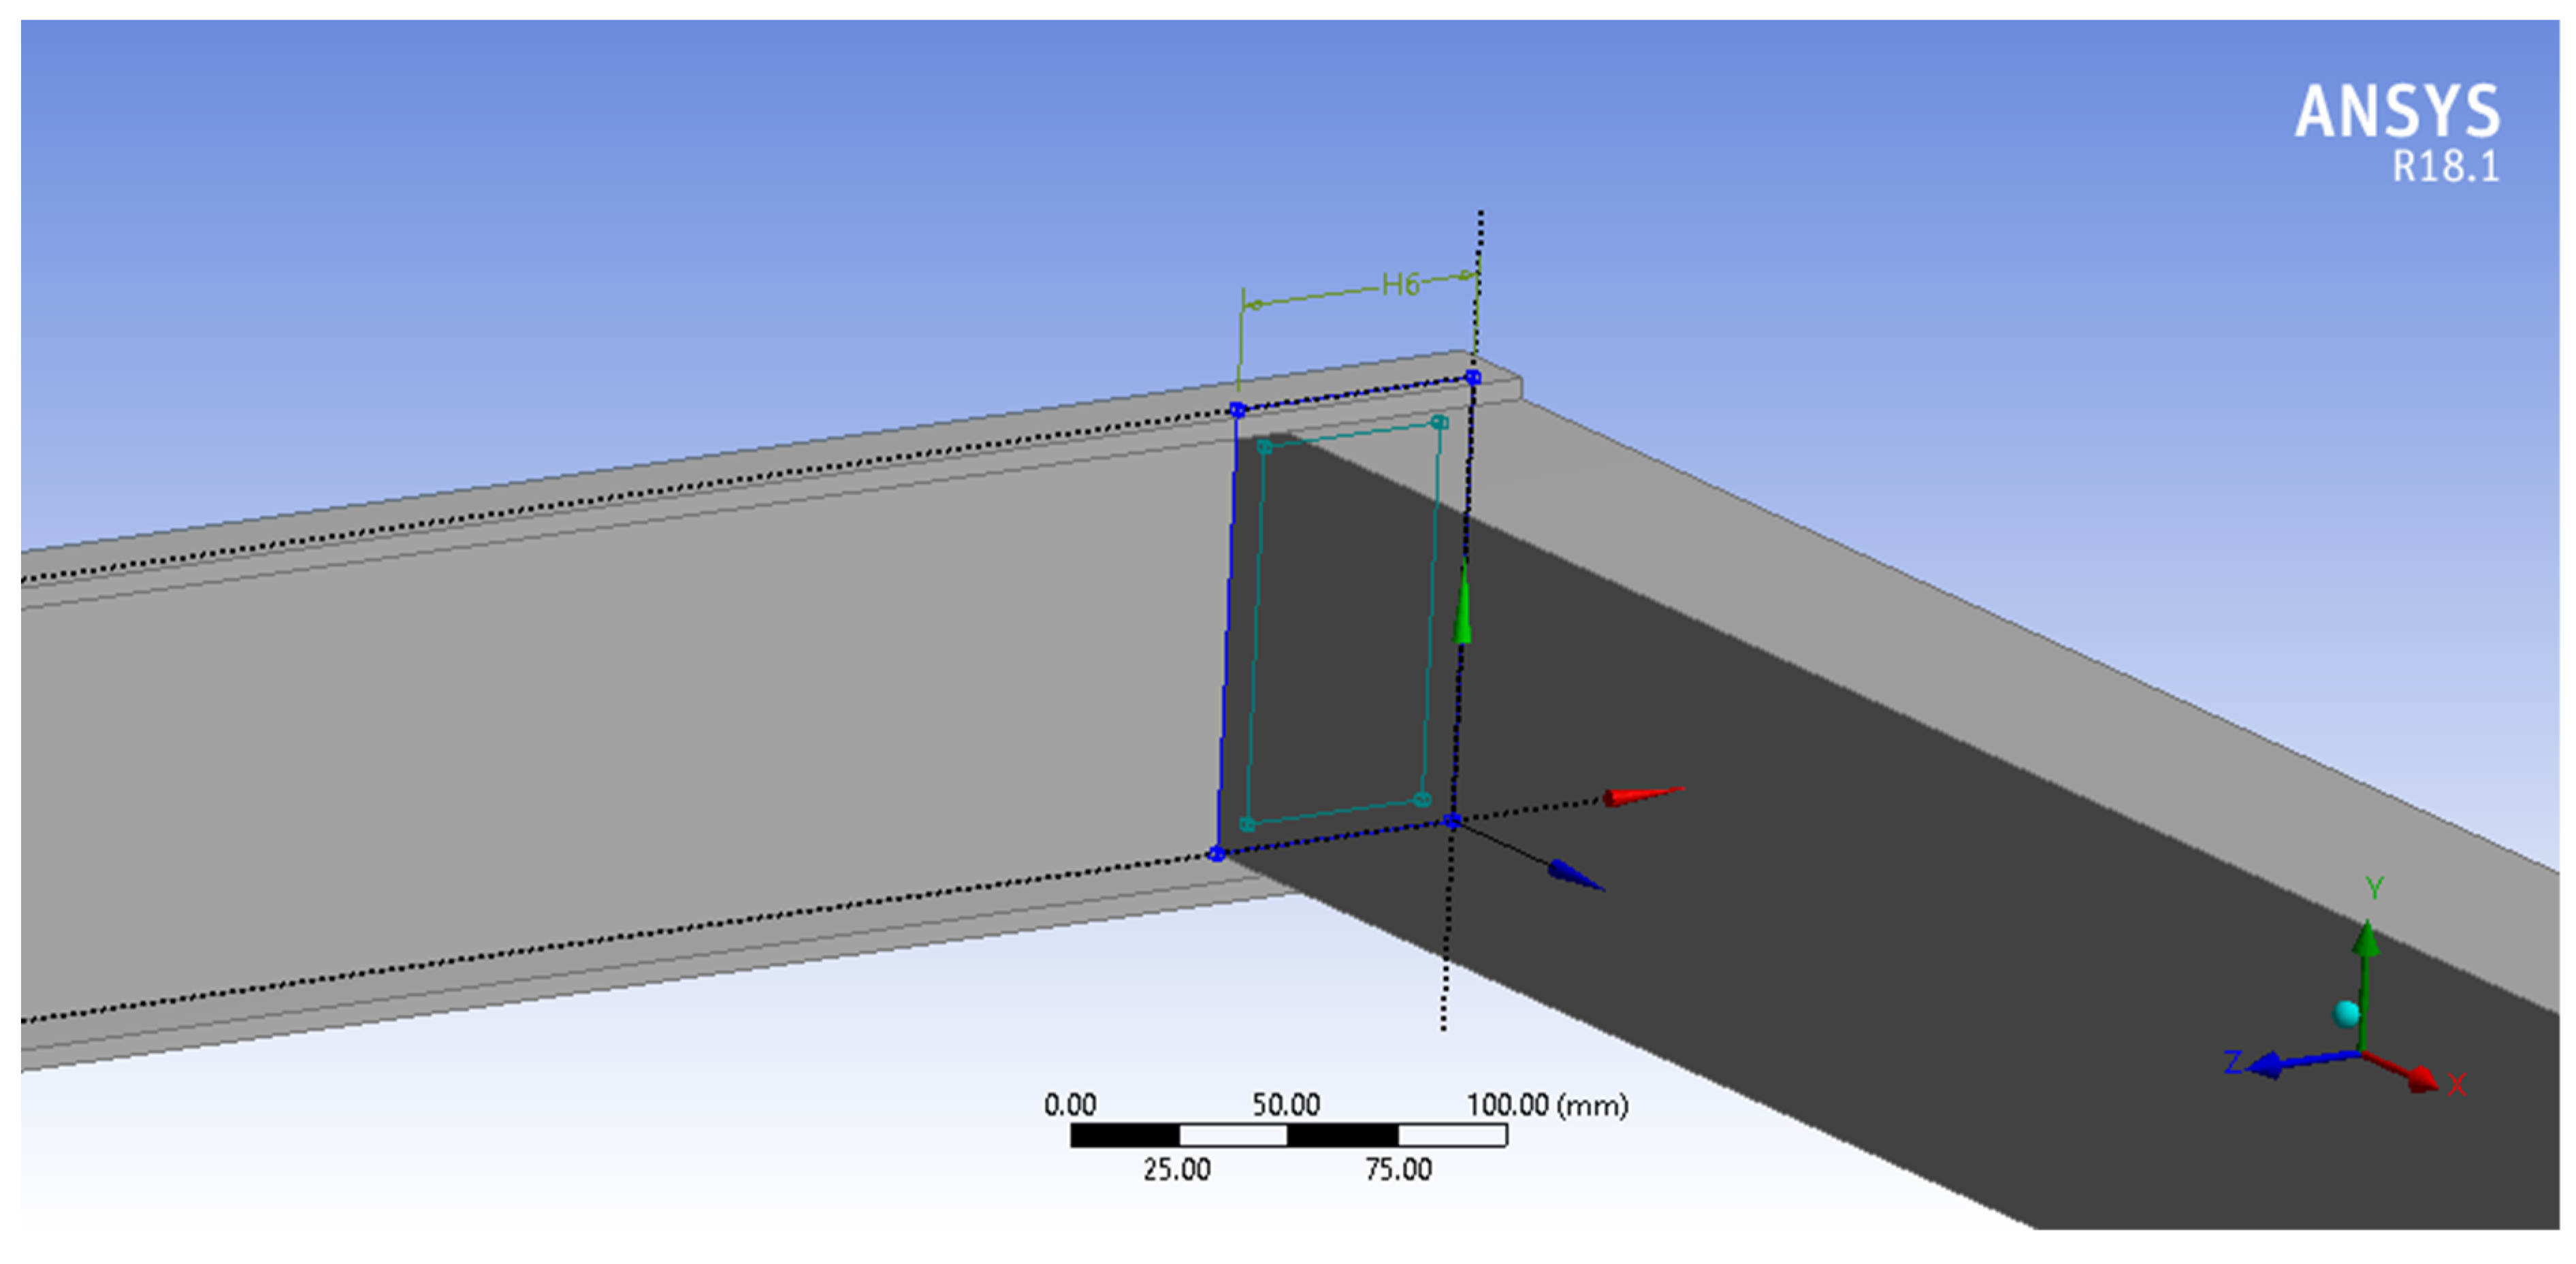
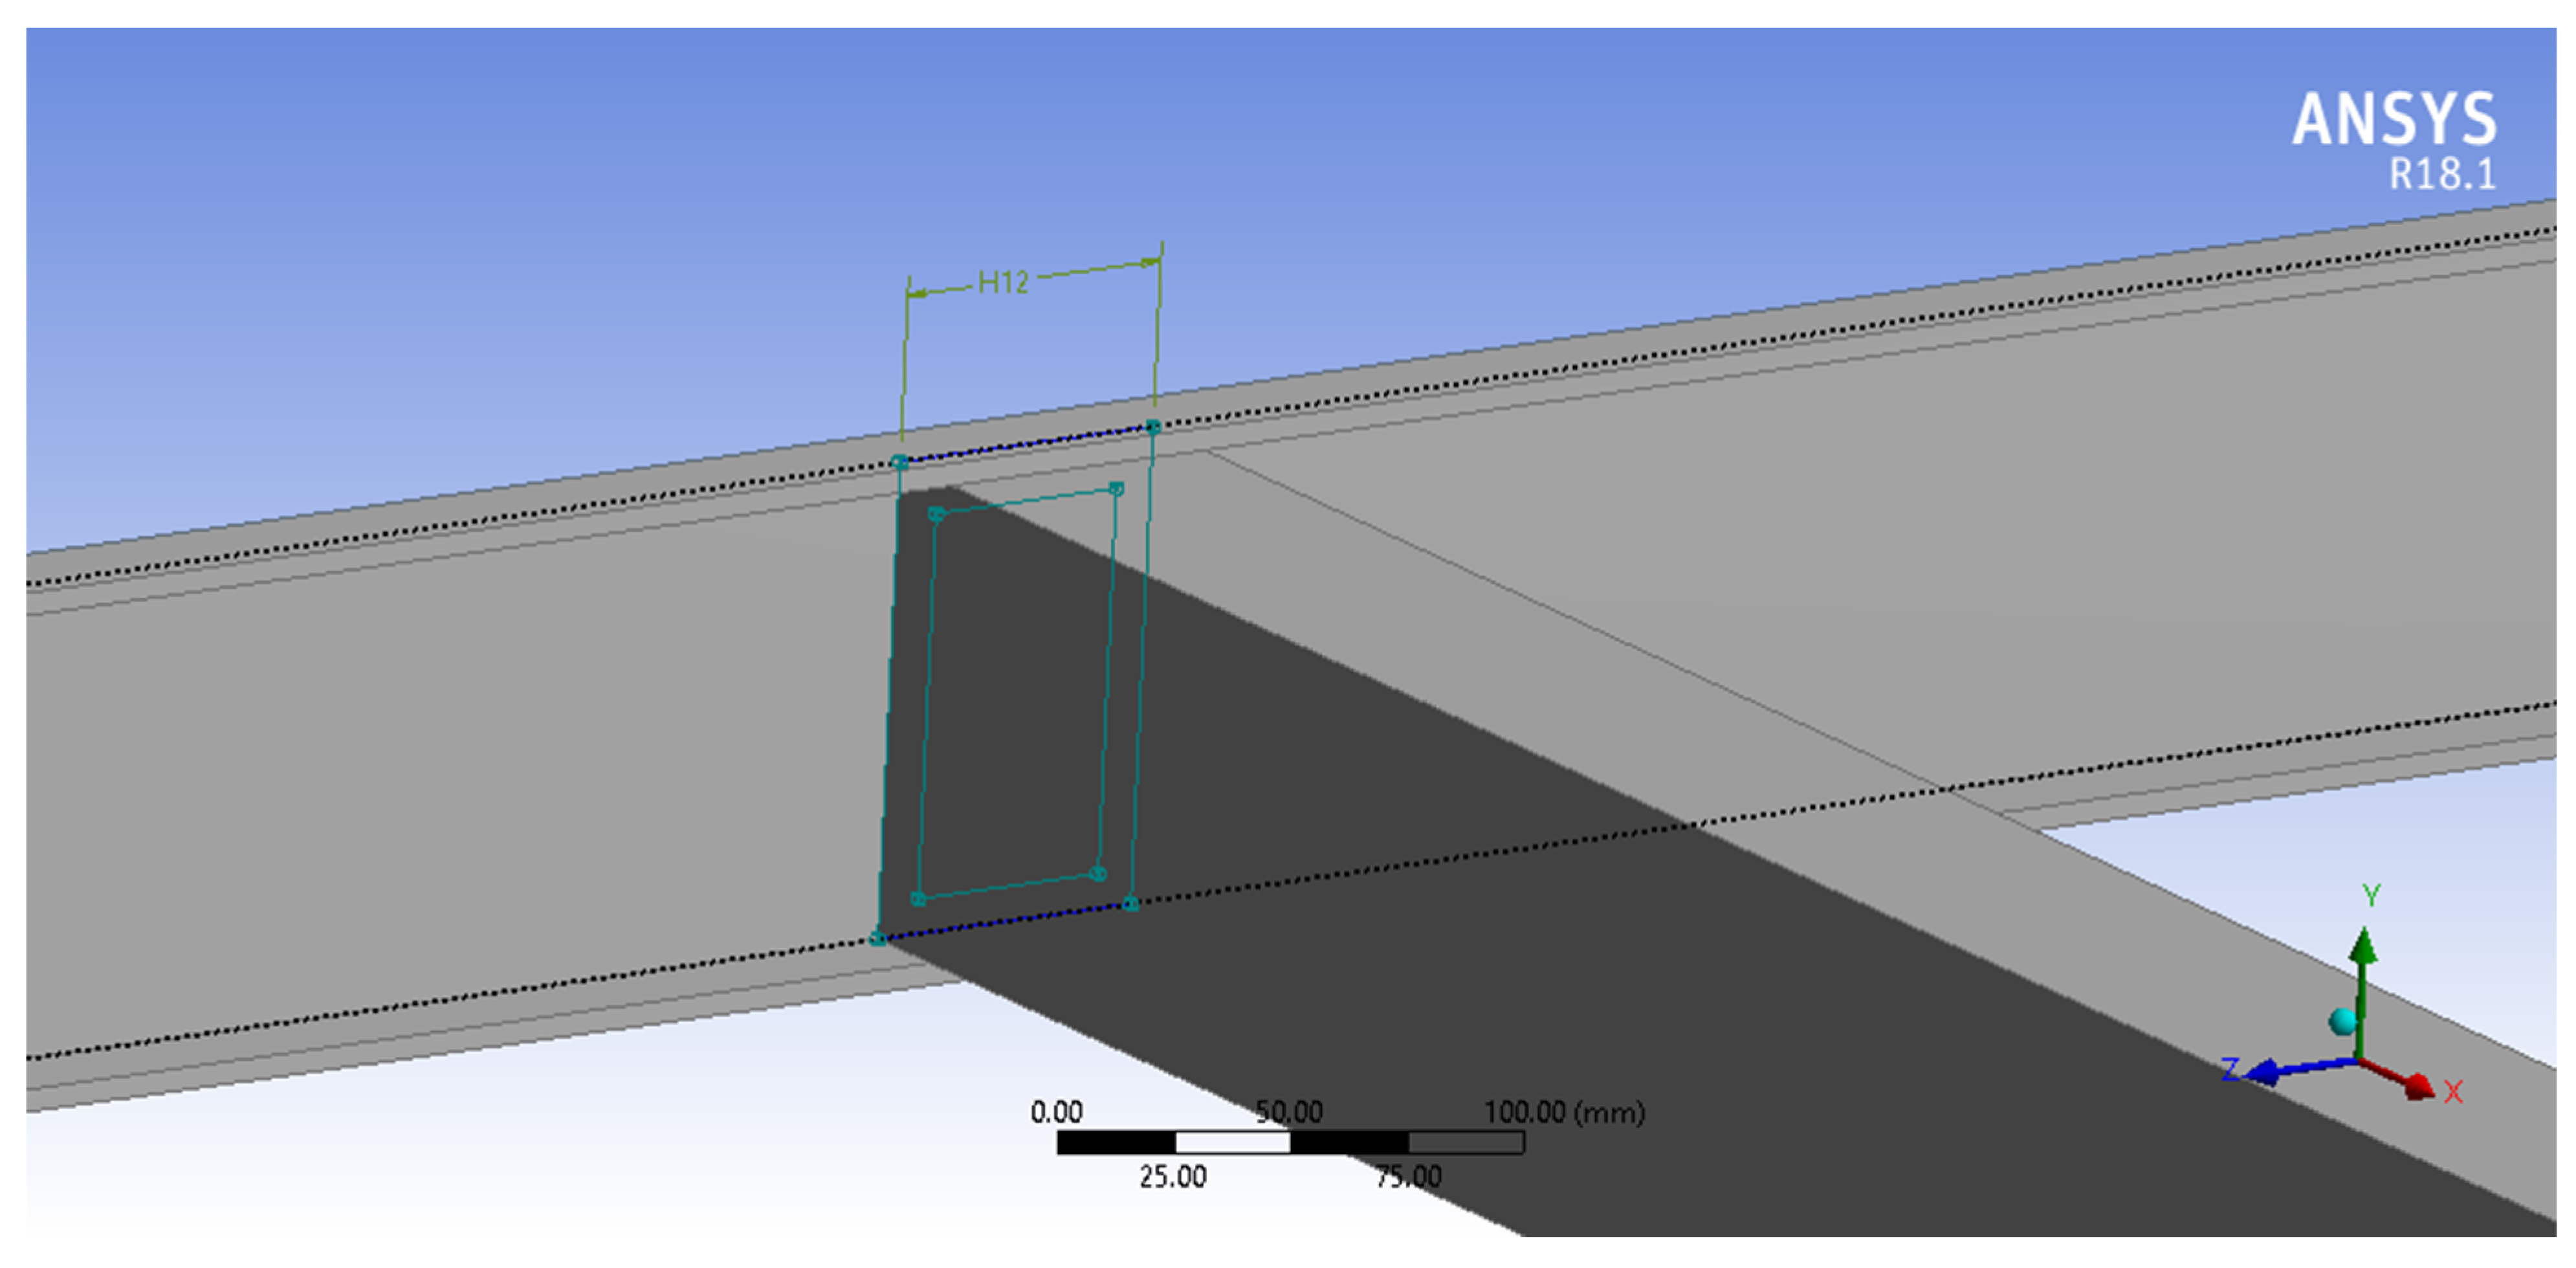
The CAD model of the chassis is developed as per the specification tabulated Table 1:

2.3. CAD Modelling

The CAD model of HMV (Heavy Motor Vehicle) chassis is developed in ANSYS® design modeler using the sketch and extrude tool. The dimensions of chassis are taken from literature as per Table 1 [27]. Two longitudinal members and eight lateral members are modeled as shown in Figure 2.
The right hand side of the chassis in Figure 2 is the vehicle frontal portion. The model of chassis is discretized using tetrahedral elements as shown in Figure 3. The number of maximum layers is set to 5, the transition is set to smooth and inflation set to normal. The number of elements generated is 20,080 and number of nodes generated is 42,840. The tetrahedral element has 4 nodes with 3 degrees of freedom at each node. The final meshed model of HMV chassis in shown by Figure 4.
The loads and boundary conditions applied on the chassis structure are as shown in Figure 5 and Figure 6 below. The supports are applied on first (front) and last transverse members. The wheels, axles and suspensions are mounted on these transverse members. The downward force of 128,511 N is applied on each longitudinal member of the chassis. The applied load values are taken from [27] based on analytical calculations.
After defining the loads and boundary conditions, the simulation is run using a sparse matrix solver. This is done as it can also reuse the same matrix structure throughout the simulation and avoids the sequential step that orders equations at every iteration [28]. The matrices are formulated for each element. The deformation and stresses are calculated at nodes, and these results interpolated for the entire element edge length. The next section presents the results of the finite element simulations on the standard chassis.

3. Results and Discussion

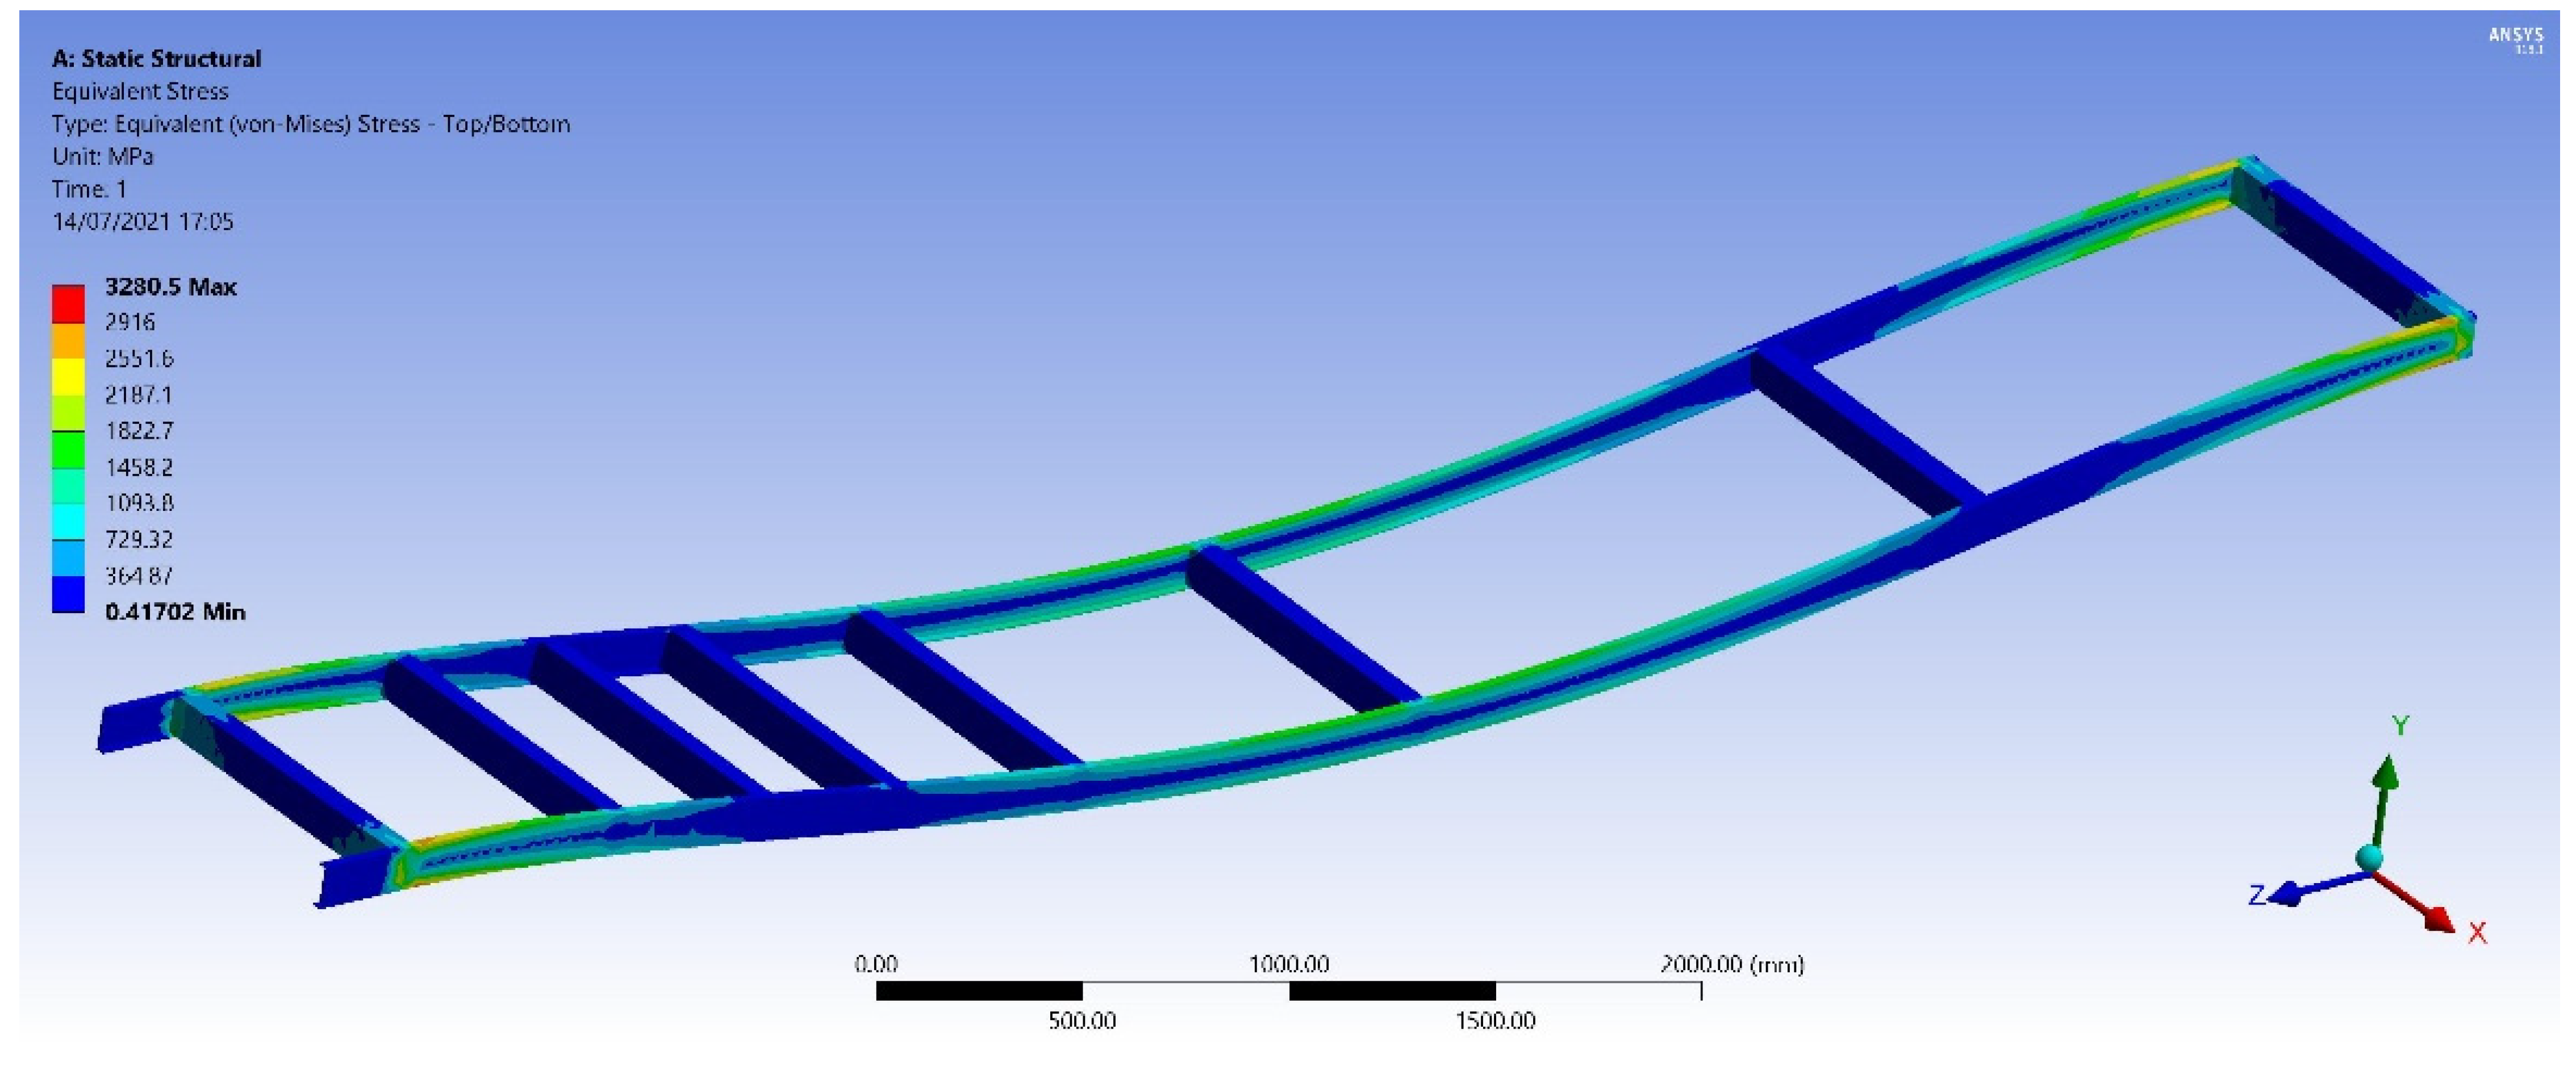
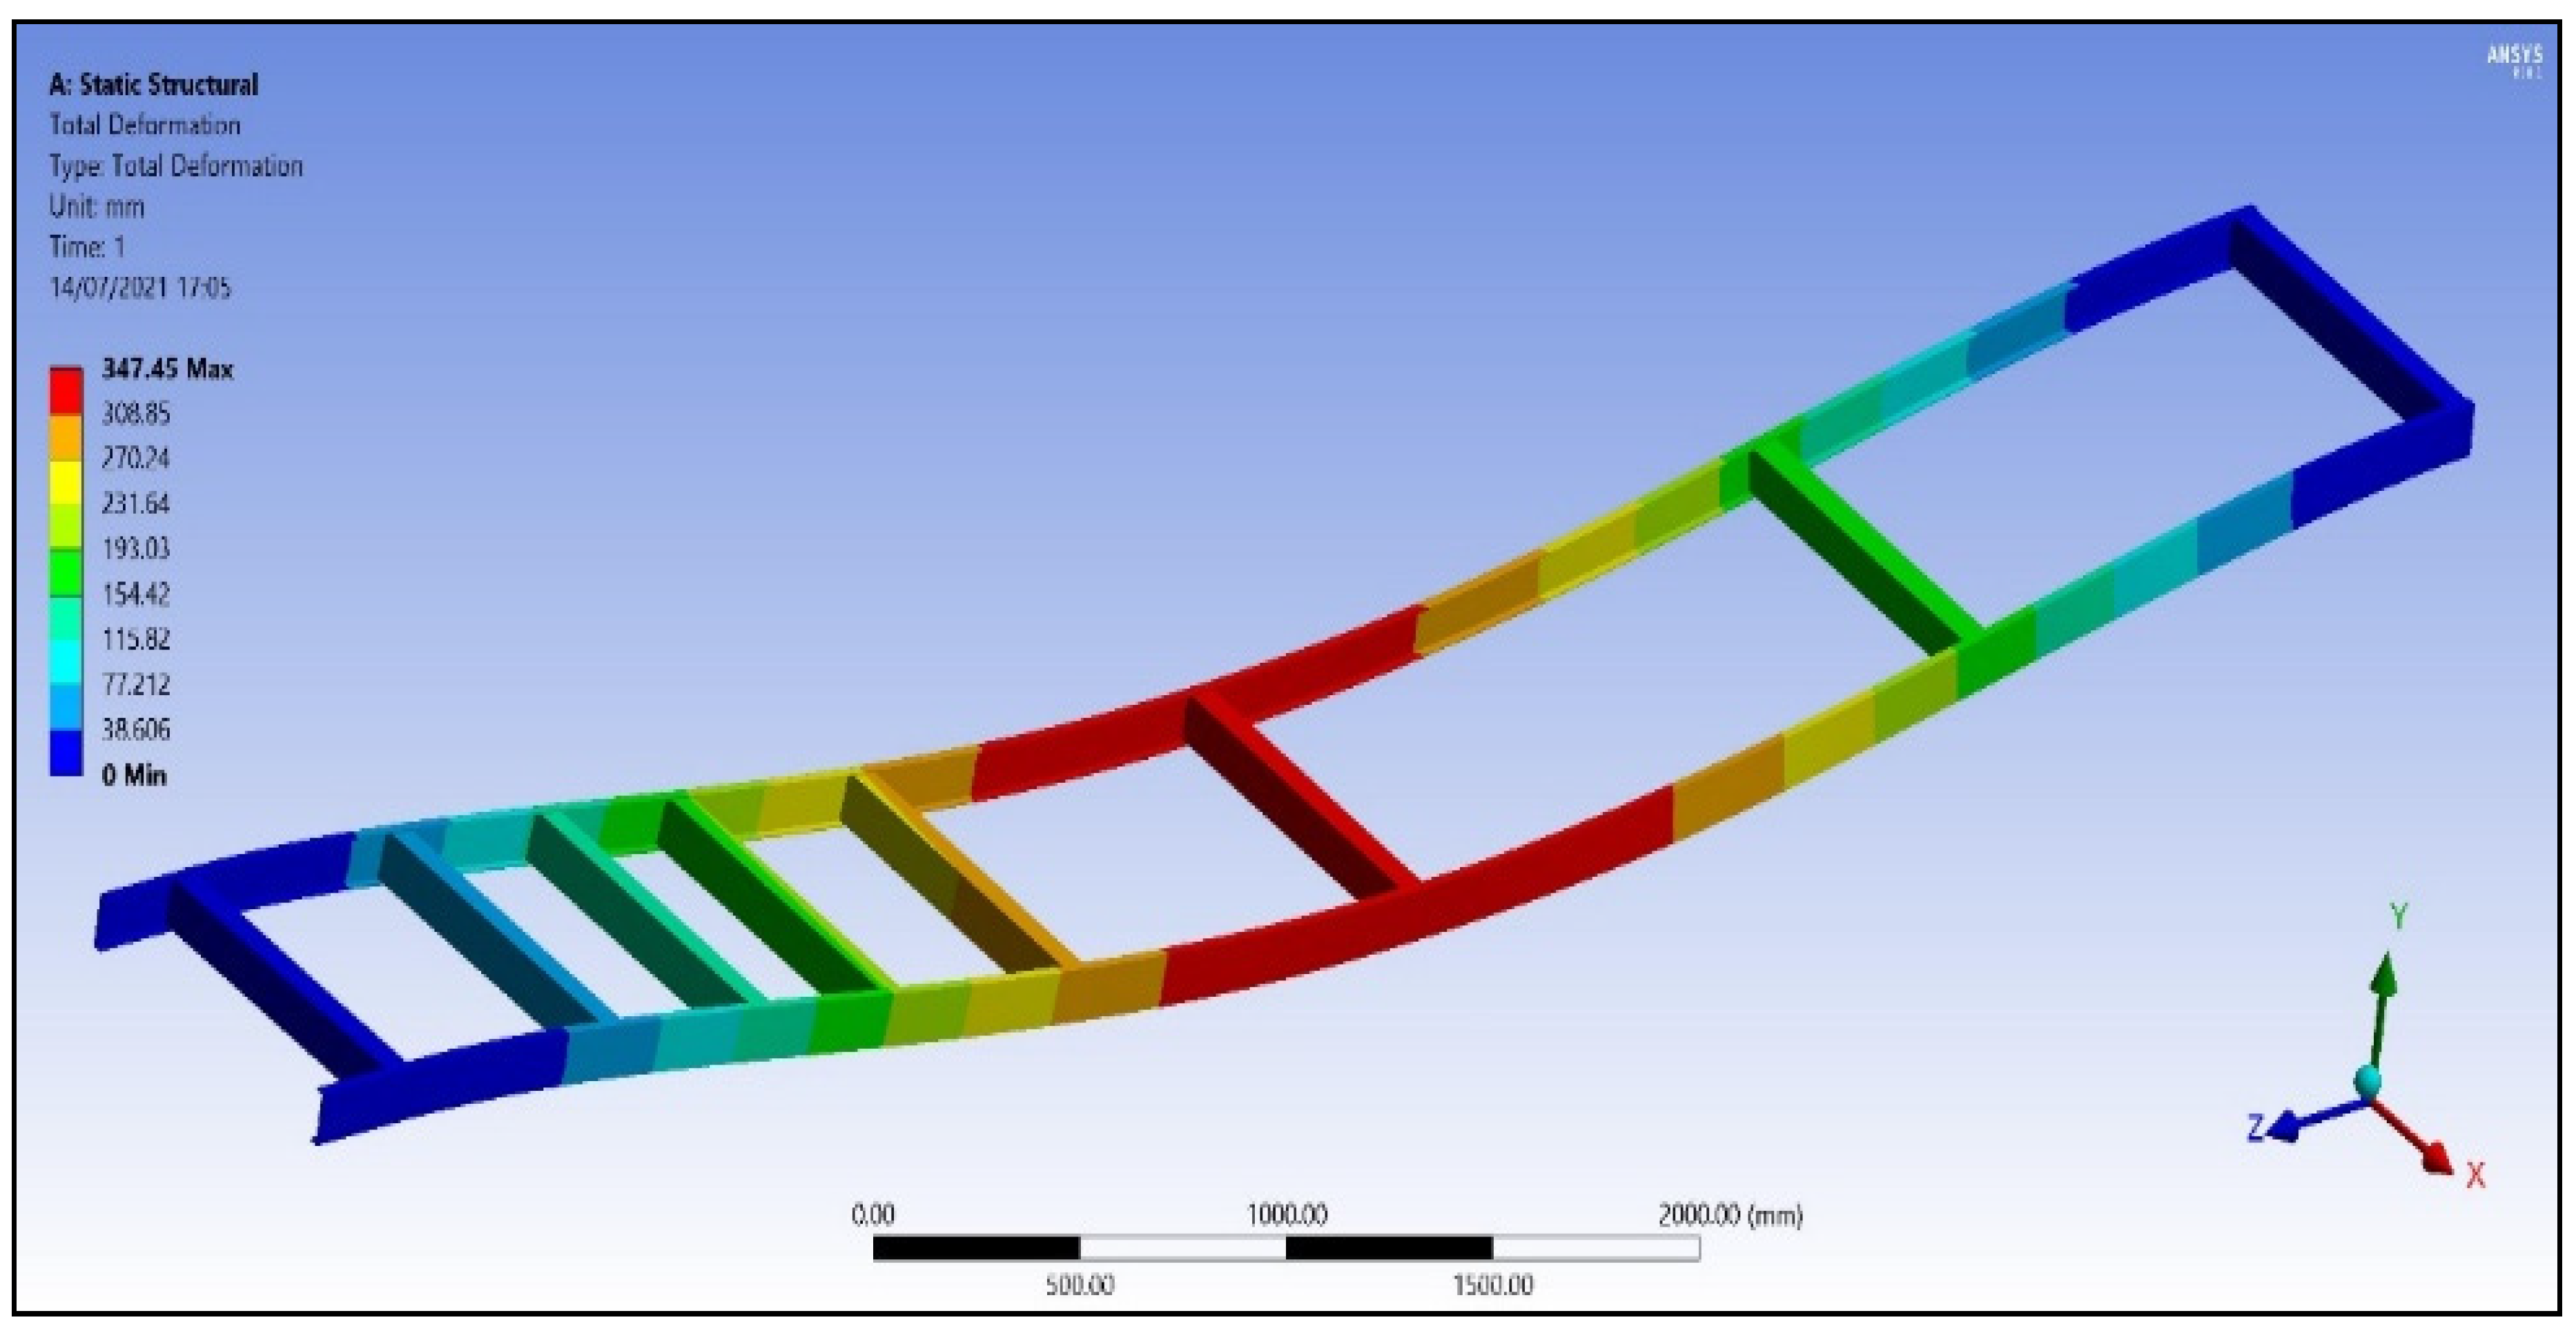
3.1. FE Results on a Standard Chassis

The FE simulation is conducted on the chassis to determine the deformation and equivalent stresses. The regions of longitudinal members near the supported end have higher equivalent stress as shown in Figure 7. The mid-section of the chassis also has high stress. This means the center of chassis and corner ends of chassis can be subject to failure under extra loading conditions. The failure of the chassis can occur in the form of crack initiation, which may propagate under repeated loading.
The deformation plot of chassis is shown in Figure 8. The maximum deformation (of approximately 347 mm) occurs at the mid-section/mid-length of the chassis. The deformation decreases and is least at the transverse members placed at the ends. In order to improve the chassis’ response to such loads, we need to improve it.
The next section presents the optimization scheme, the Taguchi design of experiments (DOE), that we used to improve the chassis.

3.2. Optimization of Standard Chassis

The optimization variables selected for the optimization of the chassis are the dimensions of the cross members. These are defined in the ANSYS® design modeler. These variables are the widths of cross member 1, 2 and 3, as shown in Figure 9 (H6), Figure 10 (H12) and Figure 11 (H14). The width dimensions are tabulated in Figure 12 below. The distance between these cross members is 1461.6 mm and 1724 mm, respectively. The three (3) selected cross sections are from rightmost (front) transverse member of chassis.
The first optimization scheme used is the central composite design (CCD). This design scheme has the following design points; axial, cube and center points, as shown in Figure 13 below.
The design points are generated based on a linear regression model and are given in Table 2 and Table 3. The lower bound and upper bound values of different cross members are shown in Table 2 below.
Table 3 shows three input points (columns B, C and D). The software evaluated the output parameters at these design points using Finite Element Analysis (FEA). These output parameters are equivalent stress and the total deformation as shown in column E and column F.
The second optimization method used is space fill design. Space fill designs are recommended for testing with deterministic models because the design points are evenly distributed in the design area as shown in Figure 14. To use these design options, an important assumption is necessary: the computer simulation must reflect the actual physical system [30].
Different design points are generated using the optimal space filling design scheme. These points are shown in column B, C and D of Table 4. The output parameters, i.e., equivalent stress (column E), total deformation (F) and solid mass (G) are evaluated for each design point.

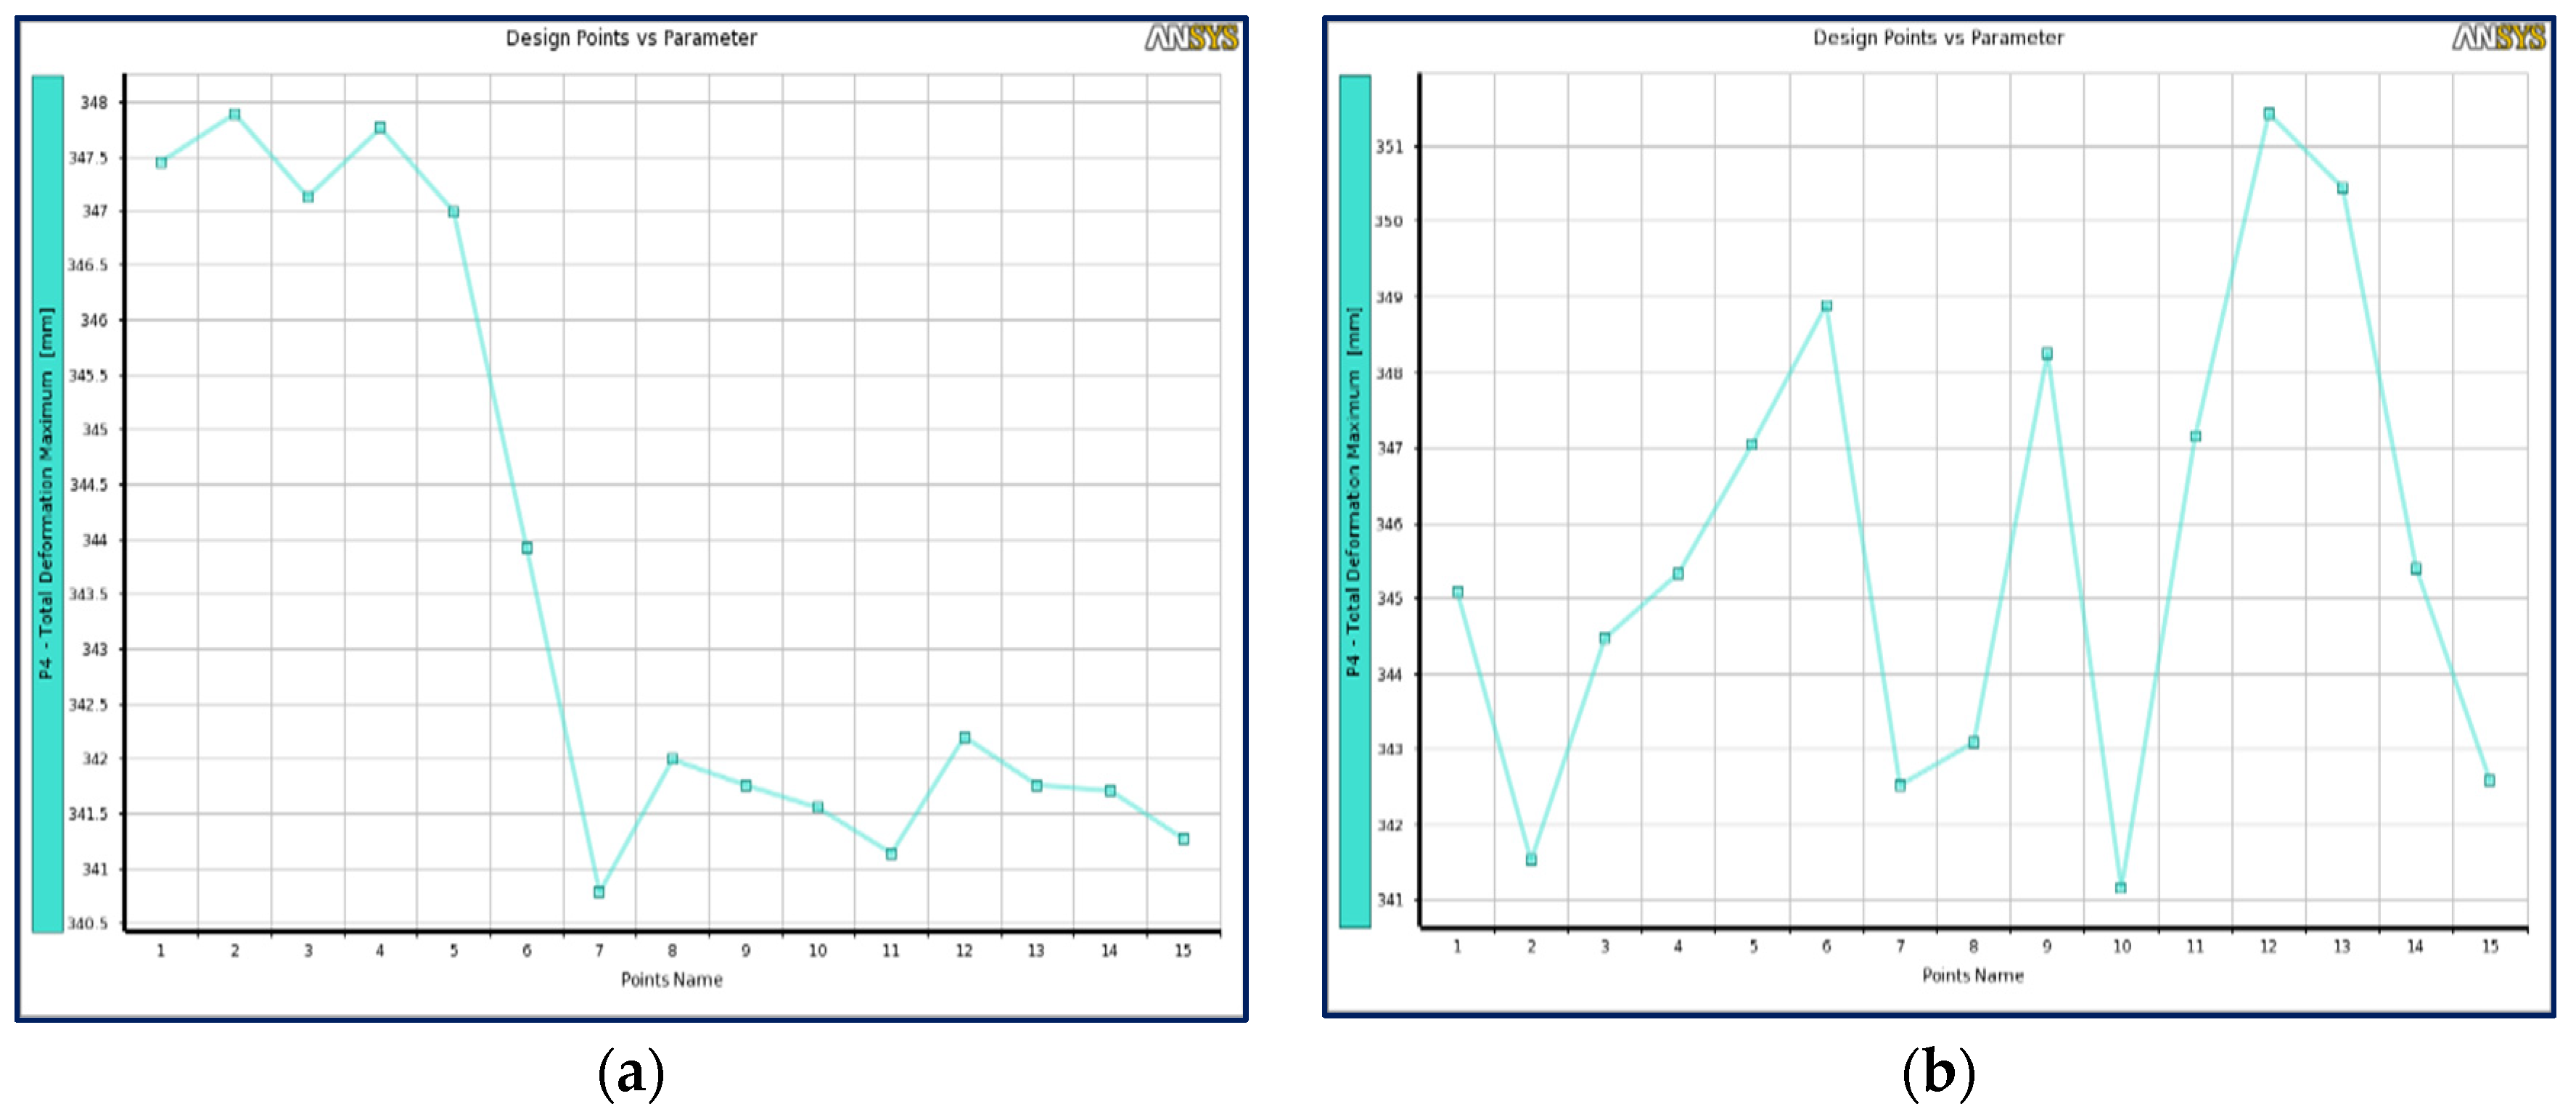
3.2.1. Total Deformation

The variation of the total deformation versus the design points is shown in Figure 15. In the CCD optimization scheme, the maximum deformation (347.89 mm) is observed for design point two (2), and minimum deformation (340.78 mm) is observed for design point seven (7). That is a 2% difference in deformation. The dimensions corresponding to design points number two (2) and seven (7), respectively, are:
  • 58.5 mm (−10%) for cross member 1, 65 mm for member 2 and 65 mm for member 3.
  • 65 mm for cross member 1, 65 mm for member 2 and 71.5 mm (+10%) for member 3.
In the OSF optimization scheme, the maximum deformation (351.44 mm) is observed for design point number 12 and minimum deformation (341.16 mm) is observed for design point number 10. That is 3% difference in deformation. The dimensions corresponding to design points 12 and 10 and the percentage change from the initial dimension are:
  • 60.67 mm (−6.6%) for cross member 1, 65 mm for member 2 and 61.53 (−5.3%) mm for member 3.
  • 65 mm for cross member 1, 67.6 mm (+4%) for member 2 and 71.07 (+9.3%) mm for member 3.

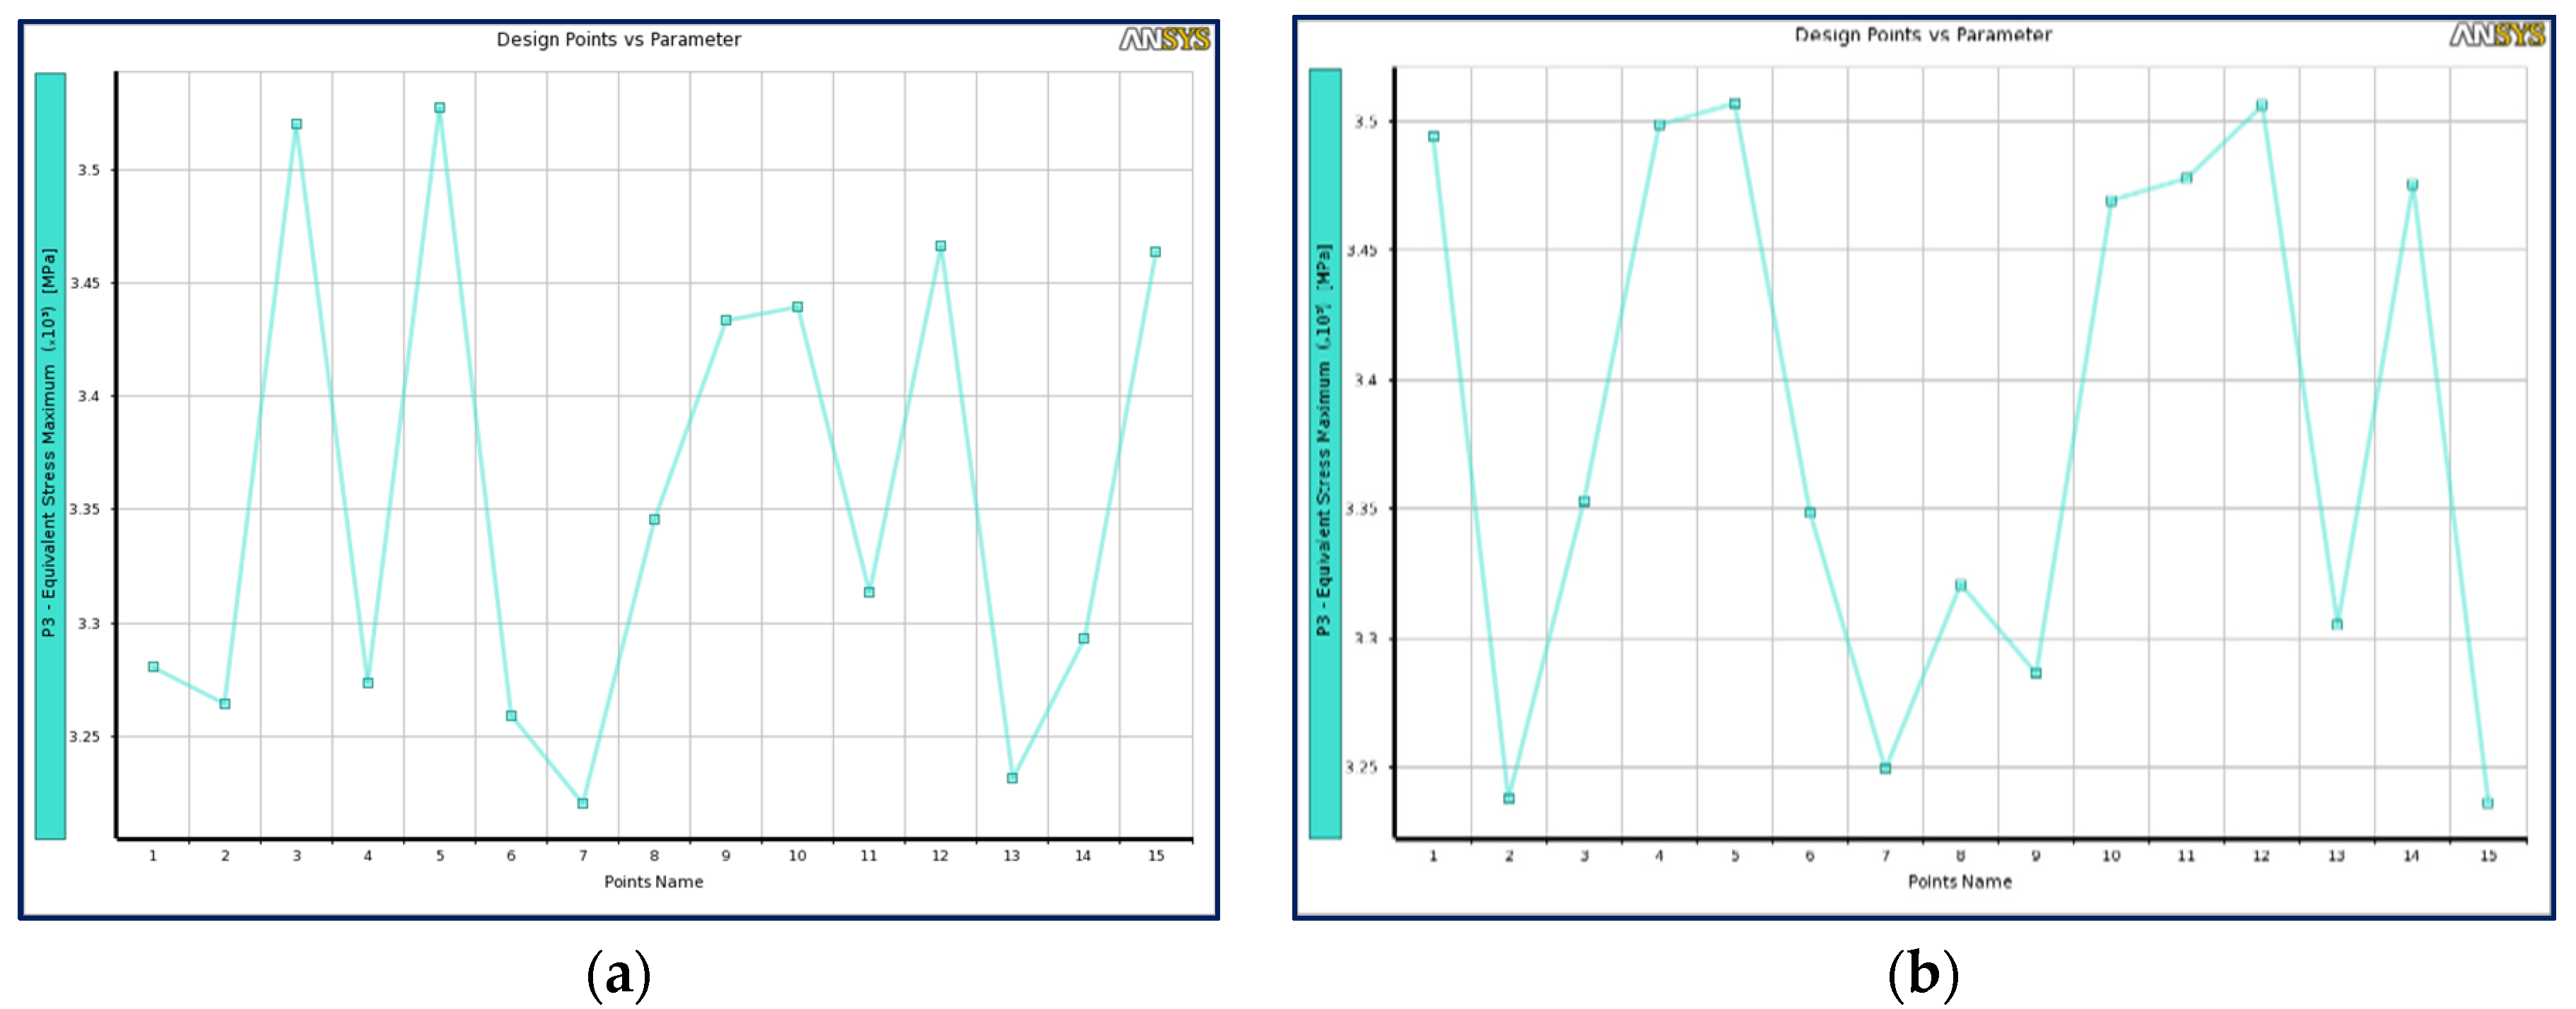
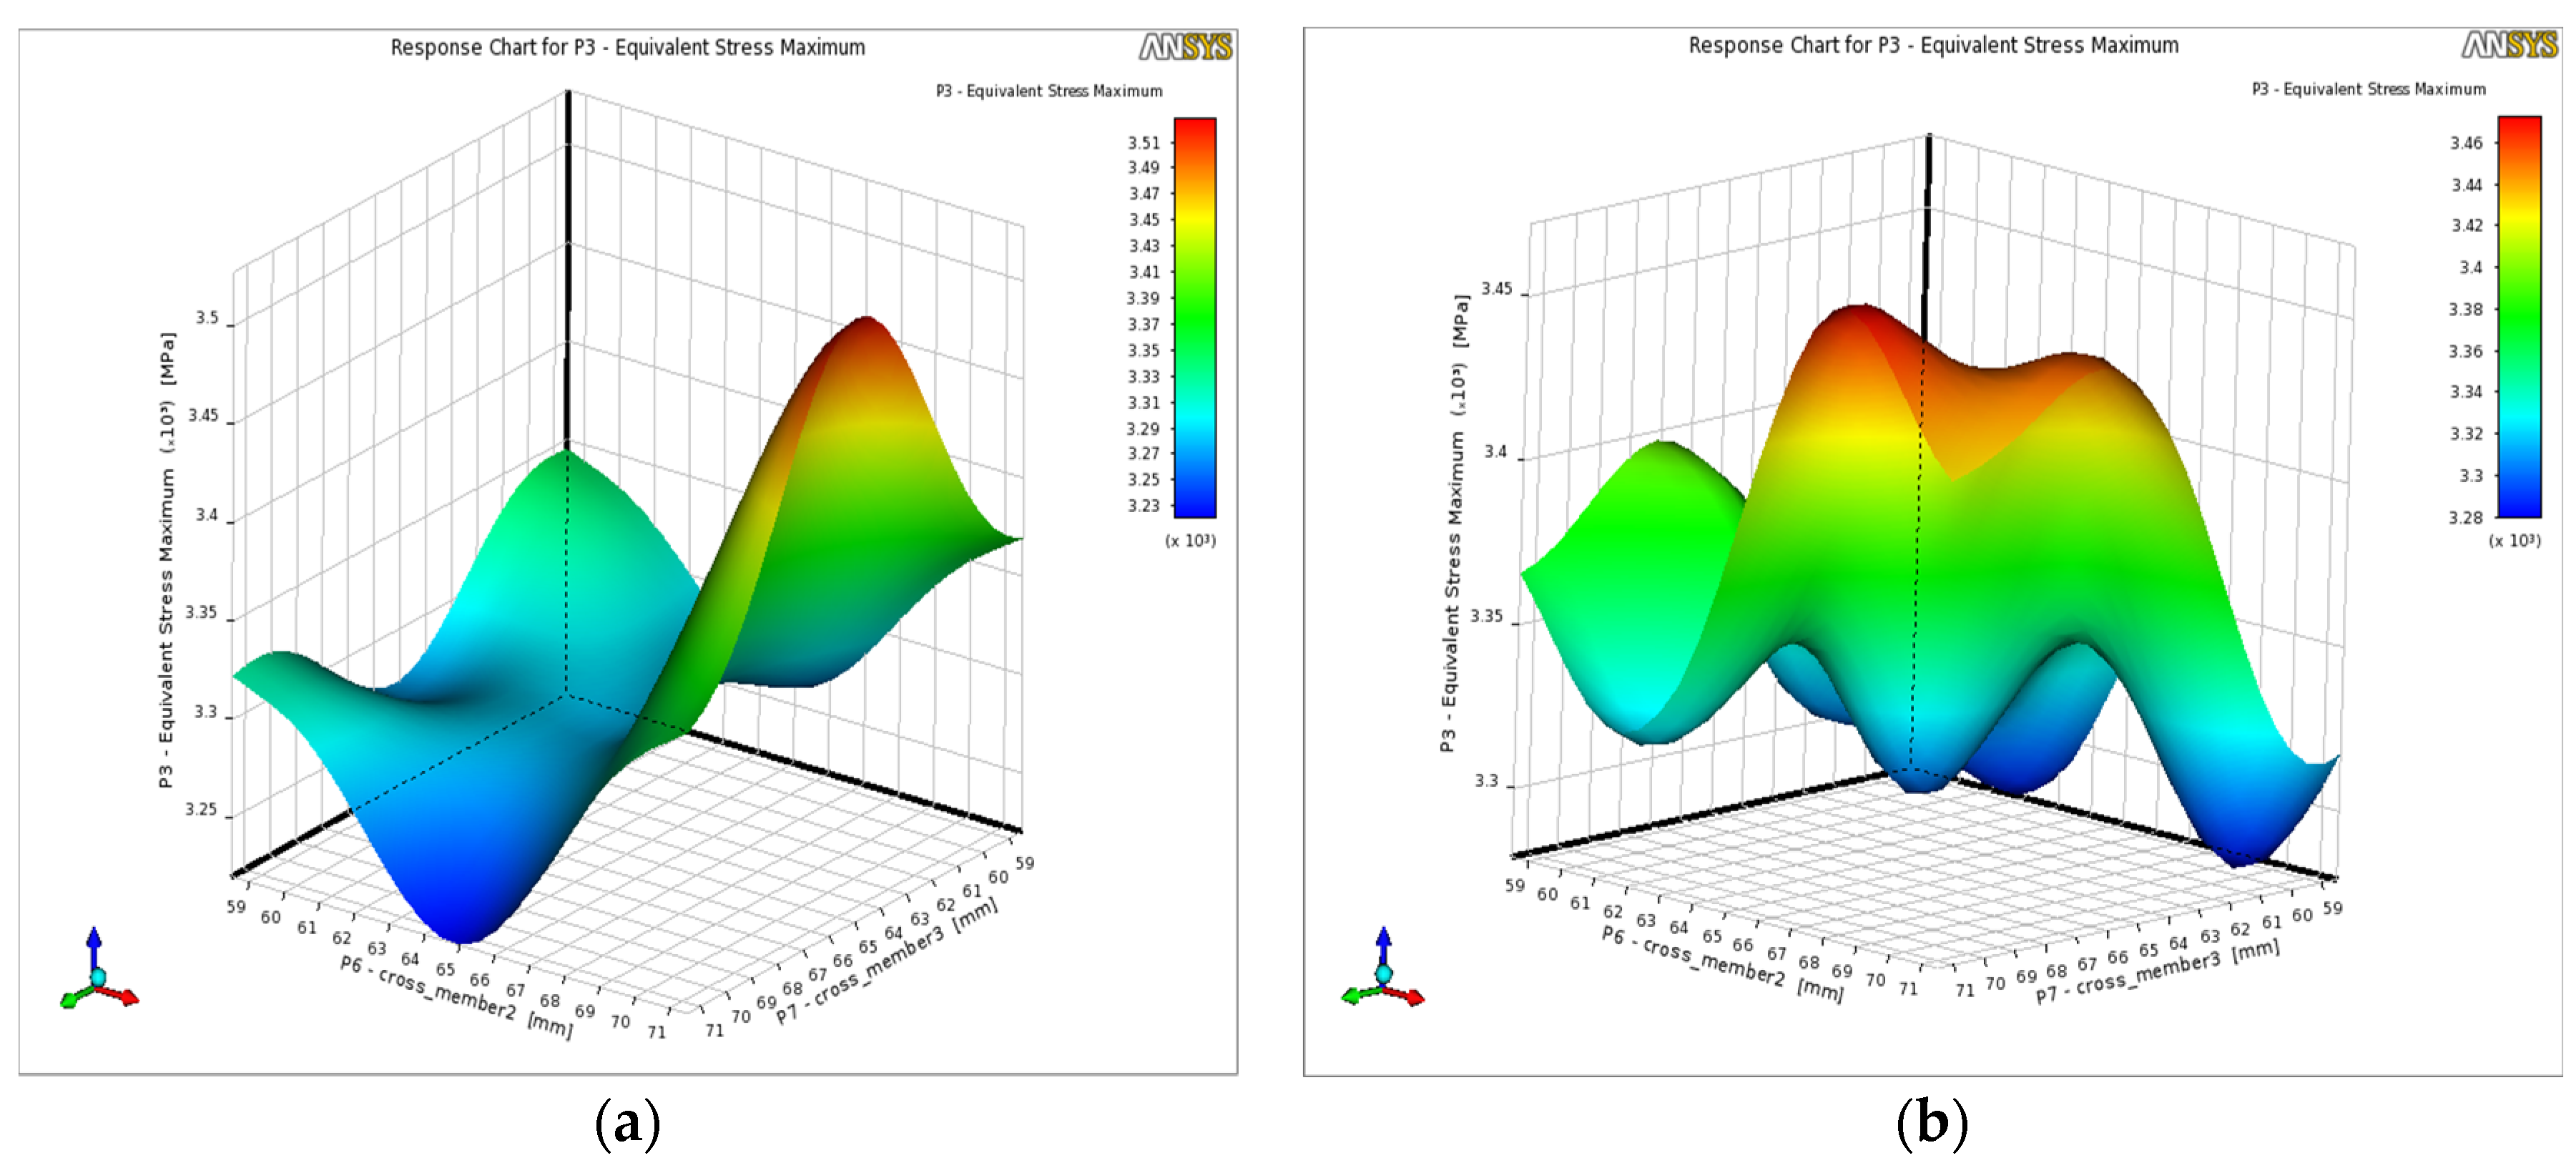
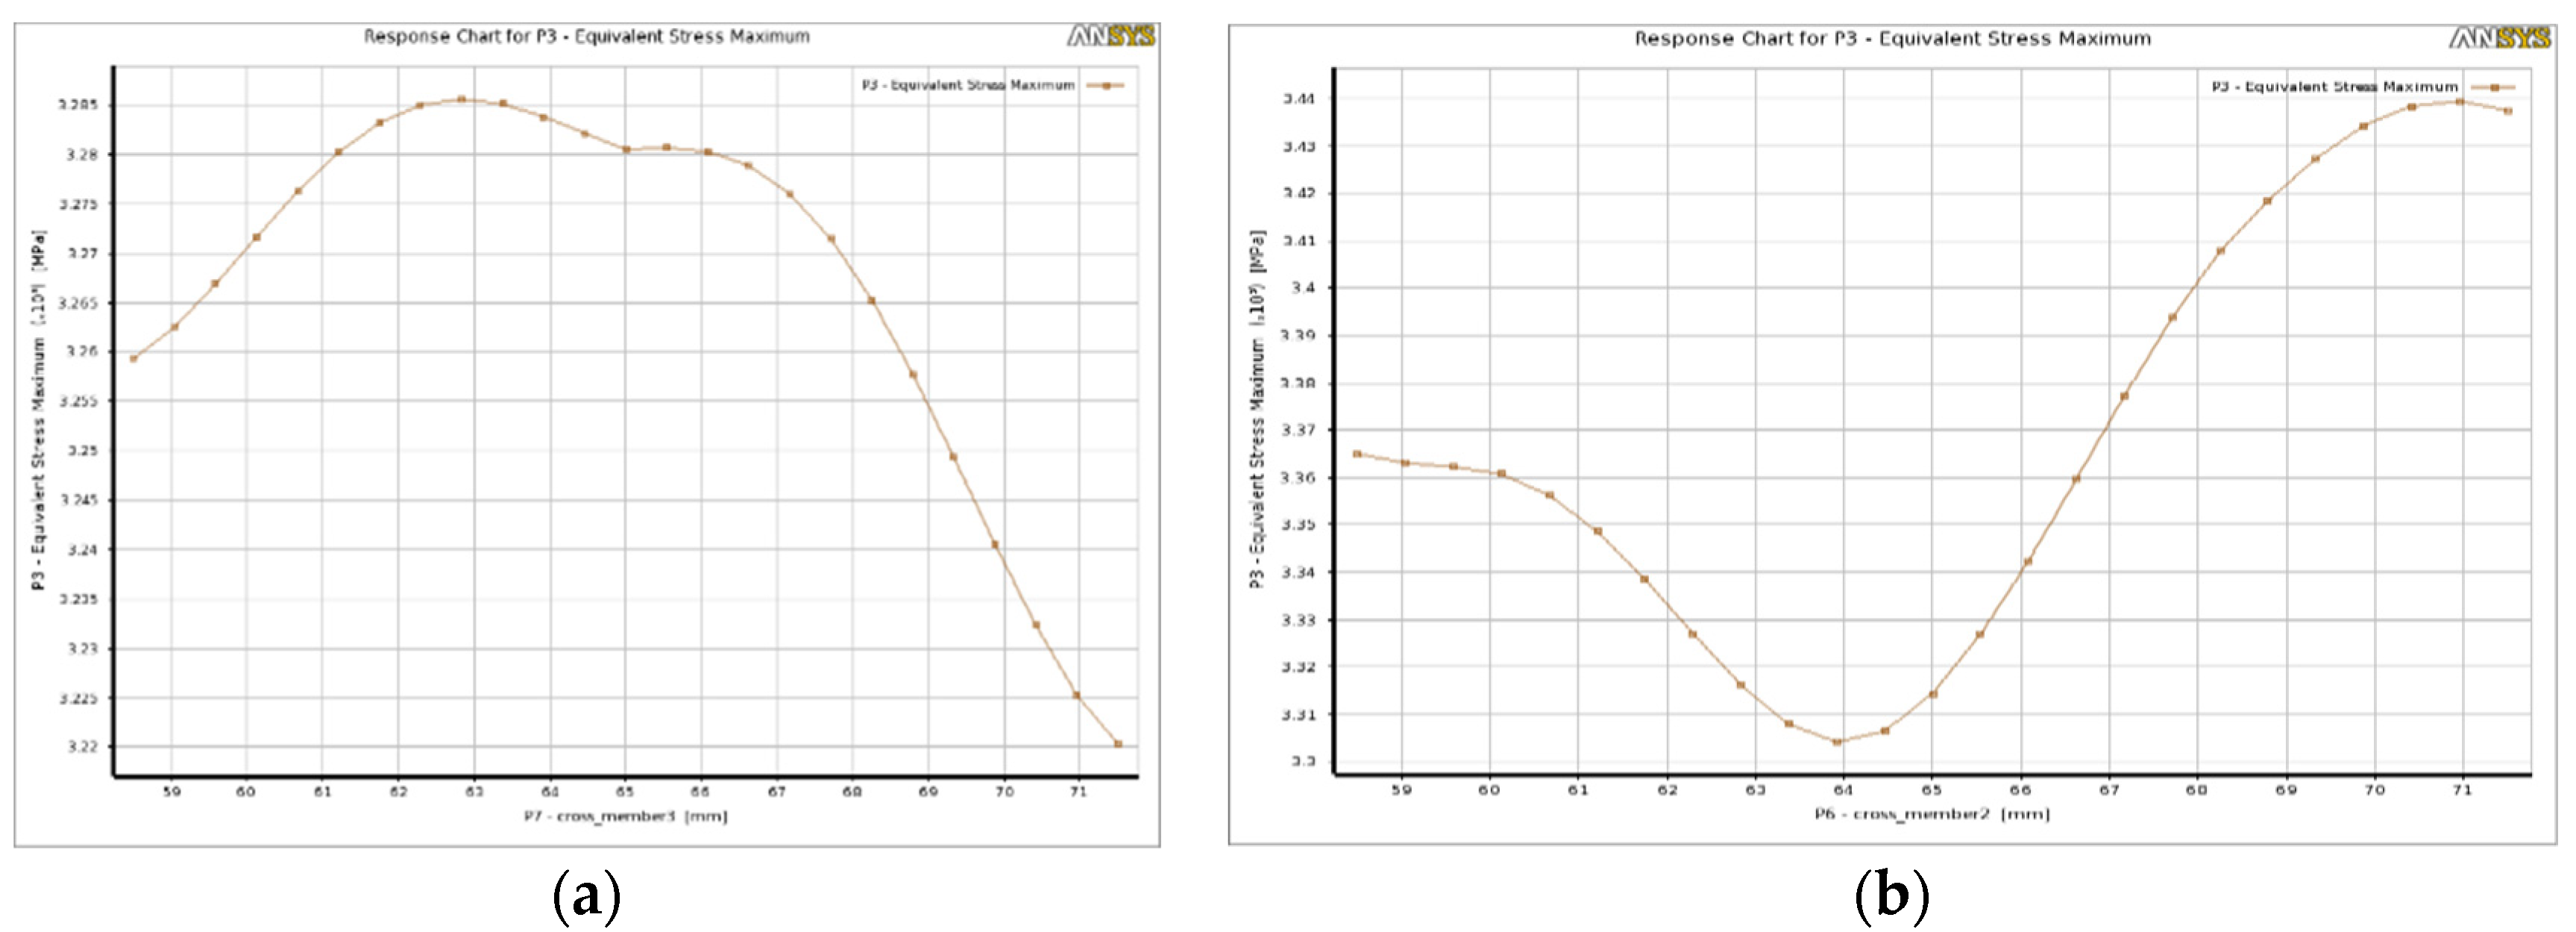
3.2.2. Equivalent Stress

Figure 16 shows the variation of equivalent stress versus the design points. In the CCD optimization scheme, the maximum equivalent stress (3527.5 MPa) is observed for design point 5 and the minimum equivalent stress (3220.3 MPa) is observed for point 7. That result a 9.5% difference in equivalent stresses. The dimensions corresponding to design point number 5 and 7, respectively, are:
  • 65 mm for cross member 1, 71.5 mm (+10%) for member 2 and 65 mm for member 3.
  • 65 mm for cross member 1, 65 mm for member 2 and 71.5 mm (+10%) for member 3.
In the OSFF optimization scheme, the maximum equivalent stress (3507 MPa) is observed at design point 5 and the minimum (3236.1 MPa) at point 15. There is an 8.3% variation differences in equivalent stresses. The dimensions corresponding to design points 5 and 15, respectively, are:
  • 58.933 mm (−9.3%) for cross member 1, 60.667 mm (−6.7%) for member 2 and 65.867 mm (+1.5%) for member 3.
  • 62.4 mm (−1.4%) for cross member 1, 61.533 mm (−5.3%) for member 2 and 70.2 mm (+8%) for member 3.
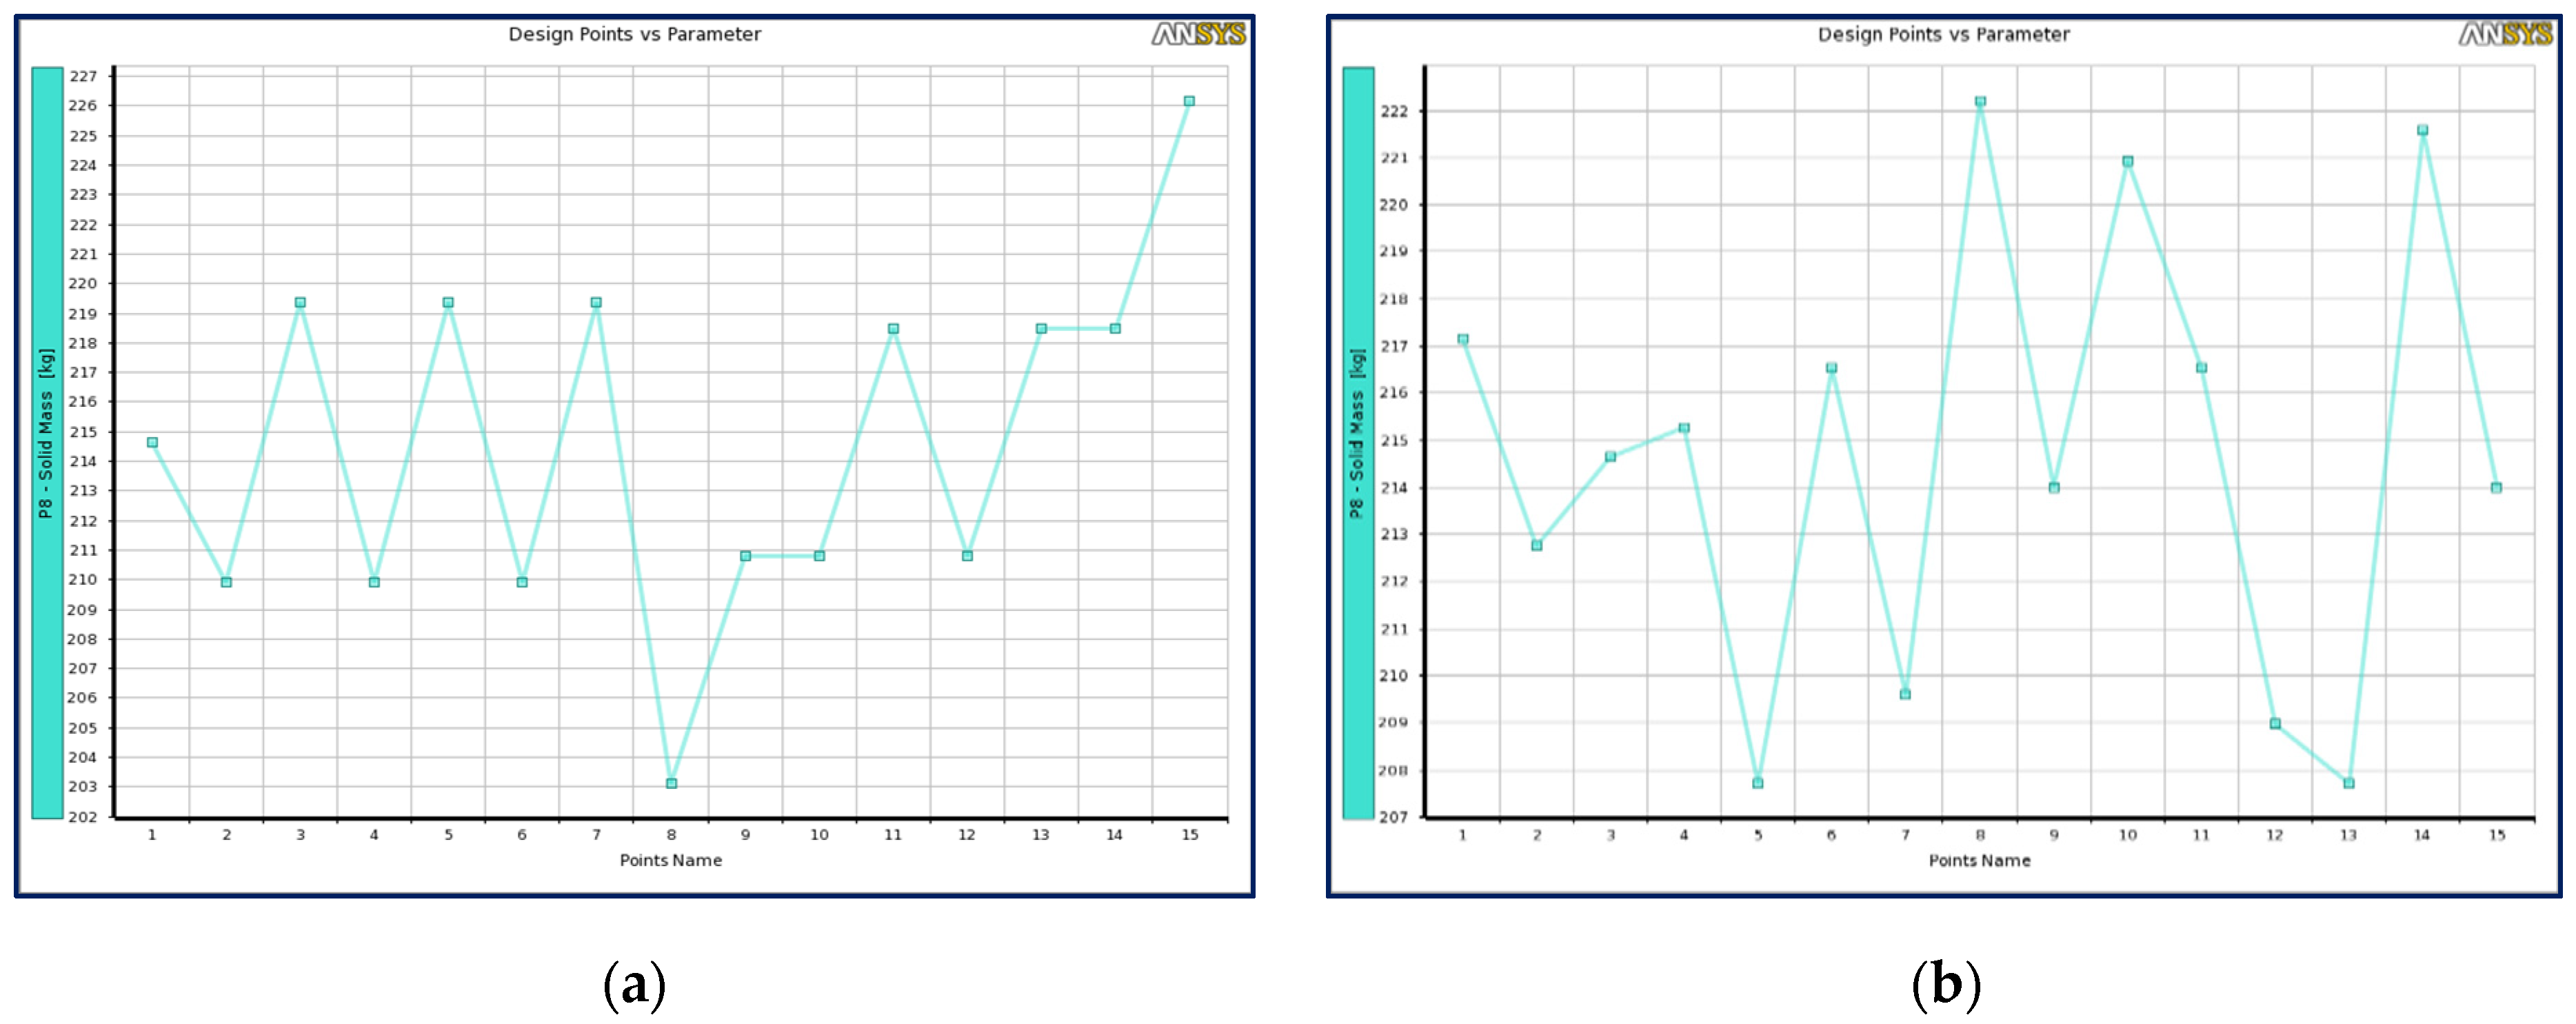
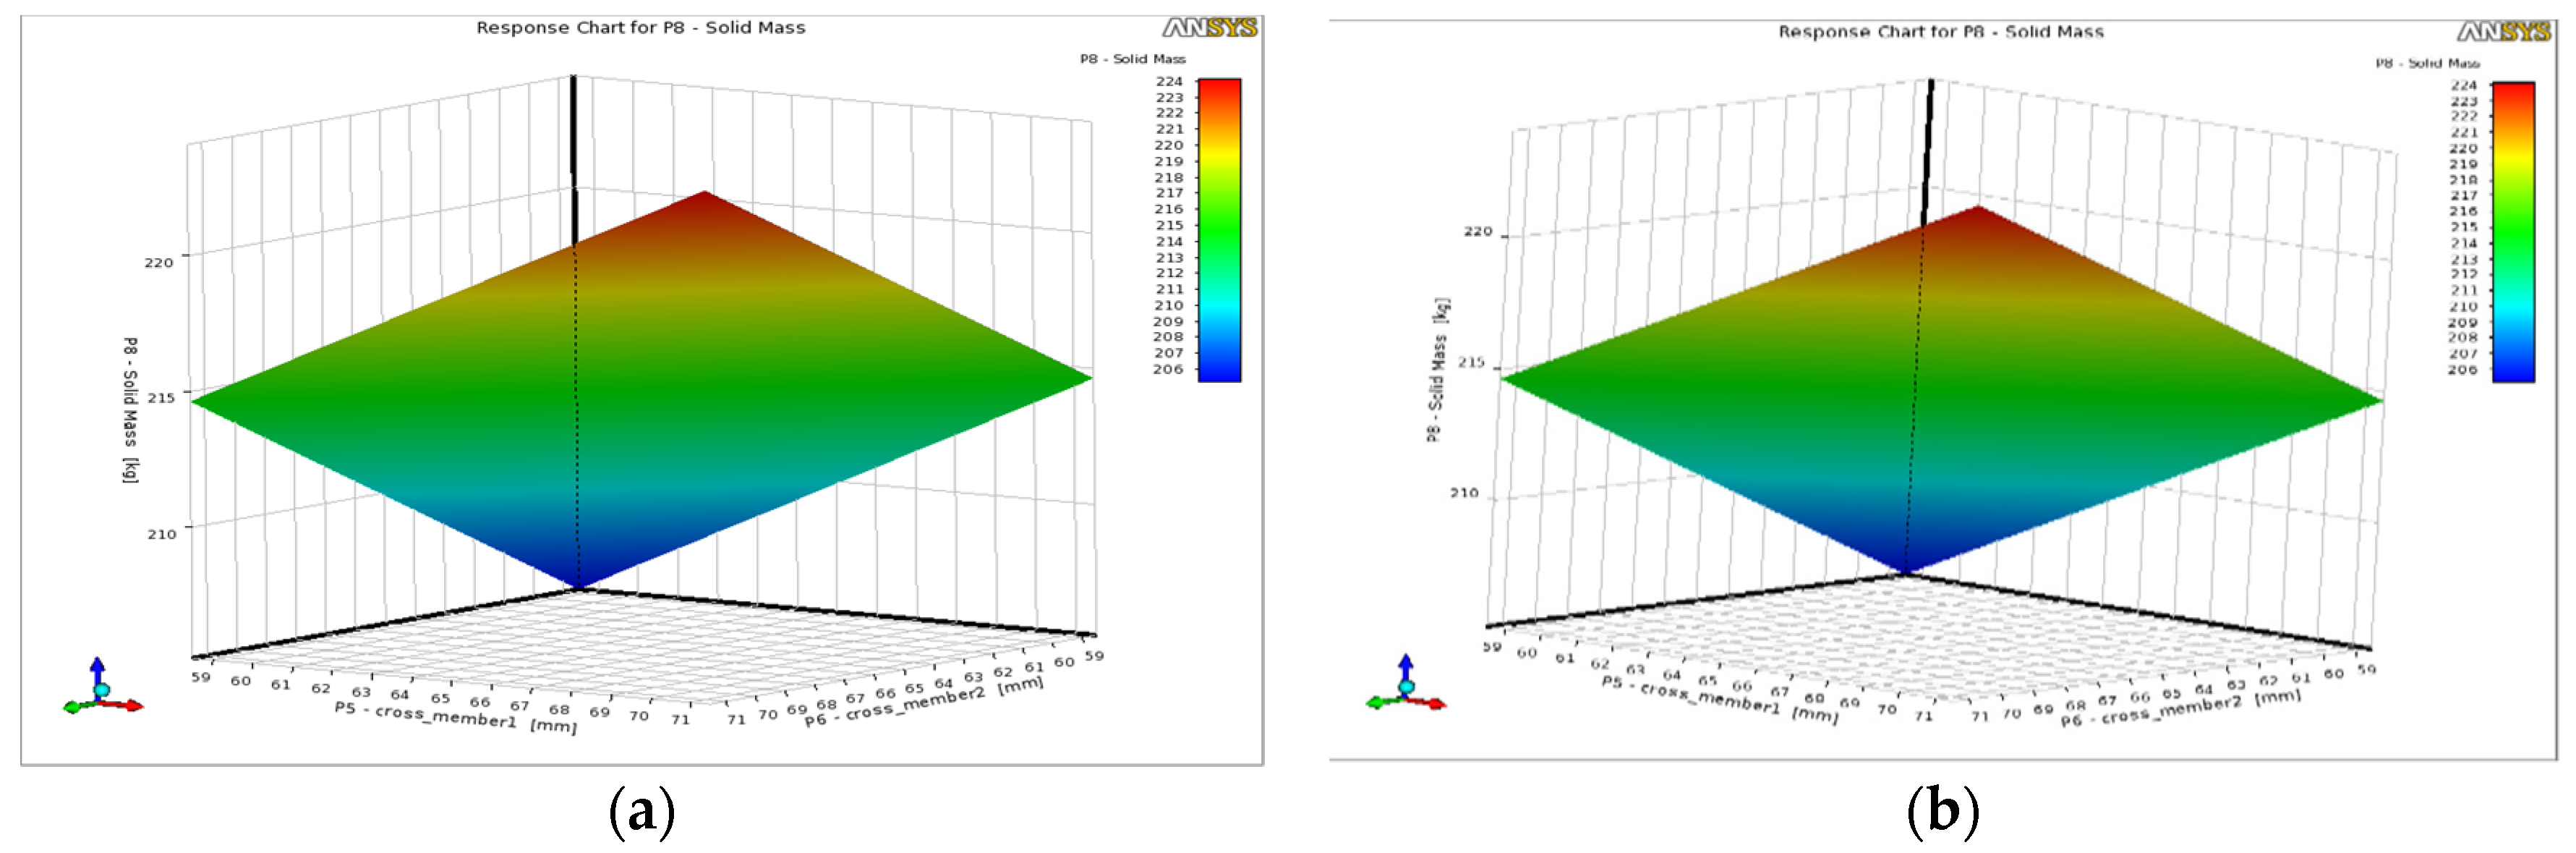
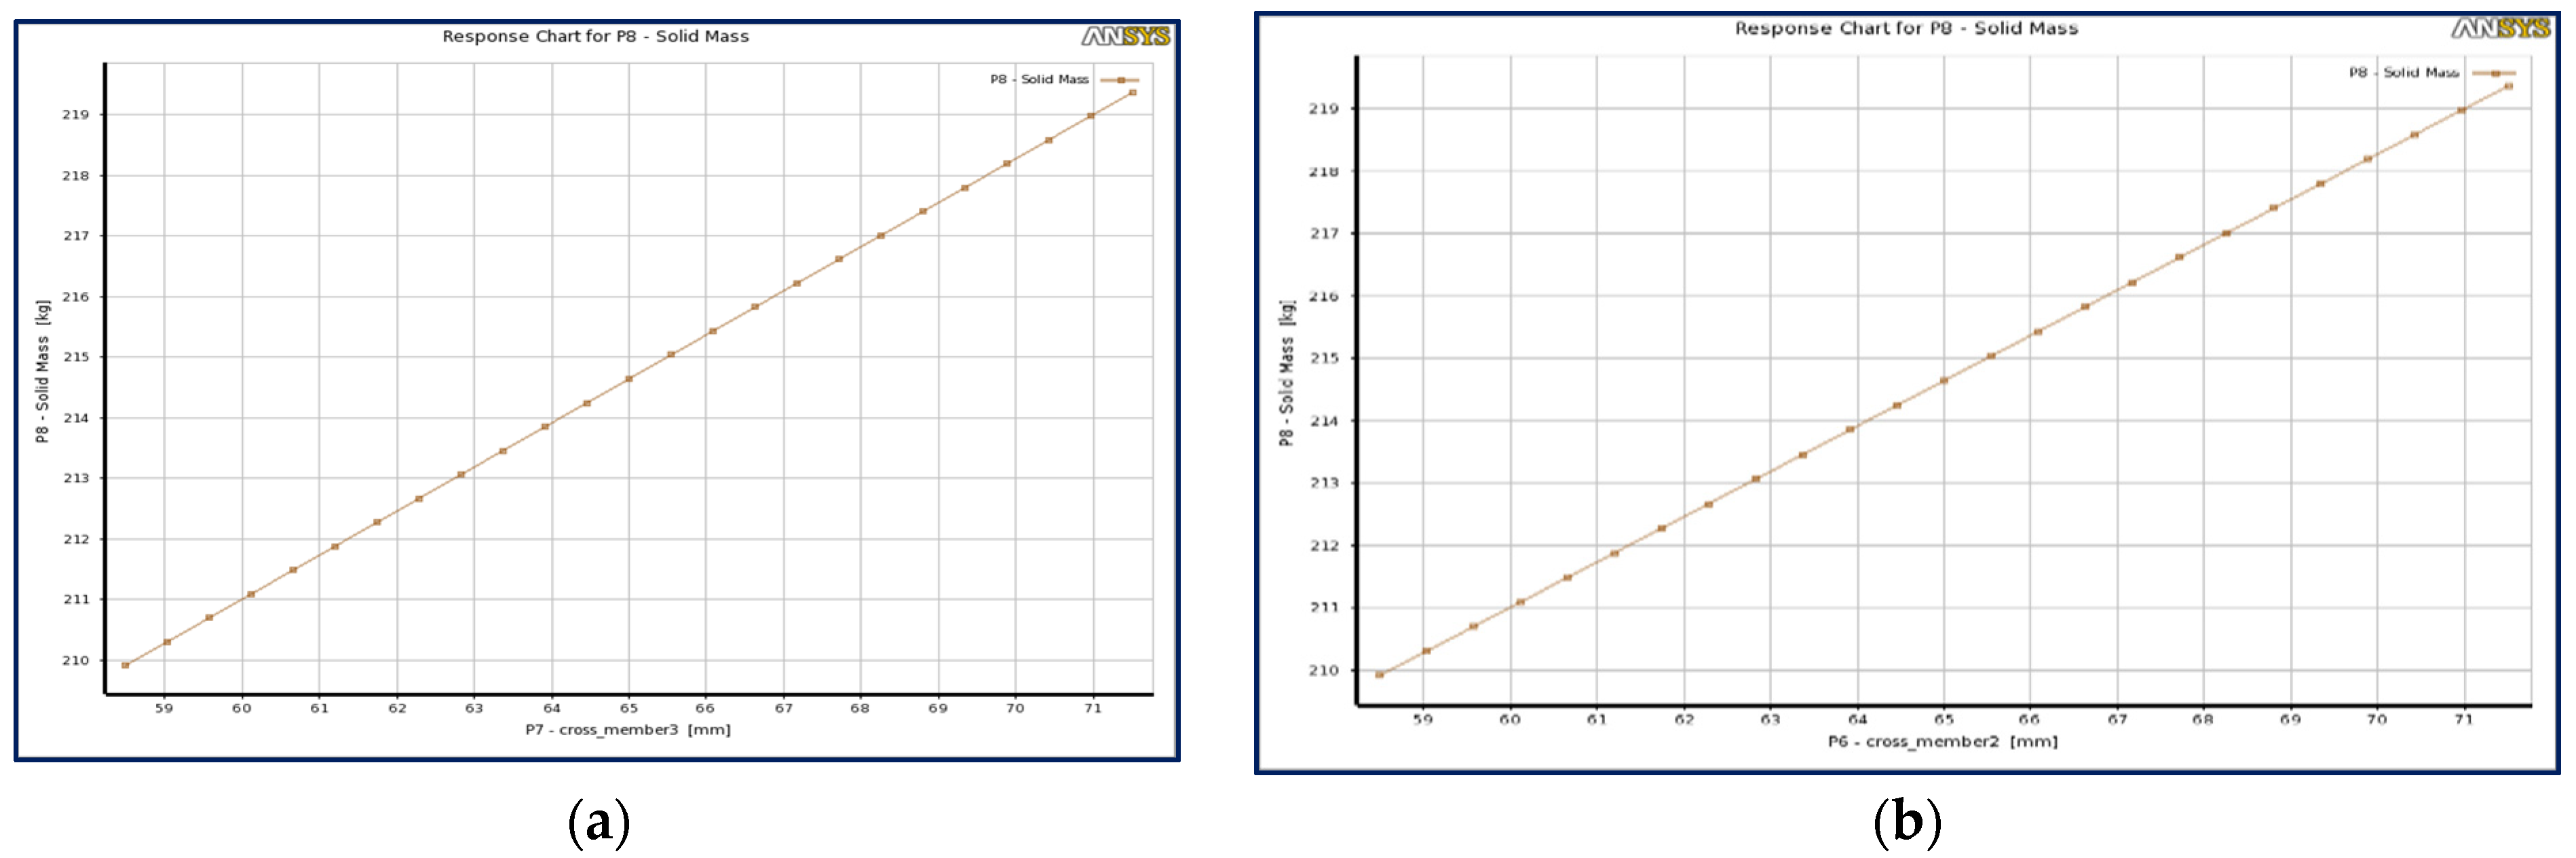
3.2.3. Solid Mass

The variation of solid mass vs. design points is shown in Figure 17. In the CCD scheme, the maximum (226.1 kg) solid mass obtained at design point number 15 and minimum (203.1 kg) solid mass at design point number 8, as shown in Figure 17a.
The dimensions corresponding to design point number 15 is 70.285 mm (+8.13 %) for all cross members.
Figure 17b indicates the results of the OSF method. The maximum (222.2 kg) solid mass is at design point number 8 and minimum (207.71 kg) at design point number 5. The dimensions corresponding to design point number 8 are:
  • 70.2 mm (+8%) for cross member 1, 65.867 mm (1.34%) for member 2, 69.333 mm (+6.7%) for member 3.
In the next section, we present the response surface plots of the optimization variables under discussion.

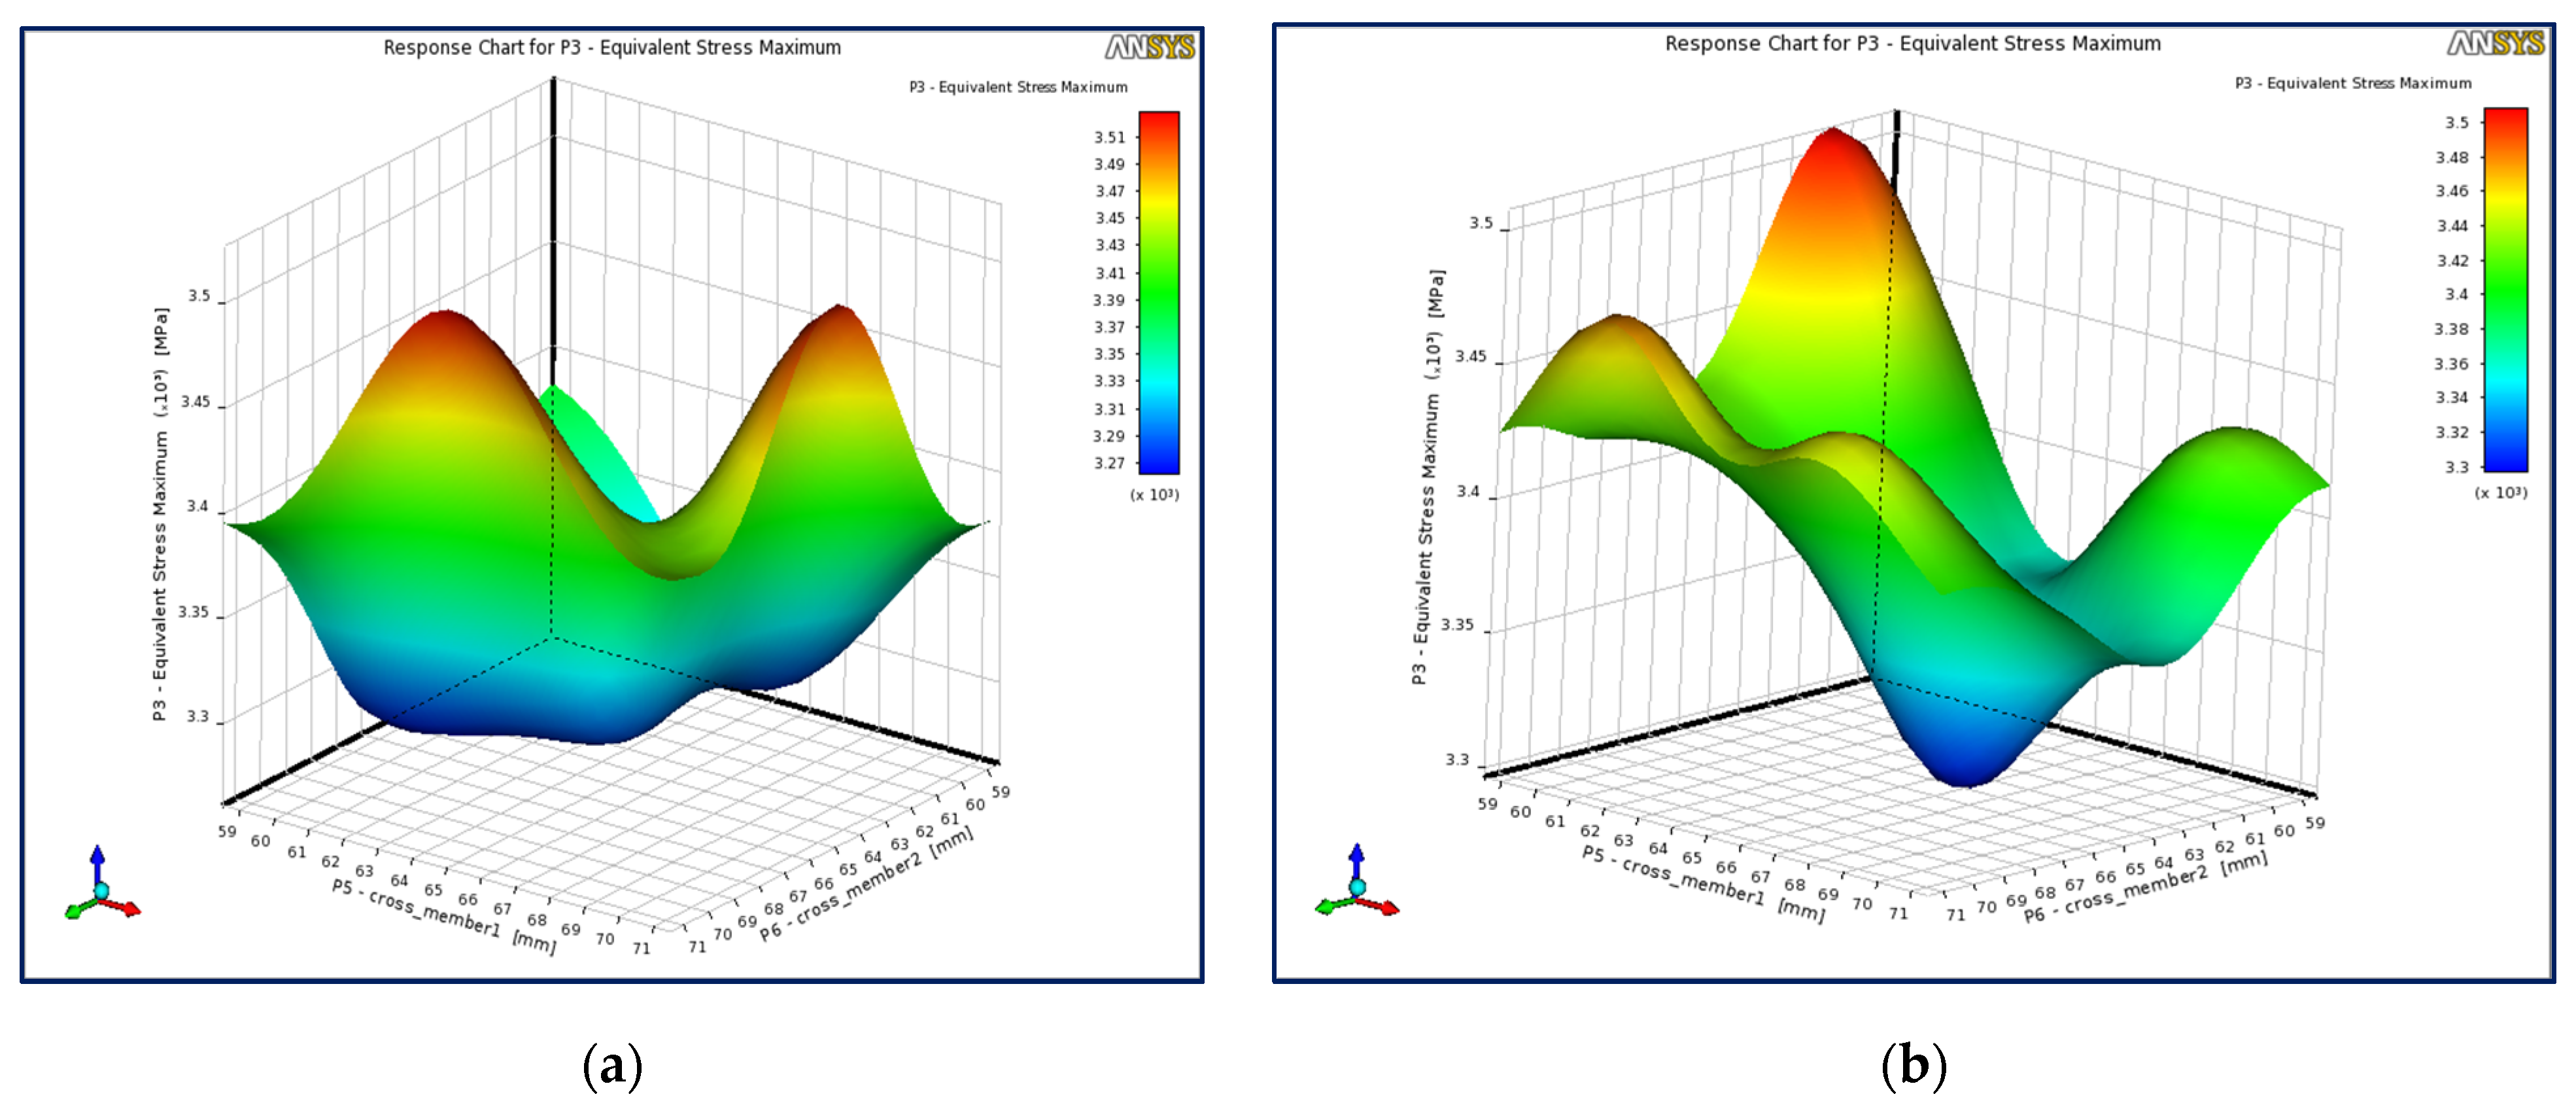
3.2.4. Surface Response

The response surface plot aids in determining the combined functional response of a range of optimization variables values. Figure 18a shows the response surface plot for the CCD optimization scheme for cross members 1 and 2.

Equivalent Stresses Surface Response

Two peaks of equivalent stress are observed as shown in the red colored region. It is clear in Figure 18a that the first peak appears along cross member 1, the equivalent stress is maximum for cross member 1 in the range between 62 mm and 67 mm and between 69 mm and 71 mm for cross member 2. The second peak appears along cross member 2, the equivalent stress is maximum for cross member 1 in the range between 69 mm to 71 mm and between 61 mm and 67 mm for cross member 2. One of the advantages of a response surface plot is that it clearly shows regions of interest for the particular objective and optimization variables.
Figure 18b shows the response surface plot of the OSF method for cross members 1 and 2. The first peak occurs along cross member 2, on this peak, the equivalent stress is maximum for cross member 1 dimension ranging from 59 mm to 62 mm and between 59 mm and 62 mm for cross member 2. The second lower peak occurs along cross member 1. At this peak, the equivalent stress is maximum for cross member 1 in the range between 61 mm to 63 mm and between 69 mm and 71 mm for cross member 2. The equivalent stress is minimum for other dimensions (Refer Table 3 and Table 4) of cross member 1 and cross member 2, as shown in dark the blue colored region.
The response surface plot of equivalent stress vs. cross member 2 and cross member 3 is shown in Figure 19. A single peak of equivalent stress is observed as shown in the red colored region. The dimensions corresponding to maximum equivalent stress are obtained using the interpolation method. The maximum equivalent stress is observed for cross member 3 value ranging from 61 mm to 67 mm and between 69 mm and 71 mm for cross member 2 (see Figure 19a). Figure 19b shows that the maximum equivalent stress is observed for cross member 3 in the range from 64 mm to 71 mm and 66 mm to 71 mm for cross member 2. The equivalent stress is minimum for other values of cross member 2 and cross member 3, which is represented by the dark blue colored region.
The variation of equivalent stress with respect to cross member 1 is shown in Figure 20. The graph in Figure 20a shows a gradual increase in equivalent stress up to 65 mm. The equivalent stress then increases exponentially and reaches a maximum value of 3570 Mpa at a cross member dimension of 71 mm. Figure 20b shows that the equivalent stress initially decreases and reaches a minimum value at cross member 1 (66 mm). The equivalent stress then increases linearly and reaches a maximum value at cross member 1 (71 mm). The initial maximum equivalent stress is obtained for cross member 1 (at 58.5 mm).
The variation of equivalent stress with respect to cross member 3 and member 2 is shown in Figure 21a and Figure 21b, respectively. The graph in Figure 21a shows the gradual increase in the equivalent stress up to 63 mm for cross member 3 then a linear decrease with an increase in the width this cross member. The minimum equivalent stress is observed at 71.5 mm.
In Figure 21b, the equivalent stress decreases with an increase in cross member 2’s width and reaches a minimum value of 64 mm. Thereafter, a linear increase of equivalent stress is observed and reaches maximum value at 71 mm.

Mass Surface Response
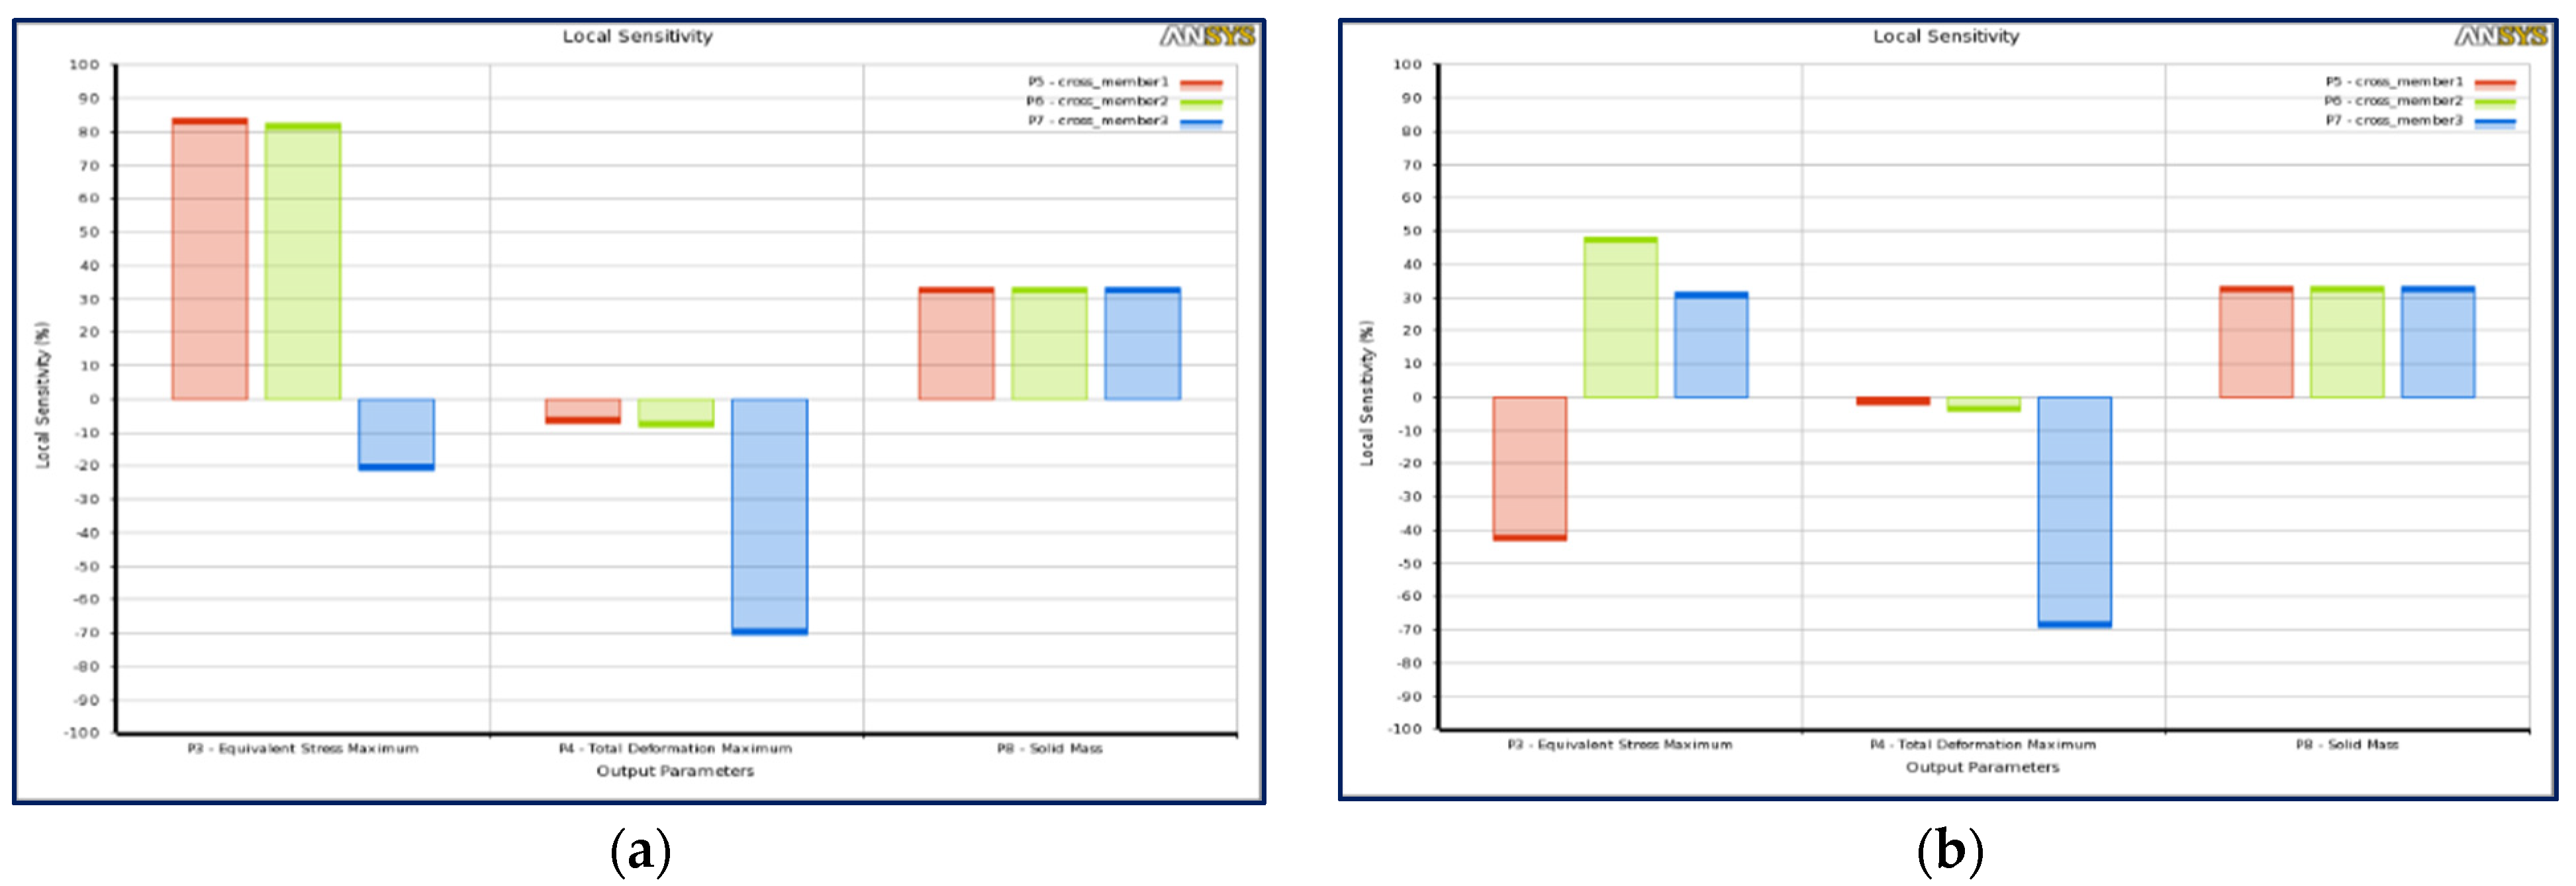
The variation of mass with respect to cross member 1 and 2 is shown in Figure 22. The maximum mass is represented in the red colored region, whereas the minimum mass is represented by the blue region.
The maximum mass in the CCD optimization, Figure 22b, is observed for cross member 1 in the range 68 mm to 71 mm and for cross member 2 between 68 mm to 71 mm. In the optimal space filling method, the maximum mass on cross member 1 is between 68 mm to 71 mm and between 65 mm and 71 mm for cross member 2. The minimum mass is observed for cross member 1 and cross member 3 dimensions ranging from 58.5 mm to 61 mm.
The variation of chassis mass with respect to cross member 1 and cross member 3 dimensions is shown in Figure 23a,b and Figure 24a,b respectively. Unsurprisingly, the solid mass of the chassis is observed to increase linearly with the increase in all the cross members dimensions.
The minimum mass of the chassis is observed for 58.5 mm cross member 3 and cross member 1 dimension 71.5 mm.

3.2.5. Sensitivity

Sensitivity plots are given in Figure 25a and Figure 25b, respectively. For the chassis deformation, the maximum sensitivity percentage is shown by cross member 3, and the minimum sensitivity percentage is shown by cross member 1. This signifies that cross member 3 has the maximum effect on the total deformation. For solid mass, all three variables show the same sensitivity percentage, which signifies that all the three optimization variables have the same effect on mass of chassis.
Figure 25a indicates for equivalent stress; the maximum sensitivity percentage is shown by cross member 1 (84.019%), and the minimum sensitivity percentage is shown by cross member 3 (21.231%), which signifies that cross member 1 has the maximum effect on the equivalent stress and cross member 3 has minimal effect. Figure 25b shows that the maximum sensitivity percentage is shown by cross member 2 and the minimum sensitivity percentage is shown by cross member 3, which signifies that cross member 2 has the maximum effect on equivalent stress.
The experimental investigation of the chassis was conducted under flexural loading conditions. The test results are in close agreement with the finite element simulation results. The experimental testing results are shown in Appendix A.

4. Conclusions

The dimensions of the chassis have a significant effect on its dynamics and load bearing characteristics. An optimized design can reduce weight and improve these characteristics. For example, a reduced mass of chassis will reduce the material required in its manufacturing.
In this paper, we applied an optimization method in order to improve the design characteristics of the chassis. This was the Taguchi design of experiments (DOE). The Taguchi DOE presented a wide range of dimensions for which equivalent stress, safety factor and mass are maximum or minimum. The optimization is conducted using central composite design (CCD) scheme and optimal space filling (OSF) design scheme. The individual effect of each variable is studied using 2D graphs and 3D response surface plots. This enabled us to determine the range of values (for the optimization variables) for which equivalent stress, mass and total deformation are maximum and or are minimum.
The optimization results obtained from the CCD scheme shows that cross member 1 has higher effect on equivalent stress as compared to cross member 2 and member 3. For total deformation, cross member 3 has a higher effect as compared to cross member 1 and 2. The mass reduction of the chassis obtained from central composite design scheme is nearly 5.3%. The optimization results obtained from optimal space filling design scheme shows that cross member 2 has higher effect on equivalent stress as compared to cross member 1 and 3. For total deformation, cross member 3 has a higher effect as compared to cross member 1 and 2.
The cost factor is quite significant in the decision-making process in industry. A chassis with a reduced weight signifies a reduction in the production, manufacturing, and material cost. Therefore, the optimization scheme that gives us higher weight reduction is desired. The mass reduction of the chassis obtained from optimization is approximately 5.3% when using the CCD method and 4.35% when using the optimal space filing method. Therefore, the central composite design scheme is preferable in this case.

5. Future Work

In the pursuit of improving vehicle chassis designs, a number of other considerations can be made. The design of vehicle chassis can be improved by perhaps changing the position of the cross members and/or by changing the orientation of cross sections of the chassis members.
Furthermore, the effects of material choices on the strength and rigidity of the heavy vehicle chassis structure requires investigation. This could have a significant effect on the strength to weight ratio of chassis.

Author Contributions

Conceptualization, A.A. and L.M.; methodology, A.A.; software, A.A.; validation, A.A., L.M.; formal analysis, A.A.; investigation, A.A.; resources, A.A.; data curation, A.A., L.M.; writing—original draft preparation, A.A.; writing—review and editing, L.M., A.A.; visualization, L.M., A.A.; supervision, L.M.; project administration, L.M., A.A.; funding acquisition, L.M. All authors have read and agreed to the published version of the manuscript.

Funding

This research and the APC was funded by University of South Africa.

Conflicts of Interest

The authors declare no conflict of interest. The funders had no role in the design of the study; in the collection, analyses, or interpretation of data; in the writing of the manuscript, or in the decision to publish the results.

Appendix A

Figure A1. Experimental testing results.
Processes 09 02028 g0a1

References

  1. Karaoǧlu, C.; Kuralay, N.S. Stress analysis of a truck chassis with riveted joints. Finite Elem. Anal. Des. 2002, 38, 1115–1130. [Google Scholar] [CrossRef]
  2. Bhaskar, E.; Muneiah, T.; Ch, V.R. Static and Dynamic Analysis of Chassic. Int. J. Res. 2014, 1, 320–328. [Google Scholar]
  3. Raju, V.V.; Prasad, B.D.; Balaramakrishna, M.; Srinivas, Y. Modeling and Structural Analysis of Ladder Type Heavy Vehicle. Int. J. Multidiscip. Educ. Res. 2014, 4, 26–42. [Google Scholar]
  4. Kumar, N.R.H. A Text Book on Automobile Chassis and Body Engineering; Government Junior College: Palamaner, India, 2014. [Google Scholar]
  5. Sinha, N.; Kumar, K. Optimization of Volumetric Composition and Cross-Section of Carbon Reinforced Epoxy based Polymeric Composite Tubes in Spaceframe Chassis. Mater. Today Proc. 2019, 18, 3812–3820. [Google Scholar] [CrossRef]
  6. Singh, A.; Soni, V.; Singh, A. Structural Analysis of Ladder Chassis for Higher Strength. Int. J. Emerg. Technol. Adv. Eng. 2014, 4, 253–259. [Google Scholar]
  7. Borns, R.; Whitacre, D. Optimizing Designs of Aluminum Suspension Components Using an Integrated Approach; SAE Technical Paper Series; SAE International: Warrendale, PA, USA, 2005. [Google Scholar] [CrossRef]
  8. Cavazzuti, M.; Costi, D.; Baldini, A.; Moruzzi, P. Automotive chassis topology optimization: A comparison between spider and coupé designs. Proc. World Congr. Eng. 2011, 3, 2289–2293. [Google Scholar]
  9. Cavazzuti, M.; Splendi, L. Structural Optimization Of Automotive Chassis: Theory, Set Up, Design. In Proceedings of the Problèmes Inverses, Contrôle et Optimisation de Formes, Parigi, Indonesia, 2–4 April 2012. [Google Scholar]
  10. Chiandussi, G.; Gaviglio, I.; Ibba, A. Topology optimisation of an automotive component without final volume constraint specification. Adv. Eng. Softw. 2004, 35, 609–617. [Google Scholar] [CrossRef]
  11. Pedersen, C.B. Crashworthiness design of transient frame structures using topology optimization. Comput. Methods Appl. Mech. Eng. 2004, 193, 653–678. [Google Scholar] [CrossRef]
  12. Duddeck, F. Multidisciplinary optimization of car bodies. Struct. Multidiscip. Optim. 2008, 35, 375–389. [Google Scholar] [CrossRef]
  13. Bhat, K.A.; Katore, H.V. The Failure Analysis of Tractor Trolley Chassis An Approach using Finite Element Method—A Review. IOSR J. Mech. Civ. Eng. 2014, 10, 24–25. [Google Scholar]
  14. Stalin, B. Structural Analysis of Front-End Cross Bar of a TATA407 Chassis Frame. Bonfring Int. J. Ind. Eng. Manag. Sci. 2016, 6, 120–122. [Google Scholar] [CrossRef] [Green Version]
  15. Yang, R.J.; Chahande, A.I. Automotive applications of topology optimization. Struct. Multidiscip. Optim. 1995, 9, 245–249. [Google Scholar] [CrossRef]
  16. Kang, N.; Kokkolaras, M.; Papalambros, P.Y.; Yoo, S.; Na, W.; Park, J.; Featherman, D. Optimal design of commercial vehicle systems using analytical target cascading. Struct. Multidiscip. Optim. 2014, 50, 1103–1114. [Google Scholar] [CrossRef]
  17. Deore, E.R.; Patil, H.B.; Kachave, S.D. Stress Analysis of Automotive Chassis with Various Thicknesses. IOSR J. Mech. Civ. Eng. 2011, 6, 44–49. [Google Scholar]
  18. Patel, V.; Patel, V.V.; Patel, R.I. Structural Analysis of Automotive Chassis Frame and Design Modification for Weight Reduction. World J. Sci. Technol. 2012, 2012, 1–6. [Google Scholar] [CrossRef]
  19. Sharma, P.K.; Parekh, N.J.; Nayak, D. Optimization and Stress Analysis of Chassis in TATA Turbo Truck SE1613. Int. J. Eng. Adv. Technol. 2014, 3, 182–187. [Google Scholar]
  20. Rajasekar, K.; Saravanan, R.; Dhandapani, N. Design and Optimization of Variable Rectangular Cross Section Chassis for On-Road Heavy Vehicles. Int. J. Veh. Struct. Syst. 2016, 8, 11–16. [Google Scholar] [CrossRef]
  21. Feng, G.; Jia, S.; Li, N.; Lin, H. Push rod failure analysis of a mining heavy dump truck. Eng. Fail. Anal. 2012, 25, 193–199. [Google Scholar] [CrossRef]
  22. Patil, R.V.; Marathe, J.; Tadamalle, A.; Reddy, Y. Optimization of tractor trolley chassis using orthogonal array method. Mater. Today: Proc. 2017, 4, 8796–8805. [Google Scholar] [CrossRef]
  23. Srivastava, J.P.; Reddy, G.G.; Teja, K.S. Numerical investigation on vibration characteristics and structural behaviour of different go-kart chassis configuration. Mater. Today Proc. 2021, 39, 176–182. [Google Scholar] [CrossRef]
  24. Prabakaran, S. Structural Analysis of Chassis Frame and Modification for Weight Reduction. Int. J. Eng. Sci. Res. Technol. 2014, 3, 1–6. [Google Scholar]
  25. De Oliveira, F.C.G.; Borges, J.A.F. Design and Optimization of a Space frame Chassis; SAE Technical Paper Series; SAE International: Warrendale, PA, USA, 2008. [Google Scholar] [CrossRef]
  26. Agarwal, A.; Molwane, O.B.; Marumo, R. Design Optimization of Knuckle Stub Using Response Surface Optimization. In Advances in Lightweight Materials and Structures; Kumar, A.P., Dirgantara, T., Krishna, P.V., Eds.; Springer: Singapore, 2020; pp. 155–164. [Google Scholar] [CrossRef]
  27. Monika, S. Finite Element Analysis of Truck Chassis Frame. Int. Res. J. Eng. Technol. 2015, 2, 1949–1956. [Google Scholar]
  28. ANSYS. Advantages to Using a Small-Sliding Contact in Your Structural Analysis. Ansys Blog. 2018. Available online: https://www.ansys.com/blog/small-sliding-contacts-can-improve-structural-analysis (accessed on 15 June 2020).
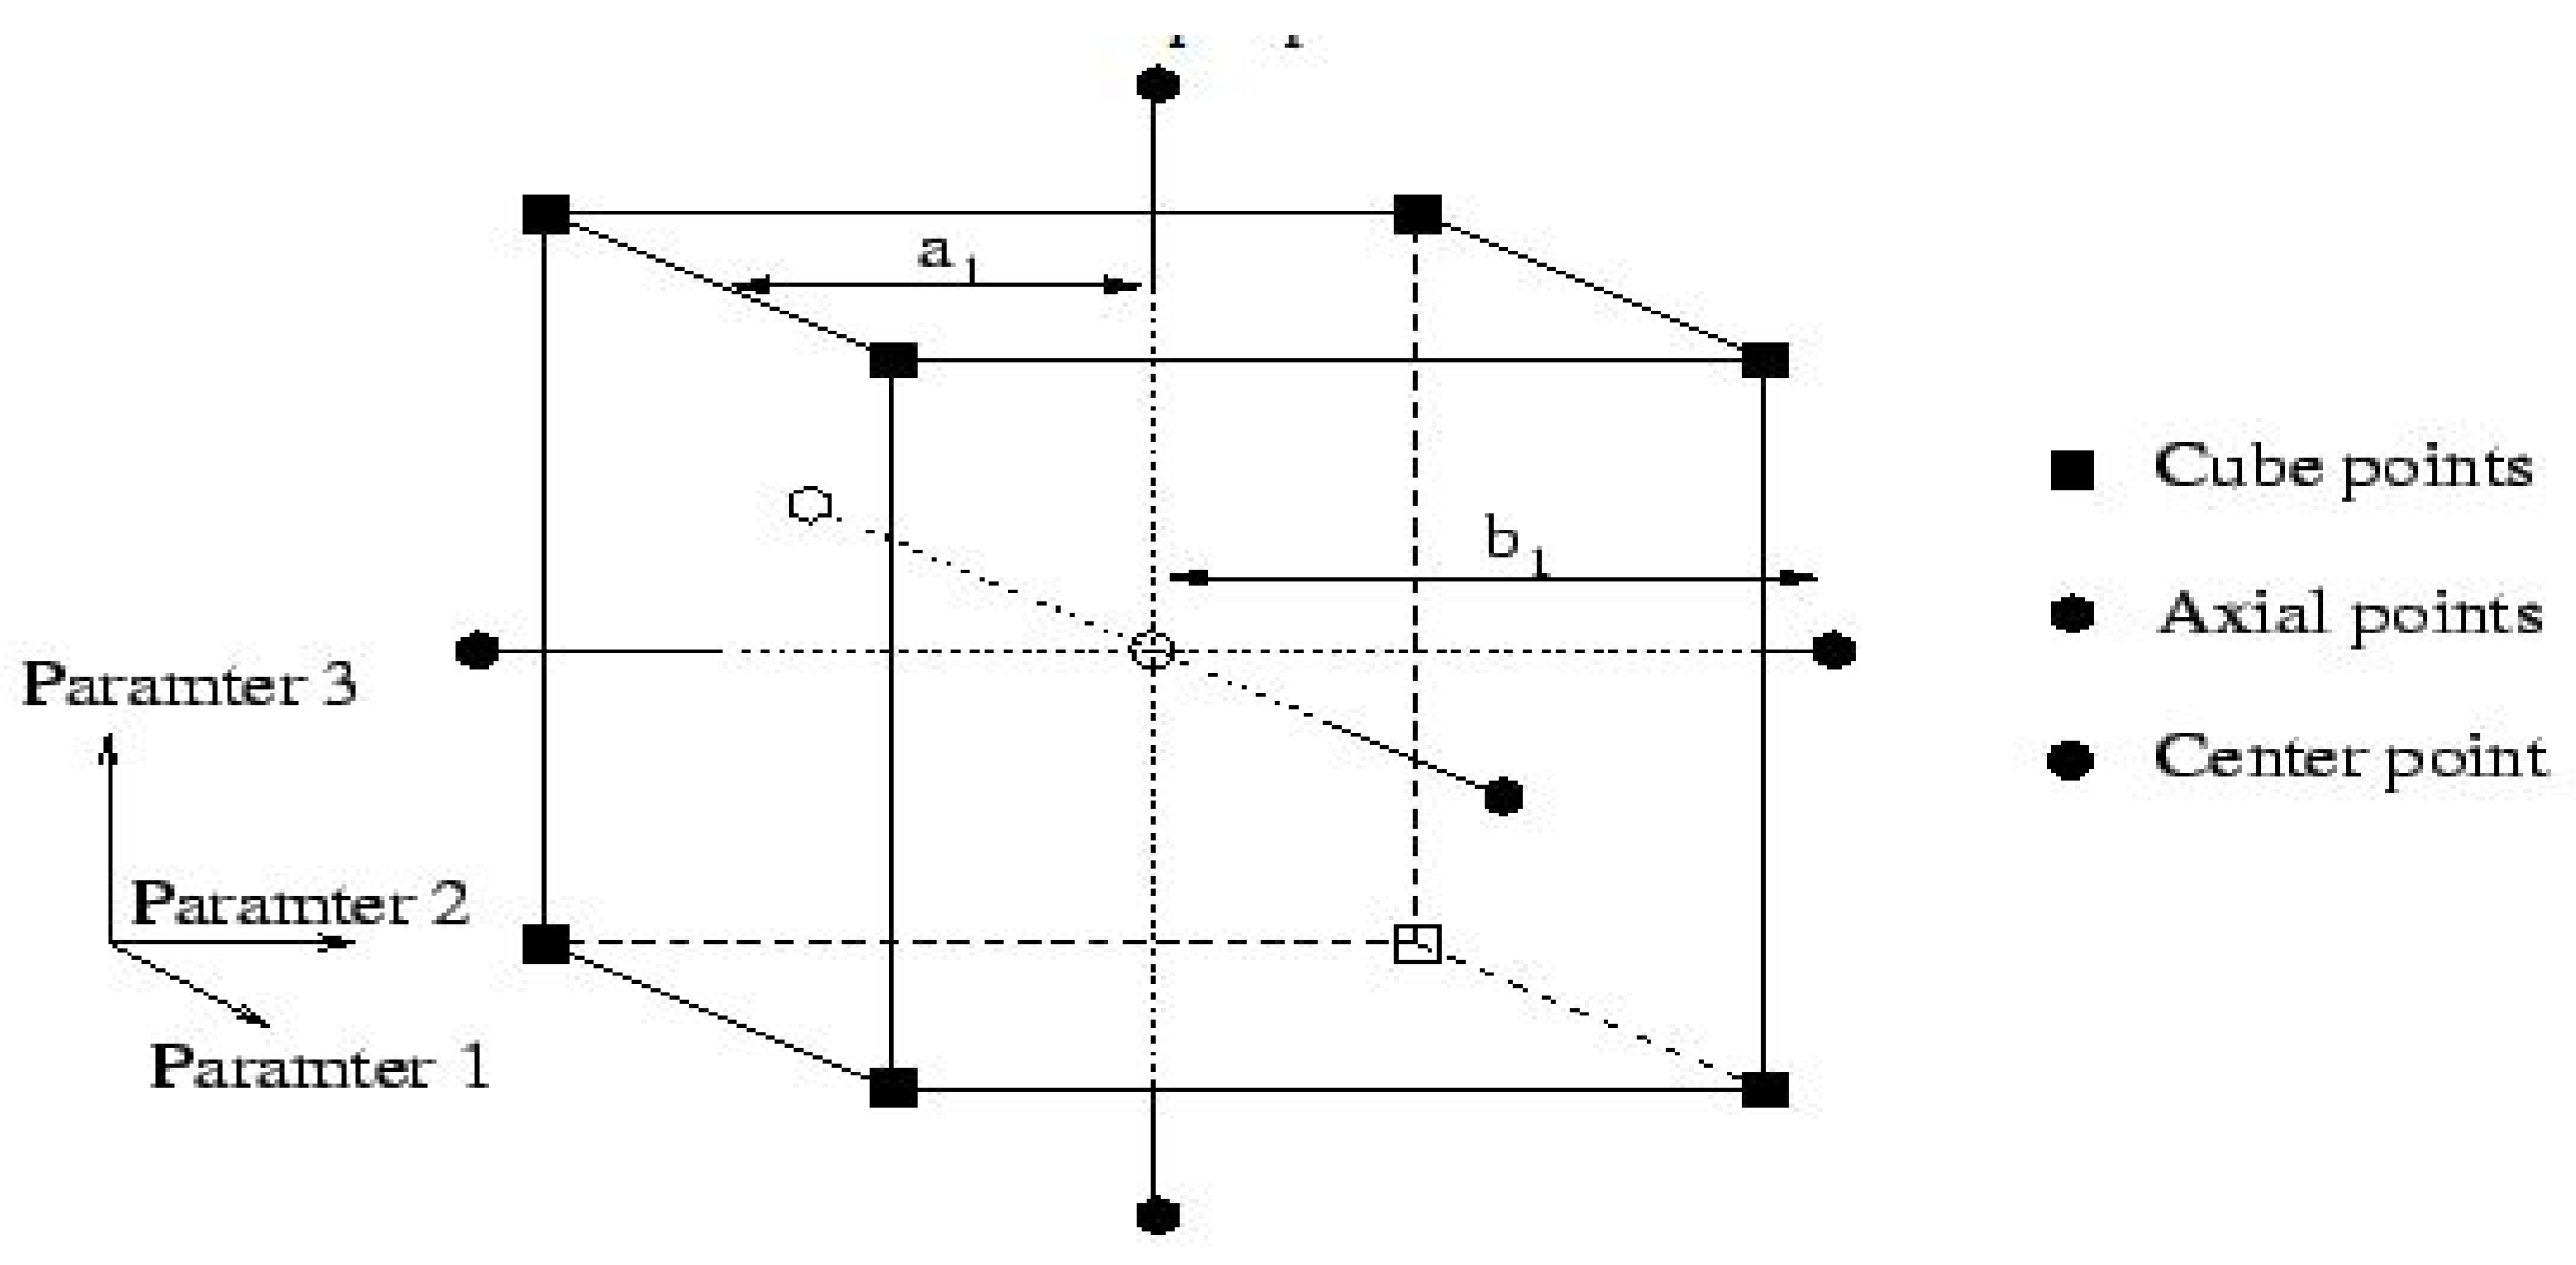
  29. Plasun, R. Central Composite Designs. Available online: https://www.iue.tuwien.ac.at/phd/plasun/node32.html (accessed on 10 January 2020).
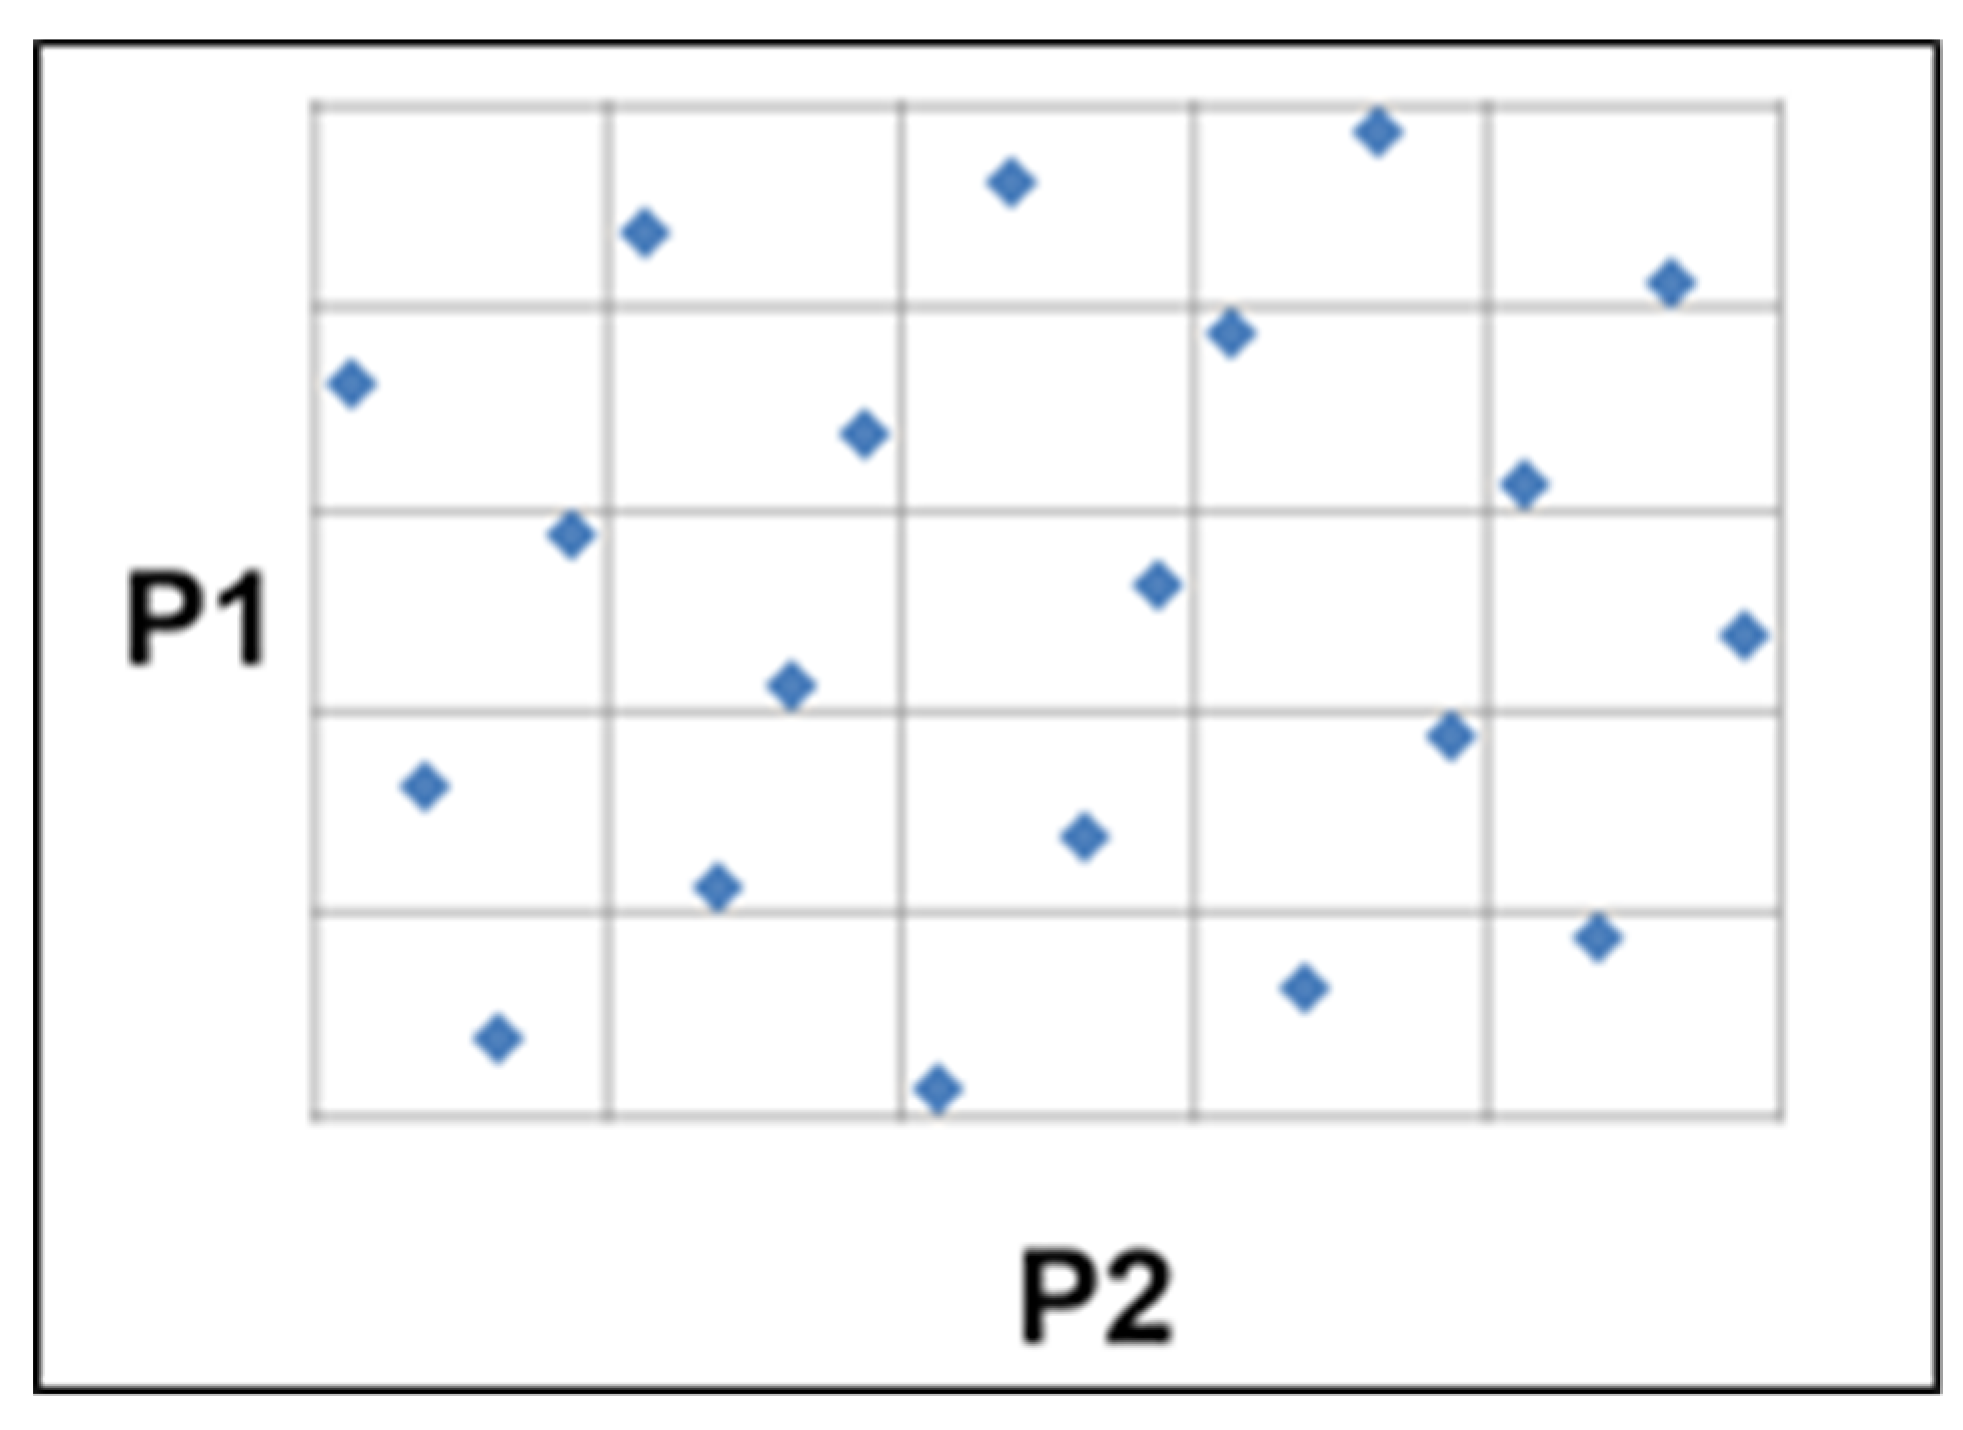
  30. Overview of Space-Filling Designs. 2018. Available online: https://www.datadvance.net/product/pseven-core/generic-tool-for-design-of-experiments/ (accessed on 20 February 2020).
  31. Optimization Process in ANSYS Workbench Software. Available online: https://www.mr-cfd.com/services/design-of-experiments-doe/ (accessed on 20 February 2020).
Figure 1. A ladder chassis frame (truck) view [6].
Processes 09 02028 g001
Figure 2. CAD model of chassis (axis origin is the front of vehicle).
Processes 09 02028 g002
Figure 3. Enlarged view of meshed model showing tetrahedral elements.
Processes 09 02028 g003
Figure 4. Meshed model of HMV chassis.
Processes 09 02028 g004
Figure 5. Loads and boundary conditions (Support Applied).
Processes 09 02028 g005
Figure 6. Loads and boundary conditions (Downward force).
Processes 09 02028 g006
Figure 7. Equivalent stress.
Processes 09 02028 g007
Figure 8. Deformation plot.
Processes 09 02028 g008
Figure 9. H6 dimension (cross member width) selected for optimization.
Processes 09 02028 g009
Figure 10. H12 dimension (cross member width) selected for optimization.
Processes 09 02028 g010
Figure 11. H14 dimension (cross member width) selected for optimization.
Processes 09 02028 g011
Figure 12. Dimensions of cross members.
Processes 09 02028 g012
Figure 13. The example points of a Central Composite Circumscribed design with three input parameters [29].
Processes 09 02028 g013
Figure 14. Optimal space filling design (OSF) [31].
Processes 09 02028 g014
Figure 15. Total deformation vs. design points (a) for CCD scheme, and (b) OSF design.
Processes 09 02028 g015
Figure 16. Equivalent stress vs. design points (a) for CCD scheme (b) for optimal space filling design.
Processes 09 02028 g016
Figure 17. Solid mass vs. design points (a) for CCD scheme (b) for optimal space filling design.
Processes 09 02028 g017
Figure 18. Response surface plot of equivalent stress vs. cross member 1 and cross member 2 (a) for CCD scheme, and (b) for optimal space filling (OSF) design.
Processes 09 02028 g018
Figure 19. Response surface plot of equivalent stress vs. cross member 2 and cross member 3 (a) for CCD scheme, and (b) for optimal space filling design.
Processes 09 02028 g019
Figure 20. Equivalent stress cross member 1 (a) for CCD scheme, and (b) for optimal space filling (OSF) design.
Processes 09 02028 g020
Figure 21. (a) Equivalent stress vs. cross member, (a) 3 in case of CCD scheme, and (b) 2 in case of optimal space filling design.
Processes 09 02028 g021
Figure 22. Three-dimensional response surface plot of solid mass (a) for CCD scheme (b) for optimal space filling design.
Processes 09 02028 g022
Figure 23. Solid mass vs. cross member 1 (a) for CCD scheme, and (b) for optimal space filling design.
Processes 09 02028 g023
Figure 24. Solid mass vs. cross member 3 (a) for CCD scheme, and (b) for optimal space filling design.
Processes 09 02028 g024
Figure 25. Sensitivity plot (a) for CCD scheme, and (b) for optimal space filling design.
Processes 09 02028 g025
Table 1. Specifications of TATA 1612 chassis [27].
Vehicle NameTATA 1612
Frame SectionC type (116 mm × 25 mm × 5 mm)
Front Overhang (a)740 mm
Rear Overhang (c)1400 mm
Wheel Base (b)6670 mm
Total Load acting on chassis257,022 N
Load acting on each beam128,511 N/Beam
Stress produced on the beam (σ)3297.422 N/mm2
Material of ChassisSt 52 E
Table 2. Lower bound and upper bound values of different variables.
Variable NameLower BoundUpper Bound
Cross Member 158.5 mm71.5 mm
Cross Member 258.5 mm71.5 mm
Cross Member 358.5 mm71.5 mm
Table 3. DOE table for CCD scheme.
ABCDEFG
1NameP5 - cross_member1 (mm)P6 - cross_member2 (mm)P7 - cross_member3 (mm)P3 - Equivalent Stress Max (MPa)P4 - Total Deformation Max (mm)P8 - Solid Mass (kg)
216565653280.49347.4546214.6414
3258.565653264.454347.8886209.9142
4371.565653520.136347.1296219.3685
546558.5653273.633347.7588209.9142
656571.5653527.463346.9958219.3685
76656558.53259.301343.9264209.9142
87656571.53220.32340.7808219.3685
9859.7152859.7152859.715283345.578341.9918203.1113
10970.2847259.7152859.715283433.409341.7593210.798
111059.7152870.2847259.715283439.451341.5502210.798
121170.2847270.2847259.715283313.501341.1359218.4847
131259.7152859.7152870.284723466.476342.1991210.798
141370.2847259.7152870.284723231.431341.758218.4847
151459.7152870.2847270.284723293.051341.7089218.4847
161570.2847270.2847270.284723464.079341.2692226.1714
Table 4. DOE table for optimal space filling (OSFF) design.
ABCDEFG
1NameP5 - cross_member1 (mm)P6 - cross_member2 (mm)P7 - cross_member3 (mm)P3 - Equivalent Stress Max (MPa)P4 - Total Deformation Max (mm)P8 - Solid Mass (kg)
2169.3333368.4666760.666673494.398345.0904217.1625
3263.2666769.3333359.83237.664341.5257212.7505
4359.866.7333368.466673352.964344.4751214.6414
5468.4666759.867.63498.669345.3408215.2717
6558.9333360.6666765.866673507.02347.0544207.7082
7671.0666763.2666763.266673348.538348.8975216.5322
8766.7333362.458.933333249.308342.5268209.5991
9870.265.8666769.333333320.901343.0932222.2048
10965.8666764.1333364.133333286.35348.261214.0111
11106567.671.066673469.519341.1595220.9442
121161.5333371.06667653478.07347.1521216.5322
131260.666676561.533333506.208351.4384208.9688
141364.1333358.9333362.43305.275350.4504207.7082
151467.670.266.733333475.766345.3902221.5745
161562.461.5333370.23236.134342.5801214.0111
Publisher’s Note: MDPI stays neutral with regard to jurisdictional claims in published maps and institutional affiliations.

