Abstract
The behaviour of a locally isolated diazotrophic consortium was investigated with the prospect of agricultural applications. A repeatable culture was obtained in a non-sterile bioreactor. Metagenomic analysis indicated Chryseobacterium ssp. and Flavobacterium ssp. were the dominant species, making up approximately 50% of the microbial community. The oxygen supply was varied and mass-transfer limited growth was attained under all experimental conditions. Negligible amounts of aqueous metabolites were formed, indicating a high selectivity towards biomass production. High oxygen availability resulted in decreased growth efficiencies i.e., the specific energy requirements for biomass synthesis. This was attributed to reduced electron transport chain efficiencies and nitrogenase protection mechanisms. Mass and energy balances indicated that sessile biomass with a high C:N served as a carbon sink. The most efficient growth was measured at an aeration feed composition of 21% oxygen and 79% nitrogen. The study presents one of the only known investigations of operational conditions on diazotrophic growth in a non-sterile bioreactor. In addition, it provides a strong foundation for the development of a Biological Nitrogen Fixation process with scaling potential.
1. Introduction
Population growth has been catalysed in the past decade by the rapid industrialisation of developing countries and technological advancements. A 200% population increase with reference to 2011 is predicted to take place by 2050 [1] . Due to this ever-expanding population, one of the main future challenges is food security [2]. To accommodate this surge in food demand, a concomitant exponential increase in food production—and therefore fertilizer usage—is required [3].
In the late nineteenth century, a similar rise in food demand occurred which necessitated industrialised nitrogen fixation. This led to the invention of nitrogen-fixing processes in the early twentieth century [4]; the Haber-Bosch process (Equation (1)) for synthetic nitrogen production became the most prevalent in modern agriculture. Currently, 450 million tonnes of nitrogen fertilizer are produced through this process each year [5]. The Haber-Bosch process has two major drawbacks. Firstly, the process is energy-intensive as it relies on fossil fuels (1–2% of world’s annual energy supply) [5]. At ambient temperatures, the Haber-Bosch process has a spontaneous standard Gibbs free energy change of −10.9 kJ/mol H. Unfortunately, at these conditions low productivities are observed due to slow reaction rates. Elevated temperatures, up to 773 K, result in faster reaction rates, but this is at a Gibbs free energy cost ( = 23.6 kJ/mol H at 773 K). Consequently, the process requires elevated pressures up to approximately 20 MPa [6] to maintain an exergonic Gibbs free energy change of −10 kJ/mol H at a temperature of 773 K [7].
The Haber-Bosch process has a significant negative impact on the environment due to greenhouse gas emissions resulting from these energy requirements [8]. Ammonia production is responsible for circa 1.6% of total global carbon-dioxide emissions [6]. Secondly, the addition of synthetic nitrogen to crops has led to leaching of nitrogen into groundwater, rivers, lakes, and estuarine zones. This has created an offset in hydrospheric nitrogen which results in phenomena such as aquatic biodiversity loss and eutrophication [9]. In addition, the release of nitrogen from synthetic fertilizers as nitrous oxides has a detrimental effect on the global climate due to its high global warming potential [9].
Prior to industrialisation, biological nitrogen fixation (BNF) was responsible for supplying 58 million tonnes of nitrogen per year [4]. BNF is the process in which nitrogenase-bearing prokaryotes reduce atmospheric nitrogen to more bio-available forms of nitrogen [10]. Many nitrogen-fixers form symbiotic relationships with plants by providing plants with nitrogen, while consuming plant exudates as their carbon-source [11]. In addition, these microbial communities release several plant-growth hormones, aid in nutrient cycling, and combat pathogens [9]. Non-symbiotic or free-living nitrogen fixers, referred to as diazotrophs, show much promise in aiding the development of sustainable agriculture [9].
Naturally occurring diazotrophs could be used for bio-fertilizer production as they significantly promote soil fertility and plant growth [9]. Bio-fertilizers are already in use, however, there is a need for improved formulations for commercialisation. Several desirable characteristics including: easily adjustable pH and nutrient addition, non-toxic, simple application, and biodegradable were described by Mahanty et al. [9]. Liquid bio-fertilizers from diazotrophic cultures could be the solution to this need. Utilizing diazotrophic cultures in broths would ensure a measurable and controllable process [9].
There is a need to reevaluate current agricultural practices and develop more sustainable approaches. Therefore, the development of a green, effective nitrogen-source which supports the natural nitrogen cycle and minimally disturbs the microbial community is essential. Bio-fertilizer production utilizing diazotrophs is a promising method of safeguarding future food supply, while minimizing or completely negating imbalances with the natural environment. To this end, the development of a process utilizing controlled bio-reactor environments is proposed. The use of a microbial consortium, instead of a pure culture, was identified as a suitable solution for agricultural application. Metabolic cooperation, increased biomass, and enhanced catalytic function are a few benefits previously identified in microbial consortia [12]. In addition, a non-sterile environment allows for the development of a robust culture, which is resilient to environmental changes. Table 1 maps out the main themes throughout literature relating to diazotrophs. The bibliometric data shows a disproportionately small amount of research focused on bioreactors and bio-fertilizers in parallel with diazotrophs.

Table 1.
Bibliometric data (4 July 2021).
BNF is highly energy-intensive for microbes with a theoretical cost of 16 ATP/N fixated and an even higher practical cost. Therefore, process conditions should be optimized to maintain a minimal energy requirement for nitrogen fixation. Due to the lack of literature on diazotrophic cultures in bioreactors, a need for diazotrophic behavioural studies in bioreactors was identified.
This study aimed to investigate the behaviour of a non-sterile diazotrophic consortium with the prospect of utilising their nitrogen-fixing ability in agricultural applications. The main objectives of the investigation were: to obtain a repeatable, non-sterile diazotrophic culture; to study the behaviour of the consortium under various aeration conditions; and to investigate their energy expenditure.
2. Materials and Methods
2.1. Materials and Reagents
A nitrogen-free, modified Burke’s medium was utilised during laboratory experiments. The medium consisted of the following: 1 g/L KHPO·7HO, 0.2 g/L MgSO·7HO, 0.1 g/L CaCl·2HO, 0.00145 g/L FeSO·7HO, 0.0002 g/L NaMoO·2HO, 0.05 g/L KOH, and 5 g/L glucose. The pH was controlled through the addition of a 1 M NaOH solution. All chemicals were purchased from Merck (Midrand, South-Africa). The aeration feed was made up of varying ratios of oxygen (99.5%) and nitrogen gas (99.5%). Gasses were purchased from Afrox (Pretoria, South-Africa).
2.2. Equipment
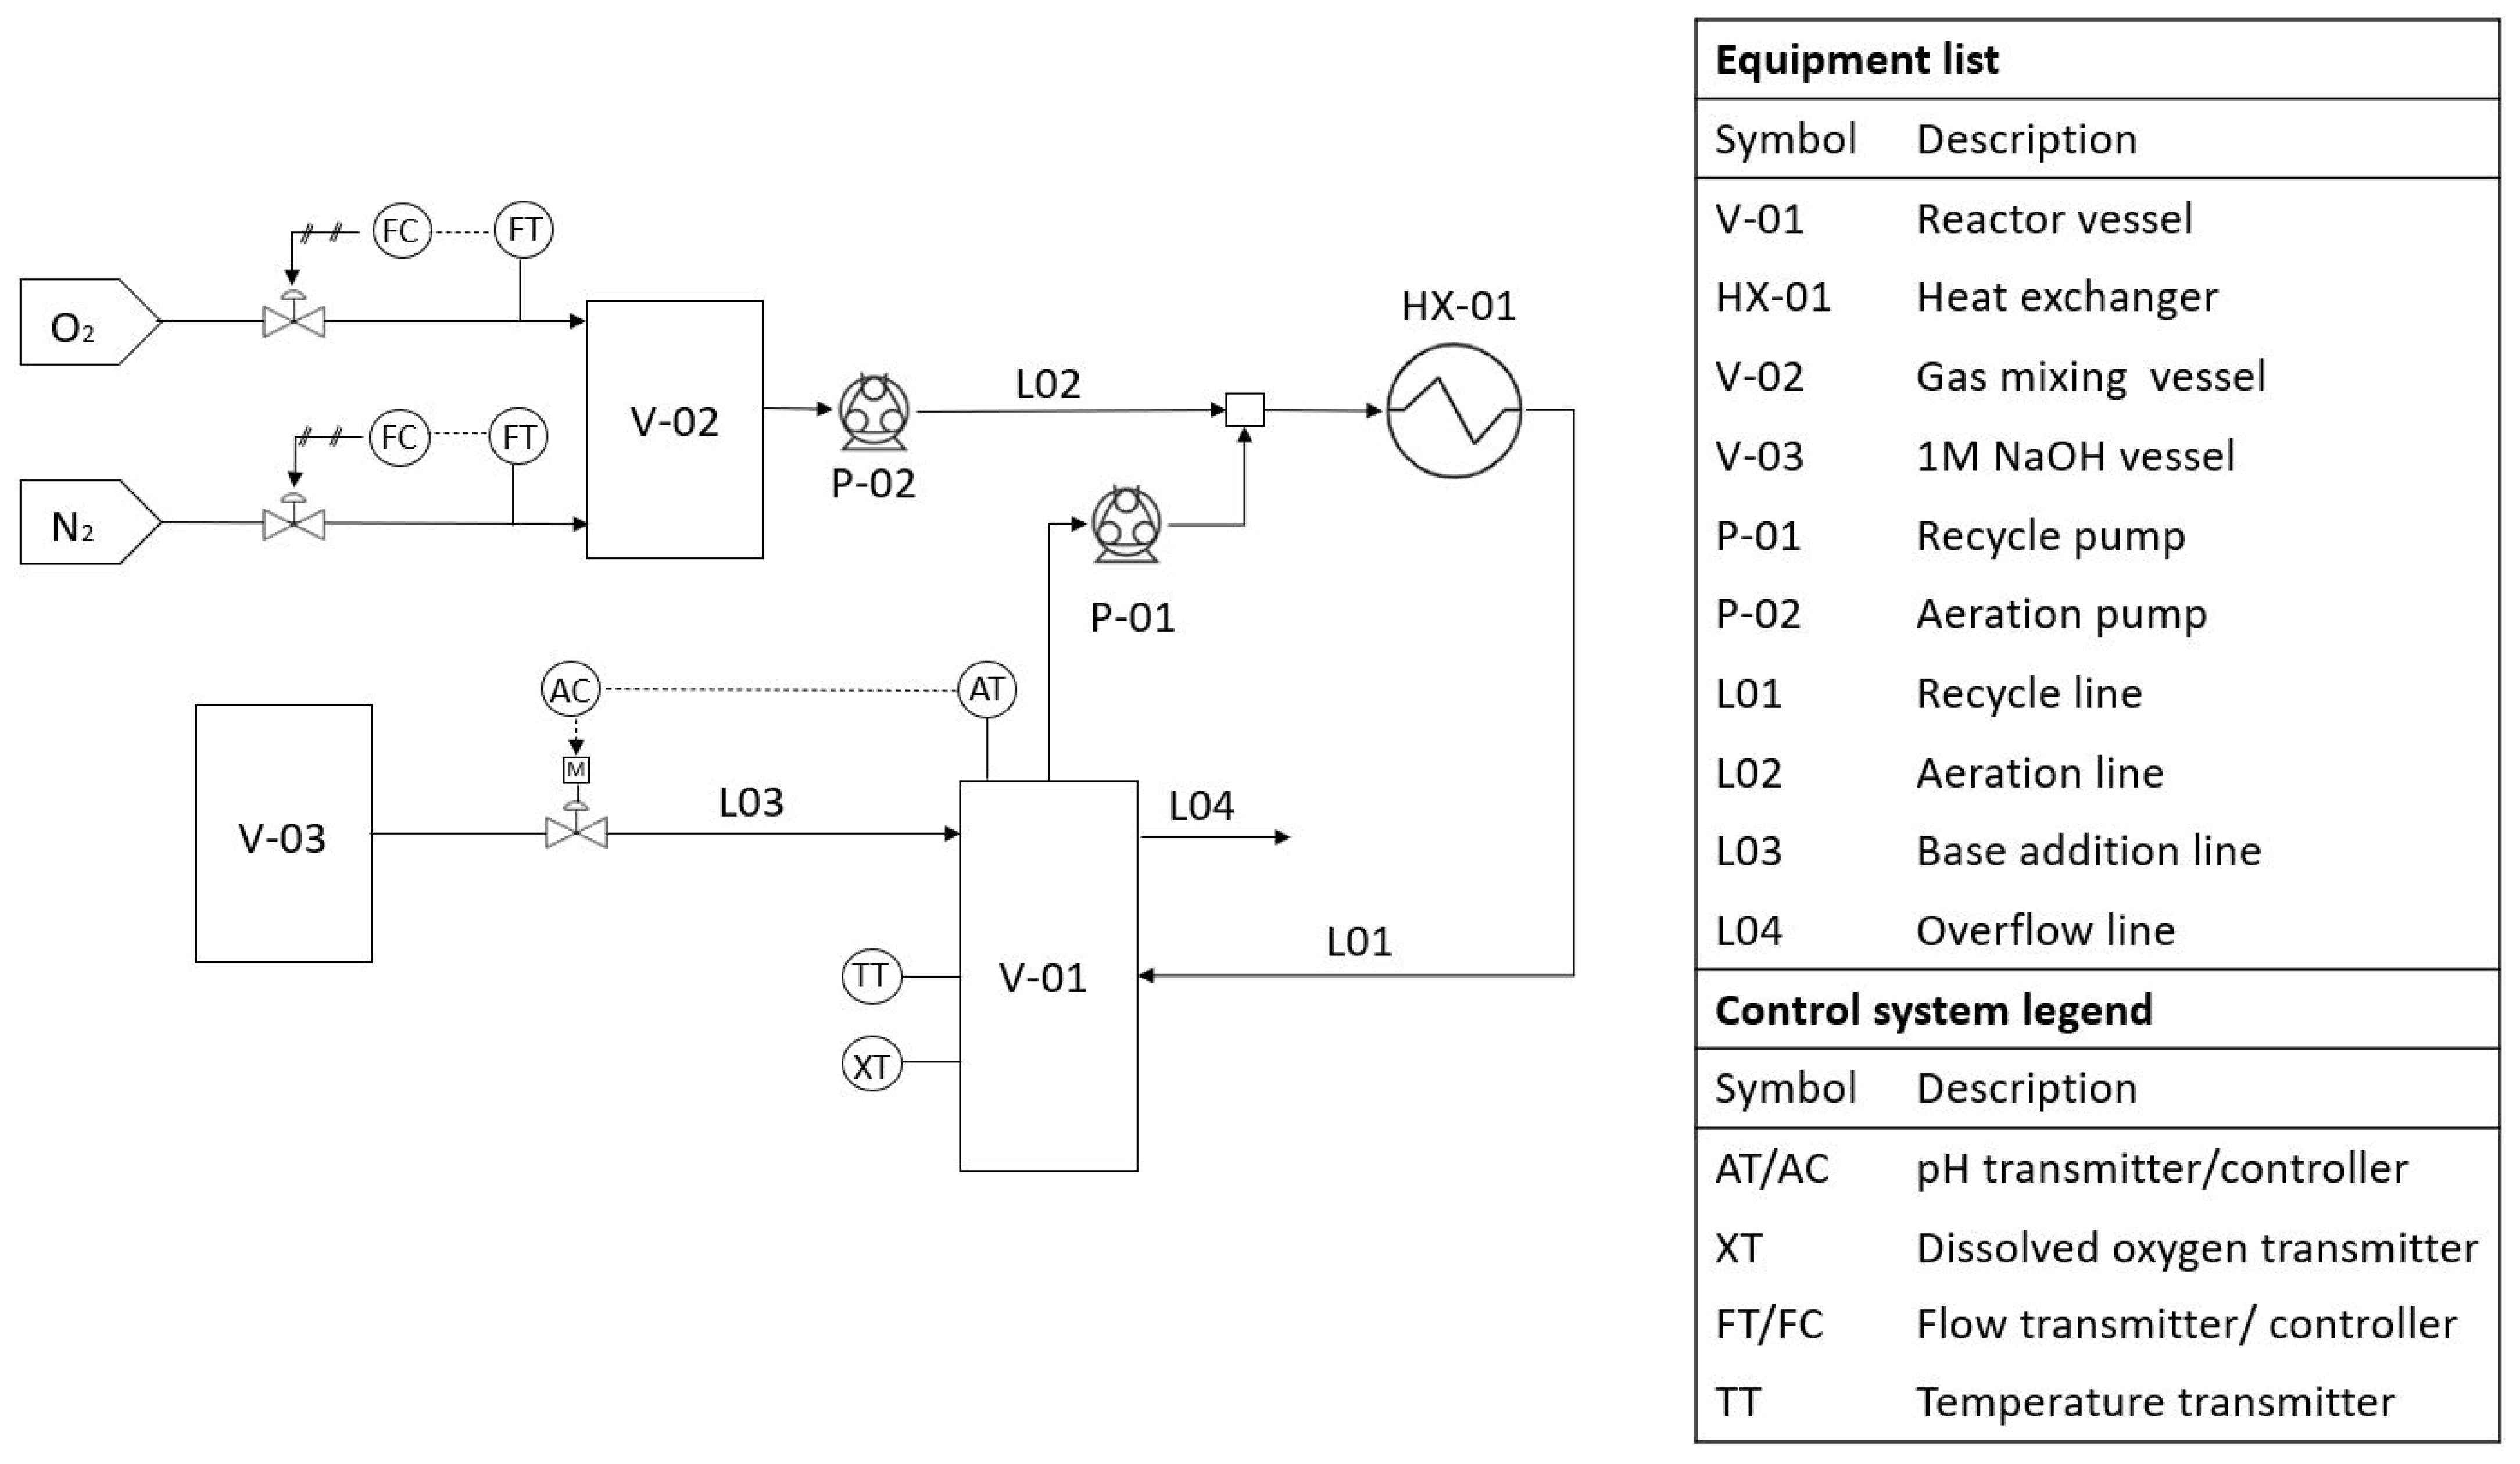
All experiments were conducted in a bench-scale bioreactor (Figure 1) with a volume of ±300 mL. The bioreactor was continuously mixed by a magnetic stirrer at 105 rpm. A recycle line with a total volume of ±100 mL was also implemented, which was utilized for aeration. The aeration gas composition was controlled by Brooks mass flow regulators where nitrogen and oxygen were fed at the desired composition to a 2 L holding vessel to ensure complete mixing. The aeration gas from the holding vessel was injected into the recycle line by a peristaltic pump, which produced a Taylor bubble flow for improved gas-to-liquid mass transfer. The recycle line also served as part of a heat exchanger as approximately 90% of the recycle line (ID 3 mm) was submerged in a 5 L bottle of water that was heated by a heating plate. The temperature of the water was maintained at 2 C above the desired reactor temperature to account for heat losses. An Endress+Hauser Memosens COS81D oxygen sensor (Johannesburg, South-Africa) was utilised to read and log dissolved oxygen and to indicate the temperature inside the reactor. The pH was controlled through proportional control. A DFRobot pH-sensor was utilized in conjunction with a peristaltic pump for base addition. An overflow system was used for level control.

Figure 1.
Diagram of the laboratory-scale reactor setup.
2.3. Experimental Methods and Analyses
2.3.1. Inoculum Procurement and Development
A soil sample from N-lean soil at 10 mm depth (coordinates: 25.75361° S, 28.229721° E) was obtained. To extract microorganisms, the soil sample was suspended in distilled water. The distilled water containing the soil particles was agitated by mixing the particles thoroughly with a spatula and manually swirling the solutions. Thereafter, the particles were allowed to settle and the supernatant was decanted. This was used as an initial inoculum. The bioreactor and adjacent lab space was disinfected using surfactants, distilled water, ethanol, and Virkon prior to each run to minimize the microbes present in the bioreactor space. The system was intentionally not autoclaved as the focus of the study was to develop a robust system able to perform under non-sterile operational conditions. The inoculum was cultured in a 1.5 L vessel at a pH of 6.8 and 25 C. Aeration with atmospheric air was supplied to prevent fermentation products. The inoculum was cultured until the glucose ran out. Then, 10 mL of the culture was placed in fresh medium and left to grow. This was repeated several times. After several runs, a natural selection had occurred as the microbial behaviour became relatively repeatable based on measured concentration profiles: suspended biomass, byproducts, and glucose concentrations. The resulting solution was stored in 10 mL vials. One vial was utilized as inoculum for each experimental run.
2.3.2. Mass-Transfer Experiments
To determine the volumetric mass transfer coefficient of the aeration in the recycle line, a mass-transfer experiment was completed in triplicate at 30 C. First, the system was purged with nitrogen and allowed to reach a low dissolved oxygen level (<2 mg/L). Then, the aeration pump (10 rpm) was turned on to replenish the system with oxygen, the dissolved oxygen was recorded until the saturated dissolved oxygen concentration was approached. The experiment was done utilizing atmospheric air to increase the oxygen concentration. The volumetric mass transfer coefficient (kla) in s was obtained by utilizing Equation (2), where t is the time in s, DO is the dissolved oxygen measured in mg/L, and DO is the saturated dissolved oxygen in mg/L.
2.3.3. Experimental Conditions
The experimental conditions were set at 30 C, ambient pressure and a pH of 6.8. These conditions were selected as they were most commonly used in literature [13,14,15,16]. The reactor was covered to be completely dark, in order to prevent algal growth. To investigate the effect of varying aeration feed compositions, three different compositions were tested: oxygen-rich, atmospheric air, and oxygen-poor. Each condition was tested in triplicate to confirm repeatability. The oxygen-rich feed (35% oxygen, 65% nitrogen) was labelled O_35, whereas the oxygen-poor feed (7% oxygen, 93% nitrogen) was labelled O_7 to reflect their respective oxygen concentrations. The atmospheric air (21% oxygen, 79% nitrogen) feed was labelled O_21. The oxygen-rich and oxygen-poor compositions were chosen such that they lay equal distances (14 percentage point) away from the atmospheric air condition and consequently the change in oxygen% compared to 21% oxygen or ( of 21%) would be sufficiently different to ensure marked differences in the operational conditions.
2.3.4. Sample Analysis
Samples were taken periodically and in duplicate. Absorbance readings were done using 3 mL cuvettes at a wavelength of 660 nm in a spectrometer (±0.0001) (Agilent Technologies, Johannesburg, South-Africa—Cary 60 UV-Vis). The absorbance readings were related to dry-cell weight (DCW) through the following procedure: an empty sample vile was weighed after remaining in an oven at 60 C overnight to allow evaporation of any liquids; the culture samples were placed in the vile; the samples were centrifuged and washed three times; then the samples were dried overnight at 60 C; the viles with sample were weighed. The difference between the two measurements was taken to determine the mass of the biomass. This was related to the sample absorbance reading. The carbon-compound and acid concentrations were measured in the high-pressure liquid chromatography (HPLC) (±0.00001 g/L) (Agilent Technologies—1260 Infinity). Before analysis, samples were centrifuged in an Eppendorf MiniSpin 5425 for 90 s at 120 rpm. After that, they were filtered (0.45 m). To determine ammonia concentrations, Ammonia test kits (Spectroquant, Merck, South-Africa) were utilised. The samples were prepared as per suppliers manual and the resulting solution was analysed in the spectrometer at 690 nm (Agilent Technologies, Johannesburg, South-Africa—Cary 60 UV-Vis).
2.3.5. C:N Determination
The total nitrogen was determined at the end of each run. A DMP Spectroquant total nitrogen test kit (Spectroquant, Merck, South-Africa) was used which determined the total nitrogen based on the sum of total Kjehldahl nitrogen, nitrate, and nitrite [17]. Samples were prepared as per supplier’s instruction (Spectroquant, Merck, South-Africa) which included digestion (analogous to method EN ISO 11905-1) [17] of biomass-containing samples at 120 C for 1 h. An absorbance reading at 340 nm was taken to determine the total nitrogen present in the samples (analogous to method DIN 38405-9) [17] . This was done for filtered and unfiltered samples. The difference in readings was indicative of the nitrogen content of the suspended biomass.
Samples were taken at the end of each run for the total organic carbon analysis. The samples were centrifuged at 2500 rpm for 5 min and filtered (45 m) and then diluted to 30 mL solutions. The solutions were analyzed on a Total Organic Carbon Analyzer (Shimadzu, Kyoto, Japan). The TOC-V (liquid samples) setting was used to determine the non-purgeable organic carbon. Nitrogen was used as a carrier gas and sodium persulfate and phosphoric acid were used as oxidizers.
2.3.6. ngDNA Sequencing
Next-generation DNA sequencing was outsourced to Inqaba Biotec (Pretoria, South-Africa). A metagenomic analysis of full length 16 s gene amplicons was performed on a sample from each experimental condition. A two-step PCR was performed on each sample and 16S (forward and reverse) primers (27F and 1492R) tailed with PacBio universal sequences were used [18]. To process raw subreads the Circular Consensus Sequences (CCS) algorithm accessible through the software SMRTlink (v9.0) was utilized to produce highly accurate reads (>QV40).
2.3.7. Statistical Analysis
To quantify the repeatability of experimental runs under a specific condition, standard deviations () were calculated according to Equation (3), where Xm is the mean, Xi is the value of the data point, and n is the number of data points.
In addition, the relative standard deviation (RSD) for each data point was calculated using Equation (4), where M signifies the mean.
To quantify the similarity of the culture compositions, the Bary-Curtis dissimilarity index (BC) was calculated. The BC is a number between 0 and 1, where 0 signifies that the data sets were identical and 1 signifies there was no overlap. Equation (5) was used to compute the BC, where A and B are the sum of frequencies for the two data sets and where W is sum of minimum frequencies among the data sets [19].
3. Results and Discussion
3.1. Diazotrophic Growth
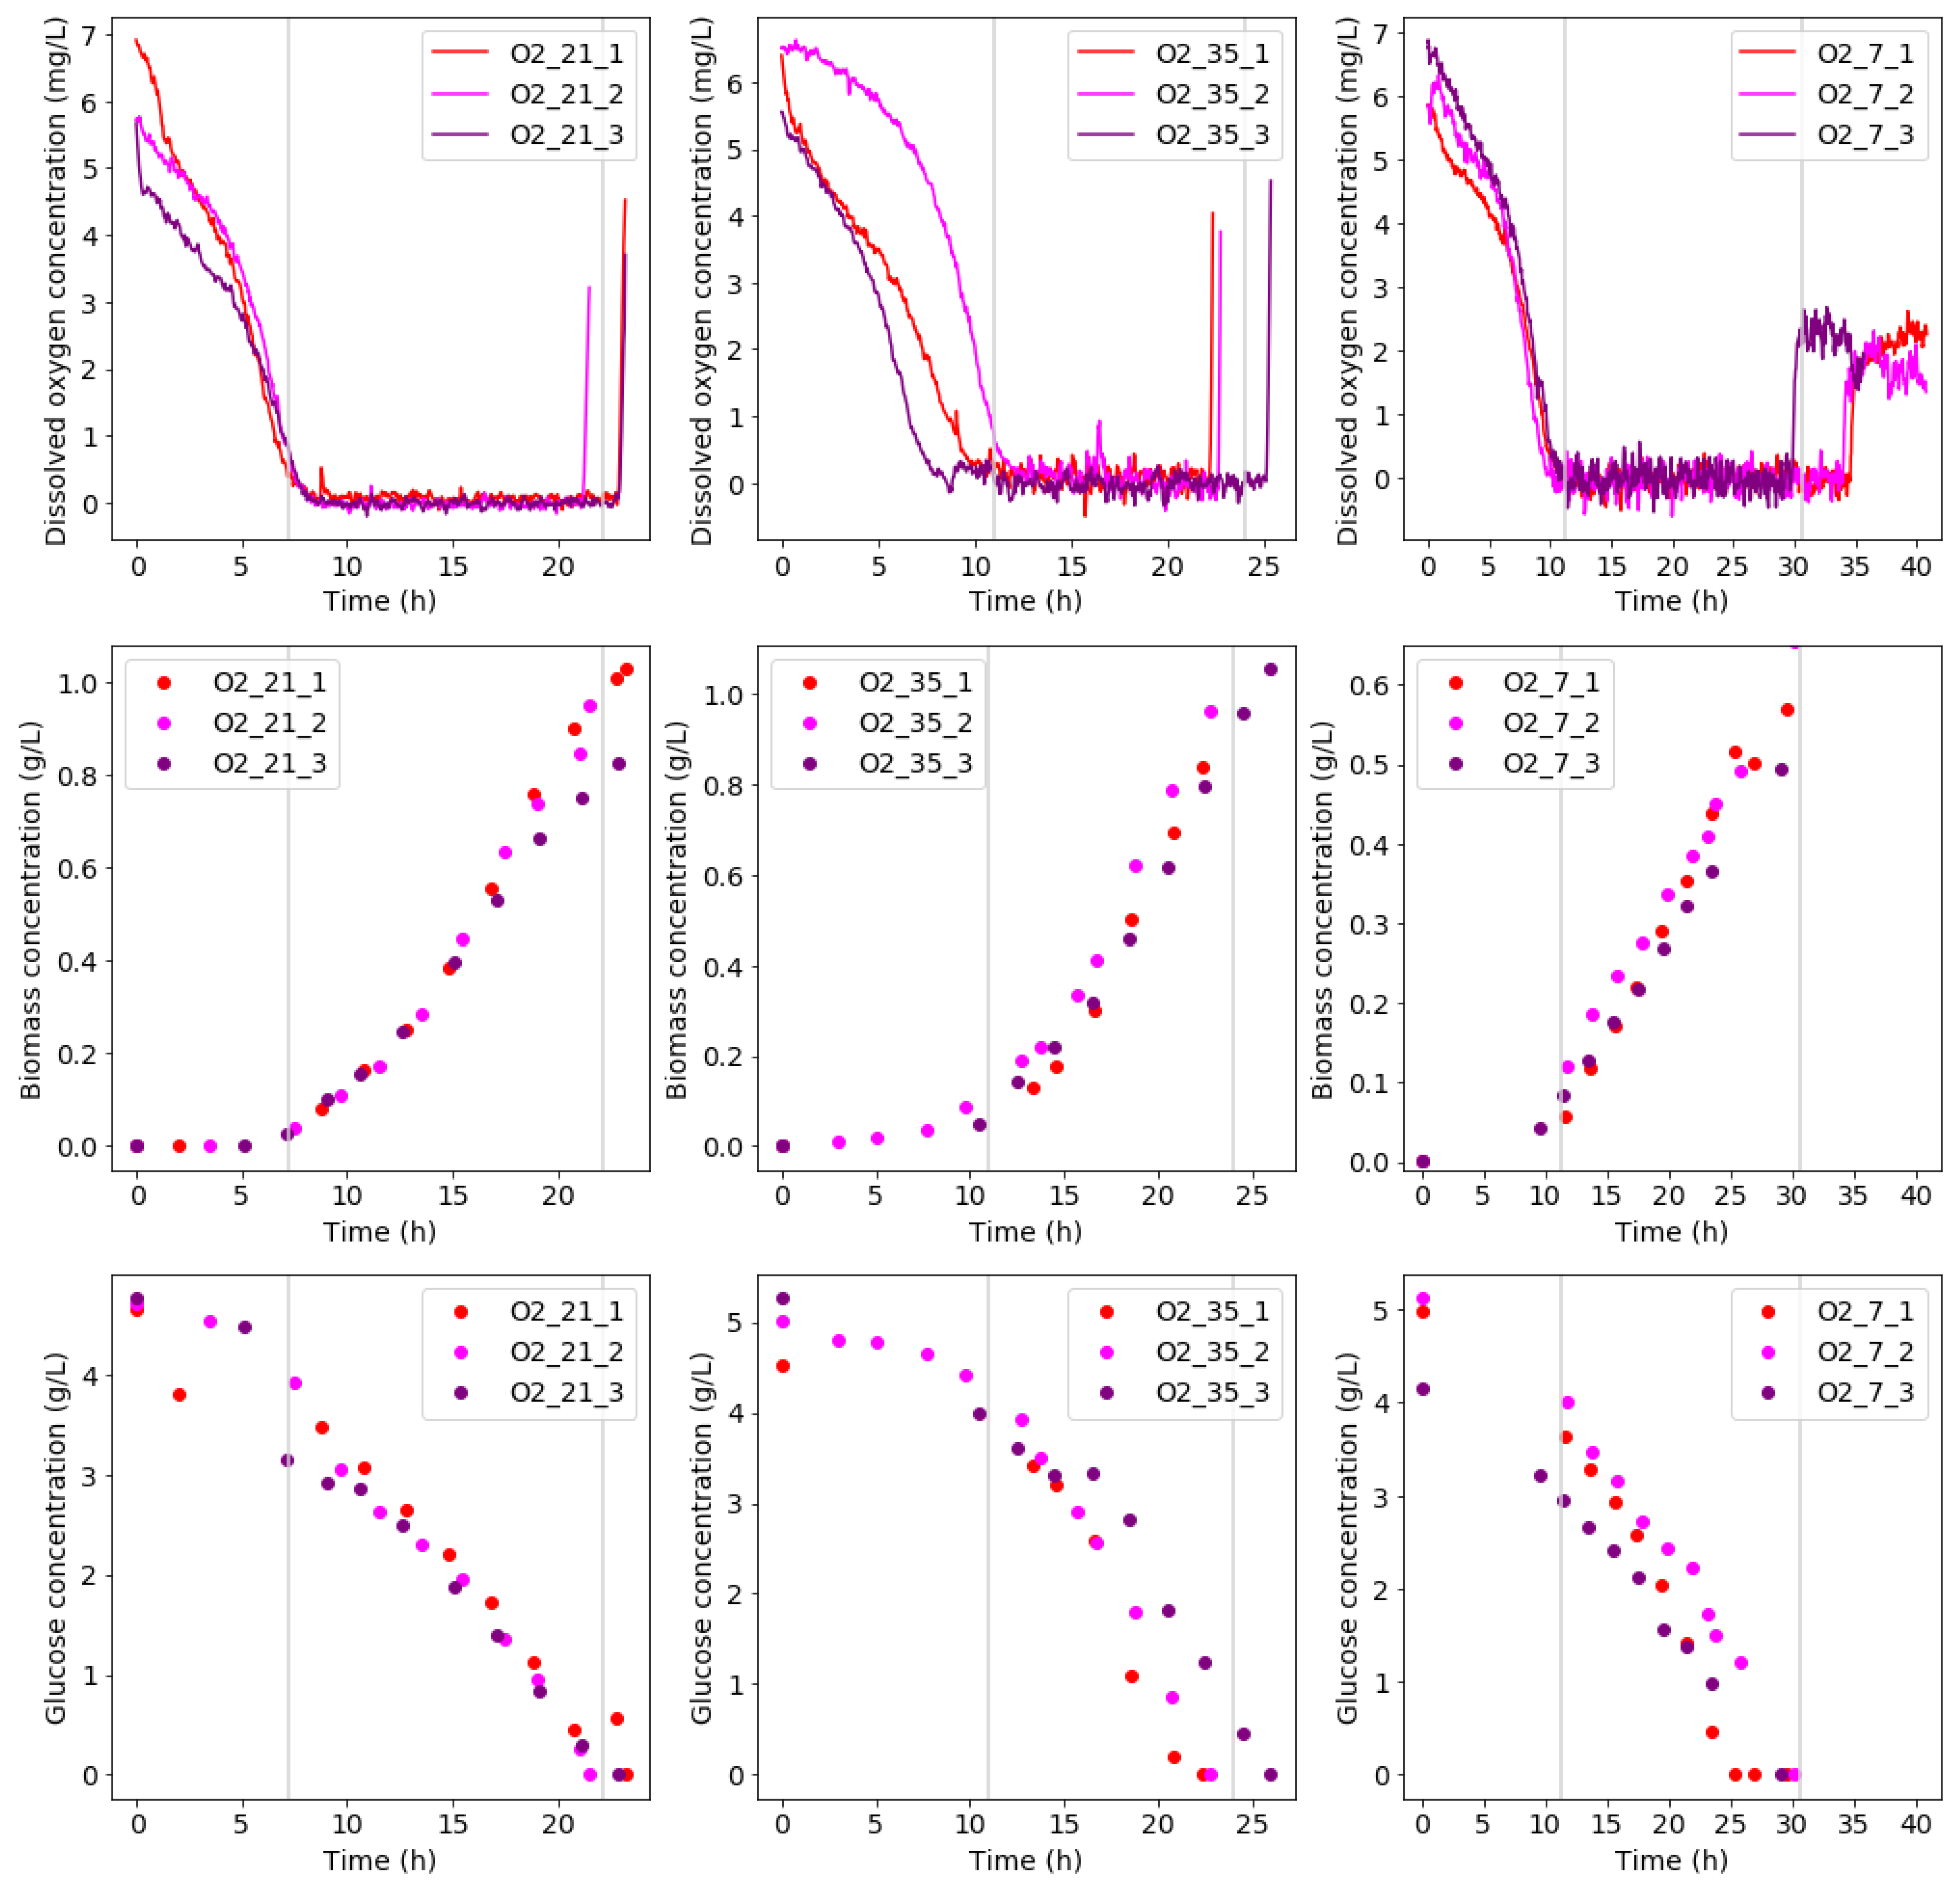
One of the objectives of this study was to obtain a repeatable culture in a non-sterile environment. As seen in Figure 2, good repeatability among experimental runs at the same condition was observed from a bio-reactor performance point of view. This was confirmed by the average RSD of the growth curve data. The average RSD values were calculated as 15.7%, 8.1%, and 12.9% for O2_21, O2_35, and O2_7, respectively. It should be noted that the biomass concentration profiles presented were based on suspended biomass measurements.
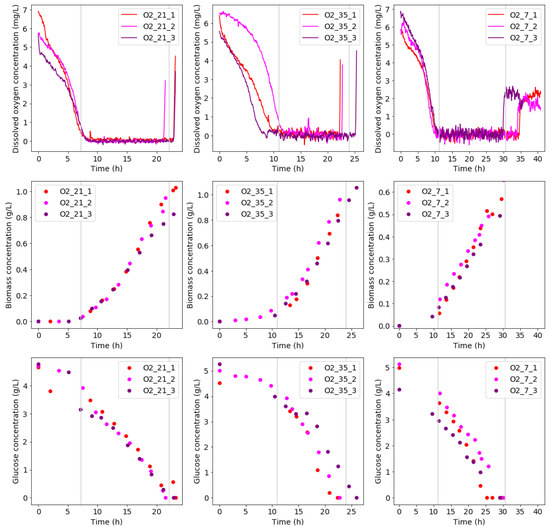
Figure 2.
The concentration profiles for runs at various aeration feed conditions (O_21, O_35, and O_7) are shown. The dissolved oxygen profiles for each condition are shown in the top row. The middle row shows biomass concentrations, whereas the bottom row shows glucose concentrations.
The biomass concentration profiles during all three conditions indicate that different growth-regimes occurred. The different growth-regimes coincide with the trends in the dissolved oxygen profiles. An initial lag phase is present to establish the culture, where the dissolved oxygen is high as there is a low oxygen demand. In this phase, little to no growth is observed. This phase is followed by a two-part growth phase. Initially, exponential growth is observed. At this stage, an exponential decrease in dissolved oxygen occurs, while the biomass is increased. This is followed by mass-transfer limited growth at low dissolved oxygen concentrations. This is visible in the biomass concentration from its straight line trends, indicating a constant growth rate. After this, a slight bend in the biomass concentration profile indicates glucose nears depletion. Once all the glucose is consumed, growth terminates and a sudden increase dissolved oxygen is observed as the oxygen demand reduces drastically.
The glucose concentration profiles corresponded well to the biomass concentration profiles. A significantly shorter lag phase was observed, however, which was followed by an exponential decrease in glucose. The initial glucose consumption only reflected in the microbial growth profiles after delay, likely due to biofilm formation. Biofilm formation in diazotrophs forms part of their oxygen-stress response [20]. Since oxygen-stress is high at the start of the experimental runs, the initiation of rapid biofilm formation would protect the consortium and increase its survival chance afterwards. As the mass-transfer limited growth is reached, a straight line trend is present in the glucose profiles. This indicates a constant glucose consumption rate. The ratio between glucose uptake rates at condition O_35 and O_21 was 1.50 ± 0.10 (mean ± ) (), whereas the ratio of growth rates between the two conditions was 1.12 ± 0.09 (). This shows that condition O_35 was less efficient in glucose consumption compared to condition O_21. For condition O_7 and O_21, a glucose consumption ratio of 1.29 ± 0.18 () was calculated, whereas the corresponding ratio of growth rates was 2.71 ± 0.34 (). This indicates condition O_21 utilized significantly more glucose towards biomass formation than condition O_7. The lower efficiency at condition O_7 could be attributed to a less efficient metabolism.
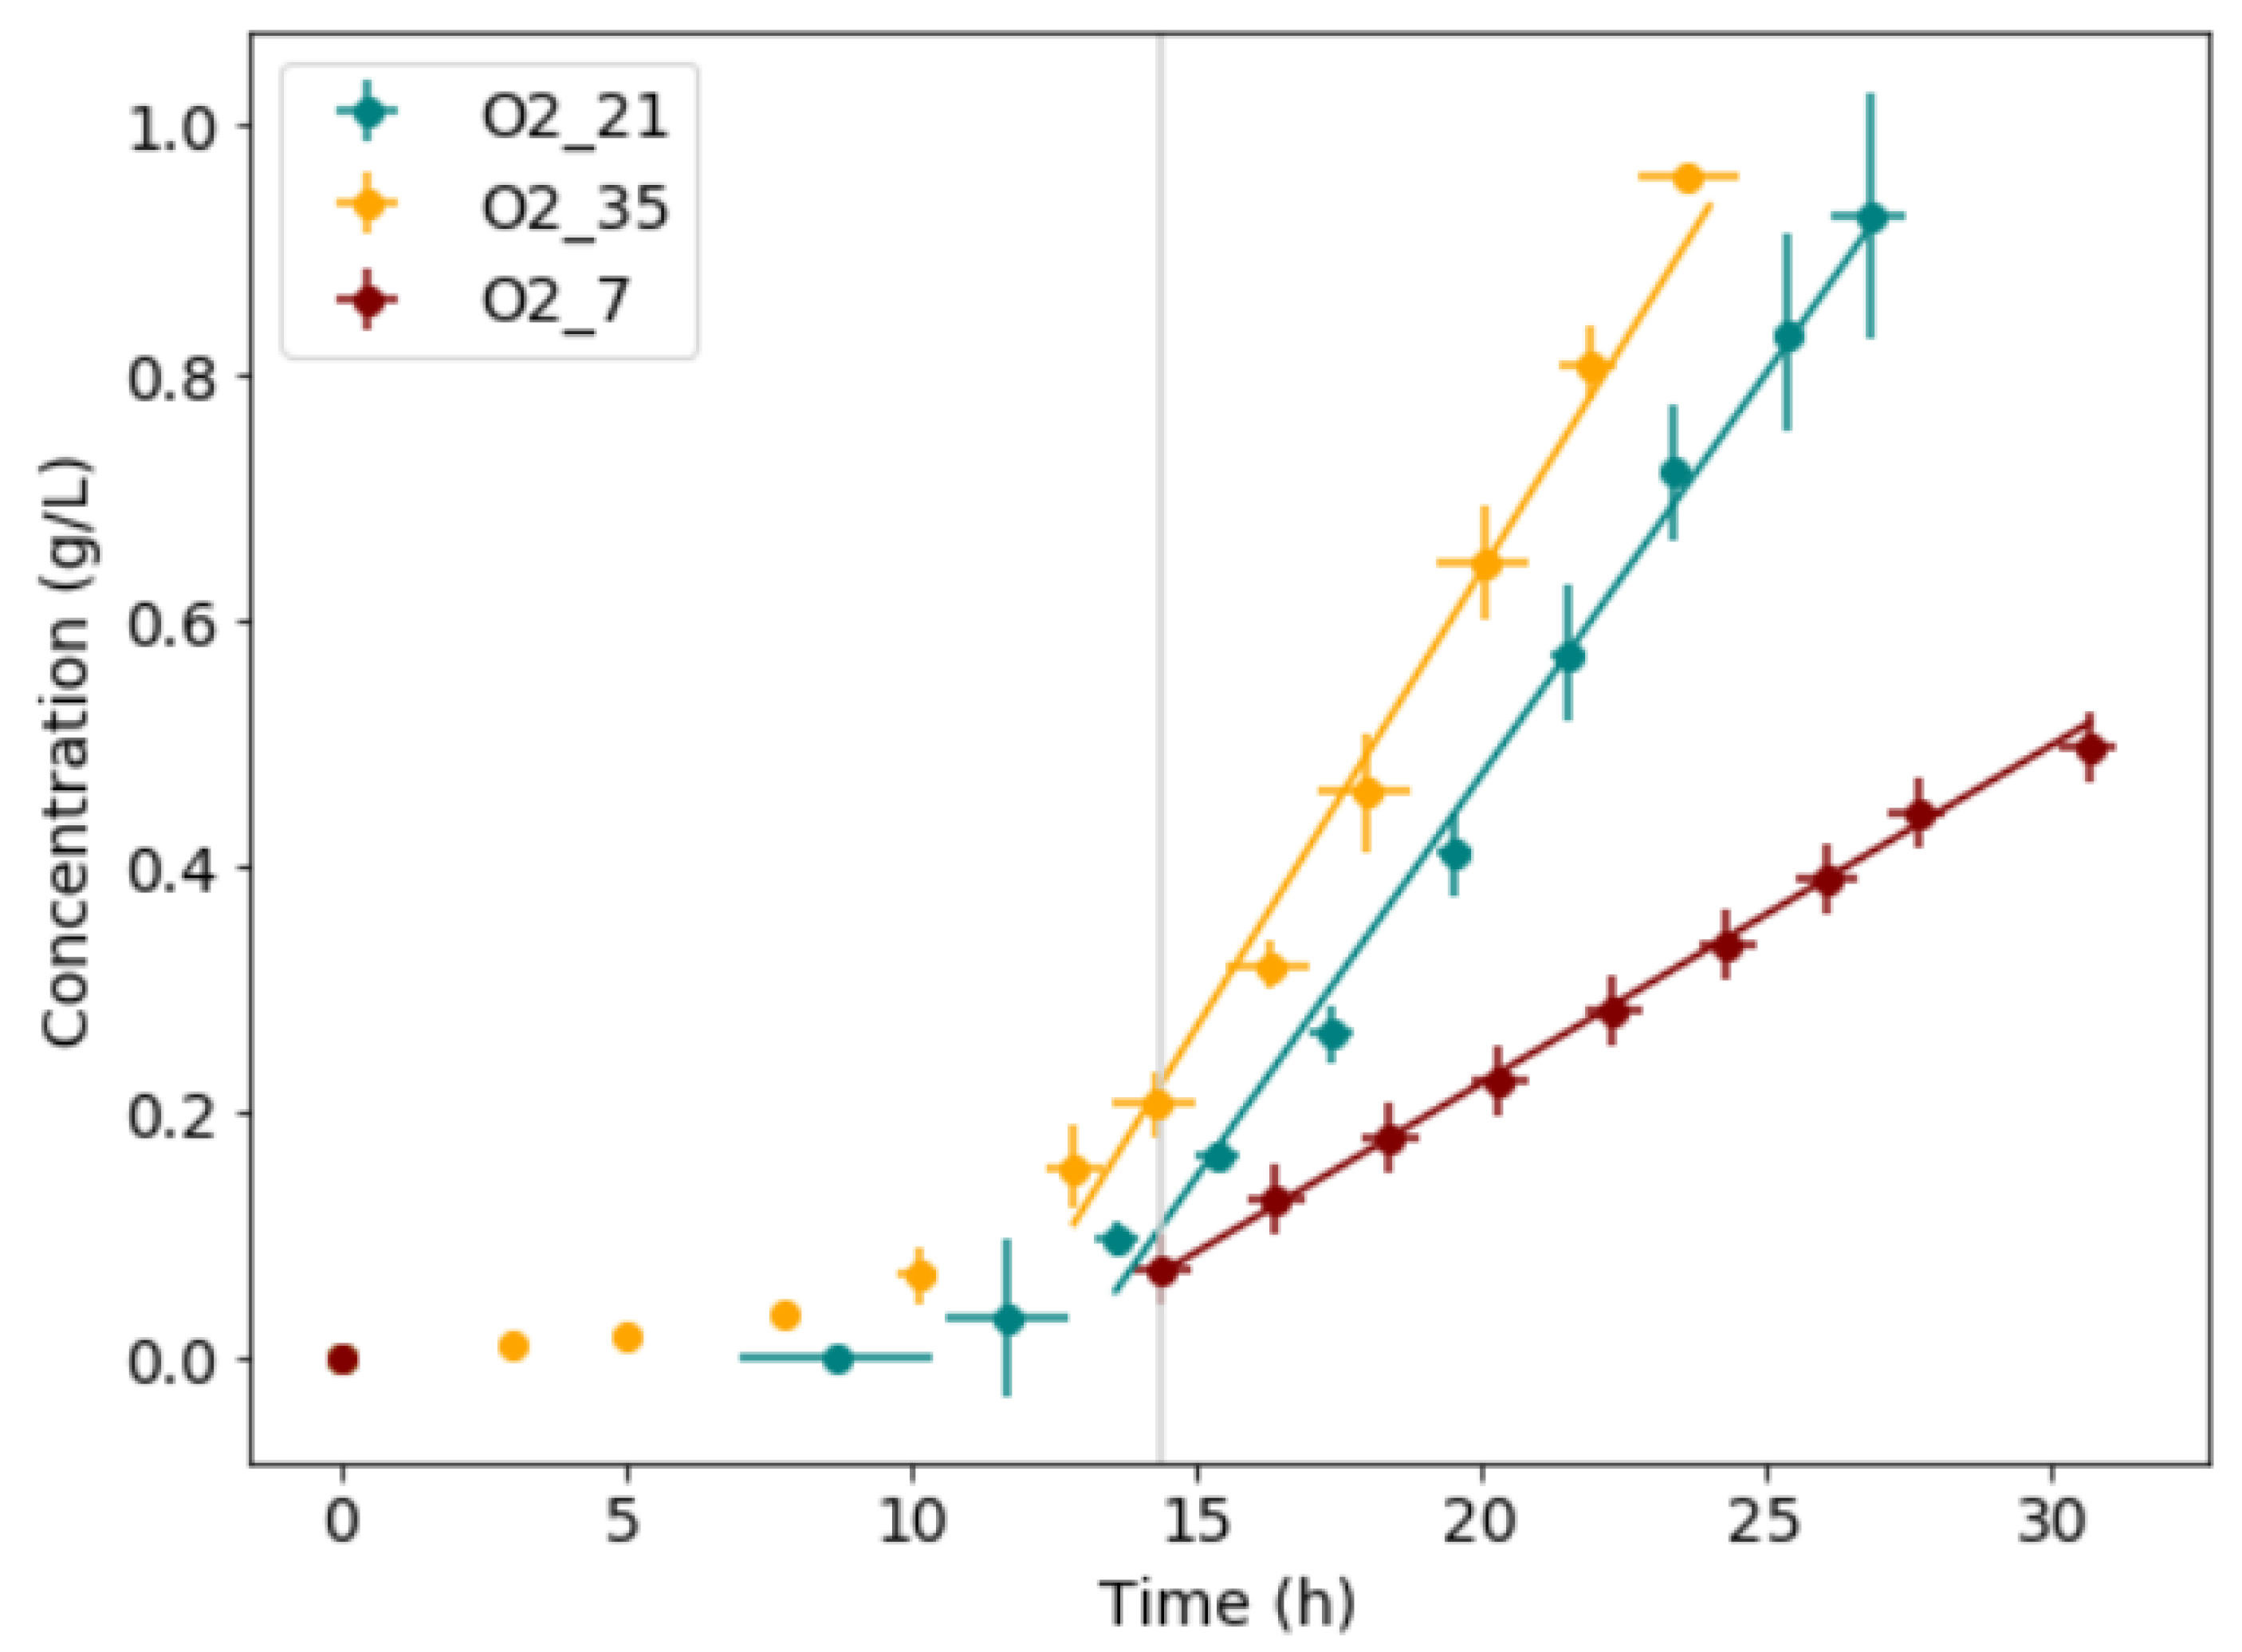
The yield of biomass produced to glucose consumed, biomass productivity, mass-transfer limited growth rate, and glucose consumption rate for each condition are shown in Table 2. When comparing the results at each condition, significant changes in growth rate, and glucose consumption rate were observed in the mass-transfer limited growth regime as a direct effect of the variation in oxygen supply. The change in growth rate is, however, not proportional to the change in oxygen supply. This is likely due to a change in energy requirement and biofilm formation. The data from all experimental runs for each condition was averaged in the x- and y-direction and compared as shown in Figure 3; the error bars show the standard deviations in both x- and y-directions. From the averaged data, a clear variation in slope for each condition was observed.
Table 2.
The effect of aeration feed composition on yield, productivity, growth rate, and glucose consumption rate. The standard deviation was calculated for each slope and shown in the slope data.
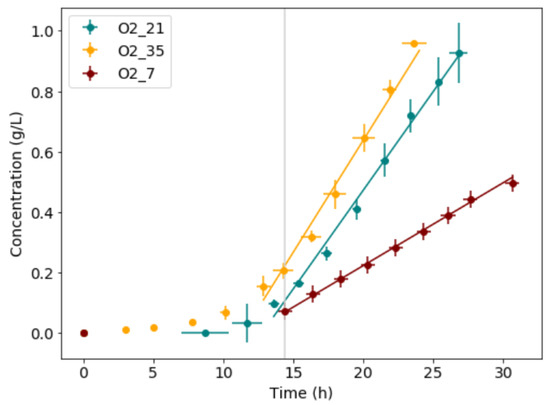
Figure 3.
The microbial growth data for all experimental runs was averaged in x- and y-direction. Time-shifted to start their mass-transfer limited growth at the same point in time (vertical line). The error bars show the standard deviations in the results from the triplicate repeat runs.
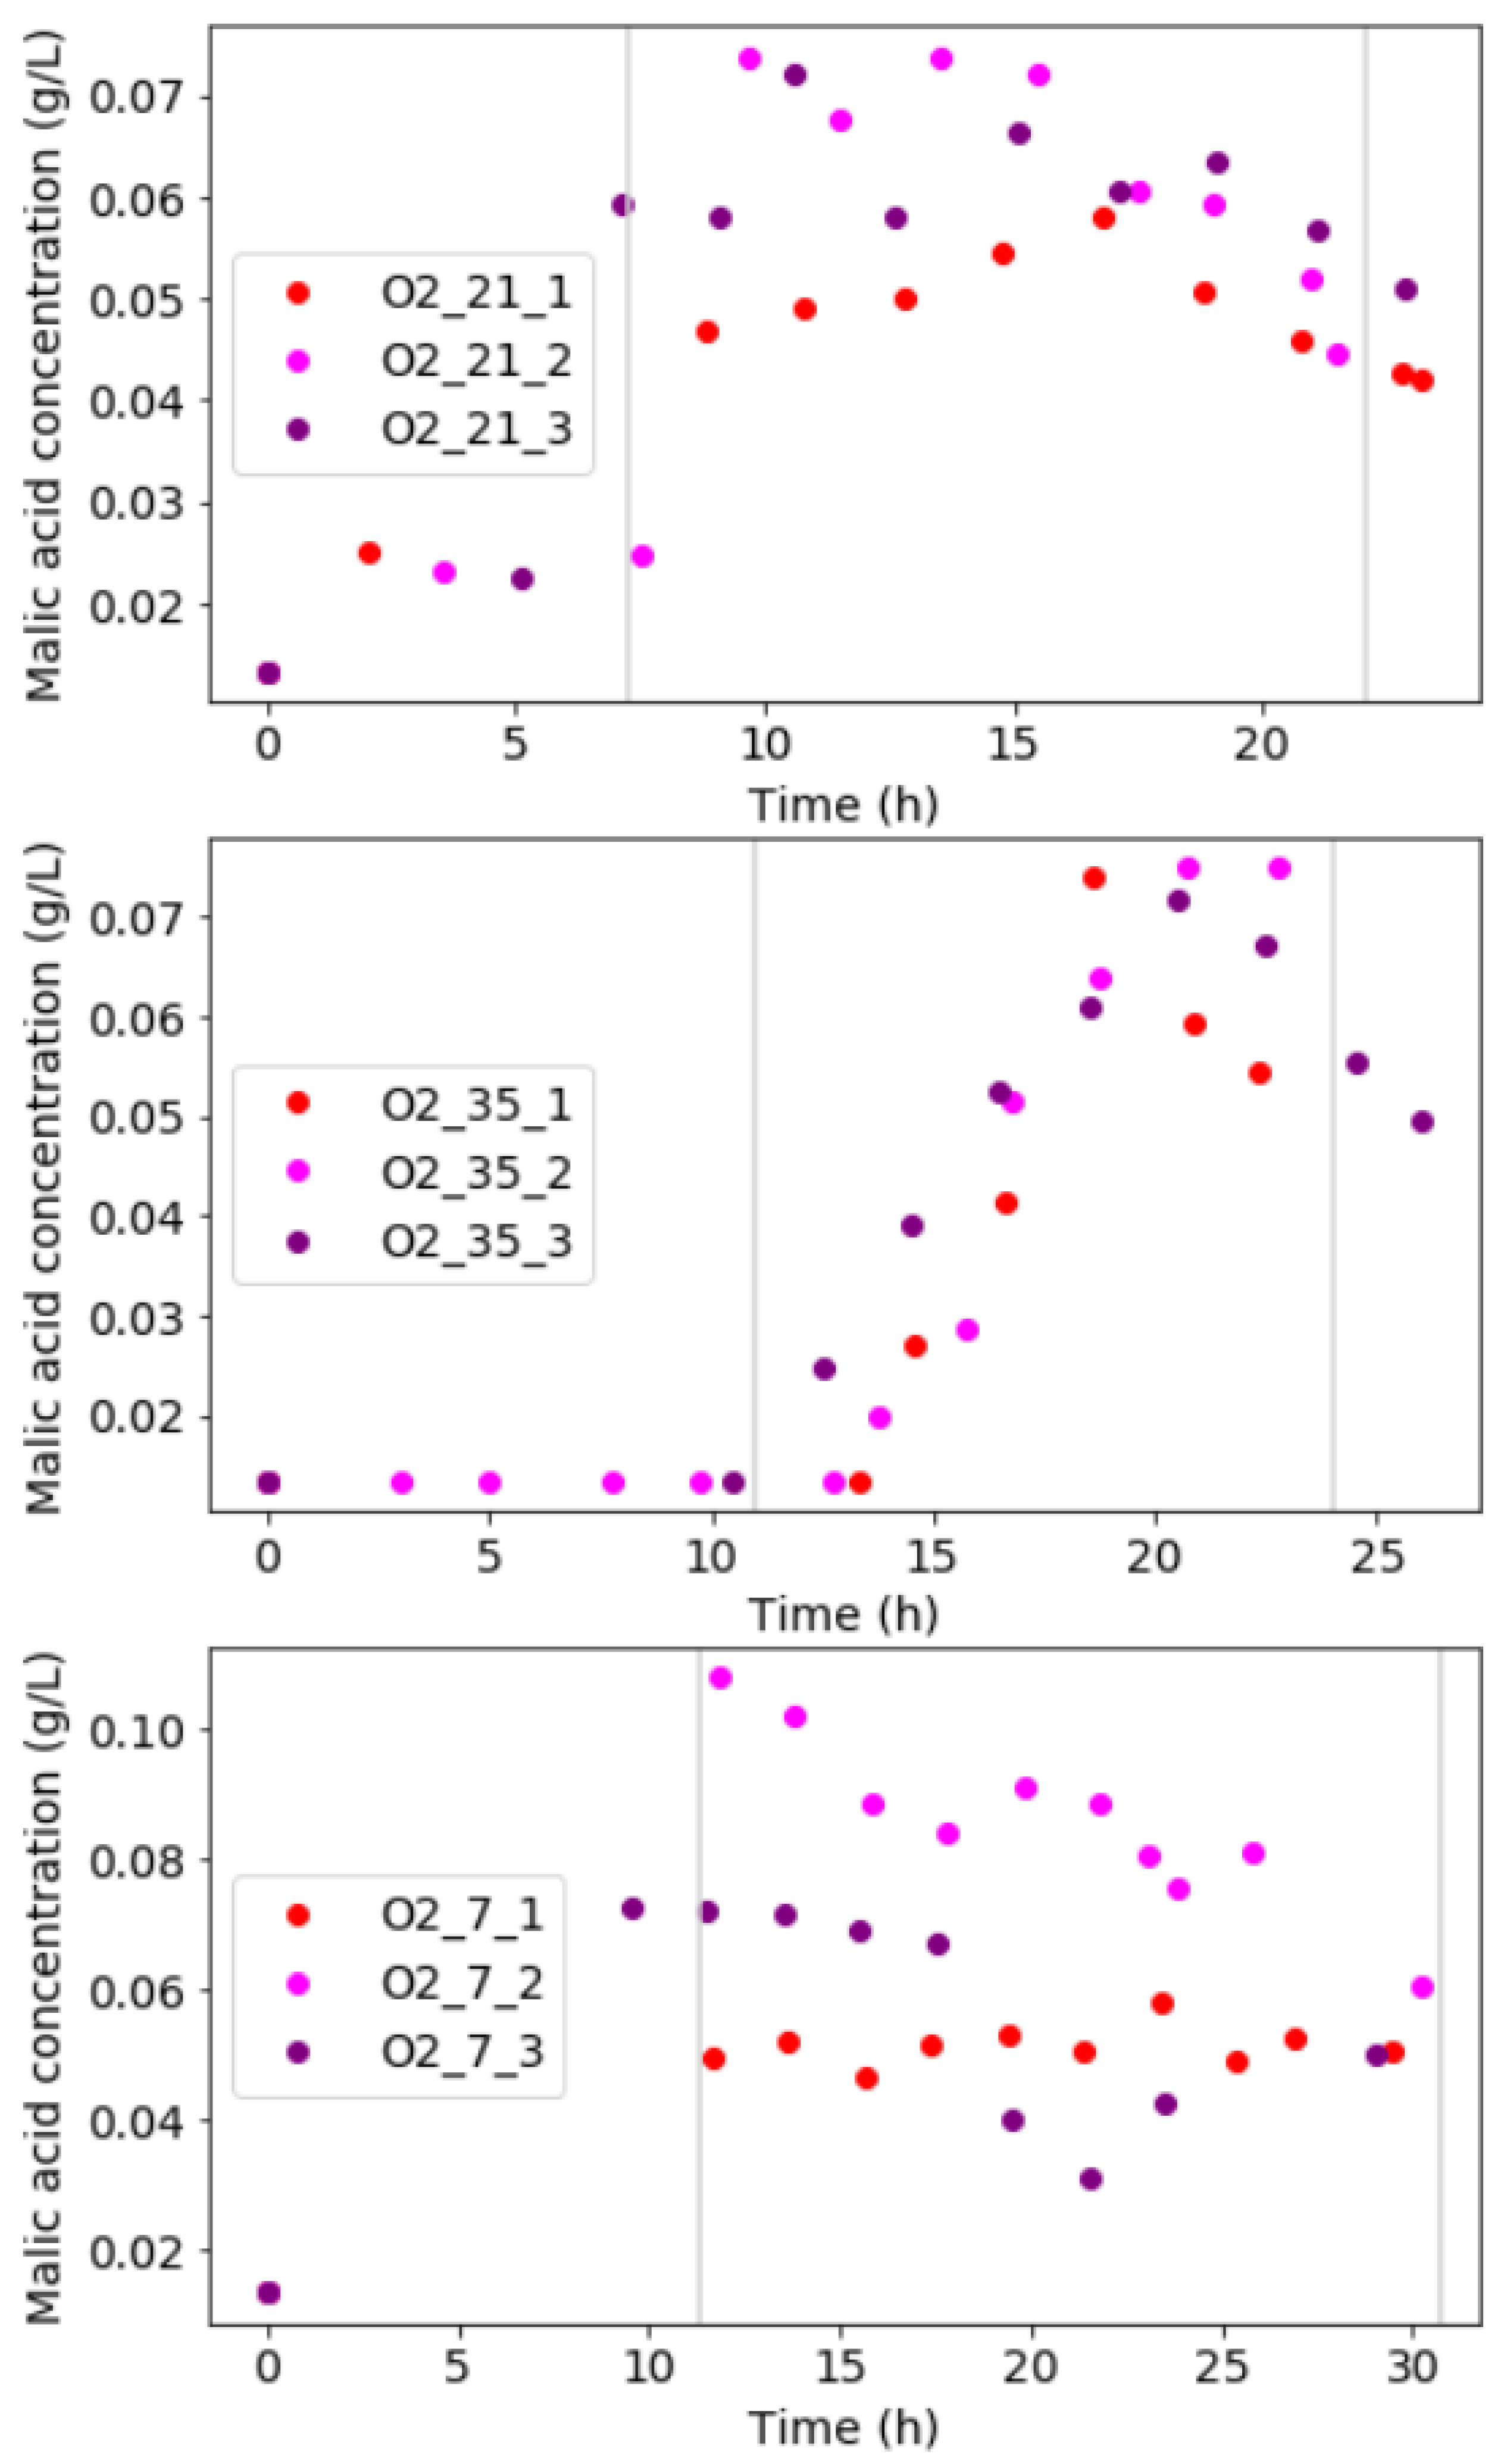
From carbon-compound analyses, it was clear that malic acid was the only byproduct in the liquid for condition O_21 and O_35. No other fermentation products were produced at these conditions. Figure 4 shows the malic acid concentration profiles at each condition. For condition O_21, malic acid increased exponentially during the exponential growth-regime and had an average concentration of 0.07 g/L. The malic acid concentration decreased when the point of glucose depletion was approached. This indicates malic acid was utilised as a carbon source by the diazotrophic culture when glucose started depleting.
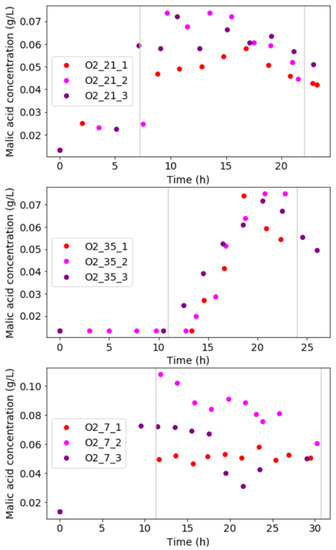
Figure 4.
Malic acid concentration profiles for each experimental condition show relatively high malic acid is attained in each run. Slight decreases in malic acid are visible towards the end of an experimental run, where glucose is near to depletion.
For condition O_35, the rise in malic acid was slightly delayed into the mass-transfer limited growth-regime. An average final concentration of approximately 0.07 g/L was obtained. In run O_35_3, malic acid consumption was observed. This phenomenon was absent in run O_35_1 and O_35_2 as their termination point occurred before malic acid could start being consumed.
Condition O_7 showed malic acid production and consumption occurred in a similar manner to the other conditions. In run O_7_1, however, some carbon was spent on ethanol and acetic acid formation. A final amount of 0.45 g/L of ethanol and 0.25 g/L of acetic acid was produced. This could explain lower malic acid concentrations compared to run O_7_2 and O_7_3. Trace amounts (<0.05 g/L) of ethanol and acetic acid were found in run O_7_2 and run O_7_3.
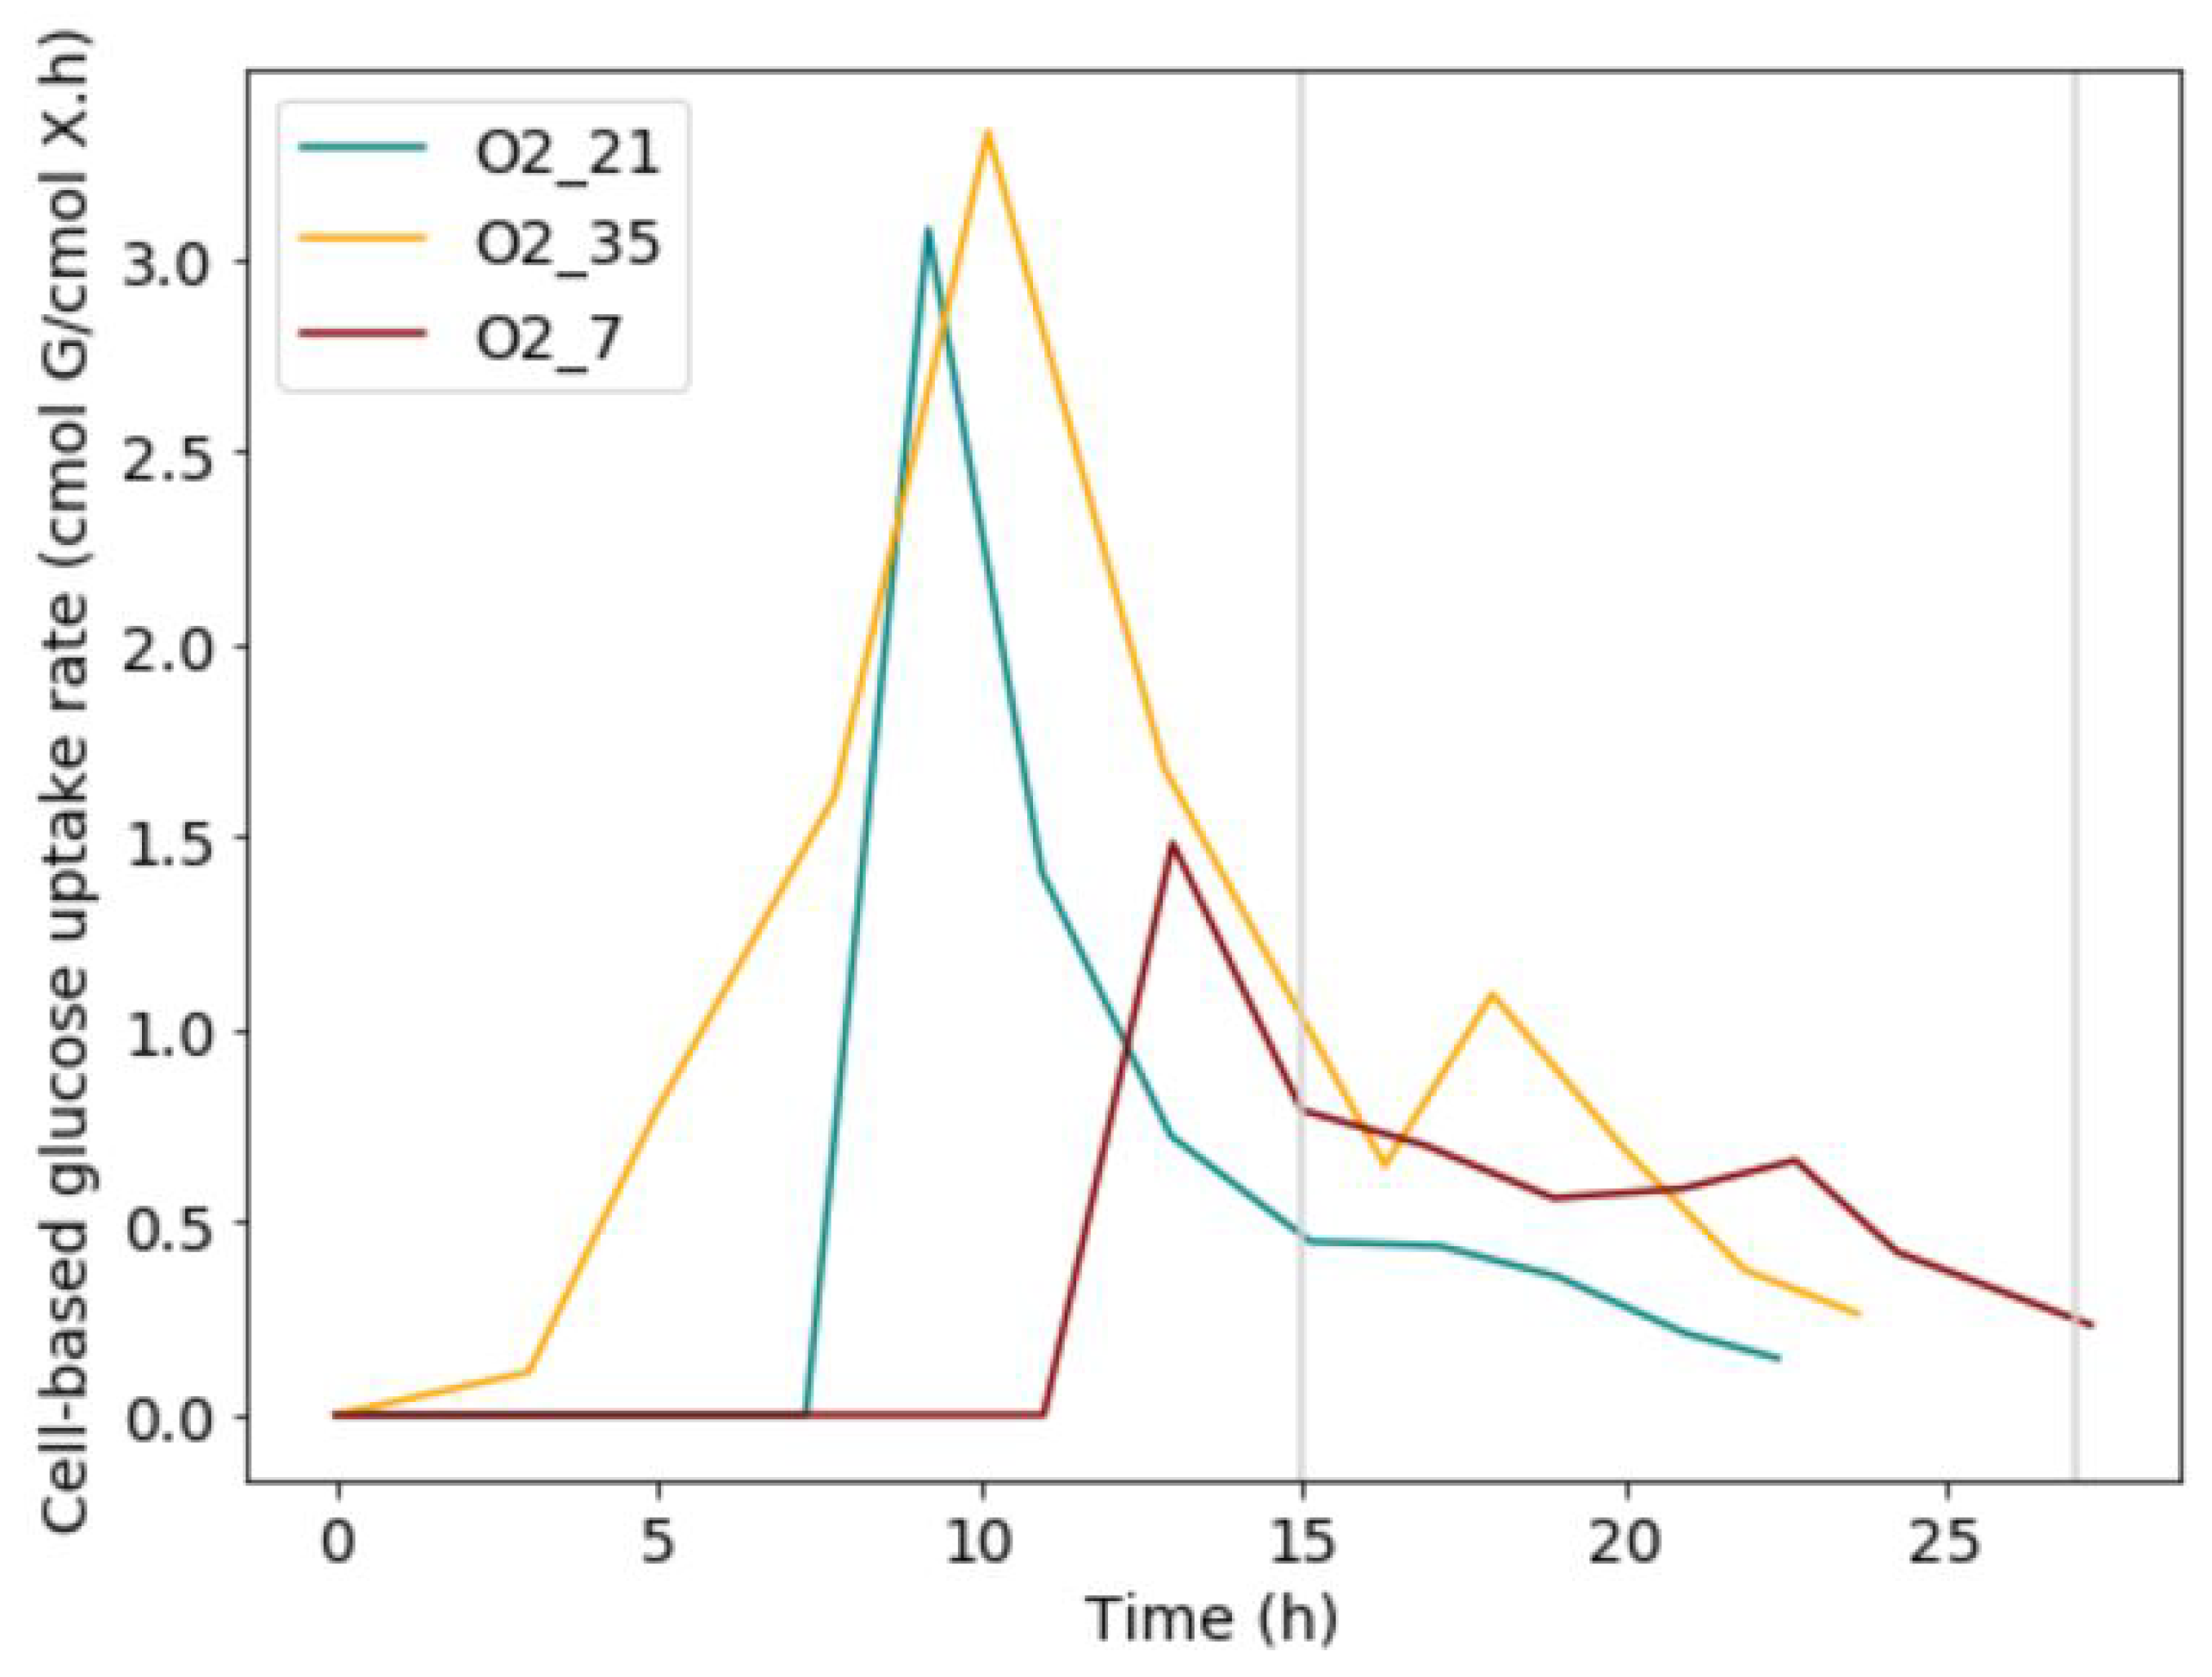
When analysing the cell-based glucose uptake rate for each condition, a distinct peak was present during the exponential growth phase (Figure 5). This peak was followed by a steep drop in glucose uptake rate and a downward trend of the uptake rate during the mass-transfer limited regime. There was a significant increase in the malic acid around the glucose transition point. Thus, the malic acid was produced at the glucose uptake peak, as well as afterwards, during the start of mass-transfer limitation and the exponential growth phase. To this end, the idea that a glucose overflow is present at the start, generating large amounts of energy, was proposed. Due to the oxygen limitation, this energy would remain unused. To facilitate down-regulation of the metabolism, malic acid could be used as a net zero ATP carbon-sink [21].
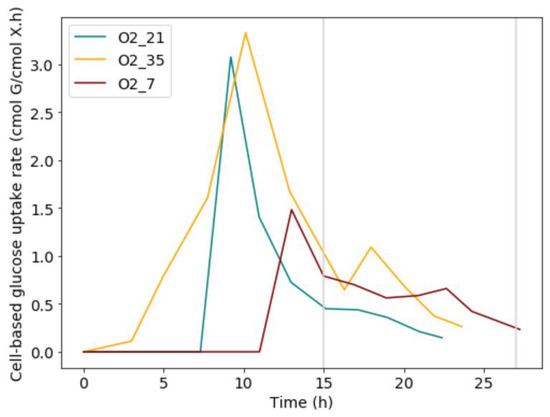
Figure 5.
Glucose uptake rates increase during the lag phase and exponential growth, but stabilize during mass transfer limited growth. It is hypothesised that malic acid is formed during exponential growth and the start of mass transfer limited growth to counteract the excess glucose.
There could be various mechanisms at play that affect the energy requirements of the microbial culture. First of all, diazotrophs contain the nitrogenase enzyme which is deactivated by oxygen. To avoid nitrogenase deactivation, various protection mechanisms have been proposed in aerobic diazotrophs. One such mechanisms is increased substrate usage [20], which reduces the exposure of the nitrogenase enzyme to oxygen by increasing the consumption of oxygen. Following this argument, the production of malic acid is likely part of this protection response. In addition, malic acid production is both NADH and ATP neutral when produced from glucose. Thus, the production of malic acid facilitates the removal of glucose from the system without generating excess ATP for growth.
Another protection mechanism is biofilm formation [20]. Bacterial communities form biofilms in order to increase their resistance against environmental stress. According to Wang et al. [22], extracellular polysaccharides in the biofilm matrix facilitate aeration management and generate a suitable micro-environment for the microbes. During all experimental conditions, a light-yellow biofilm formed in varying amounts inside the recycle line and on the pH and DO probe. Since the absorbance measurements were only based on suspended biomass [23], biofilm attachment would lead to an underestimation in yield and productivity. Much of microbial biofilms comprises of extracellular polymeric substances (EPS), attributing to 50–90% of the biofilm’s total organic carbon [24]. These EPS could serve as a carbon sink.
Lastly, as discussed by Oelze [10], when oxygen supply is increased past the oxygen demand of the organisms, a mechanism initiates to down-regulates ATP production. Diazotrophs have the ability to change their electron transport chain (ETC) during oxidative phosphorylation. Changing the ETC allows for less protons to move across the ATP complex for each oxygen consumed, this decreases the chemical gradient which, in turn, decreases the ATP production. Therefore, increasing the oxygen supply past a certain turning point would no longer benefit the growth rate.
A mass balance was performed over the mass-transfer limited regime using Equation (6). Elemental balances of C, H, O and N were performed, and the oxygen consumption rate and glucose consumption rate were specified from experimental data. The biomass composition was estimated as CHON. This was done through total nitrogen analysis, where the mass% of nitrogen in the biomass was converted to its equivalent mol%. The other elemental ratios were based on the following biomass composition: CHON [25].
Since, ammonia excretion was very low in all runs (<20 mg/L), the nitrogen requirement for ammonia was omitted in the model. The malic acid (CHO) production rate during the mass-transfer limited regime was calculated from the experimental data.
The oxygen uptake rate (OUR) in mol/L.h was calculated using Equation (7), where signifies the rate of change in dissolved oxygen over time.
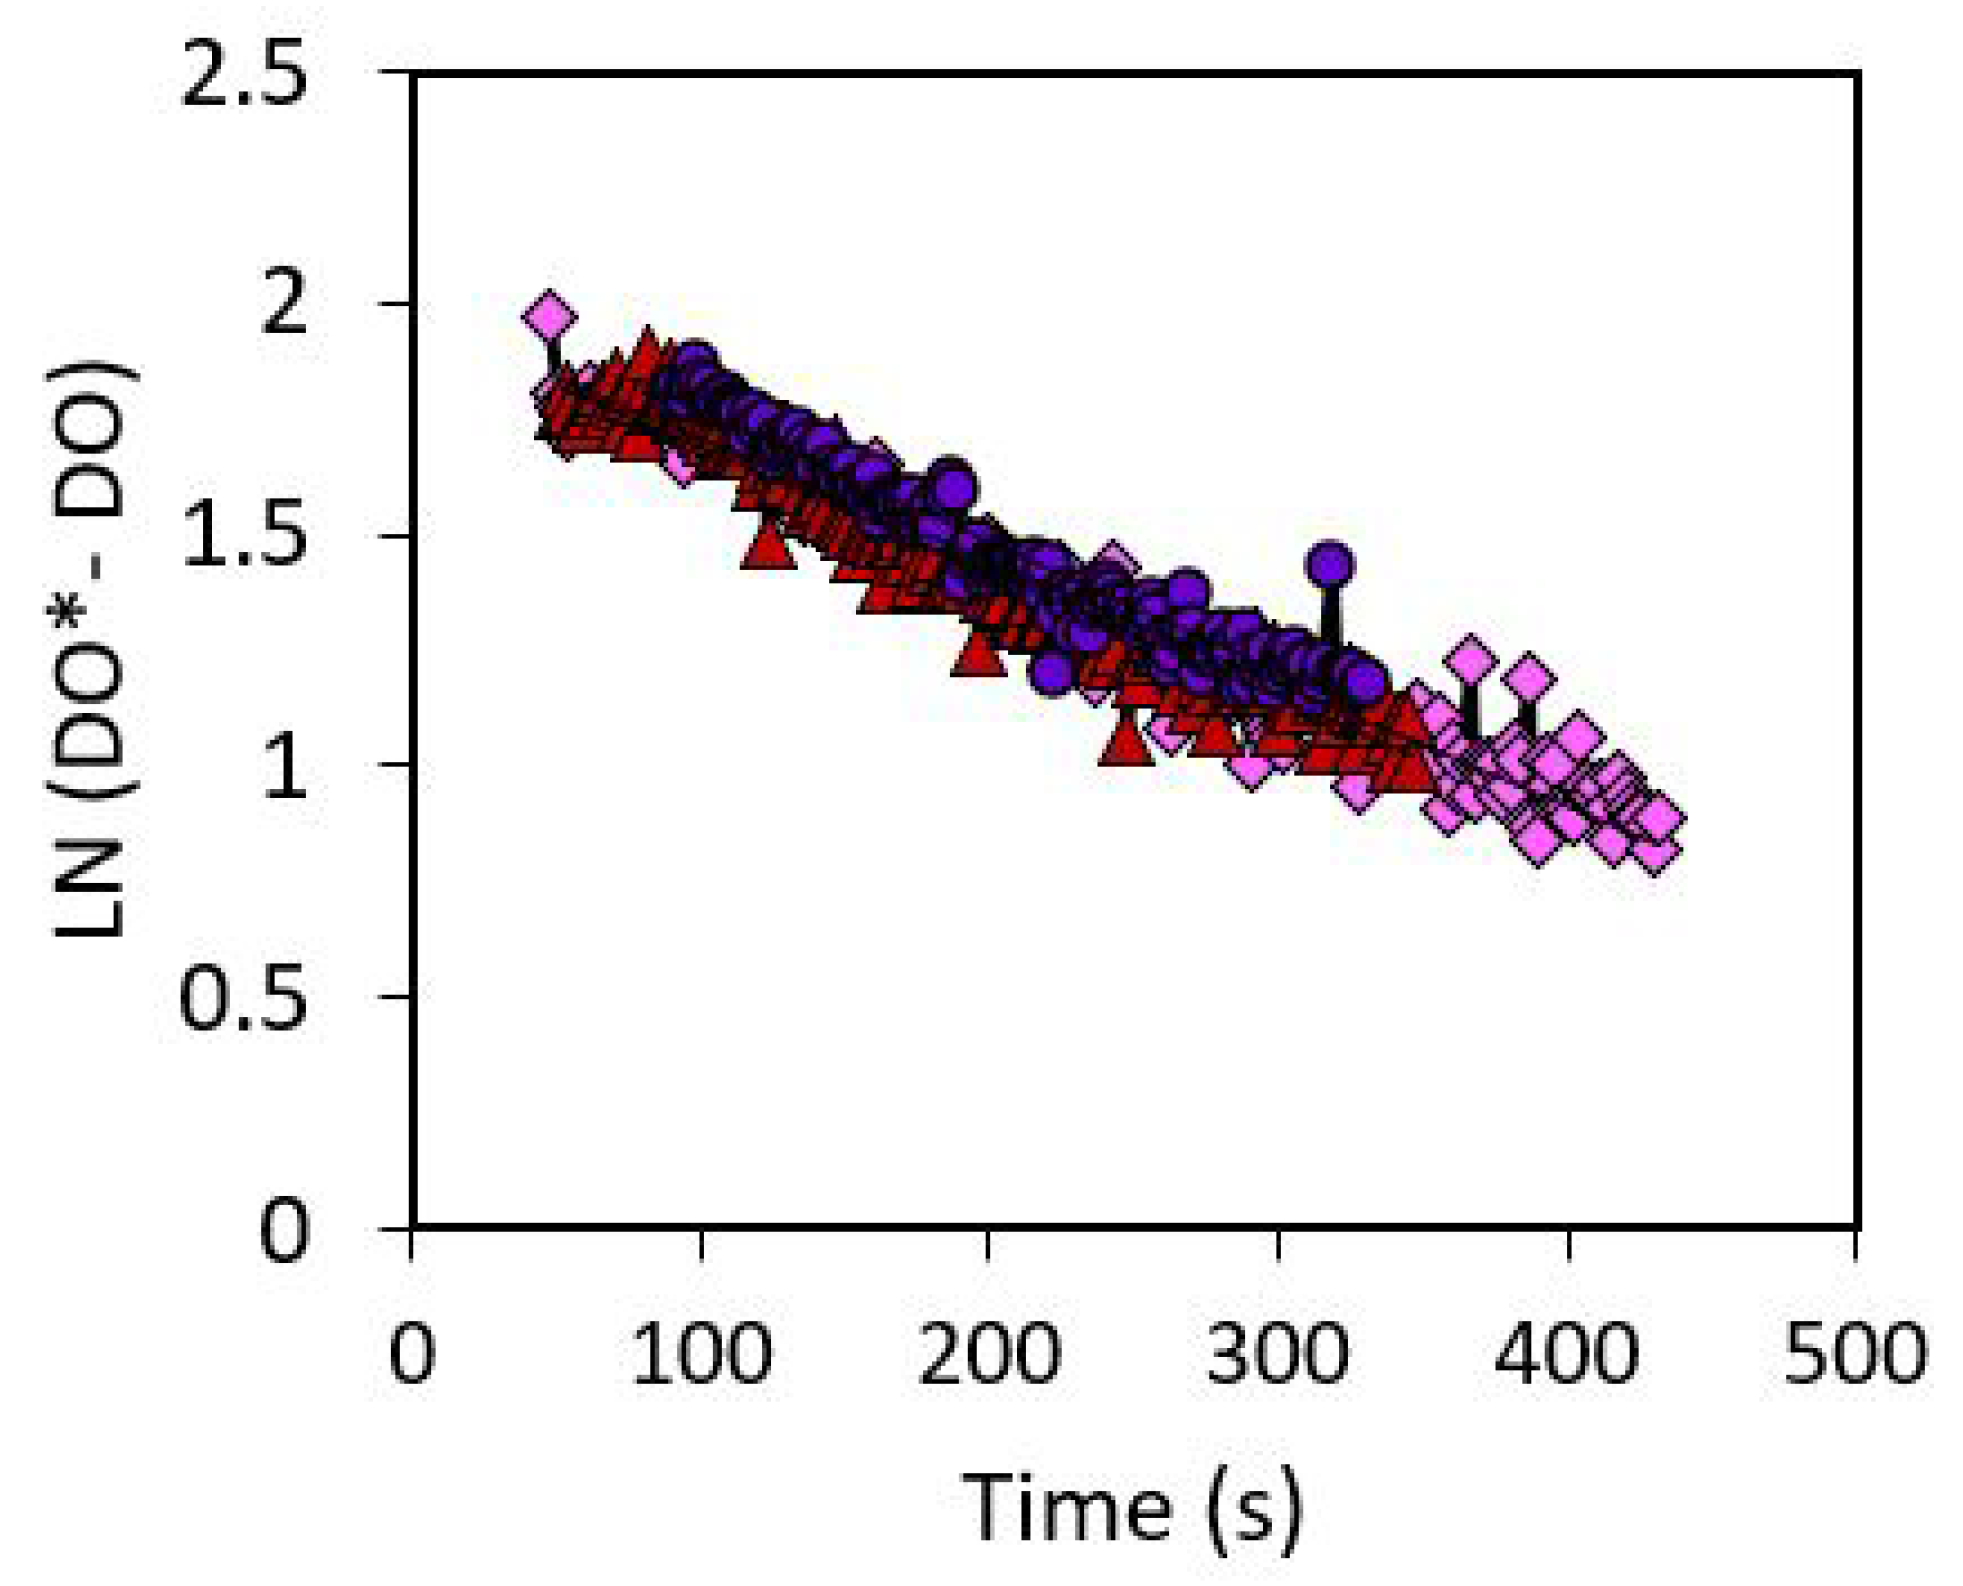
The gas-liquid mass transfer coefficient (kla) was determined to be 0.0027 . Figure 6 shows the experimental data for the mass transfer coefficient calculation.

Figure 6.
The volumetric mass transfer coefficient was found as the slope of the experimental data. Repeatable data was obtained.
To calculate the overall ATP requirement, Equation (8) was utilised. Where the oxidative phosphorylation efficiency (P/O) was assumed to be 1.5 ATP/O atom. The energy cost of nitrogen fixation was assumed to be the theoretically reported value of 16 ATP/N[26]. The rate of nitrogen fixation (r) was determined from the mass balance. It was assumed that oxidative phosphorylation was solely responsible for energy generation.
In the above approach, the assumption was made that all biomass had the same nitrogen content. This resulted in an unrealistically low energy requirement for biomass production (). Therefore, it is highly likely that the sessile biomass had a different composition from the suspended biomass. This would entail glucose expenditure on N-lean biomass as a carbon sink. This carbon sink could consist of intracellular polymeric substances (IPS), such as ATP-independent poly-3-hydroxybutyrate [27], and/or EPS. This competing process was deemed a challenge for future experiments.
This study investigated the consortium in non-sterile conditions to facilitate more realistic soil microbial interactions as compared to pure culture studies. Thus, exact metabolic pathways and survival mechanisms were not determined due to the complexity of the consortium. The carbon feed consisted of glucose as it is a simple model compound and would be suitable to determine the potential for nitrogen fixation.
3.2. C:N Ratios
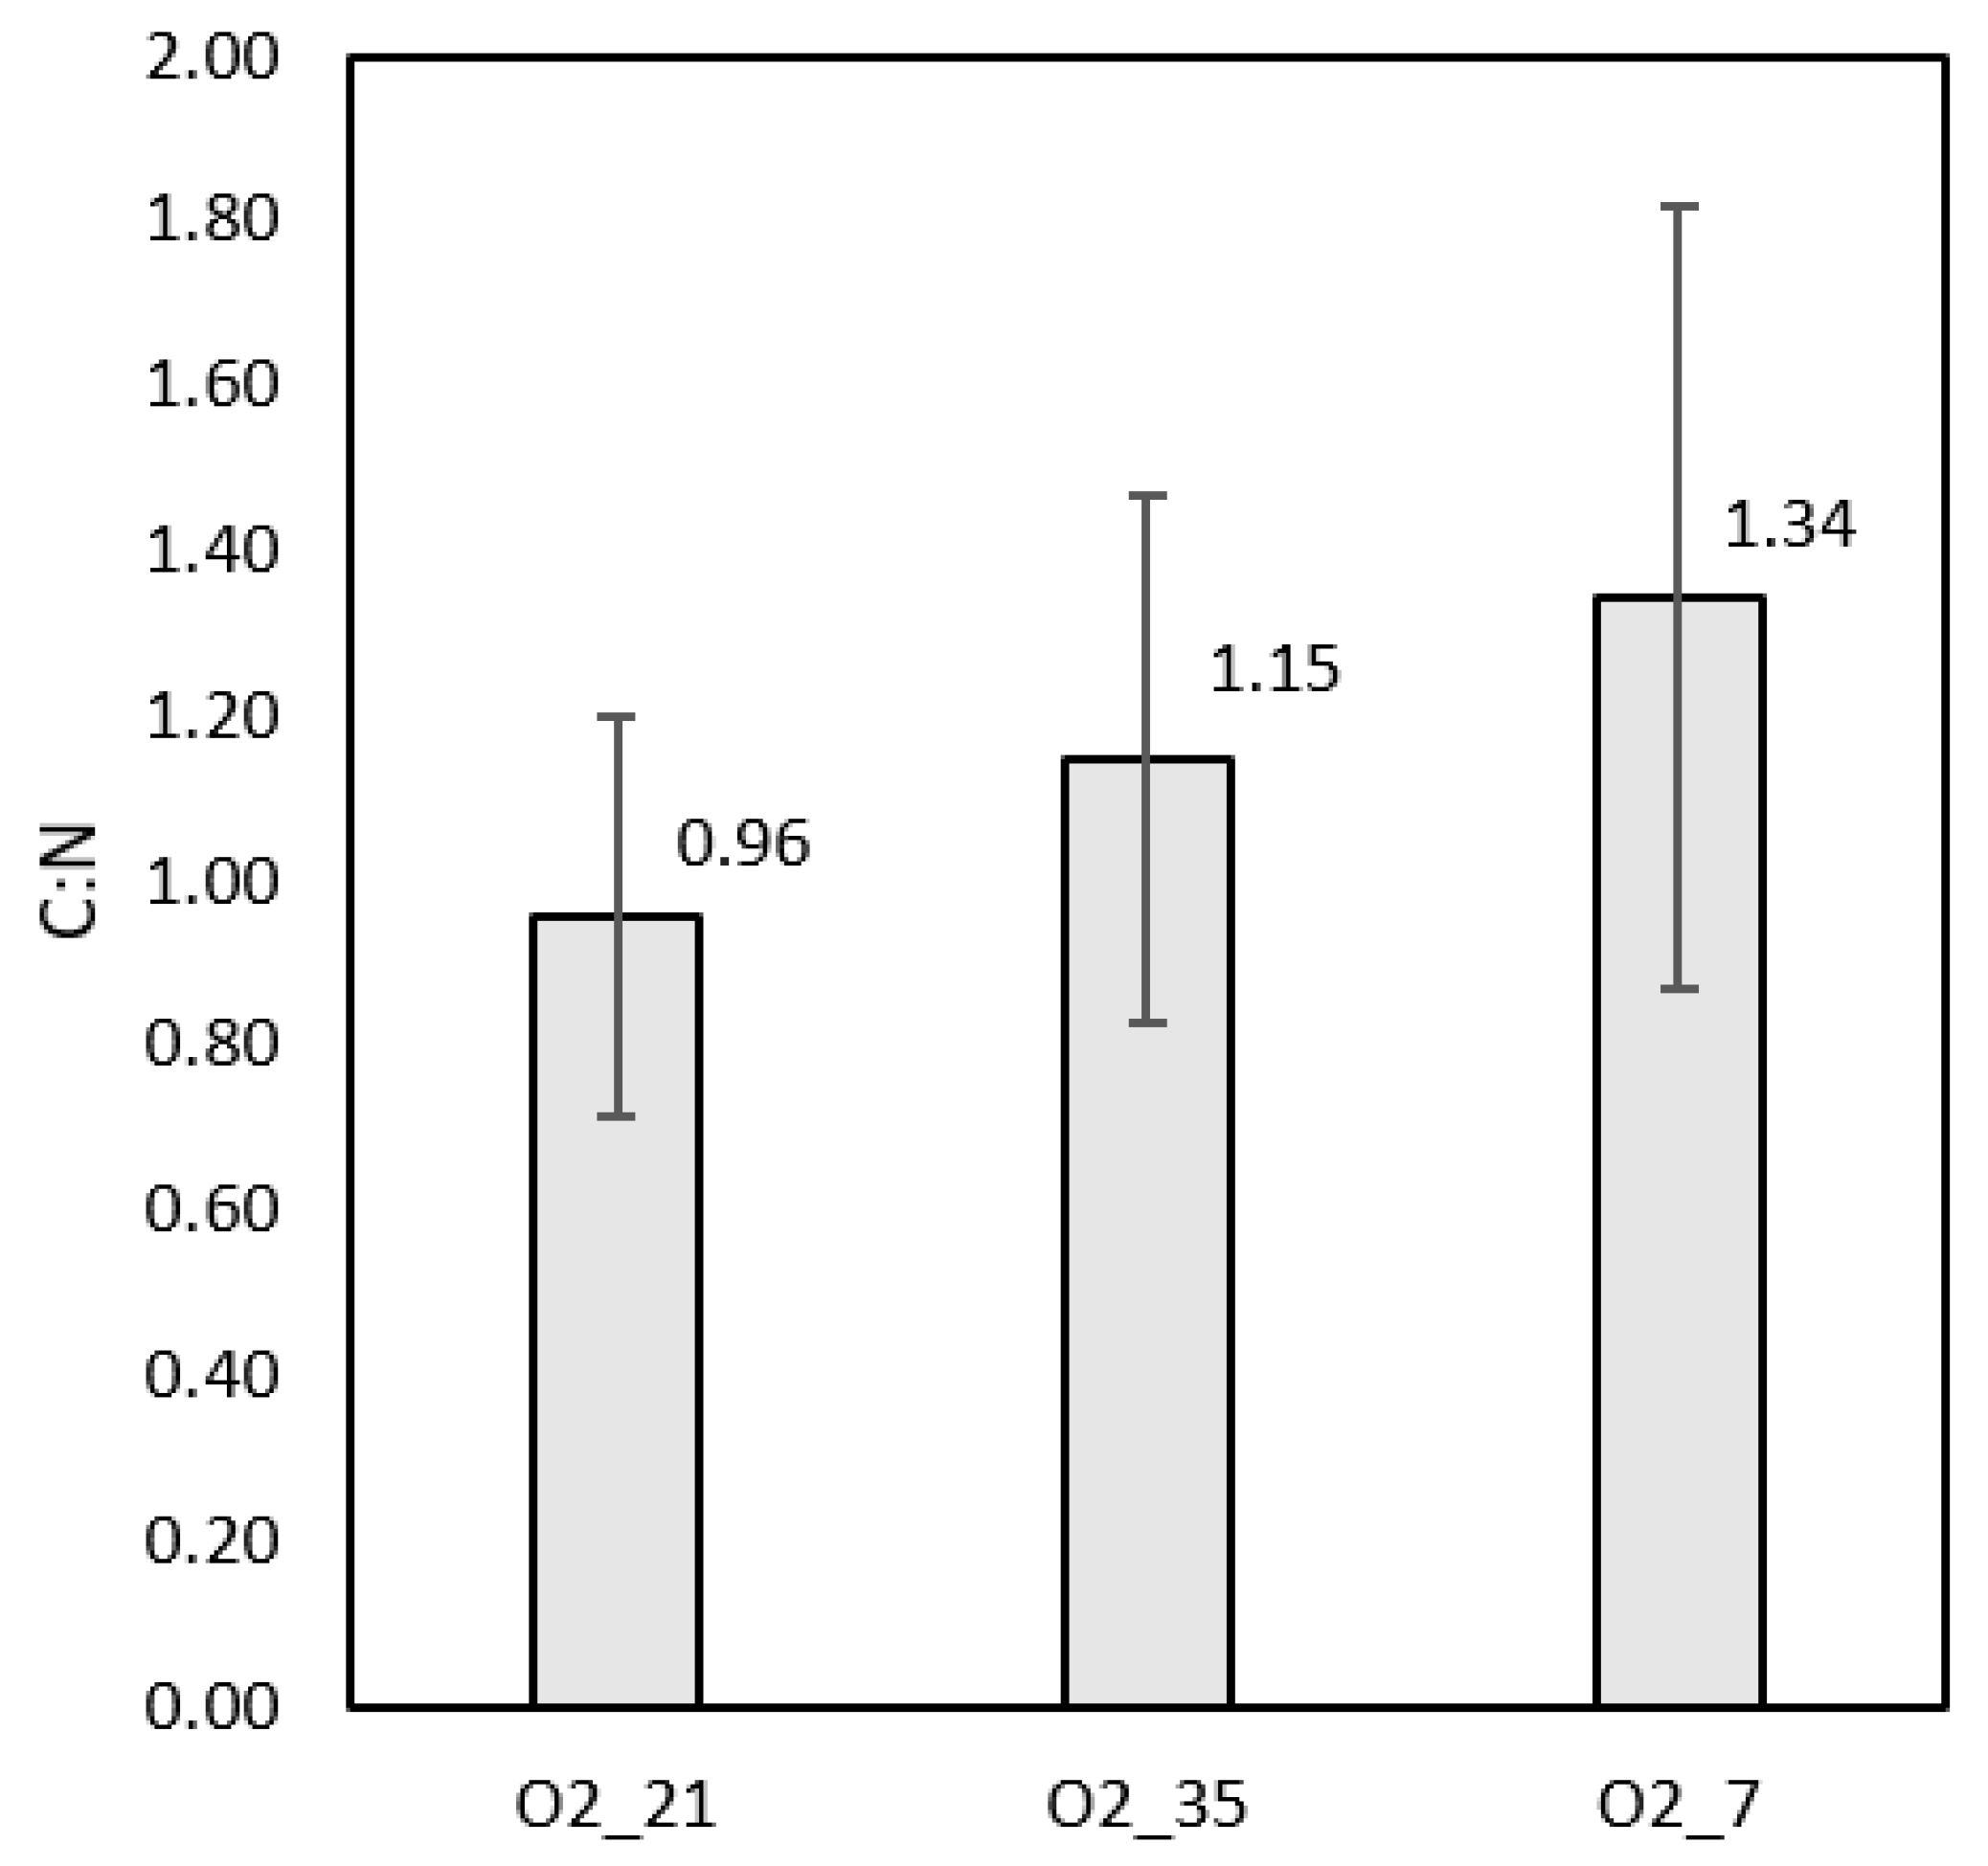
The TOC analysis and total nitrogen (TN) tests for all runs were performed at the glucose depletion point. Averages of the results at each condition were calculated to find an overall C:N ratio. Both TOC and TN showed low values of <200 mg/L and <20 mg/L, respectively. This was deemed excellent from a water treatment point of view and indicates a high selectivity towards biomass production. Figure 7 shows the resulting C:N ratios. These results confirm the hypothesis that much of the carbon was converted to sessile biomass, IPS, or EPS.
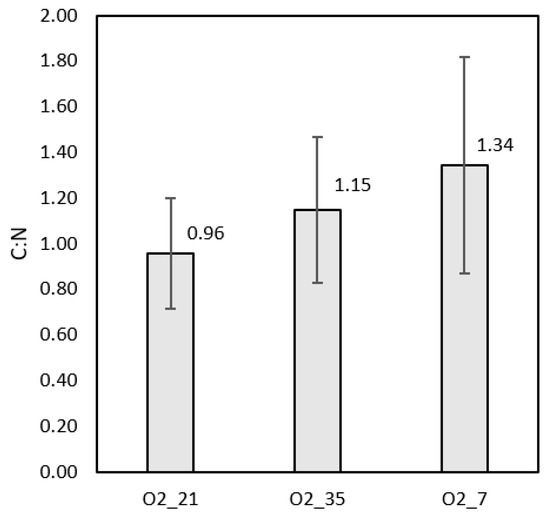
Figure 7.
The C:N ratios at each condition were between 1–2. Differences between conditions could be attributed to varying malic acid concentrations and ETC down-regulation, which would increase carbon dioxide formation. The error bars indicated the standard deviations of each set of results.
3.3. ngDNA Sequencing
For each culture sample 50 to 100 different species were identified. There were, however, few species which dominated the microbial consortium. These species made up 60–70% of the cultures. The dominant species matched across experimental conditions, however, depending on oxygen-availability they were present in slightly different percentages. Table 3 shows a summary of the species that made up the largest part of the consortia. See the Supplementary Materials for the complete reports received from Inqaba Biotec, where samples were labelled A, B, and C, for condition O2_21, O2_35, and O2_7, respectively.
Table 3.
Summary of most prominent bacteria species in the experimental cultures.
From the read count in the metagenomic information, it was clear that Chryseobacterium ssp. and Flavobacterium ssp. made up approximately 50% of the bacterial communities. This showed that the experimental conditions targeted nitrogen-fixing species successfully. In addition, the composition of the cultures showed that most of the dominating species were most commonly found in soil [28,29,30,31] with intrinsic sensitivities to oxygen therefore negating the likelihood of air-borne contamination. This strongly indicated that the cultured bacteria were indeed retrieved from the soil samples. The Bary-Curtis dissimilarity index (Equation (5)) was calculated over at least 84% and 87% of the total species count of the two aerobic culture data sets (O2_21 and O2_35), where counts of unknown species were omitted. The index was computed as 0.284 which implies there was a significant similarity (71.6%) between the data sets. The high similarity indicates that the consortium was relatively stable at these conditions. Due to the low read count measured for the O2_7 run sample (Supplementary Materials) the Bary-Curtis dissimilarity index could not be computed for this condition, however, the ngDNA report indicated very similar species were identified as the aerobic runs providing qualitative support for the stability of the consortium under low aeration conditions.
4. Conclusions
In the current study a locally obtained soil diazotrophic microbial culture was succesfully cultured in a non-sterile bench-scale bioreactor. This study provides one of the only known investigations evaluating the effect of operational conditions on BNF in this type of bioreactor. A repeatable culture was obtained and the effect of oxygen availability on the growth profile of the culture was investigated. From the experimental data, it was concluded that aeration feed composition had a significant effect on the growth profile of the diazotrophic culture studied. A mass-transfer limited regime was reached for all conditions, where oxygen availability directly controlled the growth rate. Increased oxygen availability, however, did not proportionally increase the growth rate as the energy requirements were affected. This was likely due to nitrogenase protection mechanisms against oxygen-stress and ETC down-regulation at high oxygen availability. The most efficient growth occured at condition O_21. The supernatent was found to be virtually clean, with little to no carbon and nitrogen-compounds present. This confirmed that part of the glucose was channelled to a carbon sink in the form of IPS or EPS. The metagenomic data showed that the largest portion of the microbial population were aerobic nitrogen-fixers. The dominating species were Chryseobacterium ssp. and Flavobacterium ssp.
Since this study utilized glucose as its carbon-source which is sub-optimal from an economic perspective, it is recommended to explore alternative carbon-sources. In soil, diazotrophs form symbiotic relationships with plants where plant exudates are utilized as carbon sources. Alternative carbon-sources with a high C:N ratio, such as lignocellulosic waste, could be explored. Co-inoculation with lignocellulosic digesting organisms could, therefore, be a potential research direction. This approach would improve the sustainability of the process. Lastly, the loss of glucose towards carbon sinks is a challenge. The ability of the consortium to utilize the carbon sinks at a later stage for growth should be investigated.
Supplementary Materials
The following are available online at https://www.mdpi.com/article/10.3390/pr9112039/s1.
Author Contributions
Conceptualization, A.Y.S.d.Z., I.L.v.R., W.N. and H.G.B.; methodology, A.Y.S.d.Z.; software, A.Y.S.d.Z.; validation, A.Y.S.d.Z., W.N. and H.G.B.; formal analysis, A.Y.S.d.Z.; investigation, A.Y.S.d.Z. and J.C.B.; resources, W.N.; data curation, A.Y.S.d.Z. and J.C.B.; writing—original draft preparation, A.Y.S.d.Z.; writing—review and editing, A.Y.S.d.Z., I.L.v.R., W.N. and H.G.B.; visualization, A.Y.S.d.Z., W.N. and H.G.B.; supervision, W.N. and H.G.B.; project administration, W.N.; funding acquisition, W.N. All authors have read and agreed to the published version of the manuscript.
Funding
This research received no external funding.
Data Availability Statement
The data presented in this study are openly available in the University of Pretoria Research Data Repository at 10.25403/UPresearchdata.17005651.
Acknowledgments
Devesh Devroop for technical support in the design of the bench-scale reactor regarding electronic equipment and the control system.
Conflicts of Interest
The authors declare no conflict of interest.
References
- Population Action International. Why Population Matters to Food Security; Population Action International: Washington, DC, USA, 2011; pp. 1–4. [Google Scholar]
- Hester, R.; Harrison, R. Soils and Food Security, 1st ed.; Royal Society of Chemistry: Cambridge, UK, 2012; pp. i–vi. [Google Scholar]
- Kozai, T.; Niu, G.; Takagaki, M. Plant Factory: An Indoor Vertical Farming System for Efficient Quality Food Production, 1st ed.; Elsevier Science and Technology: Amsterdam, The Netherland, 2015; pp. 1–10. [Google Scholar]
- OECD. Human Acceleration of the Nitrogen Cycle: Managing Risks and Uncertainty; IWA Publishing: London, UK, 2018. [Google Scholar]
- Barnard, J. Biological Nutrient Removal—Quo Vadis. In Proceedings of the 93rd Annual Conference—Michigan Water Environment Association, Boyne Falls, MI, USA, 24–27 June 2018. [Google Scholar]
- Chen, S.; Perathoner, S.; Ampelli, C.; Centi, G. Chapter 2—Electrochemical Dinitrogen Activation: To Find a Sustainable Way to Produce Ammonia. Stud. Surf. Sci. Catal. 2019, 178, 31–46. [Google Scholar]
- Mitsushima, S.; Hacker, V. Fuel Cells and Hydrogen, 1st ed.; Elsevier: Amsterdam, The Netherland, 2018; pp. 243–255. [Google Scholar]
- Kuypers, M.; Marchant, H.; Kartal, B. The microbioal nitrogen-cycling network. Nat. Rev. 2018, 16, 263–276. [Google Scholar]
- Mahanty, T.; Bhattacharjee, S.; Goswami, M.; Bhattacharyya, P.; Das, B.; Ghosh, A.; Tribedi, P. Biofertilizer: A potential approach for sustainable agricultural development. Environ. Sci. Pollut. Resolut. 2018, 24, 3315–3335. [Google Scholar] [CrossRef]
- Oelze, J. Respiratory protection of nitrogenase in Azotobacter species: Is a widely held hypothesis unequivocally supported by experimental evidence? FEMS Microbiol. Rev. 2000, 24, 321–333. [Google Scholar] [CrossRef]
- Pankievicz, V.; Irving, T.; Maia, L.; Ané, J. Are we there yet? The long walk towards the development of efficient symbiotic associations between nitrogen-fixing bacteria and non-leguminous crops. BMC Biol. 2019, 17, 99. [Google Scholar] [CrossRef] [Green Version]
- Singh, R.; Ryu, J.; Kim, S. Microbial consortia including methanotrophs: Some benefits of living together. J. Microbiol. 2019, 57, 939–952. [Google Scholar] [CrossRef]
- Brewin, B.; Woodley, P.; Drummond, M. The Basis of Ammonium Release in nifL Mutants of Azotobacter vinelandii. J. Bacteriol. 1999, 181, 7356–7362. [Google Scholar] [CrossRef] [Green Version]
- Barney, B.; Plunkett, M.; Natarajan, V.; Mus, F.; Knutson, C.; Peters, J. Transcriptional Analysis of an AmmoniumExcreting Strain of Azotobacter vinelandii Deregulated for Nitrogen Fixation. Appl. Environ. Microbiol. 2017, 83, e01534-17. [Google Scholar] [CrossRef] [PubMed] [Green Version]
- Bali, A.; Blanco, G.; Hill, S.; Kennedy, C. Excretion of Ammonium by a nifL Mutant of Azotobacter vinelandii Fixing Nitrogen. Appl. Environ. Microbiol. 1992, 58, 1711–1718. [Google Scholar] [CrossRef] [PubMed] [Green Version]
- Romero-Perdomo, F.; Camelo-Rusinque, M.; Criollo-Campos, P.; Bonilla-Buitrago, R. Effect of temperature and pH on the biomass production of Azospirillum brasilense C16 isolated from Guinea grass. Pastos Y Forraje 2015, 38, 231–233. [Google Scholar]
- Merck KGaA. Nitrogen (Total) Cell Test. 2021. Available online: https://www.sigmaaldrich.com/ZA/en/product/mm/100613 (accessed on 6 October 2021).
- PacBio. Procedure & Checklist—Full-Length 16S Amplification, SMRTbellR Library Preparation and Sequencing. 2018. Available online: https://dnatech.genomecenter.ucdavis.edu/wp-content/uploads/2018/07/PacBio-Full-Length-16S-Sequencing-Protocol-June2018.pdf (accessed on 6 October 2021).
- Somerfield, P. Identification of the Bray-Curtis similarity index: Comment on Yoshioka. Mar. Ecol. Prog. Ser. 2008, 372, 303–306. [Google Scholar] [CrossRef] [Green Version]
- Smercina, D.; Evans, S.; Friesen, M.; Tiemanna, L. To Fix or Not To Fix: Controls on Free-Living Nitrogen Fixation in the Rhizosphere. Appl. Environ. Microbiol. 2019, 86, e02546-18. [Google Scholar] [CrossRef] [PubMed] [Green Version]
- Kövilein, A.; Kubisch, C.; Cai, L.; Ochsenreither, K. Malic acid production from renewables: A review. J. Chem. Technol. Biotechnol. 2020, 95, 513–526. [Google Scholar] [CrossRef] [Green Version]
- Wang, D.; Xu, A.; Elmerich, C.; Ma, L. Biofilm formation enables free-living nitrogen-fixing rhizobacteria to fix nitrogen under aerobic conditions. ISME J. 2017, 11, 1602–1613. [Google Scholar] [CrossRef] [Green Version]
- Lexow, W.G.; Sekgetho, C.M.; Brink, H.G.; Nicol, W. Identifying Energy Extraction Optimisation Strategies for A. succinogenes. Catalysts 2021, 11, 1016. [Google Scholar] [CrossRef]
- Bailey, W. Biofilms: Formation, Development and Properties; Nova Science Publishers: New York, NY, USA, 2011. [Google Scholar]
- Nielsen, J.; Villadsen, J. Bioreaction Engineering Principles; Springer: Boston, MA, USA, 1994. [Google Scholar]
- Iwata, K.; Azlan, A.; Yamakawa, H.; Omori, T. Ammonia accumulation in culture broth by the novel nitrogen-fixing bacterium, Lysobacter sp. E4. J. Biosci. Bioeng. 2010, 110, 415–418. [Google Scholar] [CrossRef]
- de Souza Pinto Lemgruber, R.; Valgepea, K.; Tappel, R.; Behrendorffb, J.; Palfreyman, R.; Plan, M.; Hodson, M.; Simpson, S.; Nielsen, L.; Köpke, N.; et al. Systems-level engineering and characterisation of Clostridium autoethanogenum through heterologous production of poly-3-hydroxybutyrate (PHB). Metab. Eng. 2019, 53, 14–23. [Google Scholar] [CrossRef]
- Dhole, A.; Shelat, H.; Deepak, P. Chryseobacterium indologenes A Novel Root Nodule Endophyte in Vigna radiata. Int. J. Curr. Microbiol. Appl. Sci. 2017, 6, 836–844. [Google Scholar]
- Giri, S.; Pati, B. A comparative study on phyllosphere nitrogen fixation by newly isolated Corynebacterium sp. & Flavobacterium sp. and their potentialities as biofertilizer. Acta Microbiol. Immunol. Hung. 2004, 51, 47–56. [Google Scholar]
- Naqqash, T.; Imran, A.; Hameed, S.; Shahid, M.; Majeed, A.; Iqbal, J.; Hanif, M.; Ejaz, S.; Malik, K. First report of diazotrophic Brevundimonas spp. as growth enhancer and root colonizer of potato. Sci. Rep. 2020, 10, 12893. [Google Scholar] [CrossRef]
- Kaminski, P.; Mandon, K.; Arigoni, F.; Desnoues, N.; Elmerich, C. Regulation of nitrogen fixation in Azorhizobium caulinodans: Identification of a fixK-like gene, a positive regulator of nifA. Mol. Microbiol. 1991, 5, 1983–1991. [Google Scholar] [CrossRef] [PubMed]
- Calderón, G.; García, E.; Rojas, P.; García, E.; Rosso, M.; Losada, A. Chryseobacterium indologenes infection in a newborn: A case report. J. Med. Case Rep. 2011, 5, 10. [Google Scholar] [CrossRef] [PubMed] [Green Version]
- De Donno Novelli, L.; Moreno, S.; Rene, E. Polyhydroxyalkanoate (PHA) production via resource recovery from industrial waste streams: A review of techniques and perspectives. Bioresour. Technol. 2021, 331, 124985. [Google Scholar] [CrossRef]
- Jurat-Fuentes, J.; Jackson, T. Chapter 8—Bacterial Entomopathogens, 2nd ed.; Academic Press: Cambridge, MA, USA, 2012; pp. 265–349. [Google Scholar]
- Gtari, M.; Ghodhbane-Gtari, F.; Nouioui, I.; Beauchemin, N.; Tisa, L. Phylogenetic perspectives of nitrogen-fixing actinobacteria. Arch. Microbiol. 2012, 194, 3–11. [Google Scholar] [CrossRef] [PubMed]
- Osman, Y.; Elrazak, A.; Khater, W. Bioprocess Optimization of Microbial Biopolymer Production. J. Biobased Mater. Bioenergy 2016, 10, 119–128. [Google Scholar] [CrossRef]
- Orozco-Medina, C.; López-Cortés, A.; Maeda-Martínez, A. Aerobic Gram-positive heterotrophic bacteria Exiguobacterium mexicanum and Microbacterium sp. in the gut lumen of Artemia franciscana larvae under gnotobiotic conditions. Curr. Sci. 2009, 96, 120–129. [Google Scholar]
- Ali, I.; Jamil, N. Biosynthesis and genetics of polyhydroxyalkanoates by newly isolated Pseudomonas aeruginosa IFS and 30N using inexpensive carbon sources. Int. J. Environ. Sci. Technol. 2017, 14, 1879–1888. [Google Scholar] [CrossRef]
- Bhuwal, A.; Singh, G.; Aggarwal, K.; Goyal, V.; Yadav, A. Isolation and Screening of Polyhydroxyalkanoates Producing Bacteria from Pulp, Paper, and Cardboard Industry Wastes. Int. J. Biomater. 2013, 2013, 752821. [Google Scholar] [CrossRef] [Green Version]
- Nojima, S.; Mineki, S.; Iida, M. Purification and characterization of extracellular poly(3-hydroxybutyrate) depolymerases produced by Agrobacterium sp. K-03. J. Ferment. Bioeng. 1996, 81, 72–75. [Google Scholar] [CrossRef]
- Van Montagu, M.; Zambryski, P. Agrobacterium and Ti Plasmids; Elsevier: Amsterdam, The Netherlands, 2017. [Google Scholar]
- Earth Observing System. Nitrogen Fixation: N-Fixing Plants And Bacteria. 2021. Available online: https://eos.com/blog/nitrogen-fixation/ (accessed on 20 September 2021).
- Rai, S.; Solanki, A.; Anal, A. Modern Biotechnological Tools: An Opportunity to Discover Complex Phytobiomes of Horticulture Crops; Academic Press: Cambridge, MA, USA, 2021; pp. 85–124. [Google Scholar]
- Copeland, A.; Lucas, S.; Lapidus, A.; Barry, K.; Detter, J.C.; Glavina del Rio, T.; Dalin, E.; Tice, H.; Pitluck, S.; Chertkov, O.; et al. Proteomes—Acidovorax sp. (Strain JS42). UniProt Database. 2006. Available online: https://www.uniprot.org/proteomes/UP000000645 (accessed on 20 September 2021).
- Feng, Y.; Feng, J.; Shu, Q. Isolation and characterization of heterotrophic nitrifying and aerobic denitrifying Klebsiella pneumoniae and Klebsiella variicola strains from various environments. J. Appl. Microbiol. 2018, 124, 1195–1211. [Google Scholar] [CrossRef]
- Apparao, A.; Krishnaswamy, V. Production of Polyhydroxyalkanoate (PHA) by a Moderately Halotolerant Bacterium Klebsiella pneumoniae U1 Isolated from Rubber Plantation Area. Int. J. Environ. Bioremediat. Biodegrad. 2015, 3, 54–61. [Google Scholar]
Publisher’s Note: MDPI stays neutral with regard to jurisdictional claims in published maps and institutional affiliations. |
© 2021 by the authors. Licensee MDPI, Basel, Switzerland. This article is an open access article distributed under the terms and conditions of the Creative Commons Attribution (CC BY) license (https://creativecommons.org/licenses/by/4.0/).