Article

Anti-Oxidative Effect of Weak Alkaline Reduced Water in RAW 264.7 Murine Macrophage Cells

1
Department of Environmental Medical Biology, Wonju College of Medicine, Yonsei University, Wonju 26426, Korea
2
Department of Global Medical Science, Wonju College of Medicine, Yonsei University, Wonju 26426, Korea
3
Department of Laboratory Medicine, Wonju College of Medicine, Yonsei University, Wonju 26426, Korea
4
Hanumul Co., Ltd., Ilsan Dong-gu, Goyang-si 10442, Korea
*
Author to whom correspondence should be addressed.
Processes 2021, 9(11), 2062; https://doi.org/10.3390/pr9112062
Submission received: 26 October 2021 / Revised: 12 November 2021 / Accepted: 12 November 2021 / Published: 18 November 2021
(This article belongs to the Section Biological Processes and Systems)

Abstract

:
Excessive oxidative stress (OS) is a common cause of various diseases such as cancer, diabetes, and obesity; thus, an anti-oxidative solution is essential for the improvement of human health. Increasing evidence suggests that alkaline reduced water (ARW), especially between pH 9.5–10.0, has antioxidant capacity; however, relatively few studies have reported the effect of weak ARW at pH 8.5 on OS, especially in vitro. This study was conducted to evaluate the anti-oxidative efficacy of weak ARW with negative oxidation-reduction potential (ORP) and relatively high hydrogen (H2) concentration, as compared to tap water (TW) and ARW at pH 9.5. RAW 264.7 murine macrophage cells, stimulated by hydrogen peroxide (H2O2) and lipopolysaccharide (LPS) to induce OS, were used as a control (Con) and then treated with TW and ARW at pH 8.5 (ARW_8.5) and pH 9.5 (ARW_9.5) at different concentrations (0.1%, 1%, and 10% v/v). Results showed that cell viability was significantly restored after treatment with both ARW_8.5 and ARW_9.5 compared to Con/H2O2 and Con/LPS, while TW treatment did not induce significant changes. Levels of reactive oxygen species (ROS), nitric oxide (NO), Ca2+, catalase, and glutathione peroxide (GPx) showed significant differences in a concentration-dependent manner in ARW_8.5 and ARW_9.5 groups compared to Con/H2O2 and Con/LPS groups. Likewise, the expression of p-p38, p-JNK, and p-ERK was also significantly reduced in the ARW-treated groups, but not in the TW group. In conclusion, ARW_8.5 exhibited anti-oxidative effects through the regulation of the MAPK signaling pathway in RAW 264.7 murine macrophage cells, indicating the health-promoting potential of weak ARW through daily intake.

Graphical Abstract

1. Introduction

Alkaline reduced water (ARW) is produced by a water-electrolyzed pool at a cathode plate [1]. It is known by numerous names such as alkaline ionized water, alkaline electrolyzed water, or electrolyzed reduced water, and it is becoming increasingly popular worldwide, especially in Southeast Asian countries [2,3]. Water serves as a construction material, a solvent, a reaction medium, a reactant, a carrier of nutrients and waste, a thermoregulator, a lubricant, and a shock absorber in the human body [4,5]. A sedentary adult needs to consume 1.5 L of water each day on an average [4]. Moreover, the Environmental Protection Agency (EPA) suggested that the pH of drinking water should be between 6.5 and 8.5 [6]. Recently, the use of ARW to improve health has gathered great interest. Previous studies have shown that ARW at pH 9.5 reduces the levels of free radicals, promotes antioxidant levels, prevents reactive oxygen species (ROS)-induced DNA damage, and promotes health through the reduction of oxidative stress (OS) [7,8,9,10]. Additionally, several in vivo studies and clinical trials have shown the anti-allergy, anti-diabetic [11], anti-hangover [3] and anti-aging [12] effects of ARW at pH > 9. Moreover, a recent clinical study showed that ARW consumption reduced OS, increased antioxidant potential, and decreased fat mass [13]. Interestingly, to address the debate on the long-term effects of drinking ARW, Magro et al. reported that mice were given alkaline ionized water to drink showed a longer lifespan than control mice watered with tap water (TW) in a 3-year survival study [8]. This evidence suggests the efficacy of ARW in treating OS-related diseases.
OS is defined as an imbalance in the body’s levels of free radicals and antioxidants, as well as a disruption in the generation and buildup of reactive oxygen species (ROS) in cells and tissues, as well as biological systems’ ability to purify these products [14]. Lipopolysaccharide (LPS) and hydrogen peroxide (H2O2) stimulate the increase in ROS levels and induce OS, which may be mediated through the mitogen-activated protein kinase (MAPK) signaling pathway in murine macrophage cell lines [15,16]. RAW 264.7 cells are monocyte/macrophage-like cells generated from an Abelson leukemia virus-transformed BALB/c mouse cell line. These cells have been considered a suitable macrophage type as evidence found that the phenotype and functional characteristics of RAW 264.7 remained stable through passages [17], and these cells mimic bone-marrow derived macrophages, which initiate cellular activation and responses to microorganisms and their products [18,19]. ROS plays a protective as well as destructive role; the overproduction of ROS can lead to the dysregulation of nitric oxide (NO) and intracellular calcium (Ca2+), resulting in deleterious effects and damage to cellular structures in the body [20]. The consumption of antioxidant products is considered a preferred solution; therefore, various studies have been conducted on the use of products with high antioxidant activity, such as alkaline compounds, hydrogen (H2) and electrolyzed reduced water [21,22,23].
In Japan, an electrolyzing device for generating ARW was created and approved as a household medical device use after safety and efficacy testing. The Japanese Ministry of Health, Labor, and Welfare recommends a pH of 9.5 for drinking ARW, with a pH limit of not more than 10. In Korea, the Ministry of Food and Drug Safety also approved the alkaline water-generating device as a household medical device (grade II) and stipulated a pH range of 8.5–10.0 for ARW. ARW is characterized by parameters such as negative oxidation-reduction potential (ORP), H2 concentration, and pH, and the parameters proportionately affect each other under different conditions such as the strength of electric current and mineral concentration during electrolysis. With this, users can choose the degree of pH using buttons or dials that are set on the device. Owing to the functionality of alkaline properties, studies related to safety and efficacy have mainly focused on the high pH of ARW; consequently, the efficacy and mechanism of weak ARW have been rarely studied. Currently, ARW-generating devices are widely used to replace water purifiers. Given that people drink large amounts of water throughout their lives, it is necessary to understand the effect of ARW at different pH values. Thus, the purpose of this research was to explore the antioxidant properties of weak ARW, focusing especially on pH 8.5, and comparing it with the efficacy of weak ARW at pH 9.5 in RAW 264.7 monocyte/macrophage cell line. Furthermore, we assessed the potential mechanism by which weak ARW exerts an anti-oxidative effect by measuring MAPK-related protein expression.

2. Materials and Methods

2.1. Reagents and Antibodies

Cytiva Hyclone provided Dulbecco’s Modified Eagle Medium (DMEM) (South Logan, UT, USA). GibcoTM (Invitrogen, Carlsbad, CA, USA) supplied the penicillin/streptomycin (antibiotic) solution, and Hyclone Laboratories, Inc. gave the fetal bovine serum (FBS) (South Logan, UT, USA). Sigma-Aldrich contributed to the lipopolysaccharide (LPS, serotype O111:B4) (Gillingham, UK). Daejung produced 30 percent of the H2O2 (Siheung-si, Gyeonggi-do, Korea). Quanti-MaxTM (BIOMAX Co., Seoul, Korea) furnished the Cell Counting Kit-8 (CCK-8) and Sigma-Aldrich Inc. offered the 2’7’-dicholodihydrofluorescin diacetate (DCFH-DA) reagent (St. Louis, MO, USA). iNtRON Biotechnology (Sungnam, South Korea) supplied the NO reagent (Griess reagent kit), while BioVision Inc. supplied the catalase assay kit, glutathione peroxidase (GPx) assay kit, and calcium (Ca2+) colorimetric test kit (Milpitas, CA, USA). Takara Bio Inc. provided the Takara BCA Protein Assay Kit (Kusatsu, Japan). Rabbit monoclonal IgM antibodies recognizing phospho-p38 (p-p38), phospho-c-Jun N-terminal kinase (p-JNK), phospho-extracellular signal-related kinase (p-ERK), and β-actin (dilution 1:2000) were used as primary antibodies, and horseradish peroxidase-linked anti-rabbit IgG obtained from Cell Signaling Technology (Danvers, MA, USA) was applied as the secondary antibody (dilution 1:5000).

Characteristics of Alkaline Reduced Water

ARW was produced by using an ARW generating device (EP-5001, Hanumul Co., Ltd., Goyang-si, Republic of Korea), which is equipped with a dual electrolysis system, and TW was used as control. To confirm the properties of the experimental water samples (TW, ARW at pH 8.5 [ARW_8.5], and ARW at pH 9.5 [ARW_9.5]), pH (HM-31P, TOA DKK, Tokyo, Japan), ORP (RM-30P, TOA DKK, Tokyo, Japan), TDS (BOMEX, Beijing, China), and H2 (MARK-509, Dissolved Hydrogen Meter, Nizhny Novgorod, Russia) were measured, and the results are shown in Table 1.

2.2. Experimental Design

RAW 264.7 murine macrophage cells were thawed and sub-cultured following specific groups for 5 days. For the induction of OS, cells were exposed to 200 µmol/mL H2O2 for 2 h and 10 µg/mL LPS for 24 h before treatment with TW, ARW_8.5, and ARW_9.5 for 24 h (HAN-ICH2000, Hanumul Co., Ltd., Goyang-si, Korea). On day 7 of the experiment, the cells were collected, and cell viability, ROS, NO, antioxidant enzyme activities (GPx and catalase), and intracellular Ca2+ levels were measured. Additionally, MAPK signaling pathway-related proteins such as p-p38, p-JNK, and p-ERK were evaluated by western blotting.

2.3. Cell Culture and LPS Stimulation

RAW 264.7 macrophage cells (American Type Cell Culture Collection, Rockville, MD, USA) were cultivated in DMEM with 10% FBS and 1% antibiotic in 75 mm flasks at 37 °C with 5% CO2 in a humidified atmosphere to determine the optimal concentration and time for LPS stimulation. In these investigations, RAW 264.7 cells were seeded at a density of 5 × 10³ cells per well. The cells were treated with different concentrations of LPS (0.4, 2, and 10 µg/mL) for 6, 12, 24, and 48 h after achieving 80 percent confluence. Cell viability was evaluated using the CCK-8 test kit according to the manufacturer’s instructions.

2.4. Cell Culture and H2O2 Stimulation

RAW 264.7 macrophage cells (American Type Cell Culture Collection, Rockville, MD, USA) were cultivated in DMEM with 10% FBS and 1% antibiotic in 75 mm flasks at 37 °C with 5% CO2 in a humidified atmosphere to determine the optimal concentration and time for H2O2 stimulation. In these investigations, RAW 264.7 cells (5 × 10³ cells per well) were performed. The cells were treated with 50, 100, and 200 μmol/mL H2O2 for 30, 60, 90, and 120 min after achieving 80 percent confluence. Following the manufacturer’s instructions, the CCK-8 test kit was used to assess cell viability.

2.5. Cell Proliferation Assay

RAW 264.7 macrophage cells were planted with a density of 1 × 10⁴ cells per well in a 96-well plate and incubated for 24 h at 37 °C in 5% CO2. The cells were treated with H2O2 or LPS for the indicated periods and concentrations. After being washed twice with 1X PBS, the CCK-8 test kit was used to assess cell proliferation, and the manufacturer’s protocol was followed.

2.6. Analysis of OS Marker Levels

Following the manufacturer’s instructions, ROS levels were identified by the DCFH-DA reagent. Before being treated with H2O2 or LPS for the indicated periods and concentrations, RAW 264.7 cells were plated in 96-well black plates (1 × 10⁴ cells per well). After that, the cells were treated by ARW following indicated concentrations and time. The cells were then rinsed twice with 1X PBS before being replaced with a mixture of 20 µL of lysis buffer and 30 µL of 1X PBS. After that, 100 µL of 10 µM DCFH-DA was added to each well, and the plate was incubated at 37 °C for 30 min. The fluorescence was measured at 488 nm excitation/525 nm emission using a DTX multi-mode microplate reader (Beckman Coulter Inc., Brea, CA, USA).
Following the manufacturer’s instructions, NO levels were assessed using the Griess reagent (iNtRON). Before the cells were treated with H2O2 or LPS, the cells were plated in 96-well plates (1 × 10⁴ cells per well). After that, the cells were treated by ARW following indicated concentrations and time. The cells were then rinsed twice with 1X PBS before being replaced with a mixture of 20 µL of lysis buffer and 30 µL of 1X PBS. Finally, cells were exposed to Griess reagent and incubated at room temperature (RT) (20–22 °C) for 15 min, as per the manufacturer’s procedure. Spectra-Max® ABS Plus was used to measure the absorbance at 540 nm (Molecular Devices, San Jose, CA, USA).

2.7. Analysis of Antioxidant Enzyme Activities

BioVision kit (BioVision, Inc., Milpitas, CA, USA) was used to assess the intracellular levels of endogenous antioxidant enzymes (catalase and GPx) according to the manufacturer’s instructions. Cell lysates collected from 6-well plate cell seeding (0.2 × 10⁶ cells per well) were centrifuged at 10,000 rpm for 15 min at 4 °C. According to the manufacturer’s instructions, the cell supernatant was assayed to measure catalase and GPx activities. In a 96-well microplate, 50 µL of samples for the catalase test and 50 µL of samples for the GPx assay were added, and the plates were incubated for 30 min. A SpectraMax® ABS Plus was used to detect the optical densities of catalase at 570 nm and GPx at 340 nm (Molecular Devices, San Jose, CA, USA). Both enzyme activities were measured in nanomoles per milliliter (nmol/mL).

2.8. Ca2+ Assay

Following the manufacturer’s instructions, intracellular Ca2+ levels were determined using a Ca2+ colorimetric assay kit (Bio-Vision, Mountain View, CA, USA). Cell lysates, which were collected from 6-well plate cell seeding (0.2 × 10⁴ cells per well), were prepared with Ca2+ assay buffer and centrifuged at 10,000 rpm for 10 min at 4 °C. The supernatant was collected to assess intracellular Ca2+ levels. Briefly, 50 µL of samples were placed in a 96-well microplate, which was then incubated for 30 min. Using a Spectra-Max® ABS Plus, the optical density of each well was measured at 590 nm (Molecular Devices, San Jose, CA, USA). The results were given in milligrams per deciliter (mg/dL).

2.9. Western Blot Analysis

The cell supernatant, which was normalized protein concentrations, was loaded equally and separated on a sodium dodecyl sulfate-polyacrylamide gel electrophoresis before being electrophoretically transferred onto polyvinylidene difluoride membranes (Sartorius, Bohemia, NY, USA). The membrane was then blocked for 2 h at room temperature with protein-free blocking buffer (Takara Bio Inc., Kusatsu, Japan) before being incubated overnight at 4 °C with the primary anti-bodies p-p38, p-JNK, p-ERK, and β-actin (dilution: 1:2000; Cell Signaling Technology, Inc., Danvers, MA, USA) in Tris-buffered saline/Tween 20 (1X TBST) containing 5% bovine. The membrane was then incubated for 2 h at RT with a horseradish peroxidase-conjugated anti-rabbit secondary antibody (dilution 1:2000; Cell Signaling Technology). An enhanced chemiluminescence kit (ECL Pierce Biotechnology) UVP Bio Spectrum 600 Imaging System was used to detect bound antibodies (UVP, LLC, Upland, CA, USA). As a loading control for total protein content, β-actin (dilution 1: 2000, Cell Signaling Technology, Inc., Danvers, MA, USA ) was utilized. ImageJ was used to examine band intensity (Version 150-win Java, USA).

2.10. Data Management and Statistical Analysis

The mean ± standard error of the mean was used to depict data (SEM). All data were normalized, and fold changes were calculated relative to the normal control. Two-way analysis of variance (ANOVA) was used to examine and compare the data, followed by a multiple comparison test using the GraphPad Prism 8.0 software package (GraphPad, La Jolla, CA, USA). Statistical significance was defined as a difference of p < 0.05.

3. Results

3.1. Effect of Alkaline Reduced Water on Cell Viability in H2O2− and Lipopolysaccharide-Induced RAW 264.7 Murine Macrophage Cells

The viability of cells treated with H2O2 and LPS was significantly decreased (both p < 0.001) compared to the normal control group. However, cells treated with ARW_8.5 showed a similar increase in cell viability as those treated with ARW_9.5, which was not observed in TW-treated cells. Upon treatment of ARW, the cell viability of the ARW_9.5 group was significantly increased at 0.1% (p < 0.001 and p < 0.001), 1% (p < 0.001 and p < 0.001), and 10% (p < 0.001 and p < 0.001) compared to that of Con/H2O2 and Con/LPS groups. Moreover, the cell viability of the ARW_8.5 group was significantly increased at 0.1% (p < 0.05 and p < 0.05), 1% (p < 0.01 and p < 0.001), and 10% (p < 0.01 and p < 0.001) compared to that of Con/H2O2 and Con/LPS groups. However, cells treated with TW did not show any significant change in viability compared to Con/H2O2 and Con/LPS groups (Figure 1).

3.2. Effect of Alkaline Reduced Water on OS Production in H2O2− and Lipopolysaccharide-Induced RAW 264.7 Murine Macrophage Cells

The cells treated with ARW_8.5 showed a similar increase in the reduction of OS production as those treated with ARW_9.5. ROS and NO levels of Con/H2O2 and Con/LPS groups were significantly increased compared to those of the normal control group (p < 0.001) (Figure 2). After treatment with ARW, ROS levels were dramatically decreased by 1% (p < 0.01) and 10% (p < 0.001) in ARW_8.5 and ARW_9.5 groups compared to those in the Con/H2O2 group. However, ROS levels were significantly increased in the TW group at 1% (p < 0.05) and 10% (p < 0.01) (Figure 2A). With LPS induction, ROS levels were significantly decreased in the ARW_9.5 group at 0.1% (p < 0.001), 1% (p < 0.001), and 10% (p < 0.001) compared to those in the Con/LPS group. Similarly, ROS levels were significantly decreased in the ARW 8.5 group at 1% (p < 0.001) and 10% (p < 0.001) compared to those in the Con/LPS group (Figure 2B). Levels of NO were significantly decreased in a concentration-dependent manner in the ARW_9.5 group at 0.1% (p < 0.001 and p < 0.01), 1% (p < 0.001 and p < 0.001), and 10% (p < 0.001 and p < 0.001) compared to those in Con/H2O2 and Con/LPS groups. Similarly, NO levels were significantly decreased in the ARW_8.5 group at 0.1% (p < 0.05 and p < 0.01), 1% (p < 0.001 and p < 0.001), and 10% (p < 0.001 and p < 0.001) compared to those in Con/H2O2 and Con/LPS groups (Figure 2C,D).

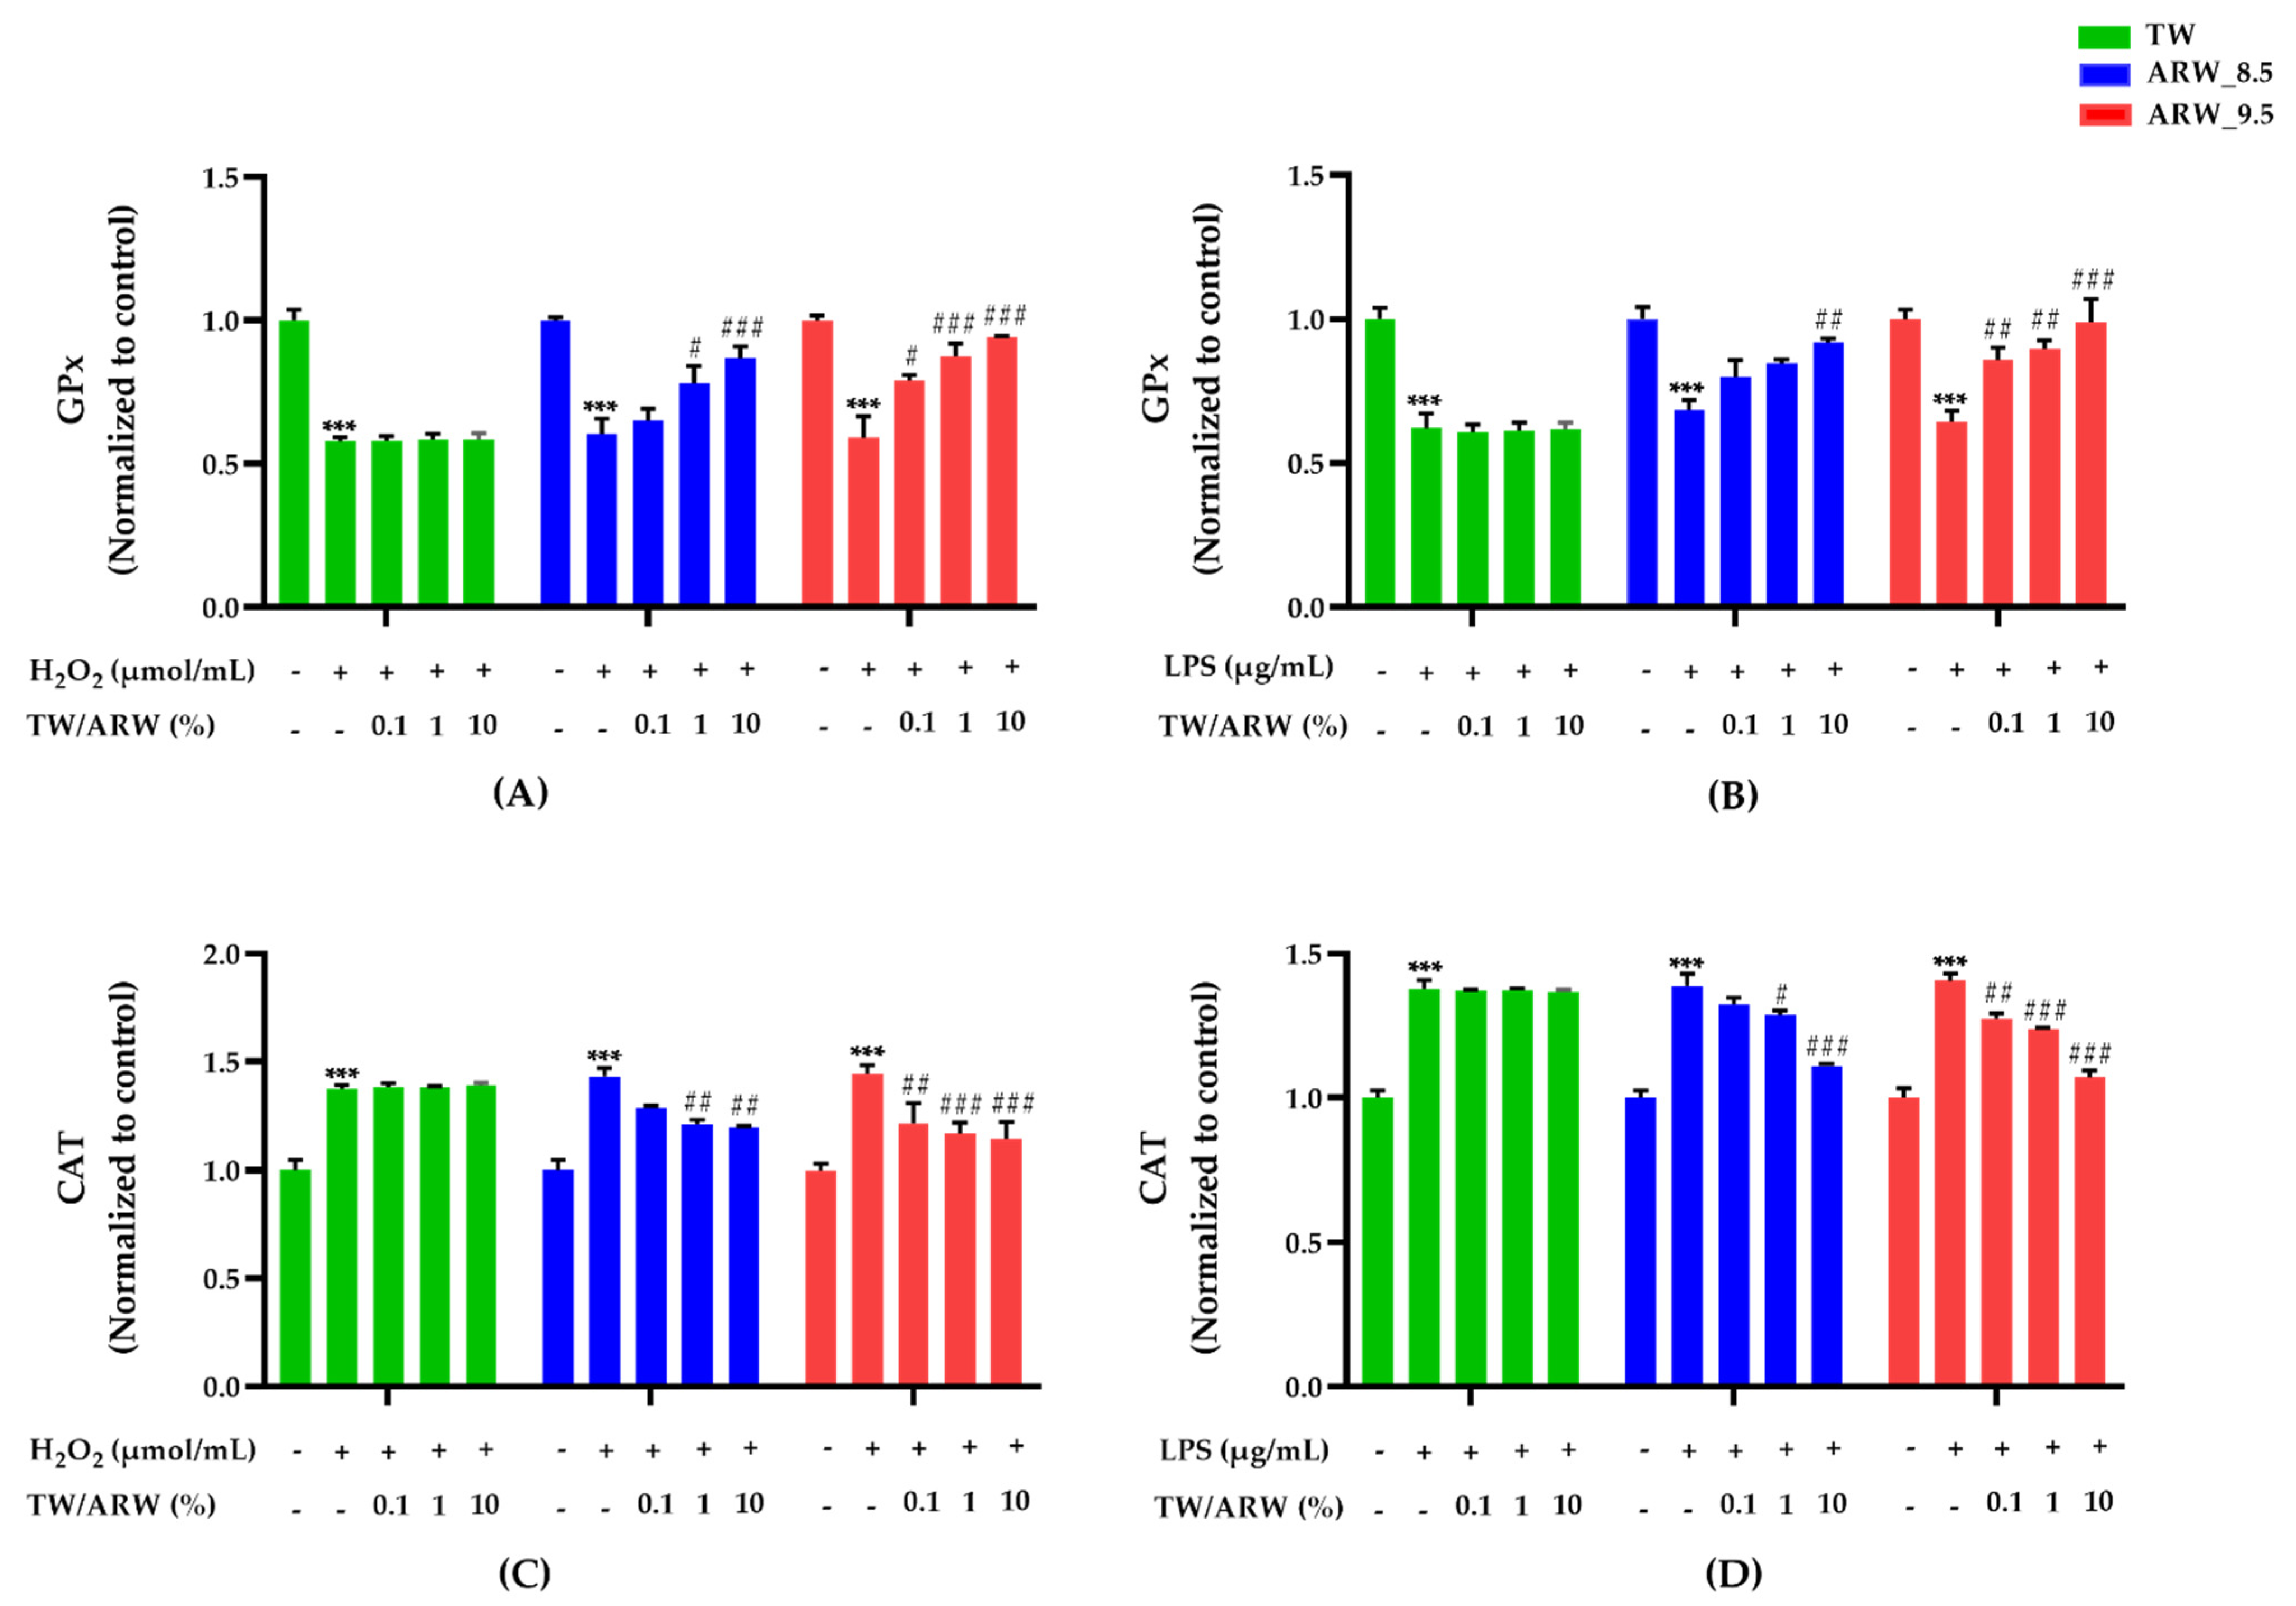
3.3. Effect of Alkaline Reduced Water on GPx and Catalase Activity in H2O2− and Lipopolysaccharide-Induced RAW 264.7 Murine Macrophage Cells

Stimulation of cells with H2O2 and LPS induced a significant decrease in GPx activity and an increase in catalase activity (both p < 0.001). However, the activities showed significant differences after treatment with ARW in a concentration-dependent manner, while there was no difference in the TW treatment group. Moreover, both ARW groups showed a similar trend in the activity of GPx and catalase (Figure 3). The activity of GPx was significantly increased after treatment of cells with ARW_9.5 at 0.1% (p < 0.05 and p < 0.01), 1% (p < 0.001 and p < 0.01), and 10% (p < 0.001 and p < 0.01) compared to that in Con/H2O2 and LPS groups. Moreover, the activity of GPx was significantly increased after treatment of cells with ARW_8.5 at 1% (p < 0.05 vs. Con/H2O2) and 10% (p < 0.001 vs. Con/H2O2 and p < 0.001 vs. Con/LPS) (Figure 3A,B). In contrast, catalase activity in the ARW_9.5 group was significantly decreased at 0.1% (p < 0.01 and p < 0.01), 1% (p < 0.001 and p < 0.001), and 10% (p < 0.001 and p < 0.001) compared to that in Con/H2O2 and Con/LPS groups. Catalase activity in the ARW_8.5 group showed a significant decrease at 1% (p < 0.01 and p < 0.05) and 10% (p < 0.01 and p < 0.001), respectively, compared to that in Con/H2O2 and Con/LPS groups (Figure 3C,D).

3.4. Effect of Alkaline Reduced Water on Intracellular Ca2+ Levels in H2O2− and Lipopolysaccharide-Induced RAW 264.7 Murine Macrophage Cells

Intracellular Ca2+ levels were significantly increased in cells treated with H2O2 and LPS; however, they were decreased in a concentration-dependent manner after treatment of cells with ARW_8.5 and ARW_9.5, with a similar decreasing pattern (Figure 4). Upon treatment with ARW_9.5, Ca2+ levels were significantly decreased at 0.1% (p < 0.05, p < 0.05), 1% (p < 0.001 and p < 0.001), and 10% (p < 0.001 and p < 0.001) compared to those in Con/H2O2 and Con/LPS groups. Moreover, Ca2+ levels were significantly decreased in the ARW_8.5 group at 1% (p < 0.01 and p < 0.01) and 10% (p < 0.001 and p < 0.001) compared to those in the Con/H2O2 and Con/LPS groups. However, cells treated with TW did not show any significant change in Ca2+ levels compared to Con/H2O2 and Con/LPS groups (Figure 4).

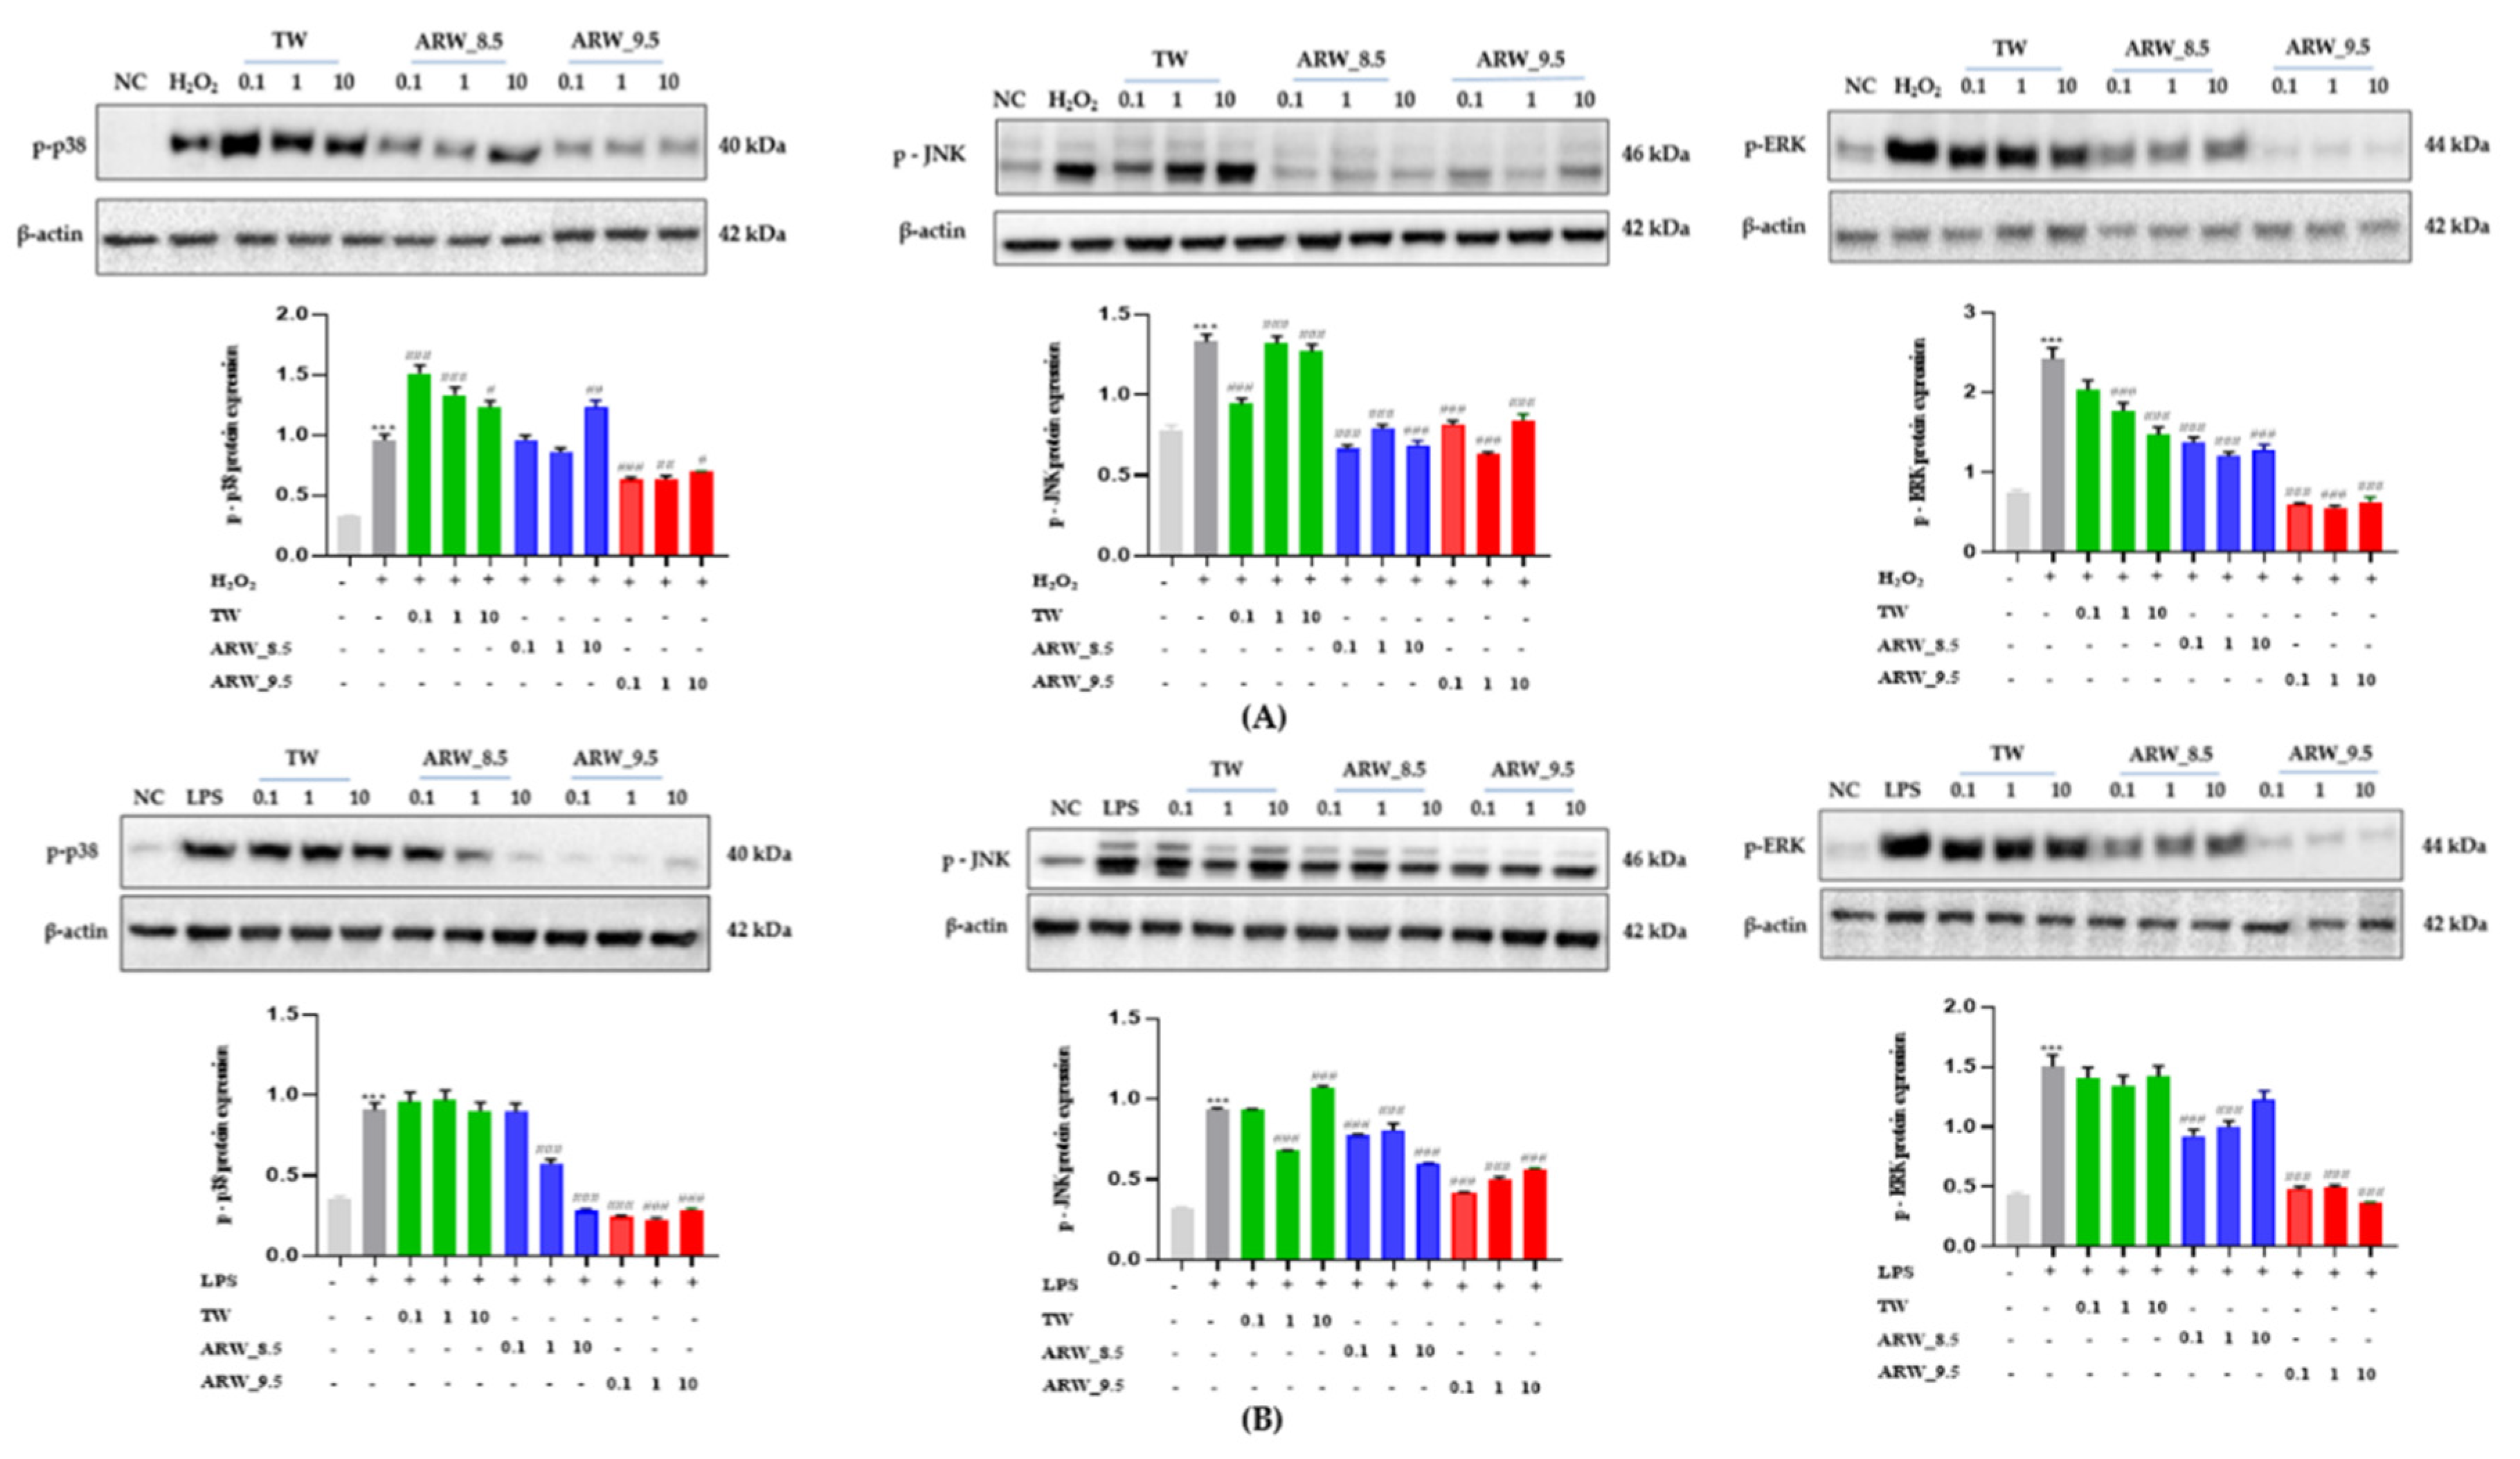
3.5. Effect of Alkaline Reduced Water on p-p38, p-JNK, and p-ERK Expression in H2O2− and Lipopolysaccharide-Induced RAW 264.7 Murine Macrophage Cells

The expression of p-p38, p-JNK, and p-ERK was increased significantly after treatment of cells with H2O2 and LPS compared to that in the normal control group (p < 0.001, respectively). Upon treatment with ARW_8.5 and ARW_9.5, the expression of p-p38, p-JNK, and p-ERK was significantly decreased in the ARW_8.5-and ARW_9.5 groups compared to the Con/H2O2 and Con/LPS groups, respectively. However, the expression levels of p-p38, p-JNK, and p-ERK were lower in the ARW_8.5 group than in the ARW_9.5 group (Figure 5).

4. Discussion

There has been an increase in not only interest but also skepticism on the use of functional water to improve one’s health. While several studies have shown the protective and therapeutic effects of ARW, issues with the continuous use of ARW at high pH still arise. The preference for high pH is strongly related to the effectiveness of ARW based on accumulated data. In this research, we identified the anti-oxidative effect of weak ARW (pH 8.5) compared with TW and ARW_9.5 in RAW 264.7 murine macrophage cells. Moreover, weak ARW is characterized by a higher H2, negative ORP, and alkalinity as compared to TW (Table 1). While most studies used ARW at pH levels of 9.5 to 10.5, relatively few studies have reported the effect of weak ARW, such as ARW at pH 8.5 [3,8,12]. Additionally, to our knowledge, there have been no reports evaluating its effect using an immune macrophage cell line.
Macrophages, which are found in all tissues, are immune cells that play an important role in the defense, homeostasis, and pathogenesis of infectious diseases [24]. Cells of the innate immune system engage in bacterial phagocytosis and secrete both anti-inflammatory and antimicrobial mediators via macrophages. In addition, diseased and damaged cells are eliminated through programmed cell death [25]. Therefore, they are commonly used in in vitro and in vivo assessments of pathophysiological roles in human diseases [26,27,28]. As mentioned, RAW 264.7 cell line is considered a suitable macrophage type due to its stable phenotype and functional characteristics and is ideal for studying cellular responses [17,18,19]. Our study first evaluated the effects of weak ARW (pH 8.5 and pH 9.5) on cell viability after induction of OS by H2O2 or LPS stimulation. Induction of H2O2 and LPS reduced cell viability greatly, as expected, but ARW_8.5, like ARW_9.5, dramatically recovered H2O2− and LPS-induced cell viability when compared to the Con/H2O2 and Con/LPS groups. (Figure 2).
In addition, we evaluated ROS and NO generation in H2O2− and LPS-induced murine macrophage cell lines following ARW 8.5 treatment to determine the anti-oxidative effect. In reaction to phagocytosis, macrophages generate and release reactive oxygen species (ROS) [29]. However, an excessive increase in ROS levels can activate signaling pathways and can damage DNA, proteins, or lipids [30]. Additionally, dysregulation of NO production, which causes OS responses in the immune system, is caused by ROS accumulation [30,31]. After H2O2 and LPS induction, ARW lowered ROS and NO levels in murine macrophage cells in a concentration-dependent manner (Figure 3). Our data showed that ARW_8.5 minimize the excessive production of damaging oxidative stress in the cell. Moreover, weak ARW demonstrated efficacy in boosting antioxidant effects against H2O2− and LPS-induced OS, which was compatible to our ROS and NO results, but TW did not. GPx and catalase are antioxidant enzymes that could rescue cells from OS. [32]. In this study, weak ARW mediated the activities of GPx and catalase after H2O2 and LPS induction, showing its antioxidant capacity (Figure 3). These antioxidants are well known for their role in the decrease of OS effectors such ROS and NO, as well as the antioxidant increase in macrophage cell lines [32,33]. Compared to previous studies on the effects of ARW at pH ranging from 9.5 to 10.5, our study on ARW at pH 8.5 confirmed its efficacy in mediating the expression of these OS markers and exerting significant antioxidant effects (Figure 4).
Additionally, to confirm the effectiveness of weak ARW against OS, we assessed intracellular Ca2+ levels. Normally, Ca2+ involves various transport channels and maintains cellular functions [34]. However, Ca2+ overload can stimulate the MAPK signaling pathway and increase ROS and OS responses [35,36]. In the present study, our results showed that ARW_8.5 rescued the cells from the accumulation of high intracellular Ca2+ concentrations (Figure 5). Therefore, our results suggest that similar to ARW_9.5, the long-term intake of weak ARW may reduce ROS and NO generation and can decrease intracellular Ca2+ levels.
Moreover, the current research focused on the MAPK signaling pathway to fully explain the therapeutic mechanism of ARW against H2O2− and LPS-induced OS response. The downstream proteins of the MAPK signaling pathway, which is one of three primary pathways involved in early OS and cell viability, are p-p38, p-JNK, and p-ERK. [37]. Furthermore, the results of western blot analysis showed that weak ARW decreased the H2O2− and LPS-induced expression of MAPK signaling proteins, including p-p38, p-JNK, and p-ERK (Figure 5). Our results also showed that ARW_8.5 has similar effects as ARW at pH 9.5, inhibiting the expression of proteins associated with these signaling pathways.
The therapeutic action of weak ARW may be attributed to its higher H2 concentration. Previous studies have reported that H2 is a potential treatment option for OS, and clinical applications of weak ARW has been reported in countries such as Japan, China, Korea, and the USA [38,39]. ORP and alkaline pH effectiveness have also been evaluated in studies of alkaline electrolyzed water, which also increases antioxidant levels and reduces OS response [33,40,41]. The current study, however, has certain limitations. The study simply reported on the anti-oxidative benefits of weak ARW in vitro. Only one macrophage cell line was used (RAW264.7) and more studies using different types of other immune cell lines or tissue-specific cell lines and further study in vivo and clinical investigations may be required to fully assess its effect. Our study also focused solely on the MAPK signaling pathway to corroborate the anti-oxidative benefits. However, specific studies such as deletion of these MAPK pathways will confirm the reported results. Moreover, more research into signaling pathways is required to completely understand the molecular mechanism of anti-oxidative effect. Remarkably, the anti-oxidative effect of weak ARW at pH 8.5 was comparable to that of ARW_9.5, suggesting that weak ARW can be consumed daily for health improvement.

5. Conclusions

Taken together, this is a primary study to show that weak ARW with pH 8.5 has anti-oxidative effect in RAW 264.7 murine macrophage cells through inhibiting the MAPK signaling pathway. In particular, in comparison to ARW_9.5, we discovered that ARW_8.5 also had a positive mediation in the parameters such as cell survival, OS, antioxidant, intracellular Ca2+ levels, and expression of MAPK signaling pathway-related proteins. To our knowledge, this in vitro study may be the first to demonstrate that weak ARW with pH 8.5 has an anti-oxidative effect on the body. As a result, consuming weak ARW daily could be an effective method for preventing OS-related diseases. In addition, the therapeutic potential of weak ARW (pH 8.5) may answer partly the earlier skepticism and debate over the safety and efficacy of the long-term consumption of ARW.

Author Contributions

Conceptualization, K.-J.L.; writing—original draft preparation, T.T.T.; writing—review and editing, T.T.T., A.F. and J.B.; data curation, T.T.T., S.S., S.-H.G. and M.H.R.; visualization, C.-S.K.; supervision, K.-J.L., S.-S.K. and W.-R.K. All authors have read and agreed to the published version of the manuscript.

Funding

This research received no external funding.

Institutional Review Board Statement

Not applicable.

Informed Consent Statement

Not applicable.

Data Availability Statement

All the data are contained within the article.

Acknowledgments

This study was supported by Hanumul Co., Ltd. (Goyang-si, Korea). The authors would like to thank Editage (Cactus Communications Korea Ltd., Seoul, South Korea) for language editing.

Conflicts of Interest

The authors declare no conflict of interest.

References

  1. Tanaka, Y.; Saihara, Y.; Izumotani, K.; Nakamura, H. Daily ingestion of alkaline electrolyzed water containing hydrogen influences human health, including gastrointestinal symptoms. Med. Gas Res. 2018, 8, 160–166. [Google Scholar] [CrossRef]
  2. Qian, L.; Shen, J.; Sun, X. Methods of hydrogen application. In Hydrogen Molecular Biology and Medicine; Sun, X., Ohta, S., Nakao, A., Eds.; Springer: Dordrecht, The Netherlands, 2015; pp. 99–107. [Google Scholar]
  3. Park, S.K.; Qi, X.F.; Song, S.B.; Kim, D.H.; Teng, Y.C.; Yoon, Y.S.; Kim, K.Y.; Li, J.H.; Jin, D.; Lee, K.J. Electrolyzed-reduced water inhibits acute ethanol-induced hangovers in sprague-dawley rats. BioMed. Res. 2009, 30, 263–269. [Google Scholar] [CrossRef] [Green Version]
  4. Jéquier, E.; Constant, F. Water as an essential nutrient: The physiological basis of hydration. Eur. J. Clin. Nutr. 2010, 64, 115–123. [Google Scholar] [CrossRef] [PubMed] [Green Version]
  5. Johnson, E.C.; Adams, W.M. Water intake, body water regulation and health. Nutrients 2020, 12, 702. [Google Scholar] [CrossRef] [Green Version]
  6. Islam, R.; Faysal, S.M.; Amin, R.; Juliana, F.M.; Islam, M.J.; Alam, J.; Hossain, M.N.; Asaduzzaman, M. Assessment of ph and total dissolved substances (tds) in the commercially available bottled drinking water. IOSR J. Nurs. Health Sci. 2017, 6, 35–40. [Google Scholar] [CrossRef]
  7. Yang, E.J.; Kim, J.R.; Ryang, Y.S.; Kim, D.H.; Deung, Y.K.; Park, S.K.; Lee, K.J. A clinical trial of orally administered alkaline reduced water. Biomed. Sci. Lett. 2007, 13, 83–89. [Google Scholar]
  8. Magro, M.; Corain, L.; Ferro, S.; Baratella, D.; Bonaiuto, E.; Terzo, M.; Corraducci, V.; Salmaso, L.; Vianello, F. Alkaline water and longevity: A murine study. Evid. Based Complement Alternat. Med. 2016, 2016, 3084126. [Google Scholar] [CrossRef] [Green Version]
  9. Hanaoka, K. Antioxidant effects of reduced water produced by electrolysis of sodium chloride solutions. J. Appl. Electrochem. 2001, 31, 1307–1313. [Google Scholar] [CrossRef]
  10. Naito, Y.; Takagi, T.; Uchiyama, K.; Tomatsuri, N.; Matsuyama, K.; Fujii, T.; Yagi, N.; Yoshida, N.; Yoshikawa, T. Chronic administration with electrolyzed alkaline water inhibits aspirin-induced gastric mucosal injury in rats through the inhibition of tumor necrosis factor-α expression. J. Clin. Biochem. Nutr. 2002, 32, 69–81. [Google Scholar] [CrossRef] [Green Version]
  11. Jin, D.; Ryu, S.H.; Kim, H.W.; Yang, E.J.; Lim, S.J.; Ryang, Y.S.; Chung, C.H.; Park, S.K.; Lee, K.J. Anti-diabetic effect of alkaline-reduced water on oletf rats. Biosci. Biotech. Bioch. 2006, 70, 31–37. [Google Scholar] [CrossRef] [Green Version]
  12. Logozzi, M.; Mizzoni, D.; Di Raimo, R.; Andreotti, M.; Macchia, D.; Spada, M.; Fais, S. In vivo antiaging effects of alkaline water supplementation. J. Enzyme Inhib. Med. Chem. 2020, 35, 657–664. [Google Scholar] [CrossRef]
  13. Choi, Y.A.; Lee, D.H.; Cho, D.Y.; Lee, Y.J. Outcomes assessment of sustainable and innovatively simple lifestyle modification at the workplace-drinking electrolyzed-reduced water (oasis-erw): A randomized, double-blind, placebo-controlled trial. Antioxidants 2020, 9, 564. [Google Scholar] [CrossRef]
  14. Pizzino, G.; Irrera, N.; Cucinotta, M.; Pallio, G.; Mannino, F.; Arcoraci, V.; Squadrito, F.; Altavilla, D.; Bitto, A. Oxidative stress: Harms and benefits for human health. Oxidative Med. Cell. Longev. 2017, 2017, 8416763. [Google Scholar] [CrossRef]
  15. Seo, D.W.; Yi, Y.J.; Lee, M.S.; Yun, B.S.; Lee, S.M. Differential modulation of lipopolysaccharide-induced inflammatory cytokine production by and antioxidant activity of fomentariol in raw264.7 cells. Mycobiology 2015, 43, 450–457. [Google Scholar] [CrossRef] [Green Version]
  16. Nakao, N.; Kurokawa, T.; Nonami, T.; Tumurkhuu, G.; Koide, N.; Yokochi, T. Hydrogen peroxide induces the production of tumor necrosis factor-alpha in raw 264.7 macrophage cells via activation of p38 and stress-activated protein kinase. Innate. Immun. 2008, 14, 190–196. [Google Scholar] [CrossRef]
  17. Taciak, B.; Białasek, M.; Braniewska, A.; Sas, Z.; Sawicka, P.; Kiraga, Ł.; Rygiel, T.; Król, M. Evaluation of phenotypic and functional stability of raw 264.7 cell line through serial passages. PLoS ONE 2018, 13, e0198943. [Google Scholar] [CrossRef]
  18. Berghaus, L.J.; Moore, J.N.; Hurley, D.J.; Vandenplas, M.L.; Fortes, B.P.; Wolfert, M.A.; Boons, G.-J. Innate immune responses of primary murine macrophage-lineage cells and raw 264.7 cells to ligands of toll-like receptors 2, 3, and 4. Comp. Immunol. Microbiol. Infect. Dis. 2010, 33, 443–454. [Google Scholar] [CrossRef] [Green Version]
  19. Chamberlain, L.M.; Godek, M.L.; Gonzalez-Juarrero, M.; Grainger, D.W. Phenotypic non-equivalence of murine (monocyte-) macrophage cells in biomaterial and inflammatory models. J. Biomed. Mater. Res. A 2009, 88, 858–871. [Google Scholar] [CrossRef]
  20. Bardaweel, S.K.; Gul, M.; Alzweiri, M.; Ishaqat, A.; HA, A.L.; Bashatwah, R.M. Reactive oxygen species: The dual role in physiological and pathological conditions of the human body. Eurasian J. Med. 2018, 50, 193–201. [Google Scholar] [CrossRef]
  21. Bustos, M.C.; Vignola, M.B.; Paesani, C.; León, A.E. Berry fruits-enriched pasta: Effect of processing and in vitro digestion on phenolics and its antioxidant activity, bioaccessibility and potential bioavailability. Int. J. Food Sci. Technol. 2020, 55, 2104–2112. [Google Scholar] [CrossRef]
  22. Yang, M.; Dong, Y.; He, Q.; Zhu, P.; Zhuang, Q.; Shen, J.; Zhang, X.; Zhao, M. Hydrogen: A novel option in human disease treatment. Oxidative Med. Cell. Longev. 2020, 2020, 8384742. [Google Scholar] [CrossRef]
  23. Asada, R.; Tazawa, K.; Sato, S.; Miwa, N. Effects of hydrogen-rich water prepared by alternating-current-electrolysis on antioxidant activity, DNA oxidative injuries, and diabetes-related markers. Med. Gas Res. 2020, 10, 114–121. [Google Scholar] [CrossRef] [PubMed]
  24. Martinez, F.O.; Sica, A.; Mantovani, A.; Locati, M. Macrophage activation and polarization. Front. Biosci. 2008, 13, 453–461. [Google Scholar] [CrossRef] [Green Version]
  25. Hirayama, D.; Iida, T.; Nakase, H. The phagocytic function of macrophage-enforcing innate immunity and tissue homeostasis. Int. J. Mol. Sci. 2018, 19, 92. [Google Scholar] [CrossRef] [PubMed] [Green Version]
  26. Wynn, T.A.; Chawla, A.; Pollard, J.W. Macrophage biology in development, homeostasis and disease. Nature 2013, 496, 445–455. [Google Scholar] [CrossRef] [PubMed]
  27. Gordon, S. The macrophage. Bioessays 1995, 17, 977–986. [Google Scholar] [CrossRef]
  28. Gordon, S. The macrophage: Past, present and future. Eur. J. Immunol. 2007, 37, S9–S17. [Google Scholar] [CrossRef]
  29. Forman, H.J.; Torres, M. Redox signaling in macrophages. Mol. Asp. Med. 2001, 22, 189–216. [Google Scholar] [CrossRef]
  30. Juan, C.A.; de la Lastra, J.M.P.; Plou, F.J.; Perez-Lebena, E. The chemistry of reactive oxygen species (ros) revisited: Outlining their role in biological macromolecules (DNA, lipids and proteins) and induced pathologies. Int. J. Mol. Sci. 2021, 22, 4642. [Google Scholar] [CrossRef]
  31. Zhao, J. Interplay among nitric oxide and reactive oxygen species: A complex network determining cell survival or death. Plant Signal. Behav. 2007, 2, 544–547. [Google Scholar] [CrossRef] [Green Version]
  32. Ighodaro, O.M.; Akinloye, O.A. First line defence antioxidants-superoxide dismutase (sod), catalase (cat) and glutathione peroxidase (gpx): Their fundamental role in the entire antioxidant defence grid. Alex. J. Med. 2018, 54, 287–293. [Google Scholar] [CrossRef] [Green Version]
  33. Begum, R.; Kim, C.S.; Fadriquela, A.; Bajgai, J.; Jing, X.Y.; Kim, D.H.; Kim, S.K.; Lee, K.J. Molecular hydrogen protects against oxidative stress-induced raw 264.7 macrophage cells through the activation of nrf2 and inhibition of mapk signaling pathway. Mol. Cell Toxicol. 2020, 16, 103–118. [Google Scholar] [CrossRef]
  34. Kinjo, T.G.; Schnetkamp, P.P. Ca2+ Chemistry, Storage and Transport in Biologic Systems: An Overview. Madame Curie Bioscience Database. Available online: https://www.ncbi.nlm.nih.gov/books/NBK5959/ (accessed on 1 September 2021).
  35. Peng, T.I.; Jou, M.J. Oxidative stress caused by mitochondrial calcium overload. Ann. N. Y. Acad. Sci. 2010, 1201, 183–188. [Google Scholar] [CrossRef] [PubMed]
  36. White, C.D.; Sacks, D.B. Regulation of map kinase signaling by calcium. In Map Kinase Signaling Protocols: Methods in Molecular Biology (Methods and Protocols); Seger, R., Ed.; Humana Press: Totowa, NJ, USA, 2010; Volume 661, pp. 151–165. [Google Scholar]
  37. Zhang, W.; Liu, H.T. Mapk signal pathways in the regulation of cell proliferation in mammalian cells. Cell Res. 2002, 12, 9–18. [Google Scholar] [CrossRef]
  38. Ichihara, M.; Sobue, S.; Ito, M.; Ito, M.; Hirayama, M.; Ohno, K. Beneficial biological effects and the underlying mechanisms of molecular hydrogen—Comprehensive review of 321 original articles. Med. Gas. Res. 2015, 5, 1–21. [Google Scholar] [CrossRef] [PubMed] [Green Version]
  39. Nishimaki, K.; Asada, T.; Ohsawa, I.; Nakajima, E.; Ikejima, C.; Yokota, T.; Kamimura, N.; Ohta, S. Effects of molecular hydrogen assessed by an animal model and a randomized clinical study on mild cognitive impairment. Curr. Alzheimer Res. 2018, 15, 482–492. [Google Scholar] [CrossRef] [PubMed] [Green Version]
  40. Pérez-Hernández, E.G.; Pedraza-Chaverrí, J. Antioxidant properties of electrolyzed reduced water and hydrogen. Vertientes Rev. Espec. Cienc. Salud 2011, 14, 5–13. [Google Scholar]
  41. Kim, M.J. Strong Reduction Potential of Alkaline Electrolyzed (eo) Water for Preventing Oxidative Damage and Its Antibrowning, Antioxidation, and Anticancer Effects. Ph.D. Thesis, University of Georgia, Athens, GA, USA, 2010. [Google Scholar]
Figure 1. Effect of ARW_8.5 and ARW_9.5 on cell viability in H2O2− and LPS-induced RAW 264.7 murine macrophage cells. Cell toxicity was induced by H2O2 (200 µmol/mL for 2 h) (A) and LPS (10 µg/mL for 24 h) (B), and cells were treated with ARW (pH 8.5 and pH 9.5) at concentrations of 0.1%, 1%, and 10%. Data are expressed as the mean ± standard error of the mean (SEM) of the fold change relative to the control (n = 3). Statistical significance was analyzed with two-way ANOVA. TW: tap water, (−): non-treatment, (+): treatment. ***, p < 0.001 vs. normal control; #, p < 0.05; ##, p < 0.01, and ###, p < 0.001 vs. Con/H2O2 or Con/LPS. Abbreviations: Con, control; ARW, alkaline reduced water; TW, tap water; H2O2, hydrogen peroxide; LPS, lipopolysaccharide.
Processes 09 02062 g001
Figure 2. Effect of ARW_8.5 and ARW_9.5 on the level of ROS and NO in H2O2− and LPS-induced RAW 264.7 murine macrophage cells. The levels of ROS and NO were induced by H2O2 (200 µmol/mL for 2 h) (A,C) and LPS (10 µg/mL for 24 h) (B,D), and the cells were treated with ARW (pH 8.5 and pH 9.5) at concentrations of 0.1%, 1%, and 10%. Data are expressed as the mean ± standard error of the mean (SEM) of the fold change relative to the control (n = 3). Statistical significance was analyzed with two-way ANOVA. (−): non-treatment, (+): treatment. ***, p < 0.001 vs. normal control. #, p < 0.05; ##, p < 0.01, and ###, p < 0.001 vs. Con/H2O2 or Con/LPS. Abbreviations: ARW, alkaline reduced water; TW, tap water; H2O2, hydrogen peroxide; LPS, lipopolysaccharide; ROS, reactive oxygen species; NO, nitric oxide; Con, control.
Processes 09 02062 g002
Figure 3. Effect of ARW at pH 8.5 and pH 9.5 on the activity of antioxidant enzymes (GPx and catalase) in H2O2− and LPS-induced RAW 264.7 murine macrophage cells. Cytotoxicity of cells was induced by H2O2 (200 µmol/mL for 2 h) (A,C) and LPS (10 µg/mL for 24 h) (B,D), and the cells were treated with ARW (pH 8.5 and pH 9.5) at concentrations of 0.1%, 1%, and 10%. Data are expressed as the mean ± standard error of the mean (SEM) of the fold change relative to the control (n = 3). Statistical significance was analyzed with two-way ANOVA. (−): non-treatment, (+): treatment. ***, p < 0.001 vs. normal control. #, p < 0.05; ##, p < 0.01, and ###, p < 0.001 vs. Con/H2O2 or Con/LPS. Abbreviations: ARW, alkaline reduced water; TW, tap water; H2O2, hydrogen peroxide; LPS, lipopolysaccharide; GPx, glutathione peroxide; Con, control.
Processes 09 02062 g003
Figure 4. Effect of ARW_8.5 and ARW_9.5 on intracellular Ca2+ levels in H2O2− and LPS-induced RAW 264.7 murine macrophage cells. Cytotoxicity was induced by H2O2 (200 µmol/mL for 2 h) (A) and LPS (10 µg/mL for 24 h) (B), and the cells were treated with ARW (pH 8.5 and pH 9.5) at concentrations of 0.1%, 1%, and 10%. Data are expressed as the mean ± standard error of the mean (SEM) of the fold change relative to the control (n = 3). Statistical significance was analyzed with two-way ANOVA. (−): non-treatment, (+): treatment. ***, p < 0.001 vs. normal control. #, p < 0.05; ##, p < 0.01, and ###, p < 0.001 vs. Con/H2O2 or Con/LPS. Abbreviations: ARW, alkaline reduced water; TW, tap water; H2O2, hydrogen peroxide; LPS, lipopolysaccharide; Ca2+, intracellular calcium; Con, control.
Processes 09 02062 g004
Figure 5. Effect of ARW_8.5 and ARW_9.5 on the expression of MAPK pathway-related proteins (p-p38, p-JNK, and p-ERK) in H2O2− and LPS-induced RAW 264.7 murine macrophage cells. Cytotoxicity was induced by H2O2 (200 µmol/mL for 2 h) (A) and LPS (10 µg/mL for 24 h) (B), and the cells were treated with ARW (pH 8.5 and pH 9.5) at concentrations of 0.1%, 1%, and 10%. Data are expressed as the mean ± standard error of the mean (SEM) of the fold change relative to the control (n = 3). Statistical significance was analyzed with two-way ANOVA. (−): non-treatment, (+): treatment. ***, p < 0.001 vs. normal control. #, p < 0.05; ##, p < 0.01, and ###, p < 0.001 vs. Con/H2O2 or Con/LPS. Abbreviations: ARW, alkaline reduced water; TW, tap water; H2O2, hydrogen peroxide; LPS, lipopolysaccharide; MAPK, mitogen-activated protein kinase; p-p38, phospho-p38; (p-JNK), phospho-c-Jun amino-terminal kinases; p-ERK, phospho-extracellular signal-regulated kinases; Con, control.
Processes 09 02062 g005
Table 1. Major water physical and chemical components of tap water and alkaline reduced water.
TWARW_8.5ARW_9.5
pH7.78.59.5
ORP (mV)609−63−394
H2 (ppb) 0150225
TDS (mg/L)636773
Ca2+ (mg/L)19.9621.2326.88
K+ (mg/L)2.392.552.70
Mg2+ (mg/L)3.663.433.87
Na+ (mg/L)6.927.227.39
Cl (mg/L)13129
Residual chlorine0.9NDND
The water quality analysis was commissioned by a specialized agency in Korea (Korea Environment & Water Works Institute). ORP, oxidation-reduction potential; TDS, total dissolved solids; H2, hydrogen molecules. TW, tap water; ARW, alkaline reduced water. ARW was produced by using ARW generating device (EP-5001, Hanumul Co., Ltd., Goyang-si, Korea).
Publisher’s Note: MDPI stays neutral with regard to jurisdictional claims in published maps and institutional affiliations.

