Article

Long-Term Stability of Nitrifying Granules in a Membrane Bioreactor without Hydraulic Selection Pressure

1
Department of Civil and Environmental Engineering, Virginia Polytechnic Institute and State University, Blacksburg, VA 24061, USA
2
Operations Department, Hampton Roads Sanitation District, Virginia Beach, VA 23455, USA
*
Author to whom correspondence should be addressed.
Processes 2021, 9(6), 1024; https://doi.org/10.3390/pr9061024
Submission received: 13 May 2021 / Revised: 6 June 2021 / Accepted: 8 June 2021 / Published: 10 June 2021
(This article belongs to the Special Issue Environmental Protection by Aerobic Granular Sludge Process)

Abstract

:
To understand the long-term stability of nitrifying granules in a membrane bioreactor (GMBR), a membrane module was submerged in an airlift reactor to eliminate the hydraulic selection pressure that was believed to be the driving force of aerobic granulation. The long-term monitoring results showed that the structure of nitrifying granules could remain stable for 305 days in the GMBR without hydraulic selection pressure; however, the majority of the granule structure was actually inactive due to mass diffusion limitation. As a consequence, active biomass free of mass diffusion limitation only inhabited the top 60–80 µm layer of the nitrifying granules. There was a dynamic equilibrium between bioflocs and membrane, i.e., 25% of bioflocs attached on the membrane surface within the last nine days of the backwash cycle in synchronization with the emergence of a peak of soluble extracellular polymeric substances (sEPS), with a concentration of around 47 mg L−1. Backwash can eventually detach and return these bioflocs to the bulk solution. However, the rate of membrane fouling did not change with and without the biofloc attachment. In a certain sense, the GMBR investigated in this study functioned in a similar fashion as an integrated fixed-film activated sludge membrane bioreactor and thus defeated the original purpose of GMBR development. The mass diffusion problem and sEPS production should be key areas of focus in future GMBR research.

Graphical Abstract

1. Introduction

Aerobic granulation technology has been developed for two decades for the advantage of granular sludge over activated sludge in terms of settleability, filterability, biomass retention, and resistance to shock loading [1]. Since the debut of aerobic granular sludge as an alternative catalyst to activated sludge for advanced wastewater treatment, its formation mechanism was attributed to the hydraulic selection pressure [1]. Theoretically, granules with mass diffusion limitation are unable to compete with bioflocs in terms of growth without the facilitation of hydraulic selection pressure [2]. For this reason, it was reported that aerobic granules could not remain structurally stable for more than 80 days within MBRs operated without hydraulic selection pressure because the submerged membrane module retained both granules and bioflocs within the same reactor without selection [3,4,5]. However, our recent study demonstrated that nitrifying granules have remained stable within a completely mixed airlift reactor for 340 days under minimum hydraulic selection pressure in terms of the surface overflow rate (SOR) as low as 0.04 m h−1 [6]. Technically, such a minimum hydraulic selection pressure should be insufficient to keep the long-term stability of nitrifying granules because it is even lower than the SOR commonly used in full-scale wastewater treatment clarifiers that only retain activated sludge [7]. Therefore, it is reasonable to hypothesize that the existing granulation mechanism for nitrifying granules should be reconsidered. To test this hypothesis, an insightful experiment was designed to provide a mechanistic explanation of the phenomenon contradictory to the conventional pressure-driven aerobic granulation theory [1]. The experiment in this study eliminated all hydraulic selection pressure by inserting an ultrafiltration membrane into the airlift reactor to turn it into a granule membrane bioreactor (GMBR), which was operated for another 305 days to check whether nitrifying granules can still remain structurally stable. This study presented our observation over this extended experimental duration with insightful data analysis to reveal the mechanic understanding behind the phenomenon. It is our intention to use this study to verify the validity of conventional aerobic granulation theory and also discuss the perspective of GMBR that has been pursued in recent years.

2. Materials and Methods

2.1. Reactor Setup

The airlift reactor (ALR) used in our previous long-term nitrifying granule stability study was used in this study (Figure 1A) [6]. The only change made was by replacing the previous overflow design with a membrane inserted for completely retaining all bioparticles inside the ALR (Figure 1B). Briefly, the ALR comes with a 1.5-L working volume and a 3-cm diameter internal riser for hydraulic mixing. The reactor diameter was 6 cm, and the height was 44.5 cm. The SOR was controlled at around 0.04 m h−1. The ALR was operated at 20–23 °C in a temperature-controlled room. The air was introduced to the bottom of the ALR at an aeration rate of 0.3 L min−1 using an air pump. The substrate containing 50–60 mg L−1 ammonium-nitrogen (NH4+-N) along with other nutrients as described in a recipe of the previous study [6] was continuously pumped into the ALR at a flow rate of 0.3 L h−1, giving a hydraulic retention time of 5.2 h. The seed granules were the anammox granules collected from a DEMON® reactor operated by Hampton Roads Sanitation District, Virginia Beach, VA. As reported previously, the ALR was operated for 340 days without any granule stability issue [6]. After that, a membrane module (ZENON Environmental, ZeeWeed, Burlington, ON, Canada) was inserted into the ALR to turn it into a GMBR to totally eliminate the hydraulic selection pressure by retaining all biomass in the GMBR. The membrane module consisted of 30 hollow fibers with a pore size of 0.04 μm and a total effective area of 268.5 cm2. The effluent was withdrawn from the membrane by a peristaltic pump at a flow rate of 0.3 L h−1, which gives a flux around 11 L m−2 h−1. The transmembrane pressure (TMP) was monitored by using a pressure gauge (Winters Instruments, PFQ790, Buffalo, NY, USA). The membrane module was backwashed in the GMBR for 5 min by pumping back the filtrate when the TMP reached 45 kPa. All detached biomass from the membrane during backwash was retained in the reactor by the membrane without any wasting, giving rise to a nearly infinite solids retention time. The period between two backwashes was defined as one backwash cycle. No relaxation time was applied during the membrane operation.

2.2. Analytical Methods

The dissolved oxygen (DO) concentration of the reactor was monitored online with a 30-min interval by a submerged luminescent DO probe (Hach, Intellical™ LDO101, Loveland, CO, USA). The pH was monitored with a pH electrode (Hach, Intellical™ PHC101, Loveland, CO, USA). The TMP was measured by an inline pressure gauge. The mixed liquor suspended solids (MLSS), mixed liquor volatile suspended solids (MLVSS), settling velocity, ash content, and oxygen utilization rate (OUR) were all analyzed by using standard methods [8]. The nitrogen species, i.e., NH4+-N, nitrite-nitrogen (NO2-N), and nitrate-nitrogen (NO3-N), were measured using the Hach salicylate/cyanurate, NitriVer 3, and Tentpoles 835 kits. The turbidity of influent and effluent was quantified by a turbidity meter (Hach, 2100N, Loveland, CO, USA). The supernatant turbidity in the GMBR was measured after settling all granules. The granule size distribution was analyzed using a laser scattering particle size analyzer (Horiba, LA-950, Kyoto, Japan). Mixed liquor samples were taken from the GMBR for the petri-dish photos. The granule cross-section was stained using LIVE/DEAD BacLight Bacterial Viability Kit L-7012 for microscopy and quantitative assays (Molecular Probes, Eugene, OR, USA). The samples were stained and incubated in the darkroom at room temperature for 15 min. A microscope used for fluorescence visualization (Nikon, Eclipse E200, Melville, NY, USA) was equipped with a camera (Sony, Exmor CMOS, New York, NY, USA) for image capture. Soluble extracellular polymeric substances (sEPS) were extracted from the supernatant of samples after centrifugation (Thermo Scientific, Sorvall Legend X1, Waltham, MA, USA) at 4000× g for 20 min at 4 °C and measured based on the method described previously [9]. Dialysis Kits (Spectrum, Labs Spectra/Por™ 3500 D MWCO Standard RC Pre-Treated, Waltham, MA, USA) were utilized to recover polymers with a molecular weight greater than 3500 Da. A phenol–sulfuric acid method was adopted for carbohydrates (PS) analysis (Nielsen, 2010), and Pierce™ modified Lowry protein assays were used for the protein (PN) analysis (Thermo Scientific, Waltham, MA, USA). The sum of PS and PN concentrations was regarded as sEPS concentration.

2.3. Model Simulation

To understand the substrate utilization profiles in the granules, the mathematical model developed and calibrated in previous studies was adopted in this work [6,10]. Briefly, the model was set up by taking both the Monod equation and Fick’s law into consideration. The values of all parameters were kept the same or adjusted to different temperatures according to the Arrhenius equation as calibrated in the previous study [10]. The model was validated in a previous study [6]. The input of the model was the steady-state operation parameters of GMBR listed in Table 1.

3. Results

3.1. Characteristics of Seed Granules

The seed sludge used for the study was steady-state nitrifying granules after 340 days of cultivation in a previous ALR without membrane insertion [6]. Figure 2A shows that these seed granules possess the typical morphology of nitrifying granules reported in the literature, i.e., smooth surface, round shape, and brown color [11,12,13]. The seed granule characteristics and performance are summarized in Table 2. It should be pointed out that the seed reactor overflow turbidity was only 0.77 ± 0.31 NTU, indicating excellent structural stability of these seed granules. The settling velocity of seed granules in ALR was as high as 54.2 m h−1, which was comparable with those reported in previous studies, i.e., 18–60 m h−1 [14,15,16]. Table 2 shows that the nitrification efficiency was as high as 97%, indicating the excellent performance of these nitrifying granules. The average particle size of granules was 1.8 mm in Table 2, with 80% of particles above 0.2 mm, as shown in Figure 3. A similar range of particle size distribution was also reported in previous nitrifying granulation studies [6,12,17].

3.2. Response of Seed Granules to Membrane Insertion

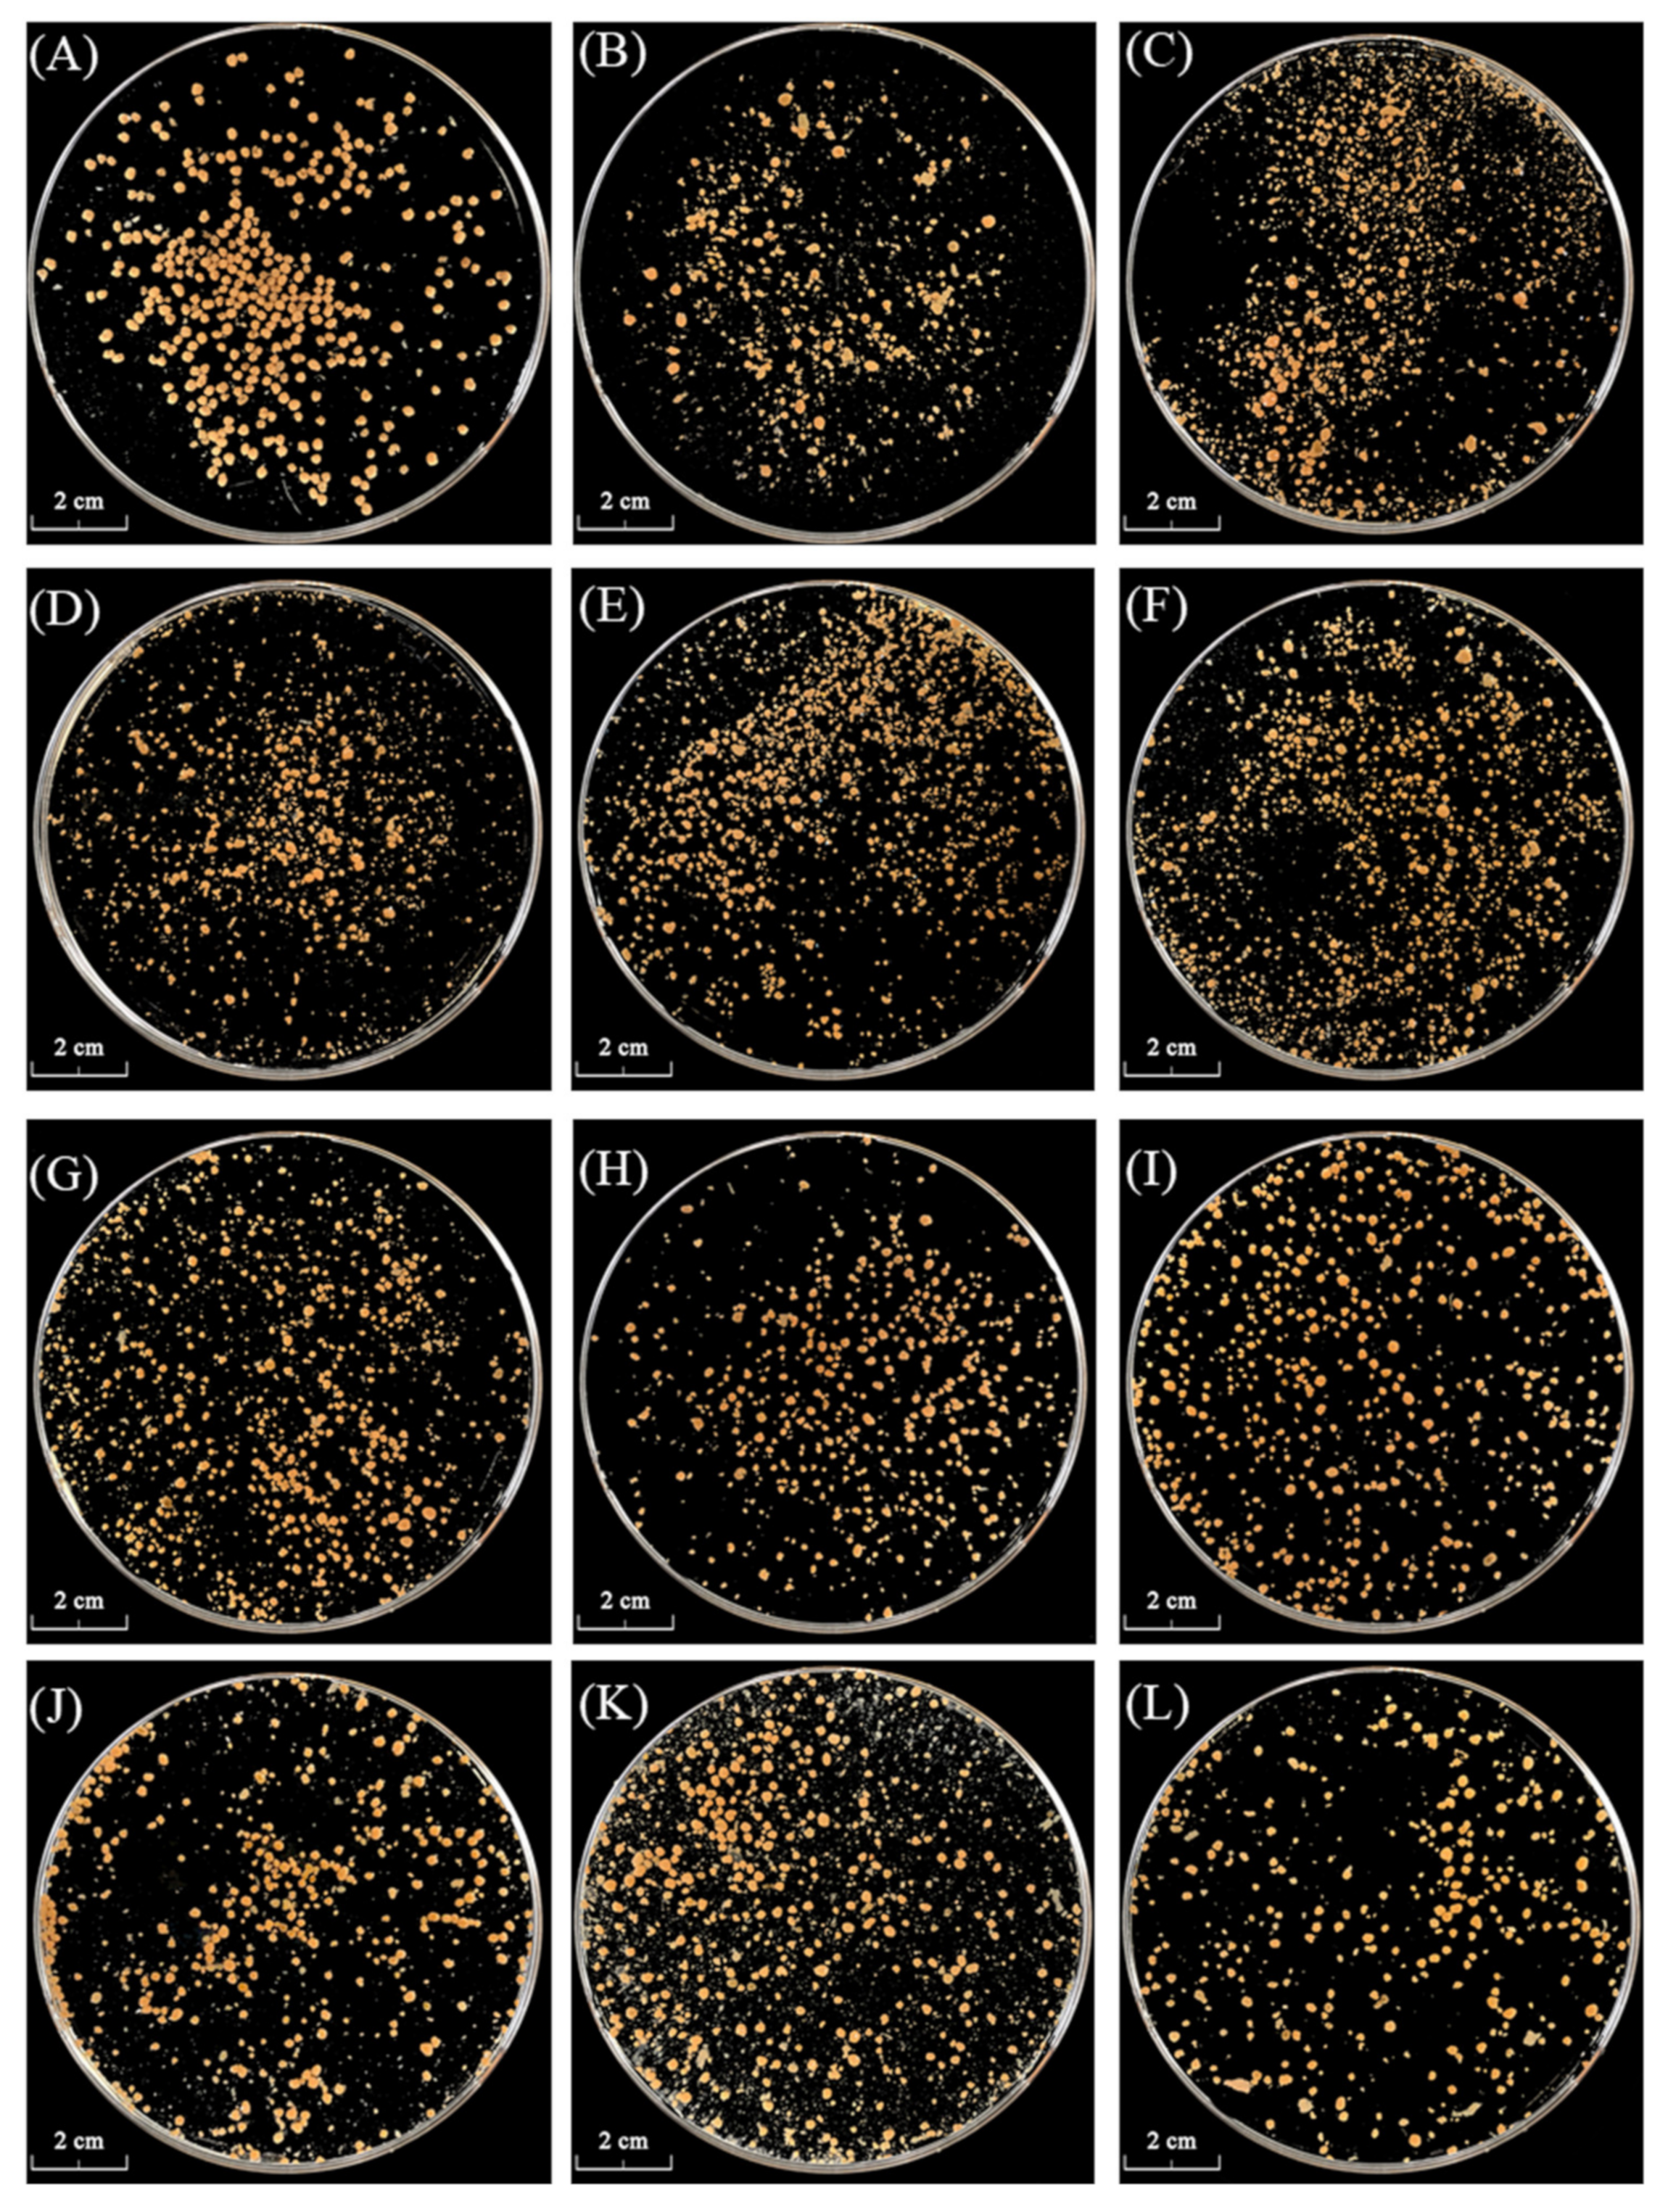
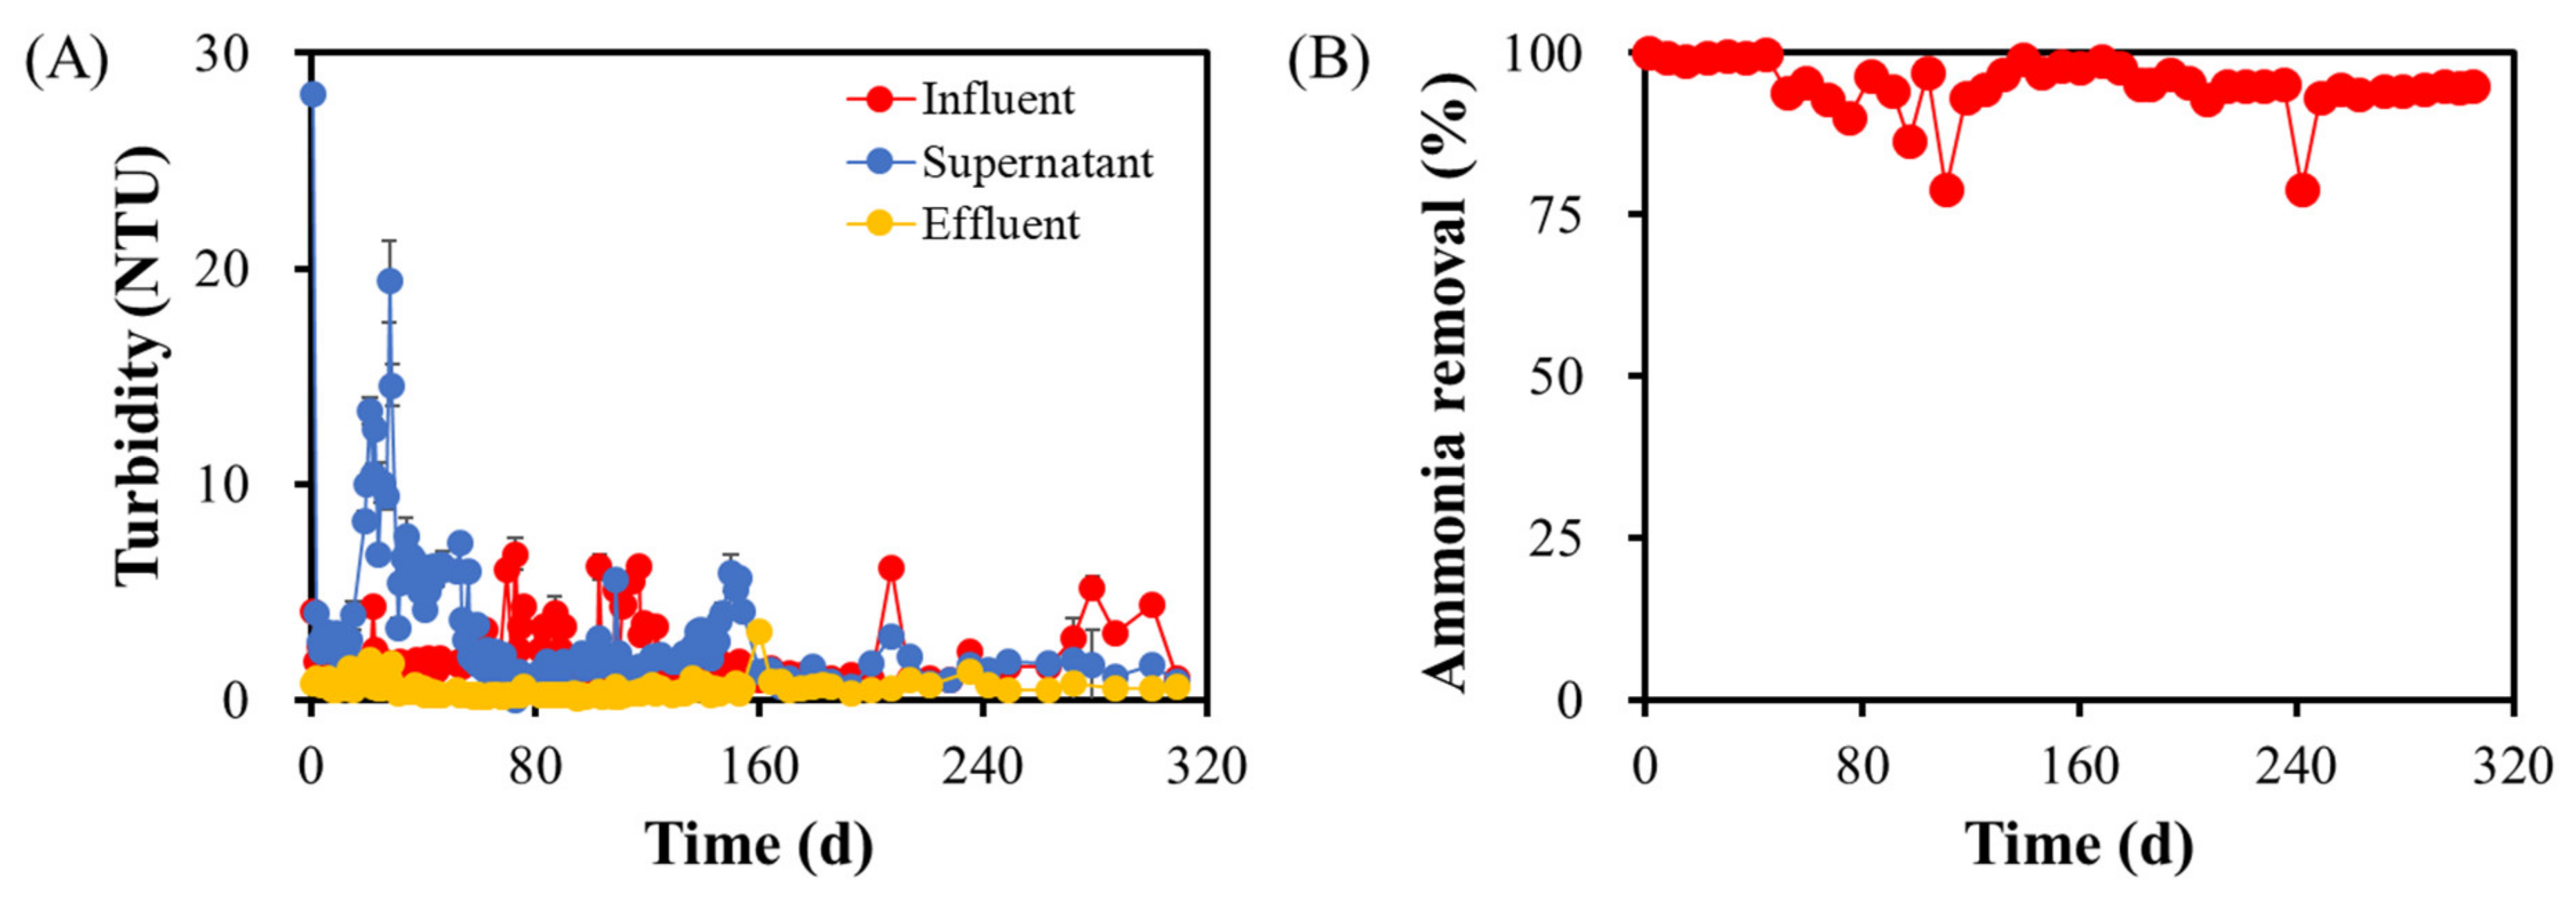
A membrane module was inserted in the seed ALR to totally eliminate the hydraulic selection pressure in order to test whether these nitrifying granules can still remain long-term stable. It should be realized that the GMBRs such as this were studied previously, but the longest operation time was only 120 days, which is relatively too short to reflect their long-term stability [4,5,18]. Figure 2 and Figure 3 show the granule morphology and particle size evolution over 305 days of the GMBR operation. As can be seen, the round shape seed granules collected have disintegrated into bioflocs with small and irregular structures after 37 days of cultivation in the GMBR, and the average particle sizes dropped from 1.8 mm to 0.8 mm (Figure 2B and Figure 3). Meanwhile, there was also a sharp increase in the number of small particles with a size of around 0.2 mm (Figure 3) as a result of the fine bioflocs formation in Figure 2B. Accordingly, the turbidity of the supernatant of GMBR after 5 min sharply settling increased from 1.03 to 19.4 NTU (Figure 4A). After acclimation to the GMBR operation for 42 days, the peak of fine bioflocs that showed up on day 37 disappeared on day 79, and the particles with a size larger than 0.5 mm increased from 48% to 74% (Figure 3). Meanwhile, the turbidity also dropped to 1.61 NTU (Figure 4A). After around 240 days of operation, the granule morphology appeared to be much more uniform (Figure 2B–I). Although there were still some fine bioflocs shown in Figure 2J,K, probably due to the membrane backwash, the granule structure became quite stable again on day 305 (Figure 2L) in view of the similar particle size distribution on days 240 and 305, as shown in Figure 3. The supernatant turbidity in GMBR also dropped to a level as low as 0.97 NTU. The consistently low turbidity in the membrane effluent in Figure 4A shows that the membrane functioned well over 305 days with the average effluent turbidity under 0.5 NTU. Regardless of the granule morphology evolution, the nitrification efficiency in the GMBR has remained as high as 99% throughout the 305 days of operation without compromise (Figure 4B). Thereby, it can be concluded that nitrifying granules responded to the insertion of a submerged membrane module mainly by disintegration and then reaggregation (Figure 2, Figure 3 and Figure 4). It is noteworthy that the granules stabilized in the GMBR were not as large as the seed sludge that was stabilized within ALR without membrane (Figure 3). Similar observations were also reported in previous studies [4,18,19]. This could have resulted from the substrate competition by bioflocs that should have been washed out if the hydraulic selection pressure were still in place.

3.3. Characteristics of the Nitrifying Granules Stabilized in the GMBR after 305 Days

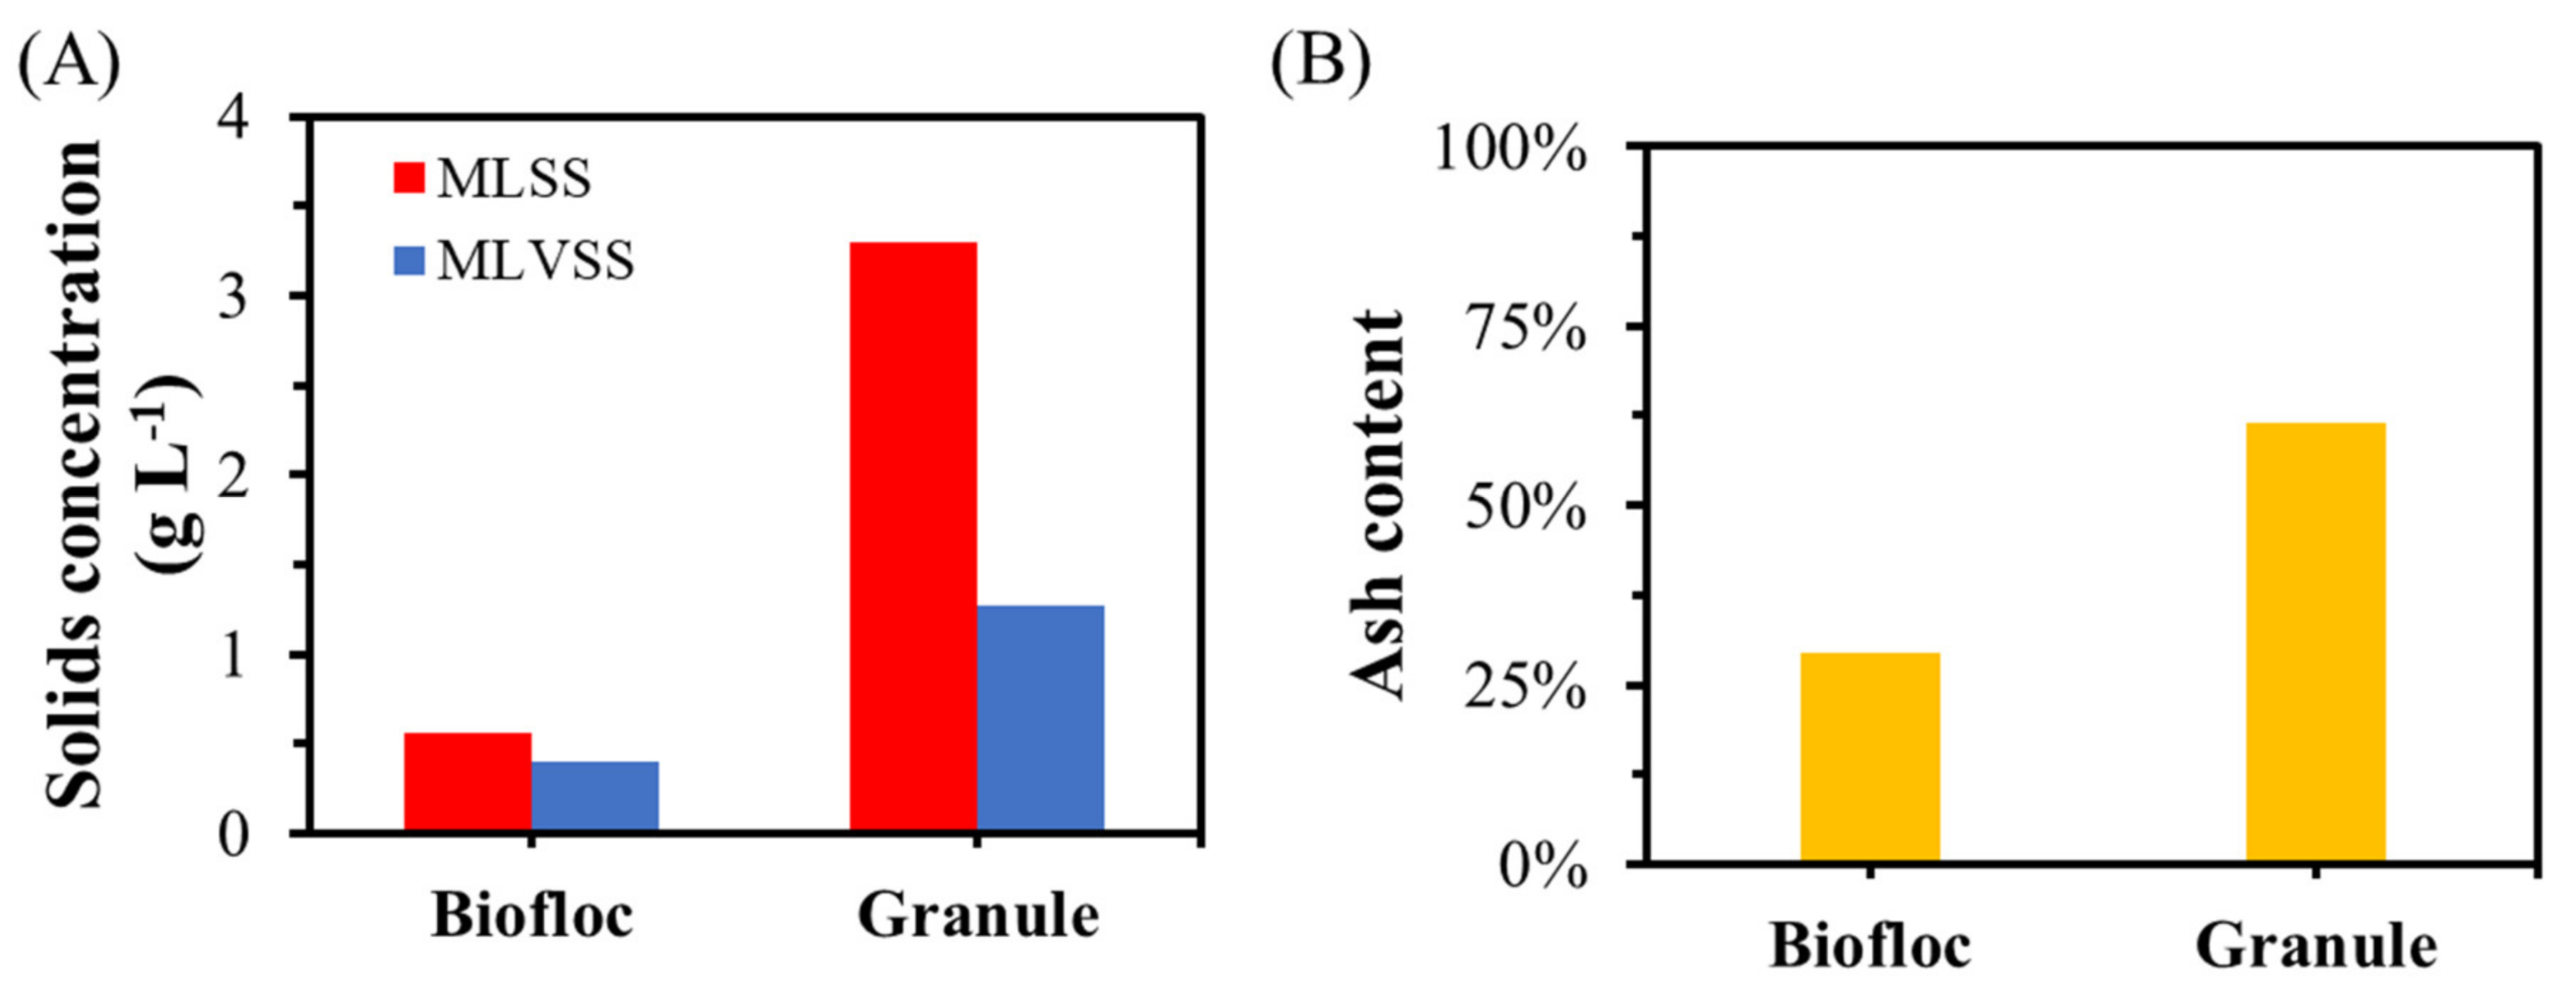
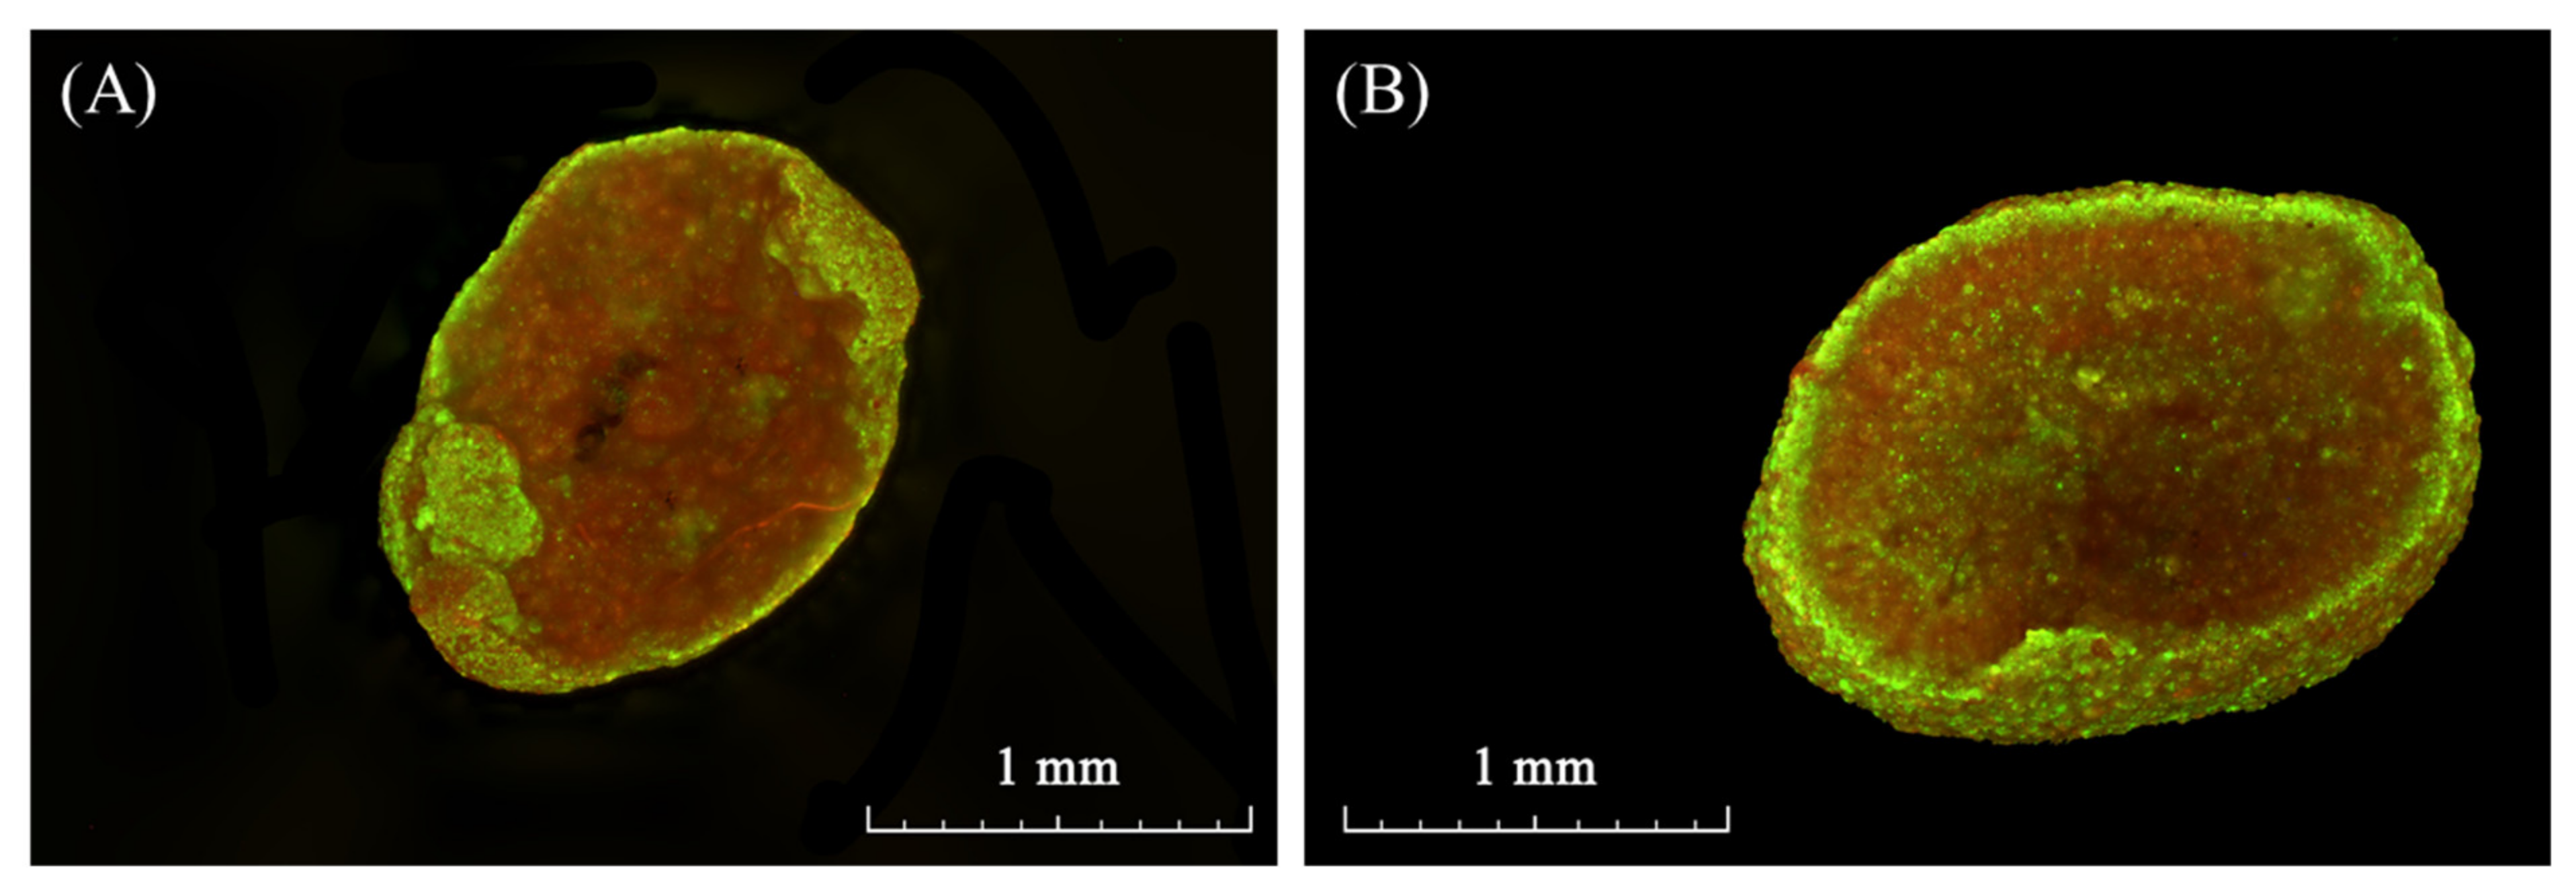
After 305 days of operation, the biomass in the GMBR was separated into granules and bioflocs with a 200 µm sieve as defined in this study. The MLSS concentration in Figure 5A shows that 85% of the biomass stabilized in the GMBR was in the form of granules, which was six times that of the bioflocs. However, the MLVSS of granules was only three times that of the bioflocs because the ash content in granules was as high as 64% (Figure 5B), which was two times that in the bioflocs. The live/dead staining in Figure 6 exhibited that only the top 60–80 μm layer of these nitrifying granules was active, with a majority of the granule structure remaining inactive. The mathematical model calibrated in our previous study was applied to simulate the mass diffusion and substrate utilization profiles along the radius of the nitrifying bacteria [6,10]. All the model inputs were listed in Table 1. It can be seen that the 4.63 mg L−1 bulk DO was only able to penetrate around 75 µm into the biomass (Figure 7). This means it can penetrate the entire bioflocs with a diameter smaller than 150 µm (Figure 7A). However, the majority of the granule structure was under DO deficiency (Figure 7B). As a consequence, it can be predicted that the inner granule structure beneath the top 75 µm surface layer was decaying under starvation over the 305 days of cultivation. Therefore, it is not surprising to see high ash content resulted in these granules (Figure 5B). In a certain sense, the GMBR might have been converted into an integrated fixed-film activated sludge membrane bioreactor (IFAS-MBR), in which bacteria were either attached on the surface of abiotic carriers in the form of traditional biofilm or suspended in the bulk solution in the form of bioflocs.

3.4. Dynamic Equilibrium within a Backwash Cycle of GMBR at the Steady State

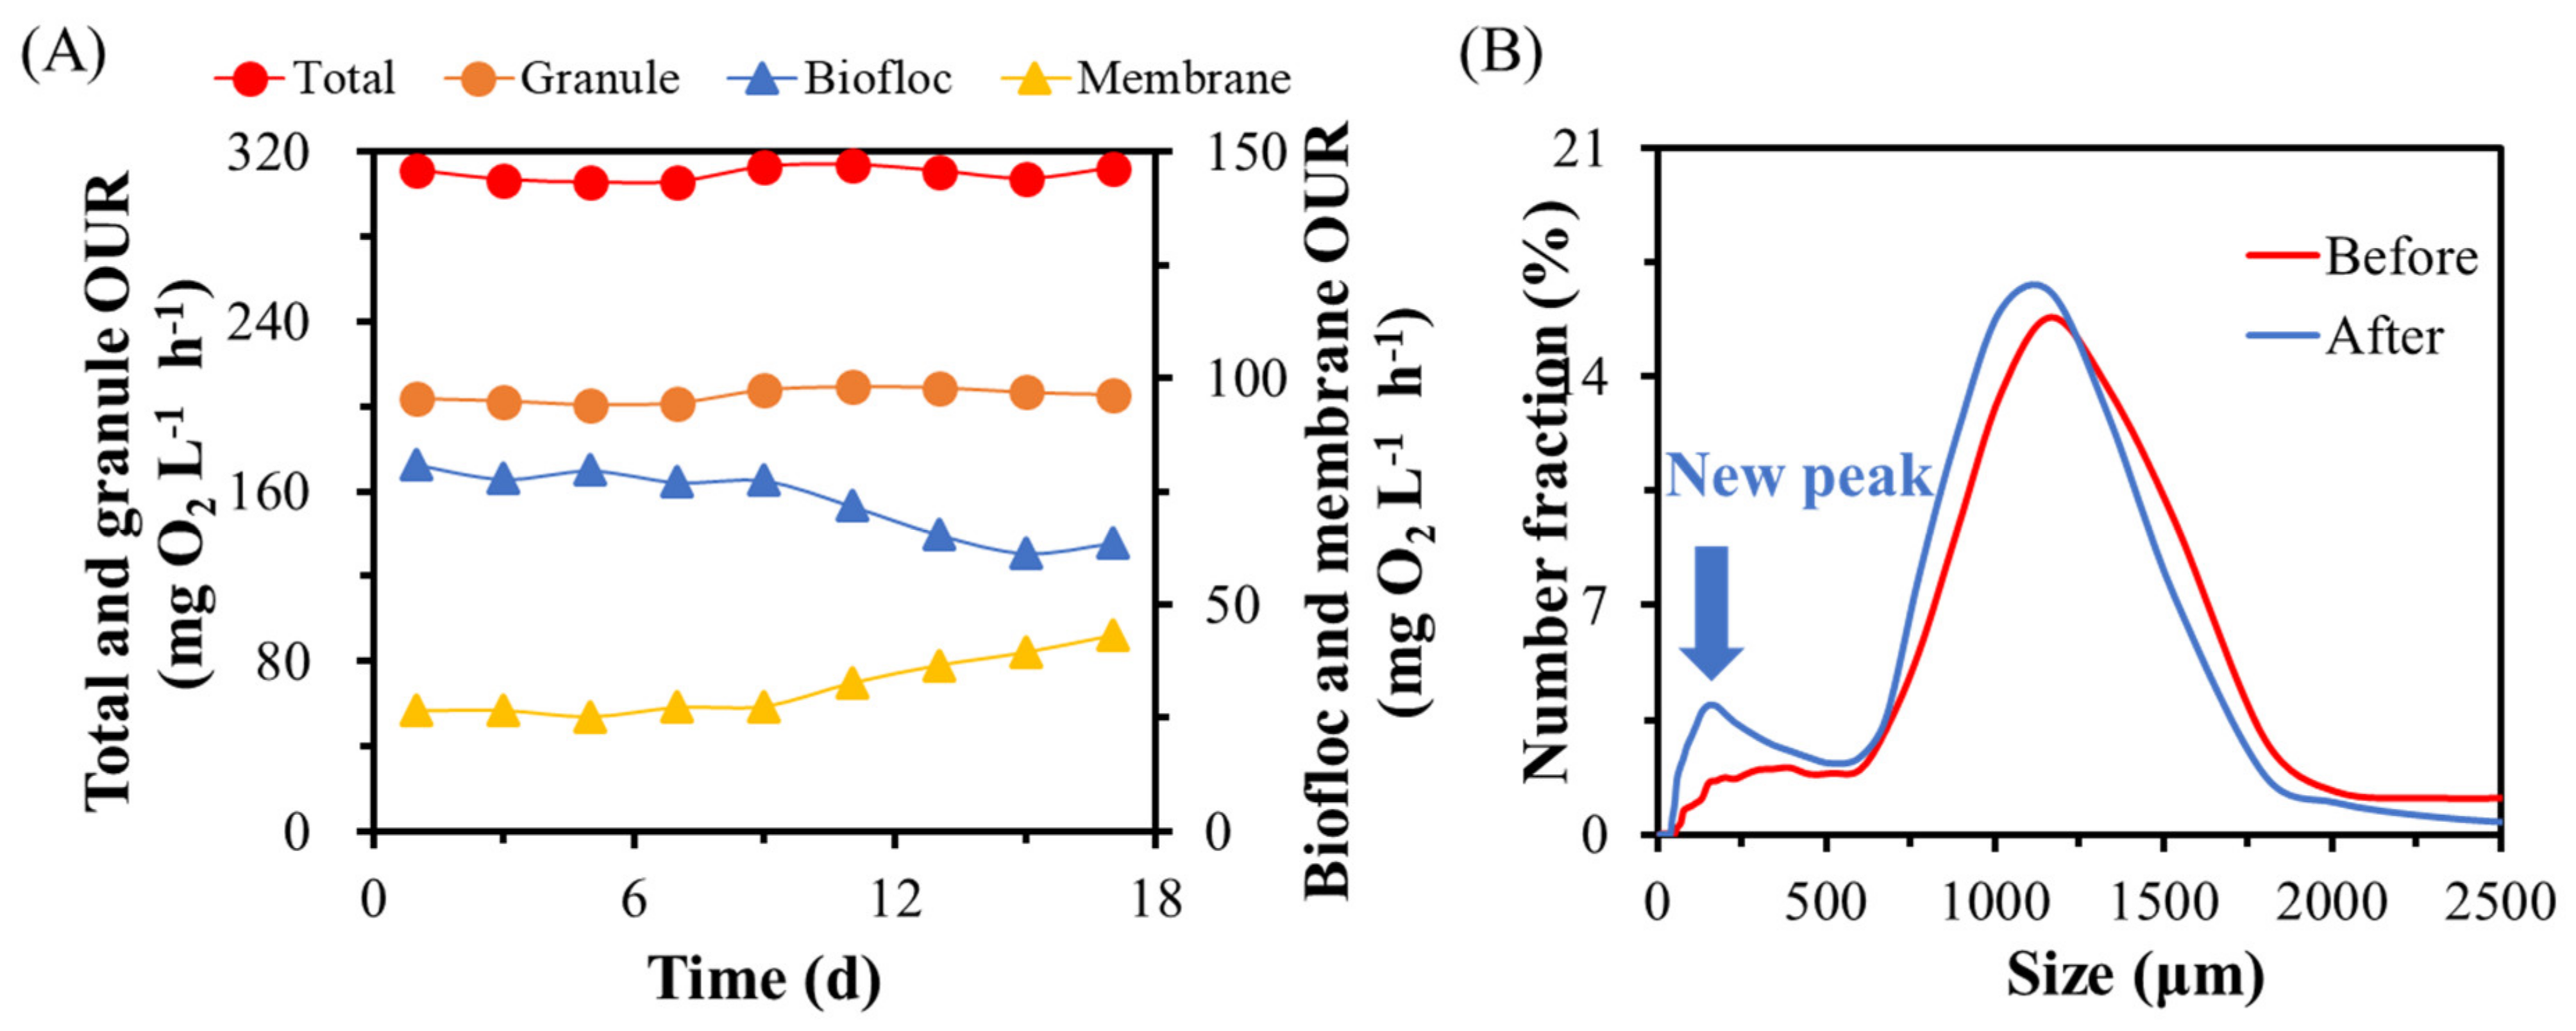
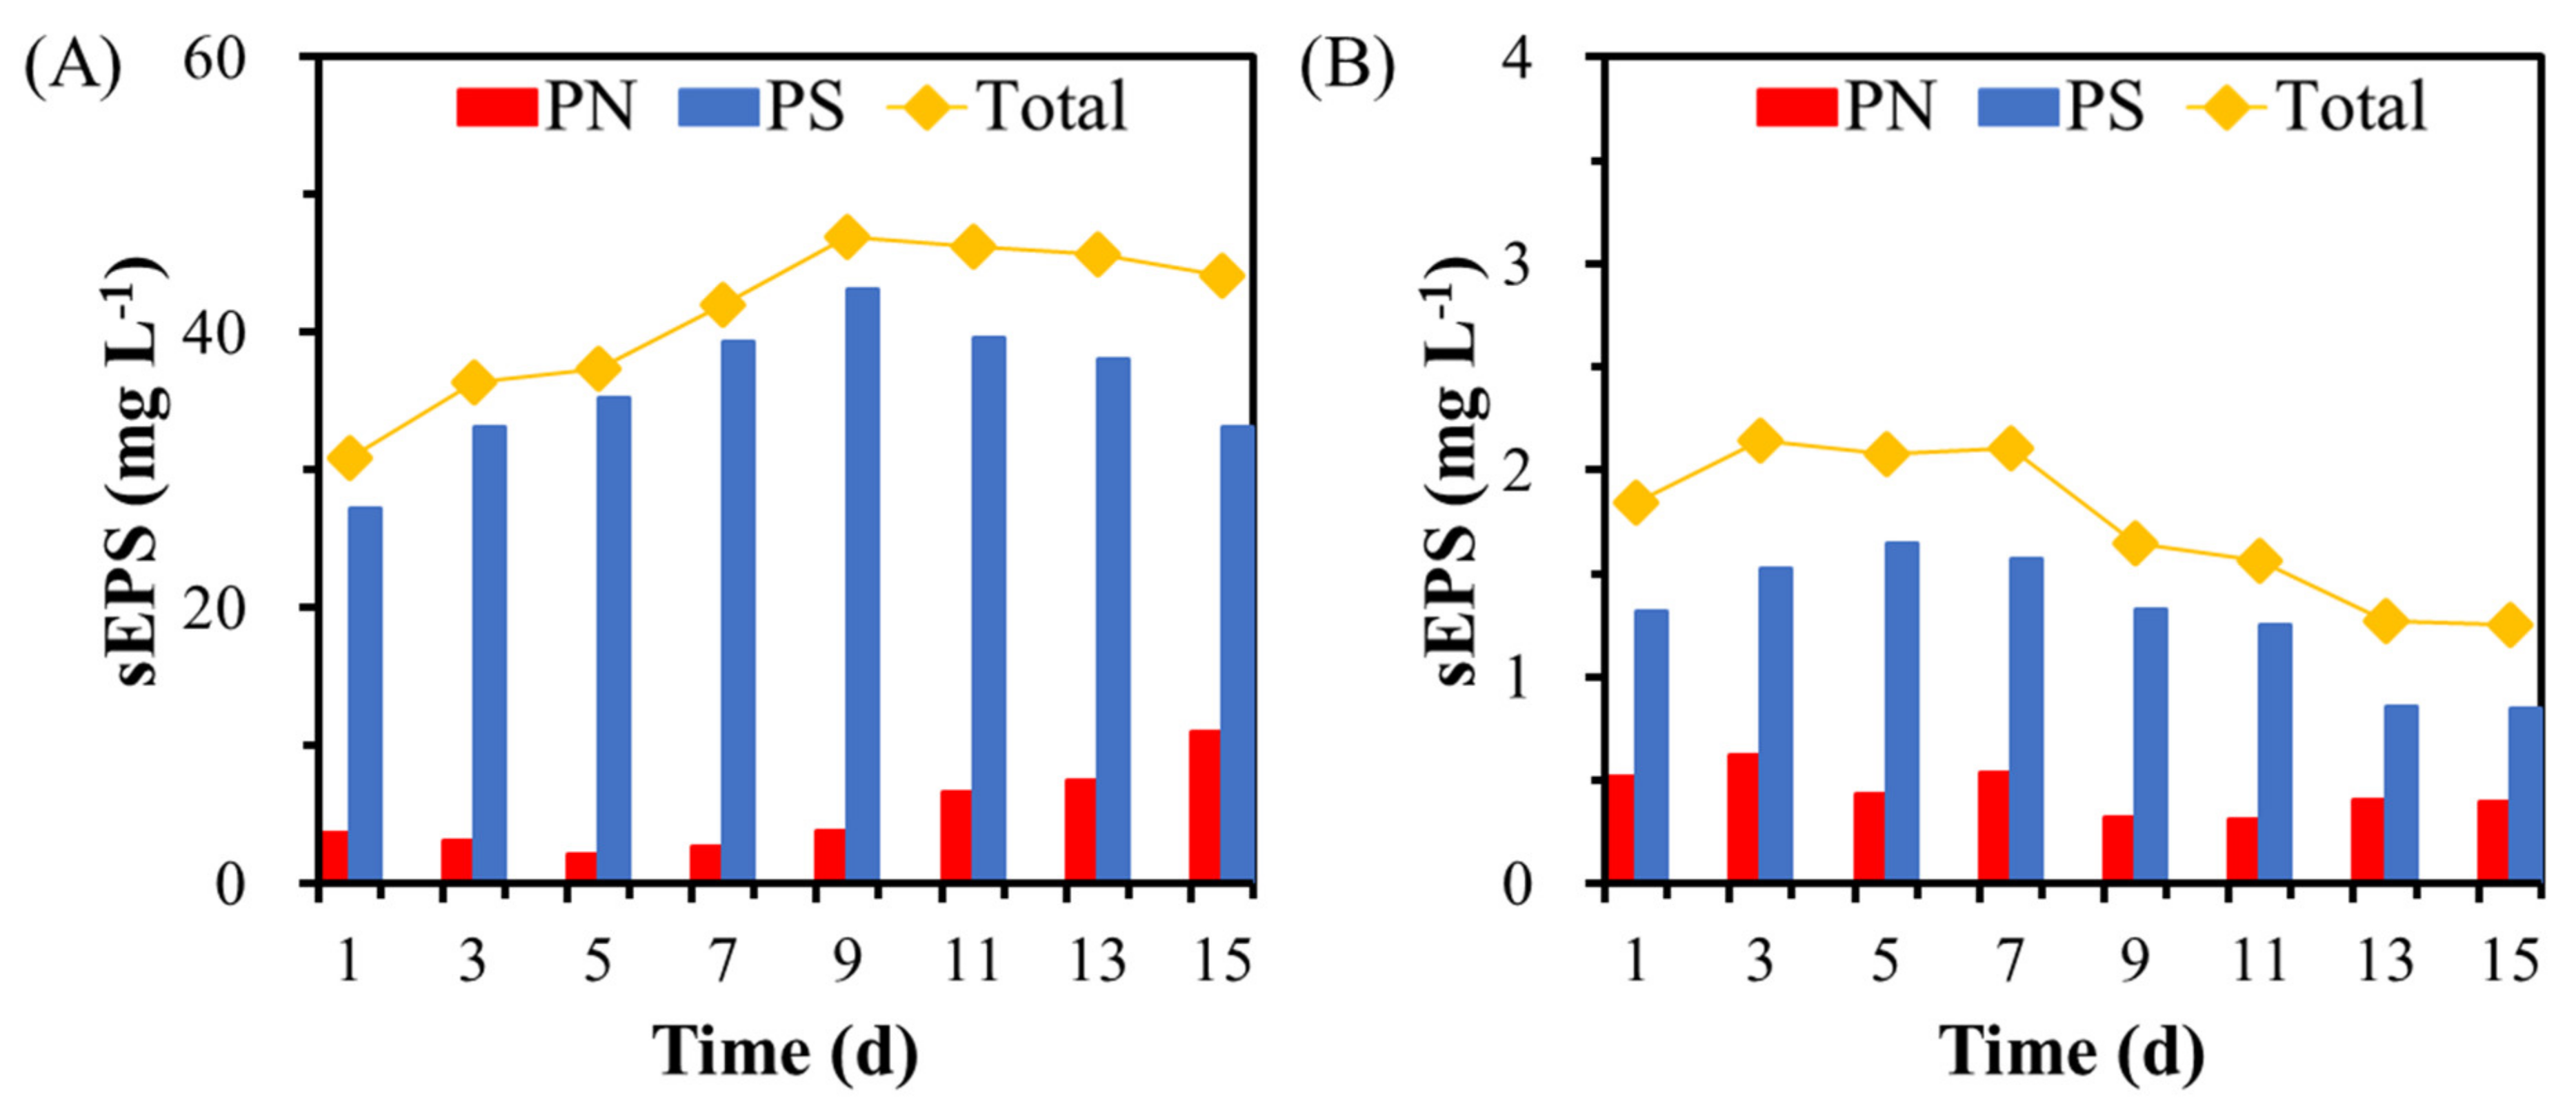
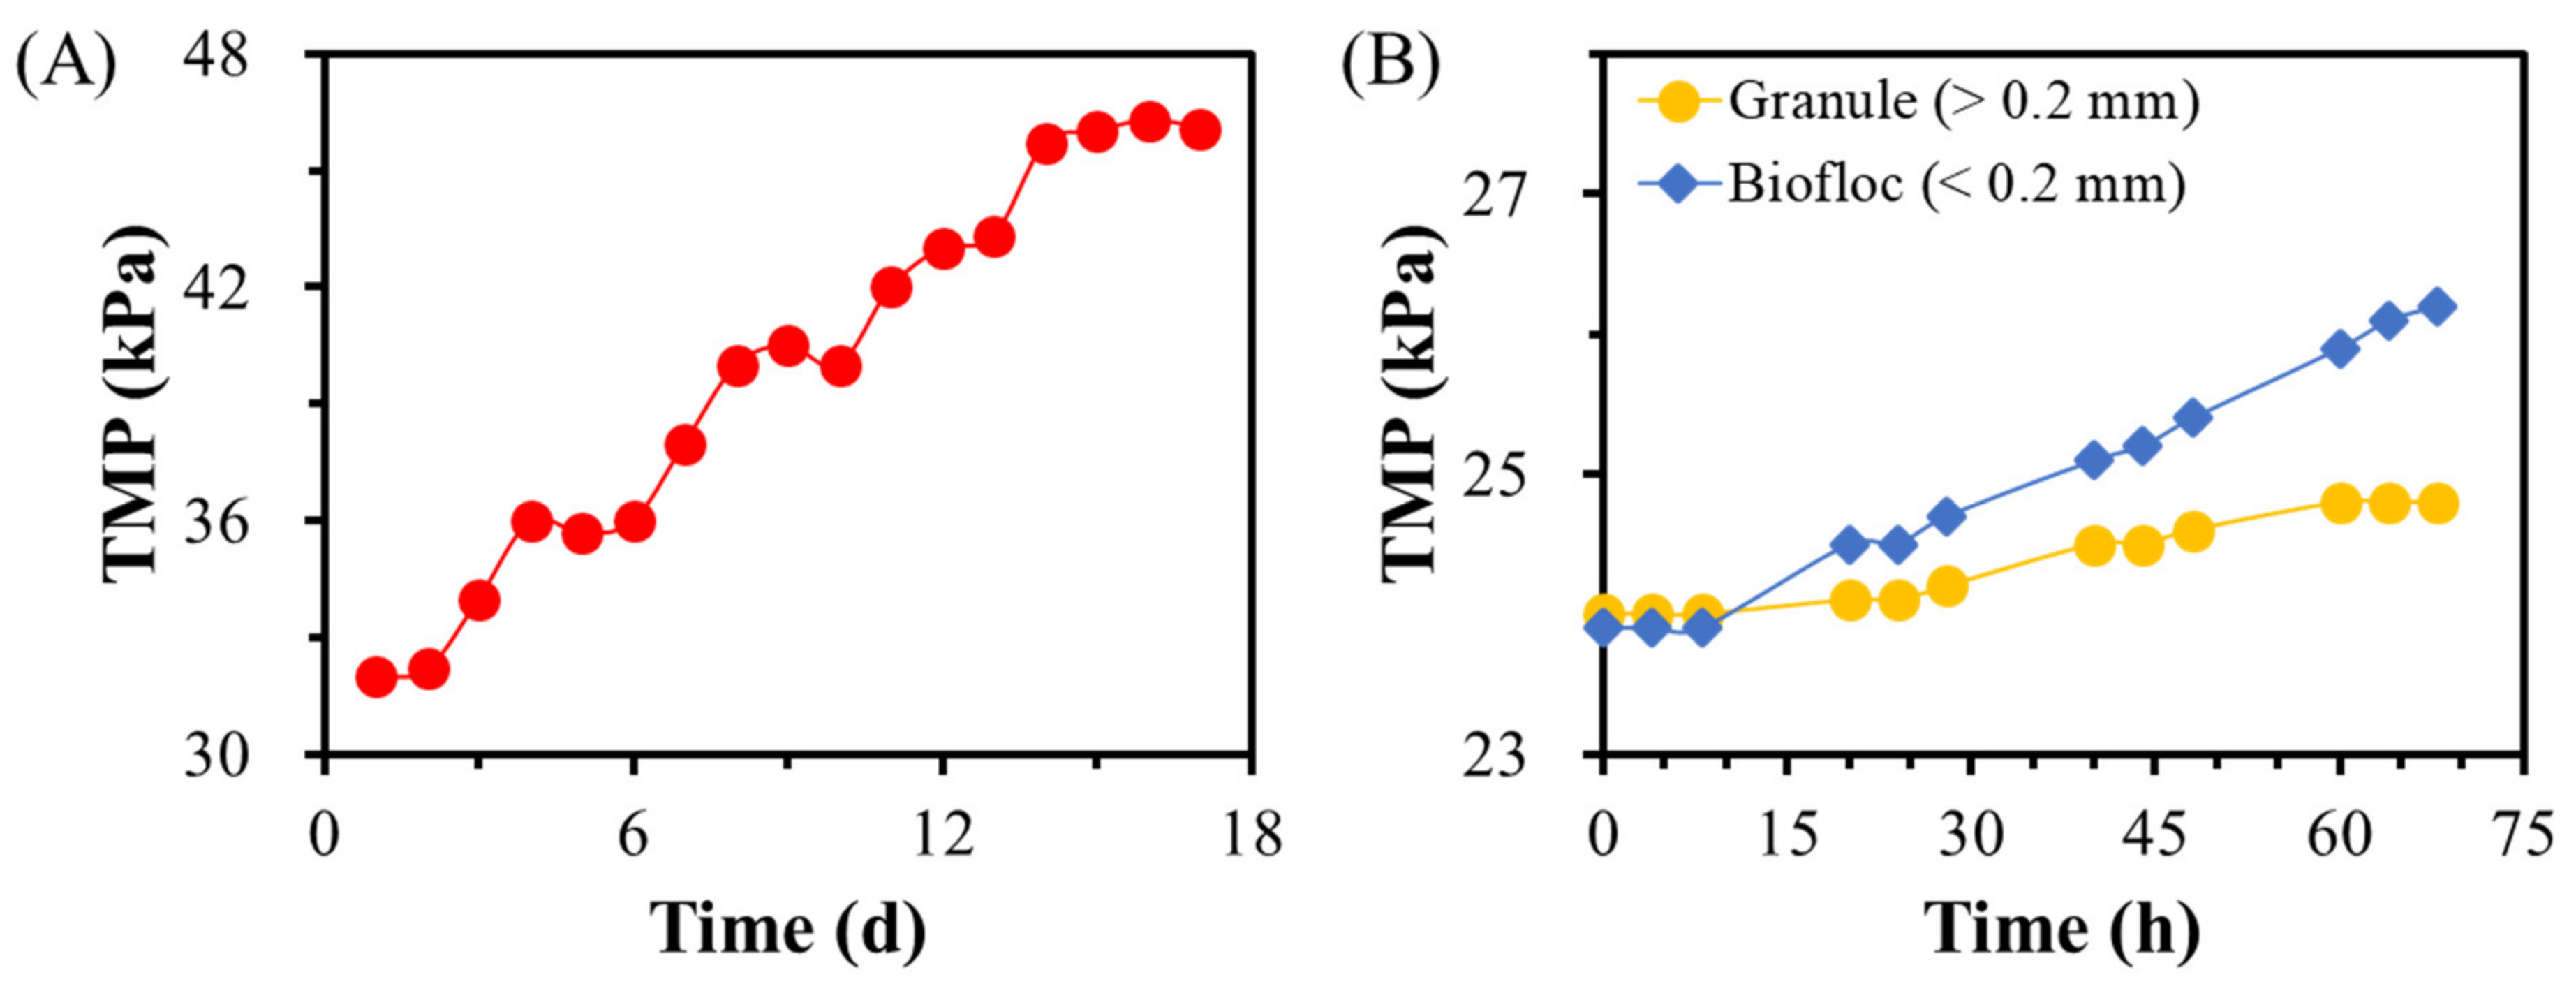
Knowing the nitrifying granules were long-term stabilized in equilibrium with suspended bioflocs, it is our interest to understand how such a dynamic equilibrium was maintained within the GMBR. Therefore, the data in a steady-state backwash cycle (18 d) were analyzed. The OUR measurement in Figure 8A shows that the total activity of nitrifying granules was nearly three times that of the bioflocs, which is consistent with MLVSS distribution measured in Figure 5A, giving almost equal SOURs of 169.7 and 185.8 mg O2 g MLVSS−1 h−1 for granules and bioflocs, respectively. This similarity between SOURs of granules and bioflocs implies the lack of mass diffusion limitation into the MLVSS of nitrifying granules, which is consistent with the thin surface layer distribution of the active biomass in nitrifying granules as visualized in Figure 6. The decline of biofloc OUR along with the corresponding membrane OUR increase in Figure 8A show that the biofloc attachment on the membrane did not start until the 9th day following membrane backwash. The emergence of a new peak of particle size distribution between 100 µm and 200 µm right after the membrane backwash evidenced such a dynamic of bioflocs detachment from the membrane in the course of each backwash cycle of the GMBR (Figure 8B). Interestingly, the sEPS profile during the same cycle revealed that the biofloc attachment on the membrane did not start until the sEPS accumulated to a maximum level around 47 mg L−1 (Figure 9A). As a matter of fact, it was recognized that sEPS plays a medium role between the bound EPS on the bacteria surface and the fouling surface of the membrane [20]. This may explain why the biofloc attachment on the membrane surface did not start until a relatively high sEPS concentration was accumulated in the GMBR (Figure 9A). It should be realized that the TMP has linearly increased with the membrane operation time (Figure 10A) regardless of the biofloc attachment measured in Figure 8A. Therefore, the membrane fouling before the 9th day of GMBR operation might be due to pore fouling by sEPS even without the biofloc attachment. Similar phenomena were repeatedly reported elsewhere [21,22]. The fact that the sEPS in the membrane effluent was only 6% and 3% those in the GMBR mixed liquor before and after the 9th day of a backwash cycle actually indicated such a pore fouling to cake-layer fouling shift within the GMBR backwash cycle (Figure 9B) and corroborated the TMP increase before the biofloc attachment (Figure 10A).

3.5. Contributions of Granules and Bioflocs to Membrane Fouling

The rates of TMP increase when the membrane was exposed to only granules or only bioflocs were measured in Figure 10B. It did show that bioflocs caused TMP to increase at a rate four times faster than granules, even though the bioflocs concentration was three times lower than that of granules (Figure 5A). This finding is consistent with previous GMBR studies showing a low trendy of membrane fouling when granules were used in place of activated sludge in MBRs [23]. However, it should be realized that the granules still caused membrane fouling even with their large particle size (Figure 10B). sEPS production, as shown in Figure 9, might be the reason behind this, i.e., both granules and bioflocs can produce sEPS, which was regarded as a primary contributor to membrane fouling [20,22]. Although sEPS was not measured in the batch experiment in Figure 10, the low fouling rates of granules even at a much higher MLVSS indicated that the sEPS production from granules might be lower than that from bioflocs [23,24].

4. Discussion

In this study, the nitrifying granules were stabilized in a continuous flow GMBR for 305 days without hydraulic selection pressure (Figure 2, Figure 3 and Figure 4). However, their size was much smaller than when the membrane was not used (Figure 3). Technically, the growth of granules cannot compete with that of the bioflocs for their severe mass diffusion limitation (Figure 7), which is why a hydraulic selection pressure had to be applied to facilitate the competition of granules over bioflocs. However, experimental results shown in this study seem contradictory to the classic selection pressure-driven aerobic granulation theory, i.e., nitrifying granules were able to remain stable in a GMBR without hydraulic selection pressure for 305 days. The thin layer of active biomass on the surfaces of these high ash content-containing nitrifying granules might have provided an explanation of the unconventional observation (Figure 5 and Figure 6). Specifically, the active biomass actually existed in the form of conventional biofilms attaching to the surfaces of the fossilized inner structure of granules, which functions just like abiotic biofilm carriers (Figure 6). As a matter of fact, the high ash contents distributed in the inner structure of aerobic granules as a result of the mass diffusion limitation were broadly reported [2,25]. It was also recognized that the granule structure could remain stable even under long-term starvation [26], which explains why granules can remain structurally stable even when a majority of their structures were fossilized (Figure 6). However, a GMBR with such high ash and low active biomass contents just defeated the purpose of using GMBR because IFAS-MBR can literally perform the same job with fewer concerns of structural stability [27].
The GMBR was anticipated to become a novel approach to controlling membrane fouling [1,4,23]. This is because the granules’ large size and rigid structure are expected to reduce cake-layer formation, pore blocking, and surface deposition on the membrane surface [23,28]. Although the better performance of GMBR over MBR was reported in a number of studies [4,5], the long-term system operation instability of GMBR was identified as a concern [1]. This study further revealed that, although nitrifying granules were capable of remaining structurally stable for the long term, their activity has dropped to extremely low levels in GMBR due to the lack of effective mass diffusion into the inner structure (Figure 6 and Figure 7). Technically, this challenge cannot be resolved in completely stirred tank reactors, in which bulk substrate concentration is expected to be low. Instead, plug flow reactors, in which deeper mass diffusion can be facilitated by a relatively higher initial substrate concentration, should be considered in future GMBR research [16]. Besides this mass diffusion problem, special attention should also be paid to the high sEPS concentration accumulated in the GMBR [22]. The results in Figure 9, together with other recent studies, indicated that it was the sEPS but not the bioflocs that was the primary cause of the membrane fouling [20,22,23]. The sEPS can be produced by both granules and bioflocs, even though the former appeared to show a less fouling tendency than the latter (Figure 10B). Although there was no organic carbon provided for autotrophic bacteria in nitrifying granules, quite high sEPS concentration was apparently produced in the GMBR (Figure 9), which was also reported in other nitrifying bioreactors [29,30]. Therefore, the cause and control of sEPS production is a key area requiring further research in the field of GMBR study.

5. Conclusions

The structure of nitrifying granules can remain long-term stable in a GMBR without hydraulic selection pressure; however, the majority of the granule structure was inactive due to mass diffusion limitation. As a consequence, active biomass free of mass diffusion limitation only inhabited the top 60–80 µm layer of the nitrifying granules. There was a dynamic equilibrium between suspended bioflocs and the membrane. Twenty-five percent of bioflocs shifted to attached living on the membrane surface within the last nine days of the backwash cycle when sEPS concentration peaked at 47 mg L−1. Backwash can eventually detach and return these bioflocs to a bulk solution. In a certain sense, the GMBR investigated in this study functioned in a similar fashion as IFAS-MBR and thus defeated the original purpose of GMBR development. The mass diffusion problem and sEPS production should be key areas of focus in future GMBR research.

Author Contributions

Conceptualization, C.B.B. and Z.-W.W.; Experimental Design, C.B.B. and Z.-W.W.; Data Collection and Analysis, Z.A., C.B.B., and Z.-W.W.; Writing—Review and Editing, Z.A., X.Z., C.B.B., and Z.-W.W. All authors have read and agreed to the published version of the manuscript.

Funding

This research received no external funding.

Institutional Review Board Statement

Not applicable.

Informed Consent Statement

Not applicable.

Data Availability Statement

All data is contained within the article, in Section 3.

Acknowledgments

Authors appreciate VT’s OASF support in publishing this article.

Conflicts of Interest

The authors declare that they have no known competing financial interests or personal relationships that could have appeared to influence the work reported in this paper.

References

  1. Kent, T.R.; Bott, C.B.; Wang, Z.-W. State of the art of aerobic granulation in continuous flow bioreactors. Biotechnol. Adv. 2018, 36, 1139–1166. [Google Scholar] [CrossRef]
  2. Liu, Y.-Q.; Lan, G.-H.; Zeng, P. Excessive precipitation of CaCO3 as aragonite in a continuous aerobic granular sludge reactor. Appl. Microbiol. Biotechnol. 2015, 99, 8225–8234. [Google Scholar] [CrossRef]
  3. Corsino, S.; Campo, R.; Di Bella, G.; Torregrossa, M.; Viviani, G. Study of aerobic granular sludge stability in a continuous-flow membrane bioreactor. Bioresour. Technol. 2016, 200, 1055–1059. [Google Scholar] [CrossRef] [PubMed] [Green Version]
  4. Sajjad, M.; Kim, I.S.; Kim, K.S. Development of a novel process to mitigate membrane fouling in a continuous sludge system by seeding aerobic granules at pilot plant. J. Membr. Sci. 2016, 497, 90–98. [Google Scholar] [CrossRef]
  5. Chen, C.; Bin, L.; Tang, B.; Huang, S.; Fu, F.; Chen, Q.; Wu, L.; Wu, C. Cultivating granular sludge directly in a continuous-flow membrane bioreactor with internal circulation. Chem. Eng. J. 2017, 309, 108–117. [Google Scholar] [CrossRef]
  6. An, Z.; Kent, T.R.; Sun, Y.; Bott, C.B.; Wang, Z.-W. Free ammonia resistance of nitrite-oxidizing bacteria developed in aerobic granular sludge cultivated in continuous upflow airlift reactors performing partial nitritation. Water Environ. Res. 2021, 93, 421–432. [Google Scholar] [CrossRef] [PubMed]
  7. Martin, K.; Shaw, A.; de Clippeleir, H.; Sturm, B. “Accidental granular sludge?”: Understanding process design and operational conditions that lead to low SVI-30 values through a survey of full scale facilities in North America. Proc. Water Environ. Fed. 2016, 2016, 3385–3394. [Google Scholar] [CrossRef]
  8. Baird, R.; Bridgewater, L. Standard Methods for Examination of Water and Wastewater, 23rd ed.; American Public Health Association: Washington, DC, USA, 2017. [Google Scholar]
  9. Liu, H.; Fang, H.H. Extraction of extracellular polymeric substances (EPS) of sludges. J. Biotechnol. 2002, 95, 249–256. [Google Scholar] [CrossRef]
  10. Kent, T.R.; Sun, Y.; An, Z.; Bott, C.B.; Wang, Z.-W. Mechanistic understanding of the NOB suppression by free ammonia inhibition in continuous flow aerobic granulation bioreactors. Environ. Int. 2019, 131, 105005. [Google Scholar] [CrossRef] [PubMed]
  11. Zhang, B.; Chen, Z.; Qiu, Z.; Jin, M.; Chen, Z.; Chen, Z.; Li, J.; Wang, X.; Wang, J. Dynamic and distribution of ammonia-oxidizing bacteria communities during sludge granulation in an anaerobic–aerobic sequencing batch reactor. Water Res. 2011, 45, 6207–6216. [Google Scholar]
  12. Jin, R.-C.; Zheng, P.; Mahmood, Q.; Zhang, L. Performance of a nitrifying airlift reactor using granular sludge. Sep. Purif. Technol. 2008, 63, 670–675. [Google Scholar] [CrossRef]
  13. Shi, X.-Y.; Yu, H.-Q.; Sun, Y.-J.; Huang, X. Characteristics of aerobic granules rich in autotrophic ammonium-oxidizing bacteria in a sequencing batch reactor. Chem. Eng. J. 2009, 147, 102–109. [Google Scholar] [CrossRef]
  14. Zheng, Y.-M.; Yu, H.-Q.; Sheng, G.-P. Physical and chemical characteristics of granular activated sludge from a sequencing batch airlift reactor. Process Biochem. 2005, 40, 645–650. [Google Scholar] [CrossRef]
  15. Liu, Y.; Wang, Z.-W.; Liu, Y.Q.; Qin, L.; Tay, J.H. A generalized model for settling velocity of aerobic granular sludge. Biotechnol. Progr. 2005, 21, 621–626. [Google Scholar] [CrossRef]
  16. Sun, Y.; Angelotti, B.; Wang, Z.-W. Continuous-flow aerobic granulation in plug-flow bioreactors fed with real domestic wastewater. Sci. Total Environ. 2019, 688, 762–770. [Google Scholar] [CrossRef]
  17. Tsuneda, S.; Nagano, T.; Hoshino, T.; Ejiri, Y.; Noda, N.; Hirata, A. Characterization of nitrifying granules produced in an aerobic upflow fluidized bed reactor. Water Res. 2003, 37, 4965–4973. [Google Scholar] [CrossRef] [PubMed]
  18. Wang, J.; Wang, X.; Zhao, Z.; Li, J. Organics and nitrogen removal and sludge stability in aerobic granular sludge membrane bioreactor. Appl. Microbiol. Biotechnol. 2008, 79, 679–685. [Google Scholar] [CrossRef]
  19. Li, X.; Li, Y.; Liu, H.; Hua, Z.; Du, G.; Chen, J. Characteristics of aerobic biogranules from membrane bioreactor system. J. Membr. Sci. 2007, 287, 294–299. [Google Scholar] [CrossRef]
  20. Geng, Z.; Hall, E.R. A comparative study of fouling-related properties of sludge from conventional and membrane enhanced biological phosphorus removal processes. Water Res. 2007, 41, 4329–4338. [Google Scholar] [CrossRef] [PubMed]
  21. Liu, Q.; Yao, Y.; Xu, D. Mechanism of Membrane Fouling Control by HMBR: Effect of Microbial Community on EPS. Int. J. Environ. Res. Public Health 2020, 17, 1681. [Google Scholar] [CrossRef] [Green Version]
  22. Zuthi, M.; Ngo, H.; Guo, W. Modelling bioprocesses and membrane fouling in membrane bioreactor (MBR): A review towards finding an integrated model framework. Bioresour. Technol. 2012, 122, 119–129. [Google Scholar] [CrossRef] [PubMed]
  23. Wang, J.; Qiu, Z.; Chen, Z.; Li, J.; Zhang, Y.; Wang, X.; Zhang, B. Comparison and analysis of membrane fouling between flocculent sludge membrane bioreactor and granular sludge membrane bioreactor. PLoS ONE 2012, 7, e40819. [Google Scholar]
  24. Wang, X.; Zhang, B.; Shen, Z.; Qiu, Z.; Chen, Z.; Jin, M.; Li, J.; Wang, J. The EPS characteristics of sludge in an aerobic granule membrane bioreactor. Bioresour. Technol. 2010, 101, 8046–8050. [Google Scholar]
  25. Liu, Y.-Q.; Lan, G.-H.; Zeng, P. Size-dependent calcium carbonate precipitation induced microbiologically in aerobic granules. Chem. Eng. J. 2016, 285, 341–348. [Google Scholar] [CrossRef] [Green Version]
  26. Wang, X.; Zhang, H.; Yang, F.; Wang, Y.; Gao, M. Long-term storage and subsequent reactivation of aerobic granules. Bioresour. Technol. 2008, 99, 8304–8309. [Google Scholar] [CrossRef]
  27. De la Torre, T.; Rodriguez, C.; Gomez, M.; Alonso, E.; Malfeito, J. The IFAS-MBR process: A compact combination of biofilm and MBR tecnnology as RO pretreatment. Desalin. Water Treat. 2013, 51, 1063–1069. [Google Scholar] [CrossRef]
  28. Iorhemen, O.T.; Hamza, R.A.; Tay, J.H. Membrane bioreactor (MBR) technology for wastewater treatment and reclamation: Membrane fouling. Membranes 2016, 6, 33. [Google Scholar] [CrossRef] [Green Version]
  29. Thanh, B.X.; Visvanathan, C.; Aim, R.B. Fouling characterization and nitrogen removal in a batch granulation membrane bioreactor. Int. Biodeterior. Biodegrad. 2013, 85, 491–498. [Google Scholar] [CrossRef]
  30. Li, X.; Du, R.; Peng, Y.; Zhang, Q.; Wang, J. Characteristics of sludge granulation and EPS production in development of stable partial nitrification. Bioresour. Technol. 2020, 303, 122937. [Google Scholar] [CrossRef]
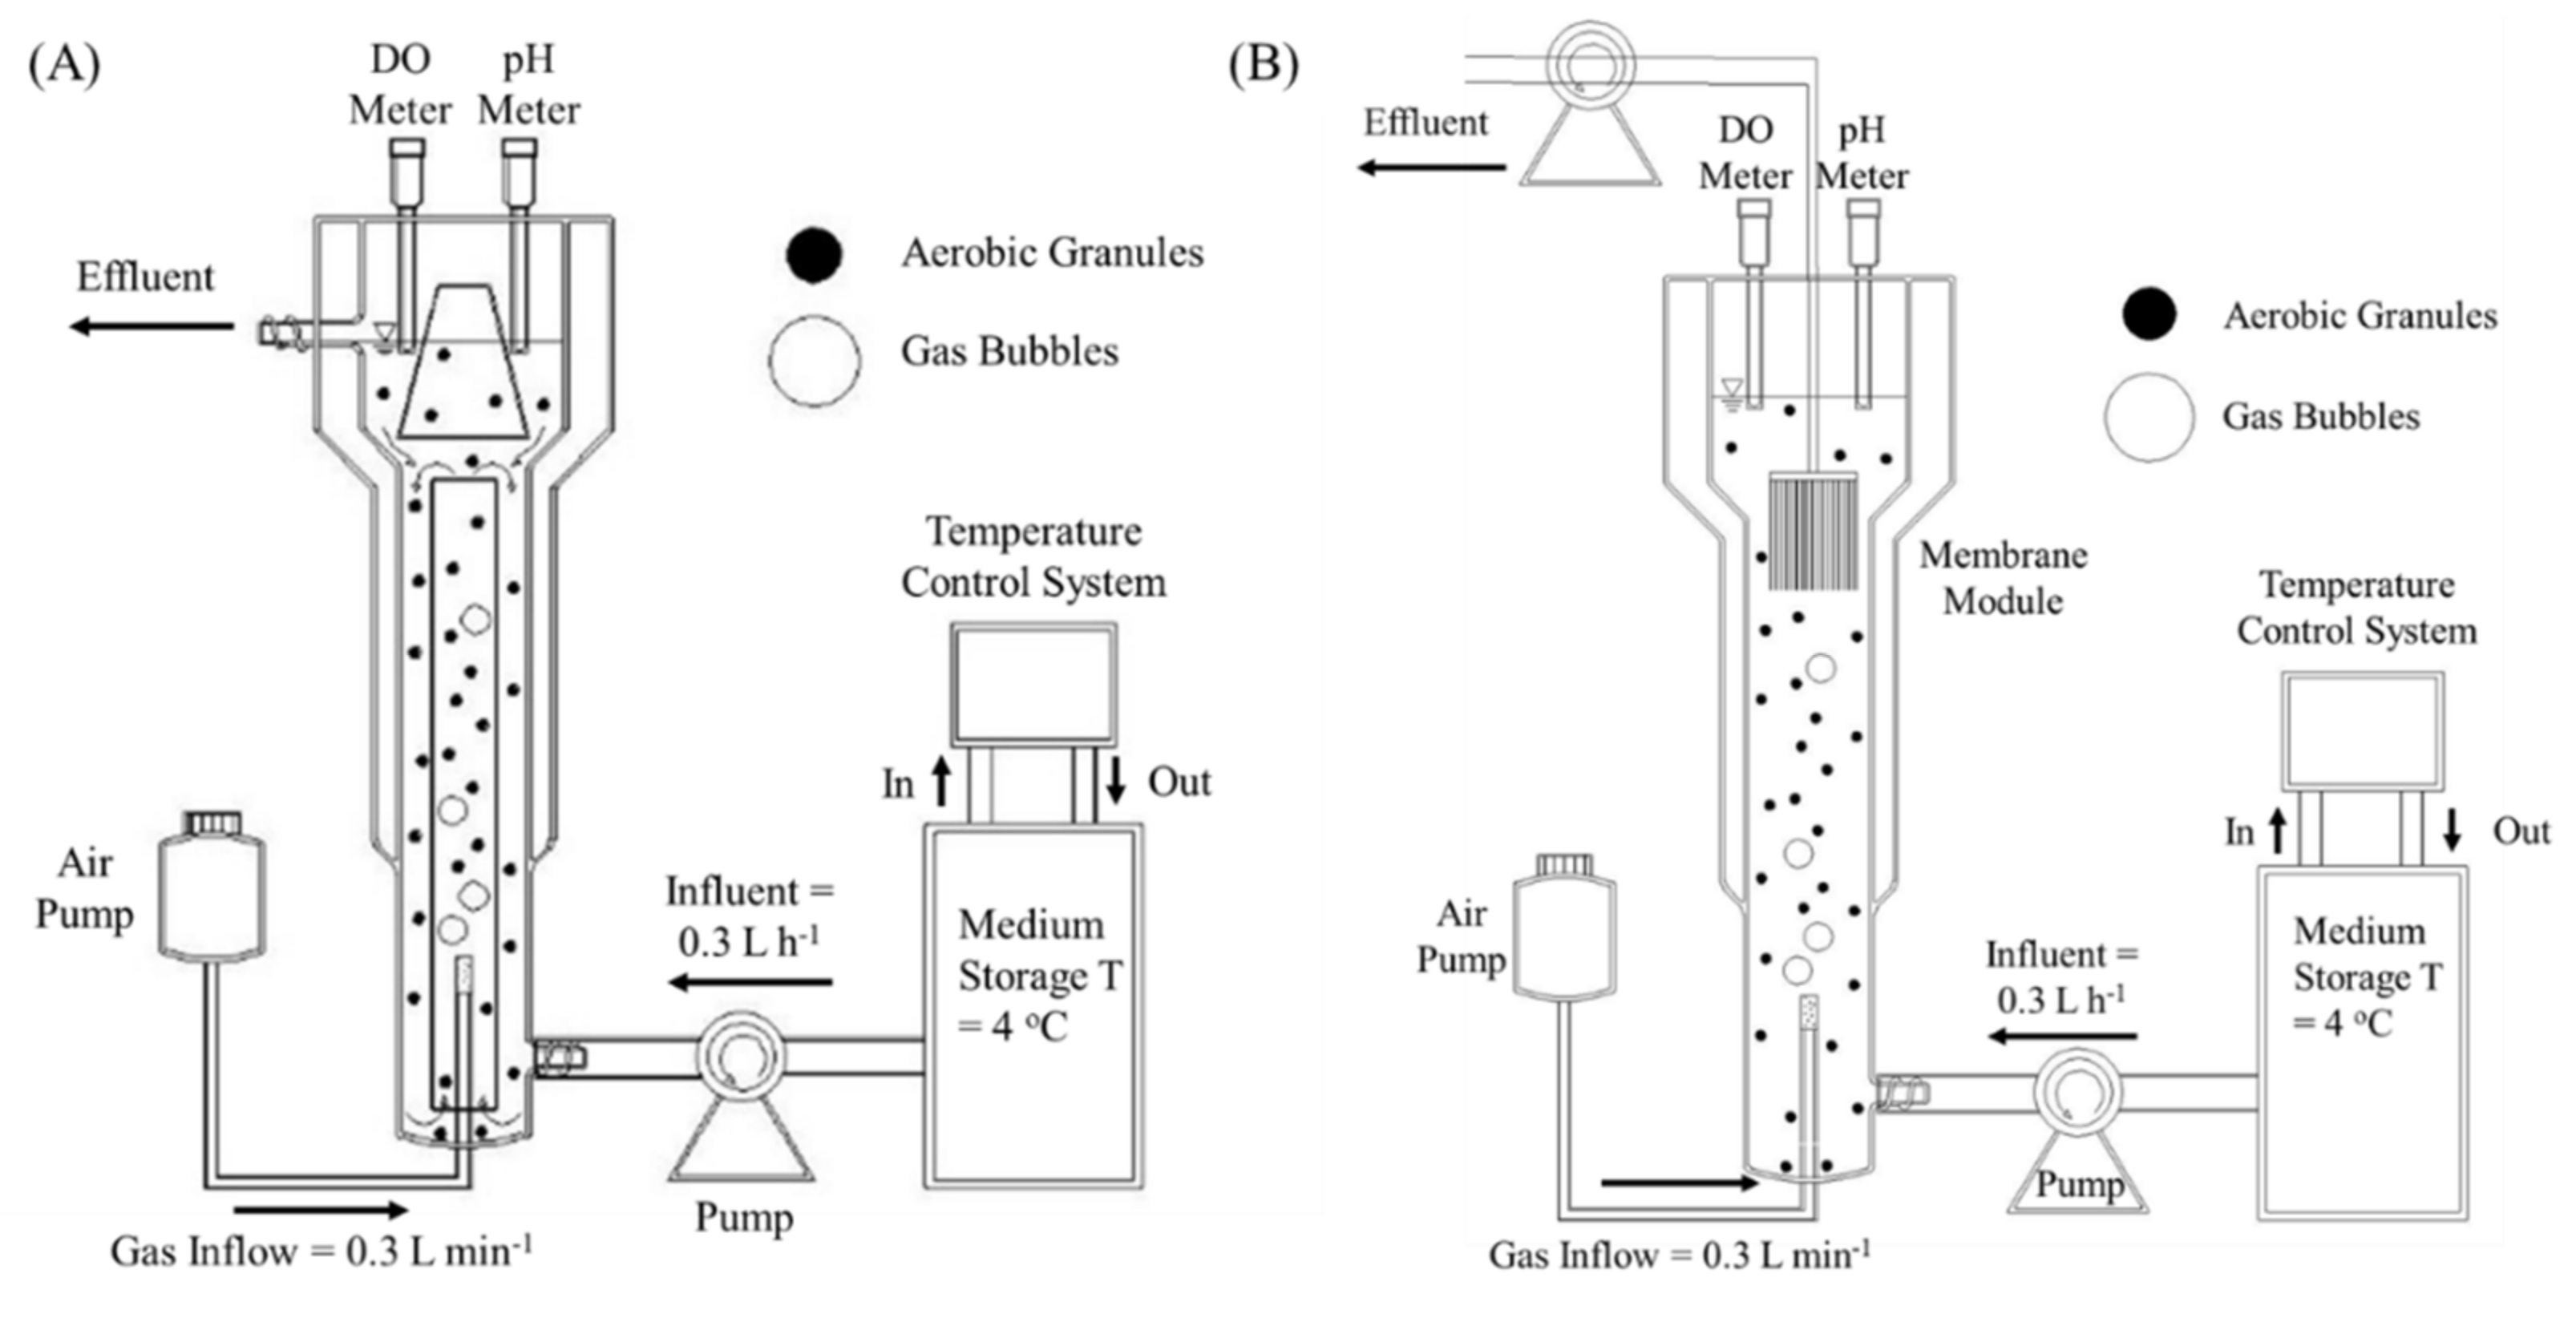
Figure 1. Reactor setup of the ALR (A) without membrane and the GMBR (B) with membrane.
Processes 09 01024 g001
Figure 2. Morphology of nitrifying granules in the GMBR on day 0 (A), 37 (B), 79 (C), 100 (D), 130 (E), 150 (F), 180 (G), 210 (H), 240 (I), 260 (J), 280 (K) and 305 (L).
Processes 09 01024 g002
Figure 3. Particle size distribution in the GMBR in the course of 305 days of operation.
Processes 09 01024 g003
Figure 4. Turbidity in the influent, supernatant, and effluent (A) of the GMBR, as well as the ammonia removal (B) in the course of 305 days of operation. The error bar refers to the standard deviation from triplicate measurement.
Processes 09 01024 g004
Figure 5. MLSS and MLVSS distribution (A) and ash contents (B) of bioflocs and granules after 305 days of cultivation in the GMBR.
Processes 09 01024 g005
Figure 6. Live/dead stained cross-section of 1.1 mm (A) and 1.8 mm (B) nitrifying granules after 305 days of cultivation in the GMBR.
Processes 09 01024 g006
Figure 7. Model simulation of substrate utilization profiles in bioflocs (150 μm diameter, (A)) and granules (1800 μm diameter, (B)).
Processes 09 01024 g007
Figure 8. OUR distribution between total, granules, bioflocs, and membrane within one backwash cycle (A) and particle size distribution before and after backwash of the membrane (B).
Processes 09 01024 g008
Figure 9. sEPS concentration in the GMBR mixed liquor (A) and membrane effluent (B) within a backwash cycle.
Processes 09 01024 g009
Figure 10. TMP profile of the membrane inserted in the mixed liquor of GMBR within a backwash cycle (A), and TMP profile of the membrane when only bioflocs or granules were loaded in the GMBR, respectively (B).
Processes 09 01024 g010
Table 1. Reactor performance in a GMBR at steady state on the 305th day.
ParametersUnitInfluentIn ReactorEffluent
DOmg L−1-4.63 ± 0.84-
pH-8.22 ± 0.147.23 ± 0.237.24 ± 0.22
NH4+-Nmg L−149.70 ± 2.503.26 ± 4.172.66 ± 5.83
NO2-Nmg L−10.28 ± 0.213.42 ± 4.533.85 ± 5.83
NO3-Nmg L−10.79 ± 0.5345.56 ± 6.7345.93 ± 5.97
Each parameter was measured in triplicate and expressed as mean ± standard deviation.
Table 2. Characteristics of seed granule and seed ALR without membrane.
ParametersUnitGranulesInfluentEffluent
Particle sizemm1.8 ± 0.6--
Settling velocitym h−154.2 ± 4.4--
DOmg L−1-4.11 ± 0.72-
pH--8.34 ± 0.167.26 ± 0.19
TurbidityNTU-2.12 ± 1.120.77 ± 0.31
NH4+-Nmg L−1-50.74 ± 5.361.70 ± 1.62
NO2--Nmg L−1-0.80 ± 0.280.55 ± 0.32
NO3--Nmg L−1-0.65 ± 0.1949.83 ± 5.07
Each parameter was measured in triplicate and expressed as mean ± standard deviation.
Publisher’s Note: MDPI stays neutral with regard to jurisdictional claims in published maps and institutional affiliations.