Abstract
A set of suitable parameter values is crucial in discrete element method (DEM) simulations. As a non-spherical particle, the coefficients of rolling friction between maize seed particles and between the seed particles and the boundary are hard to measure directly and must be obtained by calibration. In this paper, taking three representative maize varieties as research objects, the necessity for the accurate calibration of the coefficients of rolling friction between seed particles and between seed particles and boundaries is investigated. Subsequently, by studying the sensitivity of the coefficients of rolling friction between seed particles and between seed particles and the boundary to the angle of repose test, the methods used to calibrate the coefficients of rolling friction between seed particles and between the particles and the boundary are determined. It can be seen from the results that the coefficients of rolling friction between the seed particles and between the seed particles and the boundary have a significant influence on the test results, so these two parameters must be accurately calibrated. Additionally, the coefficient of rolling friction between seed particles and the boundary has no effect on the piling angle, but the piling angle is highly sensitive to the coefficient of rolling friction between seed particles. By comparing the simulation results and the experimental results in the lifting cylinder and “self-flow screening” tests, the calibrated seed parameters were found to be accurate and valid.
1. Introduction
A set of suitable parameter values is crucial in discrete element method (DEM) simulation [1]. For maize seeds, because of their irregular shape, the coefficients of rolling friction between particles and between the particles and wall are hard to measure directly. It is necessary to obtain them by the calibration method. Some studies [2,3] showed that the coefficients of rolling friction of non-spherical particles did not need to be considered in DEM simulation and the test requirements could be well met by calibrating the coefficient of sliding friction. However, some studies suggested that the coefficient of rolling friction should be considered for non-spherical particles, and the coefficient of rolling friction had a large impact on the particle group behavior [4,5,6,7,8,9,10]. Shi [9] calibrated only the coefficient of rolling friction between maize seed particles and did not consider the coefficient of rolling friction between maize particles and the boundary. Wang [5], Chen [8], and Wang [4] calibrated the coefficients of rolling friction between maize particles and between seed particles and the wall. Therefore, for the selection of maize seed parameters, whether rolling friction needs to be considered, whether the coefficients of the rolling friction between particles and between particles and the wall both need to be accurately calibrated, and how the coefficients of rolling friction affect the movement of maize seed particles need to be studied further.
Moreover, when more than two parameters need to be calibrated, there may be more than one combination of the parameters meeting the test requirements. Therefore, it is not accurate to obtain the contact parameters of maize seeds by a single-factor test without confirming that the calibration test is sensitive to only one of the parameters. When calibration tests are carried out by multifactor and multilevel comprehensive tests, the combination of parameters may not be the optimal result. Moreover, the more parameters that need to be calibrated, the more complex the calibration test will be, and the accuracy of the calibration results will be reduced. Therefore, determining a set of accurate contact parameters through fewer calibration tests requires further research.
Based on the abovementioned issues, three representative maize seed varieties were chosen for study. Some parameters of maize seed particles are measured by direct measurement. The effect of the coefficients rolling friction between seed particles and between seed particles and wall on the population behavior of seed particles is analyzed by piling angle and “self-flow screening” tests, and the calibration method of seed parameters is determined by the sensitivity study. The accuracy of the calibrated seed parameters was validated by the lifting cylinder test and “self-flow screening” tests. This article offers a reference for the calibration of particle parameters of maize seeds.
2. Measurement of Particle Parameters of Maize Seed
In this section, the moisture content, coefficient of restitution, coefficient of static friction, particle density, and other parameters of maize seeds are measured by direct measurement.
2.1. Measurement of the Moisture Content of Seed Particles
In this paper, the moisture content of maize seeds is determined by heat drying under atmospheric pressure. The formula for calculating the moisture content of maize seeds according to the mass difference of maize seeds before and after drying is as follows:
where the moisture content of maize seed is w; the mass of box is m1; the total mass of the box and maize seed particles before drying is m2; the total mass of the box and maize seed particles after the last drying is m3. Five repetitions are made for every group.
2.2. Measurement of Seed Particle Density
In this paper, the pycnometer method is used to measure the particle density of maize seeds. The formula for calculating the particle density of seed particles is as follows:
where particle density of maize seeds is ; density of distilled water at a certain temperature is ; the mass of maize seeds is m0; the mass of empty volumetric flask is m1; the mass of the volumetric flask filled with distilled water is m2; the mass of volumetric flask filled with maize seeds and distilled water is m3. The experiment is repeated five times in each group.
2.3. Measurement of Coefficients of Restitution between Seed Particles and between Particles and Boundaries
2.3.1. Measurement of the Coefficient of Restitution between Particles and Boundaries
In this paper, the dropping test [11,12] is used to determine the coefficient of restitution between seed particles and boundaries (the organic glass plate). If the influence of air resistance is not considered, the coefficient of restitution can be expressed as follows:
where the coefficient of restitution between seed particles and boundaries is ; rebound height of seed particles is h; the initial height of seed particles is H.
The procedure of measuring the coefficient of restitution between maize seed particles and boundaries is as follows. First, the position of the support frame was adjusted so that the air pump nozzle was directly above the organic glass plate, and the angle of the mirror was adjusted so that the organic glass plate could be seen completely through the computer screen. After the air pump generates suction, the seed is adsorbed on the nozzle, as shown in Figure 1a. Second, when the air pump is turned off, the seed falls vertically under gravity and collides with the organic glass plate, which is recorded by a high-speed camera (YORK TECH, Rock Hill, SC, USA). Playing back the video, contact point 1 with the aid of the mirror is marked when the seed contacts the organic glass plate for the first time, as shown in Figure 1a, and similarly, contact point 2 is marked when the seed contacts the organic glass plate for the second time, as shown in Figure 1b. Finally, the offset distance between contact point 1 and contact point 2 is compared. If the offset distance is small, namely, there is a vertical collision, and no obvious rotation occurs after the seed collides with the organic glass plate, the test data will be retained; otherwise, they will be eliminated until the number of tests meeting the requirements reaches 10.
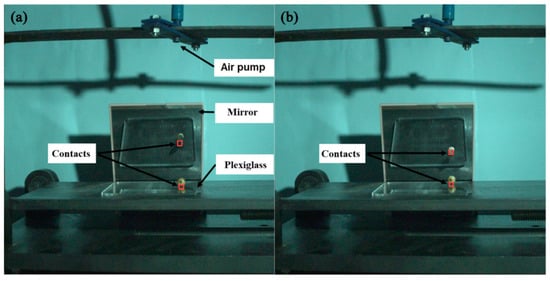
Figure 1.
Measurement of the coefficient of restitution between seed particles and boundaries: (a) the first collision and (b) Second collision.
2.3.2. Measurement of the Coefficient of Restitution between Seed Particles
In this paper, the single pendulum test [13] is used to determine the coefficient of restitution between maize seed particles. If the influence of air resistance is not considered, the coefficient of restitution between maize seed particles is expressed as follows:
where the coefficient of restitution between maize seed particles is ; the initial height of seed particle 1 is H0; the height of seed particle 1 after the collision is H1; the height of seed particle 2 after the collision is H2.
The procedure of measuring the coefficient of restitution between maize seed particles is as follows. First, lift particle 1 on the left side up to a certain height and release freely, as shown in Figure 2a. Second, under the action of gravity and tension, particle 1 swings down to the right and collides with stationary particle 2 on the right. After the collision, the two particles will swing to the right until they reach their respective highest point (see Figure 2b). Finally, a high-speed camera (YORK TECH, Rock Hill, SC, USA) is used to record the whole collision process, and measurements for the initial height of the particles and the height after the collision are obtained. The test is repeated 10 times.
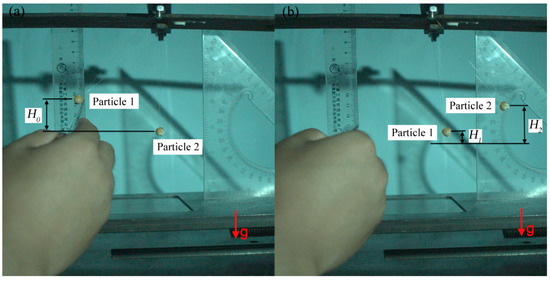
Figure 2.
Platform to test the coefficient of restitution between seed particles: (a) initial position and (b) the position of the highest point after a collision.
2.4. Measurement of Coefficients of Static Friction between Seed Particles and between Particles and Wall
In this paper, the slope method is selected to determine the coefficient of static friction between particles and between particles and boundaries. The experimental device is shown in Figure 3.
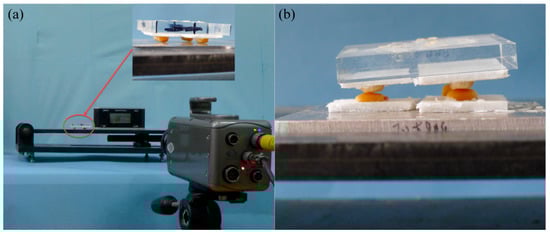
Figure 3.
Experimental setup for coefficients of static friction (a) between seed particles and (b) between particles and wall measurement.
The procedure of measuring the coefficient of static friction between particles and boundaries (organic glass) is as follows. First, three randomly selected maize seed particles were glued on an 80 mm × 80 mm × 10 mm organic glass plate, and the organic glass plate adhered to maize seed particles was placed on an organic glass plate installed on the device (see Figure 3a). The inclinometer is located horizontally at the device. Second, the slope is slowly lifted until the organic glass plate adhering to the maize seed particles slid down the slope. Finally, the indicator of the inclinometer is obtained when the maize seed particles just slide on the inclined plane by the high-speed camera (YORK TECH, Rock Hill, SC, USA). The experiment is repeated five times in each group. The coefficient of static friction between the seed particles and the wall is calculated by the following formula :
where the coefficient of static friction between the seed particles and the boundary is and the indicator of the inclinometer when the maize seed particles just slide on the inclined plane is .
Since one side of the horse-tooth-shaped maize seed particles is flat, the coefficient of static friction between seed particles is measured by the above slope method.
The procedure of measuring the coefficient of static friction between seed particles is as follows. First, six horse-tooth-shaped seed particles with flat surfaces are selected, and the selected seed particles are glued on the device and the 40 mm × 40 mm × 10 mm organic glass plate. The organic glass plate adhered to three seed particles was placed above the corresponding three seed particles glued on the device. The inclinometer is placed horizontally on the device, as shown in Figure 3b. Second, the slope was slowly lifted until the organic glass plate adhering to the maize seed particles slid down the slope. Finally, the indicator of the inclinometer is obtained when the maize seed particles just slide on the inclined plane by the high-speed camera (YORK TECH, Rock Hill, SC, USA), and the test is repeated 5 times. The coefficient of static friction between the seed particles is calculated by the following formula :
where the coefficient of static friction between the seed particles is and the indicator of the inclinometer when the maize seed particles just slide on the inclined plane is .
2.5. Parameter Setting
Poisson’s ratio was chosen according to ASAE Standards [14,15]. The Young’s modulus of maize seeds was adopted from ref. [10], which is Pa.
3. Particle Model of Maize Seed
Maize seeds can be divided into five shapes: horse-tooth, truncated triangular pyramid, ellipsoidal cone, spheroid, and irregular [10]. However, the contact parameters between seed particles and between seed particles and boundaries are independent of the shape of particles. Therefore, taking horse-tooth seeds as the research object, the contact parameters between maize seed particles and between maize seed particles and boundaries are calibrated. The particle models of horse-tooth seeds of the three maize varieties are shown in Figure 4.
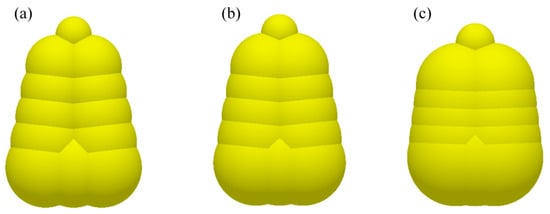
Figure 4.
Particle models of the horse-tooth-shaped seed of three varieties: (a) Liangyu99, (b) Xianyu 335, and (c) Zhengda 999.
4. Influence of Coefficients of Rolling Friction between Seed Particles and between Seed Particles and Boundary on Tests
In this section, the influence of the coefficients of rolling friction between seed particles and between seed particles and the boundary on the piling angle test and the “self-flow screening” test is investigated to validate the necessity of accurate calibration of the coefficients of rolling friction between seed particles and between seed particles and the boundary.
4.1. Influence of Coefficients of Rolling Friction between Seed Particles on Piling Angle Test
In addition to the coefficients of rolling friction between seed particles and between seed particles and the boundary, other parameters used in the simulation are shown in Table 1. The coefficient of rolling friction between seed particles and the boundary is set to 0.03, and the coefficient of rolling friction between seed particles is selected as 7 levels of 0, 0.03, 0.06, 0.09, 0.12, 0.18, and 0.21 to study the influence of the coefficient of rolling friction between seed particles on the piling angle. EDEM 2018 (4.0.0) software and the HM-new-restitution contact model [16,17] are employed to conduct the piling angle test.

Table 1.
Parameters used in the simulation.
The process of the draw-down test is as follows. When the simulation begins, first, a cuboid area of 320 mm × 64 mm × 25 mm is established to create seed particles (1.5 kg). Then, when the seeds gradually stabilize, the hole in the middle opens, and the particles flow downward. Lastly, when the particles do not move, particles left above the device form two piling angles, as shown in Figure 5. The piling angles are measured by the image processing method. Five repetitions are made for every group.
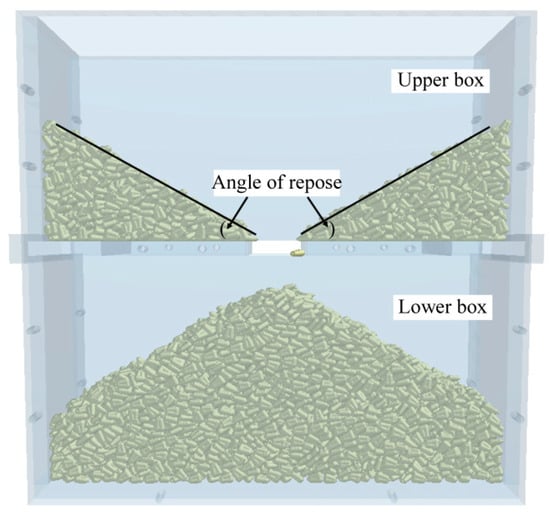
Figure 5.
Schematic of the draw-down apparatus.
4.2. Effect of the Coefficient of Rolling Friction between Seed Particles and the Boundary on the Percentage Passing
In this section, the effect of the coefficient of rolling friction between seed particles and the boundary on the percentage passing is explored by the screening test. EDEM 2018 (4.0.0) software and the HM-new-restitution contact model [16,17] are employed to conduct the angle of repose test. The coefficient of rolling friction between seed particles is set to 0.03, and the coefficient of rolling friction between seed particles and the boundary is selected as 7 levels of 0, 0.03, 0.06, 0.09, 0.12, 0.18, and 0.21. Other parameters used in the simulation are fixed, as shown in Table 1.
The process of the sieving test is as follows. First, a cuboid area of 60 mm × 100 mm × 280 mm is established in the loading box to create seed particles (0.2 kg), as shown in Figure 6. Then, when the seeds gradually stabilize, the hole in the middle opens, and the particles flow down by gravity. When the movement of particles is finished, the particles stay either in the collecting box beneath the sieve deck or on the screening deck. Lastly, the seed mass falling into each collecting box and the total mass passing through the sieve was quantified. Each simulation is repeated five times.
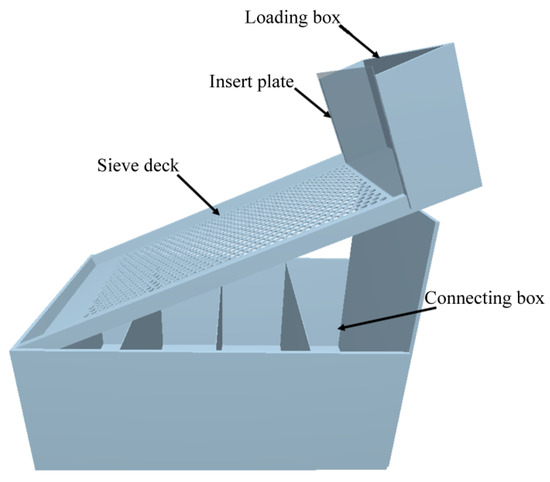
Figure 6.
Schematic of the screening test.
4.3. Analysis of the Effect of Coefficients of Rolling Friction between Maize Seed Particles and between Maize Seed Particles and Boundary on the Tests
4.3.1. Analysis of the Influence of the Coefficient of Rolling Friction between Seed Particles on the Piling Angle
Figure 7a–c shows the effect of the coefficient of rolling friction between seed particles on the piling angle for the three maize varieties. It can be seen from Figure 7a–c that with an increasing coefficient of rolling friction between seed particles, the piling angle increases first and subsequently decreases. Taking Liangyu 99 as an example, Figure 7a shows that when the coefficient of rolling friction between seed particles increases from 0 to 0.15, the angle of repose increases accordingly. The reason is that with the increase in the coefficient of rolling friction between seed particles, the rolling resistance between seed particles increases, thus increasing the piling angle. As the coefficient of rolling friction between seed particles increases from 0.15 to 0.21, the piling angle decreases gradually. The reason is that with the increase in the coefficient of rolling friction between seed particles, more seed particles stay in the middle region, forming a sector shape, which reduces the piling angle.
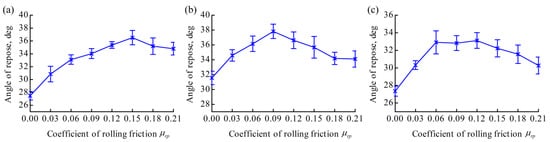
Figure 7.
Influence of coefficient of rolling friction between seed particles on piling angle for three varieties: (a) Liangyu99, (b) Xianyu 335 and (c) Zhengda 999.
Therefore, the coefficient of rolling friction between seed particles has a significant impact on the group behavior of seed particles, and it is necessary to accurately calibrate the coefficient of rolling friction between seed particles.
4.3.2. Analysis of the Effect of the Coefficient of Rolling Friction between Seed Particles and the Boundary on the Percentage Passing
Figure 8 shows that with the increase in the coefficient of rolling friction between seed particles and the boundary, the percentage passing of maize seeds decreases significantly. The reason is that with the increase of the coefficient of rolling friction between seed particles and boundary, the resistance of the particles rolling on the screen deck increases, which will make more particles accumulate on the screen deck, thus reducing percentage passing.
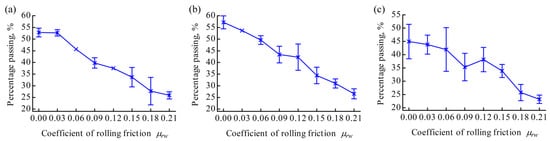
Figure 8.
Influence of coefficient of rolling friction between seed particles and boundary on percentage passing for three varieties: (a) Liangyu99, (b) Xianyu 335 and (c) Zhengda 999.
Therefore, the coefficient of rolling friction between seed particles and the boundary has a greater impact on the screening process of maize seeds, and it is essential to accurately calibrate the coefficient of rolling friction between seed particles and the boundary.
5. Study on the Sensitivity of Coefficients of Rolling Friction between Seed Particles and between Seed Particles and Boundary
In this section, the sensitivity of the coefficients of rolling friction between seed particles and between seed particles and the boundary to the angle of repose is studied to provide an effective basis for parameter calibration by a single-factor test.
5.1. Study on the Sensitivity of Coefficients of Rolling Friction between Seed Particles and between Seed Particles and Boundary to Angle of Repose
When more than two parameters need to be calibrated, there may be more than one set of the simulation parameters meeting the test requirements. If a single-factor test is selected to calibrate parameters, it is necessary to prove that the calibration test is sensitive to only one parameter. Therefore, the coefficient of rolling friction between seed particles and the coefficient of rolling friction between seed particles and the boundary is taken as 7 levels, and a 7 × 7 comprehensive test is carried out to investigate the sensitivity of the coefficients of rolling friction between seed particles and between seed particles and the boundary to the piling angle.
5.2. Analysis of the Sensitivity of Coefficients of Rolling Friction between Seed Particles and between Seed Particles and Boundary to Piling Angle
Figure 9a–c shows the effect of coefficients of rolling friction (between seed particles and between seed particles and boundary) of seed particles of three maize varieties on the piling angle. For Liangyu 99, Xianyu 335, and Zhengda 999, the coefficient of rolling friction between seed particles and the boundary has no effect on the piling angle, and the piling angle is highly sensitive to the coefficient of rolling friction between seed particles. Therefore, the coefficient of rolling friction between seed particles can be calibrated by the single-factor test of the piling angle.
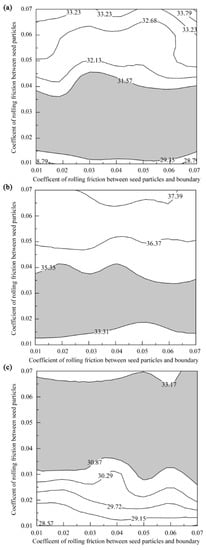
Figure 9.
Sensitivity of coefficients of rolling friction between seed particles and between seed particles and boundary to piling angle for three varieties: (a) Liangyu99, (b) Xianyu 335 and (c) Zhengda 999.
6. Calibration of Coefficients of Rolling Friction between Seed Particles and between Seed Particles and Boundary
In this section, the coefficients of rolling friction between seed particles and between seed particles and the boundary are calibrated by two single-factor tests.
6.1. Calibration of the Coefficient of Rolling Friction between Seed Particles
According to the sensitivity study in Section 5, the angle of repose is highly sensitive to the coefficient of rolling friction between seed particles and is insensitive to the coefficient of rolling friction between seed particles and the boundary. Therefore, the coefficient of rolling friction between seed particles and the boundary is fixed to 0.03, and six levels (0.01, 0.02, 0.03, 0.04, 0.05, and 0.06) of the coefficient of rolling friction between seed particles are selected to carry out the single-factor piling test. By comparing the simulation results with the experimental results, the coefficient of rolling friction between seed particles can be calibrated.
6.2. Calibration of the Coefficient of Rolling Friction between Seed Particles and the Boundary
After the coefficient of rolling friction between seed particles is determined, the coefficient of rolling friction between seed particles and the boundary (organic glass) is also calibrated by the single-factor piling test.
The calibration method of the coefficient of rolling friction between seed particles and the boundary is as follows. Because the coefficients of rolling friction are not associated with the shape of particles or boundaries, organic glass spheres (the diameters of the spheres are 10 mm) with the same material as the boundary are added into the maize seeds (see Figure 10). The coefficient of rolling friction between maize seeds and organic glass spheres is determined by single-factor piling tests, which is equal to the coefficient of rolling friction between seed particles and the boundary (organic glass).
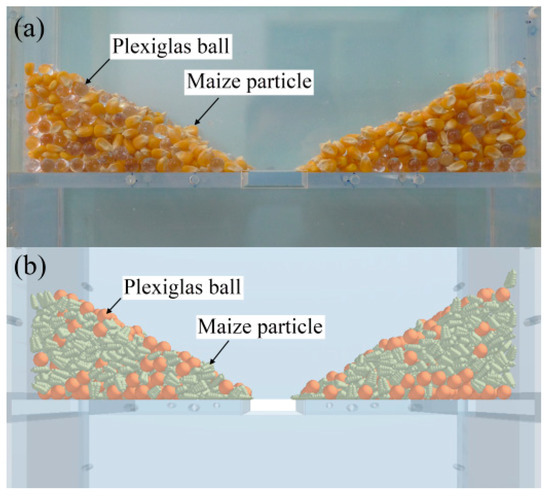
Figure 10.
Piling test after mixing maize seeds with organic glass spheres: (a) experimental result and (b) simulation result.
The coefficient of static friction between the boundaries (organic glass) is determined by the slope method, and the coefficient of restitution between boundaries (organic glass) is measured by the dropping test. The coefficient of rolling friction between the boundaries (organic glass) is measured by the slope method, as shown in Figure 11.
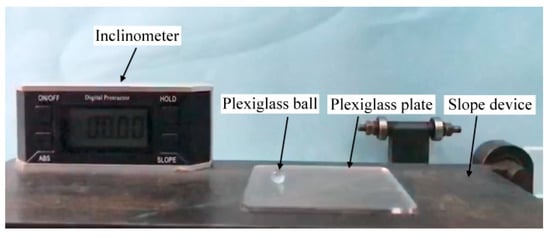
Figure 11.
Experimental setup for the coefficient of static friction between boundaries measurement.
6.3. Determination of Coefficients of Rolling Friction between Seed Particles and between Seed Particles and Boundary
6.3.1. Determination of the Coefficient of Rolling Friction between Seed Particles
Figure 12a–c shows the relationship between the piling angle and coefficient of rolling friction between seed particles for three maize varieties. Taking the calibration of the coefficient of rolling friction between seed particles of Liangyu 99 as an example, Figure 12a shows that the piling angle increases with the increase in the coefficient of rolling friction between seed particles. The linear relationship between the piling angle and coefficient of rolling friction between seed particles is obtained by linear fitting, and the formula of the linear relationship is as follows.
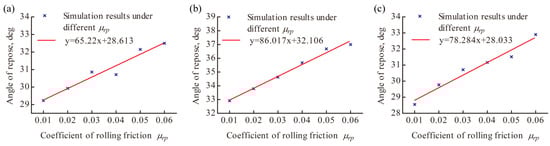
Figure 12.
Calibration of the coefficient of rolling friction between seed particles for three maize varieties for three varieties: (a) Liangyu99, (b) Xianyu 335 and (c) Zhengda 999.
Substituting the experimental result of the piling angle, 30.461, into Equation (7), the coefficient of rolling friction between seed particles is obtained as 0.028.
Similarly, the coefficients of rolling friction between seed particles of Xianyu 335 and Zhengda 999 were calculated as 0.026 and 0.051, respectively.
6.3.2. Determination of the Coefficient of Rolling Friction between Seed Particles and the Boundary
Figure 13a–c shows the relationship between the piling angle and coefficient of rolling friction between seed particles and organic glass spheres for three maize varieties. Taking the calibration of the coefficient of rolling friction between maize seed particles and organic glass spheres of Liangyu 99 as an example, it can be seen from Figure 13a that as the coefficient of rolling friction between seed particles and organic glass spheres increases, the piling angle increases. The linear relationship between seed particles and organic glass spheres is obtained by linear fitting, and the formula of the linear relationship is as follows.
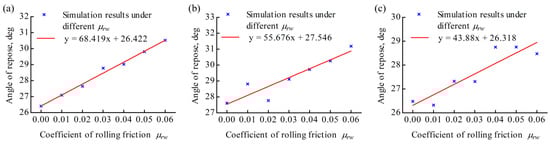
Figure 13.
Calibration of the coefficient of rolling friction between seed particles and boundary for three maize varieties for three varieties: (a) Liangyu99, (b) Xianyu 335 and (c) Zhengda 999.
Substituting the experimental result of the piling angle, 27.179, into Equation (8), the coefficient of rolling friction between seed particles and organic glass spheres is obtained, which is 0.011. The coefficient of rolling friction between seed particles and organic glass spheres is equal to the coefficients of rolling friction between seed particles and the boundary (organic glass).
Similarly, the coefficients of rolling friction between seed particles and the boundary (organic glass) for Xianyu 335 and Zhengda 999 are calculated as 0.015 and 0.023, respectively.
7. Physical Verification Test
In this section, by comparing the simulation results using the calibrated parameters (RPC) and the experimental results in the lifting cylinder and self-flow screening tests, the accuracy of the calibrated parameters is validated. Meanwhile, the difference between the simulation results without considering the rolling friction (RWR) and the experimental results is investigated.
7.1. Lifting Cylinder Test
The device of the lifting cylinder test is shown in Figure 14a, and the diameter and height of the cylinder made of organic glass are 80 mm and 200 mm, respectively. In addition, the coefficients of rolling friction between maize seed particles and between the seed particles and the boundary are adopted from the values calibrated in the previous section. Other parameters used in the simulation are shown in Table 1.
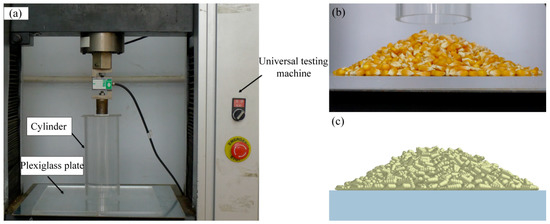
Figure 14.
Schematic of the lifting cylinder test: (a) apparatus of the lifting cylinder test, (b) experimental result of the lifting cylinder test and (c) simulation result of the lifting cylinder test.
The process of the lifting cylinder test is as follows. First, the cylinder is placed horizontally on the organic glass plate and 0.6 kg seeds are piled in the cylinder. Second, with the cylinder moving upward at the speed of 5 mm/s, the seed particles slowly accumulated on the plate. Lastly, when the seed particles stop moving, a piling angle is formed on the plate (see Figure 14b,c), and the piling angles are got by the image processing method. In the lifting cylinder test, the ratio of the diameter of the base circle of the pile to the averaged particle size meets the requirements in FEM standards [18]. The test is repeated 3 times.
Figure 15 shows the simulation results and the experimental results of the lifting cylinder test. The relative errors between the simulation results using calibrated parameters (RPC) and the experimental results in terms of the piling angle for the three maize varieties are small, which are 0.27%, 5.09%, and 4.29%, respectively. However, the simulation results without considering the rolling friction (RWR) are lower than those with considering rolling friction for the three maize varieties and differ largely from the experimental results. The relative errors between the simulation results without considering the rolling friction (RWR) and the experimental results are 10.75%, 4.15%, and 16.39%, respectively.
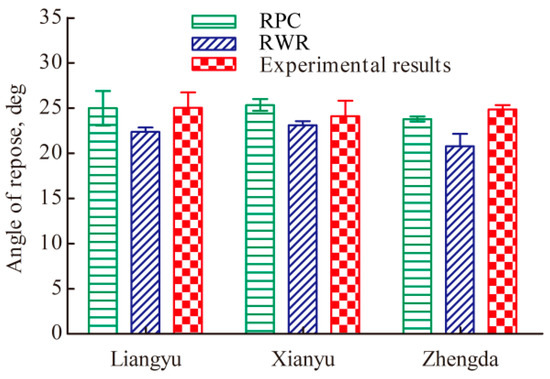
Figure 15.
Comparisons between the experimental results and the simulation results in terms of piling angle for three varieties.
7.2. “Self-Flow Screening” Test
The accuracy of maize seed parameters was further validated by a “self-flow screening” test. In the test, the thickness, length, and width of the sieve deck made of organic glass are 1.5 mm, 580 mm, and 300 mm, respectively, and the collecting box is divided into 4 compartments defined as Section 1, Section 2, Section 3, and Section 4 from right to left (Figure 16a–c). In addition, a round sieve aperture of 9 mm diameter is determined [19]. The inclination angle of the sieve deck is 24°. Additionally, the coefficients of rolling friction between maize seed particles and between the seed particles and the boundary are selected from the values calibrated in the previous section. Other parameters used in the simulation are shown in Table 1.
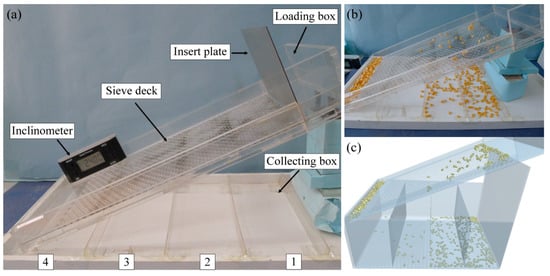
Figure 16.
Schematic of the “self-flow screening” test: (a) apparatus of the “self-flow screening” test, (b) experimental result of the “self-flow screening” test and (c) simulation result of the “self-flow screening” test.
Figure 17 and Figure 18 are the comparison of the simulated results and the experimental results in terms of the total percentages passing and percentage passing of different statistical areas for the three maize varieties. As shown in Figure 17, the differences between the simulation results using calibrated parameters (RPC) and the experimental results in terms of the total percentages passing for the three maize varieties are small, which are 10.01%, 12.05%, and 0.34%, respectively. However, the simulation results without considering the rolling friction (RWR) are significantly greater than the experimental results. Furthermore, Figure 18 shows that the simulation results using calibrated parameters (RPC) are close to the experimental results in terms of the percentage passing of different statistical areas for the three varieties. The simulation results without considering the rolling friction (RWR) differ largely from the experimental results.
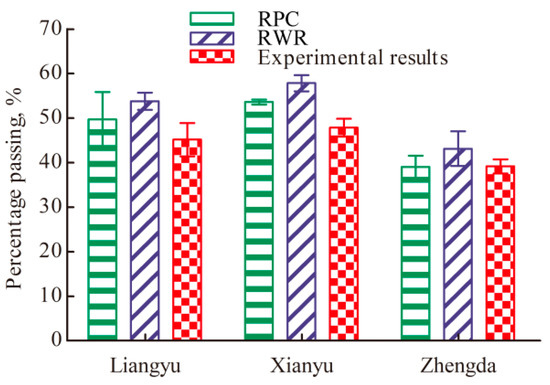
Figure 17.
Comparisons between the experimental results and the simulation results in terms of total percentages passing for three varieties.
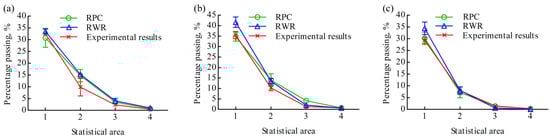
Figure 18.
Comparisons between the experimental results and the simulation results in terms of percentage passing of different statistical areas passing for three varieties: (a) Liangyu99, (b) Xianyu 335, and (c) Zhengda 999.
According to comprehensive analysis, the seed parameters obtained by the calibration tests in this paper are accurate and valid. In addition, when rolling friction is not considered, the simulation results differ largely from the experimental results. Therefore, rolling friction needs to be considered in simulation tests of maize seeds.
8. Conclusions
Considering the problems existing in the process of calibrating maize seed parameters, the influence of the coefficients of rolling friction between seed particles and between seed particles and the boundary on the angle of repose and percentage passing is investigated to explore the necessity of accurate calibration of the coefficients of rolling friction between seed particles and between seed particles and the boundary. Subsequently, by studying the sensitivity of the coefficients of rolling friction to the angle of repose, the calibration method of the coefficients of rolling friction of maize seeds is determined. The main conclusions drawn from this paper are as follows.
- (1)
- With the increase in the coefficient of rolling friction between seed particles, the angle of repose increases first and subsequently decreases. Additionally, as the coefficient of rolling friction between seed particles and the boundary increases, the percentage passing of maize seeds decreases significantly. Therefore, it is necessary to accurately calibrate the coefficients of rolling friction between seed particles and between seed particles and the boundary.
- (2)
- The coefficient of rolling friction between seed particles and the boundary does not affect the angle of repose, but the angle of repose is highly sensitive to the coefficient of rolling friction between seed particles. It provides a basis for the calibration of the coefficients of rolling friction between seed particles and between seed particles and boundaries by a single-factor test.
- (3)
- The coefficient of rolling friction between seed particles is calibrated by single-factor piling tests. Then, because the coefficients of rolling friction are not associated with the shape of particles or boundaries, spheres with the same material as the boundary are added into the maize seeds. The coefficient of rolling friction between maize seeds and spheres is determined by single-factor piling tests, which is equal to the coefficient of rolling friction between seed particles and the boundary. By comparing the simulation results and the experimental results in the lifting cylinder and “self-flow screening” tests, the seed parameters obtained by the calibration test are accurate and valid, and rolling friction must be considered in simulation tests of maize seeds.
Author Contributions
Conceptualization, J.Y.; methodology, L.Z.; validation, L.Z., and K.S.; investigation, L.Z., and D.Y.; resources, J.Y.; writing—original draft preparation L.Z.; writing—review and editing, Y.W.; supervision, L.L.; project administration, Y.Y.; funding acquisition, P.L. All authors have read and agreed to the published version of the manuscript.
Funding
This research was funded by the National Natural Science Foundation of China, grant number 51675218.
Institutional Review Board Statement
Not applicable.
Informed Consent Statement
Not applicable.
Data Availability Statement
Data sharing not applicable.
Conflicts of Interest
The authors declare no conflict of interest.
References
- Cundall, P.A.; Strack, O.D.L. A discrete numerical model for granular assemblies. Geotechnique 1979, 29, 47–65. [Google Scholar] [CrossRef]
- Pasha, M.; Hare, C.; Ghadiri, M.; Gunadi, A.; Piccione, P.M. Effect of particle shape on flow in discrete element method simulation of a rotary batch seed coater. Powder Technol. 2016, 296, 29–36. [Google Scholar] [CrossRef]
- Markauskas, D.; Ramírez-Gómez, Á.; Kačianauskas, R.; Zdancevičius, E. Maize grain shape approaches for DEM modelling. Comput. Electron. Agric. 2015, 118, 247–258. [Google Scholar] [CrossRef]
- Wang, X.; Yu, J.; Lv, F.; Wang, Y.; Fu, H. A multi-sphere based modelling method for maize grain assemblies. Adv. Powder Technol. 2017, 28, 584–595. [Google Scholar] [CrossRef]
- Wang, L.; Li, R.; Wu, B.; Wu, Z.; Ding, Z. Determination of the coefficient of rolling friction of an irregularly shaped maize particle group using physical experiment and simulations. Particuology 2018, 38, 185–195. [Google Scholar] [CrossRef]
- Roessler, T.; Richter, C.; Katterfeld, A.; Will, F. Development of a standard calibration procedure for the DEM parameters of cohesionless bulk materials—Part I: Solving the problem of ambiguous parameter combinations. Powder Technol. 2019, 343, 803–812. [Google Scholar] [CrossRef]
- Coetzee, C. Calibration of the discrete element method: Strategies for spherical and non-spherical particles. Powder Technol. 2020, 364, 851–878. [Google Scholar] [CrossRef]
- Chen, Z.R.; Yu, J.Q.; Xue, D.M.; Wang, Y.; Zhang, Q.; Ren, L.Q. An approach to and validation of maize-seed-assembly modelling based on the discrete element method. Powder Technol. 2018, 328, 167–183. [Google Scholar] [CrossRef]
- Shi, L.; Zhao, W.; Sun, B.; Sun, W. Determination of the coefficient of rolling friction of irregularly shaped maize particles by using discrete element method. Int. J. Agric. Biol. Eng. 2020, 13, 15–25. [Google Scholar] [CrossRef]
- Zhou, L.; Yu, J.Q.; Wang, Y.; Yan, D.X.; Yu, Y.J. A study on the modelling method of maize-seed particles based on the discrete element method. Powder Technol. 2020, 374, 353–376. [Google Scholar] [CrossRef]
- Wang, L.J.; Zhou, W.X.; Ding, Z.J.; Li, X.X.; Zhang, C.G. Experimental determination of parameter effects on the coefficient of restitution of differently shaped maize in three-dimensions. Powder Technol. 2015, 284, 187–194. [Google Scholar] [CrossRef]
- González-Montellano, C.; Fuentes, J.M.; Ayuga-Téllez, E.; Ayuga, F. Determination of the mechanical properties of maize grains and olives required for use in DEM simulations. J. Food Eng. 2012, 111, 553–562. [Google Scholar] [CrossRef]
- Hlosta, J.; Zurovec, D.; Rozbroj, J.; Ramirez-Gomez, A.; Necas, J.; Zegzulka, J. Experimental determination of particle-particle restitution coefficient via double pendulum method. Chem. Eng. Res. Des. 2018, 135, 222–233. [Google Scholar] [CrossRef]
- USA, American Society of Agricultural Engineers. Compression Test of Food Materials of Convex Shape, ASAE Standards. Stand. Eng. Pract. 2002, 48, 592–599. [Google Scholar]
- Coskun, M.B.; Yalcin, I.; Ozarslan, C. Physical properties of sweet corn seed (Zea mays saccharata Sturt.). J. Food Eng. 2006, 74, 523–528. [Google Scholar] [CrossRef]
- Available online: https://www.edemsimulation.com/forum/EDEM (accessed on 12 May 2021).
- Höhner, D.; Wirtz, S.; Kruggel-Emden, H.; Scherer, V. Comparison of the multi-sphere and polyhedral approach to simulate non-spherical particles within the discrete element method: Influence on temporal force evolution for multiple contacts. Powder Technol. 2011, 208, 643–656. [Google Scholar] [CrossRef]
- European Federation of Materials Handling. FEM 2.582: General Properties of Bulk Materials and Their Symbolization (1991-11); European Federation of Materials Handling: Bruxelles, Belgium, 1991. [Google Scholar]
- National Standard of the Peoples Republic China. GB/T 10612-2003: Industrial Plate Screens—Thickness below 3 mm—Round and Square Holes; General Administration of Quality Supervision, Inspection and Quarantine of the People’s Republic of China: Beijing, China, 2003. [Google Scholar]
Publisher’s Note: MDPI stays neutral with regard to jurisdictional claims in published maps and institutional affiliations. |
© 2021 by the authors. Licensee MDPI, Basel, Switzerland. This article is an open access article distributed under the terms and conditions of the Creative Commons Attribution (CC BY) license (https://creativecommons.org/licenses/by/4.0/).