Article

The Application of a Fisheye Lens in the Automatic Alignment of Wireless Optical Communication

1
Faculty of Automation and Information Engineering, Xi’an University of Technology, Xi’an 710048, China
2
Shaanxi Civil-Military Integration Key Laboratory of Intelligence Collaborative Networks, Xi’an 710126, China
*
Author to whom correspondence should be addressed.
Photonics 2024, 11(4), 344; https://doi.org/10.3390/photonics11040344
Submission received: 12 March 2024 / Revised: 5 April 2024 / Accepted: 7 April 2024 / Published: 9 April 2024
(This article belongs to the Special Issue Free-Space Optical Communication and Networking Technology)

Abstract

:
To achieve a lightweight design and wide field of view for the automatic alignment system in wireless optical communication, in the receiving antenna—a fisheye lens is incorporated as the receiving optical system. This feature enables the detection and tracking of lasers. The system utilizes a micro motor as the control servo system and a four-quadrant detector as the detection unit. Sequential and non-sequential ray tracing techniques were used to simulate the analysis of the fish-eye lens. Point array diagrams, ray trace diagrams, and encircled energy analysis were utilized to evaluate the spot’s quality. The simulation results demonstrate that the fish-eye lens has a field of view of 120°, and the spot with 80% energy has a diameter smaller than 30 μm. The experimental results indicate that the fish-eye lens effectively captures the light beam within the range of ±30°. The simulated and experimental results for the sum and difference frequency amplitudes show good agreement. The outdoor experiments have demonstrated a tracking error of 22.757 μrad in this system. After alignment, the average output optical power of the detector is 3.23 μW, and the detected waveform amplitude is 12.48 mV. These findings demonstrate the system’s potential for automatic alignment in wireless optical communication. Additionally, the system is relatively simple and practical.

1. Introduction

Wireless optical communication offers several advantages, including high communication capacity, effective concealment, robust resistance to electromagnetic interference, and compact terminal size [1,2,3]. Driven by technological advancements, wireless optical communication systems are progressing towards lightweight and miniaturized designs. The automatic alignment mechanism significantly impacts the quality of wireless optical communication systems. Lv Chunlei et al. proposed a laser communication system that employs a compound axis capture tracking and aiming mechanism, achieving a coarse tracking accuracy of 120 μrad and a fine tracking accuracy of 3 μrad [4]. Zhao Man et al. introduced a coaxial dual optical path tracking communication integrated receiving optical system to achieve high-probability capture, high-precision tracking, and aiming, with a tracking field of view of ±175 mrad and a communication field of view of ±13 mrad [5]. To meet the demand for air-to-air broadband high-speed communication, Zhang Shaoying developed a miniaturized laser communication system capable of achieving wireless laser transmission over a distance of 300 km at a rate of 2.5 Gbps, with a bit error rate of less than 1 × 10⁻⁶ [6]. To address the need for high-capacity wireless relay communication, An Jianxin et al. designed laser communication equipment mounted on unmanned aerial vehicles (UAVs), enabling stable signal transmission at a distance of 6.7 km and a rate of 1.25 Gbps [7,8,9]. To fulfill the demands for miniaturization and lightweight design of the automatic tracking system for onboard laser communication in a hexacopter unmanned aerial vehicle (UAV), Ke Xizheng et al. developed a novel structure utilizing stepper motors and quadrant detectors. This design facilitates the capture, alignment, and tracking of the laser beam [10]. Optical antennas are an important component of wireless optical communication systems. In recent years, many scholars at home and abroad have conducted extensive research on receiving antennas, and fisheye lenses have attracted the attention of researchers due to their large field-of-view advantages. To achieve rapid establishment of wireless optical links, Tu Bo et al. proposed an ultra-wide field-of-view (FOV) acquisition scheme, which utilizes a fisheye lens to obtain an ultra-wide field of view. This acquisition scheme not only simplifies the system structure of spatial acquisition, but also shortens the acquisition time [11]. Ma Xuelian proposed a spatial capture scheme based on fisheye lens and sine amplitude grating, which can simultaneously measure the laser direction and wavelength [12]. Chen Te et al. proposed an imaging receiver scheme for indoor multiple-input multiple-output (MIMO) visible light communication (VLC), which uses a fisheye lens with an ultra-wide field of view for high-quality imaging, thereby achieving omnidirectional reception [13]. In response to the problem of difficult alignment in underwater wireless optical communication links, Yan Hua et al. proposed a UWOC system that uses fisheye lenses to extend the receiver’s FOV to ±90° [14].
The automatic alignment system for wireless optical communication proposed in this paper utilizes a fisheye lens as the receiving antenna. By conducting simulations and analyzing the convex lens and fisheye lens, it has been demonstrated that the fisheye lens has the capability to widen the receiving field of view in comparison to the convex lens. Experimental results further validate the theory that the wireless optical communication automatic alignment system, employing the fisheye lens, effectively enlarges the capture and tracking angles, thereby making it well suited for automatic alignment applications.

2. Design of an Auto-Alignment System for Wireless Optical Communication

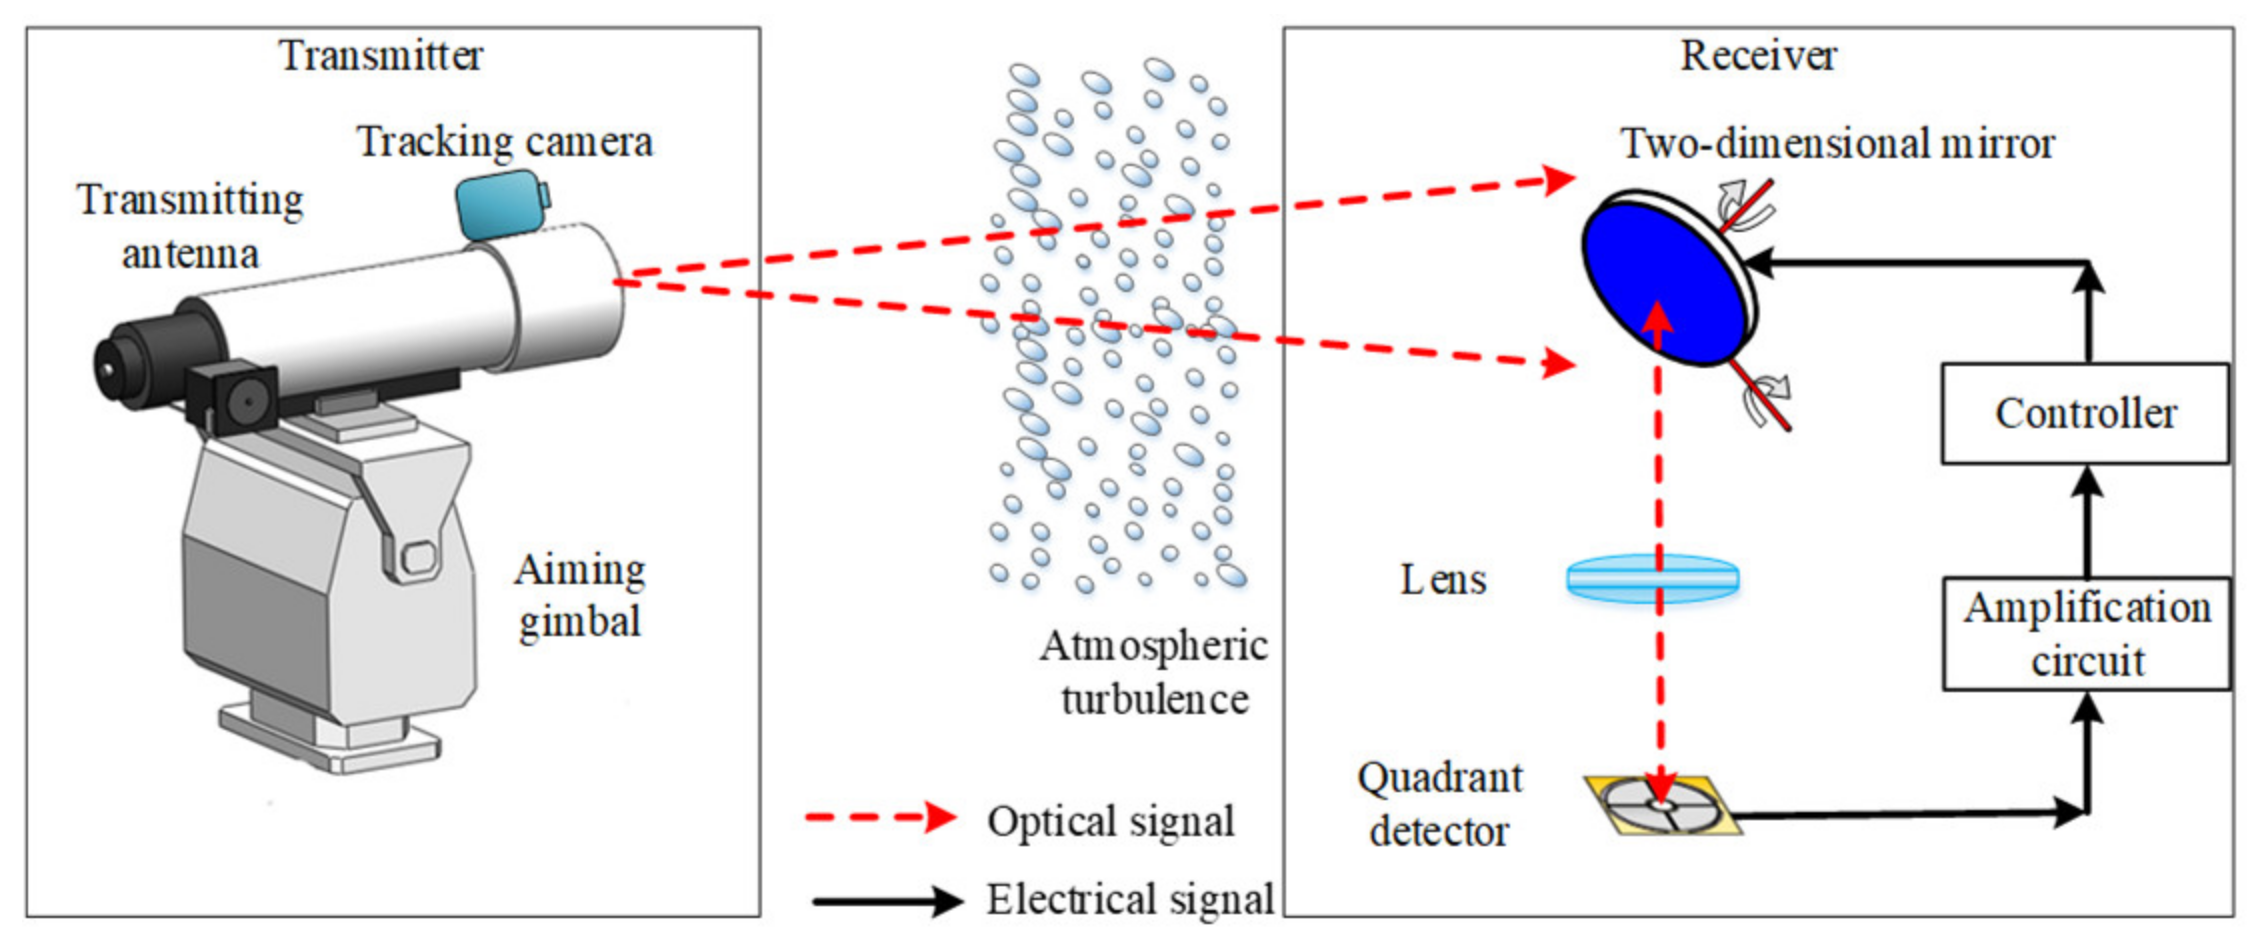
2.1. Design of the System
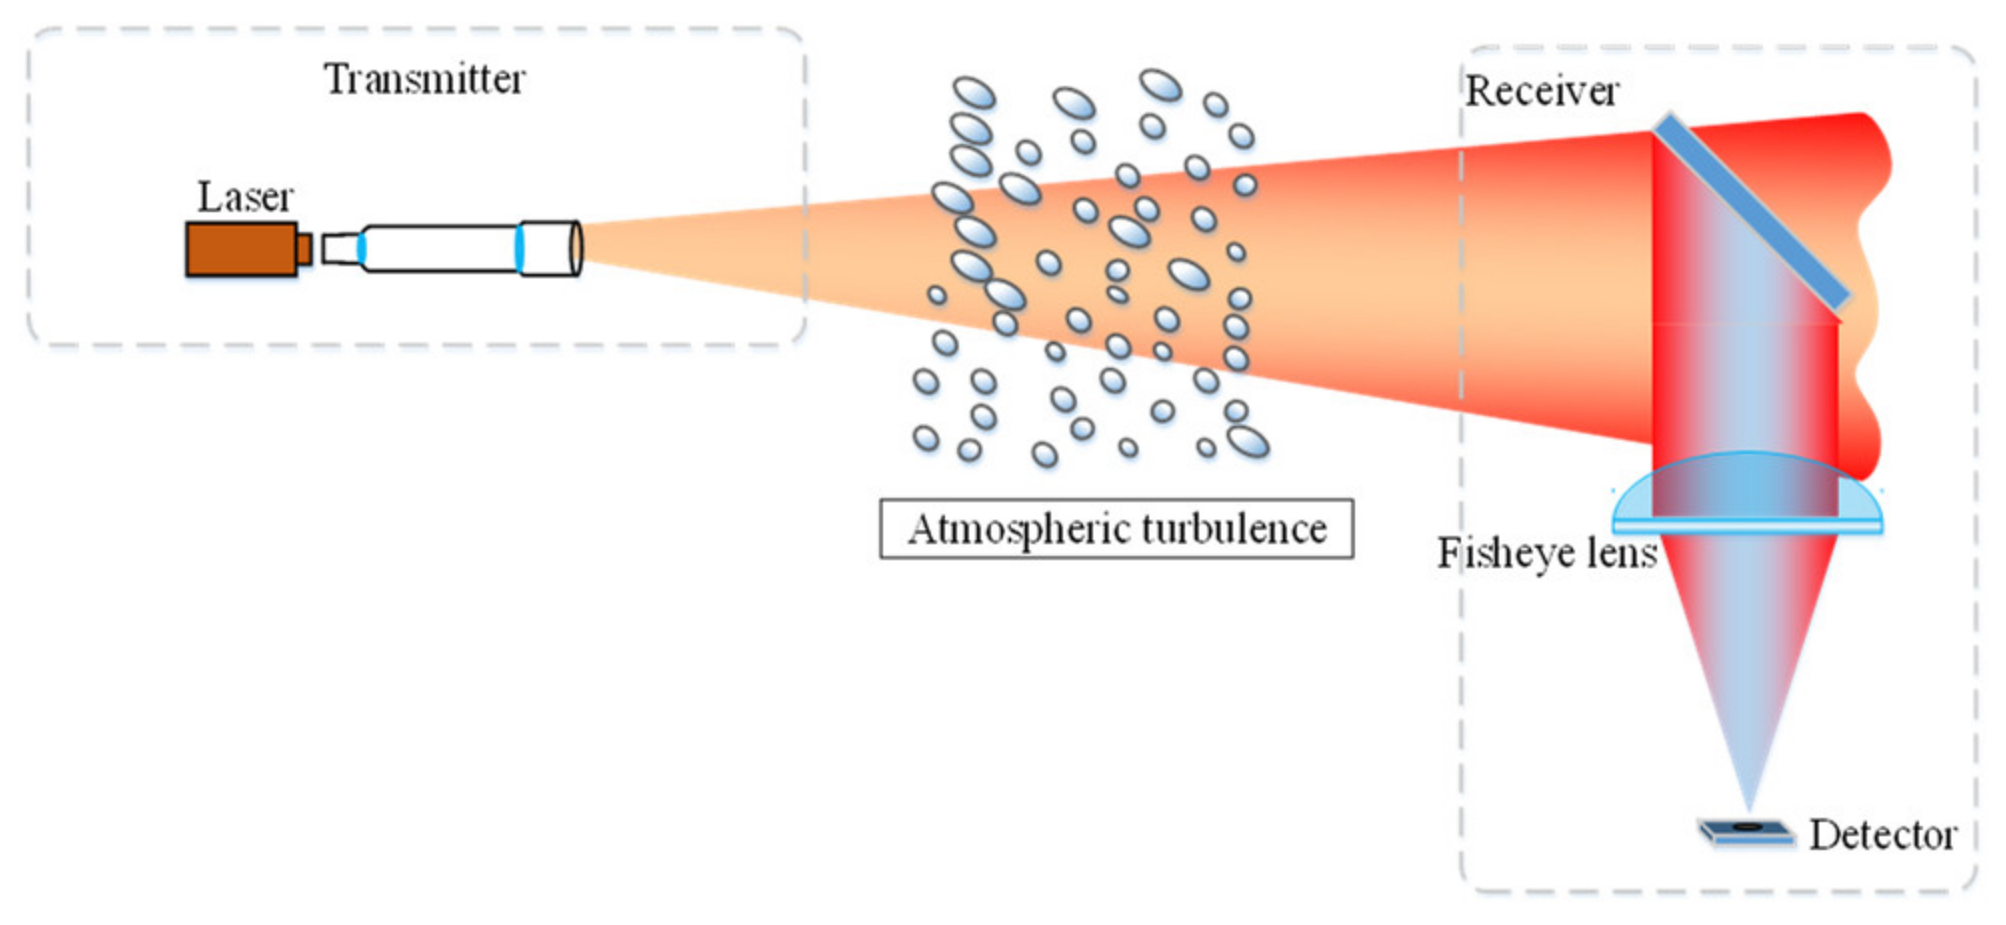
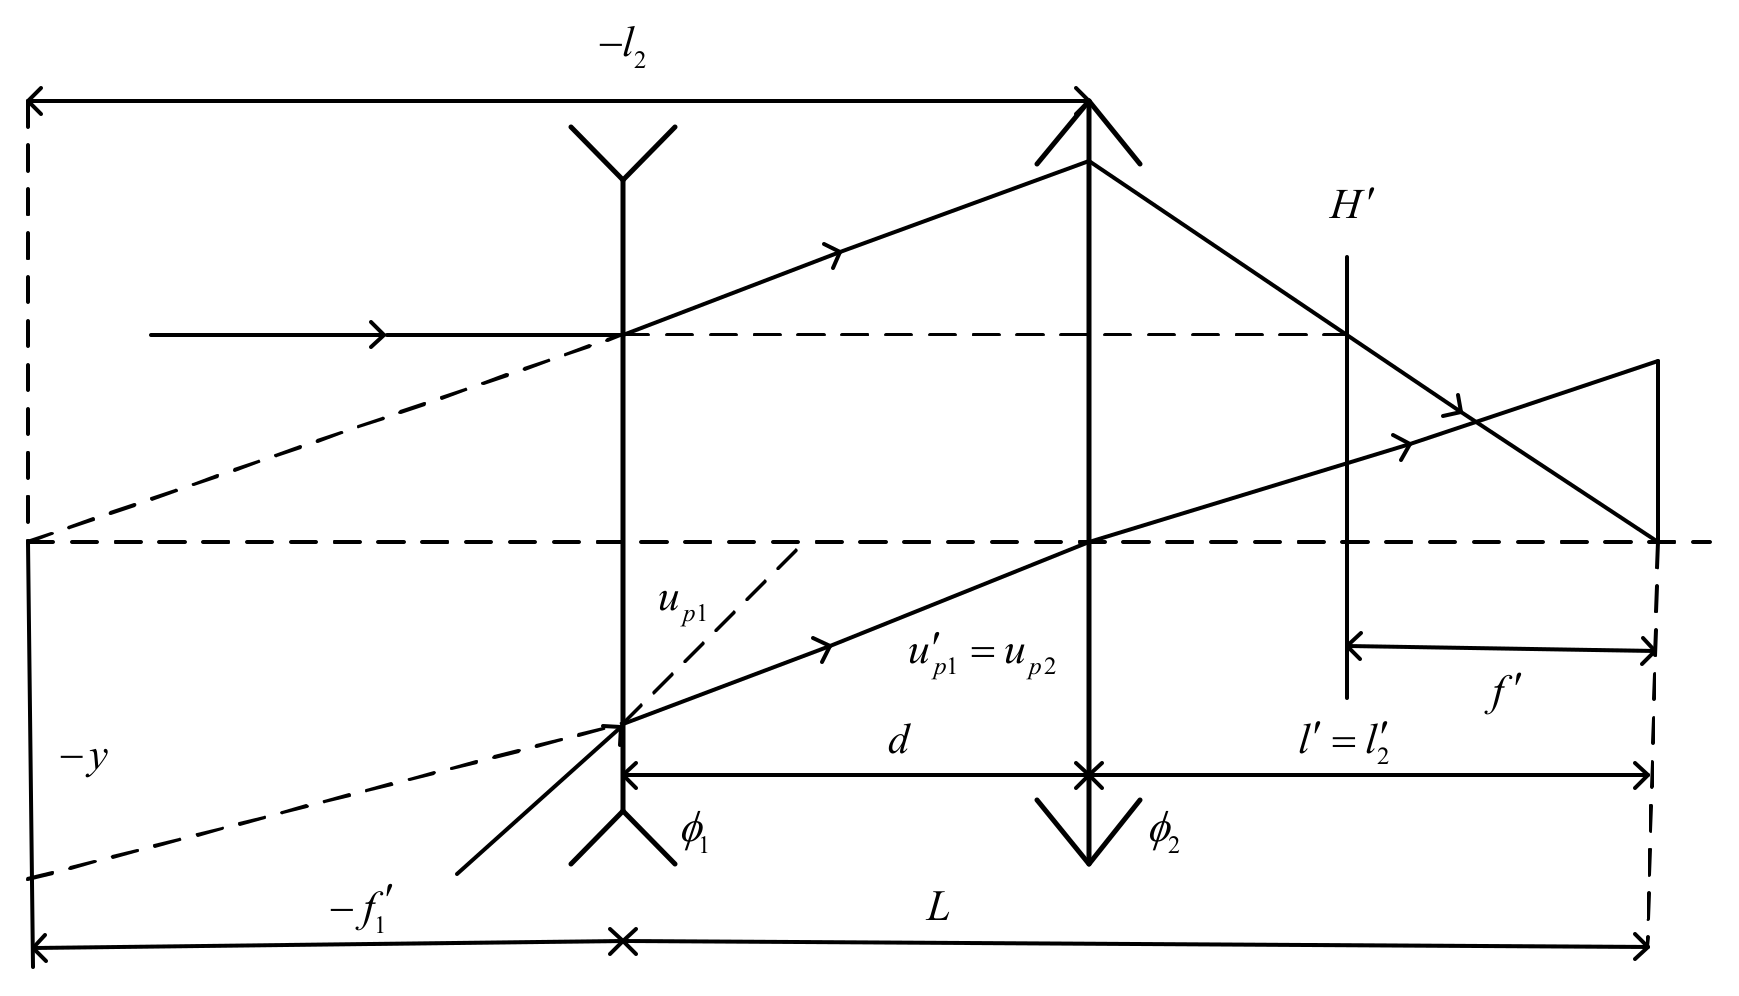
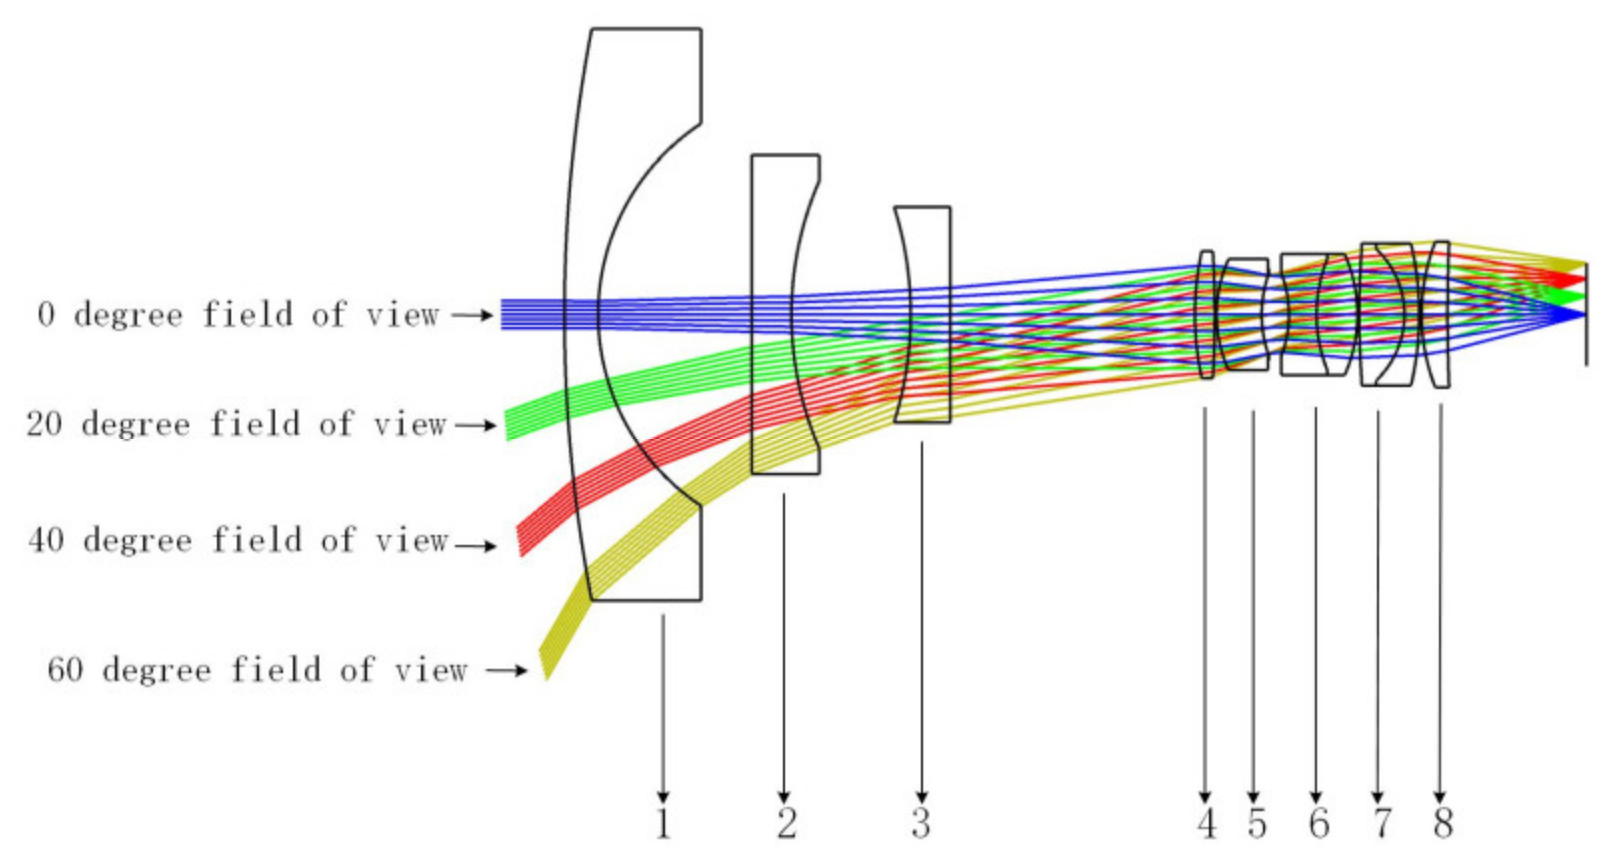
As depicted in Figure 1, the auto-alignment system for wireless optical communication [15,16] is designed with two main components: the optical unit and the tracking control unit. The optical unit consists of a two-dimensional mirror and a fisheye lens, which serves the purpose of reflecting and focusing the light path. Conversely, the tracking control unit is responsible for executing beam alignment, capture, and tracking functions.
The signal light is transmitted through the channel and reaches the reflective surface. Upon reflection, the optical system captures the beam and directs it onto the light-sensitive surface of the quadrant detector. The quadrant detector generates corresponding photocurrents based on the received light energy in each quadrant. The voltage signal is then amplified through the amplification circuit. The control unit converts the amplified signal into optical spot position information and provides feedback to the stepper motor for beam capture. Once the beam is successfully captured, the stepper motor is activated for precise adjustment and alignment until the voltage of the spot position reaches the predetermined threshold, thereby establishing the communication link. At this stage, the control unit calculates the deviation between the spot and the target position to enable closed-loop tracking of the spot. The relevant design parameters can be found in Table 1.

2.2. Optical Unit

The primary function of the optical unit is to collect and converge energy. As shown in Figure 2, a simplified model of a fisheye lens is depicted, Here, ϕ1 denotes the optical power of the front lens group and ϕ2 represents the optical power of the rear lens group. H′ represents the image-side principal plane of the objective lens, and up1 indicates the angle at which the main ray of the marginal field of view enters relative to the principal axis. Additionally, up1 represents the aperture angle on the image side of the front lens group, which is equivalent to the object-side aperture angle up2 of the rear lens group. Moreover, f1′ corresponds to the focal length of the front lens group, d represents the distance between the front and rear lens groups, f′ is the total focal length of the objective lens, l2′ signifies the image distance of the rear lens group, which is also equivalent to the back focal distance l′ of the optical system, and L represents the total image distance of the front and rear lens groups. A fisheye lens is a specialized wide-angle lens that can focus incoming light from various directions onto a single point. Through the optical unit, the laser beam is converged and focused onto the light-sensitive surface of the QD. The light is then converted into an electrical signal. The signal acquisition and processing module utilizes advanced algorithms to accurately determine the position of the laser being tested. By incorporating a fisheye lens, a larger reception angle can be achieved, resulting in an increased intensity of the received light signal. This enhancement in signal intensity improves the system’s communication distance and reliability. The utilization of a fisheye lens in the optical unit enables efficient light collection and convergence, leading to improved performance and functionality of the wireless optical communication auto-alignment system.
The main objective of the optical unit in the quadrant detector is to maintain the stability of the spot and ensure the uniform distribution of energy. This is evaluated through the use of spot diagrams, ray trace diagrams, and geometric circle entrance energy diagrams. Figure 3 illustrates the transmission of light at 0°, 20°, 40°, and 60° angles when a convex lens is employed in the optical assembly.
Figure 4 displays the spot diagram, which provides information about the diameter, position, and energy distribution of the spot across different fields of view. Upon analyzing Figure 4, it is apparent that the RMS (root mean square) radii at 0°, 20°, 40°, and 60° fields of view are 102.465 μm, 637.825 μm, 4022.84 μm, and 1.0 × 104 μm, respectively. These values indicate a significant deviation and imply an uneven distribution of light rays.
Figure 5 depicts the ray trace diagram, which illustrates the positions of the spot on the light-sensitive surface of the detector for various fields of view. Specifically, Figure 5 presents the ray trace diagrams for the 0°, 20°, 40°, and 60° fields of view. Upon examining Figure 5, it is evident that the spot is only located on the surface of the detector for the 0° field of view.
Figure 6 displays the entrance energy diagram, which visually represents the energy percentage as a function of the spot diameter. Specifically, Figure 6 showcases the entrance energy distribution for the 0°, 20°, 40°, and 60° fields of view. Upon analyzing Figure 6, it is apparent that the distribution curves of the entrance energy exhibit significant variations under different fields of view.

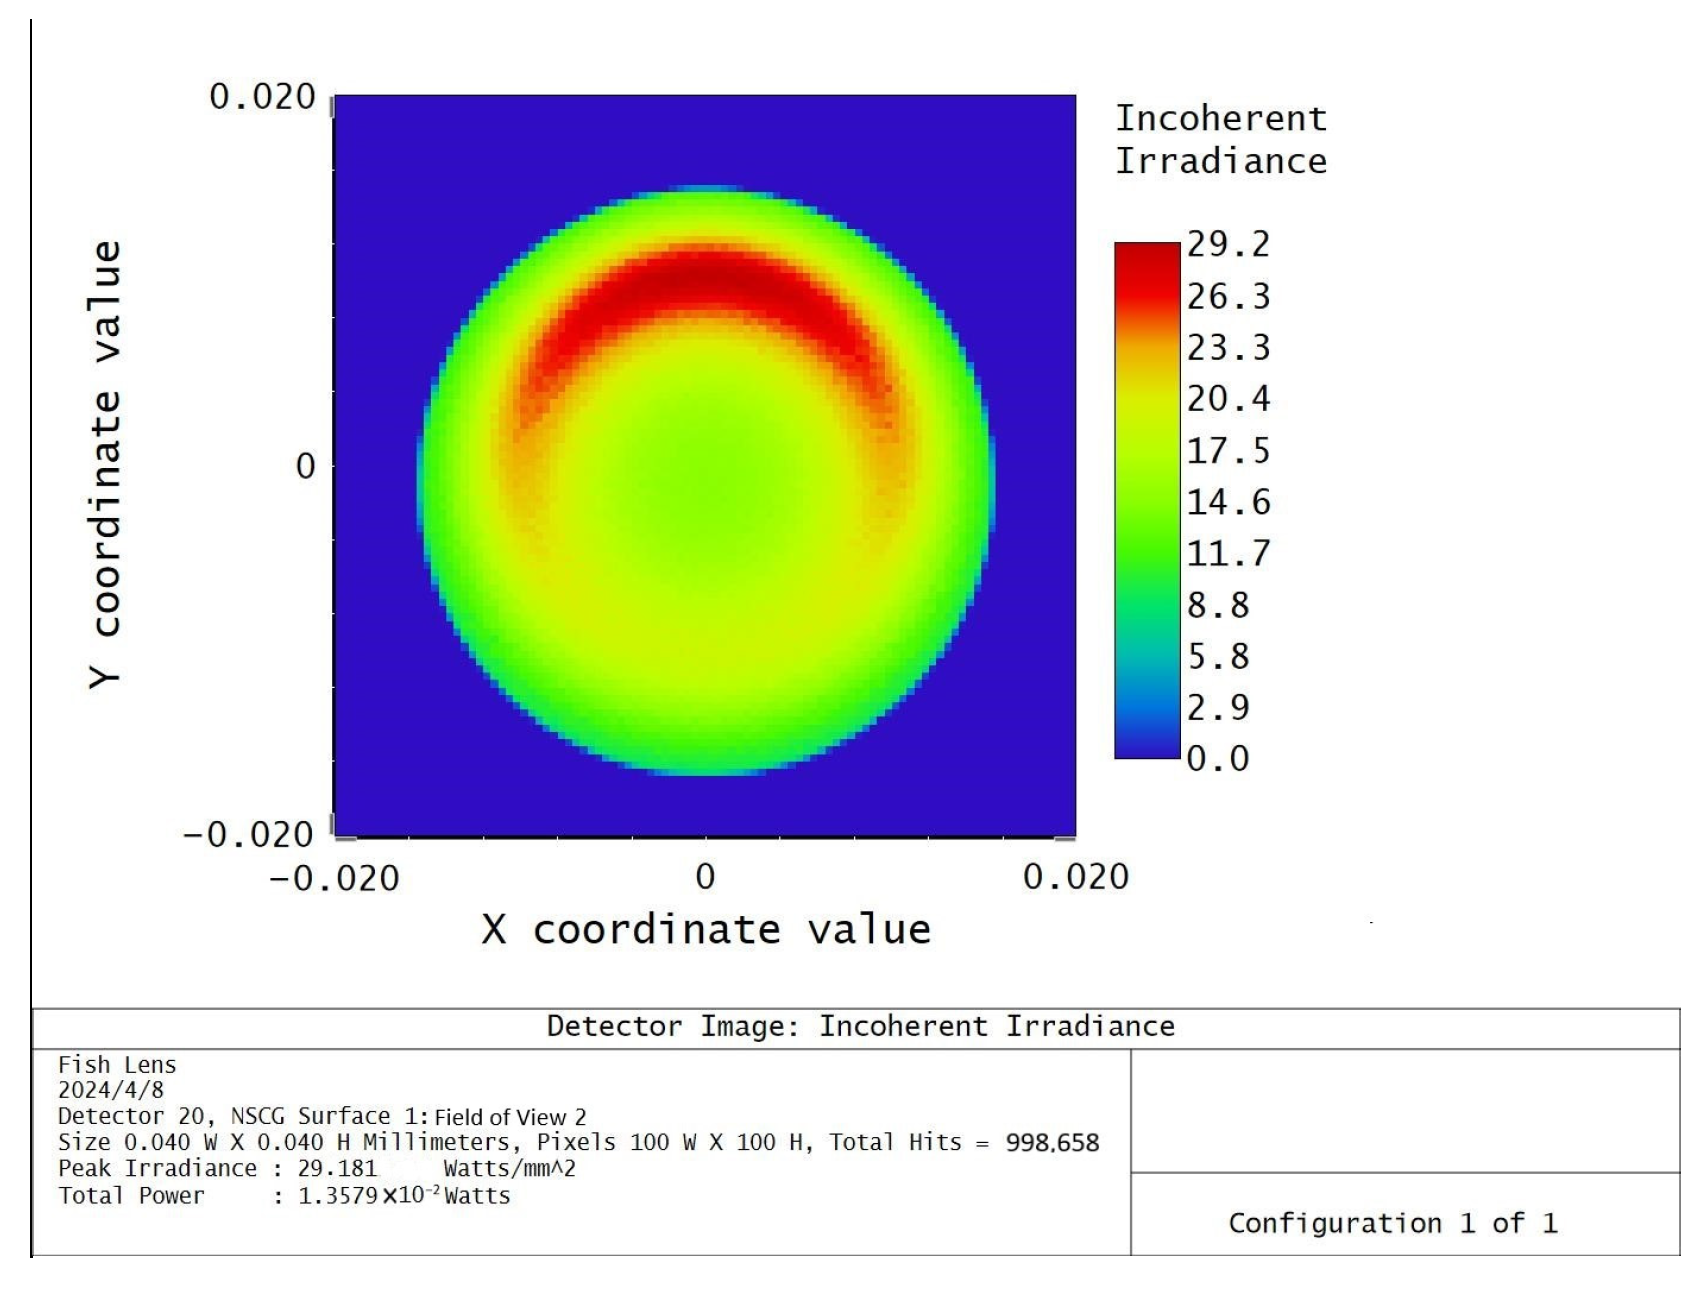
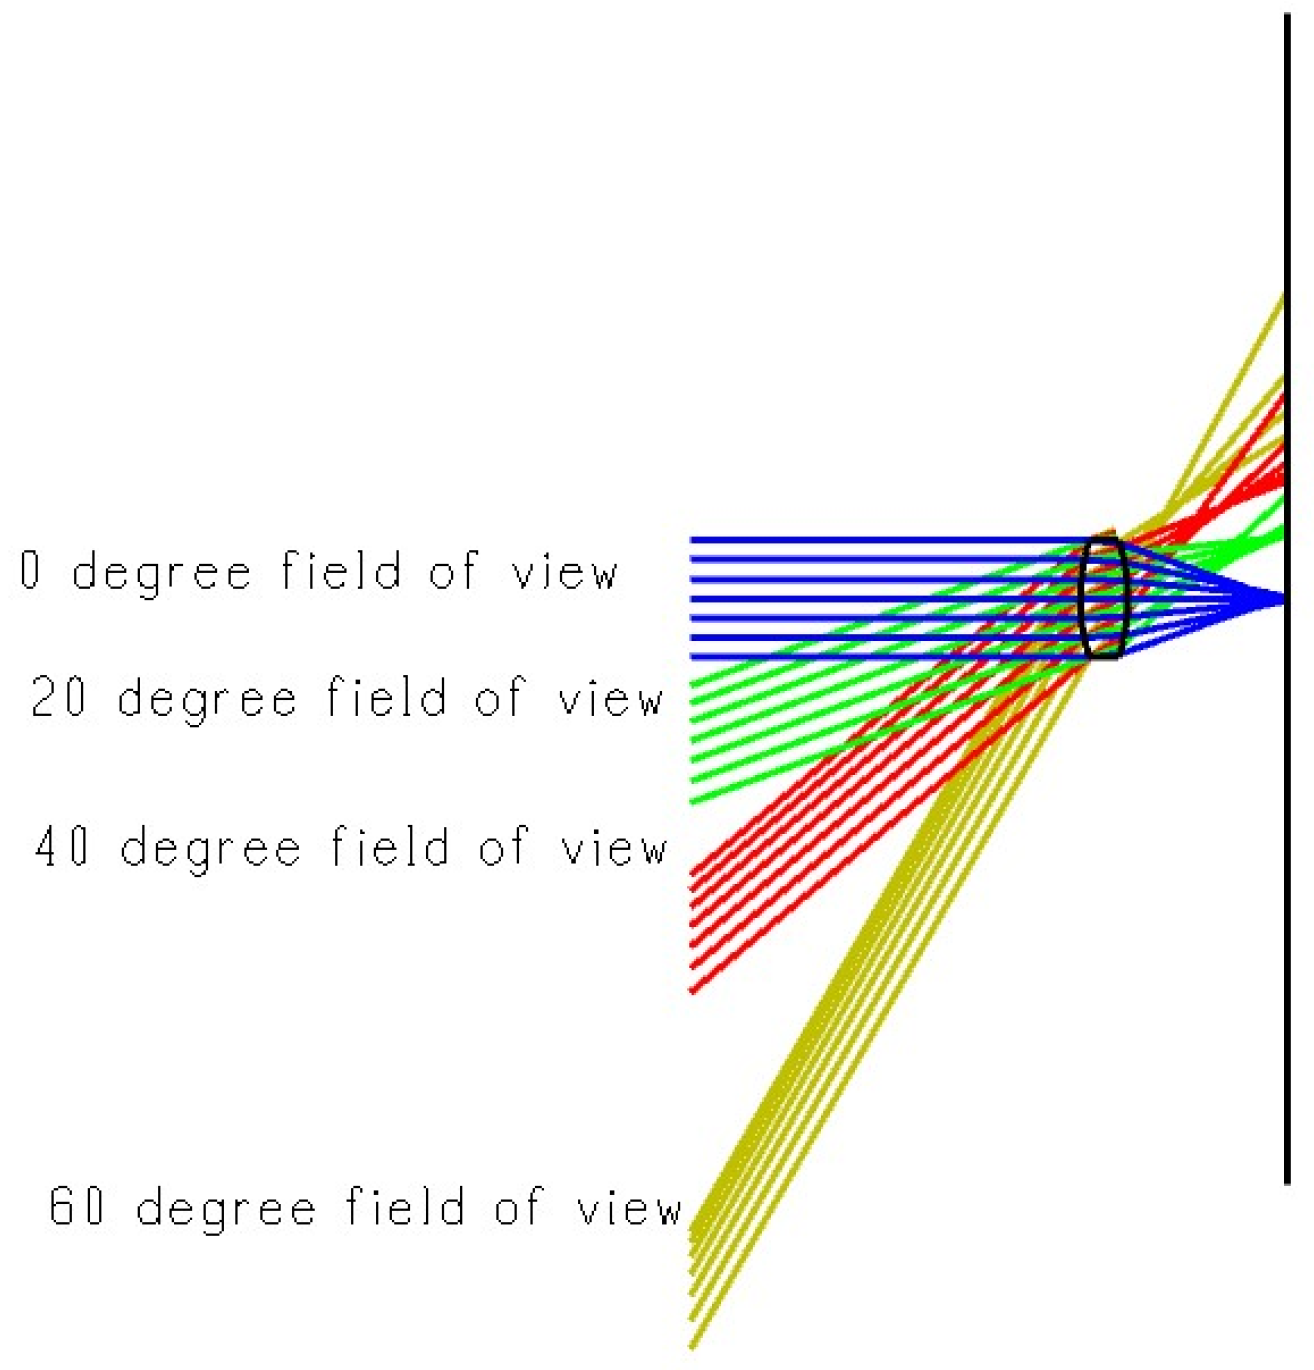
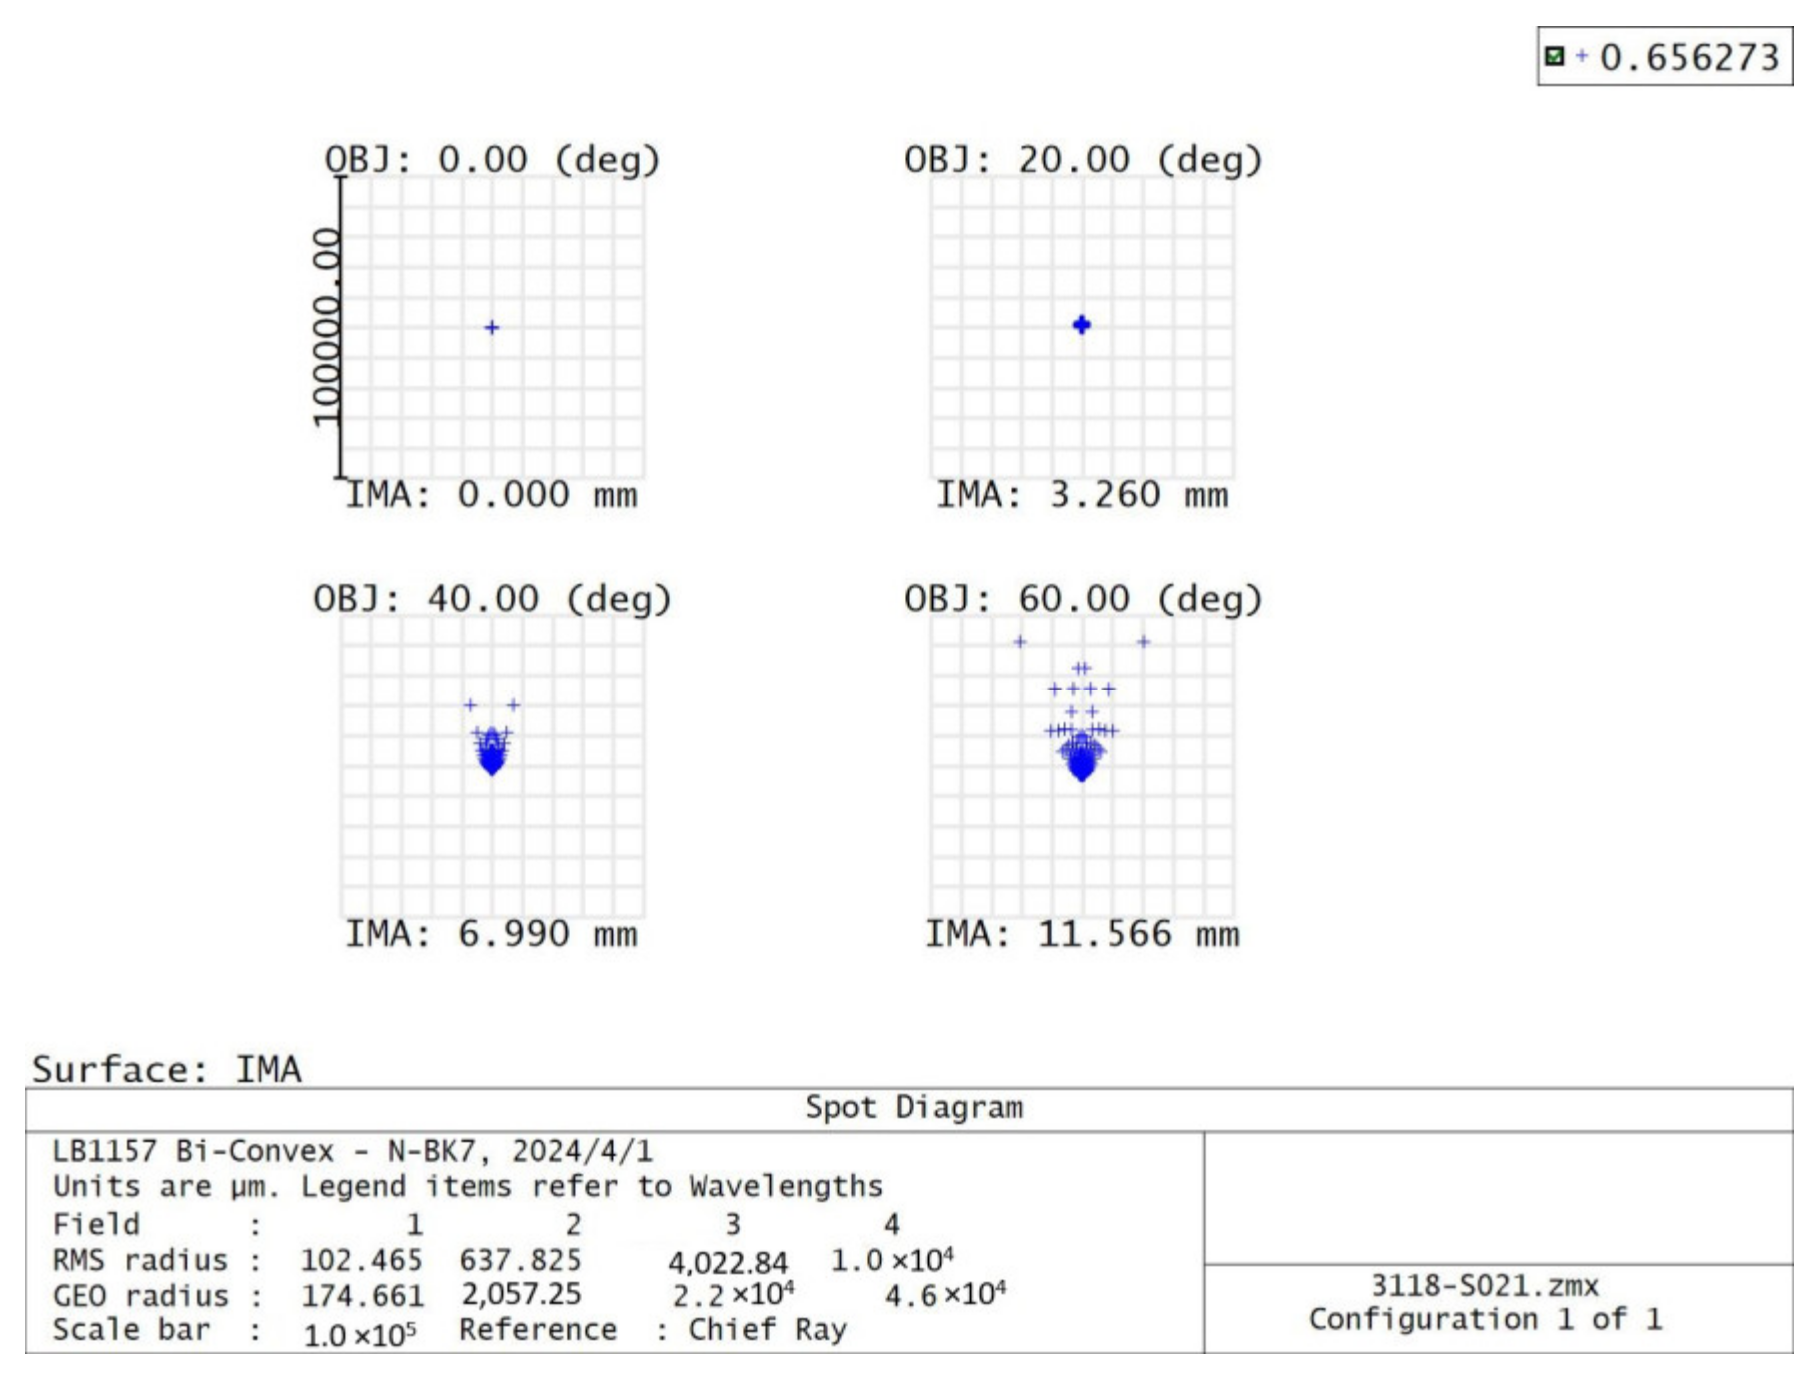
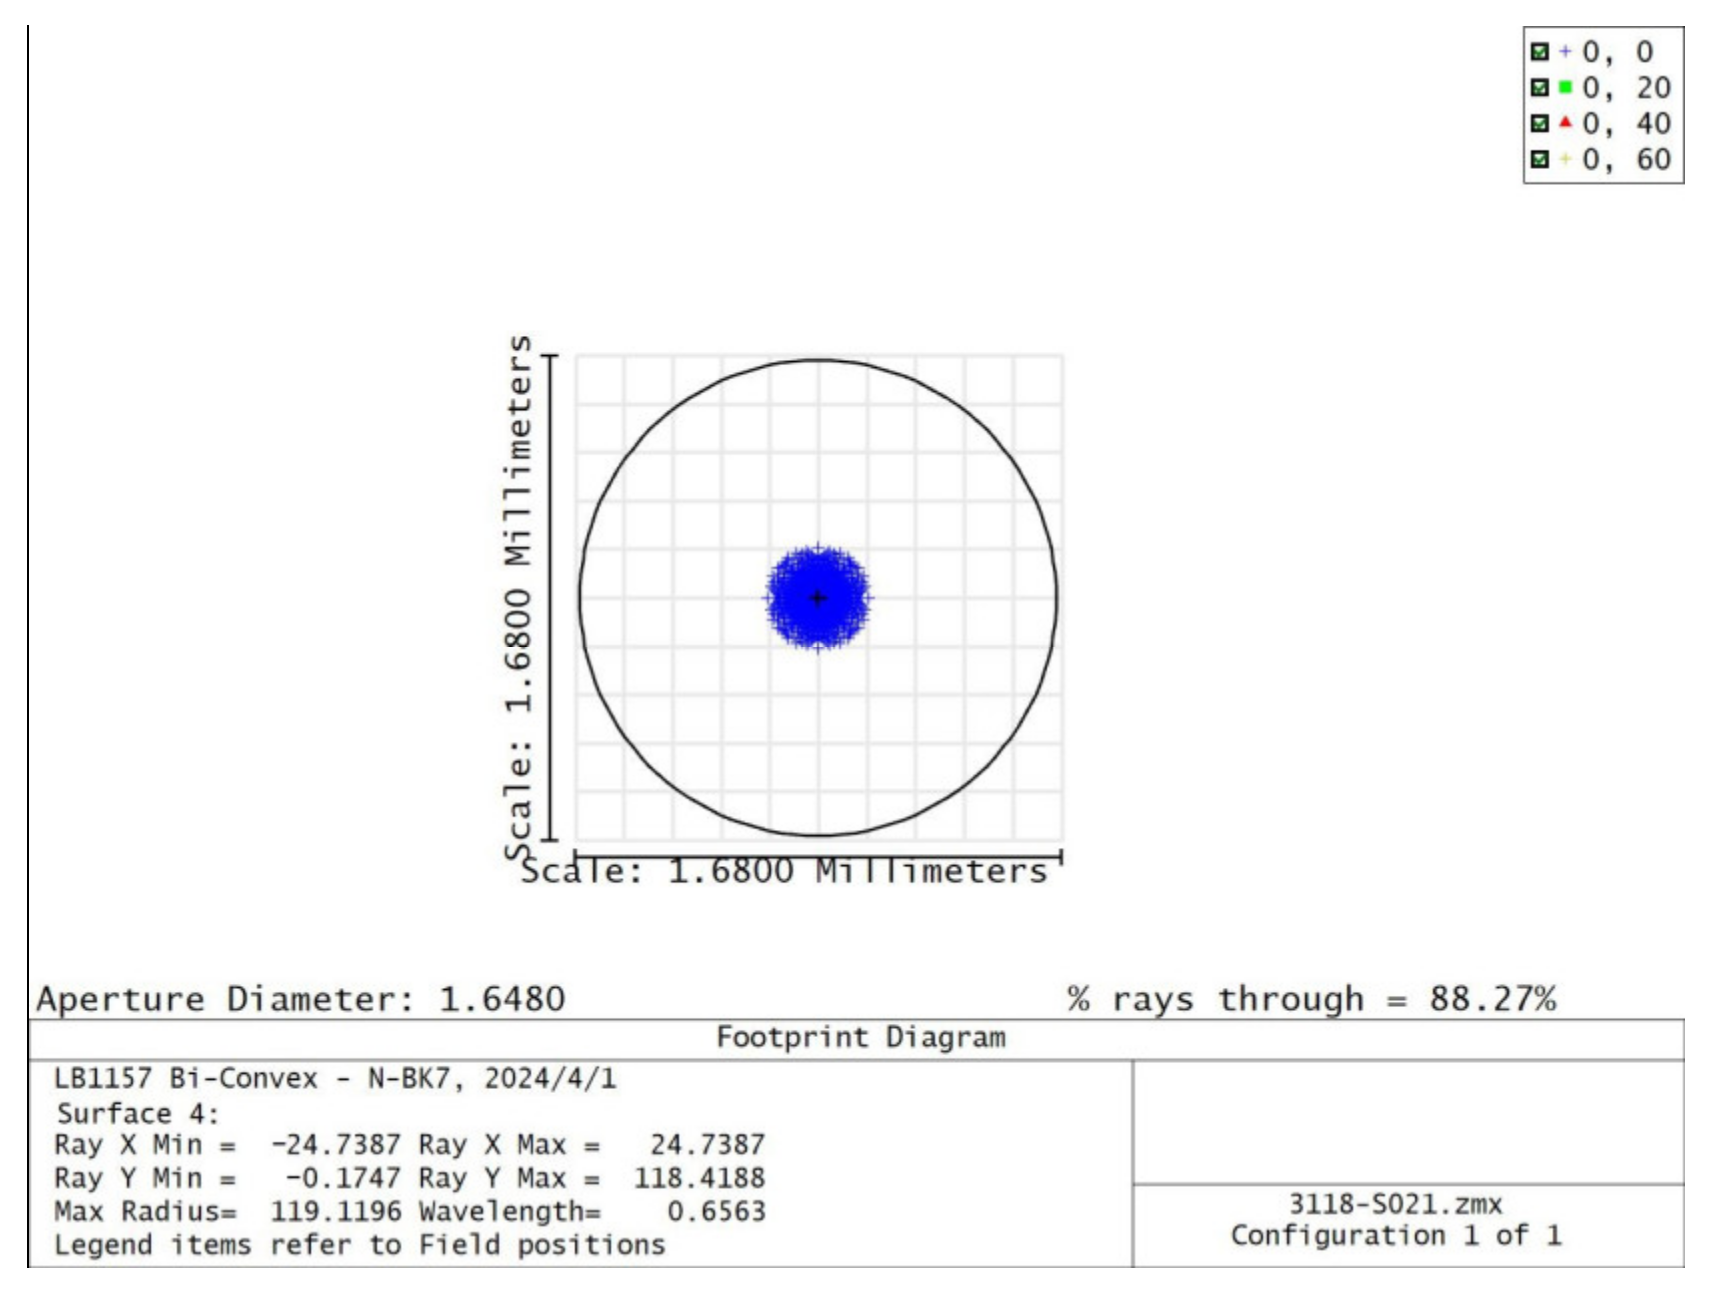
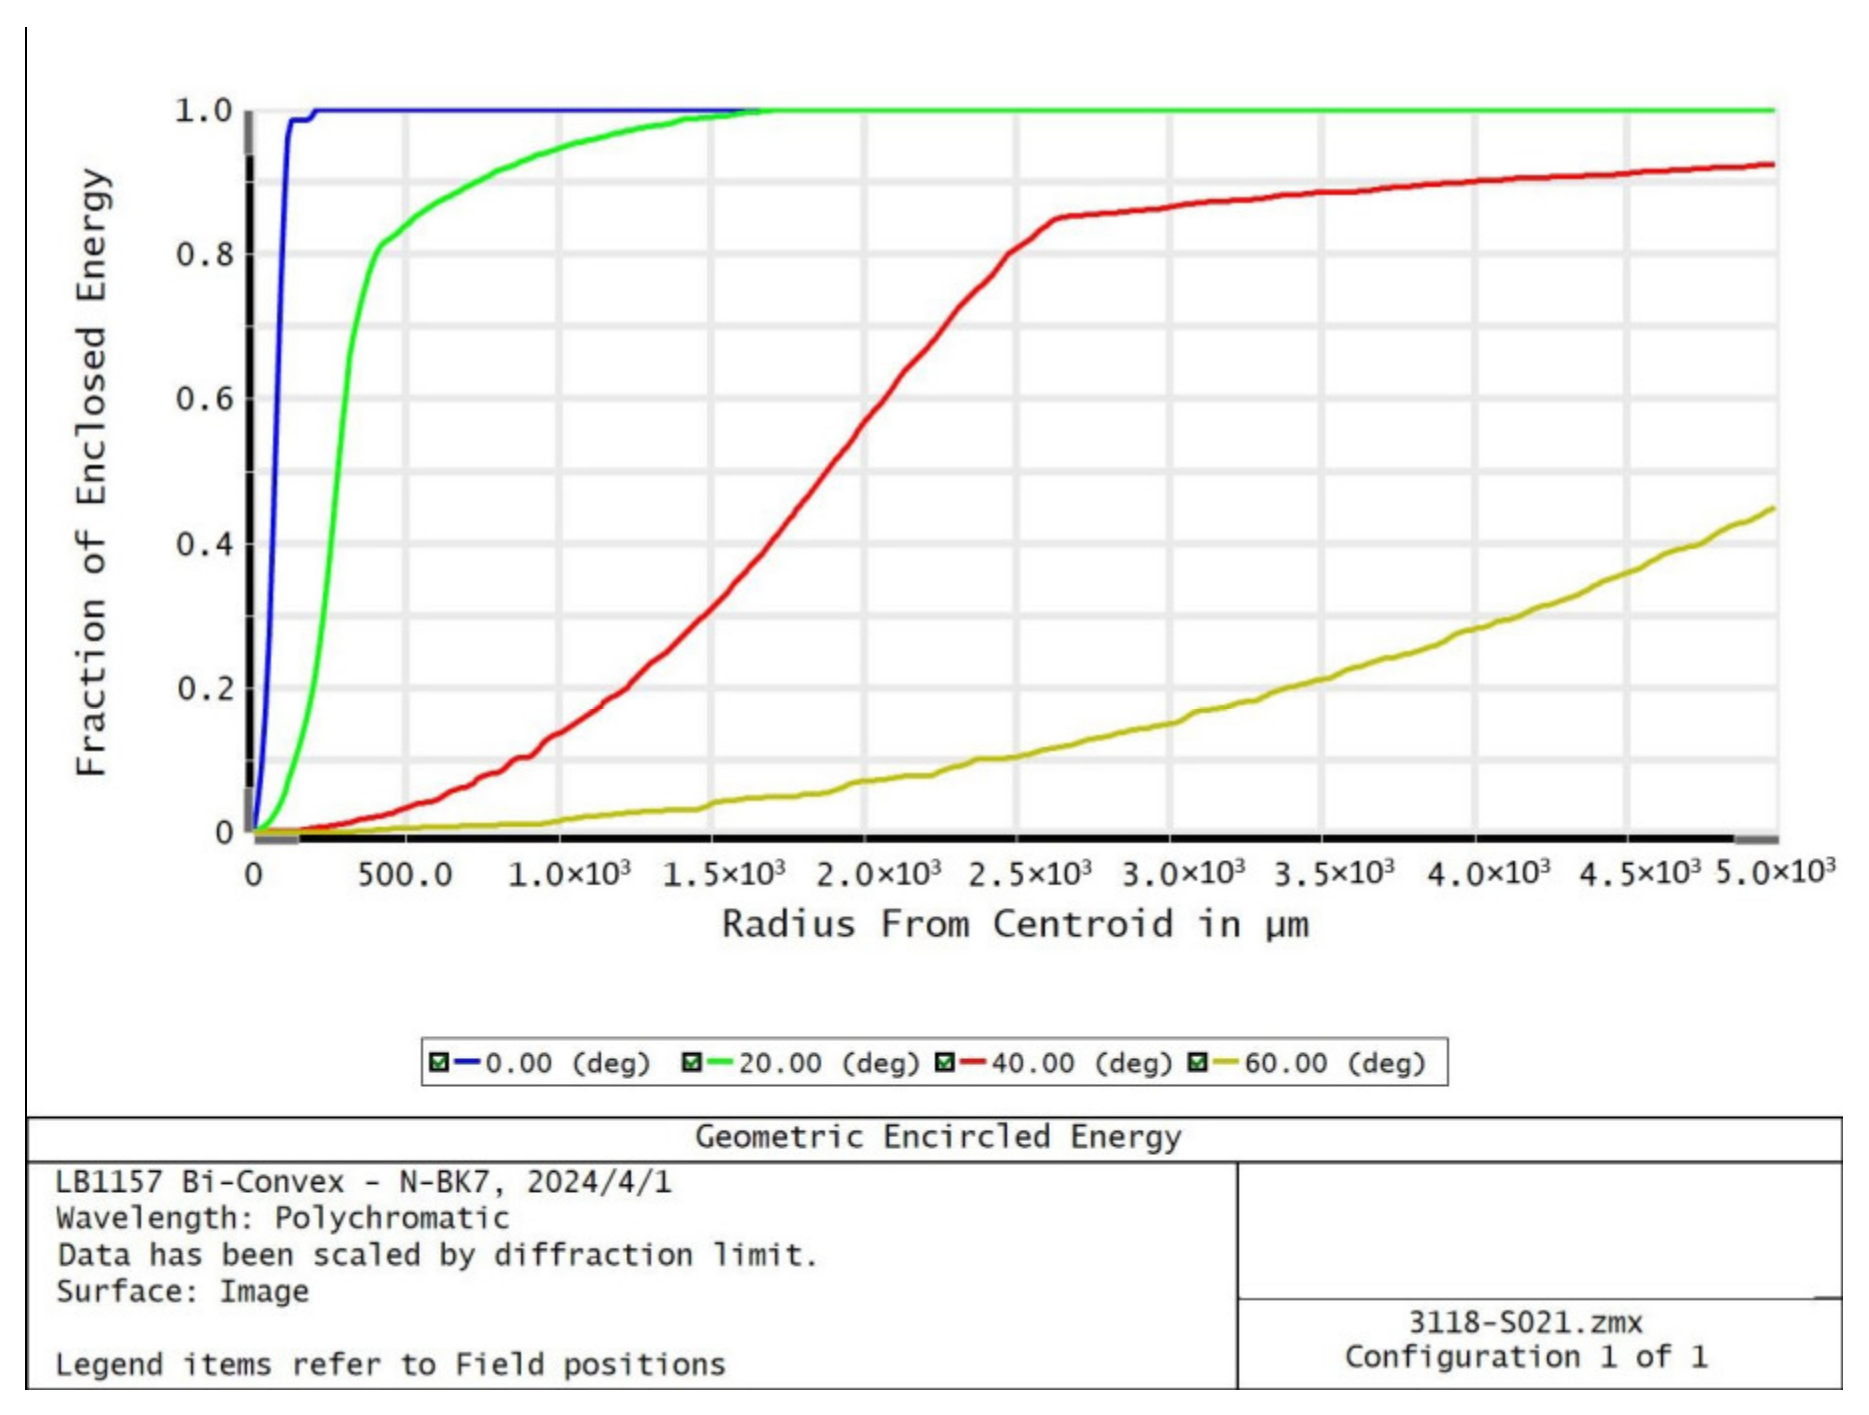
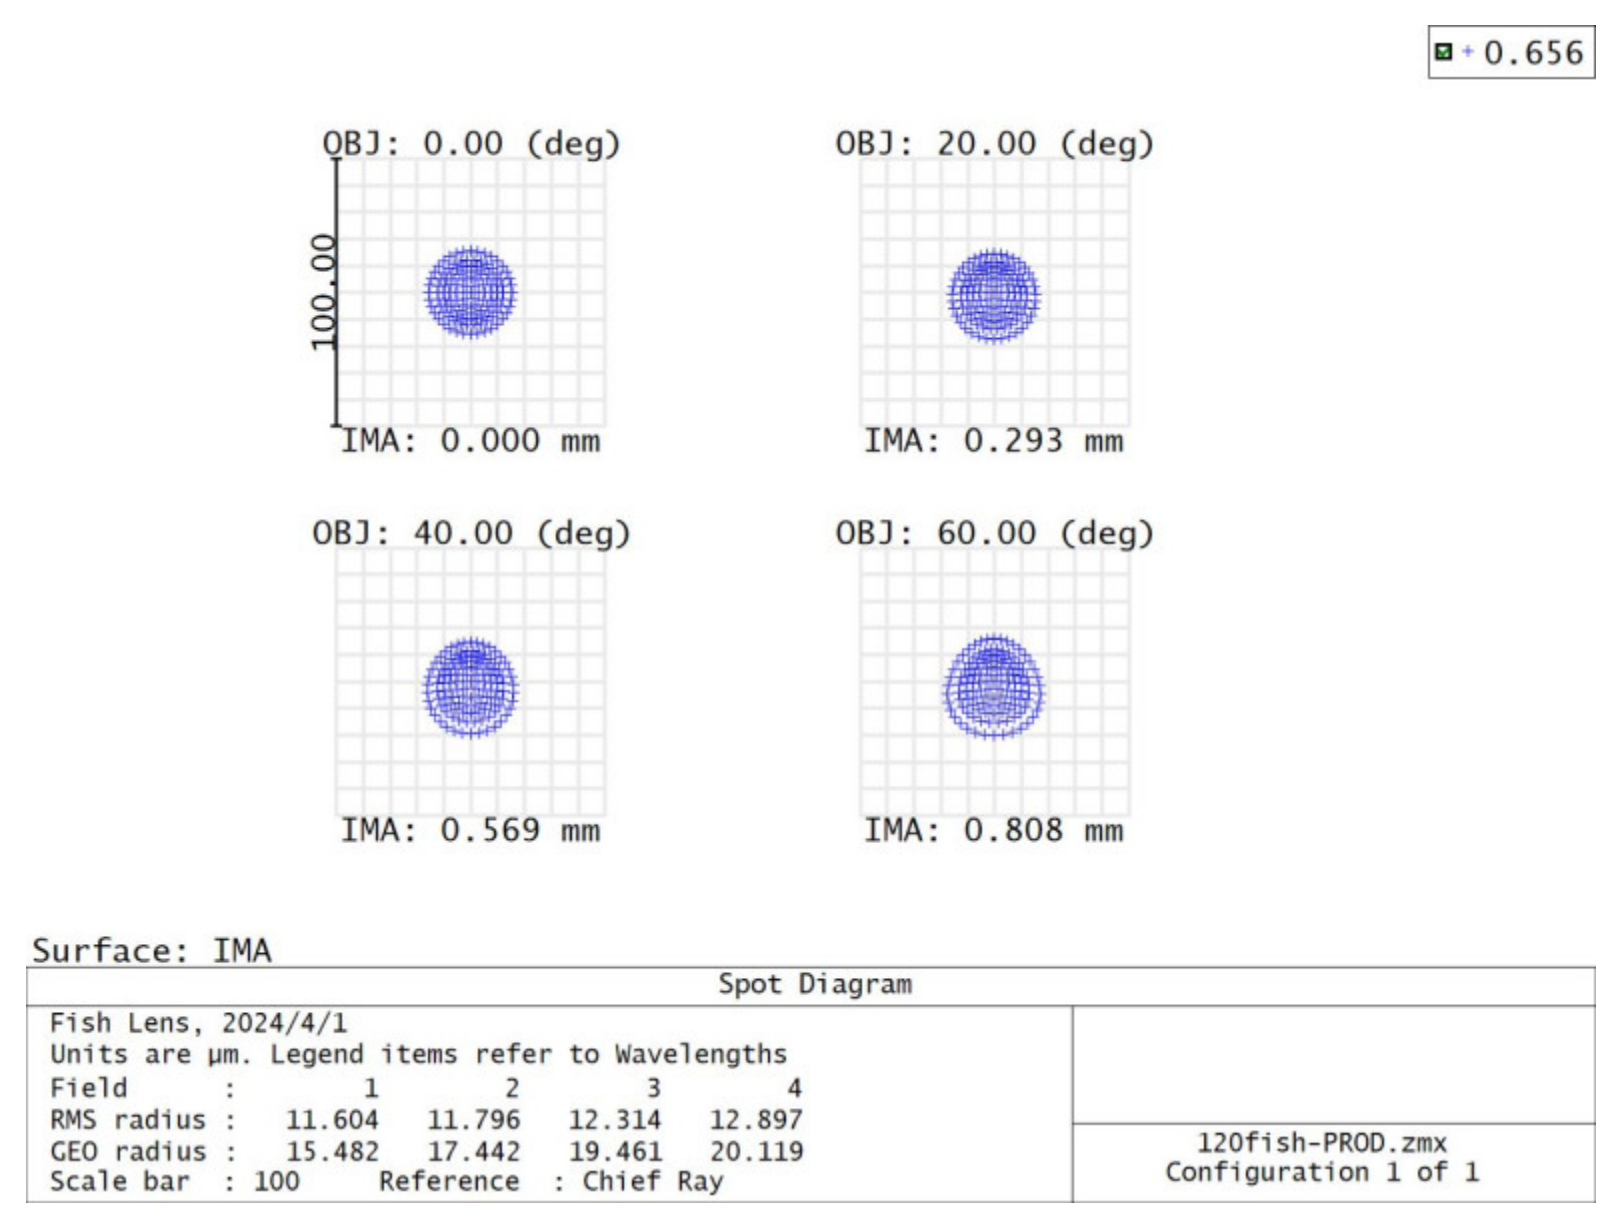
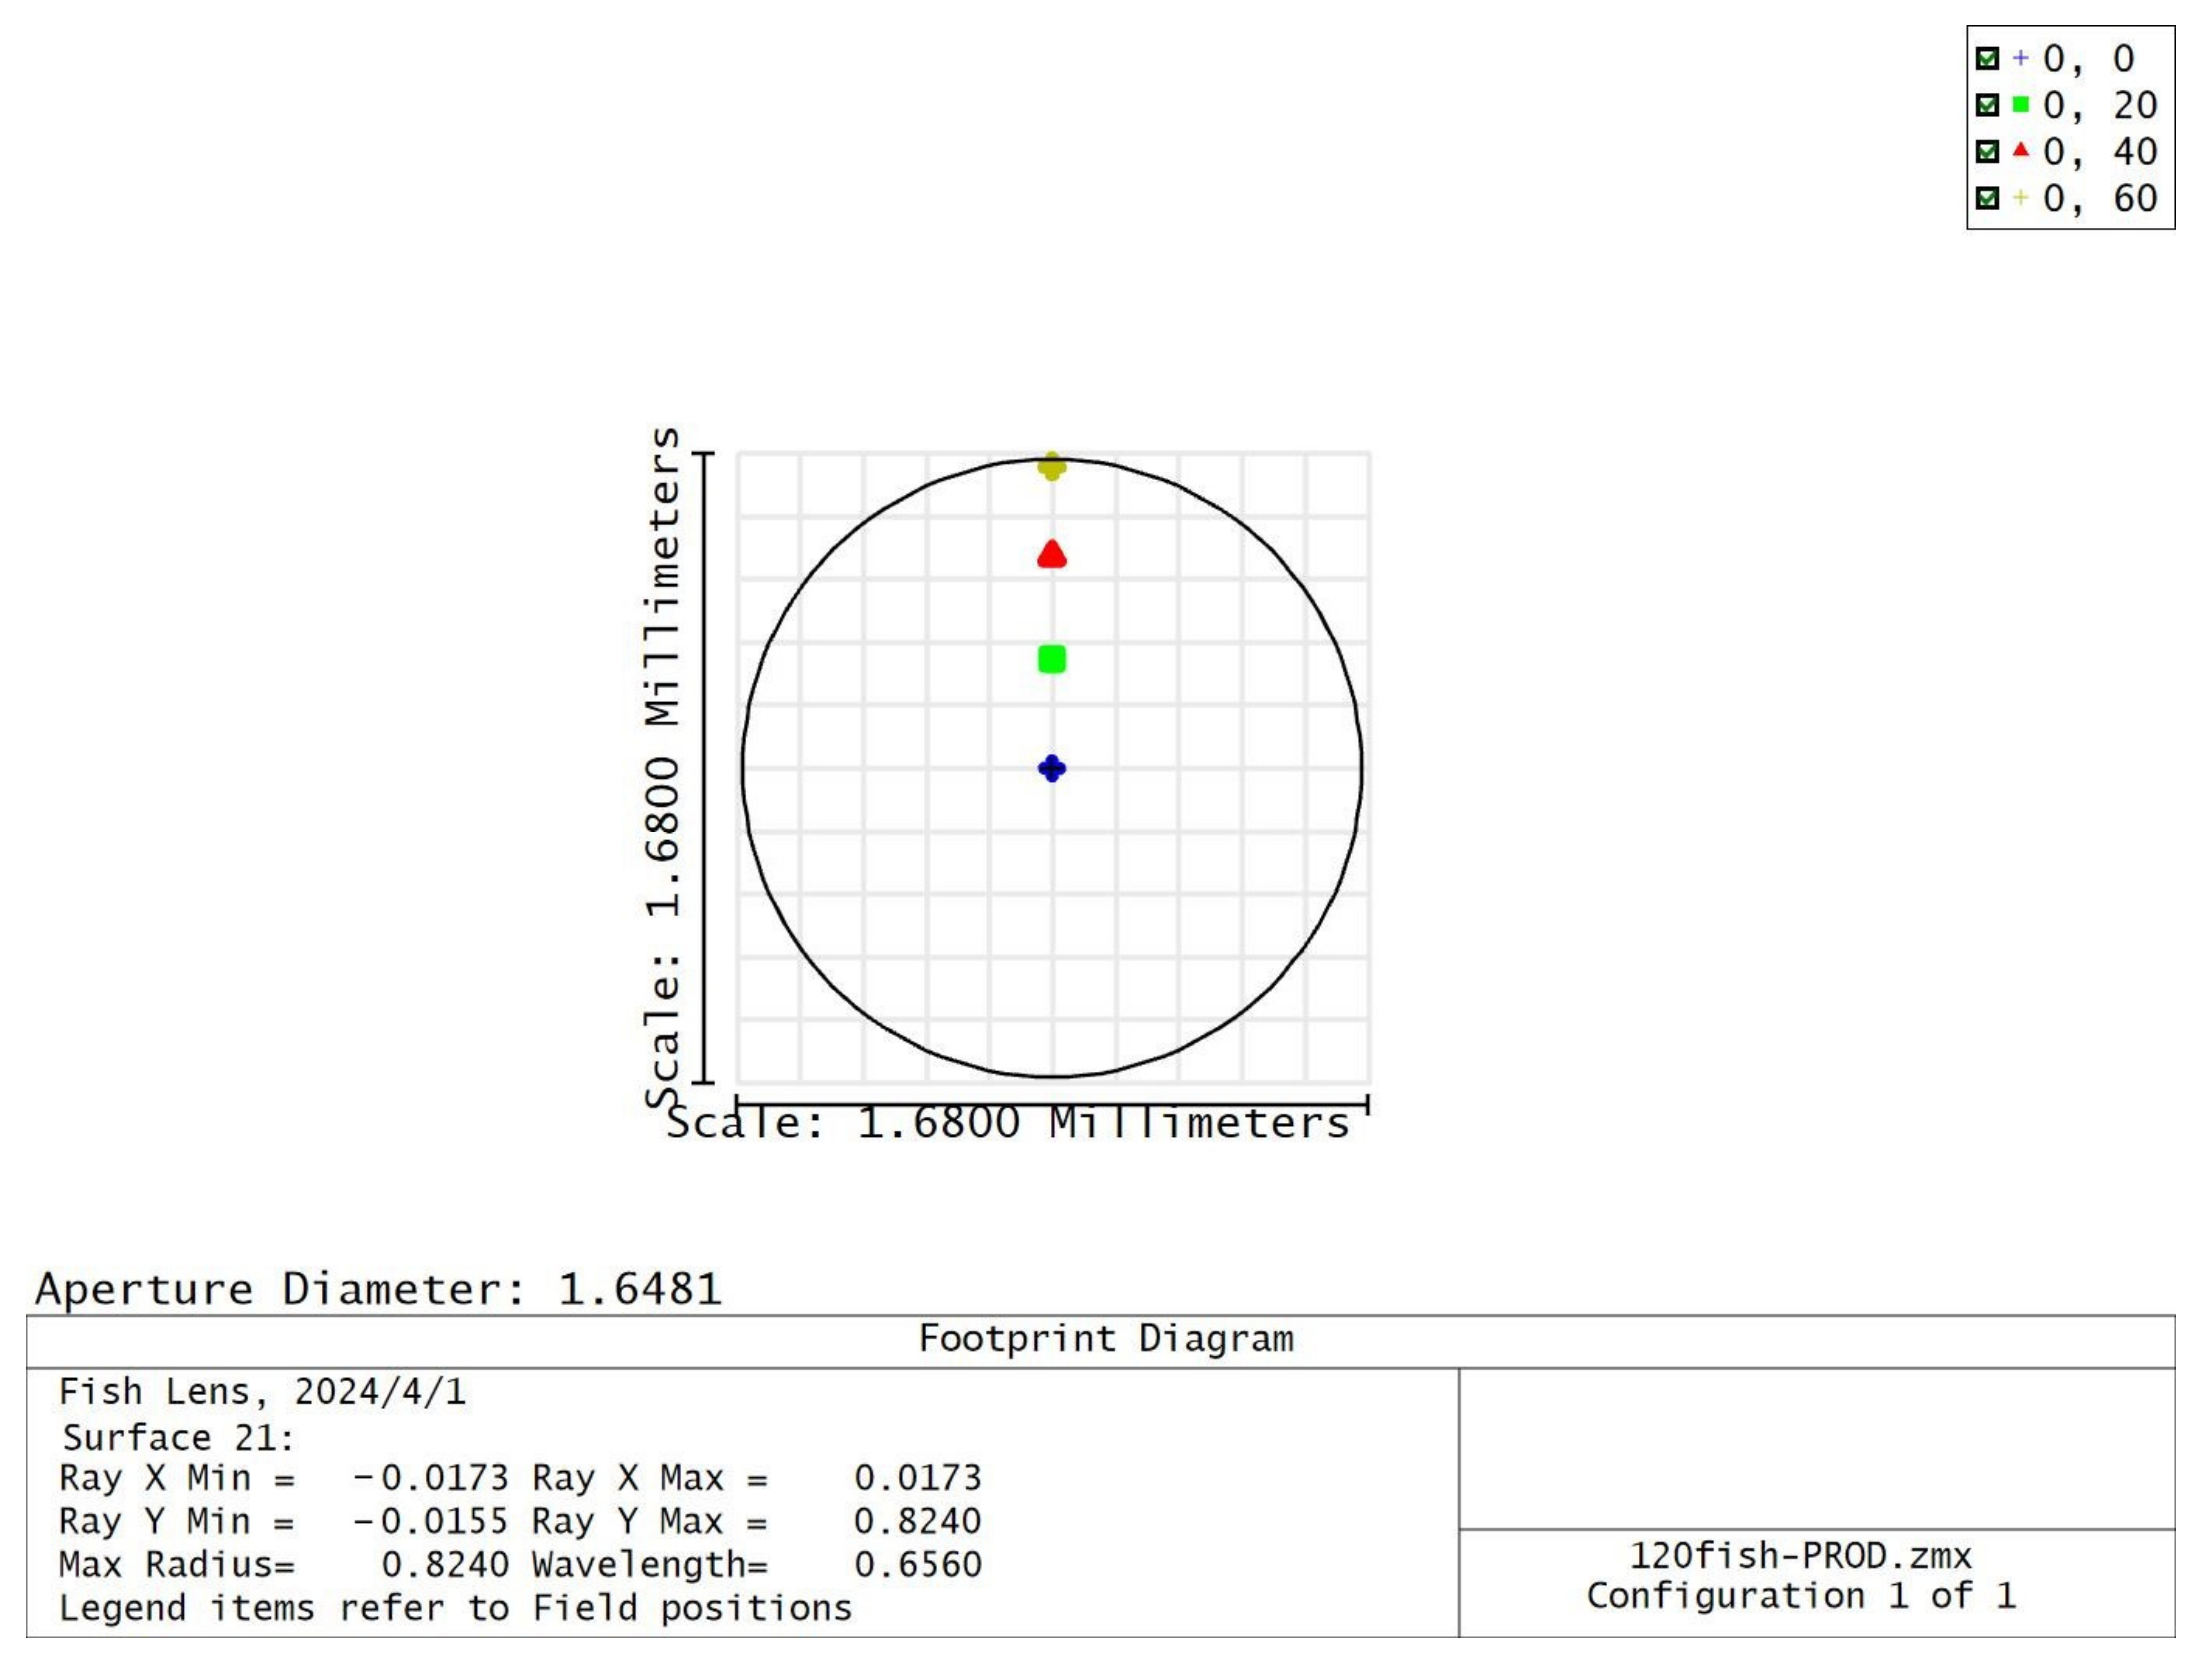
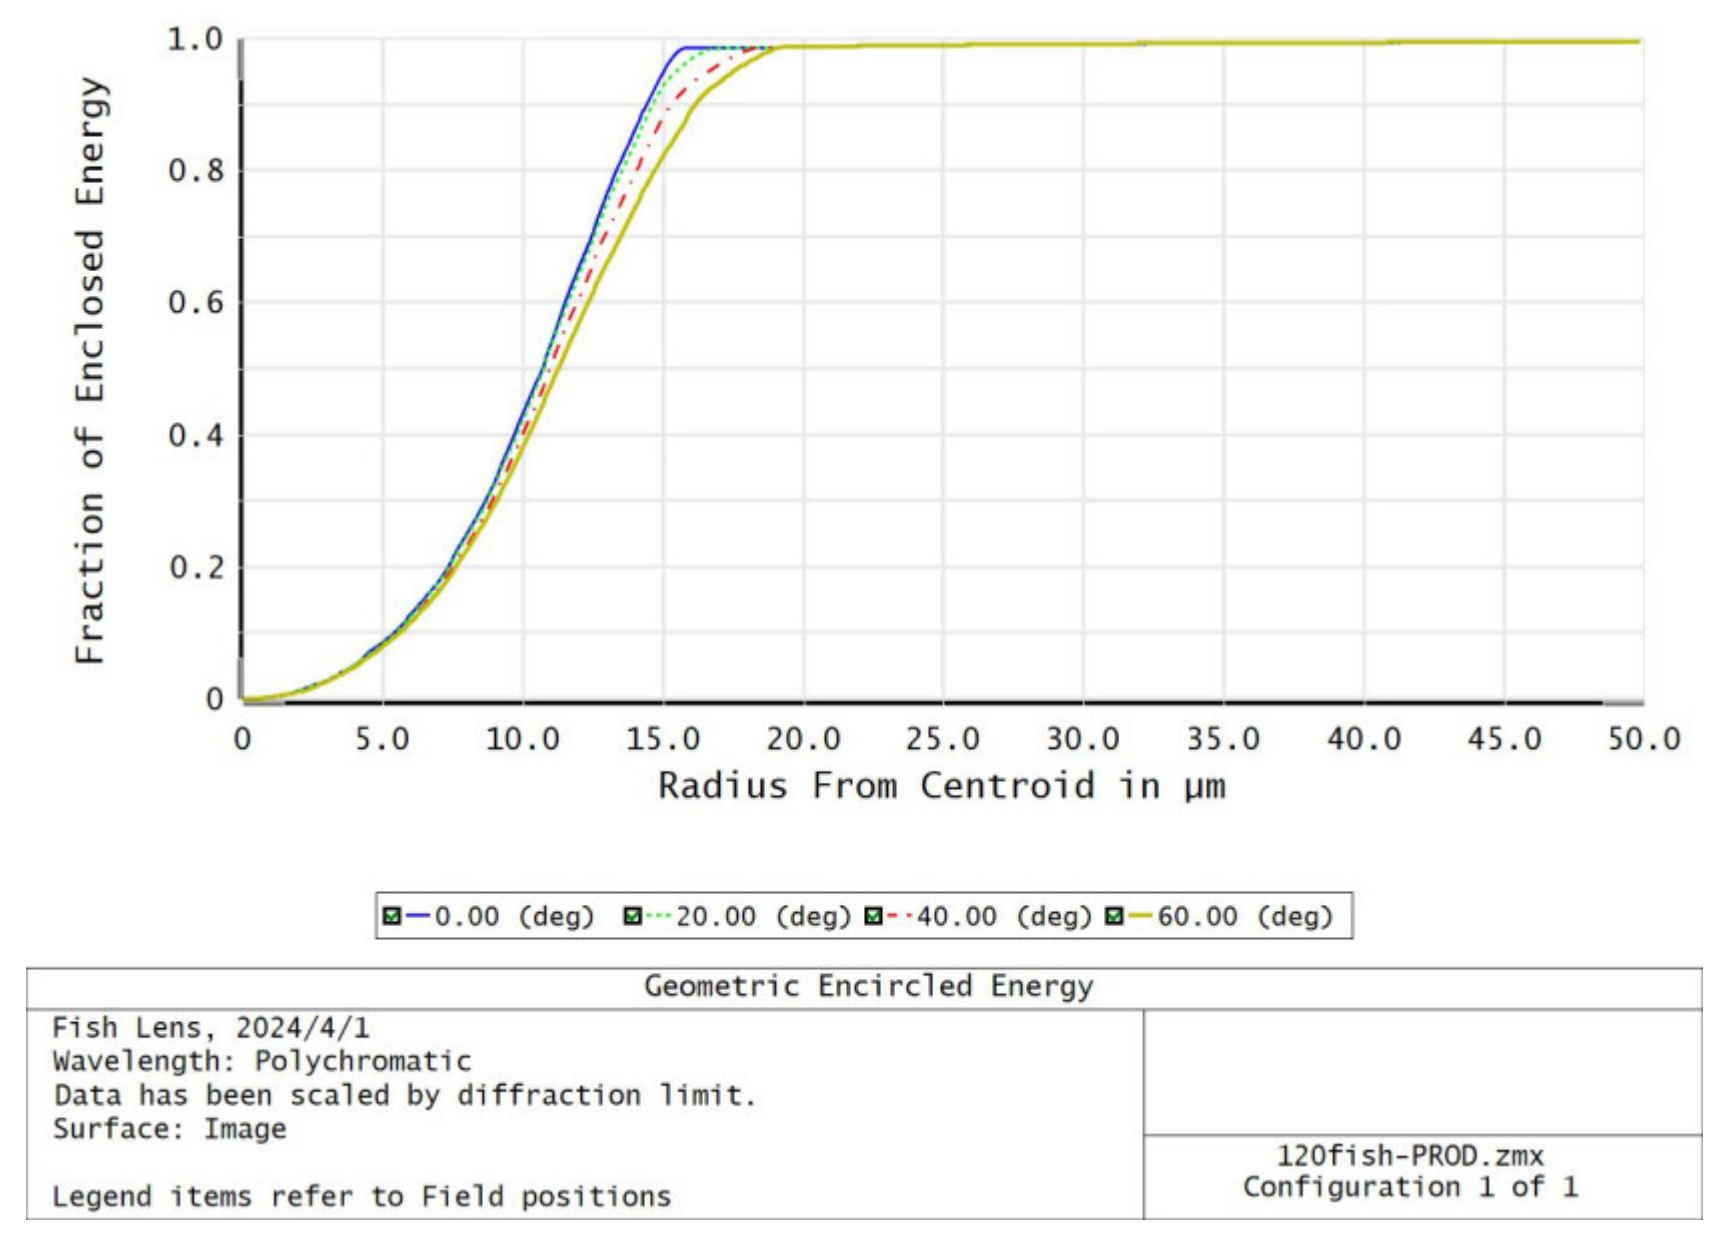
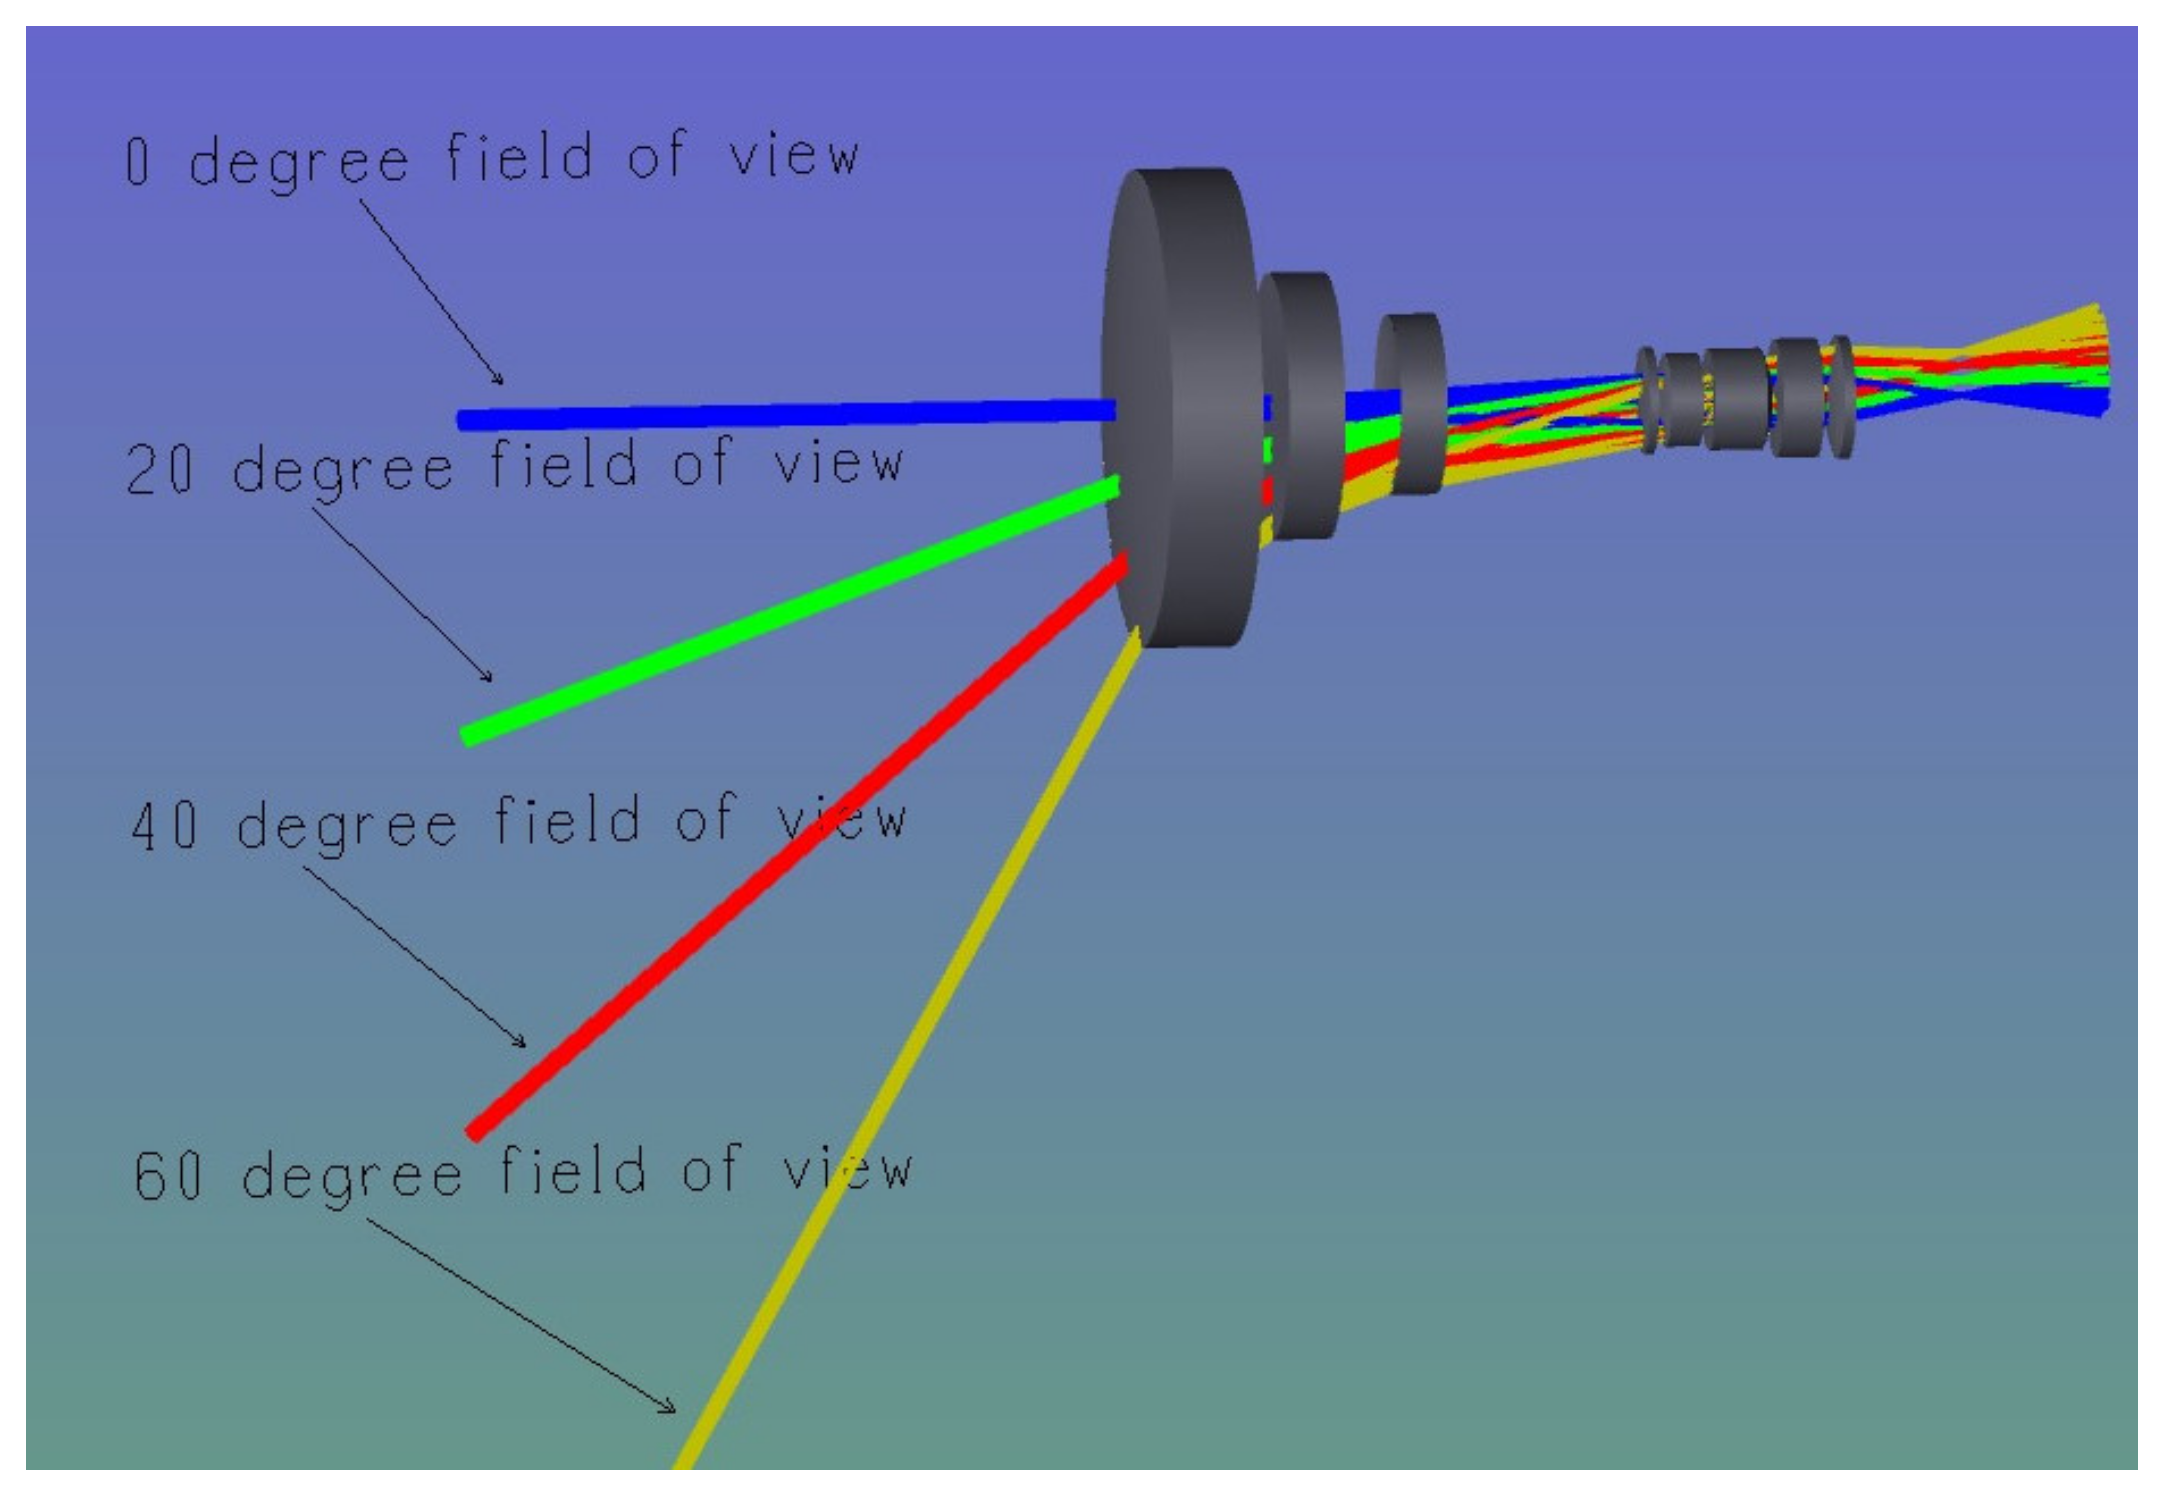
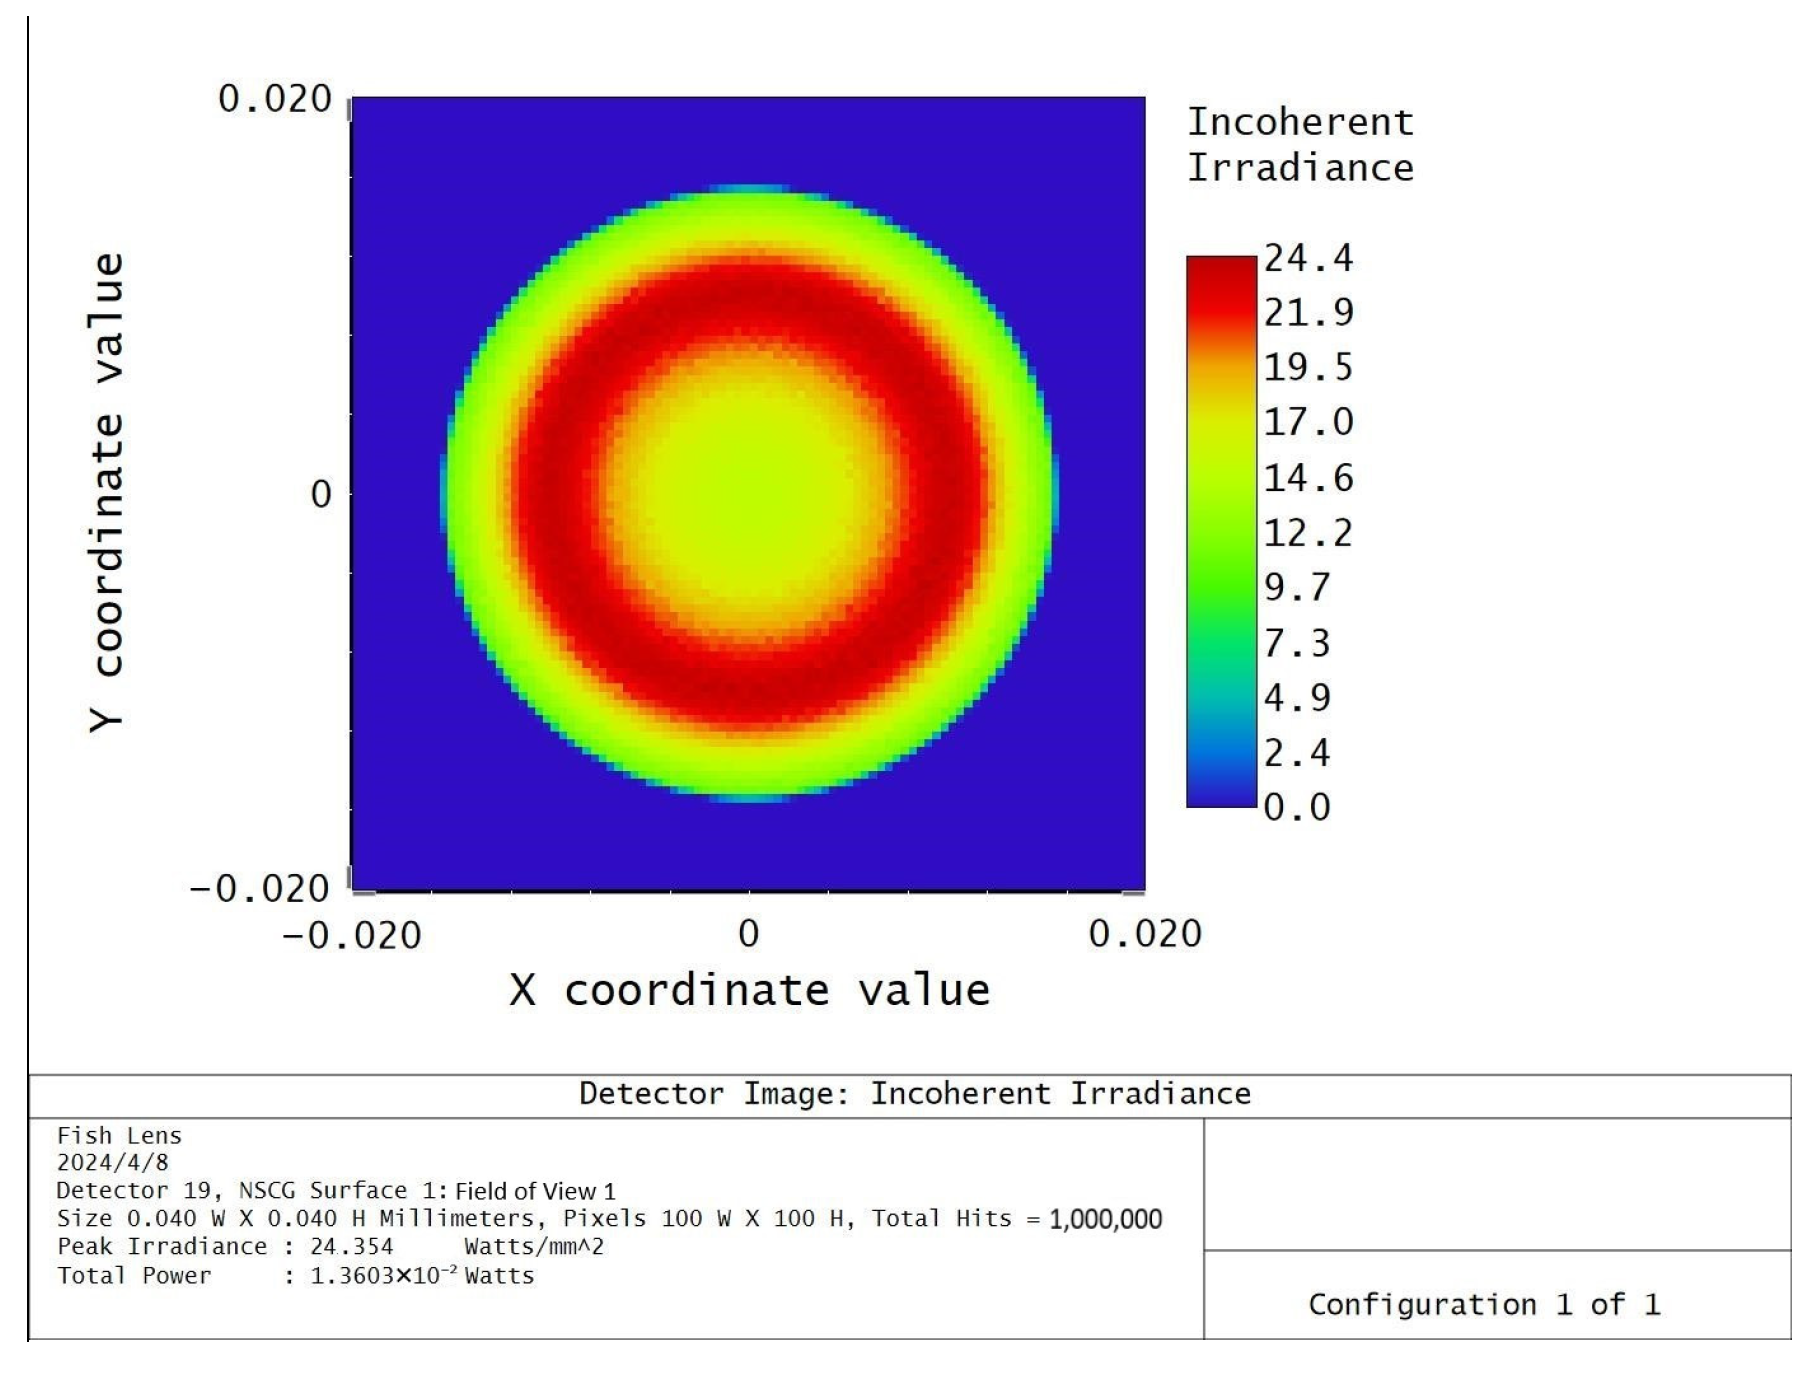
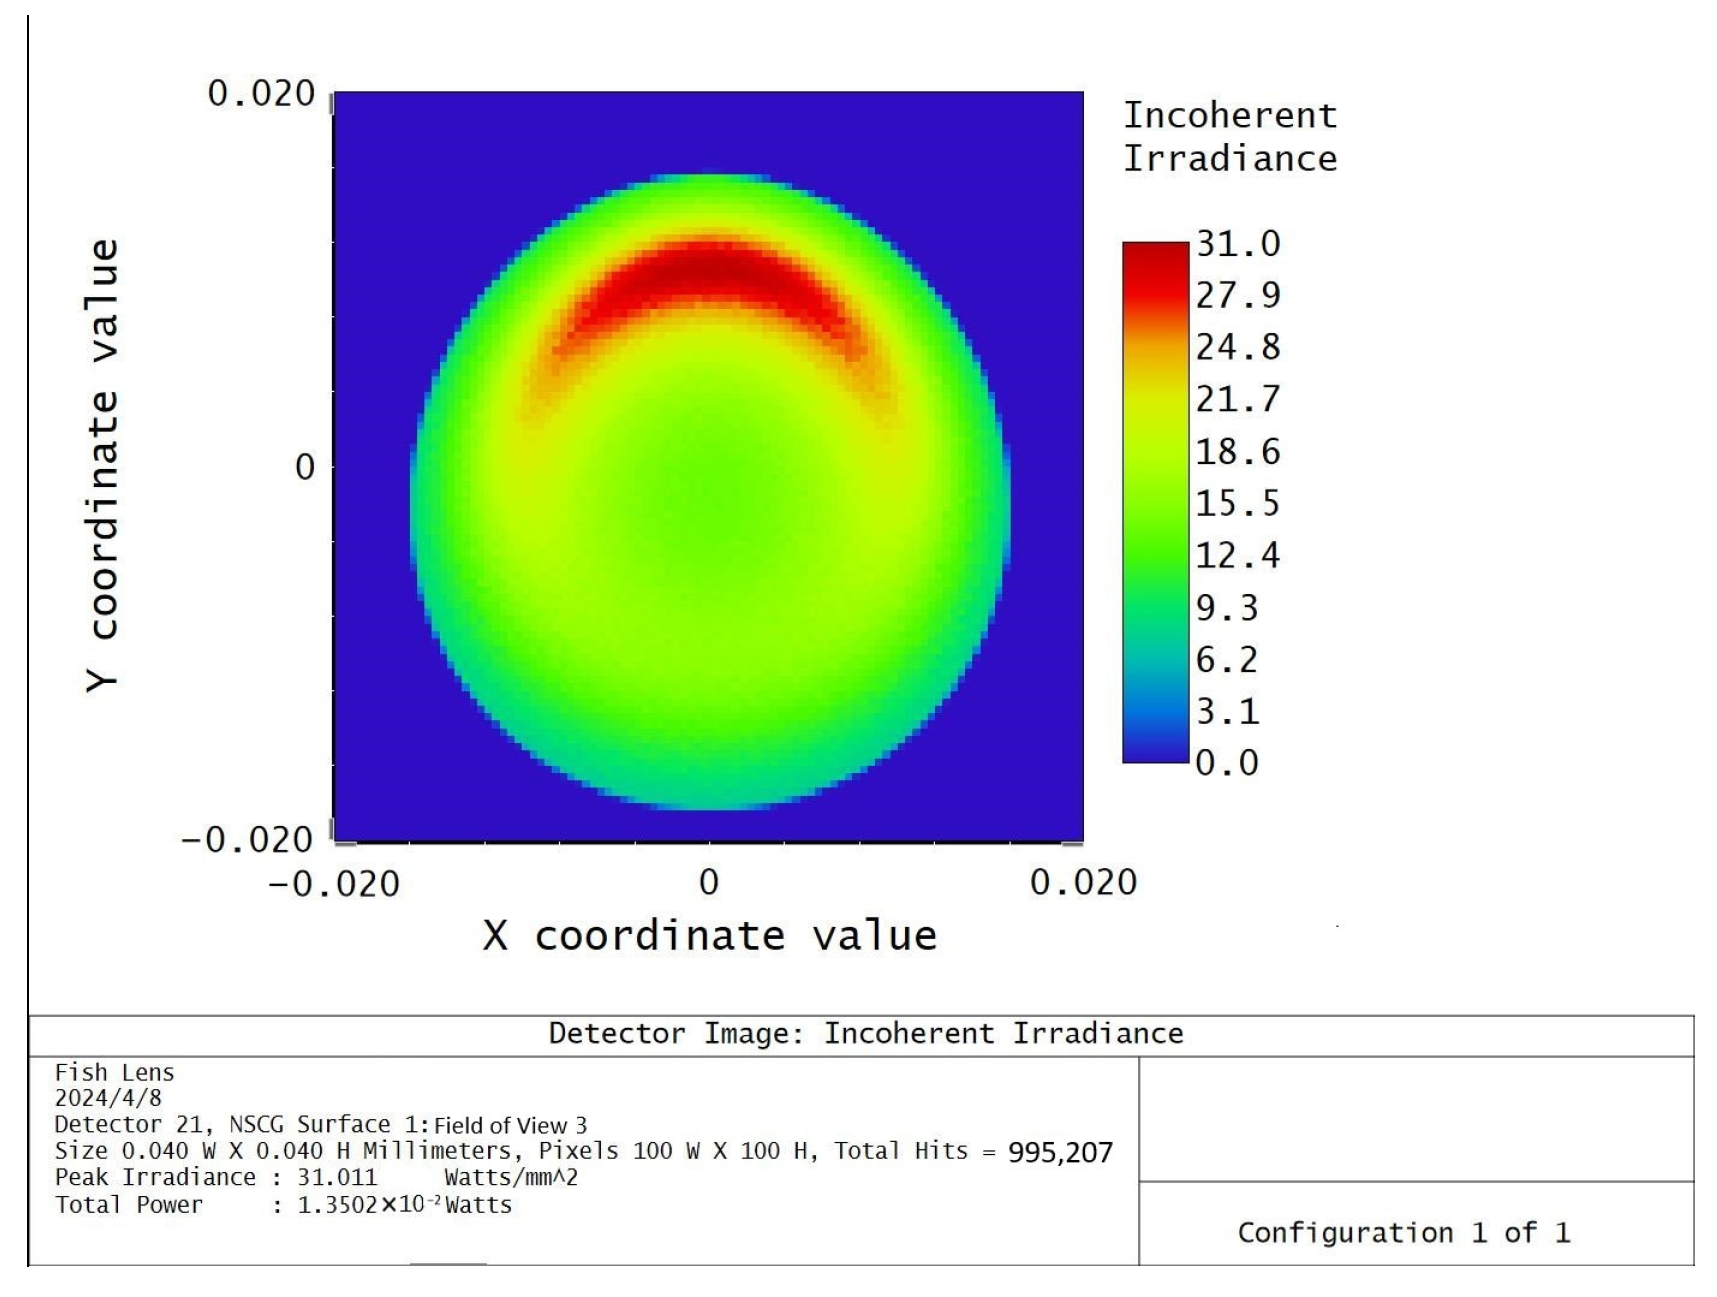
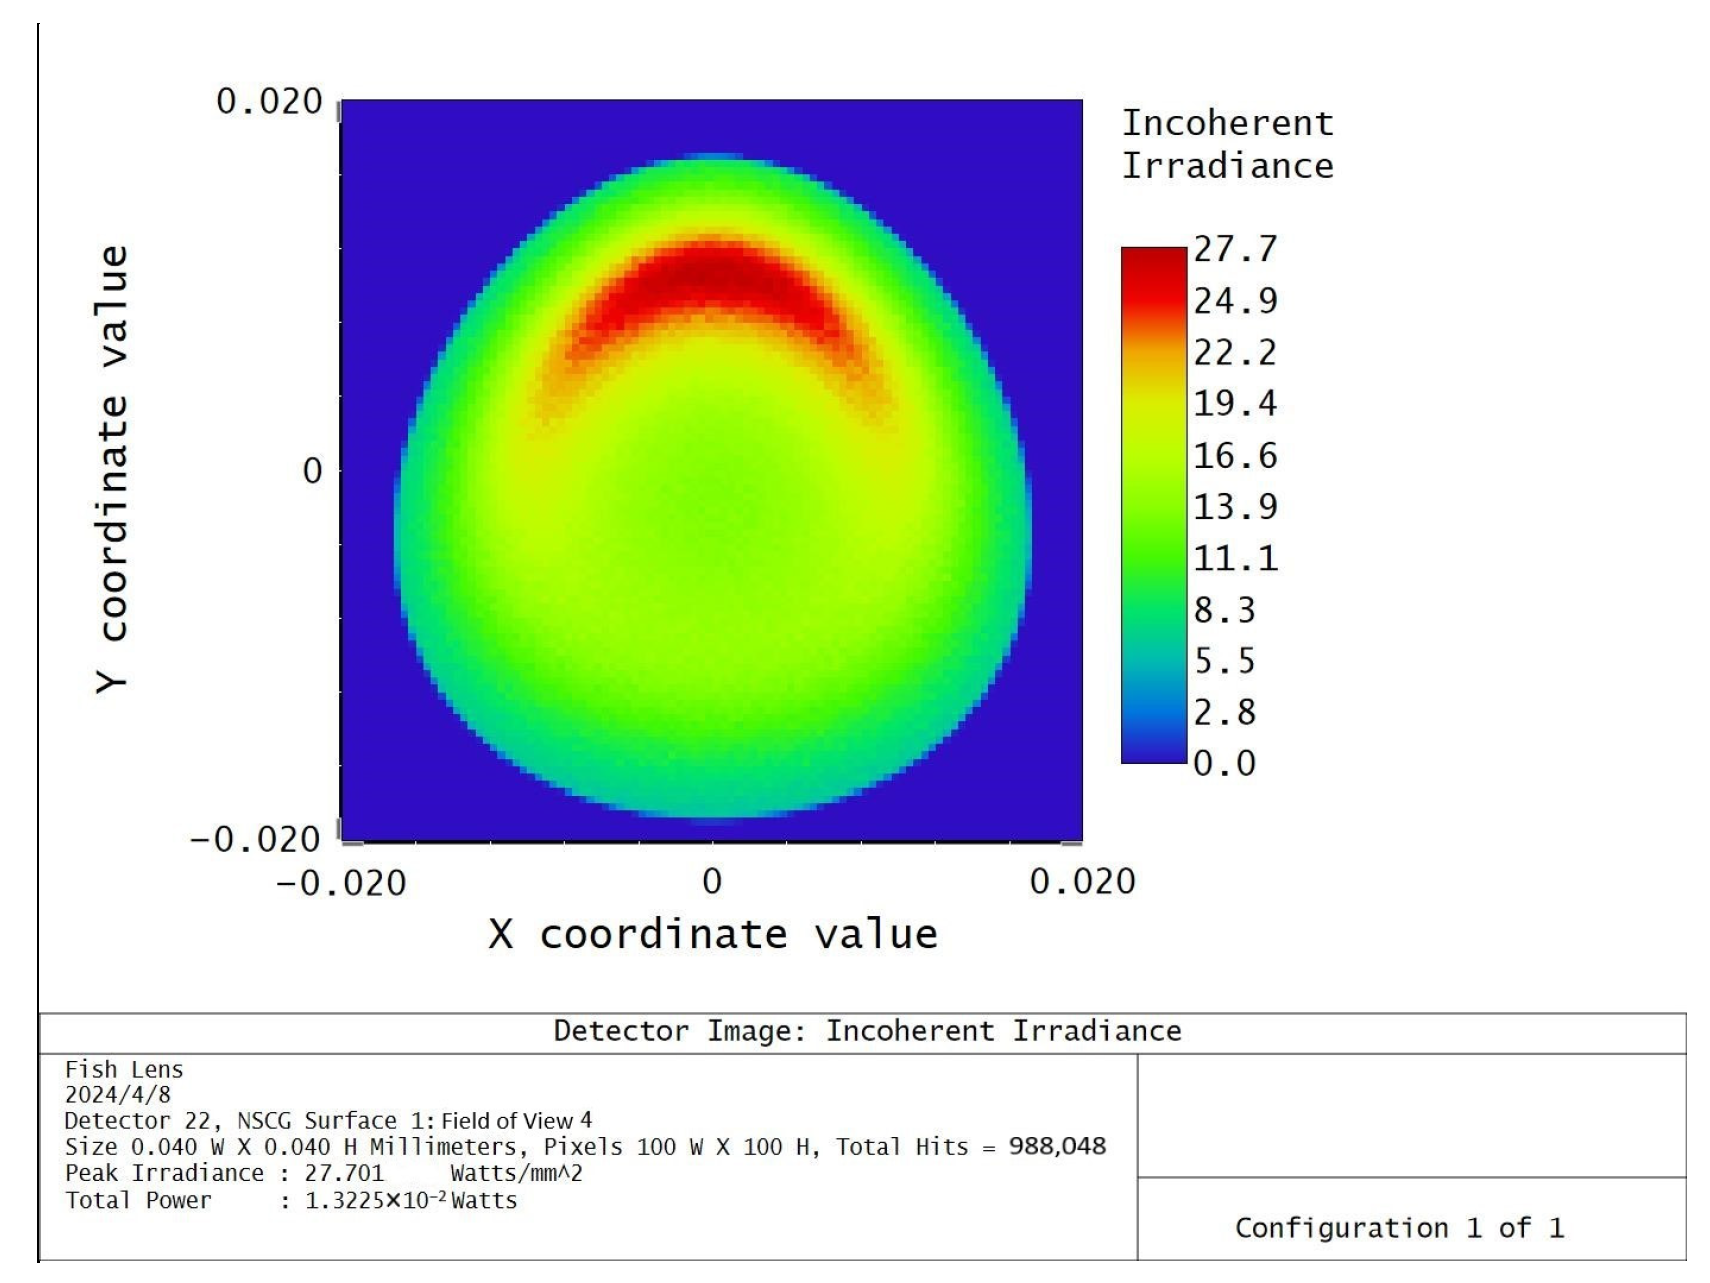
2.3. Fisheye Lens Simulation Analysis

Figure 7 illustrates the selection of the fisheye lens as the optical unit in this study. The fisheye lens is composed of two main parts: the front group and the rear group. In Figure 7, lenses 1, 2, 3, and 5 are negative lenses designed to converge the wide field of view light beams towards the optical axis. Lenses 4 and 8 are convex lenses, while lenses 6 and 7 are doublet lenses used for correcting spherical and chromatic aberrations. Ultimately, the image is formed on the image plane.
Figure 8 displays the spot diagram, and upon examining it, it becomes apparent that the RMS radii at 0°, 20°, 40°, and 60° fields of view are 11.604 μm, 11.796 μm, 12.314 μm, and 12.897 μm, respectively. These values indicate a maximum deviation of less than 12%, suggesting a relatively uniform distribution of light rays.
Figure 9 illustrates the ray trace diagram, and upon examining it, it becomes evident that for a 60° field of view, the edge of the spot closely aligns with the edge of the detector. This alignment satisfies the requirements for a wide field of view, indicating the effectiveness of the optical system.
Figure 10 depicts the entrance energy diagram, and upon examination, it can be observed that the distribution curves of the entrance energy exhibit slight variations under different fields of view. However, the overall trends of the energy distribution curves for the spot remain consistent across different fields of view. Notably, the spot diameter containing 80% of the energy on the image plane is less than 30 μm. This indicates a concentrated and efficient energy distribution within a relatively small area.
Building upon the previous sequential mode analysis, a non-sequential ray tracing was conducted to further analyze the optical path. Figure 11 illustrates the simulation model of the optical path for the receiving optical lens in the non-sequential mode.
The spot distributions for different fields of view were analyzed by varying the angle of incidence of the light source, with an output power of 35 mW. The simulated spot distributions for the 0°, 20°, 40°, and 60° fields of view are presented in Figure 12, Figure 13, Figure 14 and Figure 15, respectively. These figures visually represent the spot distributions for each field of view.
Based on the previously mentioned simulation results, it is evident that as the field- of-view angle increases, the shape of the spot on the light-sensitive surface gradually transforms into an elliptical shape. Additionally, the received power values for different fields of view (0°, 20°, 40°, and 60°) are 13.6 mW, 13.5 mW, 13.5 mW, and 13.2 mW, respectively. These consistent power values indicate stable performance and an optimal outcome.

3. Experimental and Data Analysis

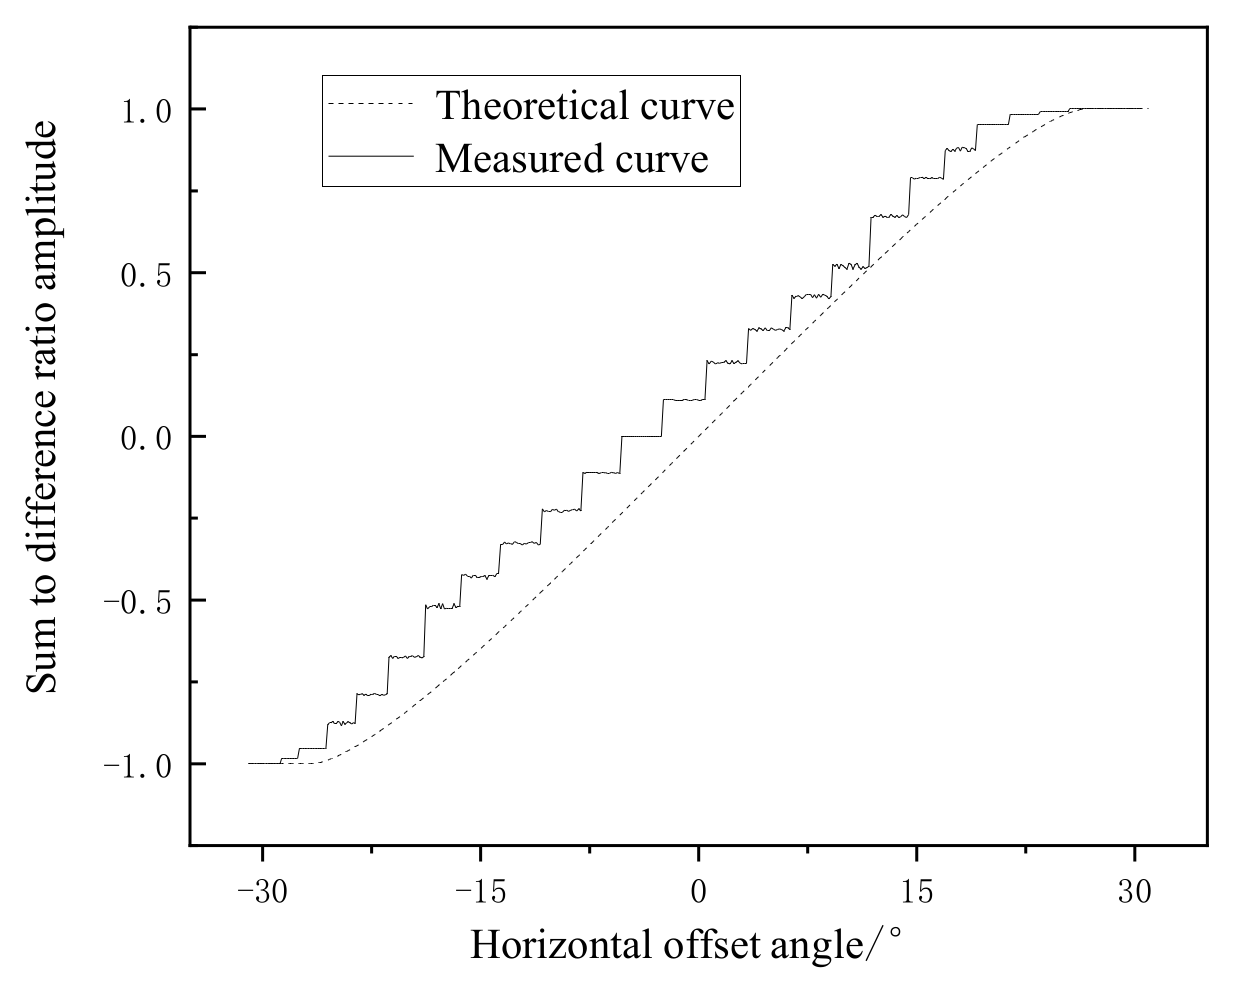
3.1. Fisheye Lens Field of View Testing

A laboratory setup was constructed to validate the performance of the optical reception system using the fisheye lens, as shown in Figure 16.
In the experiment, the fisheye lens receiving antenna was installed on a turntable. Data were collected at 1° intervals while rotating the turntable within a range of ±30°. The experimental data obtained were then compared with the simulation results, as depicted in Figure 17.
Figure 17 demonstrates that as the angle of the incident light changes, the spot gradually moves from the edge to the center of the quadrant detector, and then back to the edge. Furthermore, the differential amplitude gradually changes from −1 to 1, which aligns with the theoretical curve, indicating consistency between the experimental and theoretical results.

3.2. Experimental Testing

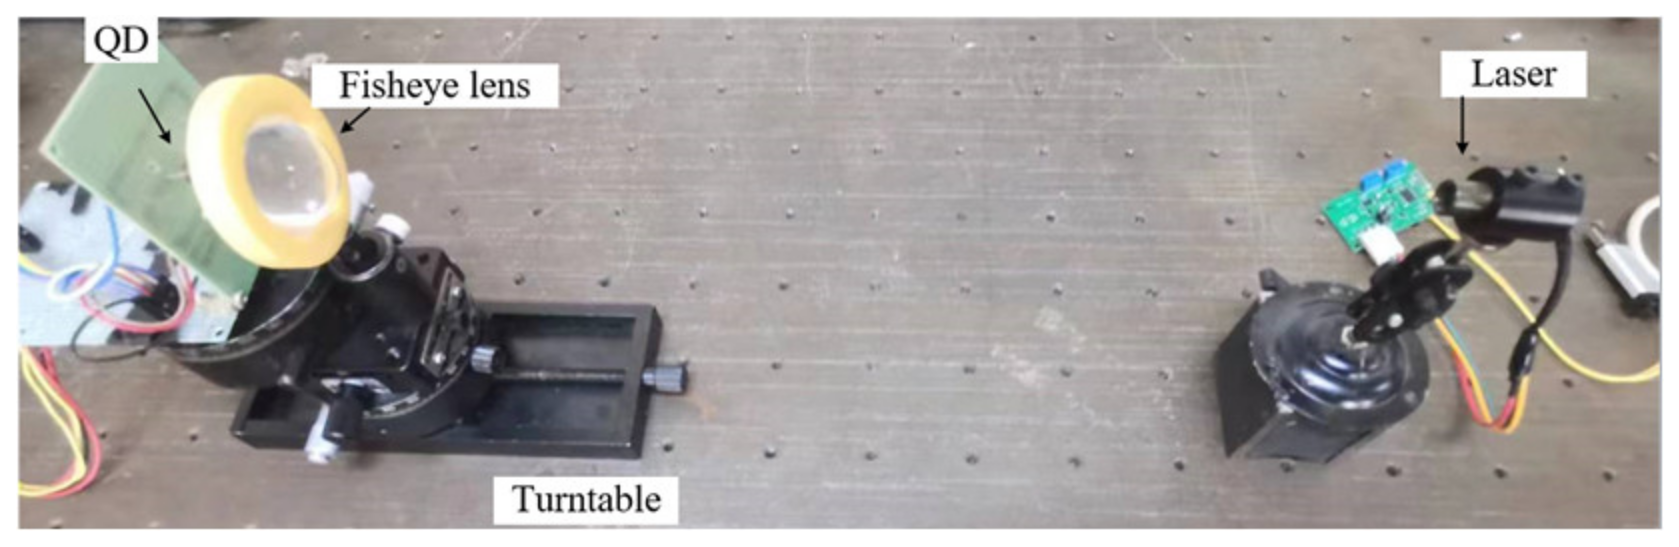
3.2.1. System Configuration

To verify the feasibility of the optical reception system using the fisheye lens, an experimental platform was established for the wireless optical communication auto-alignment system. Figure 18 depicts the schematic diagram of the experimental setup. The transmitter consists of a 650 nm laser, a signal modulator, and a transmitting antenna. The receiver comprises a two-dimensional mirror, a motor and its driver, a position sensor, a photodetector, and a microcontroller. The signal modulator, motor and its driver, position sensor, and microcontroller are not shown in the figure. The testing procedure consists of the following steps: when the beam from the transmitting end encompasses the receiving end, the two-dimensional reflector initiates a scanning capture program, causing the spot to randomly land on the photosensitive surface of the four-quadrant detector. Upon detection of the spot on the photosensitive surface of the four-quadrant detector, the scanning halts, and subsequently, the motor decelerates for precise alignment. This enables the beam to traverse through the through-hole on the surface of the four-quadrant detector, completing the alignment process.
Table 2 shows the main experimental equipment and corresponding parameters of the wireless optical communication automatic alignment system.

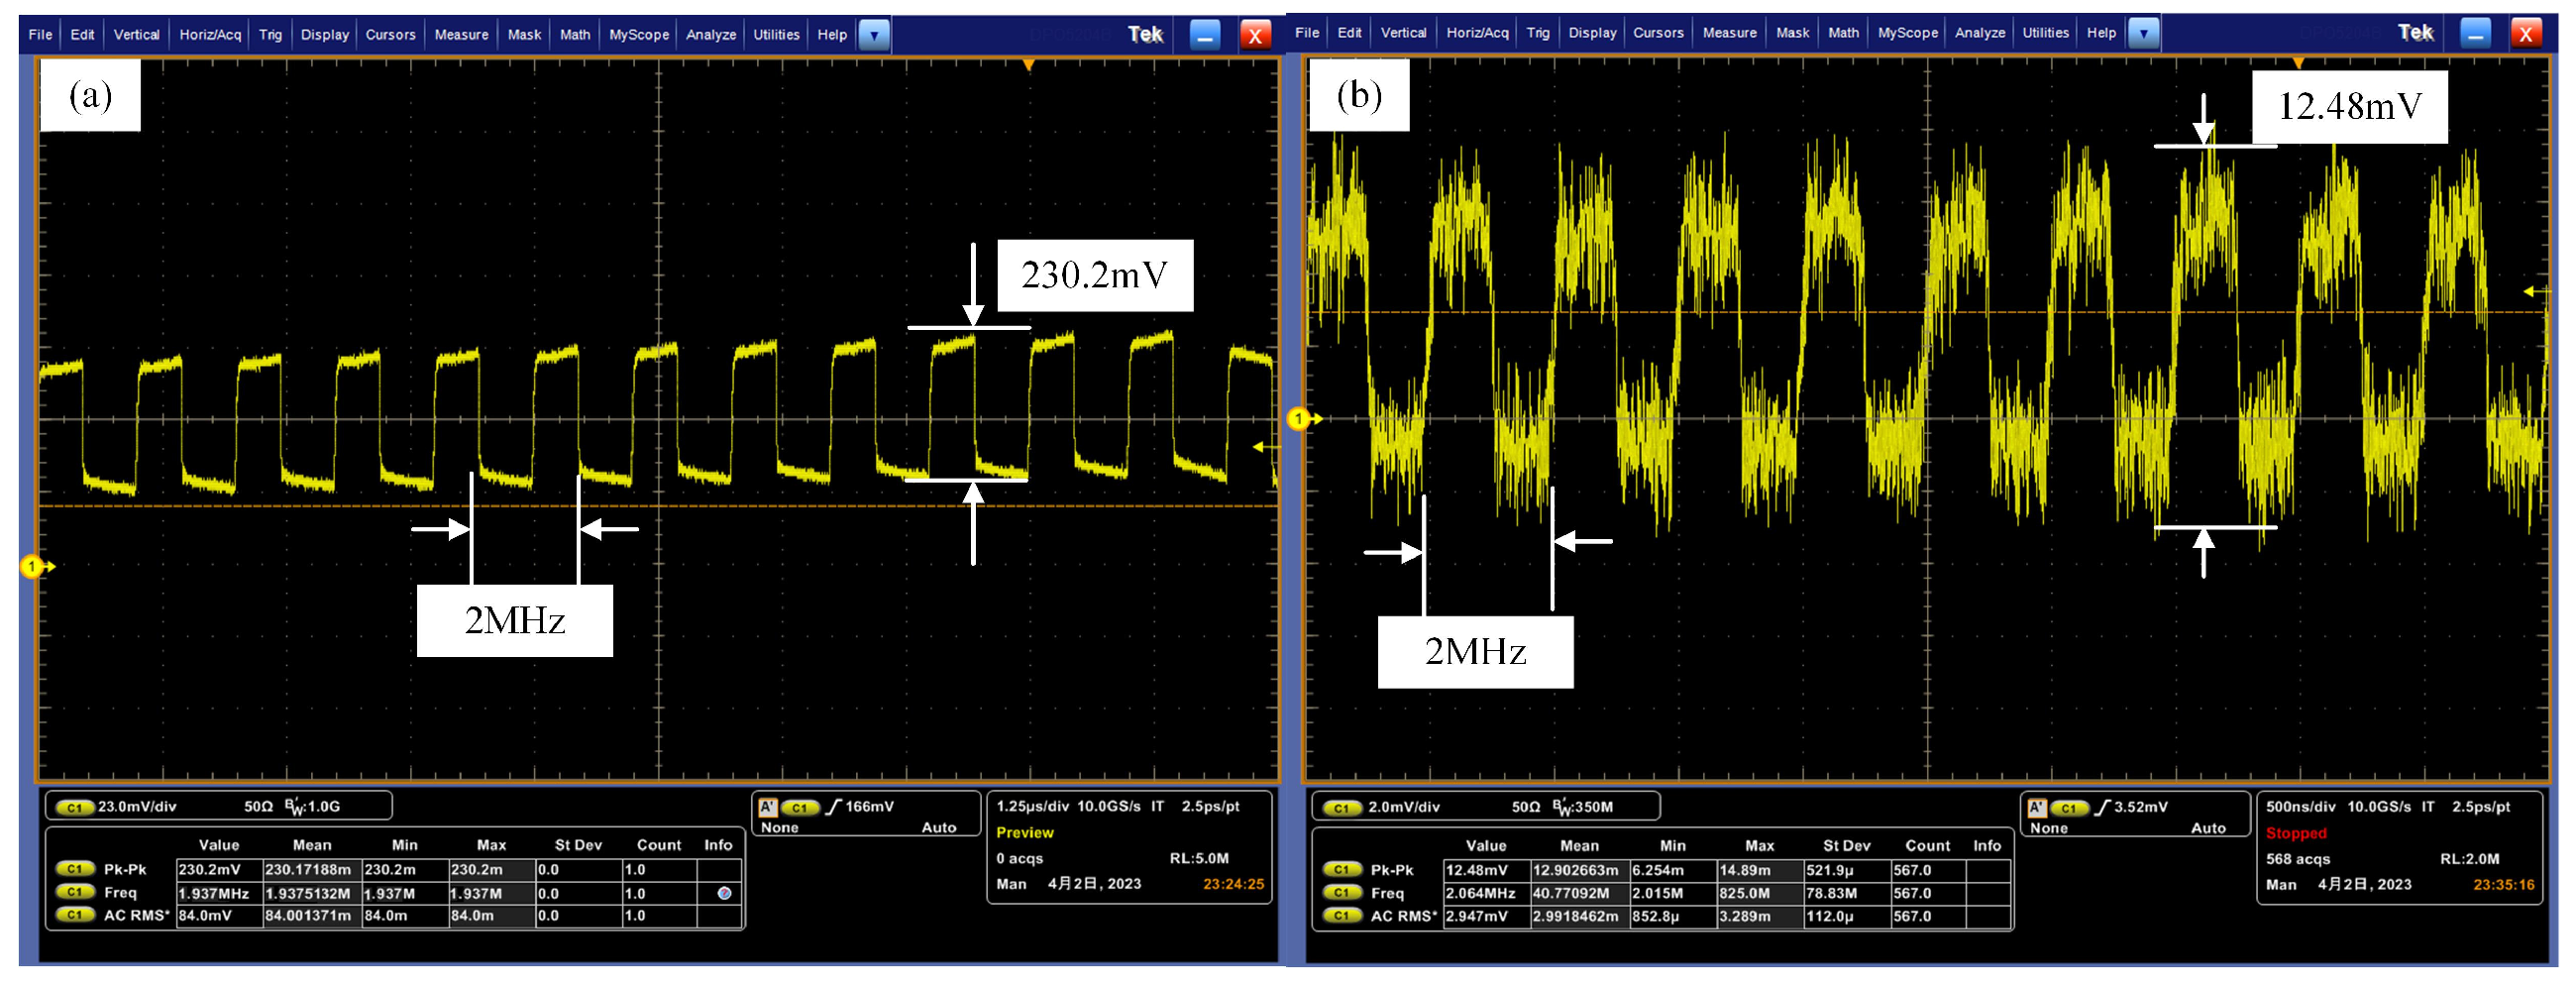
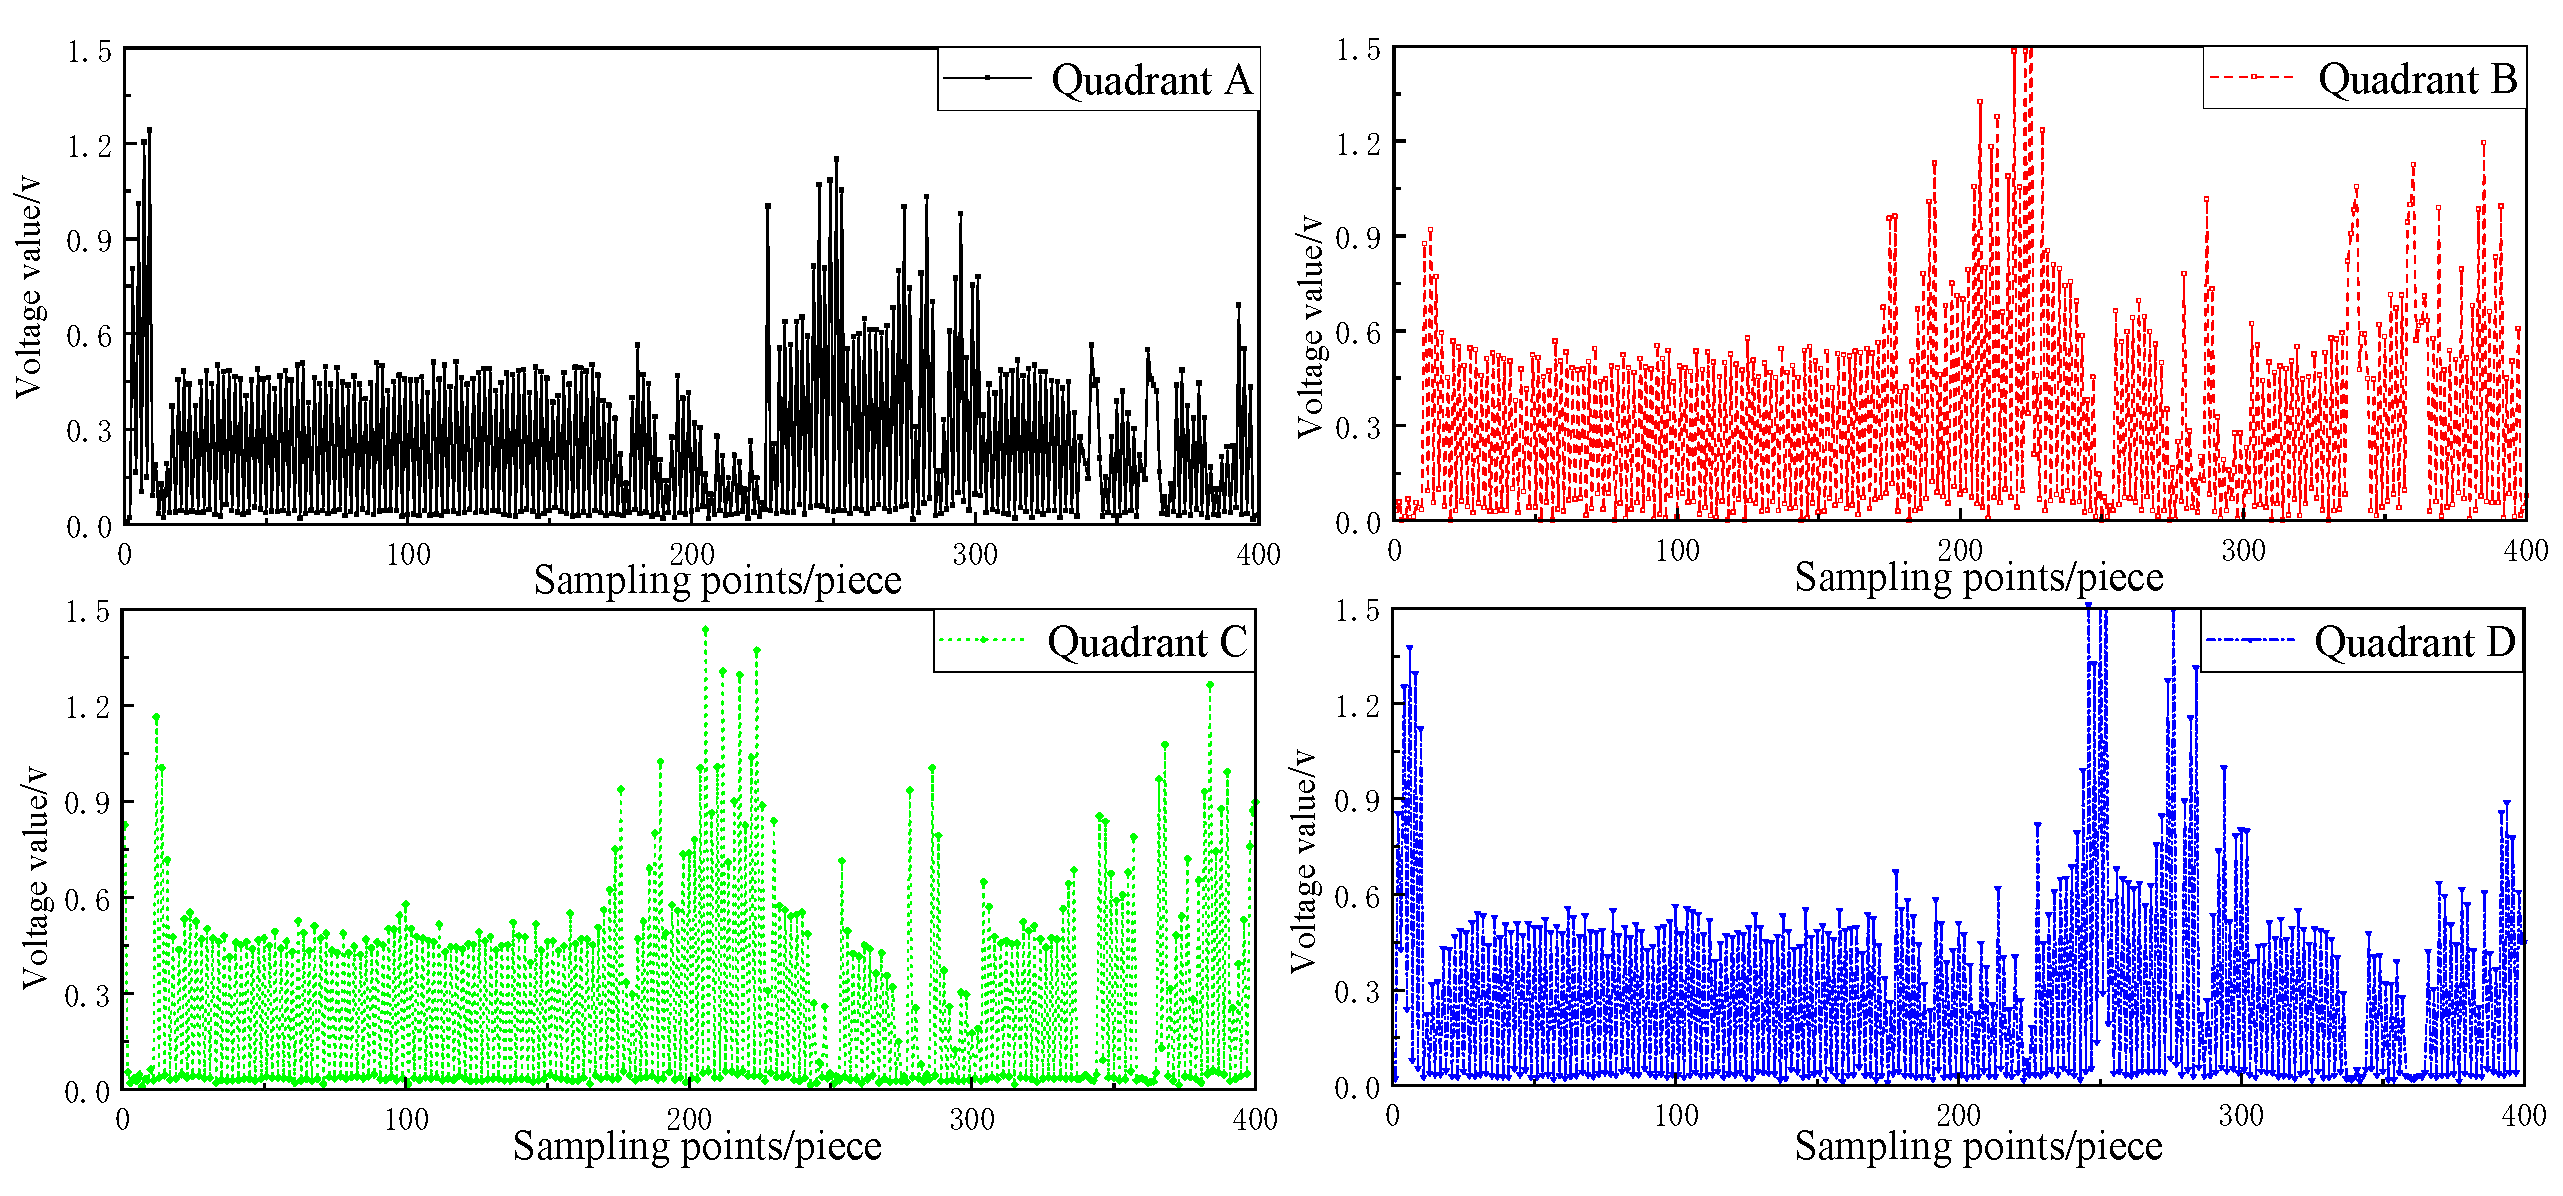
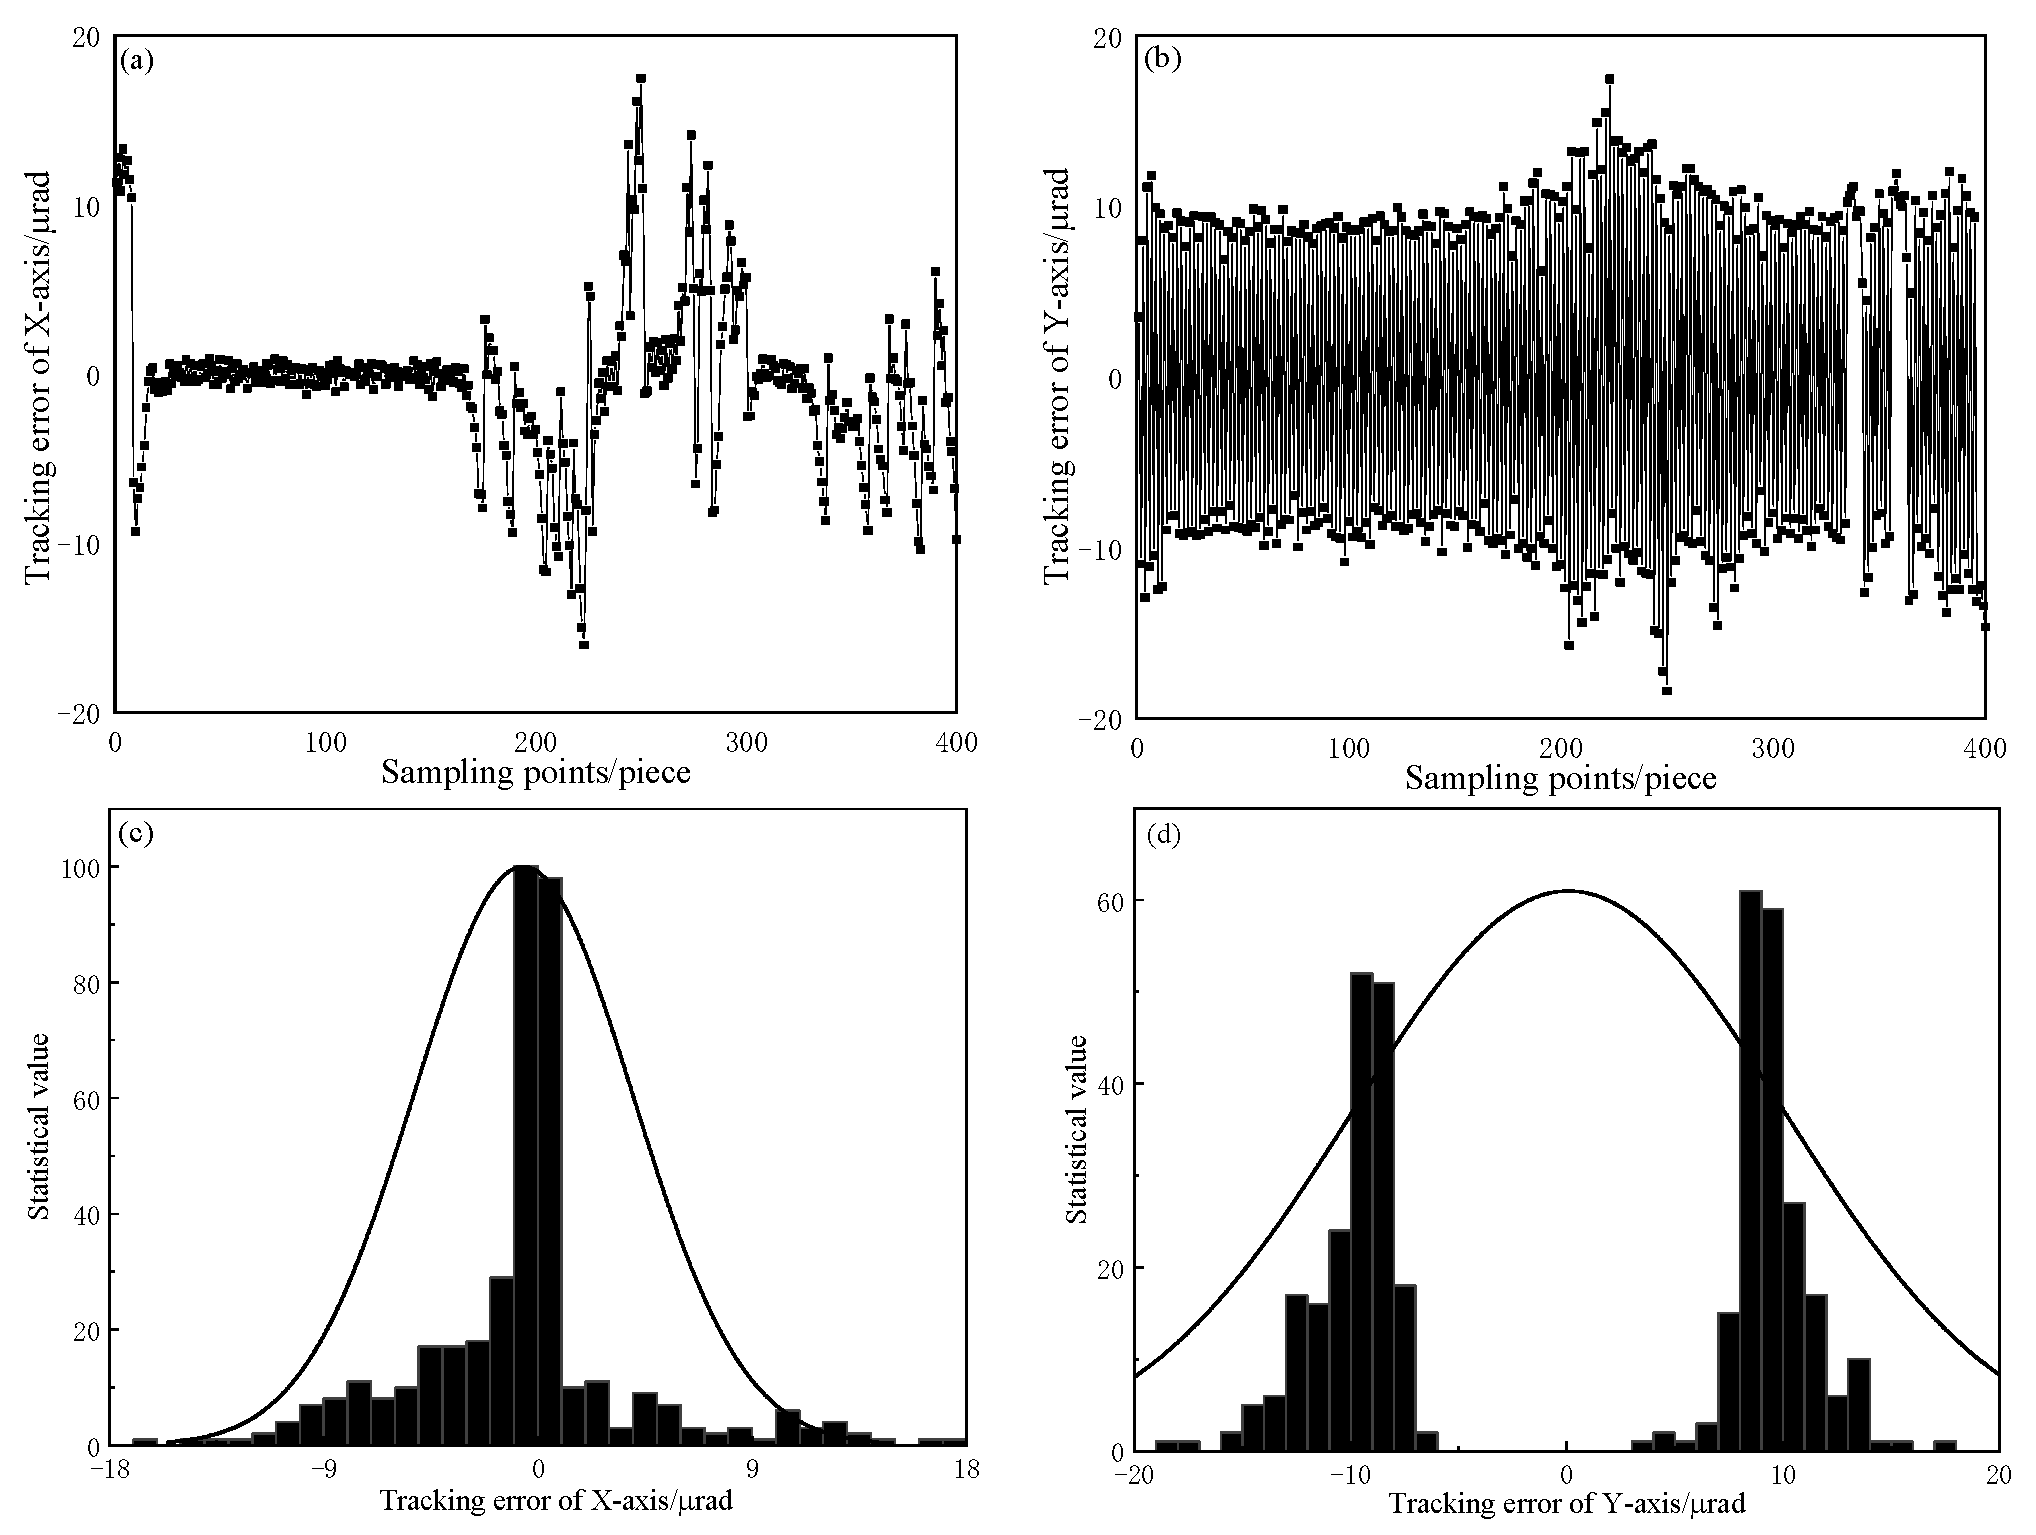
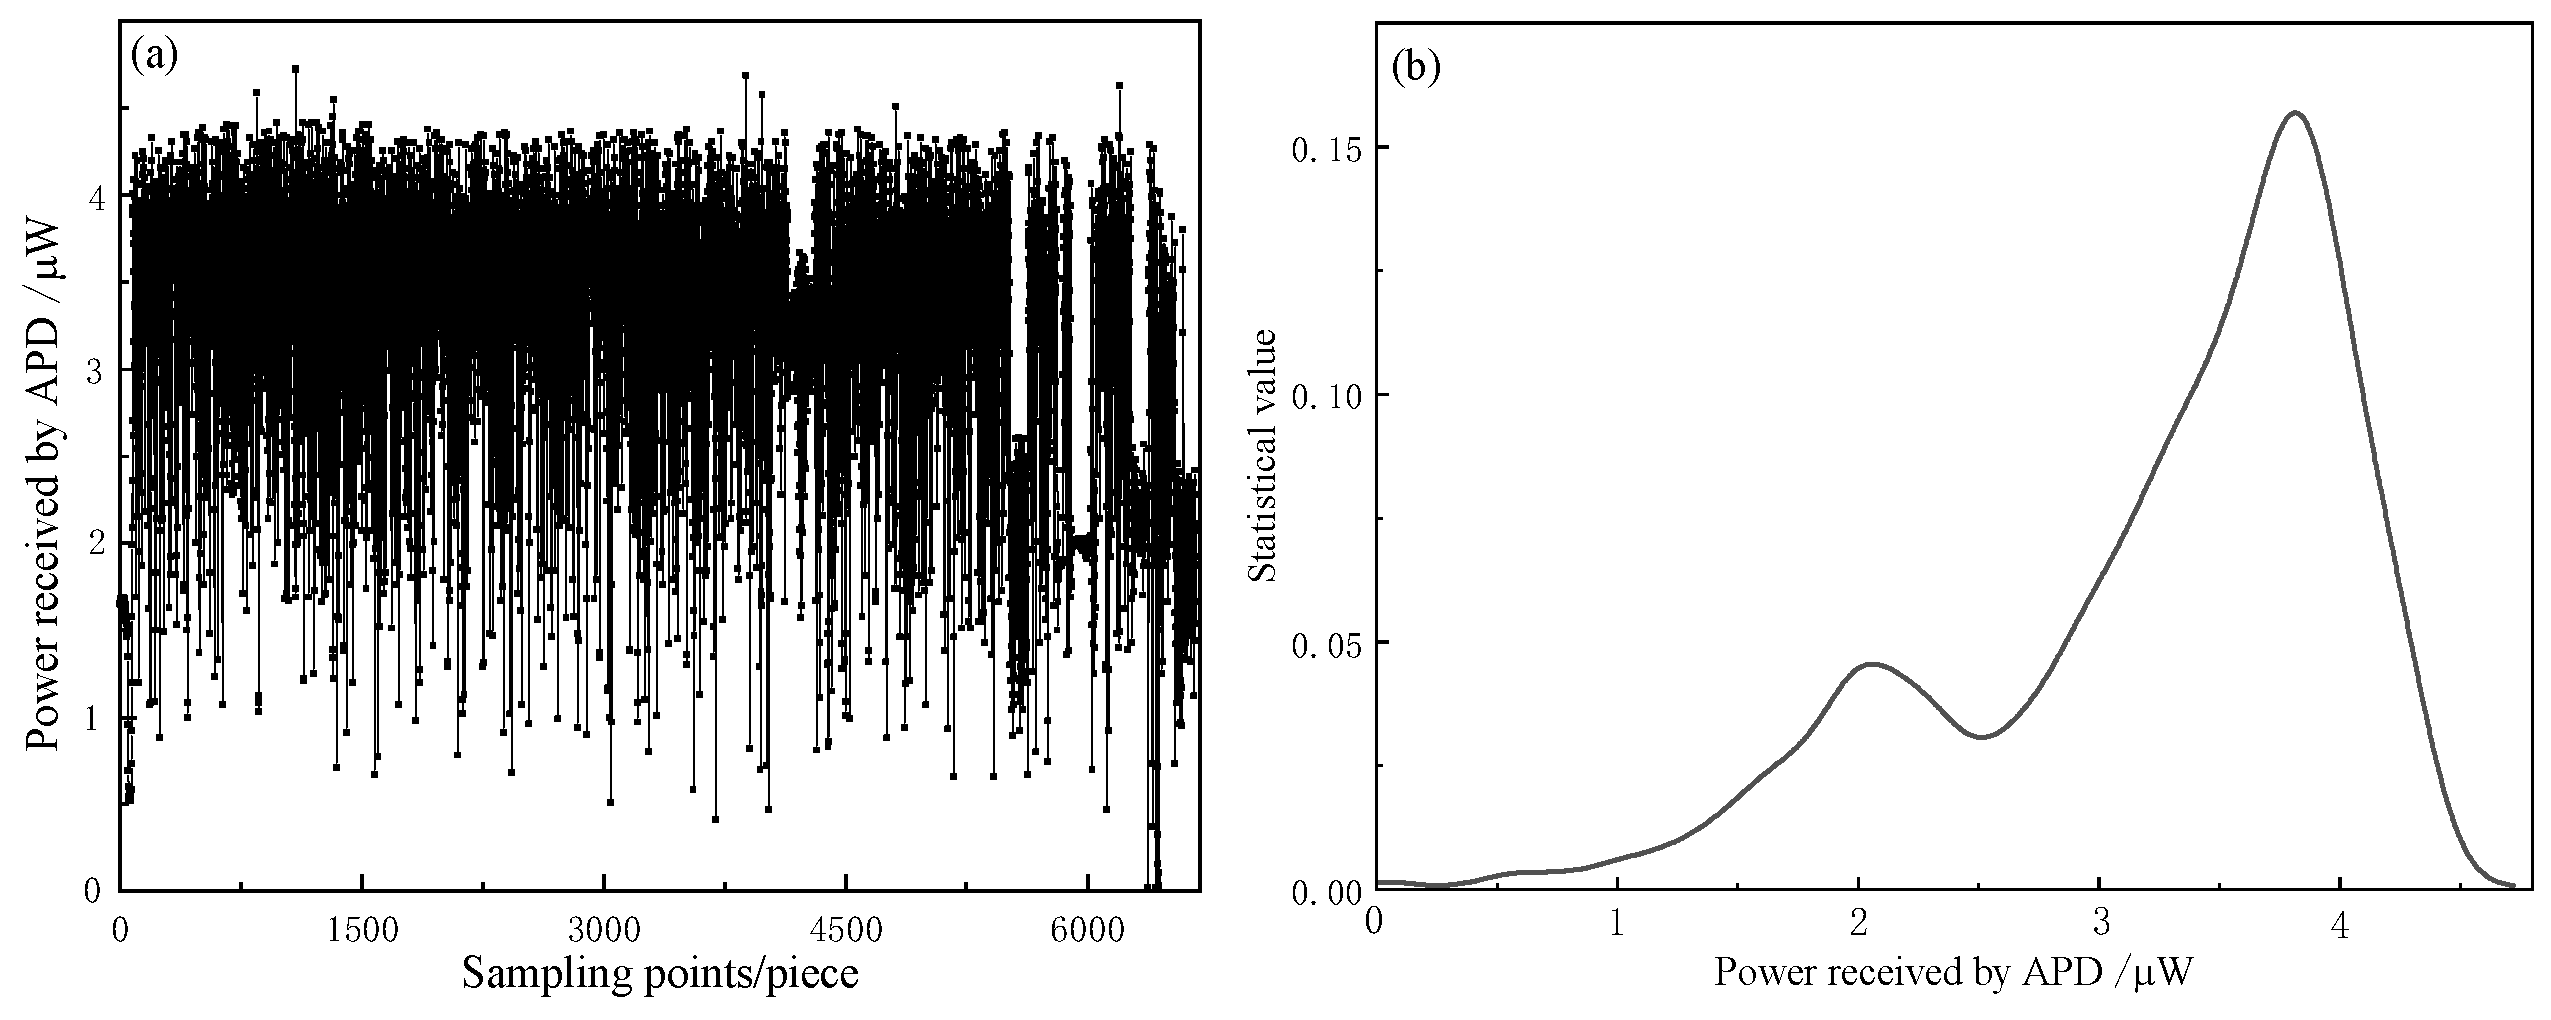
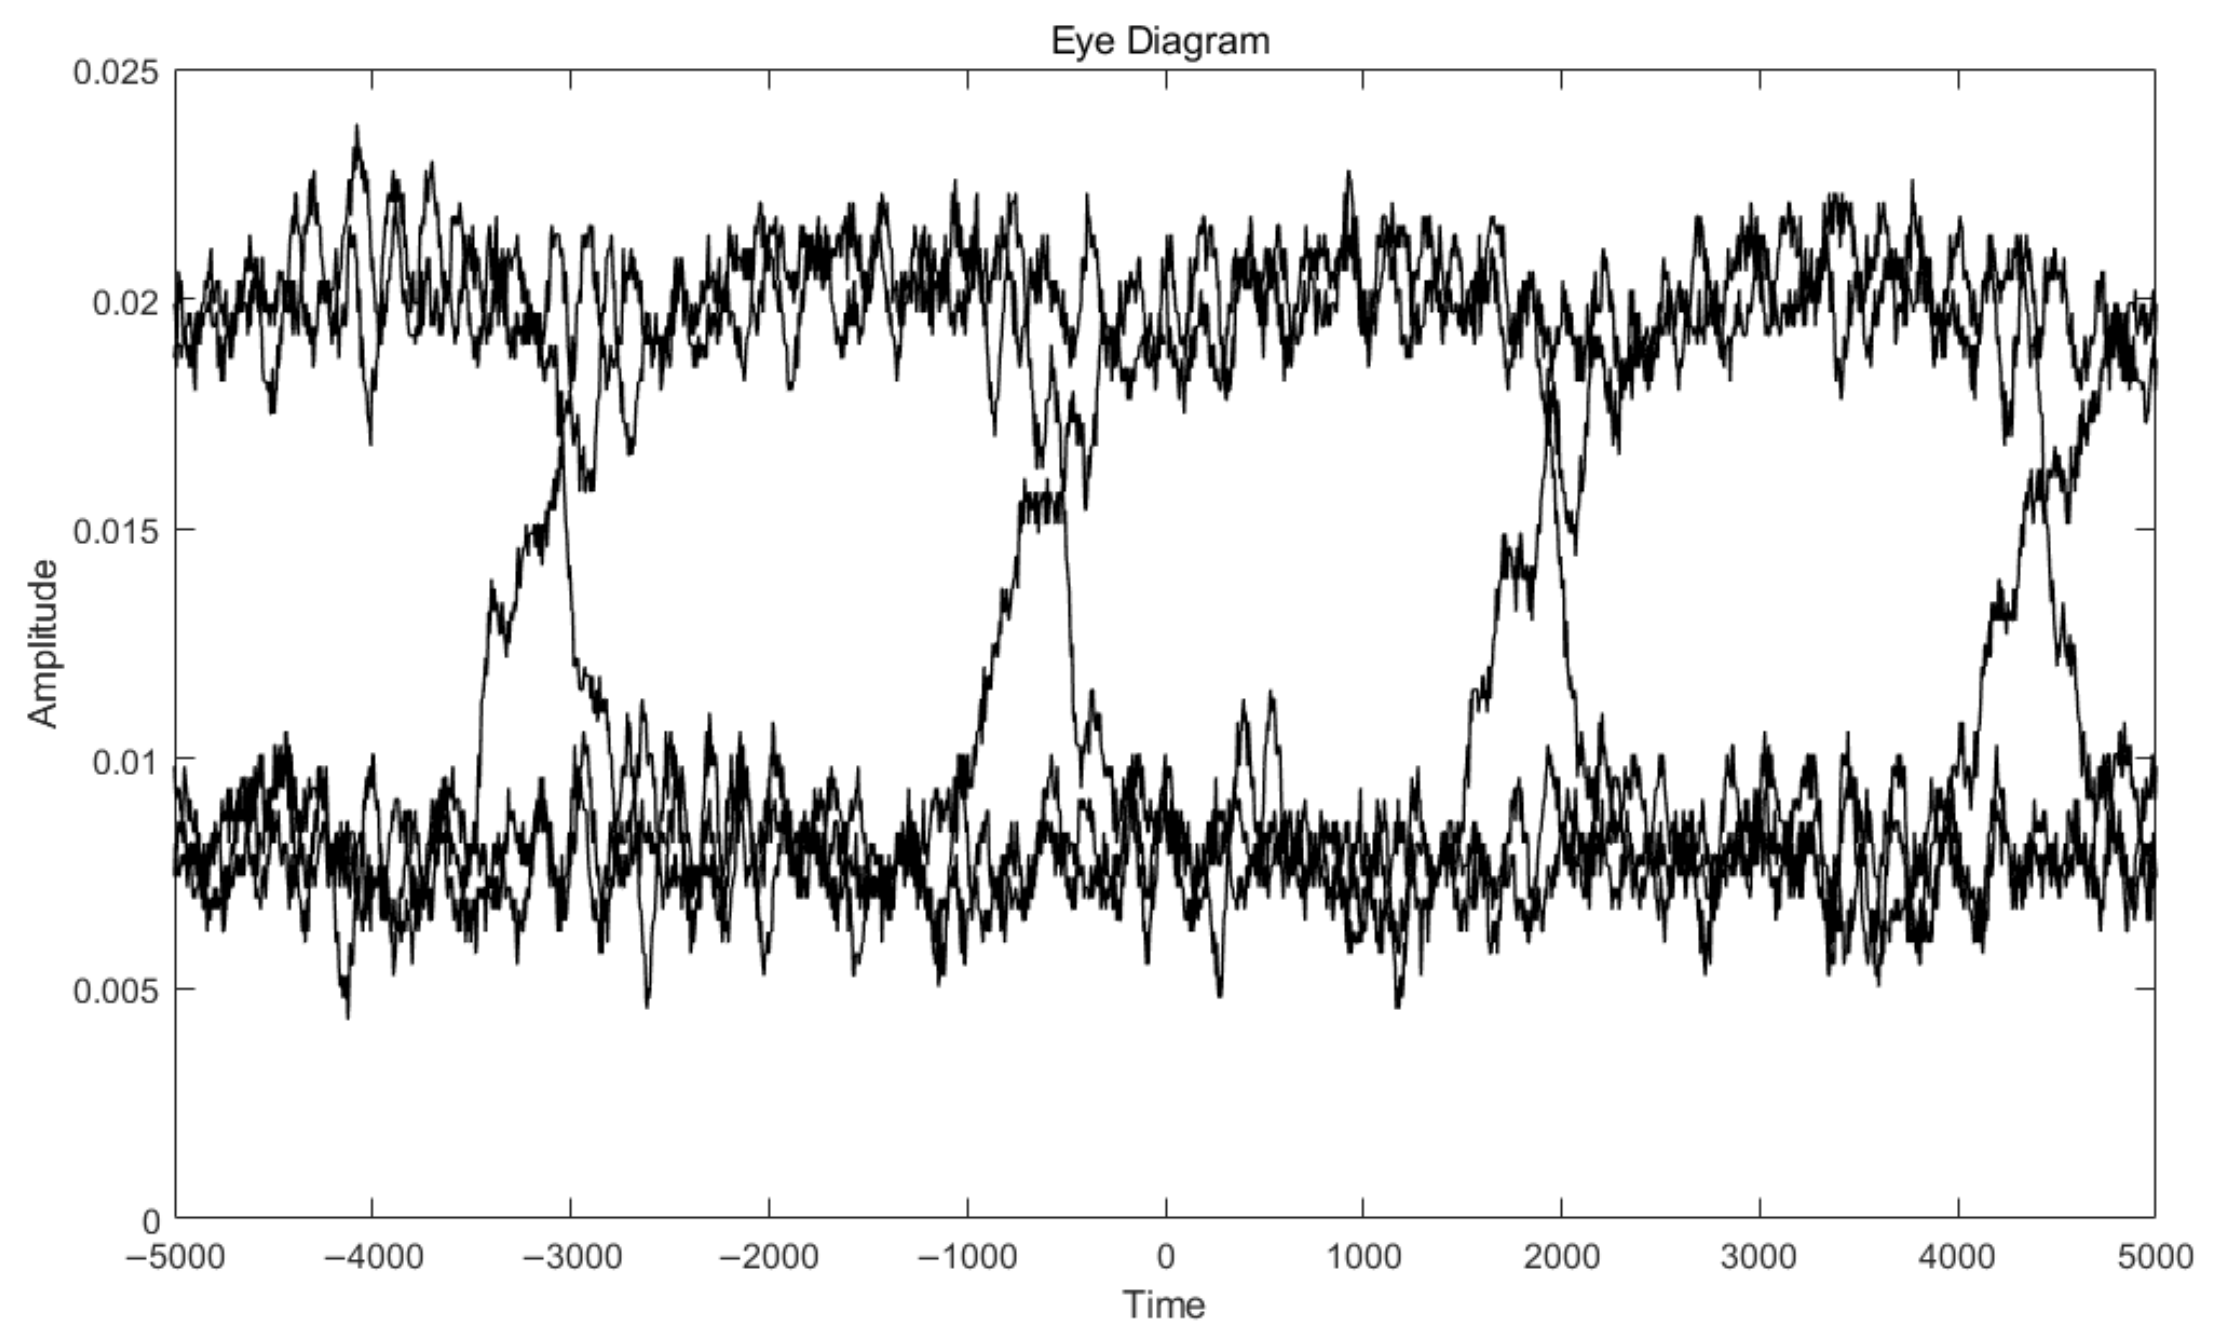
3.2.2. Data Analysis

During the alignment process, the spot’s position is determined by the output of the quadrant detector, and the stepper motor is utilized to adjust and align the beam. Figure 19 illustrates the voltage curve of each quadrant throughout the alignment process.
Figure 19 depicts the output curves of each quadrant in the quadrant detector. At sampling point 0, the voltage values of the first and fourth quadrants noticeably exceed those of the second and third quadrants, indicating successful spot detection. From sampling points 20 to 150, the output signals of all four quadrants remain consistently small and stable, indicating that the spot is accurately positioned at the center of the quadrant detector. However, between sampling points 150 and 400, the output signals of all four quadrants exhibit significant fluctuations. Consequently, the motor is adjusted to reposition the spot back to the center of the quadrant detector.
During the experiment, stable alignment and communication were successfully achieved. The measurement results are presented in Figure 20 and Figure 21. Figure 20 illustrates the tracking error curves in the X and Y axes under tracking conditions, along with their corresponding statistical values. The presence of a through-hole in the detector led to a negligible X-axis tracking error, attributed to the lack of voltage data at the through-hole post-alignment. Meanwhile, continuous adjustments of the two-dimensional mirror induced vertical movements of the light spot, causing a bimodal distribution of the Y-axis tracking error. On the other hand, Figure 21 showcases the received optical power by the detector throughout the entire tracking process.
The experimental results presented in Figure 20 reveal that the root mean square (RMS) tracking error in the X-axis is measured at 13.788 μrad (3σ), while in the Y-axis it is recorded as 22.757 μrad (3σ). Furthermore, the experimental findings displayed in Figure 21 demonstrate that with a transmit power of 35 mW, the average received optical power by the detector is 3.23 μW and the variance in the logarithmic amplitude fluctuations of the received power is calculated to be 6.922 × 10⁻¹³.
The signal generator produced a square wave signal that was modulated onto the laser and transmitted to the wireless optical communication auto-alignment system. The waveform collected by the detector is presented in Figure 22. Figure 22a displays the waveform at the transmitter with an amplitude of 230.2 mV, while Figure 22b illustrates the waveform at the receiver after the tracking process, showing an amplitude of 12.48 mV. Moving on to Figure 23, it illustrates the measured eye diagram, which exhibits a clear and well-defined eye opening with minimal distortion. The eye diagram also demonstrates a small amplitude of jitter noise, indicating low signal noise and a high signal-to-noise ratio within the system.

4. Discussion

This article presents a design proposal for a wireless optical communication automatic alignment system utilizing stepper motors, reflectors, and through-hole four-quadrant detectors. The system achieves beam capture within a ±30° field of view. Incorporating fisheye lenses extends the range of receiving angles, thus mitigating alignment requirements. Compared to composite-axis light tracking and aiming control systems [4,5], the proposed wireless optical communication automatic alignment system featuring fisheye lenses boasts a simpler structure, reduced size, and lighter weight, and is suitable for integration into unmanned aerial vehicle (UAV) airborne laser communication systems. Such integration is poised to significantly advance the field of UAV airborne laser communication. In contrast to miniaturized laser communication systems [6,7,8,9], this design enables a broader range of receiving angles while minimizing alignment constraints. Fisheye lenses facilitate automatic alignment, enhancing system stability and performance by acquiring target position information through optical imaging, thereby ensuring precise alignment. Employing image processing algorithms enables automatic beam direction and angle adjustments based on fisheye lens-captured image data, ensuring optimal alignment with the target signal. Nevertheless, akin to any system, this proposal has its limitations. Although fisheye lenses widen the receiving field of view and alleviate alignment challenges, they may introduce significant optical distortion during wide-angle imaging, potentially compromising image accuracy and precision. This distortion could impact the effectiveness of automatic alignment.

5. Conclusions

This paper focuses on addressing the requirements of lightweight, compact size, and low power consumption in wireless optical communication systems. To fulfill these requirements, a wireless optical communication auto-alignment system was designed, incorporating a stepper motor, a mirror, and a quadrant detector with an aperture. Simulation analysis was conducted on the fisheye lens, which revealed a wide field of view angle of 120°. Experimental results demonstrated that the fisheye lens enabled the capture of light beams within a ±30° field of view, with a tracking error of 22.757 μrad. After alignment, the average output optical power of the detector was measured at 3.23 μW, and the detected waveform output was found to be 12.48 mV. The system design was both simple and practical. The inclusion of a fisheye lens allowed for a broader range of receiving angles, thereby reducing the alignment requirements. Additionally, the fisheye lens proved capable of receiving the optical signal even in the presence of deviations or oscillations between the transmitting and receiving devices, ensuring uninterrupted communication.

Author Contributions

Conceptualization, X.K.; methodology, X.K. and H.X.; software, H.X.; validation, X.K. and H.X.; formal analysis, X.K.; investigation, H.X.; resources, X.K. and H.X.; data curation, X.K. and H.X.; writing—original draft preparation, X.K. and H.X.; writing—review and editing, X.K. and H.X. All authors have read and agreed to the published version of the manuscript.

Funding

This research was funded by the Key Industrial Innovation Chain Project of Shaanxi Province of the funder, grant number 2017ZDCXL-GY-06-01, and the General Project of the Natural Science Foundation of China of the funder, grant number 61377080.

Institutional Review Board Statement

Not applicable.

Informed Consent Statement

Not applicable.

Data Availability Statement

The data that support the findings of this study are available from the corresponding author upon reasonable request.

Conflicts of Interest

The authors declare no conflicts of interest.

References

  1. Ren, J.Y.; Sun, H.Y.; Zhang, L.X.; Zhang, T.Q. Development status of space laser communication and new method of networking. Laser Infrared 2019, 49, 143–150. [Google Scholar] [CrossRef]
  2. Zeng, F.; Gao, S.J.; San, X.G.; Zhang, X. Development status and trend of airborne laser communication terminals. Chin. Opt. 2016, 9, 65–73. [Google Scholar] [CrossRef]
  3. Ding, J.P.; Yi, Z.L.; Wang, J.T.; Li, Y.P.; Zhang, Z.J.; Jie, P.; Guo, X.R.; Chen, X.F. Recent Advances of UAV Airborne Optical Wireless Communications. Laser Optoelectron. Prog. 2020, 57, 40–51. [Google Scholar] [CrossRef]
  4. Lv, C.L.; Tong, S.F.; Song, Y.S. Optical-path Optimization Design of Compound Axis and APT Study of Airborne Laser Communication. Acta Photonica Sin. 2012, 41, 649–653. [Google Scholar]
  5. Zhao, M.; Xie, H.B.; Chen, M.; Yang, L. Design of tracking communication integrated receiving optical system. J. Appl. Opt. 2019, 40, 973–979. [Google Scholar] [CrossRef]
  6. Zhang, S.Y. Design and Experimental Verification of an Airborne Miniaturized Laser Communication Terminal. Telecommun. Eng. 2019, 59, 678–683. [Google Scholar] [CrossRef]
  7. Shen, Y.; Feng, Y.; Xu, L.; Sun, H.; An, J.X.; Ma, J.J. Unmanned aerial vehicle airborne laser transmission technology for fast lift air base station. Opt. Commun. Technol. 2019, 43, 32–35. [Google Scholar] [CrossRef]
  8. An, J.X.; He, X.L.; Yang, Q.Y.; Xu, L.; Liu, X. Research on the application of the air to ground free space optical communication by small UAV. Opt. Commun. Technol. 2017, 41, 10–13. [Google Scholar] [CrossRef]
  9. Xu, L.; Shen, Y.; An, J.X.; Li, K.; Luo, L. Development of a UAV airborne laser communication equipment. Opt. Commun. Technol. 2018, 42, 60–62. [Google Scholar] [CrossRef]
  10. Ke, X.Z.; Liang, H.L. Airborne Laser Communication System with Automated Tracking. Int. J. Opt. 2021, 2021, 9920368. [Google Scholar] [CrossRef]
  11. Tu, B.; Liu, L.; Liu, Y.; Jin, Y.; Tang, J. Acquisition probability analysis of ultra-wide FOV acquisition scheme in optical links under impact of atmospheric turbulence. Appl. Opt. 2013, 52, 3147–3155. [Google Scholar] [CrossRef] [PubMed]
  12. Ma, X. Spatial acquisition scheme with ultrawide FOV for atmospheric optical links: Based on a fish-eye lens and a sinusoidal amplitude grating. Appl. Opt. 2015, 54, 4135–4146. [Google Scholar] [CrossRef]
  13. Chen, T.; Liu, L.; Tu, B.; Zheng, Z.; Hu, W. High-Spatial-Diversity Imaging Receiver Using Fisheye Lens for Indoor MIMO VLCs. IEEE Photonics Technol. Lett. 2014, 26, 2260–2263. [Google Scholar] [CrossRef]
  14. Hua, Y.; Xiong, J.; Gao, Y.; Zhang, H.; Yang, X.; Zhang, Y.; Cai, C.; Wang, L.; Li, Y.; Xu, J. Fisheye lens-based UWOC system with an FOV of ±90°. Opt. Express 2023, 31, 26888–26897. [Google Scholar] [CrossRef] [PubMed]
  15. Yang, S.J.; Ke, X.Z.; Wu, J.L.; Liu, X.G. Fast Alignment of Wireless Optical Communication Using Two-Dimensional Mirror. Chin. J. Lasers 2022, 49, 101–114. [Google Scholar] [CrossRef]
  16. Xue, P.Y.; Wu, Y.; Feng, Q.; Li, C. Design of the large field optical system for four-quadrant detecting. Chin. Opt. 2014, 7, 462–468. [Google Scholar] [CrossRef]
Figure 1. Schematic Diagram of Wireless Optical Communication Auto-Alignment System.
Photonics 11 00344 g001
Figure 2. Simplified Model of Fisheye Lens.
Photonics 11 00344 g002
Figure 3. Optical System of Convex Lens.
Photonics 11 00344 g003
Figure 4. Point Array Diagram of Convex Lens.
Photonics 11 00344 g004
Figure 5. Footprint Map of Convex Lens.
Photonics 11 00344 g005
Figure 6. Geometric Circle Energy Diagram of Convex Lens.
Photonics 11 00344 g006
Figure 7. Optical System of Fisheye Lens.
Photonics 11 00344 g007
Figure 8. Point Array Diagram of Fisheye Lens.
Photonics 11 00344 g008
Figure 9. Footprint Map of Fisheye Lens.
Photonics 11 00344 g009
Figure 10. Geometric Circle Energy Diagram of Fisheye Lens.
Photonics 11 00344 g010
Figure 11. Non-sequential Mode Optical Path Simulation Model.
Photonics 11 00344 g011
Figure 12. Spatial Distribution of Light Spots Passing through a Fisheye Lens within a 0° Field of View.
Photonics 11 00344 g012
Figure 13. Spatial Distribution of Light Spots Passing through a Fisheye Lens within a 20° Field of View.
Photonics 11 00344 g013
Figure 14. Spatial Distribution of Light Spots Passing through a Fisheye Lens within a 40° Field of View.
Photonics 11 00344 g014
Figure 15. Spatial Distribution of Light Spots Passing through a Fisheye Lens within a 60° Field of View.
Photonics 11 00344 g015
Figure 16. Experimental and Test Diagrams.
Photonics 11 00344 g016
Figure 17. Sum-to-difference Ratio Amplitude Obtained Experimentally.
Photonics 11 00344 g017
Figure 18. Experimental Schematic Diagram.
Photonics 11 00344 g018
Figure 19. Voltage Output Values of Four Quadrants of the Four Quadrant Detector during the Tracking Process.
Photonics 11 00344 g019
Figure 20. (a) X-axis Tracking Error; (b) Y-axis Tracking Error; (c) Statistical Value of X-axis Tracking Error; (d) Y-axis Tracking Error Statistics.
Photonics 11 00344 g020
Figure 21. (a) Power Received by the Detector; (b) Power Statistics.
Photonics 11 00344 g021
Figure 22. Experimental Signal Waveform. (a) Transmission Signal Waveform; (b) Received Signal Waveform.
Photonics 11 00344 g022
Figure 23. Eye View of Received Signal.
Photonics 11 00344 g023
Table 1. Parameter Design of Wireless Optical Communication Auto-Alignment System.
ParameterValue
Transmitting power35 (mW)
Wavelength650 (nm)
Transfer rate4 (Gbit/s)
APD responsivity0.35 (A/W)
Two-dimensional reflector±90° @Azimuth
360° @Pitch angle
Table 2. Experimental Equipment and Parameters.
Experimental EquipmentMain Parameter
LaserWavelength: 650 (nm)
Power: 35 (mW)
Signal modulatorModulation mode: OOK modulation
Modulation bandwidth: 0~20 (Mhz)
Transmitting antennaType: Maksutov–Cassegrain telescope
Aperture: 105 (mm)
Two-dimensional reflectorMirror diameter: 60 (mm)
Modulation range: ±90° @Azimuth
360° @Pitch angle
QDPhotosensitive surface diameter: 5.05 (mm)
Response time: 13 (ns)
PhotodetectorType: InGaAs
Response frequency: 30 (kHz)~1.5 (GHz)
Disclaimer/Publisher’s Note: The statements, opinions and data contained in all publications are solely those of the individual author(s) and contributor(s) and not of MDPI and/or the editor(s). MDPI and/or the editor(s) disclaim responsibility for any injury to people or property resulting from any ideas, methods, instructions or products referred to in the content.

