Communication

Utility of Low-Cost Multichannel Data Acquisition System for Photoacoustic Computed Tomography

Richard and Loan Hill Department of Biomedical Engineering, University of Illinois Chicago, Chicago, IL 60607, USA
*
Author to whom correspondence should be addressed.
Photonics 2025, 12(4), 385; https://doi.org/10.3390/photonics12040385
Submission received: 17 January 2025 / Revised: 7 April 2025 / Accepted: 9 April 2025 / Published: 16 April 2025
(This article belongs to the Special Issue Recent Advances in 3D Optical Measurement)

Abstract

:
Typically, multi-single-element photoacoustic computed tomography (PACT) systems utilize numerous ultrasound transducers arranged in cylindrical or hemispherical configurations for detection, combined with a single diffuse light source or multiple sparse light sources to illuminate the imaging target. While these systems produce high-quality 3D PA images, they require complex, multi-channel data acquisition (DAQ) systems to acquire data from all transducers. These DAQ systems are often bulky and expensive, significantly limiting the clinical translation of PACT systems for patient care. In this study, we evaluated the feasibility of using a compact and cost-effective Texas Instruments analog front-end DAQ module for multi-single-element PACT systems. By imaging a simple 3D phantom, we demonstrated the capability of this affordable DAQ board, with reconstructed images showing promise for practical and economical solutions in PACT systems. This advancement paves the way for broader applications of PACT in both research and clinical settings.

1. Introduction

Photoacoustic tomography (PAT), a popular hybrid imaging technique, has been extensively used in biomedical applications for the last two decades [1,2,3,4,5,6,7,8,9,10,11,12,13,14,15,16,17,18,19,20,21]. Specifically, due to the combination of the technological advances of both the optical and ultrasound imaging, i.e., the high intrinsic contrast of optical imaging and the spatial resolution of ultrasound imaging, PAT has overcome several challenges of existing medical imaging techniques [22,23,24,25,26]. Typically in PAT, the imaging target is illuminated by a nanosecond pulsed laser at a specific wavelength and the absorption of the optical energy results in the generation of internal acoustic pressure waves in the ultrasound range via the thermo-acoustic effect [24,27,28]. These ultrasound pressure waves propagate through the surrounding tissue medium and are subsequently detected by wide-band ultrasonic transducers that are coupled to the tissue medium. The detected photoacoustic signal is captured using a data acquisition unit and processed for image reconstruction [29,30,31,32,33,34,35,36,37].
PA imaging is typically implemented in one of the two primary configurations: photoacoustic microscopy (PAM), optimized for high-resolution imaging of superficial tissues within a small field-of-view (FOV), and photoacoustic computed tomography (PACT), designed for wide FOV deep-tissue imaging applications. In PACT, depending on the physical arrangement and scanning mechanism of either a single-element or an array transducer, a 3D volumetric image is obtained. One such configuration of PACT is hemispherical PAT (hPACT), where single-element transducers [15,38,39,40,41] or array transducers are strategically positioned on a hemispherical platform [42,43,44,45,46] and data acquired from these transducers are used to reconstruct a 3D image. hPACT systems have been used extensively, especially in oncology and neurology applications [24,25,26,27,28,29,30].
Recently, single-element PACT systems have gained popularity due to their cost-effectiveness and compact design. However, the quality of images reconstructed from single-element PACT systems is directly dependent on the number of single-element ultrasound transducers used. Greater numbers of transducers result in a larger acoustic aperture, broader view angle, and reduced limited view problem, leading to enhanced resolution and signal-to-noise ratio. Therefore, to accommodate acquisition from a large number of view angles, a multi-channel data acquisition unit (DAQ) is needed. However, such DAQs are very expensive and deter the overall advancement of single-element PACT systems for clinical applications. Some popular single-element DAQs used in PACT application are: 4 channel 200 MS/s DAQ (GaGe CSE1642, Vitrek Corporation, Poway, CA, USA) [47], costing ~$12,000 USD; 16 channel 250 MS/s DAQ (NI PXIe-5170R, National Instruments, Austin, TX, USA) [48], costing ~$50,000 USD; and 32 channel 80 Mhz DAQ (Flash ADC, PhotoSound, Houston, TX, USA) [49], costing ~$25,000 USD. Although a lot of work has been done to make single PACT systems low-cost by introducing motorized scanning, not a lot of work has been done in decreasing the cost of DAQs used.
Here, we demonstrate the utility of a compact, cost-effective analog front-end data acquisition board from Texas Instruments in multi-single-element PACT systems, specifically used to implement a 30-element hPACT system, offering a potential alternative to expensive data acquisition counterparts. The primary objective of this study is to empirically evaluate the feasibility of employing this affordable DAQ for capturing photoacoustic signals, which has been done using 30 single-element transducers simultaneously. Initially, comprehensive information about the system setup and data acquisition framework is provided. Following that, we showcased the imaging outcomes obtained from our 30-element compact hPACT system. Finally, we performed a comparative analysis among the most popularly utilized DAQ/imaging systems and the DAQ utilized in PACT systems in terms of size, cost, features, and performance. We also discuss the potential of such low-cost and compact systems as an alternative to the existing PACT imaging systems.

2. Materials and Methods

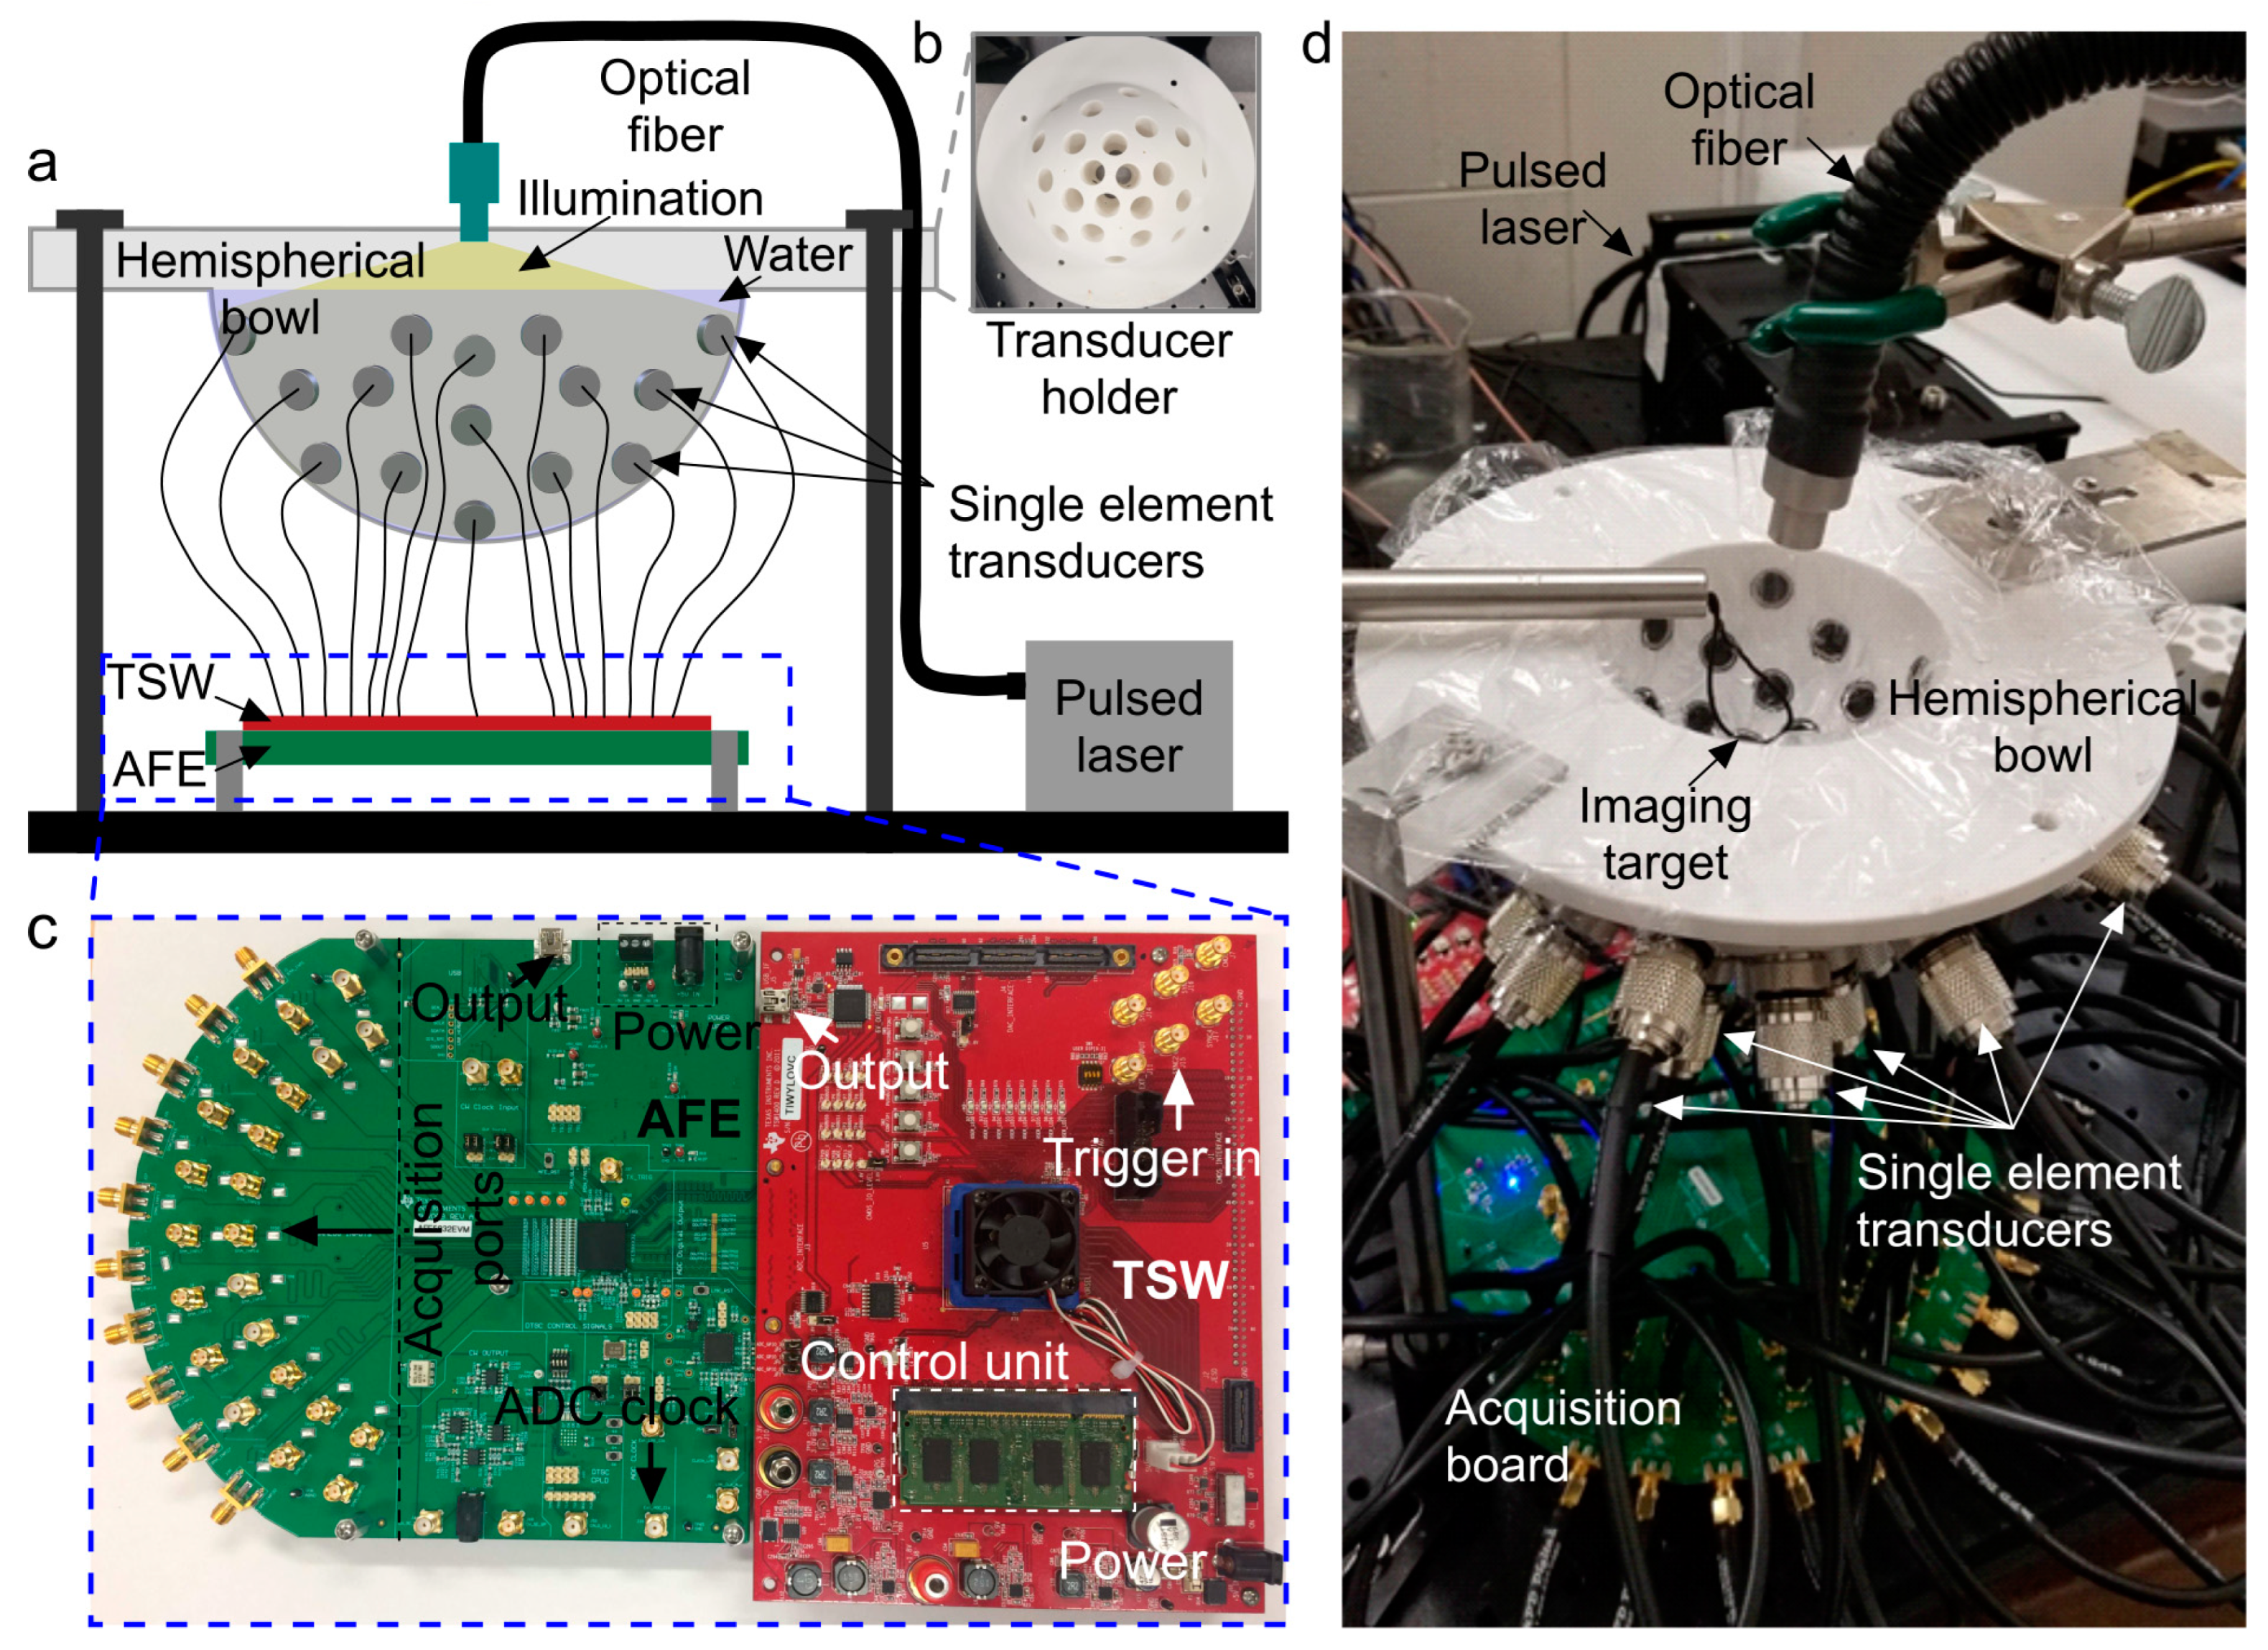
2.1. PACT System Setup

A Q-switched Nd:YAG laser (NL231-50-SH, EKSPLA, Vilnius, Lithuania) with a pulse width of ~5 ns and a pulse repetition rate of 10 Hz was used at 532 nm wavelength. The laser output was coupled to a 10 mm core diameter plastic PMMA optical fiber (epef-10, Ever Heng Optical Co., Shenzhen, China) to illuminate the imaging target from the top (as shown in Figure 1a). The output laser energy was measured at 32 mJ/cm2 using an energy meter (QE12SP-H-MT-D0, Gentec-EO, Quebec, QC, Canada). However, considering the light divergence and attenuation due to the distance between the optical fiber and the imaging target, we calculated the light energy onto the sample to be ~19.1 mJ/cm2, which is below the ANSI limit [50]. The optical fiber was held in place by optical rods and positioned at the geometric center of the 3D-printed hemispherical holder to illuminate the target with maximum uniformity (Figure 1a). The energy loss in the optical fiber was measured to be ~30% and the optical fiber was precisely positioned to maximize illumination uniformity across the imaging target. The dome-shaped hemispherical detection system was built to accommodate 30 single-element transducers (diameter: 6 mm center frequency: 2.25 MHz, bandwidth: 66.73%) from (Centrascan C306, Olympus NDT, Waltham, MA, USA). These transducers were evenly placed in a spiral pattern to create a sparse array and capture data to reconstruct 3D images of the target placed within the field of view in stationary mode, as depicted in Figure 1a,b. A black copper wire (Adafruit Industries LLC, New York, NY, USA) was shaped into a loop configuration, forming a three-dimensional imaging target with an approximate height of 3 cm for the hemispherical system. The photoacoustic signals received by each transducer were acquired, processed, and stored by a compact DAQ from Texas Instruments, Dallas, TX, USA.

2.2. Low-Cost Data Acquisition Framework:

The DAQ framework for capturing PA signals from a 30-element hPACT) system is built around two key evaluation modules (EVMs): the AFE5832EVM (module 1) and the TSW14J56EVM (module 2) from Texas Instruments, Dallas, TX, USA. The AFE5832EVM, a high-speed 12-bit analog-to-digital converter (ADC) from Texas Instruments, supports up to 32 analog channels simultaneously and it digitizes raw signals from each transducer with a sampling rate of 40 MS/s. Additionally, the module amplifies signals with an internal gain of 51 dB and operates on a 5 V, 2A DC power supply. The TSW14J56EVM, another Texas Instruments module, serves as a versatile evaluation platform for testing and analyzing high-speed data converters like the AFE5832EVM. It captures data through JESB204B interfaces and processes it using an Altera Stratix IV FPGA, de-serializing and formatting the signals before storing them in an onboard 1 GB DDR memory capable of holding up to 512 M 16-bit samples. Data is then transferred to a host PC via a USB-to-SPI interface for further analysis. The TSW14J56EVM also generates high-quality clock signals, which are synchronized with the ADC module, operating at four times the desired sampling rate (40 MS/s) and supporting a maximum frequency of 160 MHz. Its GUI (HSDC Pro) simplifies configuration and troubleshooting, providing real-time updates on connection status and data capture. Both modules are connected through a JESD204B interface for high-speed data transfer, forming a cost-effective and user-friendly DAQ solution. The key functions and roles of these two modules, working in synchrony to acquire signals, are shown in Figure 2a.
The detailed system setup is illustrated in Figure 2a. Both the modules have their own Graphical user interface (GUI). These GUIs prompt the user about any connection issues and data capture completion. Briefly, a power supply with 5 V and maximum 2A (DC power supply, Stony Labs, NY, USA) was used to power up the two evaluation module (EVM) boards. A two-channel function generator (ATF20B, ATTEN instruments, Grand Island, NY, USA) was used to provide 3.3 V of 10 Hz and trigger the signal to module 1. The USB interface on module 1 was used to connect the data acquisition unit to the host PC. The acquired signal was amplified by internal ADC amplifiers with a gain of 51 dB. The firing of the laser and the data acquisition are all synchronized by a function generator, shown in Figure 2.

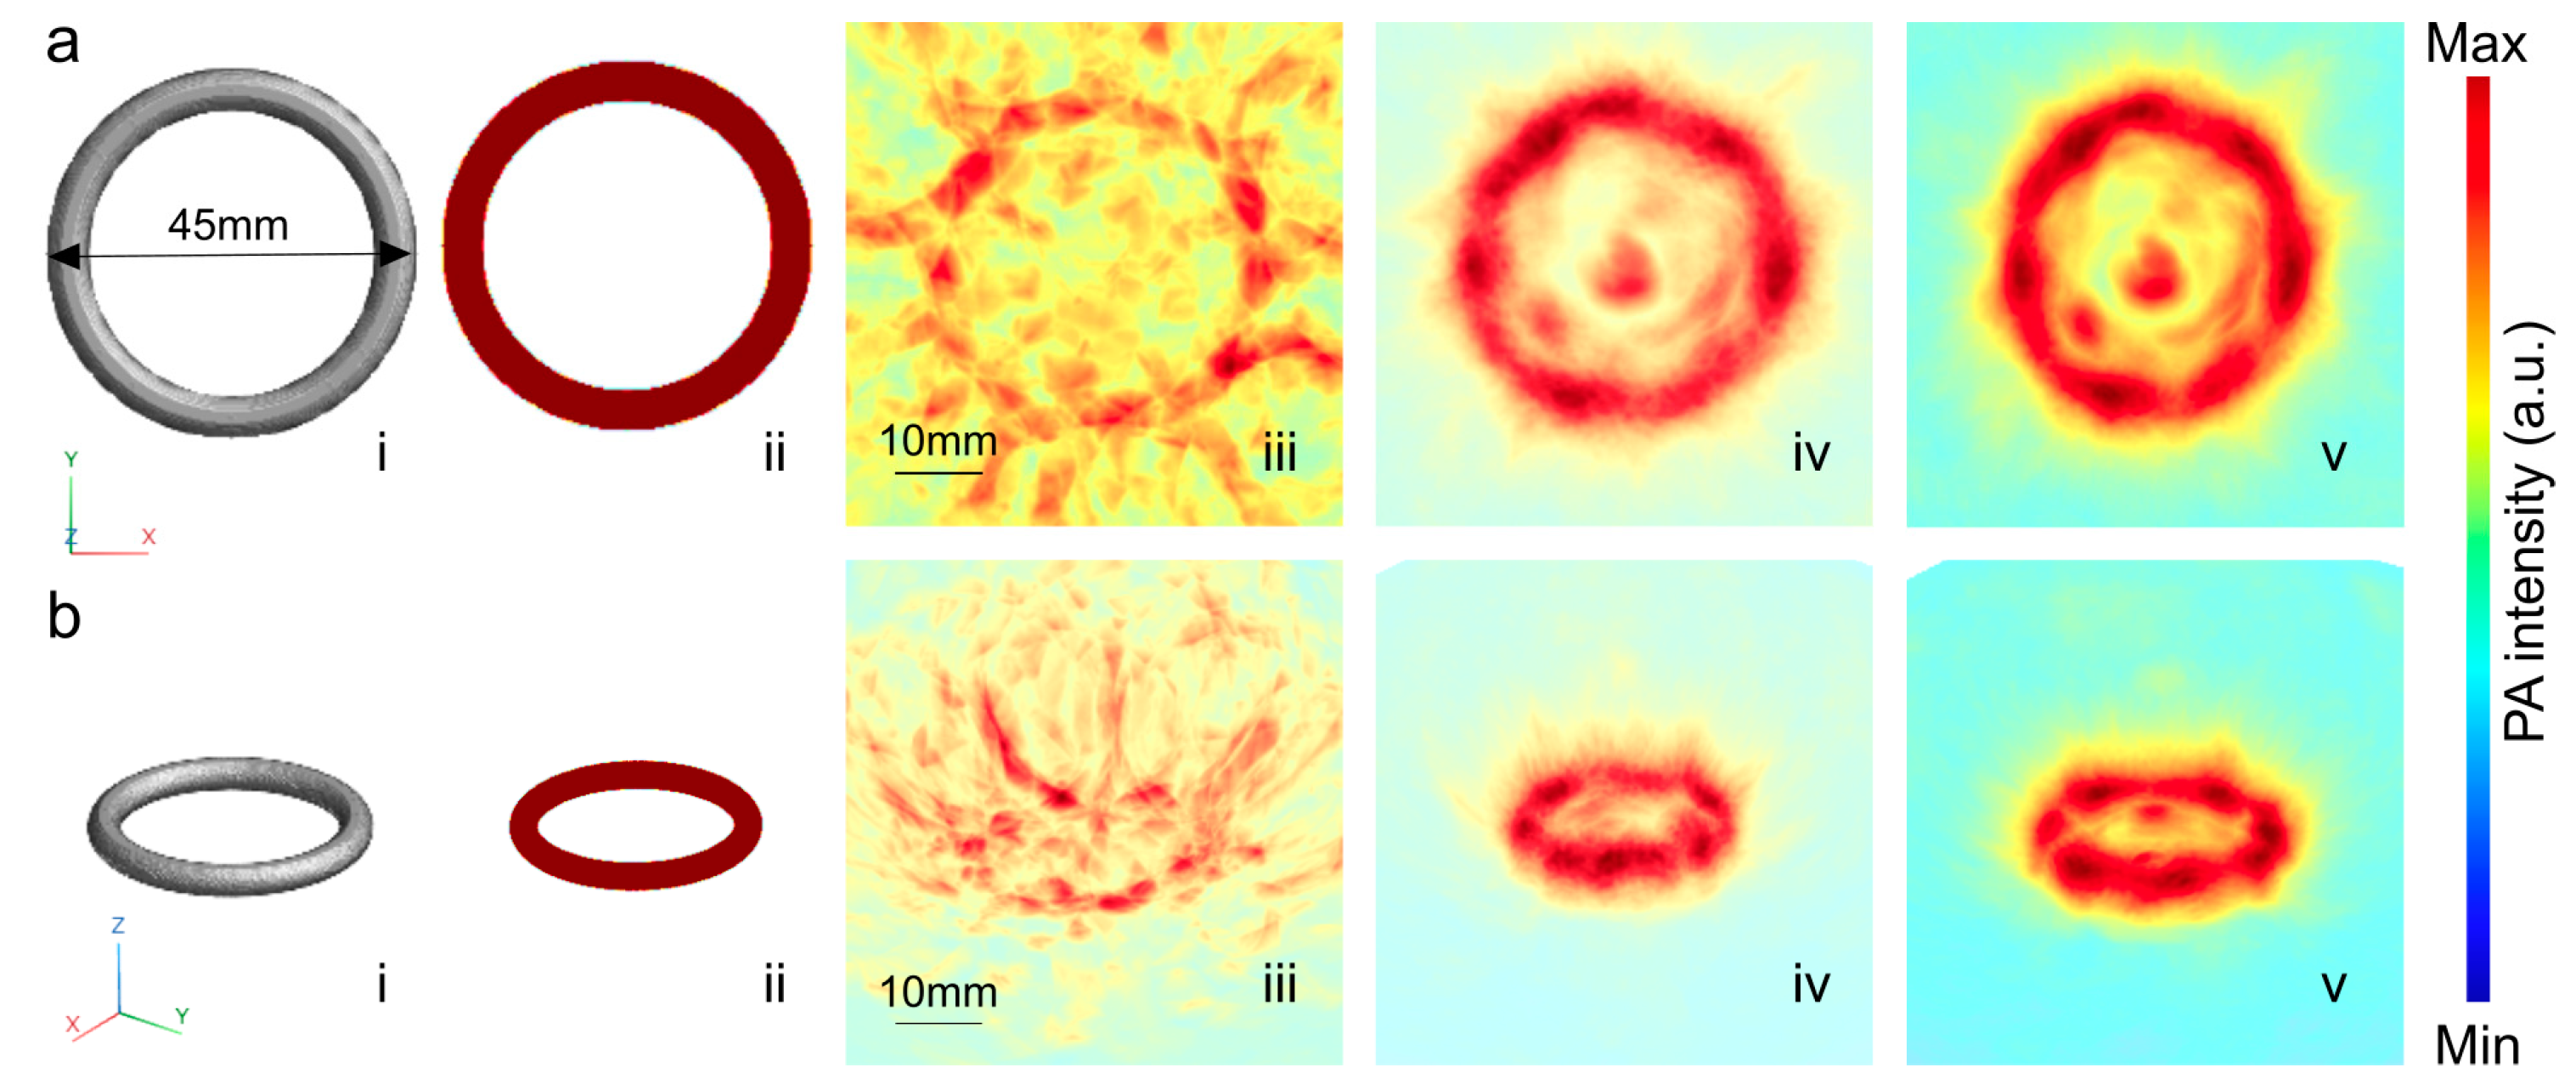
3. Results and Discussion

In this study, we utilized a compact low-cost DAQ framework to acquire signals from our 30 single-element hPACT. The signals are acquired from a circular loop imaging target and a 3D dimensional image is reconstructed. Data collection took place simultaneously from 30 distinct positions across the hemispherical area using ultrasound transducers. The PA signals from four randomly chosen transducers (1, 7, 16, and 25) are shown in Figure 3a.
The noise introduced from the DAQ was calculated from the A-scan data and a minimum SNR was calculated to be 41.54 dB. The average SNR value was obtained to be 46.10 dB and the total time to complete the acquisition process is 100 ms.
For 3D image reconstruction, we employed the conventional time-reversal algorithm [51,52]. The side view of the 3D reconstructed image, obtained using 30 elements, is shown in Figure 3b. While the imaging object is discernible, the reconstruction also exhibits artifacts caused by two primary factors. First, the limited angular coverage of the acquired data leads to incomplete information, introducing artifacts into the reconstructed image. Second, the time-reversal algorithm itself, when applied within the constraints of restricted view angles, may further contribute to image distortions or inaccuracies. To address these challenges, we investigated the impact of additional viewing angles by introducing virtual detection points distributed across the surface of a hemisphere and assigning PA signals to these points. The PA signal for each virtual point was generated through a weighted interpolation of signals from the four nearest actual detection elements (30 elements). Specifically, we calculated the distance between the virtual point and each of its four nearest neighbors, assigned weights based on these distances, and computed the weighted average of the recorded PA signals.
Figure 3c,d illustrate side views of the reconstructed 3D images using 480 and 780 virtual detection points, respectively. The selection of 480 and 780 virtual points was guided by a trade-off between computational feasibility and the goal of achieving a more uniform angular coverage of the imaging region. These numbers were chosen to provide a relatively dense and hemispherically distributed set of virtual detection points that significantly improve spatial sampling over the original 30-element configuration. Specifically, 480 and 780 points correspond to approximately 16× and 26× increases in sampling density, respectively, which we hypothesized would allow a better approximation of a fully sampled hemispherical detection geometry. The distribution of these virtual points was performed uniformly across the hemisphere surface to mimic a more ideal detection scenario. Increasing the number of virtual points enhanced the clarity of the image. Additional experiments with higher numbers of virtual transducers yielded no significant improvements in the reconstructed image. To demonstrate the impact of virtual points on the reconstructed image, we conducted a simulation comparing reconstructions using only 30 real transducers (placed at the same locations as in the actual experiment) and those incorporating virtual points. In these simulations, we utilized the k-Wave MATLAB R2024a toolbox [53] to model acoustic wave propagation. The computational domain was configured as a 900 × 900 × 900 grid, with each voxel measuring 100 µm per side. Each transducer was modeled as a single-point transducer, and the medium was assumed to be homogeneous with a sound speed of 1500 m/s, approximating the acoustic properties of water. Figure 4a,b illustrate the top and angled views of the ring-shaped phantom. The phantom and its initial pressure distribution are shown in Figure 4(i,ii), while the reconstructed images using 30 real elements, 480 virtual elements, and 780 virtual elements are presented in Figure 4(iii–v), respectively. As shown, the use of virtual points significantly enhances the image clarity.
These initial results highlight the effectiveness of our low-cost DAQ framework in capturing 3D images from complex systems, such as our 30-element hPACT system. By integrating this cost-efficient DAQ system with hPACT, we unlock a wide range of potential applications in clinical settings. These include breast cancer imaging, detection of traumatic brain injury, neonatal brain hemorrhage diagnosis, and other neurological conditions. The ability to deploy affordable DAQ systems in these contexts also facilitates the clinical translation of advanced imaging technologies, paving the way for more accessible, cost-effective diagnostic tools in medical practice.
We compared the key features and costs of several commonly used DAQ systems in photoacoustic imaging with the low-cost DAQ modules we implemented. The results of this comparison are summarized in Table 1.

4. Conclusions

In this study, we successfully demonstrated the use of compact, cost-effective data acquisition modules (AFE5832EVM and TSW14J56EVM) from Texas Instruments in a multi-single-element PACT system. By utilizing a 30-element HPAT setup, we were able to acquire adequate PA signals and reconstruct 3D images from a simple imaging target. The system achieved an average SNR of 46.10 dB, with the acquisition process completed in just 100 ms. Although the reconstruction exhibited some artifacts due to limited angular coverage, these were mitigated by employing virtual detection points, which enhanced image intensity. This work highlights the potential for compact, low-cost DAQ solutions to serve as viable alternatives to expensive multi-channel systems in PACT applications. The demonstrated affordability, simplicity, and promising image quality of this approach pave the way for broader clinical and research applications of PACT. Future advancements could focus on synchronizing more boards together to increase the channel count, reducing artifacts further, optimizing image reconstruction algorithms, and expanding the versatility of low-cost DAQ solutions for deeper tissue imaging.

Author Contributions

Conceptualization, M.Z., R.M., S.M.R. and K.A.; methodology, M.Z., R.M. and S.M.R.; software, M.Z., R.M. and S.M.R.; validation, M.Z., R.M. and K.A.; formal analysis, M.Z., R.M., S.M.R. and K.A.; investigation, M.Z., R.M., S.M.R. and K.A.; writing—original draft preparation, M.Z., R.M. and S.M.R.; writing—review and editing, M.Z., R.M., S.M.R. and K.A.; visualization, M.Z. and R.M.; supervision, K.A.; funding acquisition, K.A. All authors have read and agreed to the published version of the manuscript.

Funding

This research was funded by the National Institutes of Health grants, R01EB0278769 and R01EB028661.

Data Availability Statement

Data can be provided by the authors upon reasonable request.

Conflicts of Interest

The authors declare no conflicts of interest.

References

  1. Zhang, E.Z.; Povazay, B.; Laufer, J.; Alex, A.; Hofer, B.; Pedley, B.; Glittenberg, C.; Treeby, B.; Cox, B.; Beard, P.; et al. Multimodal photoacoustic and optical coherence tomography scanner using an all optical detection scheme for 3D morphological skin imaging. Biomed. Opt. Express 2011, 2, 2202–2215. [Google Scholar] [CrossRef]
  2. Chen, Z.; Rank, E.; Meiburger, K.M.; Sinz, C.; Hodul, A.; Zhang, E.; Hoover, E.; Minneman, M.; Ensher, J.; Beard, P.C.; et al. Non-invasive multimodal optical coherence and photoacoustic tomography for human skin imaging. Sci. Rep. 2017, 7, 17975. [Google Scholar] [CrossRef] [PubMed]
  3. Xu, D.; Yang, S.; Wang, Y.; Gu, Y.; Xing, D. Noninvasive and high-resolving photoacoustic dermoscopy of human skin. Biomed. Opt. Express 2016, 7, 2095–2102. [Google Scholar] [CrossRef] [PubMed]
  4. Kratkiewicz, K.; Manwar, R.; Rajabi-Estarabadi, A.; Fakhoury, J.; Meiliute, J.; Daveluy, S.; Mehregan, D.; Avanaki, K. Photoacoustic/ultrasound/optical coherence tomography evaluation of melanoma lesion and healthy skin in a Swine model. Sensors 2019, 19, 2815. [Google Scholar] [CrossRef] [PubMed]
  5. Olds, H.; Mehregan, D.; Kratiewicz, K.; Manwar, R.; Xu, Q.; Reddy, S.; Mahmoodkayayeh, S.; Avanaki, K. Is photoacoustic imaging clinically safe: Evaluation of possible thermal damage due to laser-tissue interaction. In Medical Student Research Symposium; Wayne State University: Detroit, MI, USA, 2020; Available online: https://digitalcommons.wayne.edu/som_srs/56 (accessed on 8 April 2025).
  6. Ermilov, S.A.; Khamapirad, T.; Conjusteau, A.; Leonard, M.H.; Lacewell, R.; Mehta, K.; Miller, T.; Oraevsky, A. Laser optoacoustic imaging system for detection of breast cancer. J. Biomed. Opt. 2009, 14, 024007. [Google Scholar] [CrossRef]
  7. Copland, J.A.; Eghtedari, M.; Popov, V.L.; Kotov, N.; Mamedova, N.; Motamedi, M.; Oraevsky, A.A. Bioconjugated gold nanoparticles as a molecular based contrast agent: Implications for imaging of deep tumors using optoacoustic tomography. Mol. Imaging Biol. 2004, 6, 341–349. [Google Scholar] [CrossRef]
  8. Manohar, S.; Vaartjes, S.E.; van Hespen, J.C.G.; Klaase, J.M.; Engh, F.M.v.D.; Steenbergen, W.; van Leeuwen, T.G. Initial results of in vivo non-invasive cancer imaging in the human breast using near-infrared photoacoustics. Opt. Express 2007, 15, 12277–12285. [Google Scholar] [CrossRef]
  9. Mallidi, S.; Luke, G.P.; Emelianov, S. Photoacoustic imaging in cancer detection, diagnosis, and treatment guidance. Trends Biotechnol. 2011, 29, 213–221. [Google Scholar] [CrossRef]
  10. Oraevsky, A.A.; Karabutov, A.A.; Solomatin, S.V.; Savateeva, E.V.; Andreev, V.A.; Gatalica, Z.; Singh, H.; Fleming, R.D. Laser optoacoustic imaging of breast cancer in vivo. In Proceedings of the BiOS 2001 the International Symposium on Biomedical Optics, San Jose, CA, USA, 15 June 2001; International Society for Optics and Photonics: Bellingham, WA, USA, 2001. [Google Scholar]
  11. Li, M.-L.; Oh, J.-T.; Xie, X.; Ku, G.; Wang, W.; Li, C.; Lungu, G.; Stoica, G.; Wang, L.V. Simultaneous Molecular and Hypoxia Imaging of Brain Tumors In Vivo Using Spectroscopic Photoacoustic Tomography. Proc. IEEE 2008, 96, 481–489. [Google Scholar] [CrossRef]
  12. Nie, L.; Cai, X.; Maslov, K.; Garcia-Uribe, A.; Anastasio, M.A.; Wang, L.V. Photoacoustic tomography through a whole adult human skull with a photon recycler. J. Biomed. Opt. 2012, 17, 110506. [Google Scholar] [CrossRef]
  13. Ranjbaran, S.M.; Zafar, M.; Saint-Martin, L.; Islam, T.; Avanaki, K. A practical solution to improve the field of view in circular scanning-based photoacoustic tomography. J. Biophotonics 2024, 17, e202400125. [Google Scholar] [CrossRef] [PubMed]
  14. Ranjbaran, S.M.; Kratkiewicz, K.; Manwar, R.; Avanaki, K. Line Illumination in Linear Array Photoacoustic Imaging Using a Powell Lens: A Proof-of-Concept Study. Photonics 2024, 11, 288. [Google Scholar] [CrossRef]
  15. Kratkiewicz, K.; Manwar, R.; Zafar, M.; Ranjbaran, S.M.; Mozaffarzadeh, M.; de Jong, N.; Ji, K.; Avanaki, K. Development of a stationary 3D photoacoustic imaging system using sparse single-element transducers: Phantom study. Appl. Sci. 2019, 9, 4505. [Google Scholar] [CrossRef]
  16. Kratkiewicz, K.; Manwar, R.; Zhou, Y.; Mozaffarzadeh, M.; Avanaki, K. Technical considerations in the Verasonics research ultrasound platform for developing a photoacoustic imaging system. Biomed. Opt. Express 2021, 12, 1050–1084. [Google Scholar] [CrossRef]
  17. Manwar, R.; Lara, J.B.; Prakash, R.; Ranjbaran, S.M.; Avanaki, K. Randomized multi-angle illumination for improved linear array photoacoustic computed tomography in brain. J. Biophotonics 2022, 15, e202200016. [Google Scholar] [CrossRef] [PubMed]
  18. Manwar, R.; Li, X.; Mahmoodkalayeh, S.; Asano, E.; Zhu, D.; Avanaki, K. Deep learning protocol for improved photoacoustic brain imaging. J. Biophotonics 2020, 13, e202000212. [Google Scholar] [CrossRef]
  19. Mozaffarzadeh, M.; Mahloojifar, A.; Orooji, M.; Adabi, S.; Nasiriavanaki, M. Double-stage delay multiply and sum beamforming algorithm: Application to linear-array photoacoustic imaging. IEEE Trans. Biomed. Eng. 2017, 65, 31–42. [Google Scholar] [CrossRef] [PubMed]
  20. Nasiriavanaki, M.; Xia, J.; Wan, H.; Bauer, A.Q.; Culver, J.P.; Wang, L.V. High-resolution photoacoustic tomography of resting-state functional connectivity in the mouse brain. Proc. Natl. Acad. Sci. USA 2013, 111, 21–26. [Google Scholar] [CrossRef]
  21. Saint-Martin, L.; Prakash, R.; Ranjbaran, S.M.; Manwar, R.; Avanaki, K. Study of Aberrations in Transcranial Photoacoustic Imaging Using μCT images of Skull: A Simulation Study. IEEE Sens. J. 2025. [Google Scholar] [CrossRef]
  22. Wang, L.V. Tutorial on photoacoustic microscopy and computed tomography. IEEE J. Sel. Top. Quantum Electron. 2008, 14, 171–179. [Google Scholar] [CrossRef]
  23. Hariri, A.; Fatima, A.; Mohammadian, N.; Mahmoodkalayeh, S.; Ansari, M.A.; Bely, N.; Avanaki, M.R.N. Development of low-cost photoacoustic imaging systems using very low-energy pulsed laser diodes. J. Biomed. Opt. 2017, 22, 075001. [Google Scholar] [CrossRef] [PubMed]
  24. Kruger, R.A.; Kuzmiak, C.M.; Lam, R.B.; Reinecke, D.R.; Del Rio, S.P.; Steed, D. Dedicated 3D photoacoustic breast imaging. Med Phys. 2013, 40, 113301. [Google Scholar] [CrossRef]
  25. Ku, G.; Wang, L.V. Deeply penetrating photoacoustic tomography in biological tissues enhanced with an optical contrast agent. Opt. Lett. 2005, 30, 507–509. [Google Scholar] [CrossRef]
  26. Chitgupi, U.; Nyayapathi, N.; Kim, J.; Wang, D.; Sun, B.; Li, C.; Carter, K.; Huang, W.-C.; Kim, C.; Xia, J.; et al. Surfactant-Stripped Micelles for NIR-II Photoacoustic Imaging through 12 cm of Breast Tissue and Whole Human Breasts. Adv. Mater. 2019, 31, e1902279. [Google Scholar] [CrossRef] [PubMed]
  27. Lou, Y.; Wang, K.; Oraevsky, A.A.; Anastasio, M.A. Impact of nonstationary optical illumination on image reconstruction in optoacoustic tomography. J. Opt. Soc. Am. A 2016, 33, 2333–2347. [Google Scholar] [CrossRef]
  28. Wang, L.V.; Hu, S. Photoacoustic tomography: In vivo imaging from organelles to organs. Science 2012, 335, 1458–1462. [Google Scholar] [CrossRef]
  29. Gamelin, J.K.; Aguirre, A.; Maurudis, A.; Huang, F.; Castillo, D.; Wang, L.V.; Zhu, Q. Curved array photoacoustic tomographic system for small animal imaging. J. Biomed. Opt. 2008, 13, 024007. [Google Scholar] [CrossRef] [PubMed]
  30. Xia, J.; Chatni, M.R.; Maslov, K.I.; Guo, Z.; Wang, K.; Anastasio, M.A.; Wang, L.V. Whole-body ring-shaped confocal photoacoustic computed tomography of small animals in vivo. J. Biomed. Opt. 2012, 17, 050506. [Google Scholar] [CrossRef]
  31. Xia, J.; Guo, Z.; Maslov, K.I.; Wang, L.V.; Aguirre, A.; Zhu, Q.; Percival, C. Three-dimensional photoacoustic tomography based on the focal-line concept. J. Biomed. Opt. 2011, 16, 090505. [Google Scholar] [CrossRef]
  32. Deán-Ben, X.L.; Fehm, T.F.; Ford, S.J.; Gottschalk, S.; Razansky, D. Spiral volumetric optoacoustic tomography visualizes multi-scale dynamics in mice. Light. Sci. Appl. 2017, 6, e16247. [Google Scholar] [CrossRef]
  33. Li, L.; Zhu, L.; Ma, C.; Lin, L.; Yao, J.; Wang, L.; Maslov, K.; Zhang, R.; Chen, W.; Shi, J.; et al. Single-impulse panoramic photoacoustic computed tomography of small-animal whole-body dynamics at high spatiotemporal resolution. Nat. Biomed. Eng. 2017, 1, 0071. [Google Scholar] [CrossRef] [PubMed]
  34. Merčep, E.; Herraiz, J.L.; Deán-Ben, X.L.; Razansky, D. Transmission–reflection optoacoustic ultrasound (TROPUS) computed tomography of small animals. Light. Sci. Appl. 2019, 8, 18. [Google Scholar] [CrossRef] [PubMed]
  35. Mohammadi, L.; Behnam, H.; Tavakkoli, J.; Avanaki, M.R.N. Skull’s Photoacoustic Attenuation and Dispersion Modeling with Deterministic Ray-Tracing: Towards Real-Time Aberration Correction. Sensors 2019, 19, 345. [Google Scholar] [CrossRef] [PubMed]
  36. Ranjbaran, S.M.; Aghamiry, H.S.; Gholami, A.; Operto, S.; Avanaki, K. Quantitative Photoacoustic Tomography Using Iteratively Refined Wavefield Reconstruction Inversion: A Simulation Study. IEEE Trans. Med Imaging 2023, 43, 874–885. [Google Scholar] [CrossRef]
  37. Prakash, R.; Manwar, R.; Avanaki, K. Evaluation of 10 current image reconstruction algorithms for linear array photoacoustic imaging. J. Biophotonics 2024, 17, e202300117. [Google Scholar] [CrossRef]
  38. Wang, B.; Xiang, L.; Jiang, M.S.; Yang, J.; Zhang, Q.; Carney, P.R.; Jiang, H. Photoacoustic tomography system for noninvasive real-time three-dimensional imaging of epilepsy. Biomed. Opt. Express 2012, 3, 1427–1432. [Google Scholar] [CrossRef]
  39. Wang, B.; Xiao, J.; Jiang, H. Simultaneous real-time 3D photoacoustic tomography and EEG for neurovascular coupling study in an animal model of epilepsy. J. Neural Eng. 2014, 11, 046013. [Google Scholar] [CrossRef]
  40. Ephrat, P.; Roumeliotis, M.; Prato, F.S.; Carson, J.J. Four-dimensional photoacoustic imaging of moving targets. Opt. Express 2008, 16, 21570–21581. [Google Scholar] [CrossRef]
  41. Ephrat, P.; Keenliside, L.; Seabrook, A.; Prato, F.S.; Carson, J.J.L. Three-dimensional photoacoustic imaging by sparse-array detection and iterative image reconstruction. J. Biomed. Opt. 2008, 13, 054052. [Google Scholar] [CrossRef]
  42. Toi, M.; Asao, Y.; Matsumoto, Y.; Sekiguchi, H.; Yoshikawa, A.; Takada, M.; Kataoka, M.; Endo, T.; Kawaguchi-Sakita, N.; Kawashima, M.; et al. Visualization of tumor-related blood vessels in human breast by photoacoustic imaging system with a hemispherical detector array. Sci. Rep. 2017, 7, 41970. [Google Scholar] [CrossRef]
  43. Matsumoto, Y.; Asao, Y.; Yoshikawa, A.; Sekiguchi, H.; Takada, M.; Furu, M.; Saito, S.; Kataoka, M.; Abe, H.; Yagi, T.; et al. Label-free photoacoustic imaging of human palmar vessels: A structural morphological analysis. Sci. Rep. 2018, 8, 786. [Google Scholar] [CrossRef] [PubMed]
  44. Suzuki, Y.; Kajita, H.; Konishi, N.; Oh, A.; Urano, M.; Watanabe, S.; Asao, Y.; Imanishi, N.; Tsuji, T.; Jinzaki, M.; et al. Subcutaneous lymphatic vessels in the lower extremities: Comparison between photoacoustic lymphangiography and near-infrared fluorescence lymphangiography. Radiology 2020, 295, 469–474. [Google Scholar] [CrossRef]
  45. Nagae, K.; Asao, Y.; Sudo, Y.; Murayama, N.; Tanaka, Y.; Ohira, K.; Ishida, Y.; Otsuka, A.; Matsumoto, Y.; Saito, S.; et al. Real-time 3D photoacoustic visualization system with a wide field of view for imaging human limbs. F1000Research 2019, 7, 1813. [Google Scholar] [CrossRef] [PubMed]
  46. Matsumoto, Y.; Asao, Y.; Sekiguchi, H.; Yoshikawa, A.; Ishii, T.; Nagae, K.-I.; Kobayashi, S.; Tsuge, I.; Saito, S.; Takada, M.; et al. Visualising peripheral arterioles and venules through high-resolution and large-area photoacoustic imaging. Sci. Rep. 2018, 8, 14930. [Google Scholar] [CrossRef]
  47. Zafar, M.; McGuire, L.S.; Ranjbaran, S.M.; Matchynski, J.I.; Manwar, R.; Conti, A.C.; Perrine, S.A.; Avanaki, K. Spiral laser scanning photoacoustic microscopy for functional brain imaging in rats. Neurophotonics 2024, 11, 015007. [Google Scholar] [CrossRef]
  48. Zafar, M.; Kratkiewicz, K.; Manwar, R.; Avanaki, M. Development of Low-Cost Fast Photoacoustic Computed Tomography: System Characterization and Phantom Study. Appl. Sci. 2019, 9, 374. [Google Scholar] [CrossRef]
  49. Kirchner, T.; Villringer, C.; Laufer, J. Evaluation of ultrasound sensors for transcranial photoacoustic sensing and imaging. Photoacoustics 2023, 33, 100556. [Google Scholar] [CrossRef] [PubMed]
  50. Laser Institute of America. American National Standard for Safe Use of Lasers; Laser Institute of America: Orlando, FL, USA, 2007. [Google Scholar]
  51. Bossy, E.; Daoudi, K.; Boccara, A.-C.; Tanter, M.; Aubry, J.-F.; Montaldo, G.; Fink, M. Time reversal of photoacoustic waves. Appl. Phys. Lett. 2006, 89, 184108. [Google Scholar] [CrossRef]
  52. Xu, Y.; Wang, L.V. Time reversal in photoacoustic or thermoacoustic tomography. In Photoacoustic Imaging and Spectroscopy; CRC Press: Boca Raton, FL, USA, 2017; pp. 117–120. [Google Scholar]
  53. Treeby, B.E.; Cox, B.T. k-Wave: MATLAB toolbox for the simulation and reconstruction of photoacoustic wave fields. J. Biomed. Opt. 2010, 15, 021314. [Google Scholar] [CrossRef]
  54. Lusk, J.F.; Miranda, C.; Smith, B.S. Ovarian Cancer Detection Using Photoacoustic Flow Cytometry. JoVE 2020, 155, e60279. [Google Scholar] [CrossRef]
  55. Manwar, R.; Islam, T.; Ranjbaran, S.M.; Avanaki, K. Transfontanelle photoacoustic imaging: Ultrasound transducer selection analysis. Biomed. Opt. Express 2022, 13, 676–693. [Google Scholar] [CrossRef] [PubMed]
  56. Zhao, S.; Hartanto, J.; Joseph, R.; Wu, C.-H.; Zhao, Y.; Chen, Y.-S. Hybrid photoacoustic and fast super-resolution ultrasound imaging. Nat. Commun. 2023, 14, 2191. [Google Scholar] [CrossRef] [PubMed]
Figure 1. Visualization of components in a 30-channel hemispherical photoacoustic tomography system. (a) Schematic of the experimental setup using a 30 channel hemispherical photoacoustic tomography system consisting of Nd:YAG laser (532 nm), 3D-printed hemispherical bowl-shaped holder for single transducers, top illumination using optical fiber (10 mm core diameter), evaluation boards- AFE, TSW (EVMs), (b) top view of the 3D-printed hemispherical holder for a single-element transducer, (c) photograph of data acquisition unit that includes module 1: AFE5832EVM (green) and module 2: TSW14J56EVM (red). The blue dashed line encloses the number of channels of the ADC, and the (d) orthogonal view demonstrates the hemispherical PA imaging setup.
Photonics 12 00385 g001
Figure 2. Data acquisition setup overview and connection diagram. (a) The flowchart and key features of DAQ modules used for PA signals acquisition, (b) connections diagram for 30 single-element PACT systems. The laser output is coupled with an optical fiber for top illumination within the hemispherical holder. The generated PA signal is detected by single-element transducers and transferred through dedicated channels on AFE, which is further digitized on TSW. To activate all the channels, a function generator was utilized to control the clock cycle externally. For synchronization, the laser Q-switch and the TSW were triggered by another channel on the function generator. The AFE hardware parameter was set, and the acquired raw data was obtained via manufacturer-provided software/GUI (version: 4.70). DAQ: data acquisition, PA: photoacoustic, PACT: photoacoustic computed tomography.
Photonics 12 00385 g002
Figure 3. Photoacoustic signal acquired by the DAQ and reconstructed image slices. (a) Illustration of acquired data from four randomly chosen single-element transducers (1st, 7th, 16th, and 25th) on the hemispherical holder. The position of these transducers is annotated with a dark blue circle. Side views of the 3D photoacoustic image using (b) 30 real elements, (c) 480 virtual elements, and (d) 780 virtual elements. (i) and (ii) display the reconstructed images with and without the guiding dashed line indicating the object’s location, respectively.
Photonics 12 00385 g003
Figure 4. Simulation results demonstrating the effect of virtual points on image reconstruction quality. (a) Top view and (b) angled view of the ring-shaped phantom. (i) Phantom structure and (ii) corresponding initial pressure distribution. Reconstructed images using (iii) 30 real transducer elements, (iv) 480 virtual elements, and (v) 780 virtual elements.
Photonics 12 00385 g004
Table 1. Cost comparison between different data acquisition systems.
Ref.Data Acquisition
System
No. of
Channels
Resolution
(Bits)
Sampling Rate (MSamples·s−1)Cost
(USD)
[54]PXIe-5170814250~15 k
[16]Vantage 64641462.5~30 k
[55]Legion ADC128–2561240~50 k
[56]Vantage 2562561462.5~70 k
This reportAFE5832 + TSW1400321240<2 k
Disclaimer/Publisher’s Note: The statements, opinions and data contained in all publications are solely those of the individual author(s) and contributor(s) and not of MDPI and/or the editor(s). MDPI and/or the editor(s) disclaim responsibility for any injury to people or property resulting from any ideas, methods, instructions or products referred to in the content.

