
Simultaneous Determination of Purines and Uric Acid in Chinese Chicken Broth Using TFA/FA Hydrolysis Coupled with HPLC-VWD


Abstract
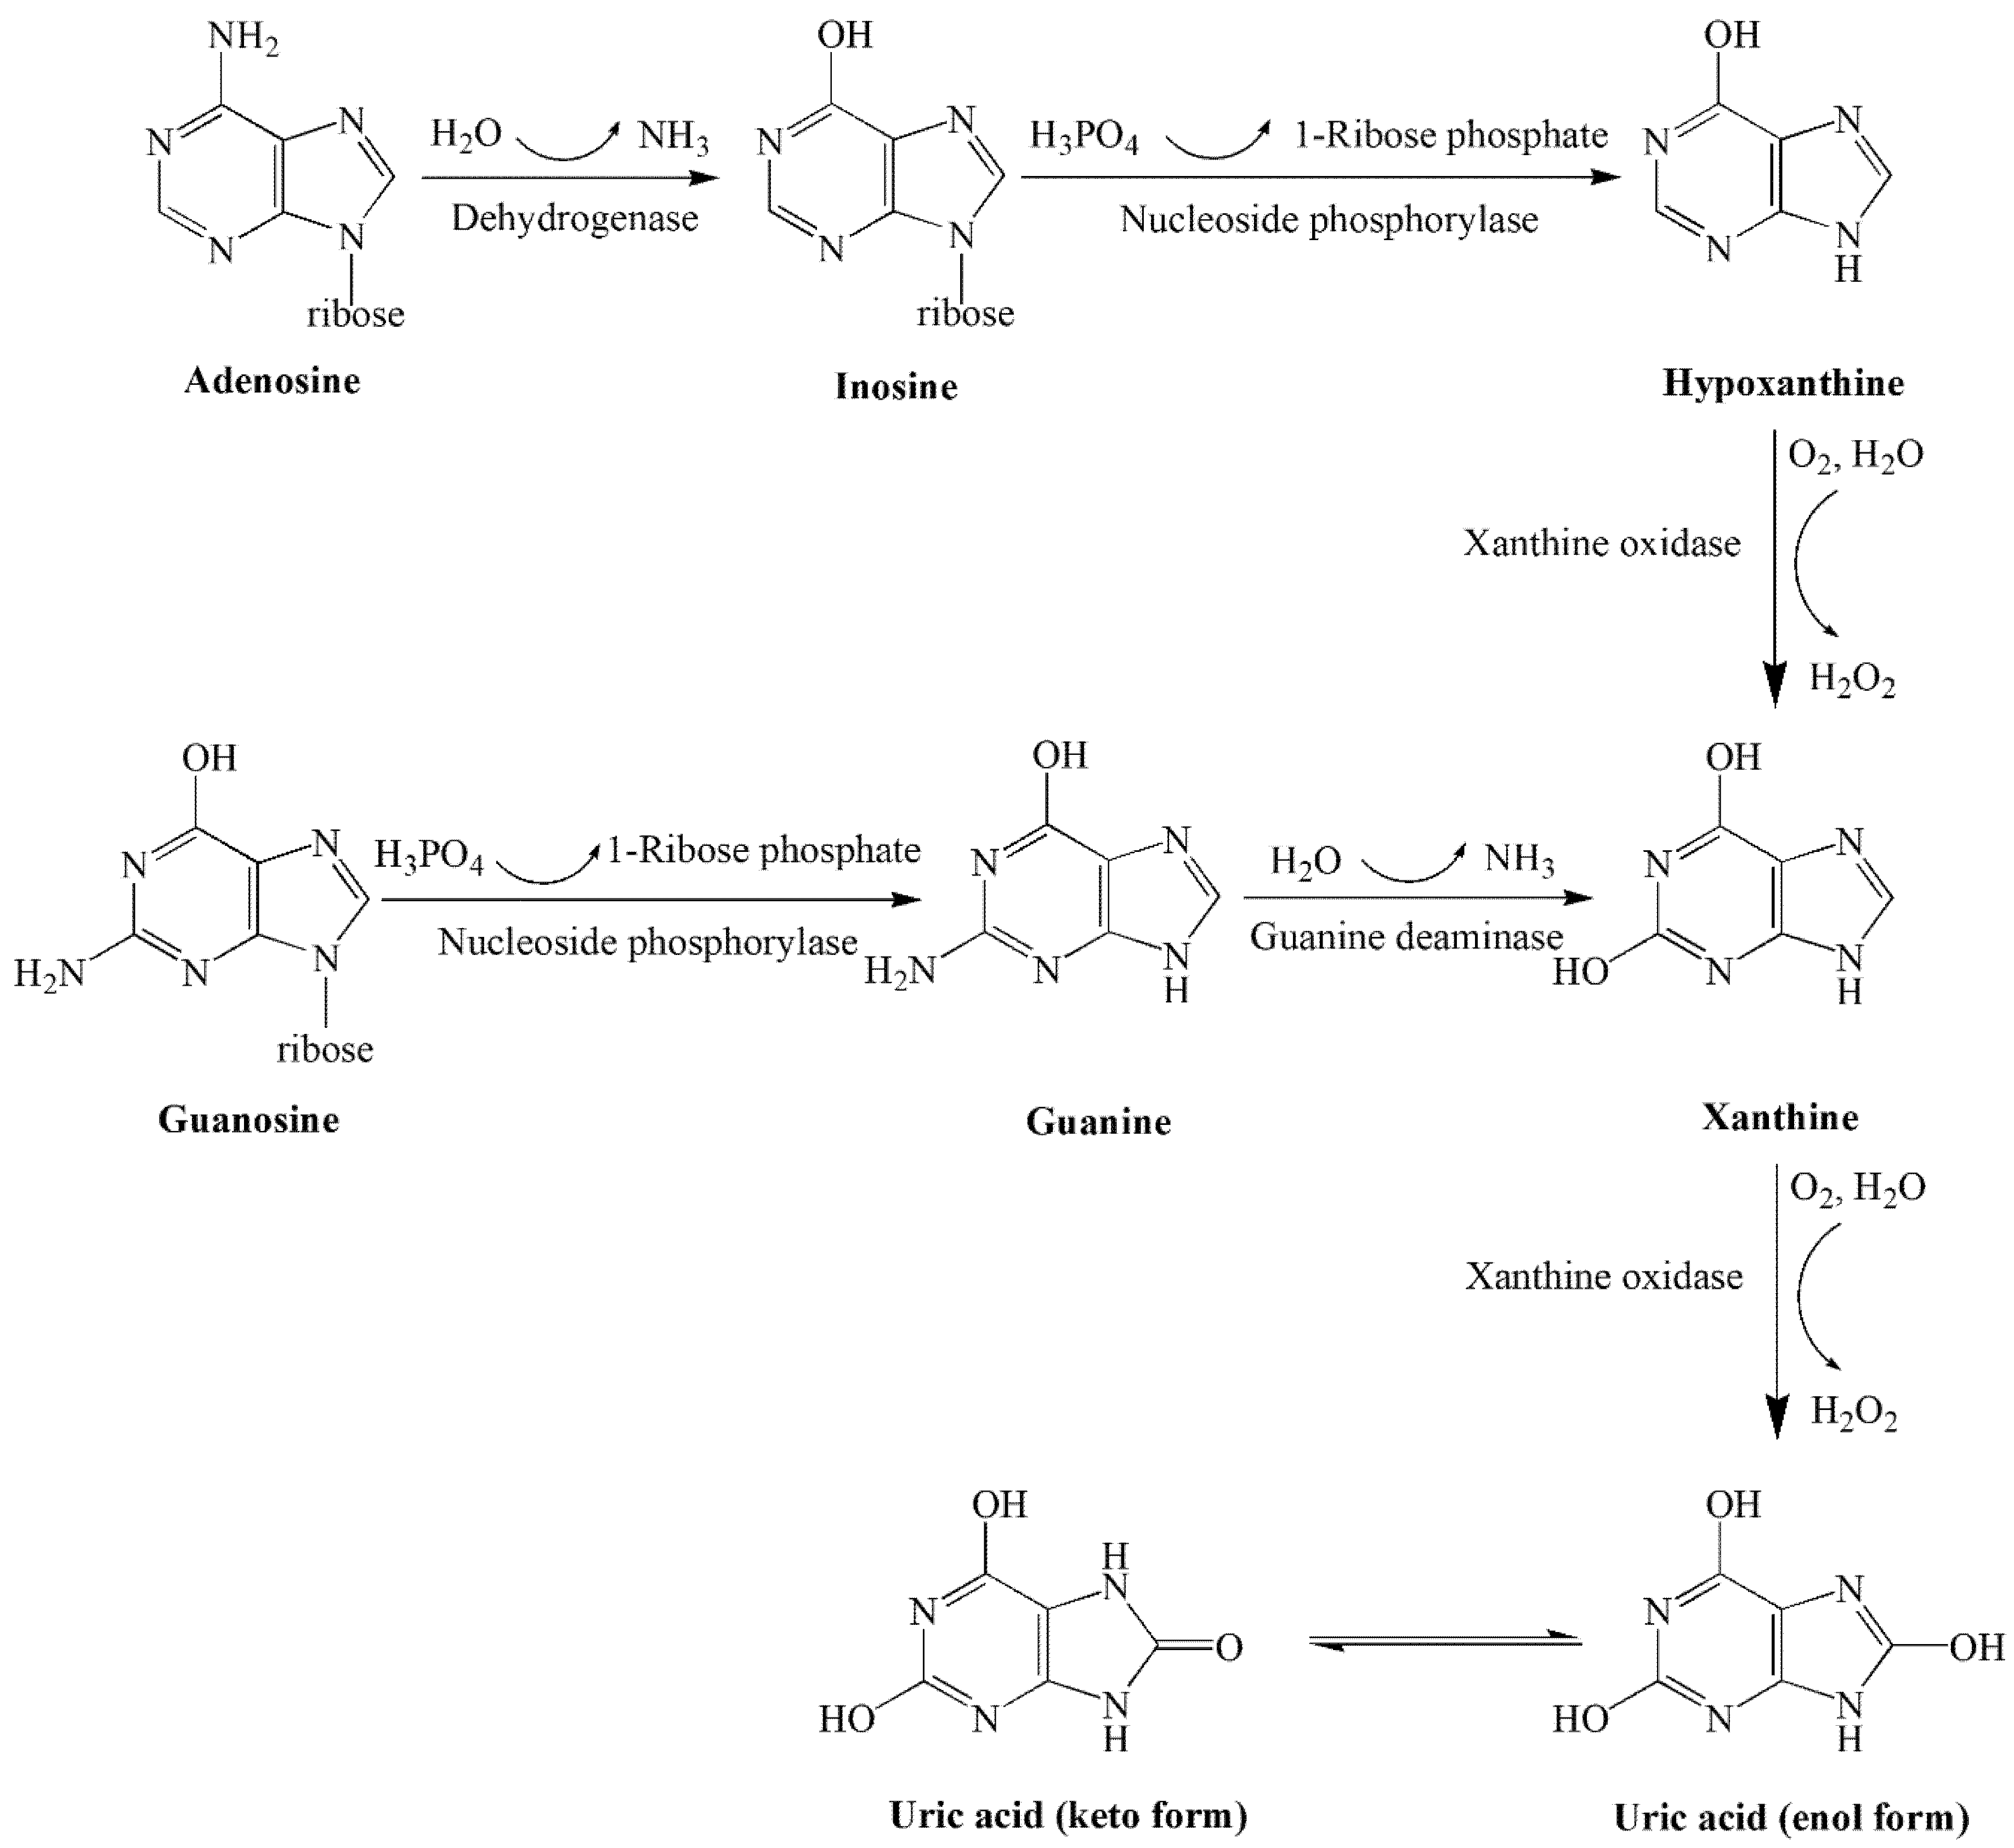
:1. Introduction
2. Materials and Methods
2.1. Chemicals and Reagents
2.2. Sample Collection
2.3. Standard Solutions Preparation
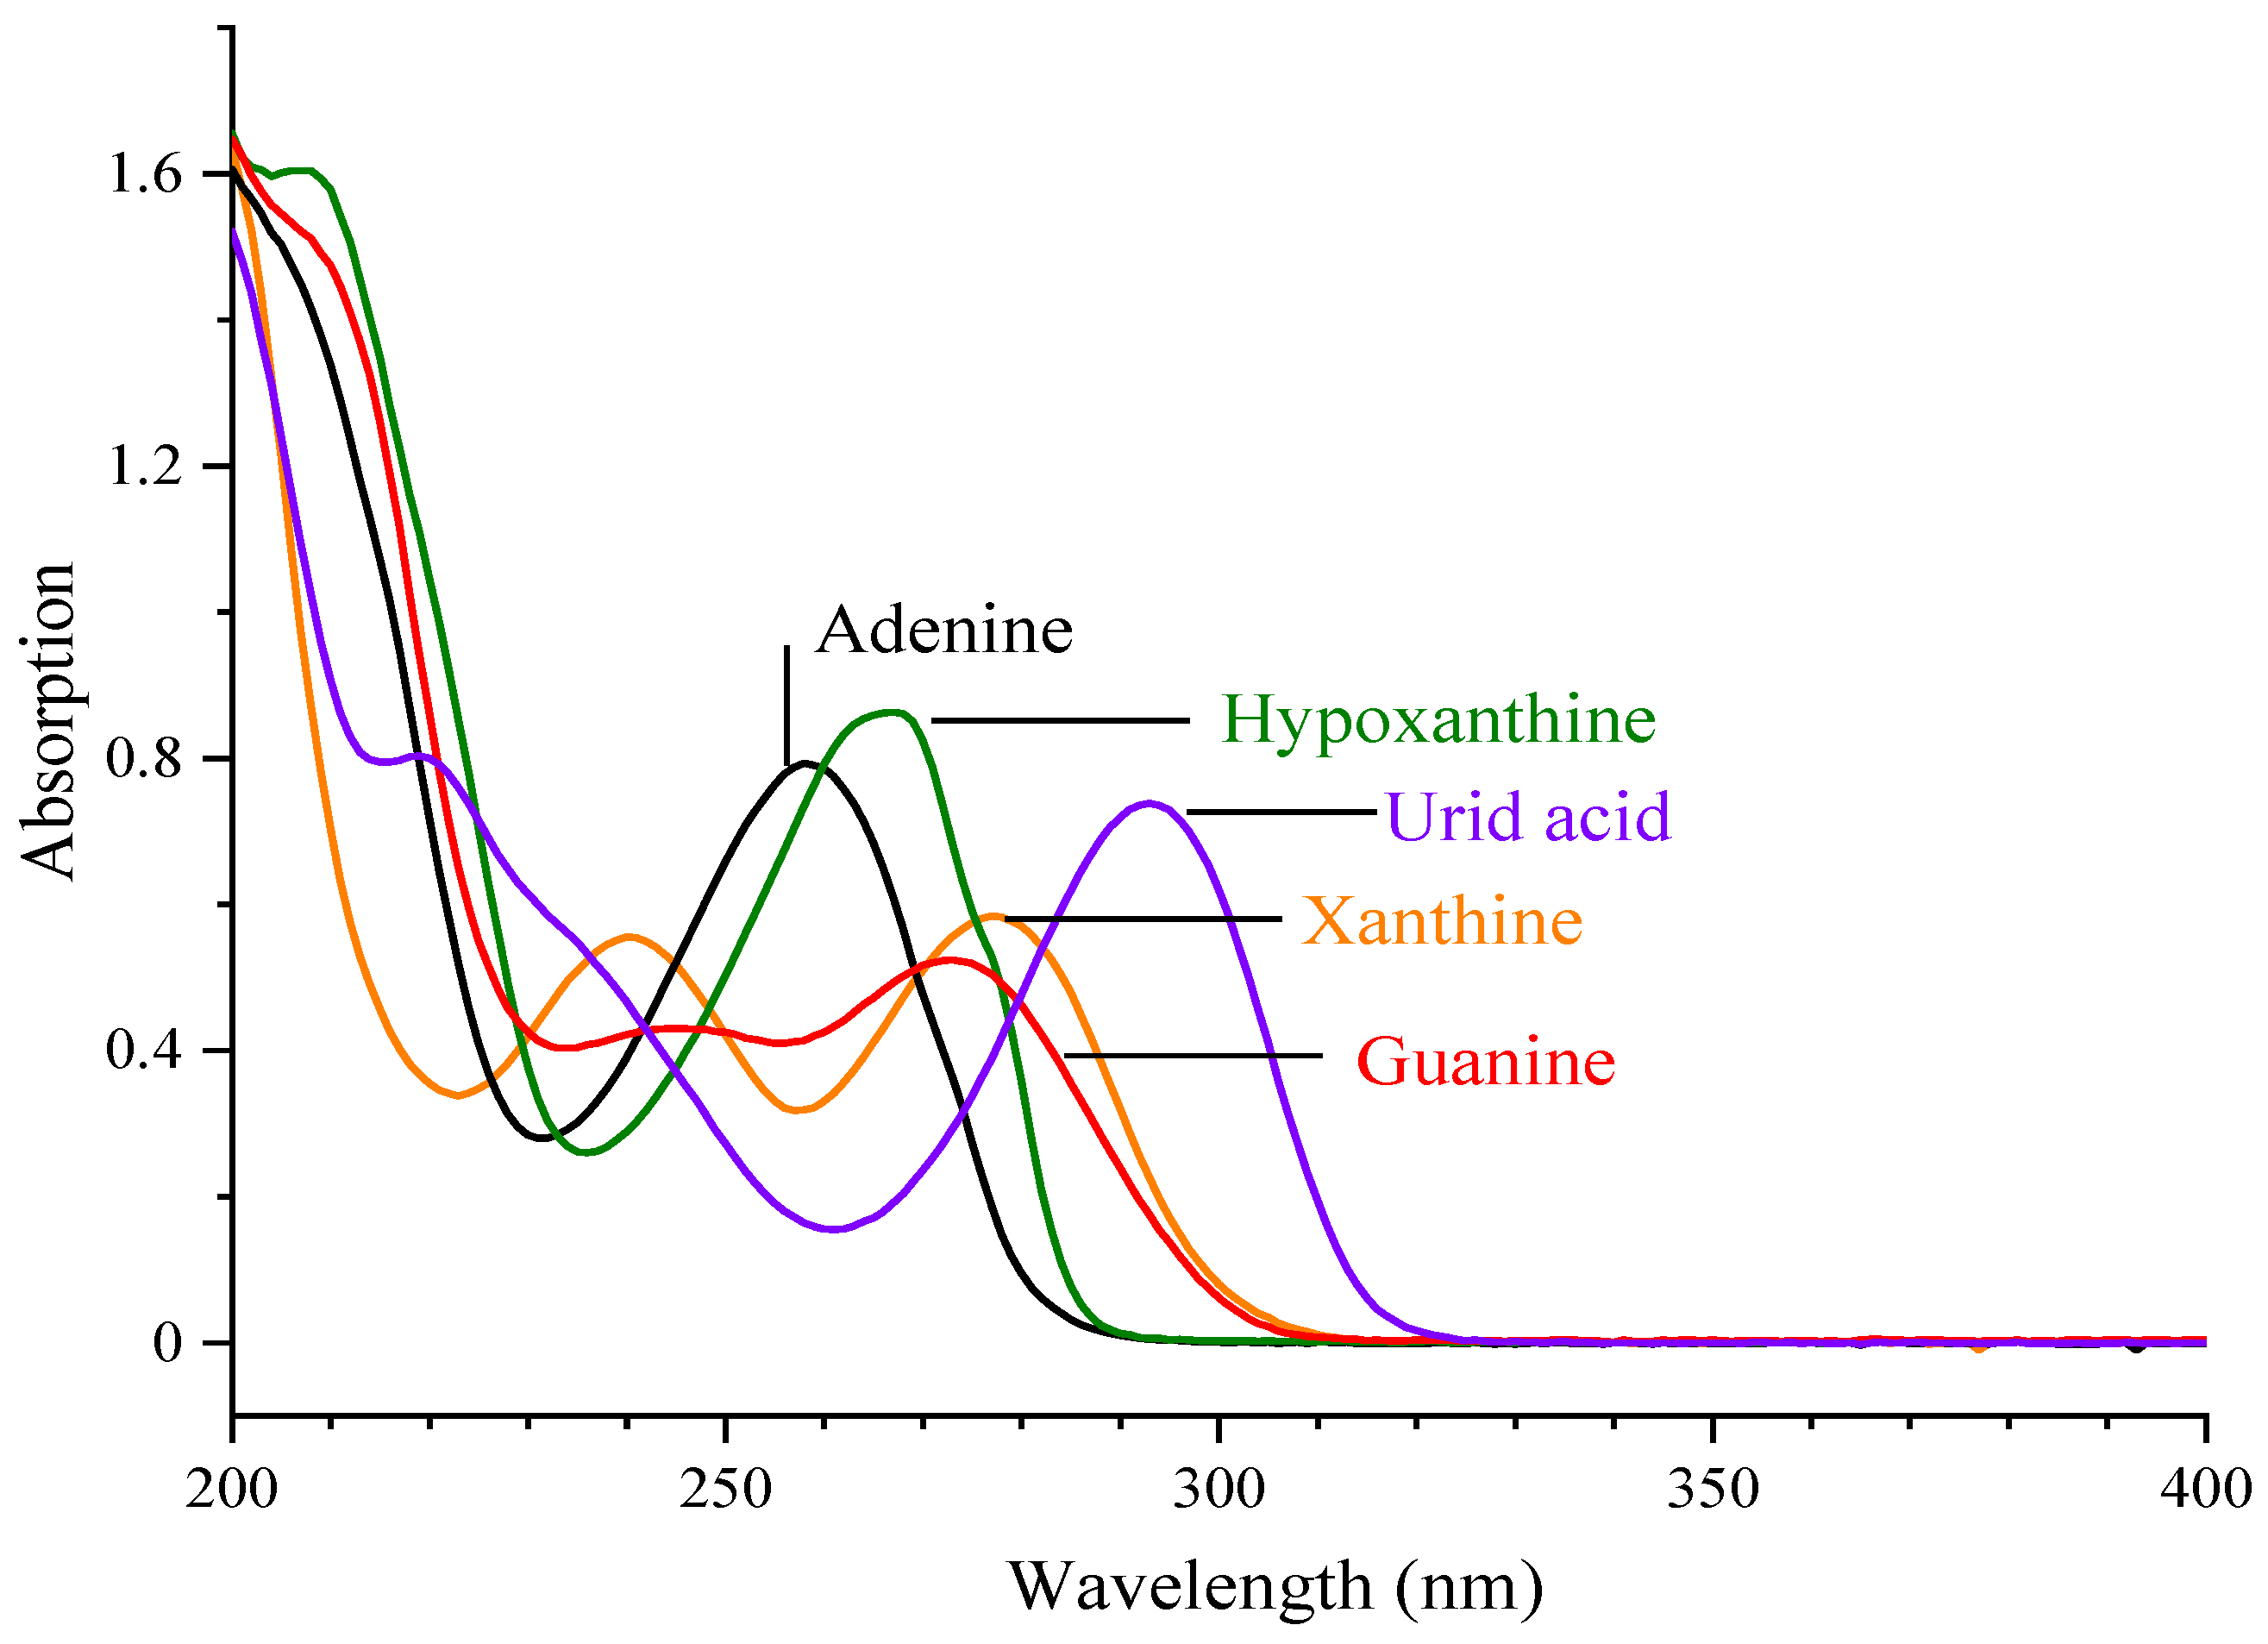
2.4. Liquid Chromatographic Conditions
2.5. Chinese Chicken Broth Preparation
2.6. TFA/FA Hydrolysis
2.6.1. Single-Factor Test
2.6.2. Orthogonal Experimental Design
2.7. PCA Hydrolysis
2.8. Method Validation
2.8.1. Determination of Linearity, Limit of Detection, and Limit of Quantification
2.8.2. Verification of Precision, Repeatability, and Accuracy
3. Results and Discussion
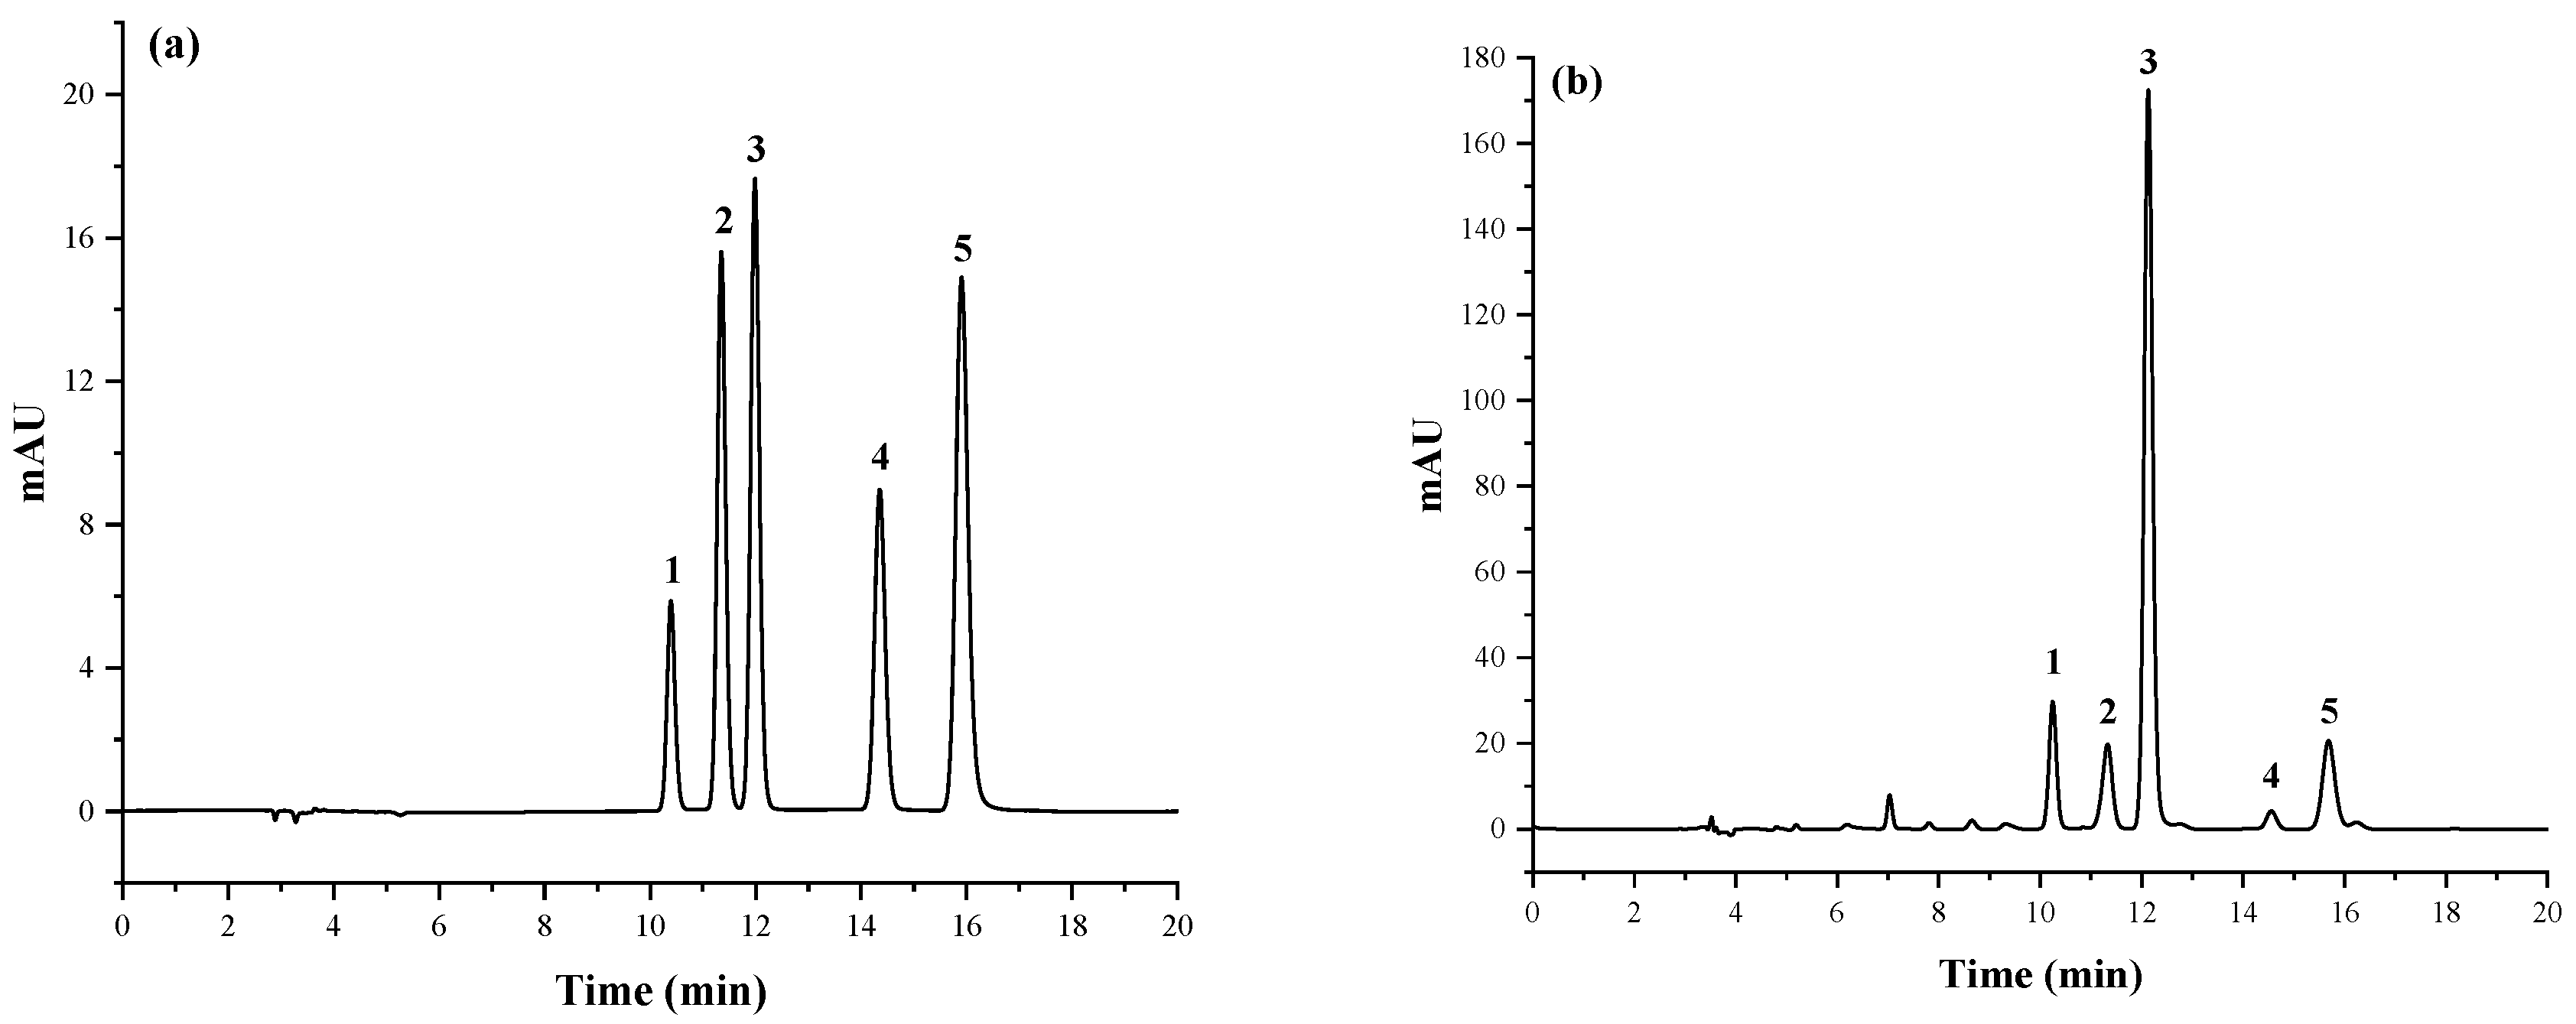
3.1. Optimization of HPLC Conditions
3.2. Optimization of Sample Pretreatment
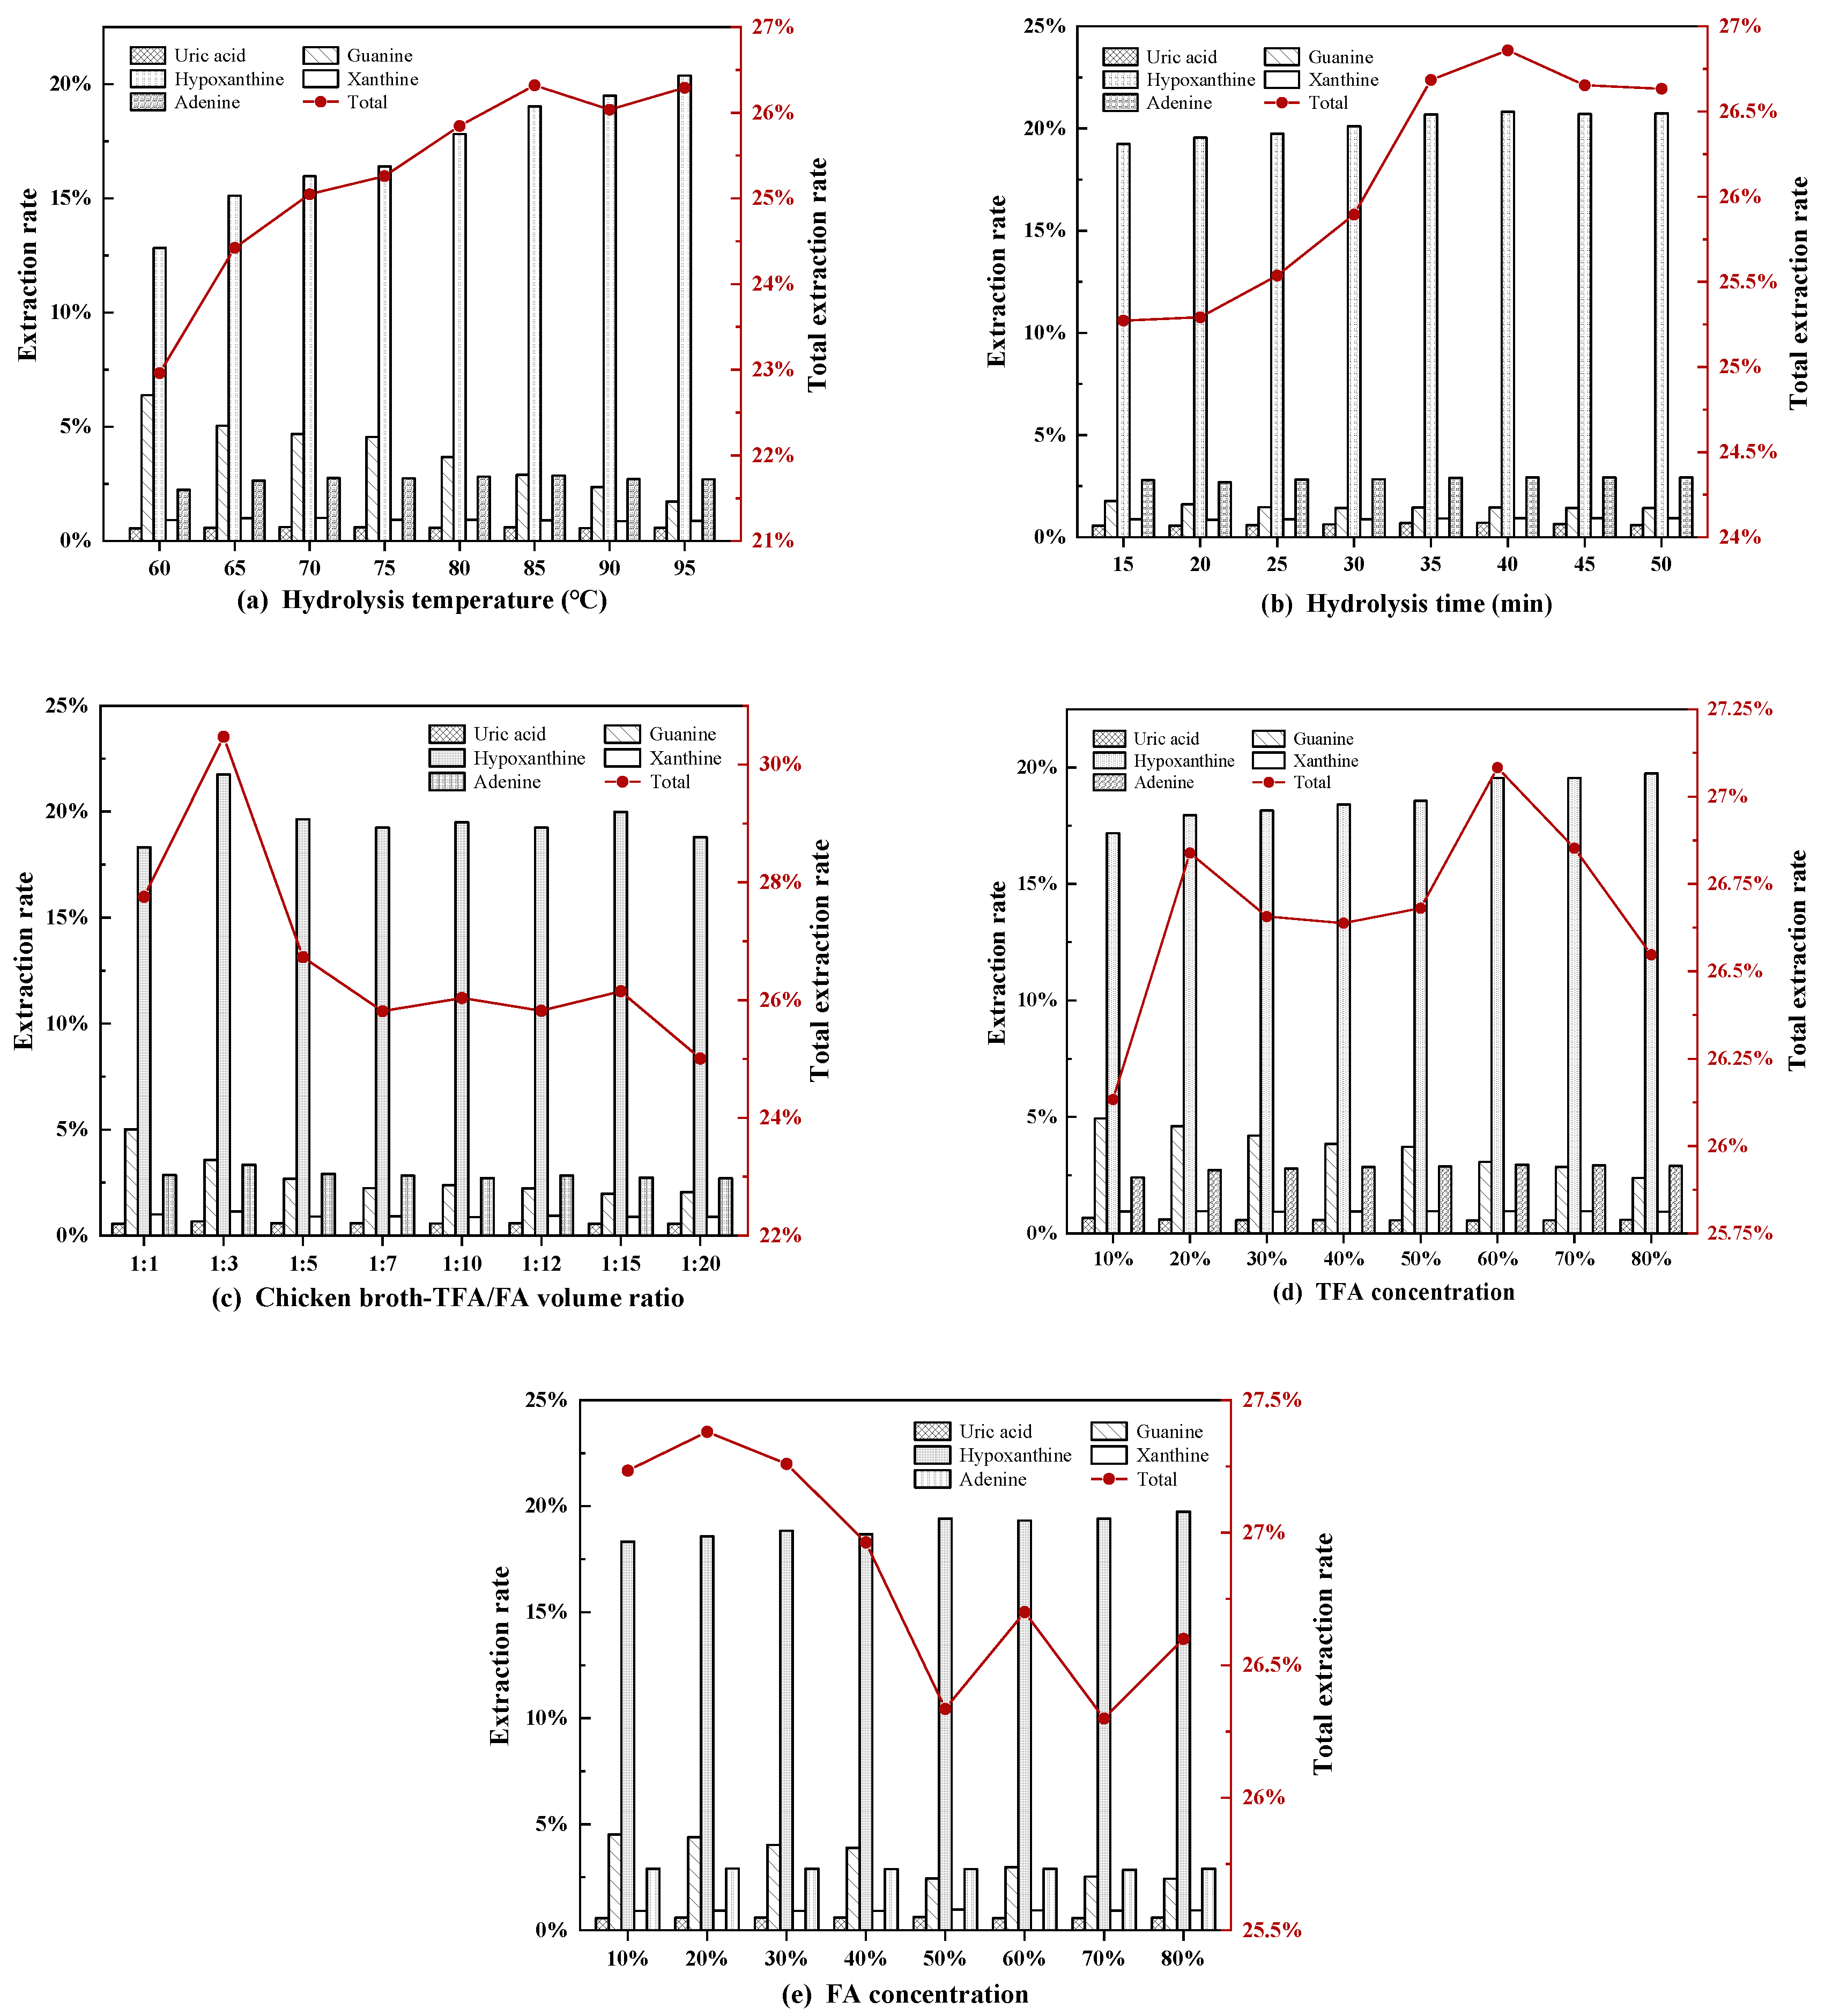
3.2.1. Single-Factor Test
3.2.2. Orthogonal Experiment Design
3.3. Validation of Analytical Methods
3.3.1. Linearity of the Standard Curves, the Limit of Detection, and the Limit of Quantification
3.3.2. Precision, Repeatability, and Accuracy
3.4. Application to Commercially Available Chinese Chicken Broths
4. Conclusions
Author Contributions
Funding
Institutional Review Board Statement
Informed Consent Statement
Data Availability Statement
Acknowledgments
Conflicts of Interest
References
- Inazawa, K.; Sato, A.; Kato, Y.; Yamaoka, N.; Fukuuchi, T.; Yasuda, M.; Mawatari, K.; Nakagomi, K.; Kaneko, K. Determination and profiling of purines in foods by using hplc and LC-MS. Nucleosides Nucleotides Nucleic Acids 2014, 33, 439–444. [Google Scholar] [CrossRef]
- Kaneko, K.; Aoyagi, Y.; Fukuuchi, T.; Inazawa, K.; Yamaoka, N. Total Purine and Purine Base Content of Common Foodstuffs for Facilitating Nutritional Therapy for Gout and Hyperuricemia. Biol. Pharm. Bull. 2014, 37, 709–721. [Google Scholar] [CrossRef] [Green Version]
- Pleskacova, A.; Brejcha, S.; Pacal, L.; Kankova, K.; Tomandl, J. Simultaneous Determination of Uric Acid, Xanthine and Hypoxanthine in Human Plasma and Serum by HPLC-UV: Uric Acid Metabolism Tracking. Chromatographia 2017, 80, 529–536. [Google Scholar] [CrossRef]
- Falasca, G.F. Metabolic diseases: Gout. Clin. Dermatol. 2006, 24, 498–508. [Google Scholar] [CrossRef] [PubMed]
- Yuan, H.; Yu, C.; Li, X.; Sun, L.; Zhu, X.; Zhao, C.; Zhang, Z.; Yang, Z. Serum Uric Acid Levels and Risk of Metabolic Syndrome: A Dose-Response Meta-Analysis of Prospective Studies. J. Clin. Endocrinol. Metab. 2015, 100, 4198–4207. [Google Scholar] [CrossRef] [PubMed] [Green Version]
- Sundstrom, J.; Sullivan, L.; D’Agostino, R.B.; Levy, D.; Kannel, W.B.; Vasan, R.S. Relations of serum uric acid to longitudinal blood pressure tracking and hypertension incidence. Hypertension 2005, 45, 28–33. [Google Scholar] [CrossRef] [Green Version]
- Dehlin, M.; Jacobsson, L.; Roddy, E. Global epidemiology of gout: Prevalence, incidence, treatment patterns and risk factors. Nat. Rev. Rheumatol. 2020, 16, 380–390. [Google Scholar] [CrossRef]
- CBNData. Available online: https://cbndata.com/report/2622/detail?isReading=report&page=1 (accessed on 27 September 2021).
- Li, R.; Yu, K.; Li, C. Dietary factors and risk of gout and hyperuricemia: A meta-analysis and systematic review. Asia Pac. J. Clin. Nutr. 2018, 27, 1344–1356. [Google Scholar] [CrossRef]
- Das, L.; Das, S.; Chandra, I.R.A.; Mallick, A.K.; Gupta, A. Validation and comparison of analytical methods for the determination of uric acid in pulses and cereals by salting out assisted extraction by Rapid resolution liquid chromatography. J. Chromatogr. B-Anal. Technol. Biomed. Life Sci. 2021, 1180, 122894. [Google Scholar] [CrossRef]
- Yang, H.; Zhang, J.; Liu, G.; Zhang, P. Measurement of purines and uric acid simultaneous in meat with high performance liquid chromatographys. J. Hyg. Res. 2012, 41, 303–306. [Google Scholar]
- Yang, Y.C.; Wang, X.F.; Wang, G.Y.; Gu, D.H.; Xu, Z.Q.; Fan, J.P.; Pu, Y.H.; Liu, P.; Liao, G.Z. Research Status and Development Trend of Chicken Soup. Sci. Technol. Food Ind. 2019, 40, 285–289. [Google Scholar]
- Rennard, B.O.; Ertl, R.F.; Gossman, G.L.; Robbins, R.A.; Rennard, S.I. Chicken soup inhibits neutrophil chemotaxis in vitro. Chest 2000, 118, 1150–1157. [Google Scholar] [CrossRef]
- Zhou, W.-J.; Sun, Z.-D. Advance in nutritional components and dietotherapy function of chicken soup. Food Sci. Technol. 2008, 9, 78–84. [Google Scholar]
- Liu, L.; Ouyang, J.; Baeyens, W.R.G. Separation of purine and pyrimidine bases by ion chromatography with direct conductivity detection. J. Chromatogr. A 2008, 1193, 104–108. [Google Scholar] [CrossRef]
- Klampfl, C.W.; Himmelsbach, M.; Buchberger, W.; Klein, H. Determination of purines and pyrimidines in beer samples by capillary zone electrophoresis. Anal. Chim. Acta 2002, 454, 185–191. [Google Scholar] [CrossRef]
- Cui, J.-W.; Hou, T.-J.; Wang, Q.; Gao, G.-G.; Bi, S.; Zhou, K.-C.; Li, J.-L.; Wu, D.-M. An Enzyme Assisted Electrochemical Detection System of Purine Intracellular Utilizing MWCNTs-IL Modified Glassy Carbon Electrode. Electrochim. Acta 2015, 180, 360–365. [Google Scholar] [CrossRef]
- Fukuuchi, T.; Yasuda, M.; Inazawa, K.; Ota, T.; Yamaoka, N.; Mawatari, K.I.; Nakagomi, K.; Kaneko, K. A Simple HPLC Method for Determining the Purine Content of Beer and Beer-like Alcoholic Beverages. Anal. Sci. 2013, 29, 511–517. [Google Scholar] [CrossRef] [Green Version]
- Roy, L.; Harrell, C.C.; Ryan, A.S.; Thorsteinsson, T.; Sancilio, F.D. Development and validation of a single HPLC method for analysis of purines in fish oil supplements. Food Nutr. Sci. 2013, 4, 1255. [Google Scholar] [CrossRef] [Green Version]
- Kaneko, K.; Takayanagi, F.; Fukuuchi, T.; Yamaoka, N.; Yasuda, M.; Mawatari, K.I.; Fujimori, S. Determination of total purine and purine base content of 80 food products to aid nutritional therapy for gout and hyperuricemia. Nucleosides Nucleotides Nucleic Acids 2020, 39, 1449–1457. [Google Scholar] [CrossRef]
- Qi, J.; Wang, H.; Zhou, G.; Xu, X.; Li, X.; Bai, Y.; Yu, X. Evaluation of the taste-active and volatile compounds in stewed meat from the Chinese yellow-feather chicken breed. Int. J. Food Prop. 2018, 20, S2579–S2595. [Google Scholar] [CrossRef]
- Bauer, L.C.; Santana, D.d.A.; Macedo, M.d.S.; Torres, A.G.; de Souza, N.E.; Simionato, J.I. Method Validation for Simultaneous Determination of Cholesterol and Cholesterol Oxides in Milk by RP-HPLC-DAD. J. Braz. Chem. Soc. 2014, 25, 161–168. [Google Scholar] [CrossRef]
- Kolaric, L.; Simko, P. Determination of Cholesterol Content in Butter by HPLC: Up-to-Date Optimization, and In-House Validation Using Reference Materials. Foods 2020, 9, 1378. [Google Scholar] [CrossRef]
- Li, H.; Liu, F.; Hao, J.; Liu, C. Determination of Purines in Beer by HPLC Using a Simple and Rapid Sample Pretreatment. J. Am. Soc. Brew. Chem. 2015, 73, 137–142. [Google Scholar] [CrossRef]
- Rong, S.; Zou, L.; Zhang, Y.; Zhang, G.; Li, X.; Li, M.; Yang, F.; Li, C.; He, Y.; Guan, H.; et al. Determination of purine contents in different parts of pork and beef by high performance liquid chromatography. Food Chem. 2015, 170, 303–307. [Google Scholar] [CrossRef]
- Kaneko, K.; Yamanobe, T.; Fujimori, S. Determination of purine contents of alcoholic beverages using high performance liquid chromatography. Biomed. Chromatogr. 2009, 23, 858–864. [Google Scholar] [CrossRef]
- Hou, C.; Xiao, G.; Amakye, W.K.; Sun, J.; Xu, Z.; Ren, J. Guidelines for purine extraction and determination in foods. Food Front. 2021, 1–17. [Google Scholar] [CrossRef]
- Zheng, M.; Huang, Y.; Ji, J.; Xiao, S.; Ma, J.; Huang, L. Effects of breeds, tissues and genders on purine contents in pork and the relationships between purine content and other meat quality traits. Meat Sci. 2018, 143, 81–86. [Google Scholar] [CrossRef]
- Jamil, N.H.; Halim, N.R.A.; Sarbon, N.M. Optimization of enzymatic hydrolysis condition and functional properties of eel (Monopterus sp.) protein using response surface methodology (RSM). Int. Food Res. J. 2016, 23, 53074993. [Google Scholar]
- Markelj, J.; Zupancic, T.; Pihlar, B. Optimization of High Performance Liquid Chromatography Method for Simultaneous Determination of Some Purine and Pyrimidine Bases. Acta Chim. Slov. 2016, 63, 8–17. [Google Scholar] [CrossRef] [Green Version]
- Li, T.; Ren, L.; Wang, D.; Song, M.; Li, Q.; Li, J. Optimization of extraction conditions and determination of purine content in marine fish during boiling. Peerj 2019, 7, 6690. [Google Scholar] [CrossRef] [Green Version]
- Qu, X.; Sui, J.; Mi, N.; Lin, H. Determination of four different purines and their content change in seafood by high-performance liquid chromatography. J. Sci. Food Agric. 2017, 97, 520–525. [Google Scholar] [CrossRef] [PubMed]
- Pineiro-Sotelo, M.; de Quiros, A.R.B.; Lopez-Hernandez, J.; Simal-Lozano, J. Determination of purine bases in sea urchin (Paracentortus lividus) gonads by high-performance liquid chromatography. Food Chem. 2002, 79, 113–117. [Google Scholar] [CrossRef]
- Mu, G.; Luan, F.; Xu, L.; Hu, F.; Liu, H.; Gao, Y. Determination of purines in soybean milk by capillary electrophoresis in comparison with high performance liquid chromatography. Anal. Methods 2012, 4, 3386–3391. [Google Scholar] [CrossRef]
- FitzGerald, J.; Brignardello-Petersen, R.; Dalbeth, N.; Mikuls, T.; Neogi, T.; Guyatt, G. Response to the 2020 American College of Rheumatology guideline for the management of gout: Comment on the article by FitzGerald et al Reply. Arthritis Care Res. 2020, 72, 1507–1508. [Google Scholar] [CrossRef]
- Takayanagi, F.; Fukuuchi, T.; Yamaoka, N.; Kaneko, K. Measurement of the total purine contents and free nucleosides, nucleotides, and purine bases composition in Japanese anchovies (Engraulis japonicus) using high-performance liquid chromatography with UV detection. Nucleosides Nucleotides Nucleic Acids 2020, 39, 1458–1464. [Google Scholar] [CrossRef]
- Ling, Y.; Wang, X.-Y.; Yong, W.; Yuan, J.-Q.; Chu, X.-G. Determination of four purines in meat by high performance liquid chromatography. Chin. J. Anal. Chem. 2008, 36, 724–728. [Google Scholar]
- Clifford, A.; Riumallo, J.; Young, V.; Scrimshaw, N. Effect of oral purines on serum and urinary uric acid of normal, hyperuricemic and gouty humans. J. Nutr. 1976, 106, 428–434. [Google Scholar] [CrossRef]

| Level | Factor | ||
|---|---|---|---|
| Hydrolysis Temperature (°C) | Hydrolysis Time (min) | FA Concentration (%) | |
| 1 | 80 | 35 | 10 |
| 2 | 85 | 40 | 20 |
| 3 | 90 | 45 | 30 |
| Experimental No. | A (°C) | B (min) | C (%) | Total Content (mg/100 g) |
|---|---|---|---|---|
| 1 | 1(80) | 1(35) | 1(10) | 26.90 |
| 2 | 1(80) | 2(40) | 2(20) | 26.99 |
| 3 | 1(80) | 3(45) | 3(30) | 27.13 |
| 4 | 2(85) | 1(35) | 2(20) | 27.14 |
| 5 | 2(85) | 2(40) | 3(30) | 27.31 |
| 6 | 2(85) | 3(45) | 1(10) | 26.68 |
| 7 | 3(90) | 1(35) | 3(30) | 26.07 |
| 8 | 3(90) | 2(40) | 1(10) | 26.64 |
| 9 | 3(90) | 3(45) | 2(20) | 26.63 |
| K1 | 27.00 | 26.70 | 26.74 | |
| K2 | 27.04 | 26.98 | 26.92 | |
| K3 | 26.47 | 26.81 | 26.84 | |
| R | 0.60 | 0.28 | 0.18 | |
| Factor priorities | A > B > C | |||
| Optimal combination | A2B2C2: A (85 °C) B (40 min) C (20%) | |||
| Compound | Regression Equation | R2 | Linear Range (mg/L) | LOD (µg/L) | LOQ (µg/L) | Precision (%RSD) | Repeatability (%RSD) |
|---|---|---|---|---|---|---|---|
| Uric acid | y = 12.2198x + 2.0876 | 0.9998 | 0.05–100 | 1.71 | 5.70 | 1 | 1 |
| Guanine | y = 36.9705x − 1.0485 | 0.9998 | 0.05–100 | 0.64 | 2.13 | 1 | 1 |
| Hypoxanthine | y = 40.1194x + 11.6305 | 0.9997 | 0.05–100 | 0.58 | 1.92 | 1 | 1 |
| Xanthine | y = 25.0866x + 5.5252 | 0.9998 | 0.05–100 | 1.14 | 3.79 | 1 | 2 |
| Adenine | y = 50.9974x + 10.7899 | 0.9997 | 0.05–100 | 0.66 | 2.19 | 1 | 1 |
| Compound | Original Quantity (mg) | Spiked Quantity (mg) | Measured Quantity (mg) | Recovery (%) | RSD (%) | Average Recovery (%) |
|---|---|---|---|---|---|---|
| Uric acid | 0.0058 | 0.0029 | 0.0084 | 92 | 1 | 93 |
| 0.0058 | 0.0111 | 92 | 1 | |||
| 0.0115 | 0.0167 | 95 | 2 | |||
| Guanine | 0.0318 | 0.0159 | 0.0484 | 104 | 2 | 101 |
| 0.0318 | 0.0627 | 97 | 3 | |||
| 0.0636 | 0.0963 | 101 | 3 | |||
| Hypoxanthine | 0.1959 | 0.0980 | 0.2922 | 98 | 2 | 99 |
| 0.1959 | 0.3892 | 99 | 1 | |||
| 0.3919 | 0.5861 | 100 | 1 | |||
| Xanthine | 0.0098 | 0.0049 | 0.0143 | 92 | 2 | 91 |
| 0.0098 | 0.0188 | 91 | 2 | |||
| 0.0196 | 0.0278 | 92 | 2 | |||
| Adenine | 0.0295 | 0.0147 | 0.0434 | 95 | 2 | 95 |
| 0.0295 | 0.0571 | 94 | 2 | |||
| 0.0580 | 0.0854 | 97 | 3 |
| Sample | Average Concentration ± SD | ||||||
|---|---|---|---|---|---|---|---|
| Uric Acid (mg/L) | Guanine (mg/L) | Hypoxanthine (mg/L) | Xanthine (mg/L) | Adenine (mg/L) | Total Purine (mg/L) | Total Amount (mg/L) | |
| BR-1 | 3.86 ± 0.04 Fc | 71.92 ± 1.14 Cb | 223.33 ± 2.84 Ba | 9.19 ± 0.10 Eb | 54.97 ± 0.80 Da | 359.40 ± 4.65 Aa | 363.26 ± 4.65 Aa |
| BR-2 | 4.42 ± 0.46 Gb | 85.95 ± 0.79 Da | 180.84 ± 1.91 Cb | 12.87 ± 0.54 Fa | 38.40 ± 0.25 Ec | 318.05 ± 3.43 Bb | 322.47 ± 3.38 Ab |
| BR-3 | 3.80 ± 0.01 Dc | 60.75 ± 1.40 Cd | 144.12 ± 2.46 Bc | 3.96 ± 0.33 De | 55.49 ± 1.48 Ca | 264.31 ± 5.60 Ac | 268.12 ± 5.59 Ac |
| BR-4 | 1.80 ± 0.07 Ed | 43.53 ± 1.08 Cf | 144.75 ± 3.69 Bc | 5.46 ± 0.34 Ed | 33.60 ± 0.73 Dd | 227.35 ± 5.84 Ad | 229.15 ± 5.83 Ad |
| BR-5 | 1.65 ± 0.14 Ed | 66.47 ± 0.73 Cc | 112.54 ± 1.13 Be | 3.57 ± 0.45 Ee | 41.37 ± 0.39 Db | 223.95 ± 2.59 Ad | 225.60 ± 2.46 Ad |
| BR-6 | 0.74 ± 0.03 De | 43.10 ± 1.02 Cf | 138.14 ± 2.22 Bd | 1.18 ± 0.24 Df | 39.49 ± 0.65 Cc | 221.92 ± 4.10 Ad | 222.66 ± 4.08 Ad |
| BR-7 | 1.78 ± 0.11 Dd | 34.91 ± 1.55 Cg | 97.99 ± 4.59 Bf | 5.25 ± 0.24 Dd | 34.86 ± 1.52 Cd | 173.01 ± 7.90 Ae | 174.79 ± 8.01 Ae |
| BR-8 | 0.81 ± 0.03 De | 32.72 ± 0.71 Ch | 92.22 ± 2.20 Bg | 1.68 ± 0.12 Df | 29.67 ± 0.72 Ce | 156.28 ± 3.64 Af | 157.09 ± 3.65 Af |
| BR-9 | 0.87 ± 0.04 Ee | 31.88 ± 0.51 Ch | 77.42 ± 1.32 Bh | 1.48 ± 0.05 Ef | 27.77 ± 0.78 Df | 138.55 ± 2.46 Ag | 139.42 ± 2.44 Ag |
| BR-10 | 1.66 ± 0.06 Ed | 50.16 ± 1.14 Be | 44.77 ± 0.45 Cj | 1.23 ± 0.06 Ef | 22.71 ± 0.57 Dg | 118.87 ± 2.17 Ah | 120.53 ± 2.11 Ah |
| BR-11 | 6.84 ± 0.28 Fa | 22.90 ± 0.32 Di | 70.03 ± 0.39 Ci | 6.77 ± 0.25 Fc | 16.59 ± 0.28 Eh | 116.29 ± 0.55 Bh | 123.13 ± 0.82 Ah |
| BR-12 | 0.39 ± 0.06 Ef | 32.67 ± 0.17 Ch | 37.38 ± 0.05 Bk | 1.34 ± 0.06 Ef | 22.25 ± 1.31 Dg | 93.64 ± 1.43 Ai | 94.04 ± 1.49 Ai |
Publisher’s Note: MDPI stays neutral with regard to jurisdictional claims in published maps and institutional affiliations. |
© 2021 by the authors. Licensee MDPI, Basel, Switzerland. This article is an open access article distributed under the terms and conditions of the Creative Commons Attribution (CC BY) license (https://creativecommons.org/licenses/by/4.0/).
Share and Cite
Wu, M.; Zhang, W.; Shen, X.; Wang, W. Simultaneous Determination of Purines and Uric Acid in Chinese Chicken Broth Using TFA/FA Hydrolysis Coupled with HPLC-VWD. Foods 2021, 10, 2814. https://doi.org/10.3390/foods10112814
Wu M, Zhang W, Shen X, Wang W. Simultaneous Determination of Purines and Uric Acid in Chinese Chicken Broth Using TFA/FA Hydrolysis Coupled with HPLC-VWD. Foods. 2021; 10(11):2814. https://doi.org/10.3390/foods10112814
Chicago/Turabian StyleWu, Manli, Wangang Zhang, Xixi Shen, and Wei Wang. 2021. "Simultaneous Determination of Purines and Uric Acid in Chinese Chicken Broth Using TFA/FA Hydrolysis Coupled with HPLC-VWD" Foods 10, no. 11: 2814. https://doi.org/10.3390/foods10112814
APA StyleWu, M., Zhang, W., Shen, X., & Wang, W. (2021). Simultaneous Determination of Purines and Uric Acid in Chinese Chicken Broth Using TFA/FA Hydrolysis Coupled with HPLC-VWD. Foods, 10(11), 2814. https://doi.org/10.3390/foods10112814