
Combined Effect of Temperature and Oil and Salt Contents on the Variation of Dielectric Properties of a Tomato-Based Homogenate


Abstract
:
1. Introduction
2. Materials and Methods
2.1. Sample Preparation
2.2. Sample Characterization
2.3. Measurement of Dielectric Properties
2.4. Calculation of the Frequency at Which the Relationship between the Dielectric Constant and Temperature Reverses
2.5. Calculation of the Penetration Depth
2.6. Statistical Analysis
3. Results and Discussion
3.1. Dielectric Constant ()
3.2. Loss Factor ()
3.3. Penetration Depth ()
4. Conclusions
Supplementary Materials
Author Contributions
Funding
Institutional Review Board Statement
Informed Consent Statement
Data Availability Statement
Acknowledgments
Conflicts of Interest
References
- Li, Q.; Li, T.; Liu, C.; Chen, J.; Zhang, R.; Zhang, Z.; Dai, T.; McClements, D.J. Potential Physicochemical Basis of Mediterranean Diet Effect: Ability of Emulsified Olive Oil to Increase Carotenoid Bioaccessibility in Raw and Cooked Tomatoes. Food Res. Int. 2016, 89, 320–329. [Google Scholar] [CrossRef] [Green Version]
- European Commission. EU Agricultural Outlook for Markets and Income, 2018–2030; European Comission, DG Agriculture and Rural Development: Brussels, Belgium, 2018. [Google Scholar]
- Elez-Martínez, P.; Martín-Belloso, O. Effects of High Intensity Pulsed Electric Field Processing Conditions on Vitamin C and Antioxidant Capacity of Orange Juice and Gazpacho, a Cold Vegetable Soup. Food Chem. 2007, 102, 201–209. [Google Scholar] [CrossRef]
- Colle, I.J.P.; Andrys, A.; Grundelius, A.; Lemmens, L.; Löfgren, A.; Van Buggenhout, S.; Van Loey, A.; Hendrickx, M. Effect of Pilot-Scale Aseptic Processing on Tomato Soup Quality Parameters. J. Food. Sci. 2011, 76, C714–C723. [Google Scholar] [CrossRef] [PubMed]
- Kim, W.J.; Park, S.H.; Kang, D.H. Inactivation of Foodborne Pathogens Influenced by Dielectric Properties, Relevant to Sugar Contents, in Chili Sauce by 915 MHz Microwaves. LWT 2018, 96, 111–118. [Google Scholar] [CrossRef]
- Jiao, Y.; Tang, J.; Wang, Y.; Koral, T.L. Radio-Frequency Applications for Food Processing and Safety. Annu. Rev. Food Sci. Technol. 2018, 9, 105–127. [Google Scholar] [CrossRef] [PubMed] [Green Version]
- Jain, D.; Tang, J.; Pedrow, P.D.; Tang, Z.; Sablani, S.; Hong, Y.-K. Effect of Changes in Salt Content and Food Thickness on Electromagnetic Heating of Rice, Mashed Potatoes and Peas in 915 MHz Single Mode Microwave Cavity. Food Res. Int. 2019, 119, 584–595. [Google Scholar] [CrossRef] [PubMed]
- Tanaka, F.; Morita, K.; Mallikarjunan, P.; Hung, Y.-C.; Ezeike, G.O.I. Analysis of Dielectric Properties of Soy Sauce. J. Food Eng. 2005, 71, 92–97. [Google Scholar] [CrossRef]
- Kumar, P.; Coronel, P.; Simunovic, J.; Sandeep, K.P. Thermophysical and Dielectric Properties of Salsa Con Queso and Its Vegetable Ingredients at Sterilization Temperatures. Int. J. Food Prop. 2008, 11, 112–126. [Google Scholar] [CrossRef] [Green Version]
- Tanaka, F.; Uchino, T.; Hamanaka, D.; Atungulu, G.G.; Hung, Y.C. Dielectric Properties of Mirin in the Microwave Frequency Range. J. Food Eng. 2008, 89, 435–440. [Google Scholar] [CrossRef]
- Bohigas, X.; Tejada, J. Dielectric Properties of Acetic Acid and Vinegar in the Microwave Frequencies Range 1–20 GHz. J. Food Eng. 2009, 94, 46–51. [Google Scholar] [CrossRef]
- Guo, W.; Liu, Y.; Zhu, X.; Wang, S. Dielectric Properties of Honey Adulterated with Sucrose Syrup. J. Food Eng. 2011, 107, 1–7. [Google Scholar] [CrossRef]
- Zhu, X.; Guo, W.; Wu, X. Frequency- and Temperature-Dependent Dielectric Properties of Fruit Juices Associated with Pasteurization by Dielectric Heating. J. Food Eng. 2012, 109, 258–266. [Google Scholar] [CrossRef]
- Muñoz, I.; Gou, P.; Picouet, P.A.; Barlabé, A.; Felipe, X. Dielectric Properties of Milk during Ultra-Heat Treatment. J. Food Eng. 2018, 219, 137–146. [Google Scholar] [CrossRef]
- Ahmed, J.; Thomas, L.; Mulla, M. Dielectric and Microstructural Properties of High-Pressure Treated Hummus in the Selected Packaging Materials. LWT 2020, 118, 108885. [Google Scholar] [CrossRef]
- Franco, A.P.; Yamamoto, L.Y.; Tadini, C.C.; Gut, J.A.W. Dielectric Properties of Green Coconut Water Relevant to Microwave Processing: Effect of Temperature and Field Frequency. J. Food Eng. 2015, 155, 69–78. [Google Scholar] [CrossRef]
- Luan, D.; Tang, J.; Liu, F.; Tang, Z.; Li, F.; Lin, H.; Stewart, B. Dielectric Properties of Bentonite Water Pastes Used for Stable Loads in Microwave Thermal Processing Systems. J. Food Eng. 2015, 161, 40–47. [Google Scholar] [CrossRef]
- De los Reyes, R.; Heredia, A.; Fito, P.; De los Reyes, E.; Andrés, A. Dielectric Spectroscopy of Osmotic Solutions and Osmotically Dehydrated Tomato Products. J. Food Eng. 2007, 80, 1218–1225. [Google Scholar] [CrossRef]
- Peng, J.; Tang, J.; Jiao, Y.; Bohnet, S.G.; Barrett, D.M. Dielectric Properties of Tomatoes Assisting in the Development of Microwave Pasteurization and Sterilization Processes. LWT 2013, 54, 367–376. [Google Scholar] [CrossRef]
- AOAC Method 950.46. Moisture in Meat. In Official Method of Analysis of the Association of Official Analytical Chemists; Association of Official Analytical Chemists: Arlington, MA, USA, 1990; p. 931.
- Debye, P. Polar Molecules. The Chemical Catalog Co. J. Chem. Technol. Biotechnol. 1929, 48, 1036–1037. [Google Scholar] [CrossRef]
- Zadeh, M.V.; Afrooz, K.; Shamsi, M.; Rostami, M.A. Measuring the Dielectric Properties of Date Palm Fruit, Date Palm Leaflet, and Dubas Bug at Radio and Microwave Frequency Using Two-Port Coaxial Transmission/Reflection Line Technique. Biosyst. Eng. 2019, 181, 73–85. [Google Scholar] [CrossRef]
- Zhang, J.; Li, M.; Cheng, J.; Wang, J.; Ding, Z.; Yuan, X.; Zhou, S.; Liu, X. Effects of Moisture, Temperature, and Salt Content on the Dielectric Properties of Pecan Kernels during Microwave and Radio Frequency Drying Processes. Foods 2019, 8, 385. [Google Scholar] [CrossRef] [Green Version]
- Ahmed, J.; Thomas, L.; Khashawi, R. Dielectric, Thermal, and Rheological Properties of Inulin/Water Binary Solutions in the Selected Concentration. J. Food Process. Eng. 2019, 42, e12968. [Google Scholar] [CrossRef]
- Sosa-Morales, M.E.; Valerio-Junco, L.; López-Malo, A.; García, H.S. Dielectric Properties of Foods: Reported Data in the 21st Century and Their Potential Applications. LWT 2010, 43, 1169–1179. [Google Scholar] [CrossRef]
- Wang, Y.; Wig, T.D.; Tang, J.; Hallberg, L.M. Dielectric Properties of Foods Relevant to RF and Microwave Pasteurization and Sterilization. J. Food Eng. 2003, 57, 257–268. [Google Scholar] [CrossRef]
- Nelson, S.O.; Bartley, P.G. Frequency and Temperature Dependence of the Dielectric Properties of Food Materials. Trans. ASAE 2002, 45, 1223. [Google Scholar] [CrossRef]
- Guan, D.G.; Cheng, M.; Wang, Y.; Tang, J. Dielectric Properties of Mashed Potatoes Relevant to Microwave and Radio-Frequency Pasteurization and Sterilization Processes. J. Food Sci. 2004, 69, FEP30–FEP37. [Google Scholar] [CrossRef]
- Nelson, S.O. Dielectric Properties of Agricultural Products and Some Applications. Res. Agr. Eng. 2008, 54, 104–112. [Google Scholar] [CrossRef] [Green Version]
- Liu, Y.; Tang, J.; Mao, Z. Analysis of Bread Loss Factor Using Modified Debye Equations. J. Food Eng. 2009, 93, 453–459. [Google Scholar] [CrossRef]
- Ikediala, N.J.; Tang, J.; Drake, S.R.; Neven, L.G. Dielectric Properties of Apple Cultivars and Codling Moth Larvae. Trans. ASAE 2000, 43, 1175–1184. [Google Scholar] [CrossRef]
- Schiffmann, R.F. Microwave and Dielectric Drying. In Handbook of Industrial Drying; Mujumdar, A.S., Ed.; CRC Press: Boca Raton, FL, USA, 1995; ISBN 978-0-429-28977-4. [Google Scholar]
 ) 0% salt (
  ) 0.5% salt (
  ) 1% salt. Error bars correspond to standard deviations.
) 0% salt ( ) 0.5% salt ( ) 1% salt. Error bars correspond to standard deviations.
) 1% salt. Error bars correspond to standard deviations.
) 0% salt ( ) 0.5% salt ( ) 1% salt. Error bars correspond to standard deviations.

 ) 0% oil ( ) 5% oil ( ) 10% oil. Error bars correspond to standard deviations.
) 0% oil ( ) 5% oil ( ) 10% oil. Error bars correspond to standard deviations.
) 0% oil ( ) 5% oil ( ) 10% oil. Error bars correspond to standard deviations.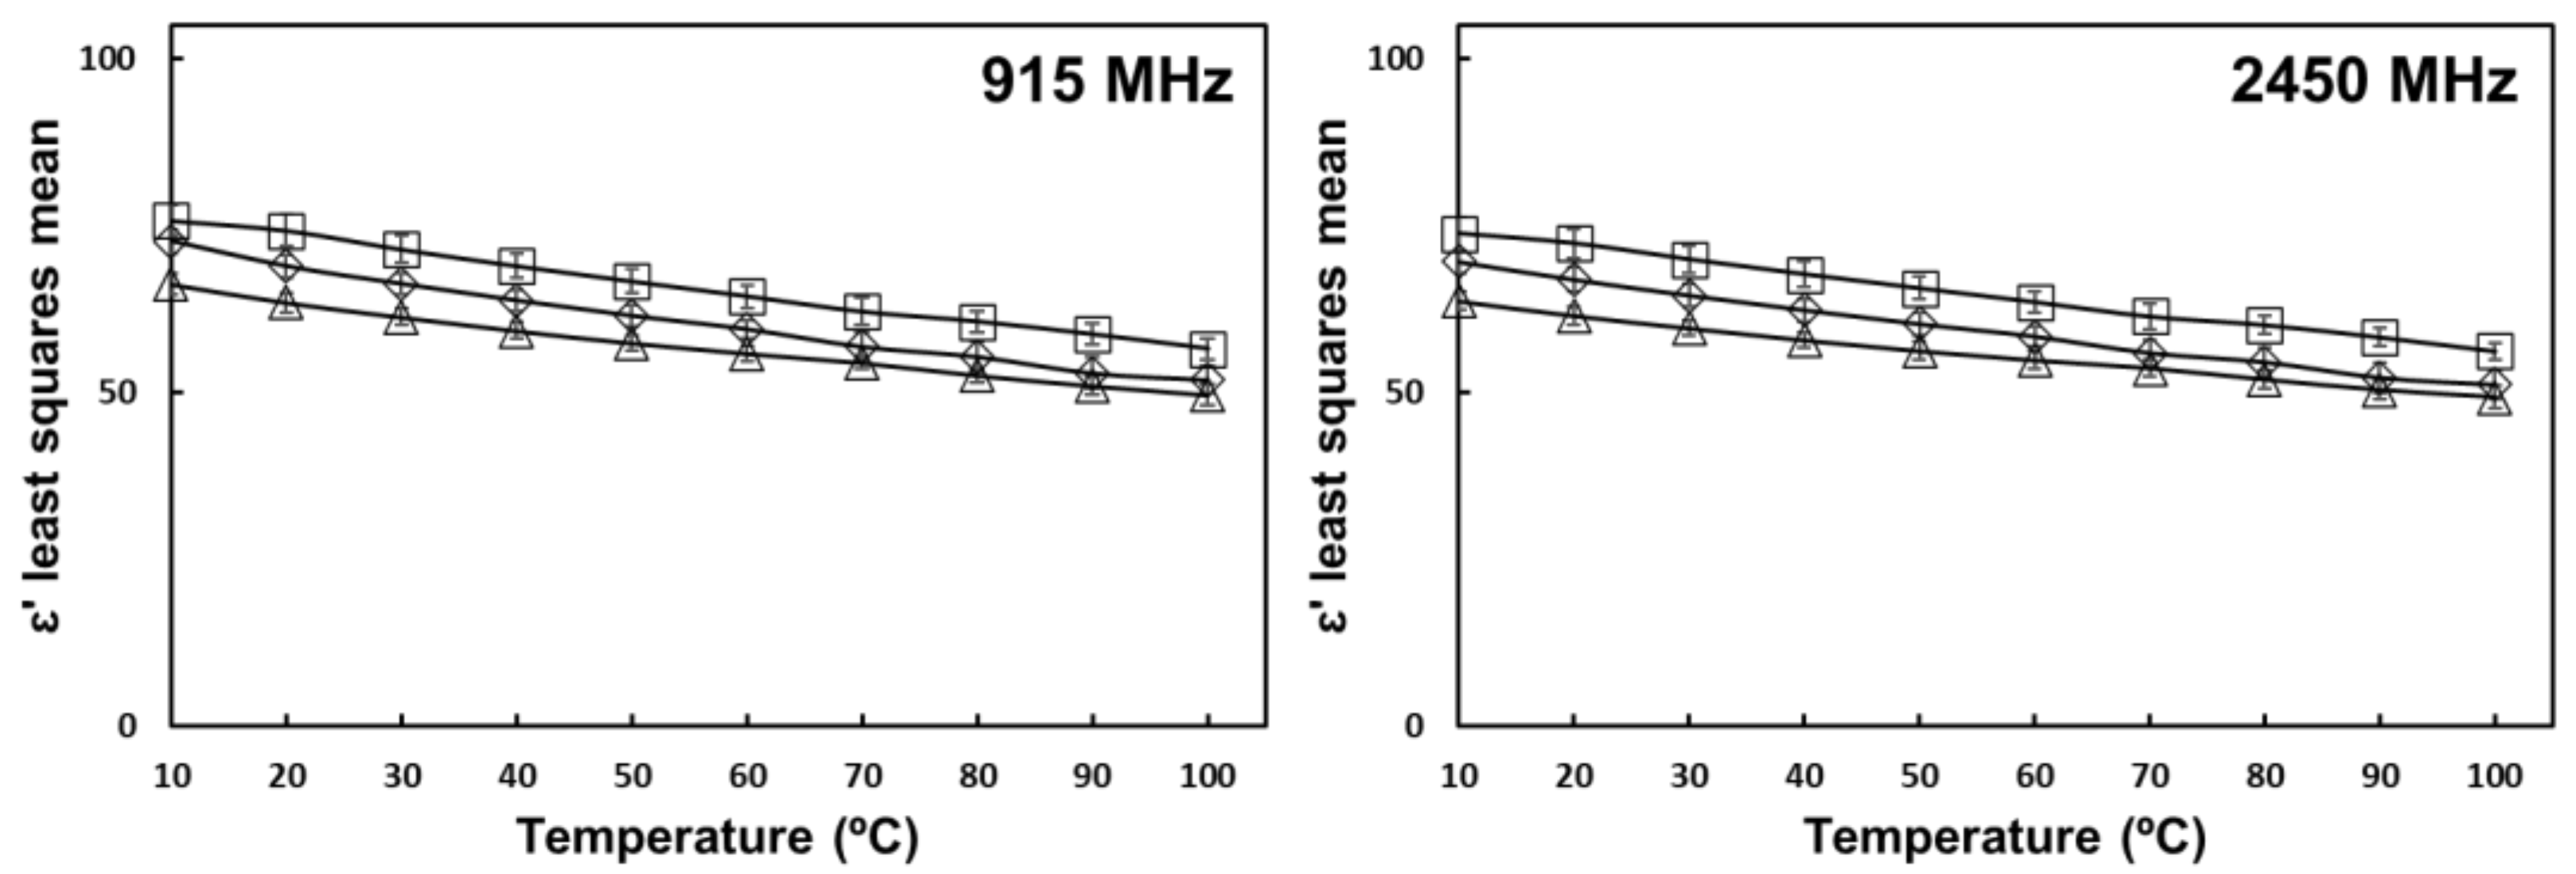 ) 0% salt ( ) 0.5% salt ( ) 1% salt. Error bars correspond to standard deviations.
) 0% salt ( ) 0.5% salt ( ) 1% salt. Error bars correspond to standard deviations.
) 0% salt ( ) 0.5% salt ( ) 1% salt. Error bars correspond to standard deviations.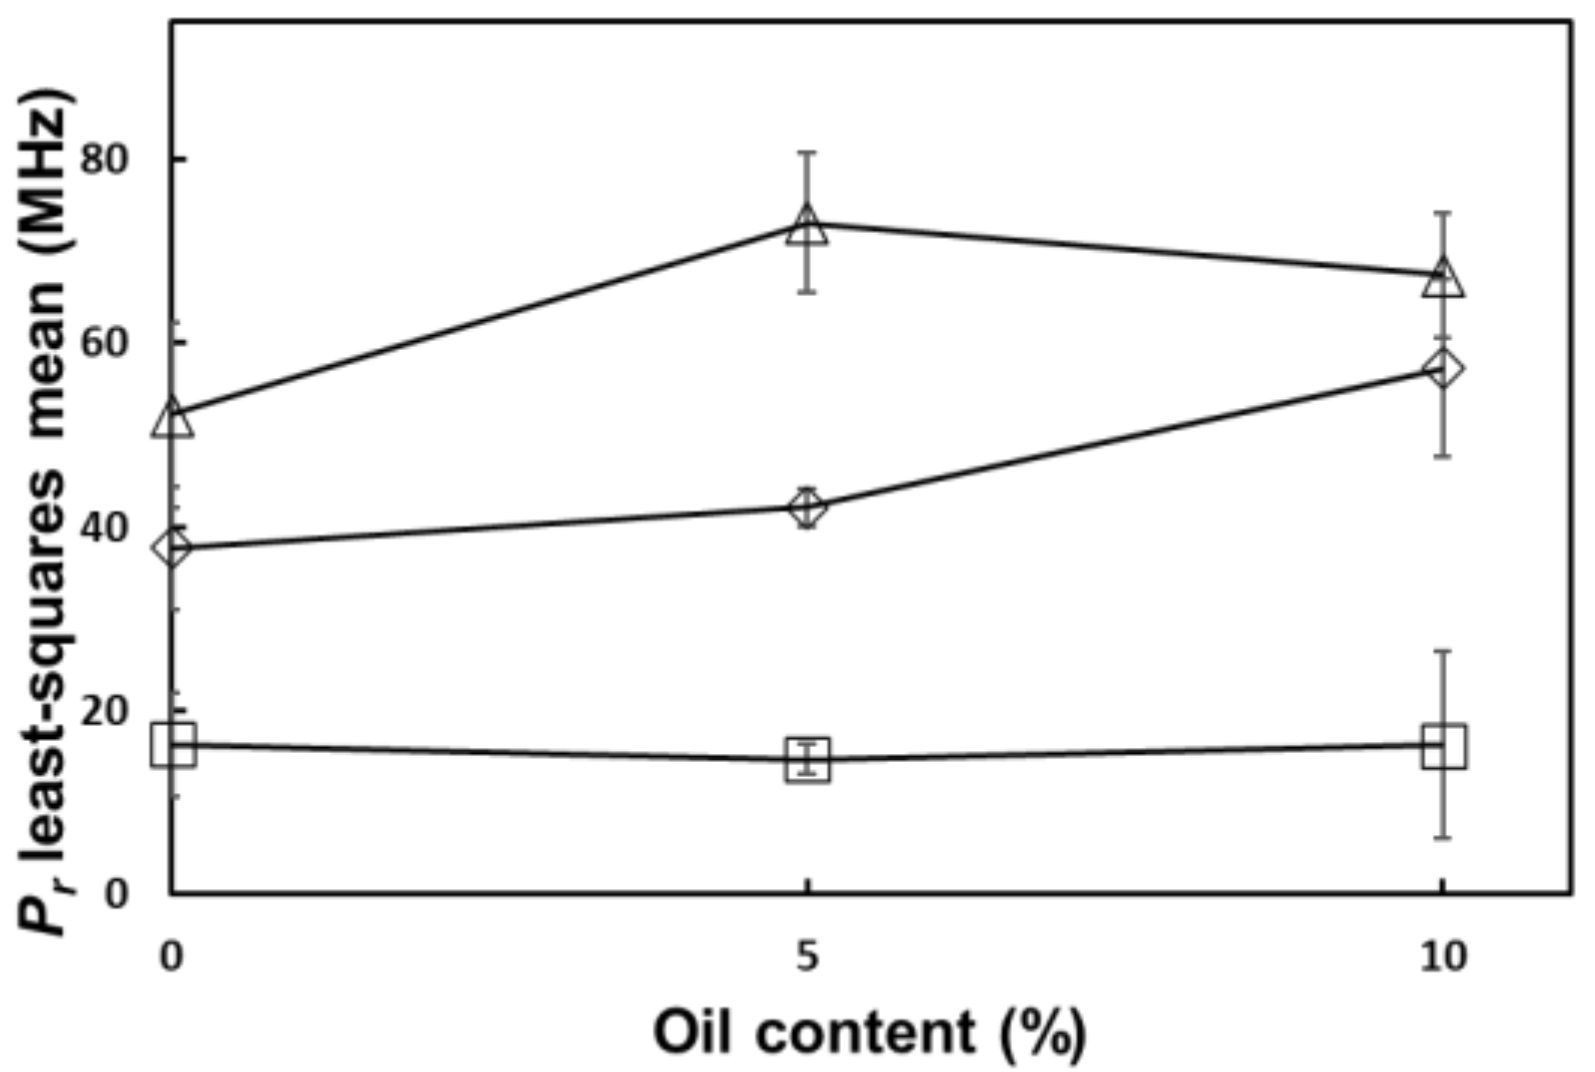 ) 0% salt ( ) 0.5% salt ( ) 1% salt. Error bars correspond to standard deviations.
) 0% salt ( ) 0.5% salt ( ) 1% salt. Error bars correspond to standard deviations.
) 0% salt ( ) 0.5% salt ( ) 1% salt. Error bars correspond to standard deviations.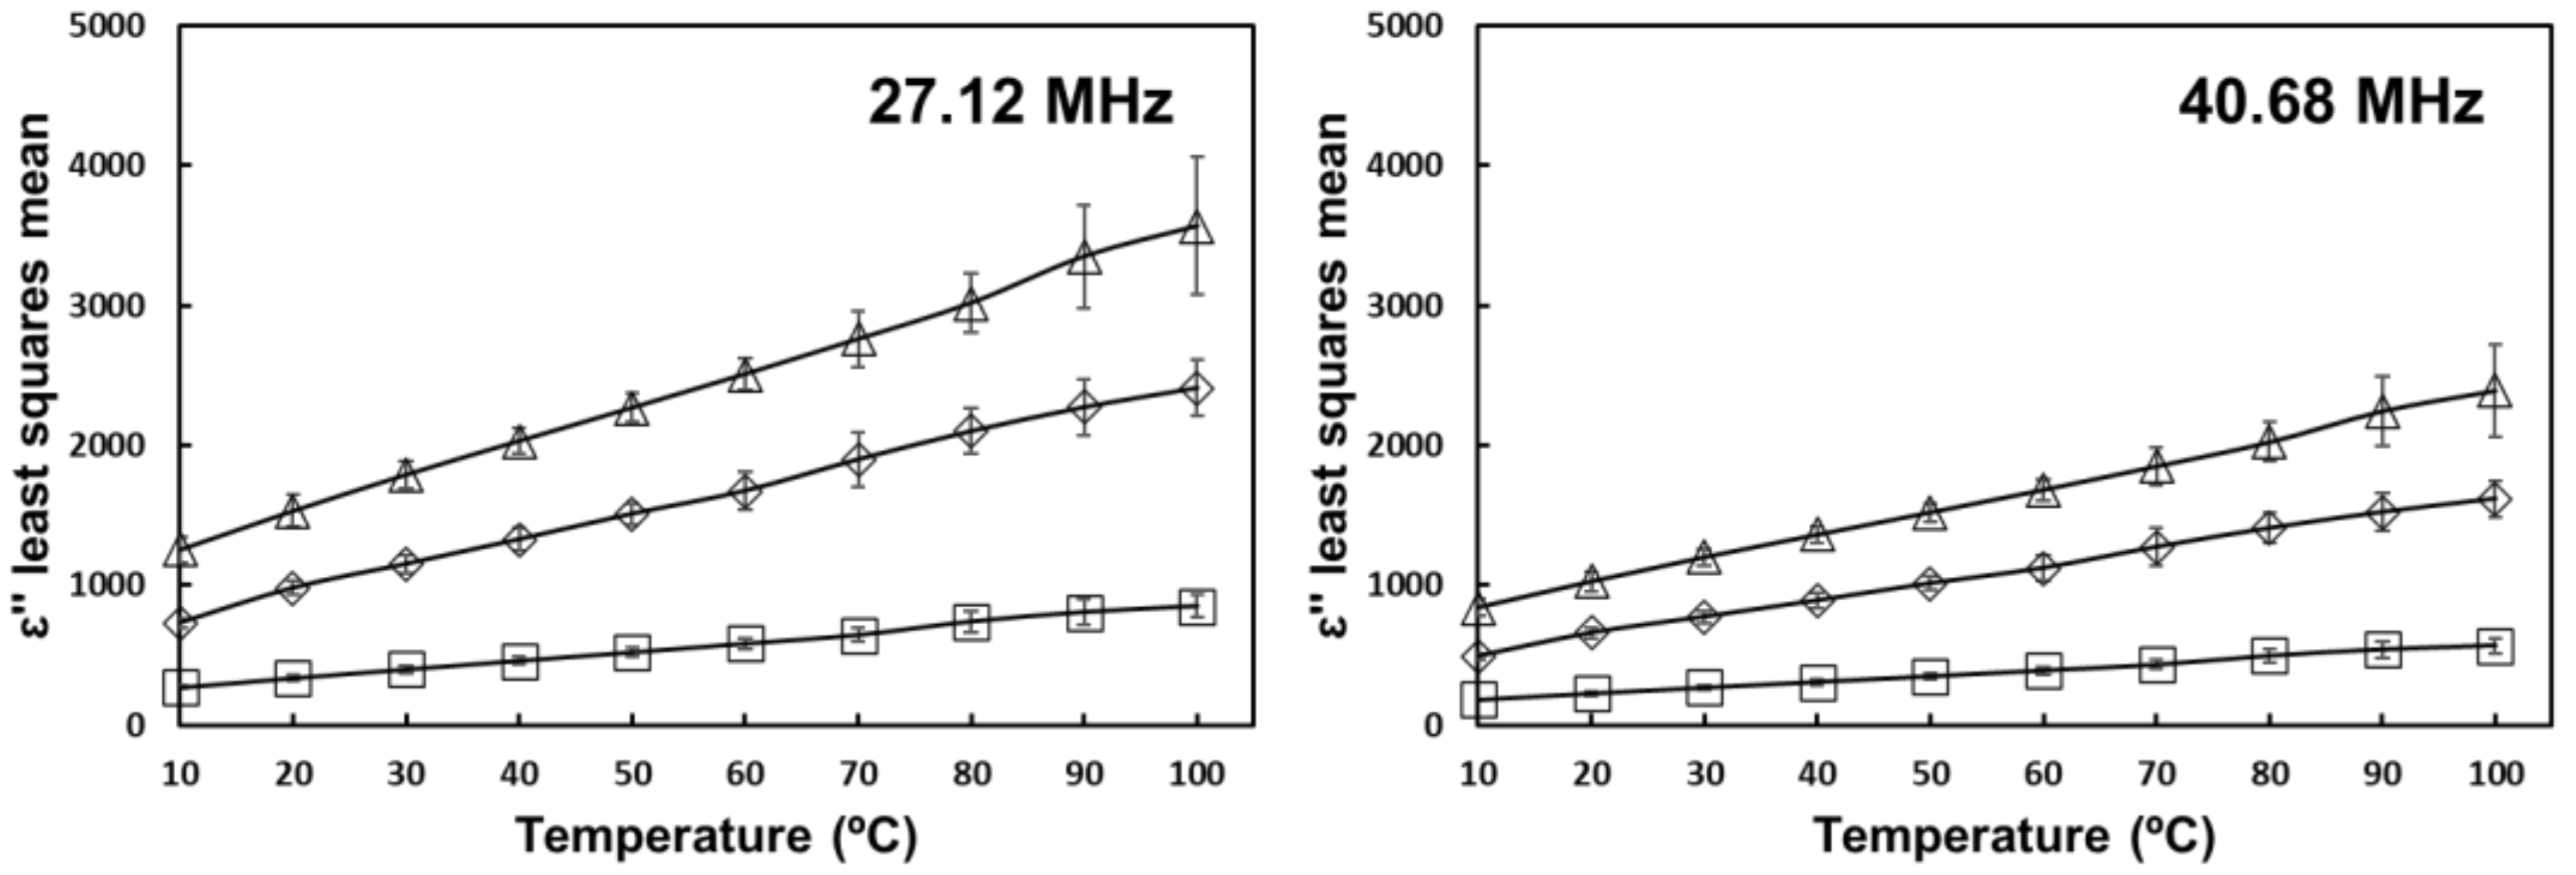 ) 0% salt ( ) 0.5% salt ( ) 1% salt. Error bars correspond to standard deviations.
) 0% salt ( ) 0.5% salt ( ) 1% salt. Error bars correspond to standard deviations.
) 0% salt ( ) 0.5% salt ( ) 1% salt. Error bars correspond to standard deviations.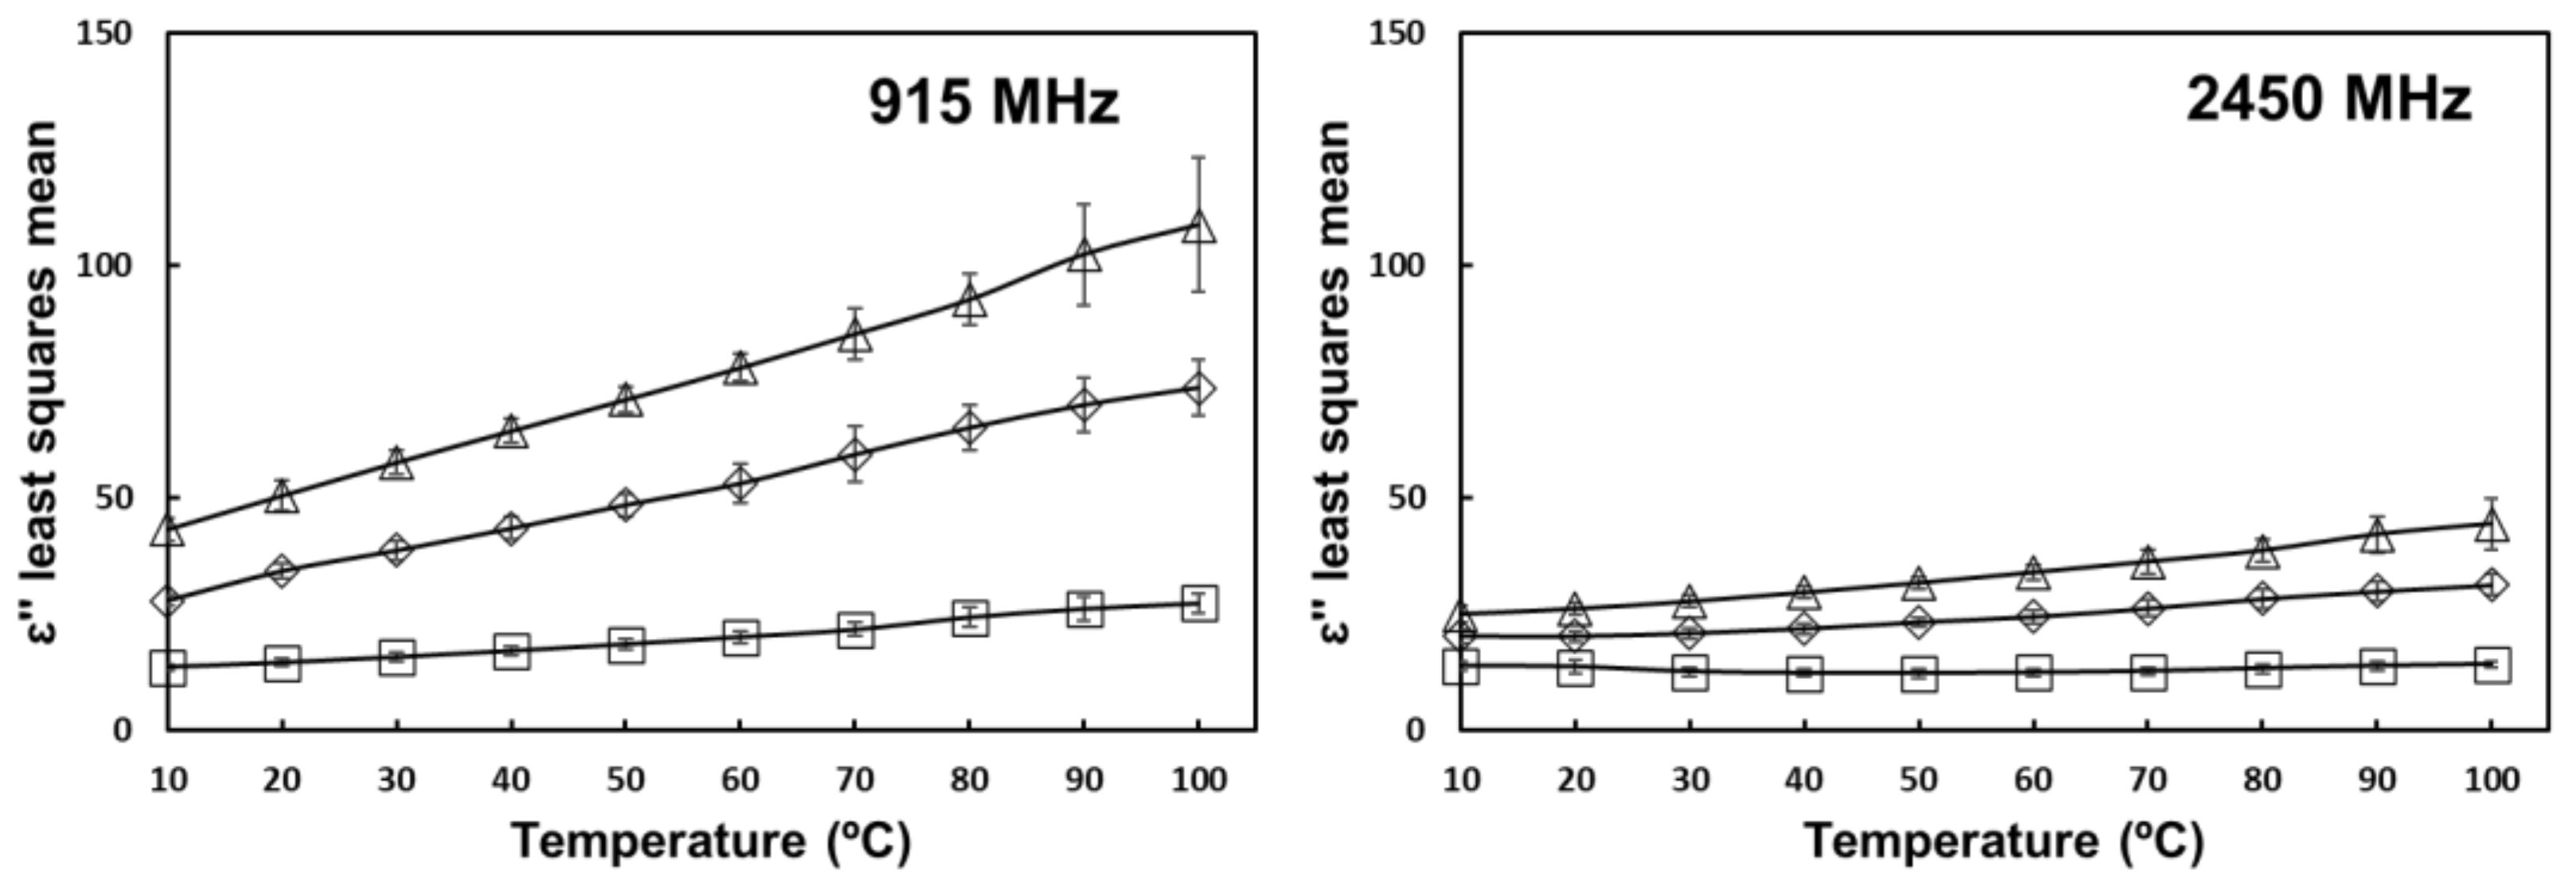 ) 0% salt ( ) 0.5% salt ( ) 1% salt. Error bars correspond to standard deviations.
) 0% salt ( ) 0.5% salt ( ) 1% salt. Error bars correspond to standard deviations.
) 0% salt ( ) 0.5% salt ( ) 1% salt. Error bars correspond to standard deviations. ) 0% salt ( ) 0.5% salt ( ) 1% salt. Error bars correspond to standard deviations.
) 0% salt ( ) 0.5% salt ( ) 1% salt. Error bars correspond to standard deviations.
) 0% salt ( ) 0.5% salt ( ) 1% salt. Error bars correspond to standard deviations.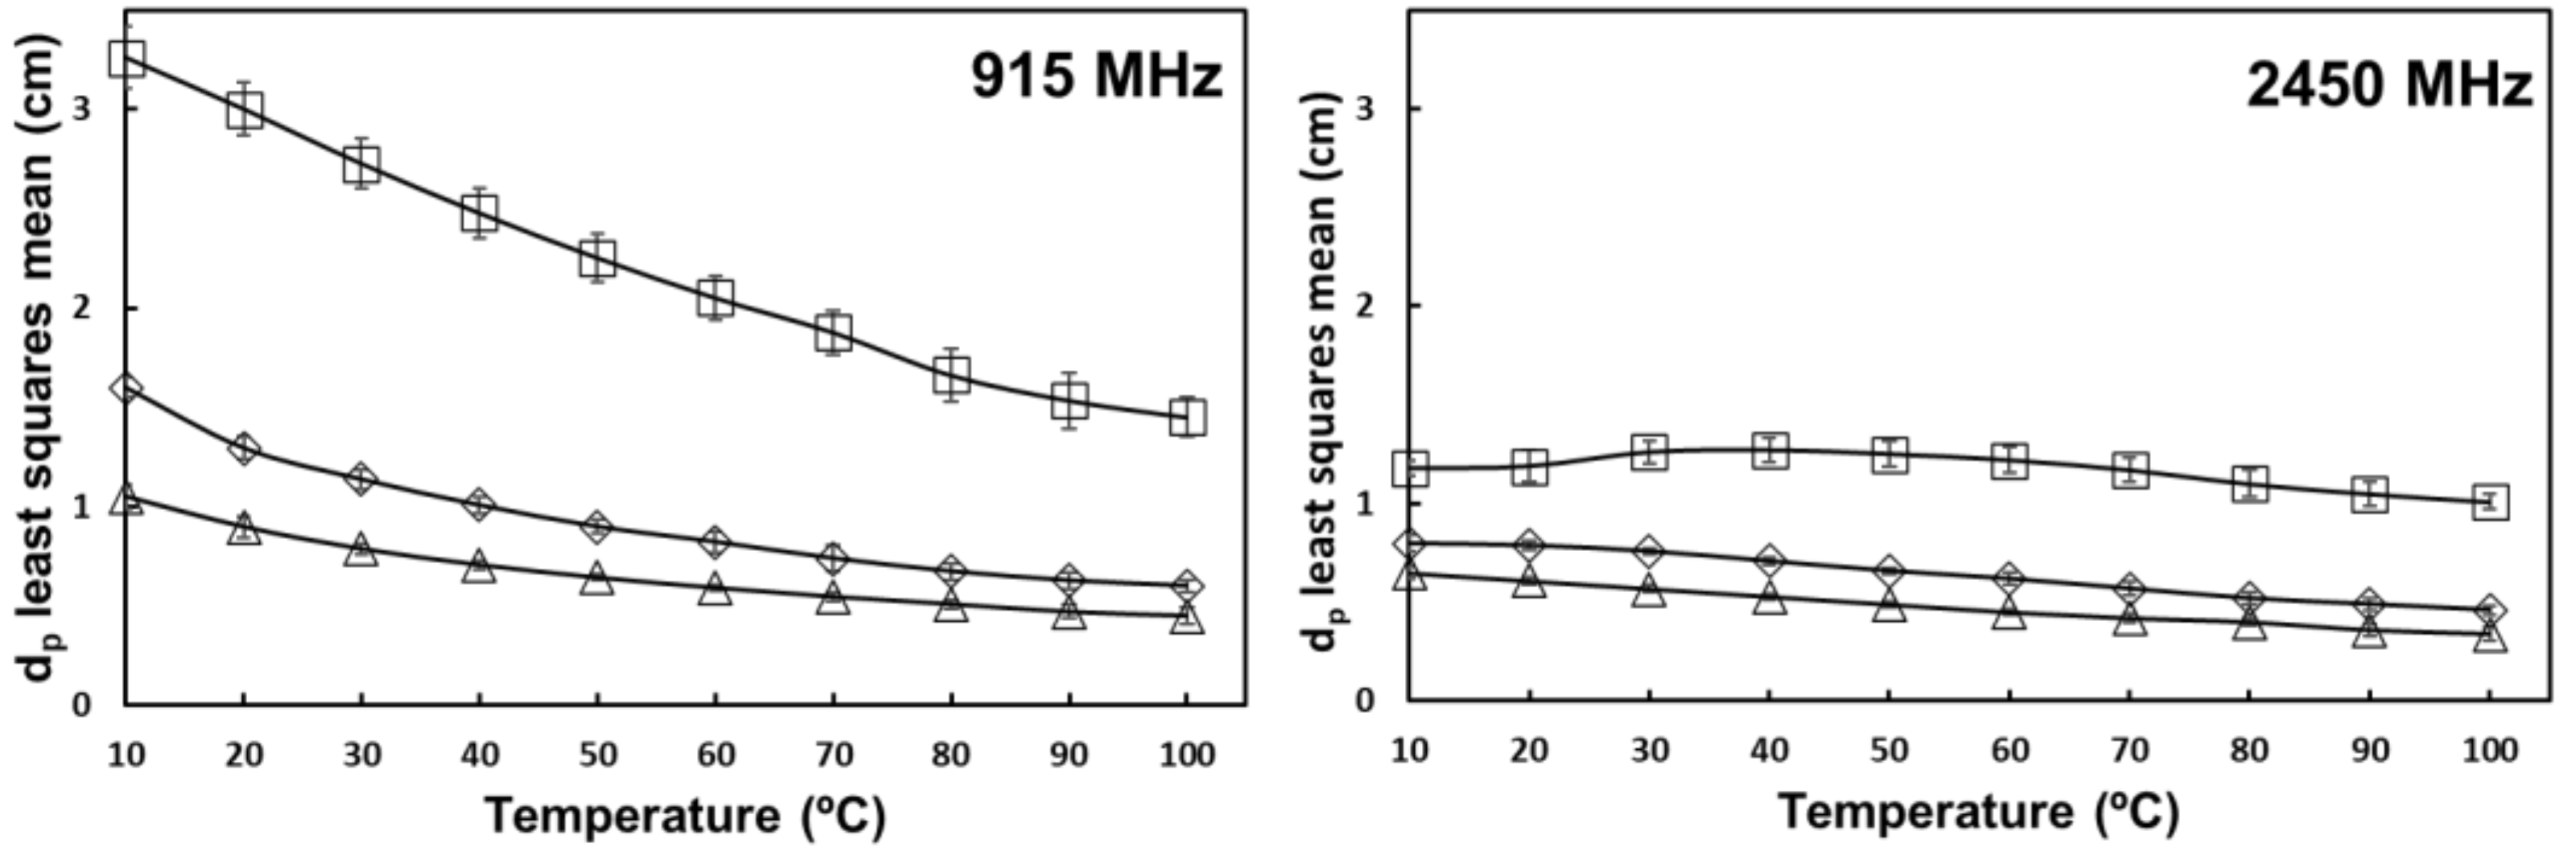

| Frequency (MHz) | RMSE | Salt | Oil | Temperature | Salt * Oil | Salt * Temperature | Oil * Temperature |
|---|---|---|---|---|---|---|---|
| ɛ′ | |||||||
| 27.12 | 5.09 | *** | NS | *** | NS | *** | NS |
| 40.68 | 2.91 | *** | *** | *** | NS | *** | NS |
| 915 | 0.96 | *** | *** | *** | NS | NS | *** |
| 2450 | 0.94 | *** | *** | *** | NS | NS | *** |
| ɛ″ | |||||||
| 27.12 | 127.86 | *** | NS | *** | NS | *** | NS |
| 40.68 | 85.78 | *** | NS | *** | NS | *** | NS |
| 915 | 3.77 | *** | NS | *** | NS | *** | NS |
| 2450 | 1.34 | *** | *** | *** | NS | *** | NS |
| 27.12 | 0.13 | *** | NS | *** | NS | *** | NS |
| 40.68 | 0.11 | *** | NS | *** | NS | *** | NS |
| 915 | 0.06 | *** | NS | *** | NS | *** | NS |
| 2450 | 0.03 | *** | NS | *** | NS | *** | NS |
| - | 6.60 | *** | ** | - | * | - | - |
Publisher’s Note: MDPI stays neutral with regard to jurisdictional claims in published maps and institutional affiliations. |
© 2021 by the authors. Licensee MDPI, Basel, Switzerland. This article is an open access article distributed under the terms and conditions of the Creative Commons Attribution (CC BY) license (https://creativecommons.org/licenses/by/4.0/).
Share and Cite
Abea, A.; Gou, P.; Guardia, M.D.; Bañon, S.; Muñoz, I. Combined Effect of Temperature and Oil and Salt Contents on the Variation of Dielectric Properties of a Tomato-Based Homogenate. Foods 2021, 10, 3124. https://doi.org/10.3390/foods10123124
Abea A, Gou P, Guardia MD, Bañon S, Muñoz I. Combined Effect of Temperature and Oil and Salt Contents on the Variation of Dielectric Properties of a Tomato-Based Homogenate. Foods. 2021; 10(12):3124. https://doi.org/10.3390/foods10123124
Chicago/Turabian StyleAbea, Andres, Pere Gou, Maria Dolors Guardia, Sancho Bañon, and Israel Muñoz. 2021. "Combined Effect of Temperature and Oil and Salt Contents on the Variation of Dielectric Properties of a Tomato-Based Homogenate" Foods 10, no. 12: 3124. https://doi.org/10.3390/foods10123124