
Shelf-Life Prediction and Critical Value of Quality Index of Sichuan Sauerkraut Based on Kinetic Model and Principal Component Analysis


Abstract
:1. Introduction
2. Materials and Methods
2.1. Sichuan Sauerkraut Sample
2.2. Determination of Texture
2.3. Determination of Color
2.4. Determination of Total Acid
2.5. Microbiological Analysis
2.6. Determination of Flavor
2.7. Determination of Taste
2.8. Near Infrared Test
2.9. Sensory Evaluation
2.10. Dynamic Equation during Storage
2.11. Establish BP-ANN Model
2.12. Data Analysis
3. Results and Discussion
3.1. Texture
3.2. Color
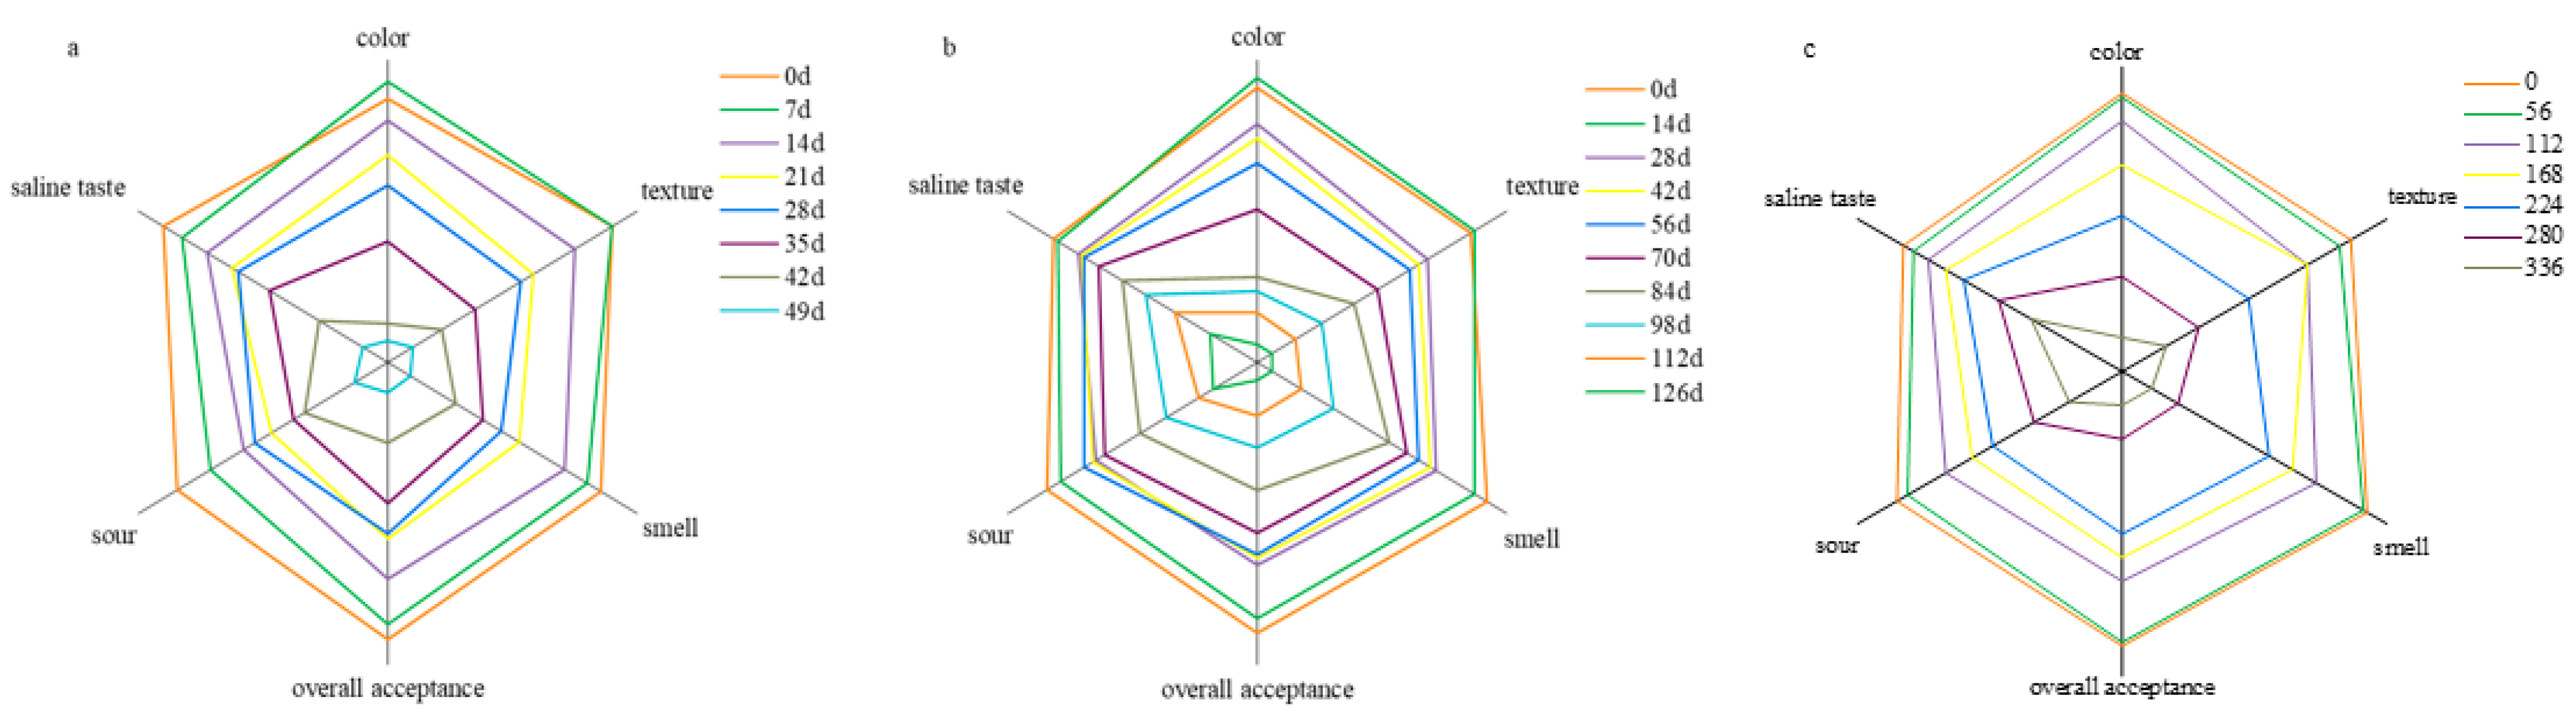
3.3. Sensory Evaluation
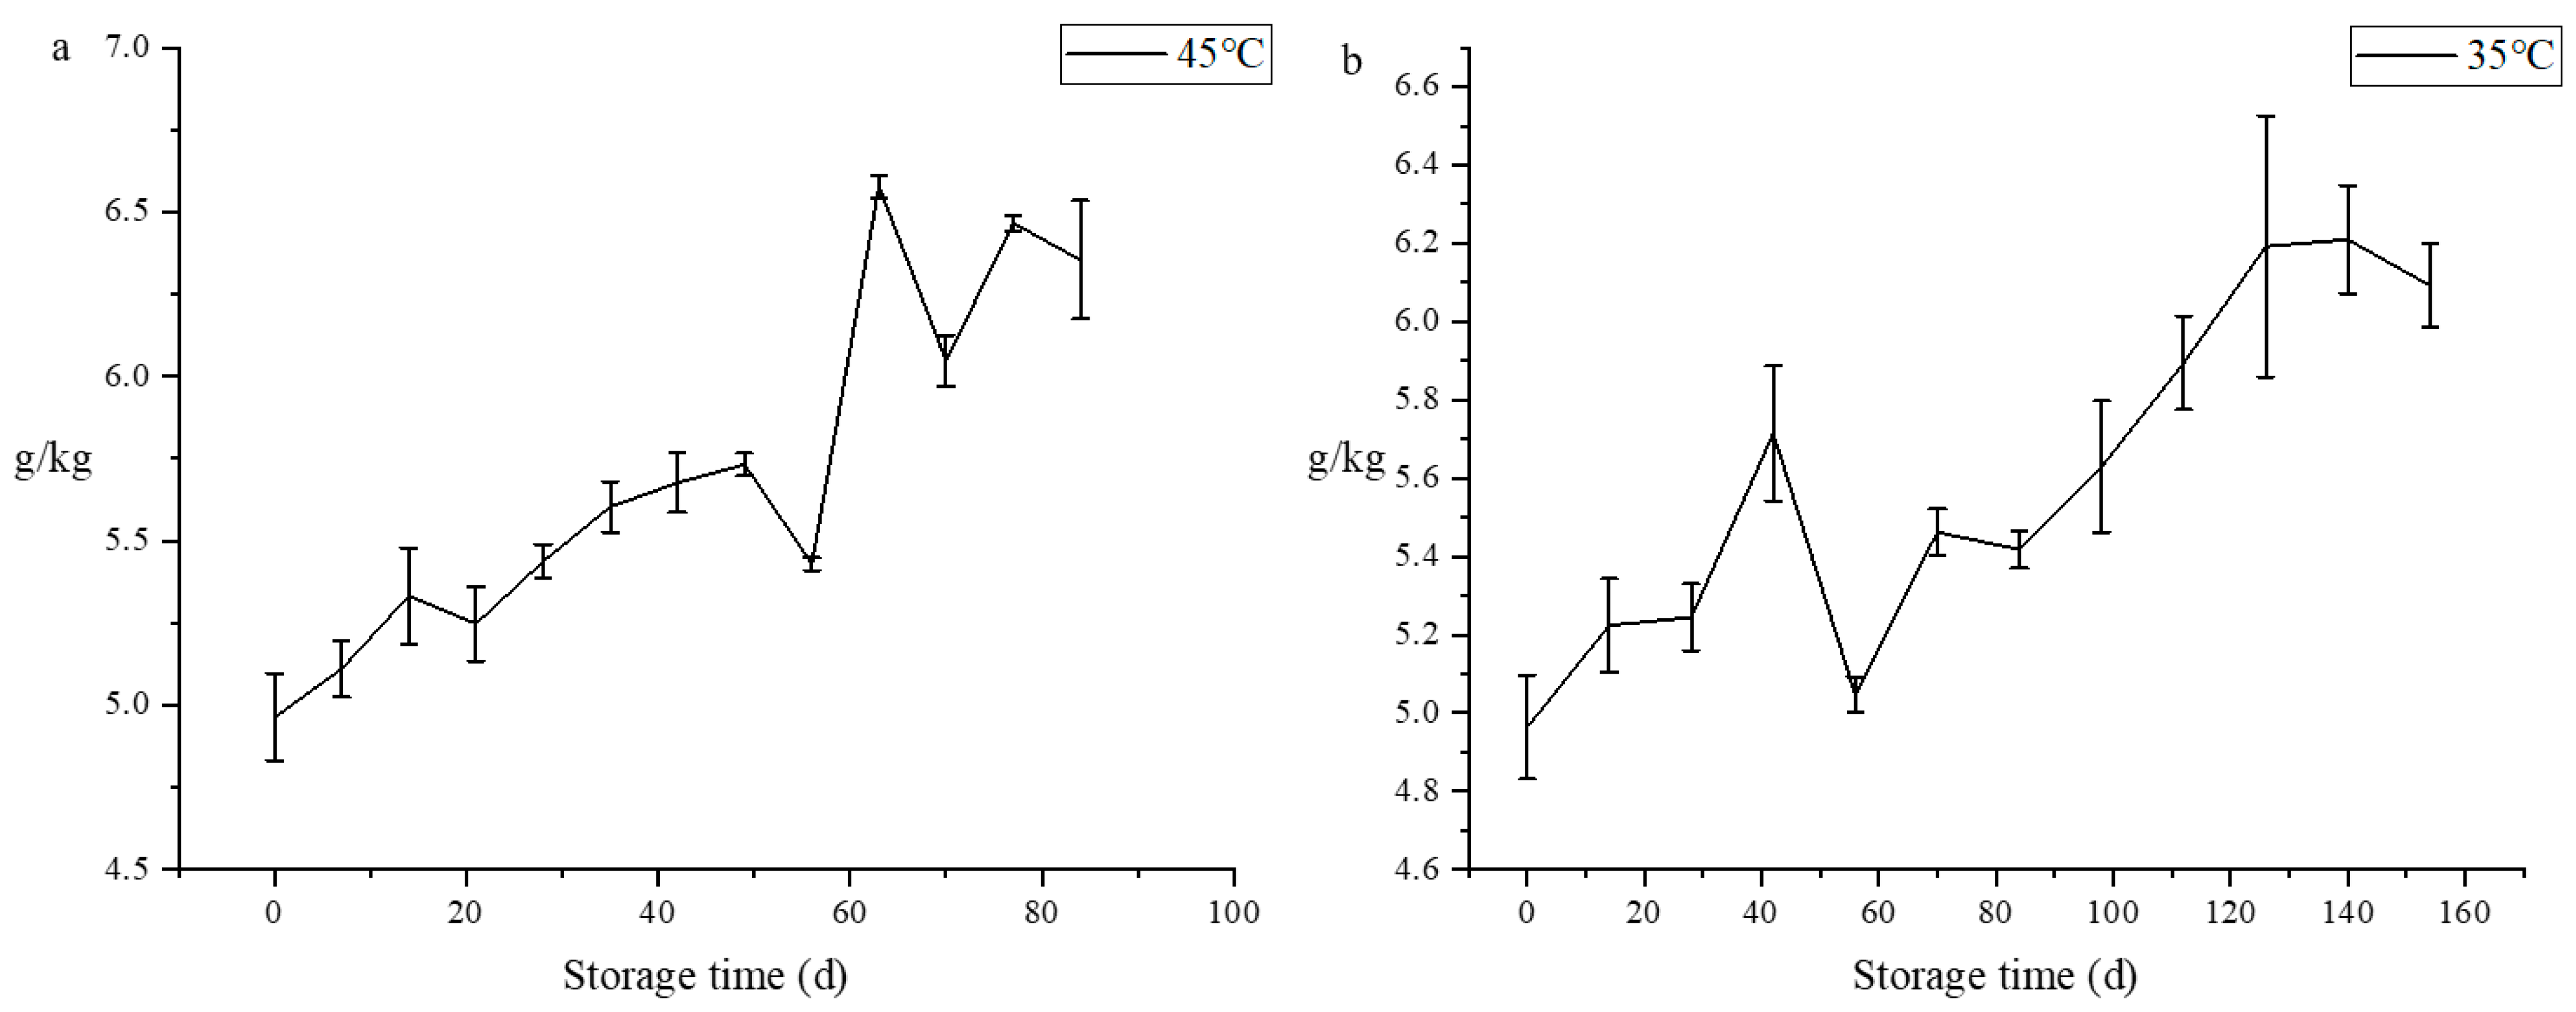
3.4. Total Acid
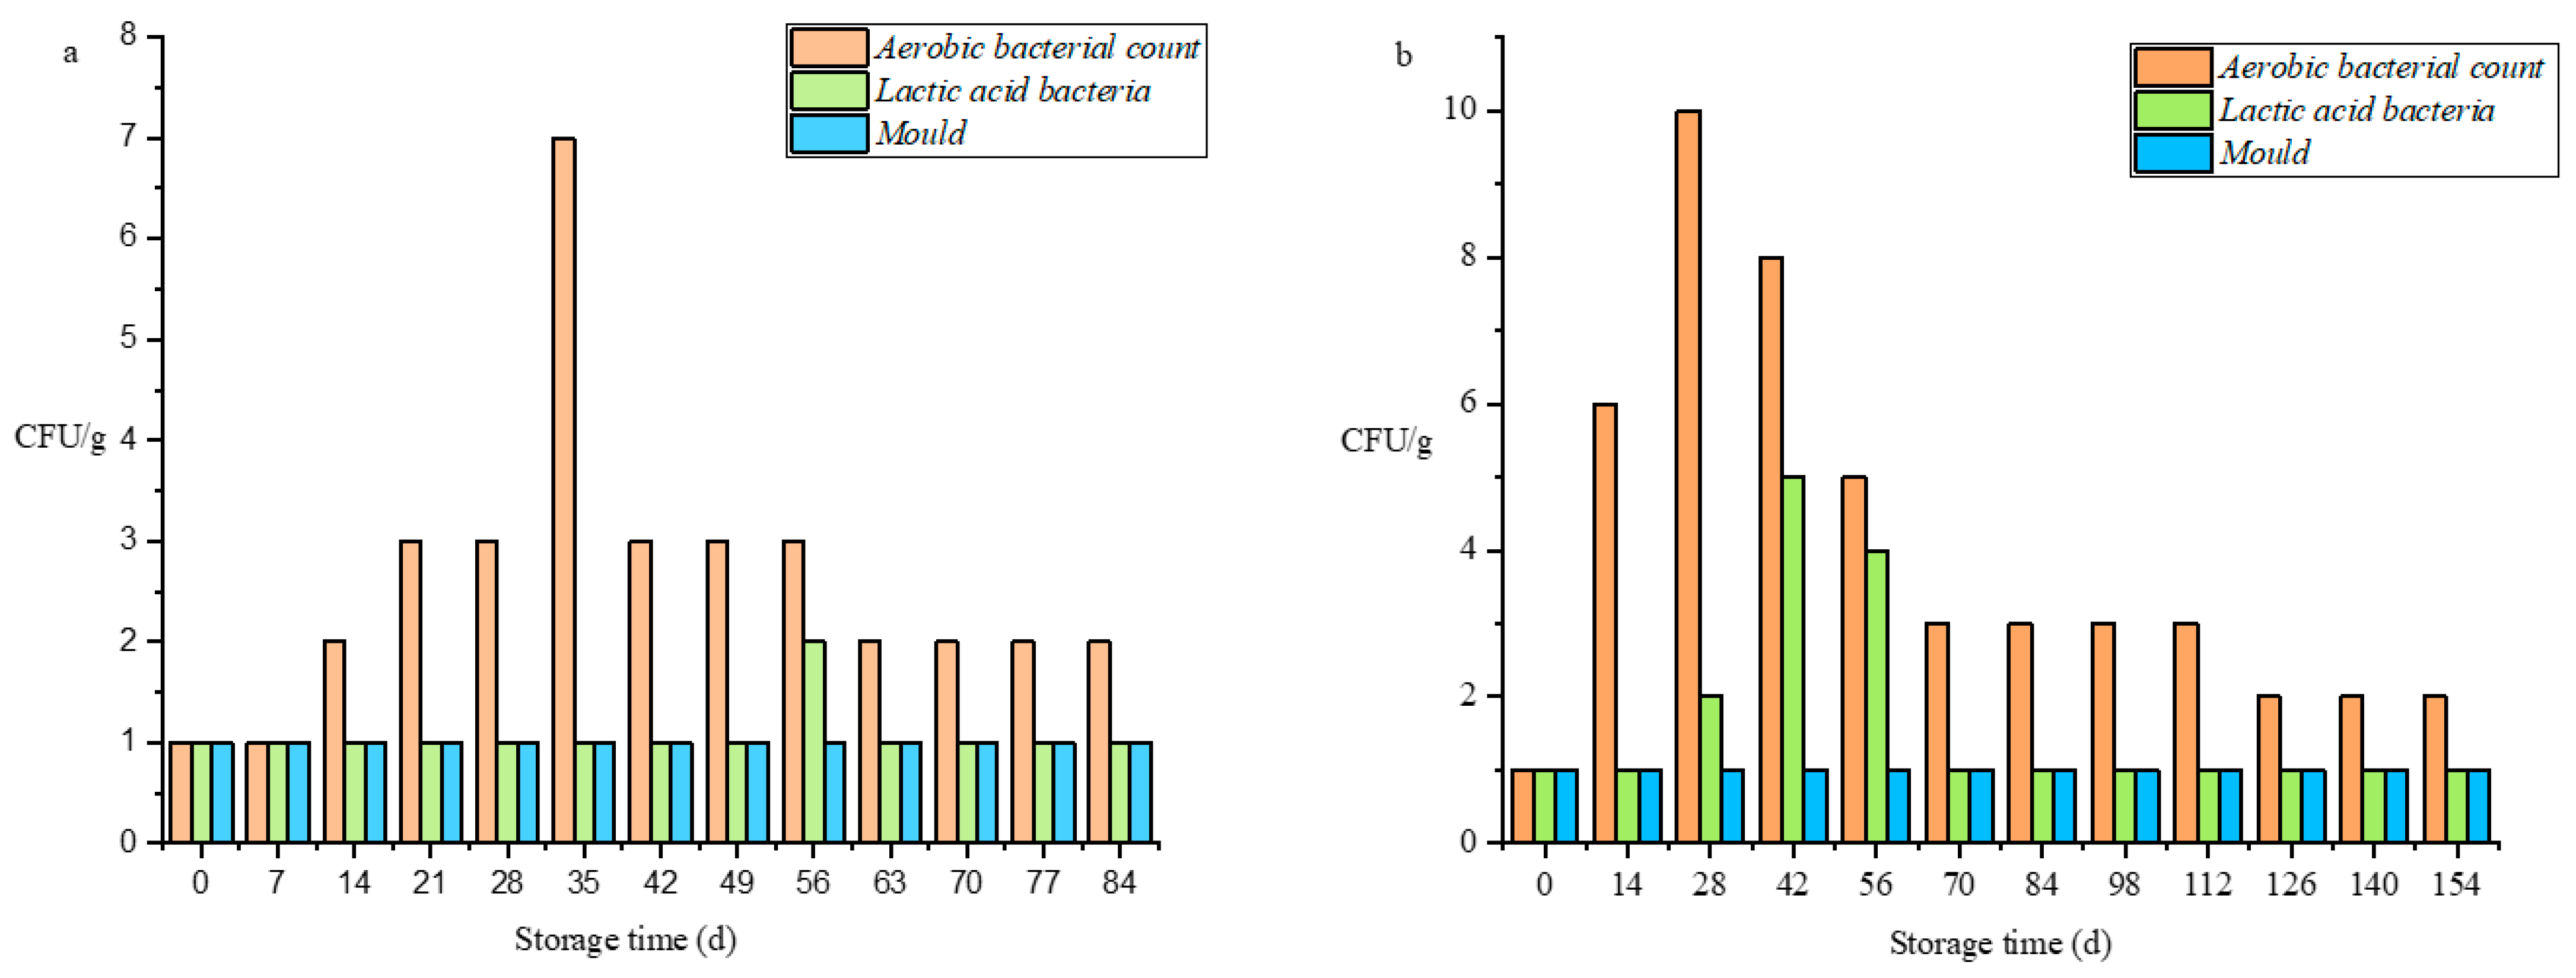
3.5. Microorganism
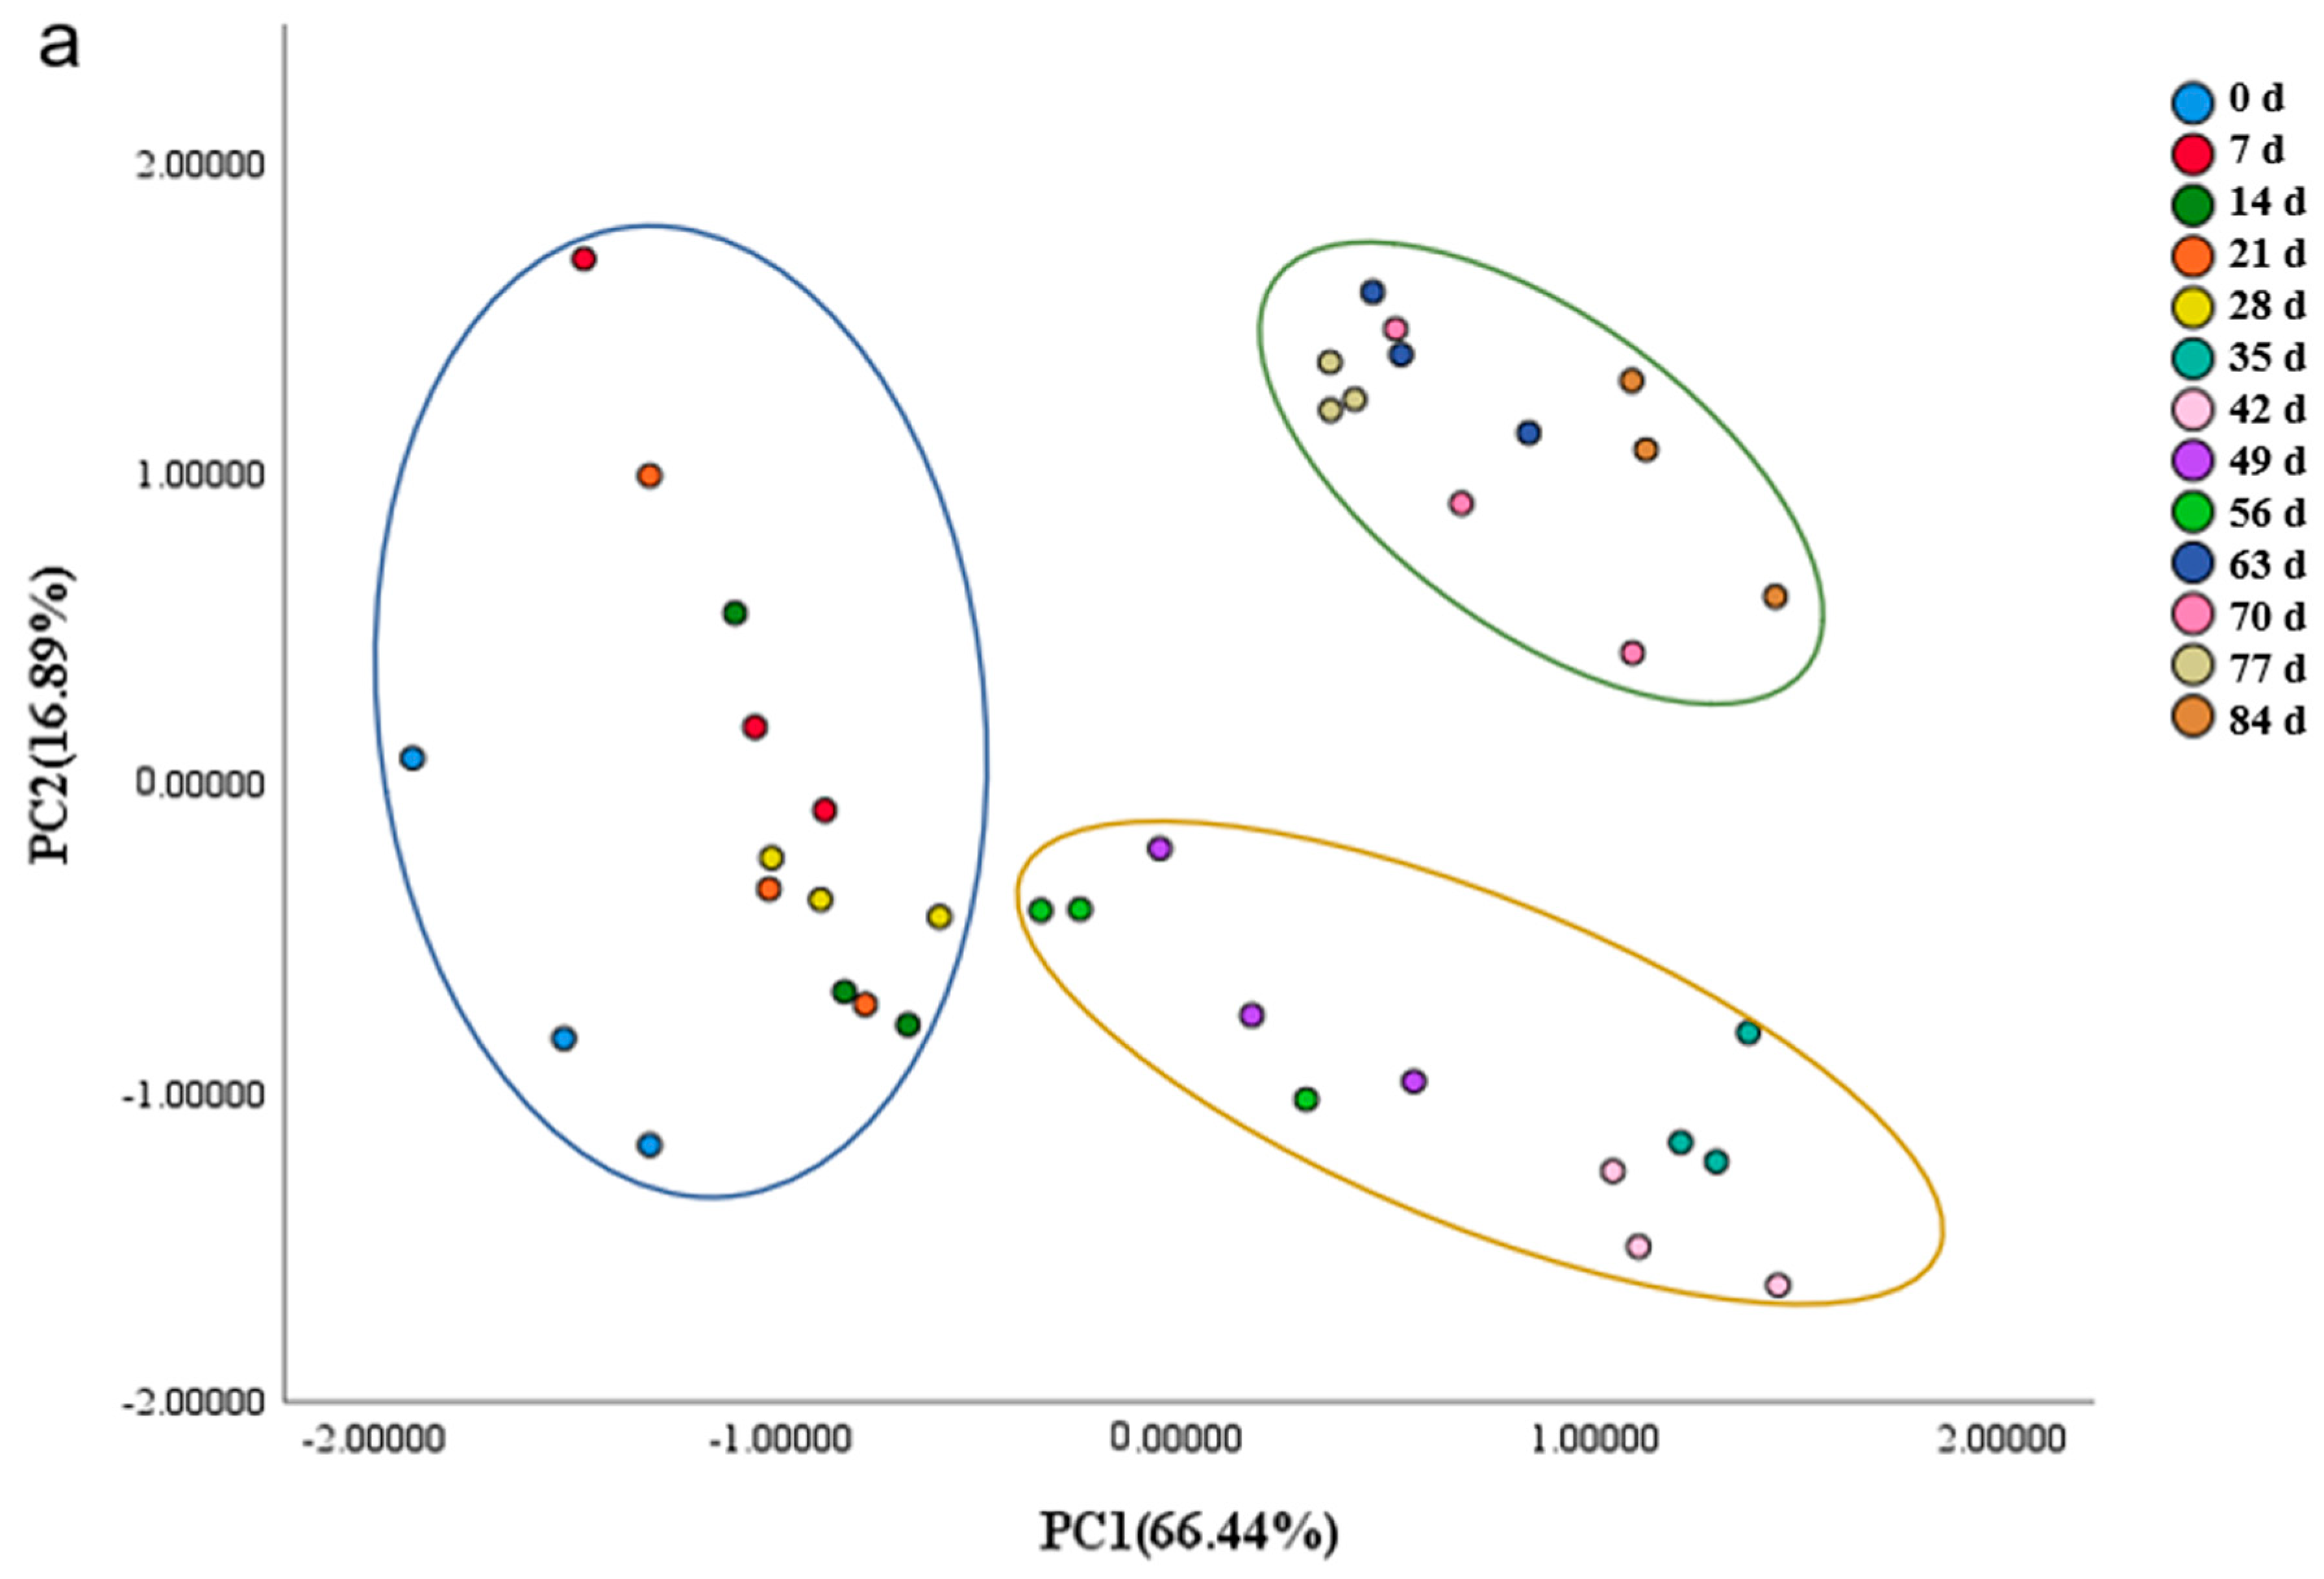
3.6. Volatiles and Taste
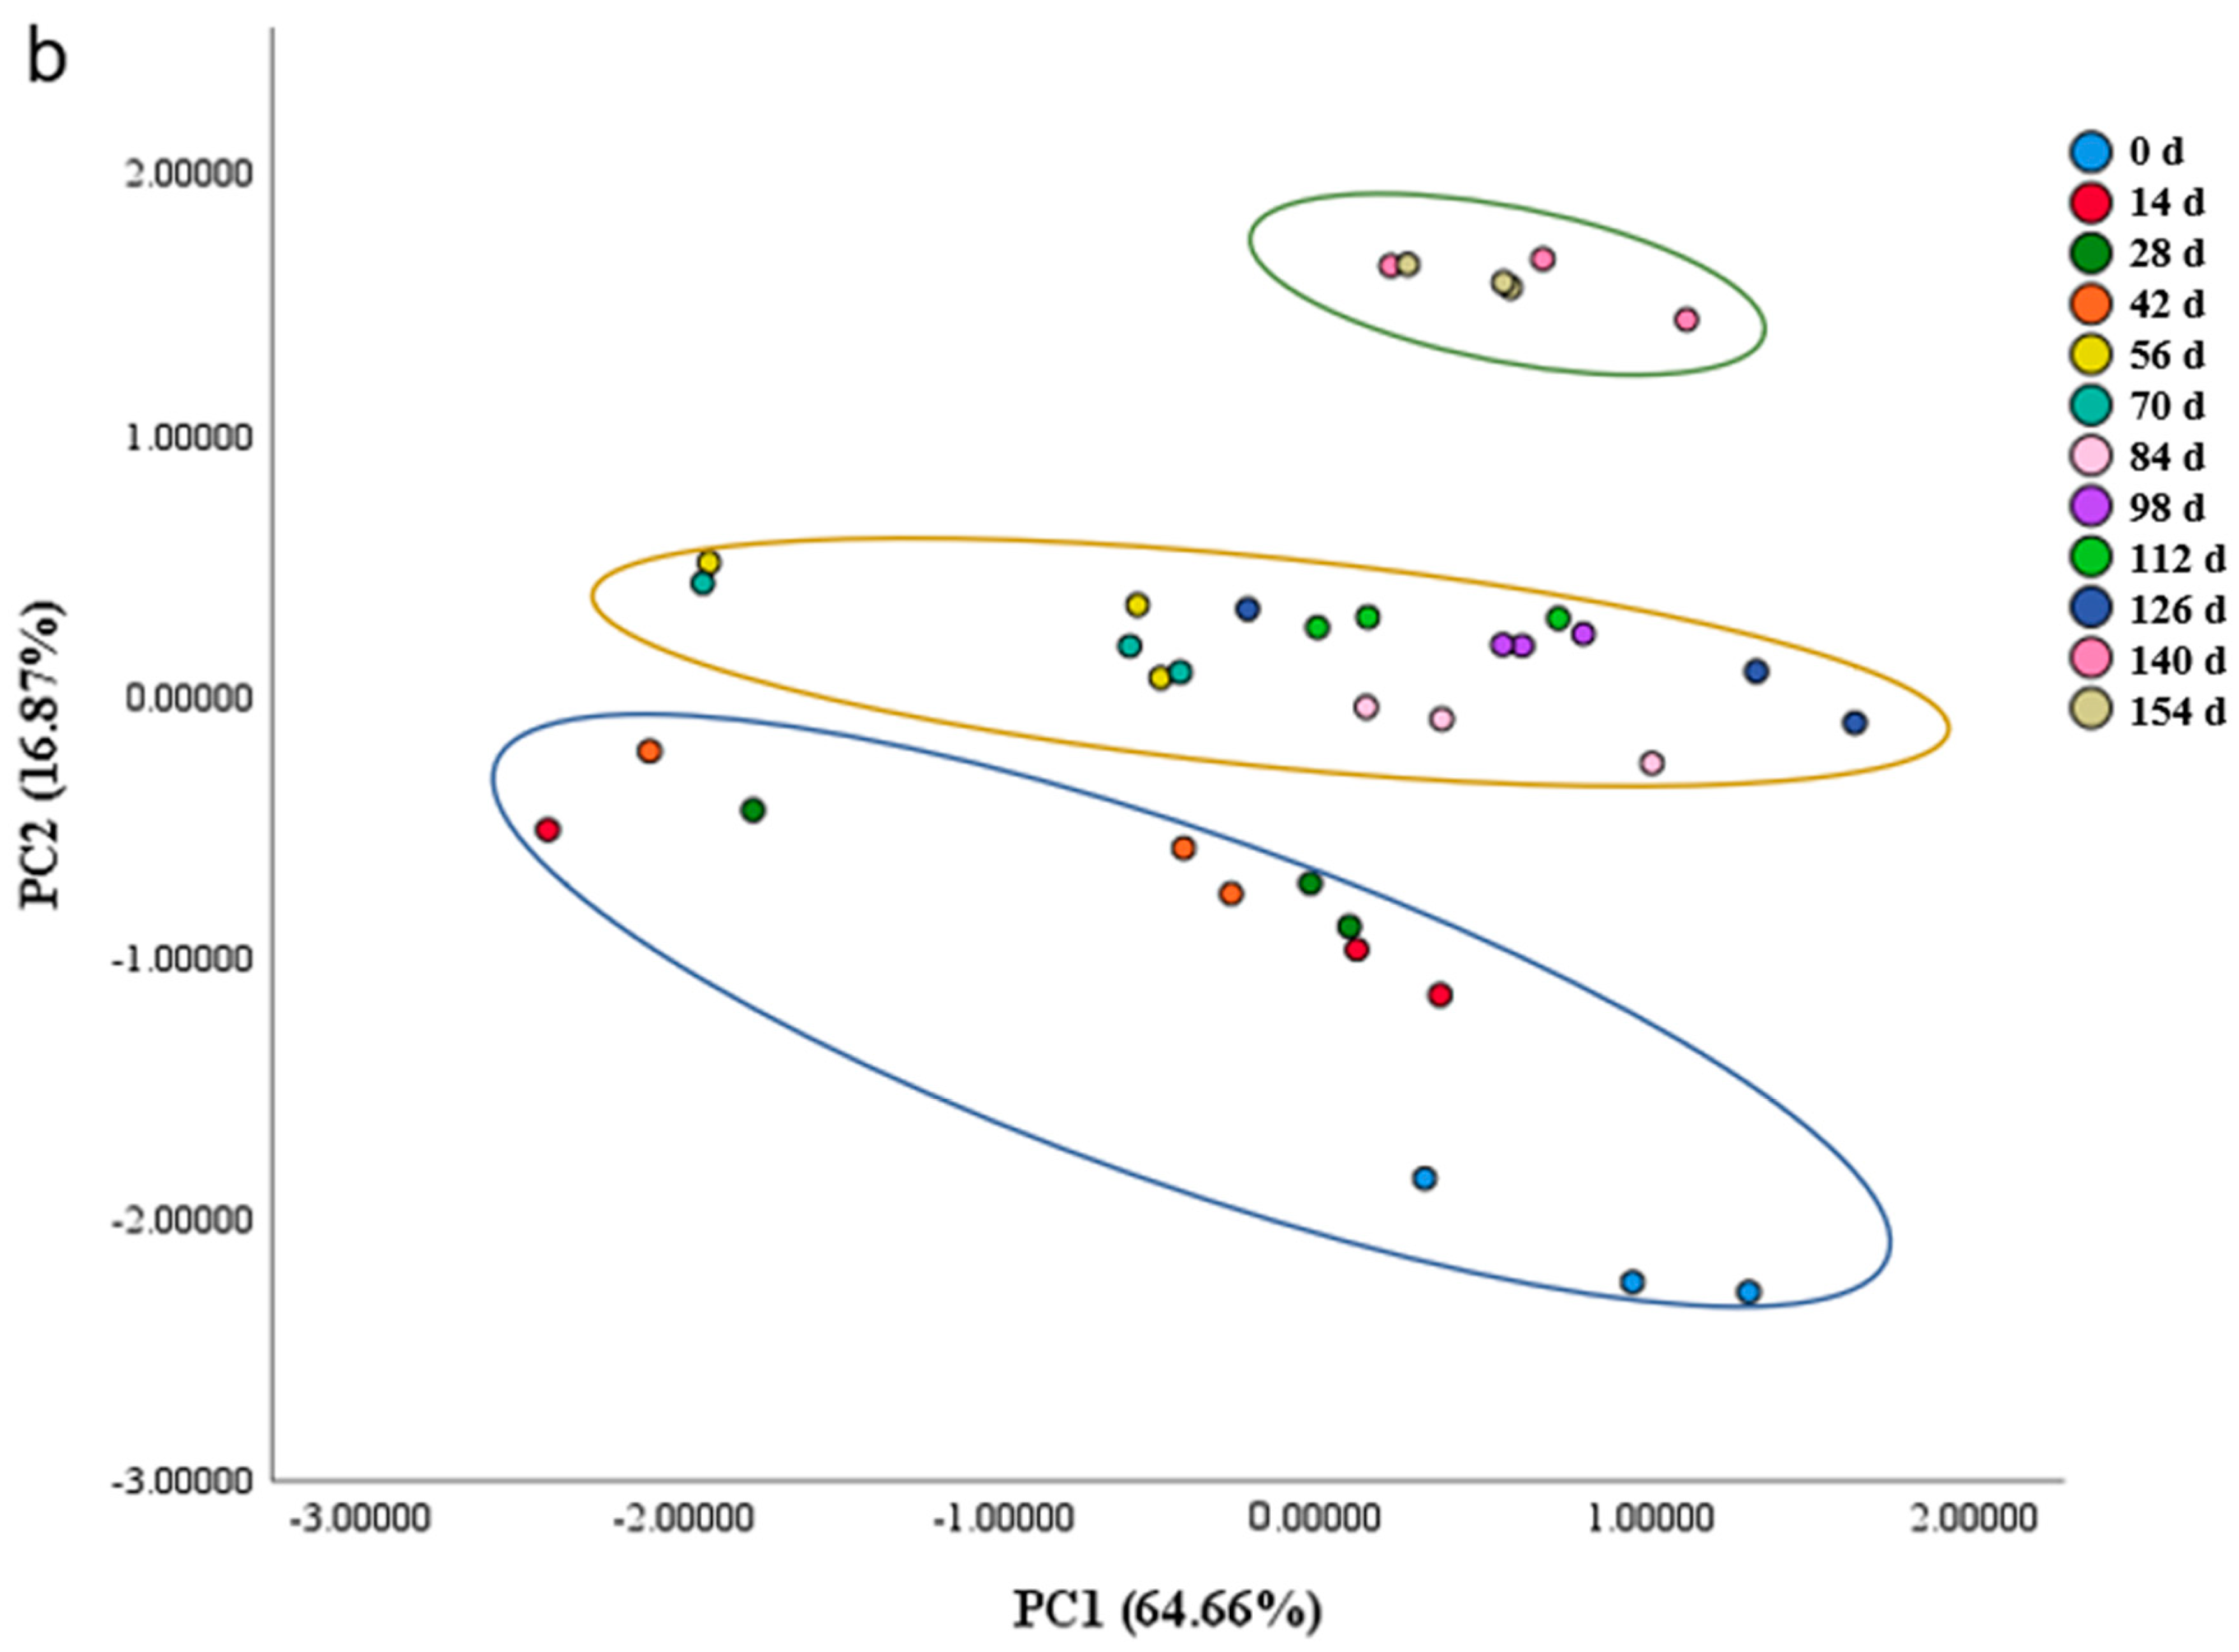
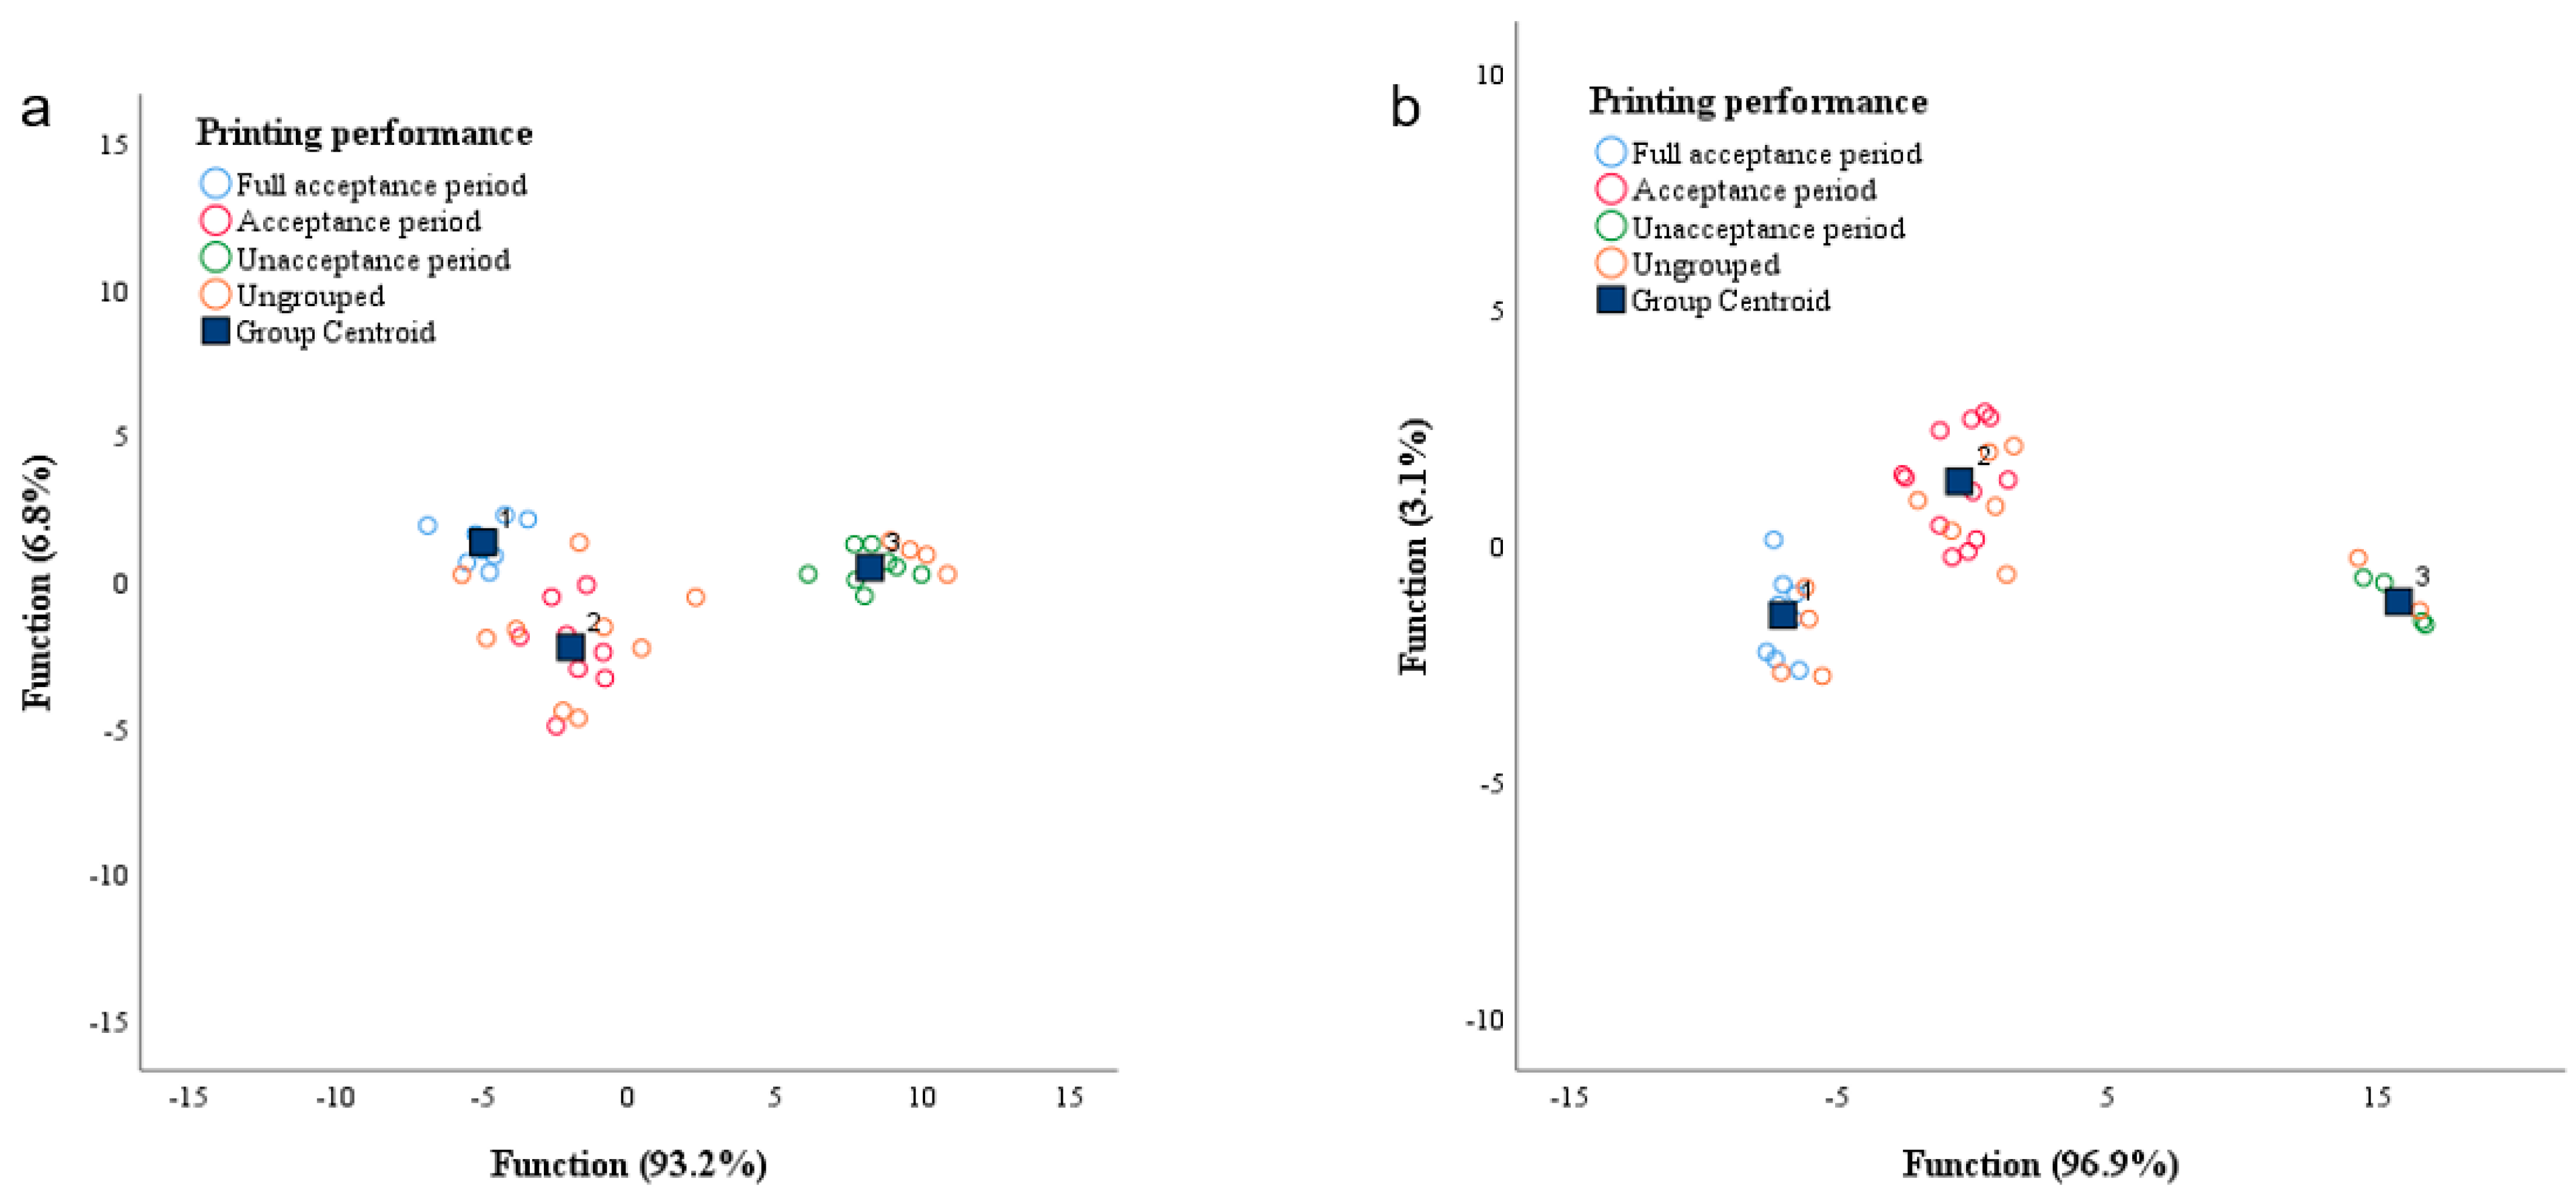
3.7. NIR Spectrum Characteristics
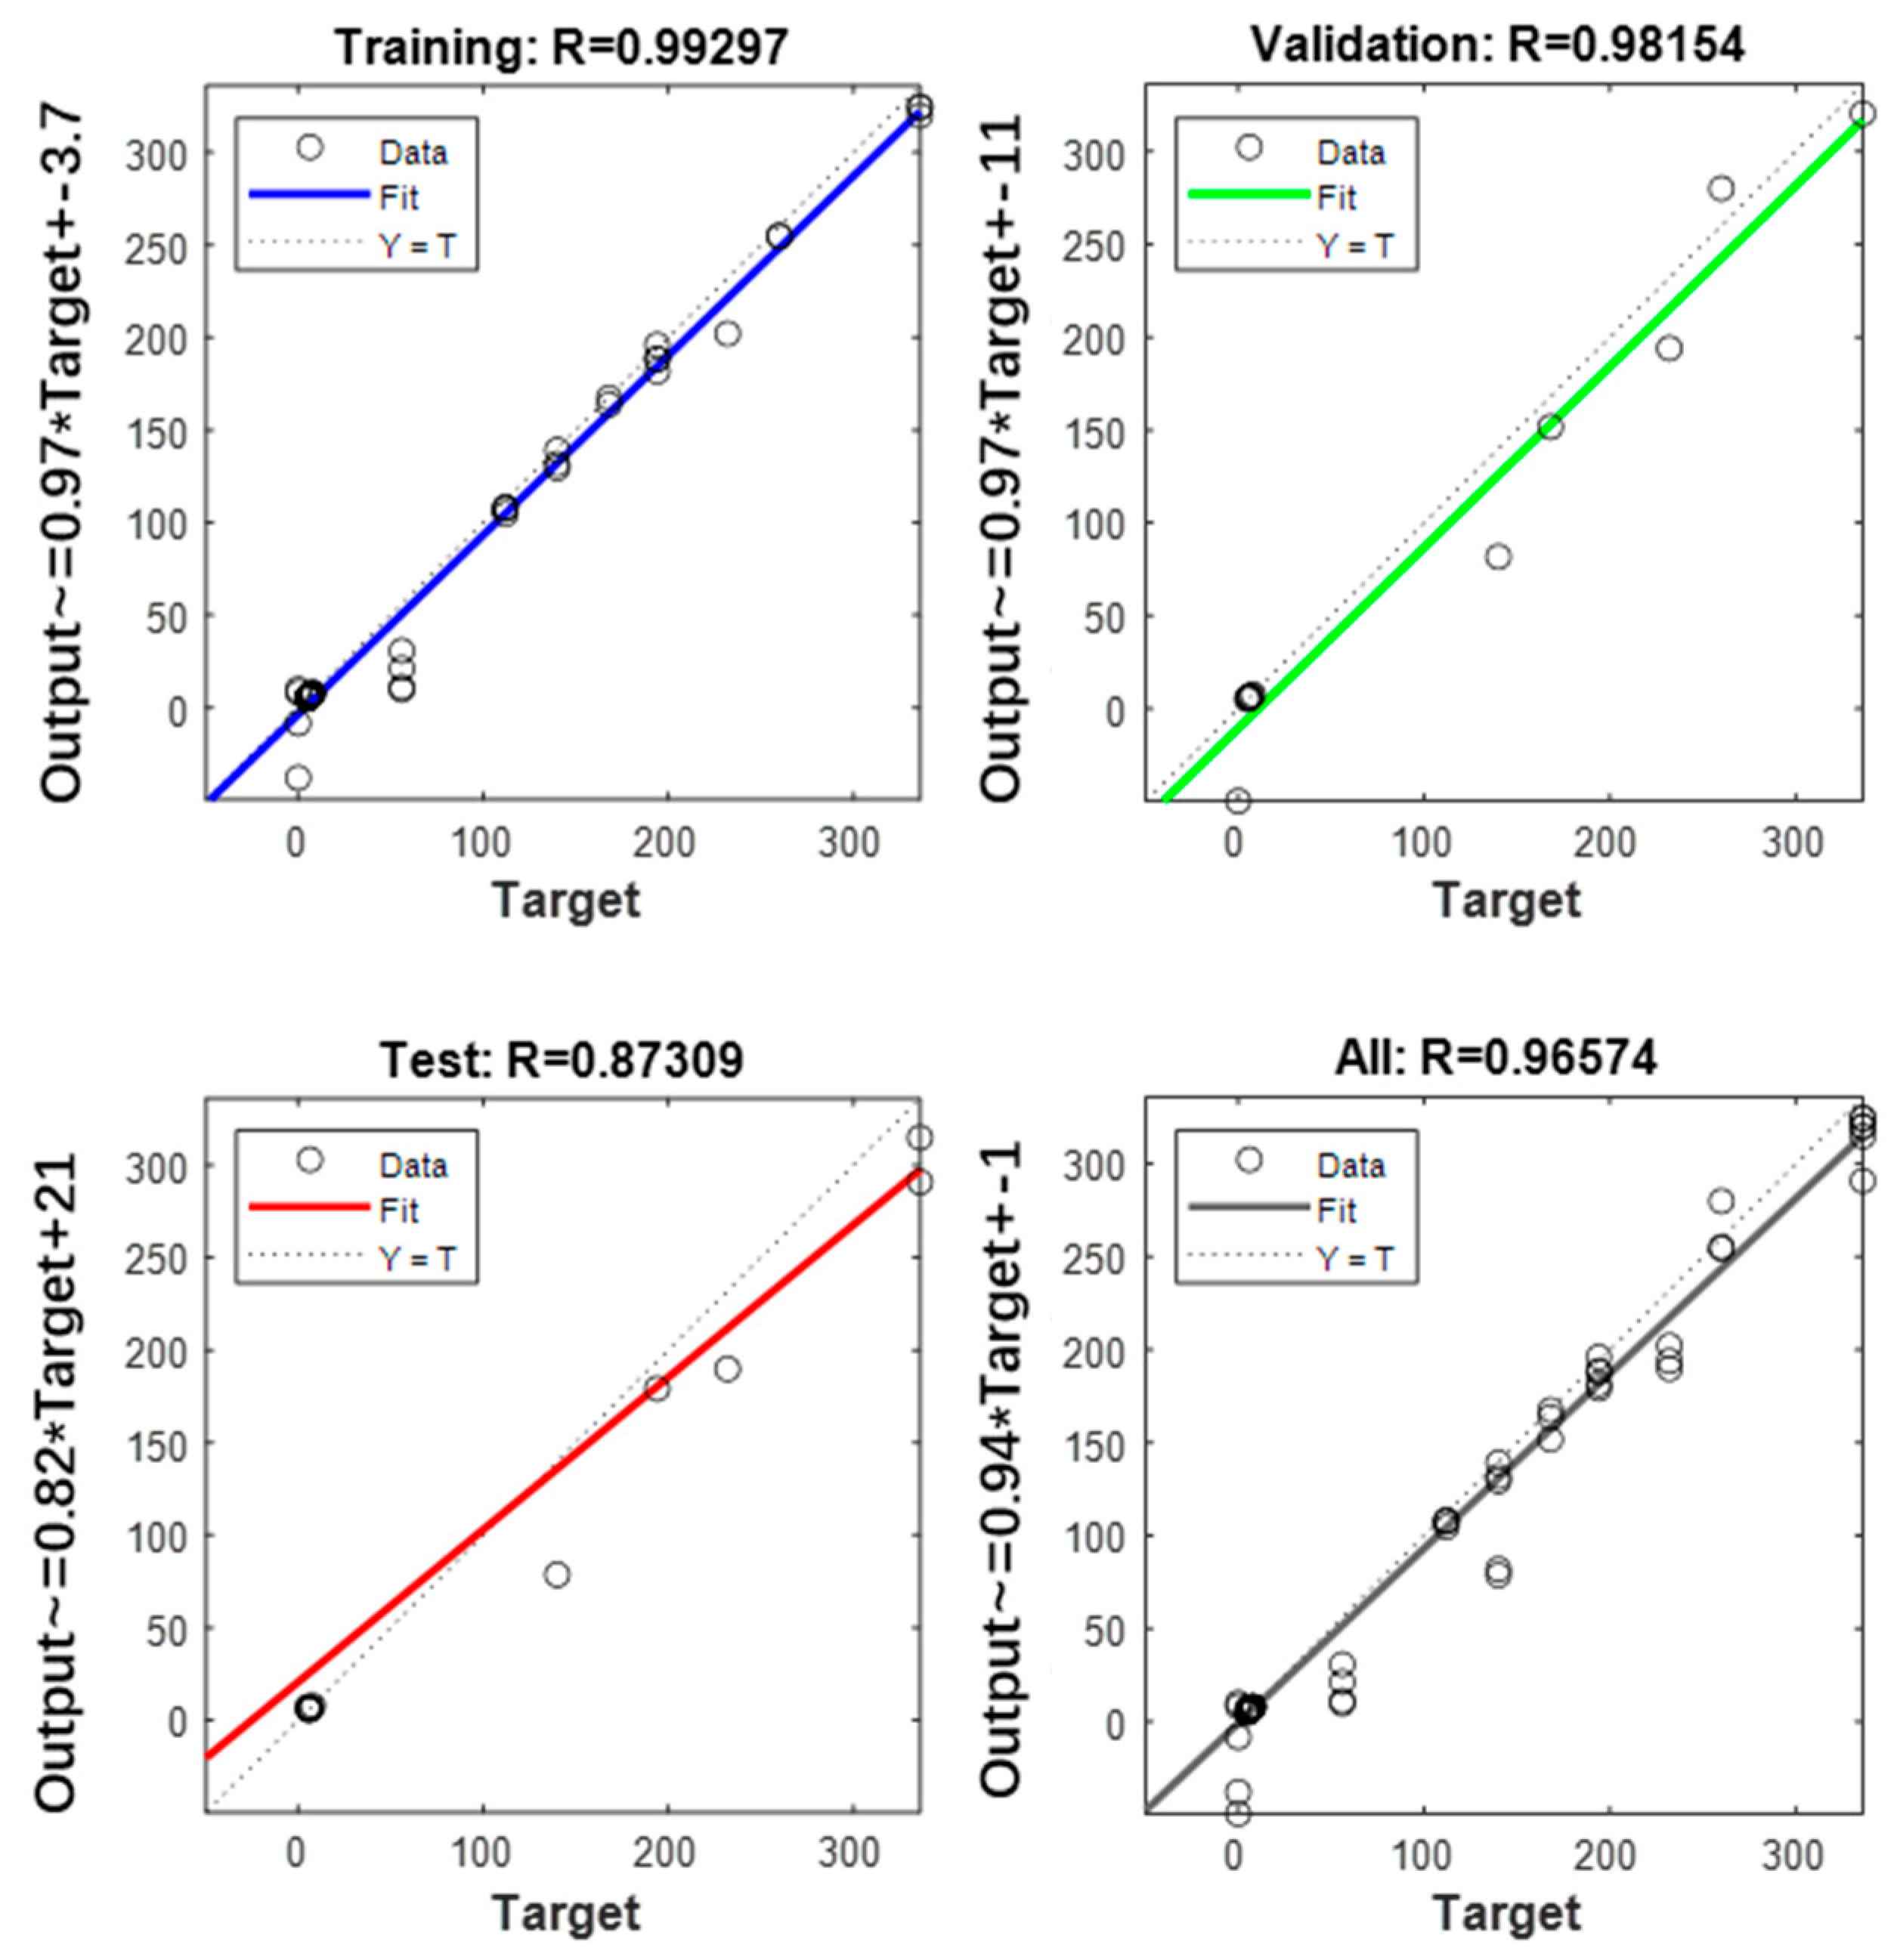
3.8. Kinetics Model and Shelf-Life Prediction
4. Conclusions
Supplementary Materials
Author Contributions
Funding
Institutional Review Board Statement
Informed Consent Statement
Data Availability Statement
Conflicts of Interest
References
- Liu, L.; She, X.; Qian, Y.; Li, Y.; Tao, Y.; Che, Z.; Liu, G.; Rao, Y. Effect of different fermenting containers on the deterioration of Sichuan pickle. LWT-Food Sci. Technol. 2019, 111, 829–836. [Google Scholar] [CrossRef]
- Rao, Y.; Tao, Y.; Chen, X.; She, X.; Qian, Y.; Li, Y.; Du, Y.; Xiang, W.; Li, H.; Liu, L. The characteristics and correlation of the microbial communities and flavors in traditionally pickled radishes. LWT-Food Sci. Technol. 2020, 118, 108804. [Google Scholar] [CrossRef]
- Zhang, W.; Luo, Z.; Wang, A.; Gu, X.; Lv, Z. Kinetic models applied to quality change and shelf life prediction of kiwifruits. LWT-Food Sci. Technol. 2021, 138, 110610. [Google Scholar] [CrossRef]
- Weng, Z.; Sun, L.; Wang, F.; Sui, X.; Fang, Y.; Tang, X.; Shen, X. Assessment the flavor of soybean meal hydrolyzed with Alcalase enzyme under different hydrolysis conditions by E-nose, E-tongue and HS-SPME-GC-MS. Food Chem. X 2021, 12, 100141. [Google Scholar] [CrossRef]
- Zaragoza, P.; Fuentes, A.; Fernandez-Segovia, I.; Vivancos, J.L.; Rizo, A.; Ros-Lis, J.V.; Barat, J.M.; Martinez-Manez, R. Evaluation of sea bream (Sparus aurata) shelf life using an optoelectronic nose. Food Chem. 2013, 138, 1374–1380. [Google Scholar] [CrossRef]
- Yu, S.; Huang, X.; Wang, L.; Ren, Y.; Zhang, X.; Wang, Y. Characterization of selected Chinese soybean paste based on flavor profiles using HS-SPME-GC/MS, E-nose and E-tongue combined with chemometrics. Food Chem. 2022, 375, 131840. [Google Scholar] [CrossRef]
- Vlasov, Y.; Legin, A.; Rudnitskaya, A.; Di Natale, C.; D’Amico, A. Nonspecific sensor arrays (“electronic tongue”) for chemical analysis of liquids (IUPAC Technical Report). Pure Appl. Chem. 2005, 77, 1965–1983. [Google Scholar] [CrossRef]
- Chen, J.; Zhang, M.; Devahastin, S.; Yu, D. Novel alternative use of near-infrared spectroscopy to indirectly forecast 3D printability of purple sweet potato pastes. J. Food Eng. 2021, 296, 110464. [Google Scholar] [CrossRef]
- Remini, H.; Mertz, C.; Belbahi, A.; Achir, N.; Dornier, M.; Madani, K. Degradation kinetic modelling of ascorbic acid and colour intensity in pasteurised blood orange juice during storage. Food Chem. 2015, 173, 665–673. [Google Scholar] [CrossRef]
- Boekel, M.A.J.S.V. Kinetic modeling of food quality: A critical review. Compr. Rev. Food Sci. Food Saf. 2008, 7, 144–158. [Google Scholar] [CrossRef]
- Zhao, S.S.; Han, X.Y.; Liu, B.; Wang, S.Y.; Guan, W.Q.; Wu, Z.J.; Theodorakis, P.E. Shelf-life prediction model of fresh-cut potato at different storage temperatures. J. Food Eng. 2022, 317, 110867. [Google Scholar] [CrossRef]
- Jafari, S.M.; Ganje, M.; Dehnad, D.; Ghanbari, V.; Hajitabar, J. Arrhenius equation modeling for the shelf life prediction of tomato paste containing a natural preservative. J. Sci. Food Agric. 2017, 97, 5216–5222. [Google Scholar] [CrossRef] [PubMed]
- Wang, Z.-C.; Yin, Y.-X.; Ao, H.-P.; Yin, H.; Ren, D.-F.; Lu, J. The shelf-life of chestnut rose beverage packaged in PEN/PET bottles under long term storage: A comparison to packaging in ordinary PET bottles. Food Chem. 2022, 370, 131044. [Google Scholar] [CrossRef] [PubMed]
- Shen, Y.; Lu, T.; Liu, X.-Y.; Zhao, M.-T.; Yin, F.-W.; Rakariyatham, K.; Zhou, D.-Y. Improving the oxidative stability and lengthening the shelf life of DHA algae oil with composite antioxidants. Food Chem. 2020, 313, 126139. [Google Scholar] [CrossRef] [PubMed]
- Jiang, Y.; Yang, X.; Jin, H.; Feng, X.; Tian, F.; Song, Y.; Ren, Y.; Man, C.; Zhang, W. Shelf-life prediction and chemical characteristics analysis of milk formula during storage. LWT-Food Sci. Technol. 2021, 144, 111268. [Google Scholar] [CrossRef]
- Wenjun, W.; Weixin, H.; Tian, D.; Xingqian, Y.; Donghong, L. Shelf-life prediction of strawberry at different temperatures during storage using kinetic analysis and model development. J. Food Processing Preserv. 2018, 42, e13693. [Google Scholar] [CrossRef]
- Sun, Y.N.; Zhang, M.; Fan, D.C. Effect of ultrasonic on deterioration of oil in microwave vacuum frying and prediction of frying oil quality based on low field nuclear magnetic resonance (LF-NMR). Ultrason. Sonochem. 2019, 51, 77–89. [Google Scholar] [CrossRef]
- Wang, Y.Q.; Zhang, M.; Mujumdar, A.S. Influence of green banana flour substitution for cassava starch on the nutrition, color, texture and sensory quality in two types of snacks. LWT-Food Sci. Technol. 2012, 47, 175–182. [Google Scholar] [CrossRef]
- Xu, X.; Deng, J.; Luo, D.; Bao, Y.; Liao, X.; Gao, H.; Wu, J. Comparative study of high hydrostatic pressure and high temperature short time processing on quality of clear and cloudy Se-enriched kiwifruit juices. Innov. Food Sci. Emerg. Technol. 2018, 49, 1–12. [Google Scholar] [CrossRef]
- Fan, K.; Zhang, M.; Jiang, F.J. Ultrasound treatment to modified atmospheric packaged fresh-cut cucumber: Influence on microbial inhibition and storage quality. Ultrason. Sonochem. 2019, 54, 162–170. [Google Scholar] [CrossRef]
- Liu, Q.; Zhang, M.; Bhandari, B.; Xu, J.C.; Yang, C.H. Effects of nanoemulsion-based active coatings with composite mixture of star anise essential oil, polylysine, and nisin on the quality and shelf life of ready-to-eat Yao meat products. Food Control 2020, 107, 106771. [Google Scholar] [CrossRef]
- Jiang, H.Y.; Zhang, M.; Bhandari, B.; Adhikari, B. Application of electronic tongue for fresh foods quality evaluation: A review. Food Rev. Int. 2018, 34, 746–769. [Google Scholar] [CrossRef]
- Chitrakar, B.; Zhang, M.; Bhandari, B. Improvement strategies of food supply chain through novel food processing technologies during COVID-19 pandemic. Food Control 2021, 125, 108010. [Google Scholar] [CrossRef] [PubMed]
- Giannoglou, M.; Evangelopoulou, A.-M.; Perikleous, N.; Baclori, C.; Tsironi, T.; Taoukis, P. Time temperature integrators for monitoring the shelf life of ready-to-eat chilled smoked fish products. Food Packag. Shelf Life 2019, 22, 100403. [Google Scholar] [CrossRef]
- Sun, Q.; Zhang, M.; Mujumdar, A.S.; Yang, P. Combined LF-NMR and Artificial Intelligence for Continuous Real-Time Monitoring of Carrot in Microwave Vacuum Drying. Food Bioprocess Technol. 2019, 12, 551–562. [Google Scholar] [CrossRef]
- Liu, W.; Zhang, M.; Bhandari, B.; Yu, D. A novel combination of LF-NMR and NIR to intelligent control in pulse-spouted microwave freeze drying of blueberry. LWT-Food Sci. Technol. 2021, 137, 110455. [Google Scholar] [CrossRef]
- Sun, Y.A.; Zhang, M.; Bhandari, B.; Yang, P.Q. Intelligent detection of flavor changes in ginger during microwave vacuum drying based on LF-NMR. Food Res. Int. 2019, 119, 417–425. [Google Scholar] [CrossRef]
- Cortes Rodriguez, M.; Villegas Yepez, C.; Gil Gonzalez, J.H.; Ortega-Toro, R. Effect of a multifunctional edible coating based on cassava starch on the shelf life of Andean blackberry. Heliyon 2020, 6, e03974. [Google Scholar] [CrossRef]
- Gundewadi, G.; Rudra, S.G.; Sarkar, D.J.; Singh, D. Nanoemulsion based alginate organic coating for shelf life extension of okra. Food Packag. Shelf Life 2018, 18, 1–12. [Google Scholar] [CrossRef]
- Rode, T.M.; Rotabakk, B.T. Extending shelf life of desalted cod by high pressure processing. Innov. Food Sci. Emerg. Technol. 2021, 69, 102476. [Google Scholar] [CrossRef]
- Zhang, M.; De Baerdemaeker, J.; Schrevens, E. Effects of different varieties and shelf storage conditions of chicory on deteriorative color changes using digital image processing and analysis. Food Res. Int. 2003, 36, 669–676. [Google Scholar] [CrossRef]
- Zhang, F.; Tang, Y.; Ren, Y.; Yao, K.; He, Q.; Wan, Y.; Chi, Y. Microbial composition of spoiled industrial-scale Sichuan paocai and characteristics of the microorganisms responsible for paocai spoilage. Int. J. Food Microbiol. 2018, 275, 32–38. [Google Scholar] [CrossRef] [PubMed]
- Yang, S.; Zhang, M.N.; Shan, C.S.; Chen, Z.G. Evaluation of cooking performance, structural properties, storage stability and shelf life prediction of high-moisture wet starch noodles. Food Chem. 2021, 357, 129744. [Google Scholar] [CrossRef] [PubMed]
- Xiong, T.; Li, J.B.; Liang, F.; Wang, Y.P.; Guan, Q.Q.; Xie, M.Y. Effects of salt concentration on Chinese sauerkraut fermentation. LWT-Food Sci. Technol. 2016, 69, 169–174. [Google Scholar] [CrossRef]
- Rao, Y.; Qian, Y.; Tao, Y.; She, X.; Li, Y.; Che, Z.; Li, H.; Liu, L. Influence of oxygen exposure on fermentation process and sensory qualities of Sichuan pickle (paocai). RSC Adv. 2019, 9, 38520–38530. [Google Scholar] [CrossRef] [Green Version]
- Du, R.; Song, G.; Zhao, D.; Sun, J.; Ping, W.; Ge, J. Lactobacillus casei starter culture improves vitamin content, increases acidity and decreases nitrite concentration during sauerkraut fermentation. Int. J. Food Sci. Technol. 2018, 53, 1925–1931. [Google Scholar] [CrossRef]
- Tolonen, M.; Taipale, M.; Viander, B.; Pihlava, J.M.; Korhonen, H.; Ryhänen, E.L. Plant-Derived Biomolecules in Fermented Cabbage. J. Agric. Food Chem. 2002, 50, 6798–6803. [Google Scholar] [CrossRef]
- Ho, C.C.a.C.t. Thermal Degradation of Allyl Isothiocyanate in Aqueous Solution. J. Agric. Food Chem. 1998, 46, 220–223. [Google Scholar]
- Francini, A.; Romeo, S.; Cifelli, M.; Gori, D.; Domenici, V.; Sebastiani, L. (1)H NMR and PCA-based analysis revealed variety dependent changes in phenolic contents of apple fruit after drying. Food Chem. 2017, 221, 1206–1213. [Google Scholar] [CrossRef]
- de Almeida, V.E.; de Sousa Fernandes, D.D.; Diniz, P.; de Araujo Gomes, A.; Veras, G.; Galvao, R.K.H.; Araujo, M.C.U. Scores selection via Fisher’s discriminant power in PCA-LDA to improve the classification of food data. Food Chem. 2021, 363, 130296. [Google Scholar] [CrossRef]
- Jia, W.; Wang, H.; Shi, L.; Zhang, F.; Fan, C.; Chen, X.; Chang, J.; Chu, X. High-throughput foodomics strategy for screening flavor components in dairy products using multiple mass spectrometry. Food Chem. 2019, 279, 1–11. [Google Scholar] [CrossRef] [PubMed]
- Feng, L.; Zhang, M.; Adhikari, B.; Guo, Z. Nondestructive Detection of Postharvest Quality of Cherry Tomatoes Using a Portable NIR Spectrometer and Chemometric Algorithms. Food Anal. Methods 2019, 12, 914–925. [Google Scholar] [CrossRef]
- Talari, A.C.S.; Martinez, M.A.G.; Movasaghi, Z.; Rehman, S.; Rehman, I.U. Advances in Fourier transform infrared (FTIR) spectroscopy of biological tissues. Appl. Spectrosc. Rev. 2016, 52, 456–506. [Google Scholar] [CrossRef]
- Pang, L.; Lu, G.; Cheng, J.; Lu, X.; Ma, D.; Li, Q.; Li, Z.; Zheng, J.; Zhang, C.; Pan, S. Physiological and biochemical characteristics of sweet potato (Ipomoea batatas (L.) Lam) roots treated by a high voltage alternating electric field during cold storage. Postharvest Biol. Technol. 2021, 180, 111619. [Google Scholar] [CrossRef]
- Palazón, M.A.; Pérez-Conesa, D.; Abellán, P.; Ros, G.; Romero, F.; Vidal, M.L. Determination of shelf-life of homogenized apple-based beikost storage at different temperatures using Weibull hazard model. LWT-Food Sci. Technol. 2009, 42, 319–326. [Google Scholar] [CrossRef]
- Pinheiro, J.; Alegria, C.; Abreu, M.; Gonçalves, E.M.; Silva, C.L.M. Kinetics of changes in the physical quality parameters of fresh tomato fruits (Solanum lycopersicum, cv. ‘Zinac’) during storage. J. Food Eng. 2013, 114, 338–345. [Google Scholar] [CrossRef]
- Dahlquist-Willard, R.M.; Marshall, M.N.; Betts, S.L.; Tuell-Todd, C.C.; VanderGheynst, J.S.; Stapleton, J.J. Development and validation of a Weibull–Arrhenius model to predict thermal inactivation of black mustard (Brassica nigra) seeds under fluctuating temperature regimens. Biosyst. Eng. 2016, 151, 350–360. [Google Scholar] [CrossRef]
- Ma, Y.; Guo, S.; Zhang, J.; Xu, Y.; Wang, D. Kinetic modeling of ethyl carbamate formation from urea in Huangjiu during storage. Food Control 2021, 129, 108249. [Google Scholar] [CrossRef]


| Storage Time (d) | Temperature (45 °C) | |||
|---|---|---|---|---|
| Hardness (gf)/Rd | Chewiness (gf)/Rd | Hardness (gf)/V | Chewiness (gf)/V | |
| 0 | 763.28 ± 57.54 a | 93.04 ± 49.48 a | 277.87 ± 78.42 a | 66.15 ± 21.45 a |
| 7 | 634.29 ± 141.37 b | 54.30 ± 17.49 b | 194.18 ± 71.49 bc | 59.19 ± 19.93 a |
| 14 | 760.48 ± 98.12 a | 34.16 ± 12.64 b | 228.13 ± 79.50 b | 54.17 ± 19.57 ab |
| 21 | 605.33 ± 121.40 b | 46.19 ± 19.76 b | 200.42 ± 77.80 bc | 43.02 ± 18.63 bc |
| 28 | 458.82 ± 93.37 c | 40.60 ± 22.33 b | 152.87 ± 26.93 c | 41.82 ± 16.66 bc |
| 35 | 344.55 ± 105.05 d | 39.89 ± 24.69 b | 69.90 ± 25.88 d | 28.17 ± 10.95 cde |
| 42 | 251.28 ± 72.92 de | 35.73 ± 10.67 b | 98.89 ± 38.48 d | 34.92 ± 13.64 cd |
| 49 | 233.73 ± 71.30 de | 46.84 ± 14.65 b | 68.27 ± 30.23 d | 23.58 ± 12.61 de |
| 56 | 191.81 ± 72.85 e | 41.83 ± 26.04 b | 79.13 ± 35.95 d | 28.39 ± 13.87 cde |
| 63 | 249.18 ± 109.63 de | 41.35 ± 32.65 b | 65.08 ± 29.63 d | 20.48 ± 8.30 de |
| 70 | 243.71 ± 32.53 de | 29.36 ± 10.84 b | 64.18 ± 22.86 d | 18.99 ± 9.25 de |
| 77 | 219.84 ± 55.44 e | 27.63 ± 8.75 b | 58.17 ± 15.18 d | 20.47 ± 5.45 de |
| 84 | 148.97 ± 29.84 e | 35.67 ± 12.72 b | 69.12 ± 18.84 d | 15.45 ± 7.84 e |
| Storage time (d) | Temperature (35 °C) | |||
| 0 | 763.28 ± 57.54 a | 93.04 ± 49.48 a | 277.87 ± 78.42 a | 66.15 ± 21.45 a |
| 14 | 691.83 ± 114.67 ab | 70.49 ± 33.83 abc | 259.48 ± 16.05 a | 82.72 ± 25.60 a |
| 28 | 635.23 ± 117.83 b | 60.41 ± 25.96 abcd | 192.59 ± 49.61 b | 52.98 ± 15.82 bc |
| 42 | 644.19 ± 107.13 b | 79.25 ± 44.10 ab | 177.50 ± 53.40 b | 48.95 ± 16.51 c |
| 56 | 596.58 ± 117.58 b | 49.30 ± 24.16 bcde | 165.28 ± 45.77 b | 49.94 ± 13.54 c |
| 70 | 420.33 ± 94.18 c | 58.08 ± 27.58 abcd | 108.13 ± 61.94 cd | 33.63 ± 14.52 de |
| 84 | 181.78 ± 73.94 de | 64.52 ± 25.51 abc | 80.38 ± 27.95 cde | 30.45 ± 10.70 def |
| 98 | 261.48 ± 76.66 d | 40.08 ± 17.16 cdef | 86.08 ± 29.92 cde | 26.07 ± 8.30 def |
| 112 | 251.32 ± 67.48 d | 35.66 ± 15.44 cdef | 109.68 ± 23.22 c | 35.67 ± 9.12 d |
| 126 | 240.09 ± 71.86 d | 25.21 ± 27.68 def | 59.91 ± 19.58 e | 18.73 ± 6.77 f |
| 140 | 94.92 ± 24.35 e | 12.50 ± 7.24 f | 64.28 ± 22.22 e | 18.37 ± 7.76 f |
| 154 | 113.25 ± 30.51 e | 17.88 ± 7.14 ef | 67.01 ± 15.92 de | 20.20 ± 8.01 ef |
| Storage time (d) | Temperature (25 °C) | |||
| 0 | 763.28 ± 57.54 a | 93.04 ± 49.48 a | 277.87 ± 78.42 a | 66.15 ± 21.45 a |
| 56 | 730.98 ± 108.74 a | 67.41 ± 23.88 b | 273.82 ± 29.94 a | 58.75 ± 14.36 ab |
| 112 | 659.29 ± 76.18 a | 56.93 ± 14.59 bc | 189.99 ± 40.19 b | 65.87 ± 18.52 a |
| 168 | 403.41 ± 100.74 b | 57.12 ± 15.59 bc | 216.67 ± 45.01 b | 46.69 ± 15.85 abc |
| 224 | 408.97 ± 106.85 b | 45.81 ± 24.20 cd | 221.66 ± 59.50 b | 44.39 ± 15.51 bc |
| 280 | 268.74 ± 61.49 c | 35.38 ± 15.85 de | 135.88 ± 37.52 c | 40.22 ± 19.91 bc |
| 336 | 182.95 ± 63.06 c | 25.52 ± 10.21 e | 76.22 ± 32.39 d | 27.12 ± 11.08 c |
| Quality Indices | T (°C) | Zero-Order | First-Order | ||||
|---|---|---|---|---|---|---|---|
| k | R2 | RSME | k | R2 | RSME | ||
| Total acid | 25 | −0.0078 | 0.8699 | 0.3384 | -- | -- | -- |
| 35 | −0.0083 | 0.9523 | 0.0958 | −0.0015 | 0.9494 | 0.0968 | |
| 45 | −0.0196 | 0.9684 | 0.0943 | −0.0034 | 0.9738 | 0.0888 | |
| L* Rd | 25 | 0.0424 | 0.9325 | 1.3799 | -- | -- | -- |
| 35 | 0.1035 | 0.9424 | 1.2946 | 0.0022 | 0.9657 | 1.1442 | |
| 45 | 0.2276 | 0.9029 | 2.0287 | 0.0050 | 0.9468 | 1.7736 | |
| L* v | 25 | 0.0238 | 0.8906 | 0.9210 | -- | -- | -- |
| 35 | 0.0536 | 0.9274 | 0.7635 | 0.0012 | 0.9202 | 0.7807 | |
| 45 | 0.1346 | 0.9188 | 1.0812 | 0.0030 | 0.9265 | 1.0507 | |
| Hardness Rd | 25 | 1.7110 | 0.9694 | 34.0525 | -- | -- | -- |
| 35 | 4.3592 | 0.9669 | 40.4722 | 0.0097 | 0.8781 | 54.3007 | |
| 45 | 6.6641 | 0.8761 | 70.3778 | 0.0019 | 0.9596 | 49.5786 | |
| Hardness V | 25 | 0.5850 | 0.9840 | 8.8842 | -- | -- | -- |
| 35 | 1.4207 | 0.9063 | 23.5509 | 0.0114 | 0.9967 | 11.6397 | |
| 45 | 2.7775 | 0.9116 | 23.0117 | 0.0219 | 0.9749 | 11.5778 | |
| Sensory score | 25 | 0.0212 | 0.9895 | 0.2086 | -- | -- | -- |
| 35 | 0.0427 | 0.9713 | 0.2951 | 0.0079 | 0.9243 | 0.3661 | |
| 45 | 0.1075 | 0.9685 | 0.3111 | 0.0180 | 0.8772 | 0.4704 | |
| (A) | ||||
| Storage Time (d) | Temperature (45 °C) | |||
| Sample (radish) | ||||
| L* | a* | b* | ∆E | |
| 0 | 58.57 ± 2.60 c | −3.06 ± 0.32 g | 18.84 ± 0.49 a | 0.00 ± 0.00 g |
| 7 | 56.88 ± 2.20 a | 0.54 ± 0.30 f | 17.31 ± 2.00 ab | 5.35 ± 1.95 f |
| 14 | 53.20 ± 2.29 b | 1.39 ± 0.43 e | 18.28 ± 2.40 a | 7.38 ± 1.65 f |
| 21 | 52.36 ± 2.49 b | 1.58 ± 0.31 f | 17.39 ± 1.58 ab | 7.31 ± 2.25 f |
| 28 | 45.66 ± 4.08 cde | 2.62 ± 0.42 cd | 16.19 ± 2.29 abc | 14.61 ± 3.68 de |
| 35 | 45.61 ± 1.99 cde | 2.36 ± 0.62 d | 14.38 ± 2.02 cd | 14.87 ± 2.00 de |
| 42 | 43.73 ± 4.03 def | 3.05 ± 0.96 bcd | 12.28 ± 3.18 d | 17.64 ± 3.94 cde |
| 49 | 46.05 ± 3.98 cd | 2.51 ± 0.72 d | 14.74 ± 1.57 bcd | 14.46 ± 3.68 e |
| 56 | 42.97 ± 5.25 def | 2.96 ± 0.77 cd | 13.26 ± 3.78 d | 17.96 ± 5.39 cd |
| 63 | 42.52 ± 2.88 ef | 3.87 ± 1.42 ab | 13.09 ± 3.03 d | 18.69 ± 2.82 bc |
| 70 | 41.00 ± 2.32 fg | 4.42 ± 1.38 a | 13.74 ± 3.59 cd | 20.08 ± 2.50 bc |
| 77 | 40.57 ± 2.65 fg | 3.46 ± 1.06 bc | 9.60 ± 2.38 e | 21.39 ± 2.73 ab |
| 84 | 37.87 ± 2.46 g | 3.19 ± 0.83 bcd | 8.70 ± 1.77 fd | 23.94 ± 2.58 a |
| Storage time (d) | Sample (vegetable) | |||
| 0 | 49.22 ± 3.01 a | −4.98 ± 0.83 f | 21.68 ± 2.54 a | 0.00 ± 0.00 f |
| 7 | 49.70 ± 3.65 a | −2.73 ± 0.96 e | 21.89 ± 3.11 a | 4.86 ± 1.90 e |
| 14 | 51.15 ± 3.76 a | −3.20 ± 0.78 e | 22.78 ± 3.83 a | 5.51 ± 2.17 e |
| 21 | 49.78 ± 1.99 a | −2.87 ± 0.72 e | 21.02 ± 2.82 a | 3.61 ± 1.93 e |
| 28 | 44.38 ± 2.34 b | −1.21 ± 0.67 bcd | 15.91 ± 2.59 b | 8.85 ± 2.08 d |
| 35 | 42.60 ± 2.23 bd | −1.47 ± 1.00 cd | 14.14 ± 3.23 bc | 10.87 ± 3.24 cd |
| 42 | 44.64 ± 1.85 b | −1.32 ± 0.45 cd | 14.32 ± 2.51 bc | 9.61 ± 2.40 cd |
| 49 | 43.03 ± 3.60 bc | −1.49 ± 0.67 d | 14.28 ± 3.36 bc | 10.54 ± 4.26 cd |
| 56 | 42.78 ± 3.09 bd | −0.37 ± 1.35 ab | 12.88 ± 2.45 cd | 12.19 ± 2.86 bc |
| 63 | 41.16 ± 2.15 cd | −0.04 ± 1.03 a | 11.58 ± 2.40 cde | 14.01 ± 2.47 ab |
| 70 | 39.64 ± 3.28 d | −0.71 ± 1.06 abcd | 12.30 ± 2.16 cd | 14.26 ± 3.24 ab |
| 77 | 40.61 ± 2.16 cd | 0.15 ± 0.92 a | 10.15 ± 2.28 de | 15.38 ± 2.68 a |
| 84 | 39.51 ± 2.56 d | −0.57 ± 1.08 abc | 9.35 ± 3.31 e | 16.44 ± 3.67 a |
| (B) | ||||
| Storage time (d) | Temperature (35 °C) | |||
| Sample (radish) | ||||
| L* | a* | b* | ∆E | |
| 0 | 58.57 ± 2.60 b | −3.06 ± 0.32 f | 18.84 ± 0.49 abc | 0.00 ± 0.00 d |
| 14 | 54.22 ± 4.02 a | −0.13 ± 0.81 e | 15.28 ± 1.04 bcd | 6.86 ± 3.21 c |
| 28 | 53.15 ± 2.17 ab | 0.67 ± 0.5 cd | 16.47 ± 2.23 abc | 7.41 ± 1.84 c |
| 42 | 52.00 ± 3.11 ab | 0.45 ± 0.54 de | 17.36 ± 2.55 ab | 8.16 ± 2.59 bc |
| 56 | 50.56 ± 4.85 b | 1.32 ± 0.70 c | 17.32 ± 3.12 ab | 9.84 ± 4.62 bc |
| 70 | 49.70 ± 4.22 b | 3.10 ± 0.77 a | 17.94 ± 3.07 a | 11.43 ± 3.65 b |
| 84 | 41.76 ± 3.23 b | 1.30 ± 0.86 c | 13.41 ± 2.97 d | 18.39 ± 3.46 a |
| 98 | 44.89 ± 2.35 d | 2.22 ± 0.80 b | 14.36 ± 3.16 cd | 15.58 ± 2.75 a |
| 112 | 42.59 ± 4.10 cd | 2.92 ± 0.86 ab | 13.89 ± 3.11 cd | 18.02 ± 4.10 a |
| 126 | 46.07 ± 3.30 cd | 2.92 ± 0.55 ab | 12.72 ± 2.44 e | 15.58 ± 3.30 a |
| 140 | 42.84 ± 2.00 c | 3.58 ± 1.24 a | 14.04 ± 2.74 cd | 17.95 ± 2.09 a |
| 154 | 42.13 ± 2.62 d | 3.42 ± 0.80 a | 13.01 ± 2.75 d | 18.81 ± 2.54 a |
| Sample (vegetable) | ||||
| 0 | 49.22 ± 3.01 b | −4.98 ± 0.83 e | 21.68 ± 2.54 ab | 0.00 ± 0.00 e |
| 14 | 48.24 ± 3.67 bc | −2.52 ± 1.25 cd | 23.06 ± 2.25 a | 4.94 ± 1.69 d |
| 28 | 49.19 ± 2.77 b | −2.46 ± 0.94 d | 22.48 ± 4.69 a | 5.59 ± 1.90 d |
| 42 | 52.05 ± 2.79 a | −3.19 ± 0.71 d | 24.00 ± 3.41 a | 5.20 ± 2.89 d |
| 56 | 48.69 ± 2.75 bc | −1.78 ± 1.09 bc | 22.75 ± 3.40 a | 5.07 ± 2.17 d |
| 70 | 46.24 ± 1.92 cd | −1.12 ± 1.06 ab | 19.47 ± 4.19 b | 6.41 ± 2.91 d |
| 84 | 45.24 ± 3.68 de | −2.39 ± 0.62 cd | 16.52 ± 1.90 c | 7.52 ± 3.05 cd |
| 98 | 44.10 ± 1.93 de | −1.41 ± 0.92 b | 14.86 ± 3.02 cd | 9.40 ± 3.25 bc |
| 112 | 42.66 ± 2.71 ef | −1.00 ± 0.65 ab | 14.93 ± 2.62 cd | 10.40 ± 3.24 b |
| 126 | 44.06 ± 1.94 de | −0.85 ± 0.70 ab | 13.43 ± 1.72 d | 10.71 ± 1.94 b |
| 140 | 43.04 ± 2.86 ef | −0.26 ± 1.46 a | 14.38 ± 2.74 cd | 10.99 ± 3.14 b |
| 154 | 41.17 ± 1.51 f | −0.43 ± 1.11 a | 12.16 ± 2.98 d | 13.36 ± 3.07 a |
| (C) | ||||
| Storage time (d) | Temperature (25 °C) | |||
| Sample (radish) | ||||
| L* | a* | b* | ∆E | |
| 0 | 58.57 ± 2.60 a | −3.06 ± 0.32 e | 18.84 ± 0.49 ab | 0.00 ± 0.00 d |
| 56 | 51.78 ± 3.36 a | 1.12 ± 0.53 c | 17.91 ± 1.46 ab | 8.48 ± 2.30 c |
| 112 | 50.44 ± 2.81 ab | 0.84 ± 0.41 c | 17.97 ± 2.01 ab | 9.32 ± 2.59 c |
| 168 | 52.13 ± 2.15 a | 0.22 ± 0.37 d | 18.79 ± 2.17 a | 7.61 ± 1.79 c |
| 224 | 46.30 ± 2.83 cd | 2.28 ± 0.48 b | 16.05 ± 2.24 bc | 13.85 ± 2.79 b |
| 280 | 42.45 ± 2.47 e | 2.29 ± 0.59 b | 12.74 ± 2.56 d | 18.20 ± 2.64 a |
| 336 | 44.79 ± 3.73 de | 2.89 ± 0.83 a | 14.47 ± 3.55 cd | 15.97 ± 3.96 ab |
| Sample (vegetable) | ||||
| 0 | 49.22 ± 3.01 a | −4.98 ± 0.83 d | 21.68 ± 2.54 a | 0.00 ± 0.00 d |
| 56 | 48.57 ± 3.24 a | −2.07 ± 0.65 bc | 21.33 ± 2.27 ab | 4.65 ± 1.42 c |
| 112 | 49.99 ± 2.56 a | −1.78 ± 0.97 abc | 22.94 ± 3.14 a | 5.08 ± 1.56 c |
| 168 | 48.54 ± 2.72 a | −2.52 ± 0.69 c | 22.21 ± 3.96 a | 4.82 ± 2.31 c |
| 224 | 45.57 ± 1.27 b | −1.13 ± 0.77 a | 18.33 ± 2.86 bc | 6.64 ± 2.26 bc |
| 280 | 42.67 ± 1.58 c | −1.43 ± 0.35 ab | 15.62 ± 1.83 c | 9.74 ± 1.71 a |
| 336 | 44.98 ± 2.30 bc | −1.39 ± 0.61 ab | 15.22 ± 2.12 c | 8.75 ± 2.38 ab |
| Classification | Molecular Formula | Compounds | RT | Storage Temperature | ||||||
|---|---|---|---|---|---|---|---|---|---|---|
| 45 °C | 35 °C | |||||||||
| 0 d | 28 d | 56 d | 84 d | 42 d | 70 d | 154 d | ||||
| Area % | Area % | Area % | Area % | Area % | Area % | Area % | ||||
| Sulfur compounds (2) | ||||||||||
| 1 | C4H10S2 | Ethane, 1,1-bis (methylthio) - | 9.12 | 8.97 | 6.76 | 1.79 | 0.07 | 9.85 | 8.23 | 1.9 |
| 2 | C2H6S3 | Dimethyl trisulfide | 10.36 | 4.62 | 4.85 | 8.63 | 8.59 | 5.94 | 6.8 | 4.02 |
| Ester compounds (8) | ||||||||||
| 1 | C5H10O3 | Propanoic acid, 2-hydroxy-, ethyl ester | 4.82 | 1.28 | 1.51 | 1 | 0.86 | 1.25 | 1.36 | 2.63 |
| 2 | C10H20O2 | Octanoic acid, ethyl ester | 21.24 | 0.39 | 1.04 | 0.24 | 0.26 | 1.23 | 1.43 | 0.75 |
| 3 | C17H34O2 | Hexadecanoic acid, methyl ester | 46.88 | 0.66 | 0.37 | 0.41 | 0.06 | 0.32 | 0.27 | 0.09 |
| 4 | C18H36O2 | Hexadecanoic acid, ethyl ester | 47.84 | 0.5 | 1.96 | 1.23 | 0.02 | 1.17 | 0.92 | 0.15 |
| 5 | C4H5NS | Allyl Isothiocyanate | 6.61 | 3.63 | 0.44 | 0.37 | 0.14 | 0.98 | 0.44 | -- |
| 6 | C7H14O2 | 1-Butanol, 3-methyl-, acetate | 6.86 | 0.13 | 0.12 | 0.08 | 0.48 | 0.19 | 0.15 | 0.12 |
| 7 | C12H24O2 | Decanoic acid, ethyl ester | 29.88 | 0.2 | 0.29 | 0.69 | -- | 0.14 | 0.18 | 0.06 |
| 8 | C14H28O2 | Dodecanoic acid, ethyl ester | 44.49 | 0.02 | 2.23 | 0.05 | -- | 0.09 | 0.07 | -- |
| Thioethers compounds (3) | ||||||||||
| 1 | C2H6S2 | Disulfide, dimethyl | 3.18 | 9.78 | 6.5 | 9.48 | 8.94 | 9.04 | 7.18 | 4.19 |
| 2 | C2H6S4 | Dimethyl tetrasulfide | 21.61 | 0.34 | 1.16 | 4.17 | 2.99 | 0.55 | 0.63 | 4.19 |
| 3 | C6H10S3 | Trisulfide, di-2-propenyl | 25.51 | 0.32 | 0.16 | -- | -- | -- | 0.16 | -- |
| Ketone compounds (1) | ||||||||||
| 1 | C7H10O | trans, trans-3,5-Heptadien-2-one | 11.65 | 0.35 | 10.13 | 11.74 | 10.91 | 1.06 | 1.43 | 3.99 |
| Acid compounds (3) | ||||||||||
| 1 | C6H8O2 | Sorbic Acid | 16.49 | 10.75 | 13.59 | 14.23 | 3.36 | 18.69 | 13.28 | 11.02 |
| 2 | C8H16O2 | Octanoic acid | 20.79 | -- | -- | 0.88 | 1.06 | -- | -- | 0.14 |
| 3 | C10H20O2 | n-Decanoic acid | 20.95 | -- | -- | 3.27 | 0.32 | 0.29 | 0.22 | 0.75 |
| Phenolic compounds (2) | ||||||||||
| 1 | C8H10O | Phenol, 4-ethyl- | 20.3 | 3.48 | 6.03 | 3.36 | 1.38 | 5.08 | 5.91 | 5.06 |
| 2 | C9H12O2 | Phenol, 4-ethyl-2-methoxy- | 24.82 | 1.3 | 2.19 | 1.09 | 0.34 | 2.05 | 2.11 | 1.32 |
| Aromatic compounds (3) | ||||||||||
| 1 | C10H12O | Anethole | 25.08 | 7.38 | 1.09 | -- | -- | -- | 1.09 | -- |
| 2 | C9H9N | Benzenepropanenitrile | 22.99 | -- | 0.51 | 0.44 | 0.12 | 0.58 | 0.6 | 0.4 |
| 3 | C10H10O | 1H-Indene-4-carboxaldehyde, 2,3-dihydro- (9CI) | 24.42 | -- | 1.69 | 1.2 | 0.51 | -- | 0.78 | 0.98 |
| Aldehyde compounds (4) | ||||||||||
| 1 | C5H4O2 | Furfural | 5.38 | -- | 1.04 | 0.86 | 0.98 | 0.55 | 0.56 | 1.87 |
| 2 | C7H6O | Benzaldehyde | 10.1 | 0.17 | 0.66 | 1.23 | 2.33 | 0.66 | 0.66 | 2.05 |
| 3 | C8H8O2 | Benzaldehyde, 4-methoxy- | 23.61 | 1.24 | 0.21 | -- | -- | -- | 0.21 | -- |
| 4 | C7H10O | 2,4-Heptadienal, (E, E)- | 12.42 | -- | -- | 0.61 | 1.48 | -- | -- | -- |
| Hydrocarbon compounds (1) | ||||||||||
| 1 | C8H14 | 5,5-Dimethyl-1,3-hexadiene- | 13.75 | -- | 2.49 | 2.4 | 0.02 | -- | 2.82 | 0.11 |
| (A) | ||||||||||
| Sample-45 °C (storage time/d) | Calibration data | Prediction data | ||||||||
| Full acceptance period | Acceptance period | Unacceptance period | Total | Correctly classified (%) | Full acceptance period | Acceptance period | Unacceptance period | Total | Correctly classified (%) | |
| 0, 7, 14, 21, 28 | 10 | 10 | 100 | 3 | 2 | 5 | 60 | |||
| 35, 42, 49, 56 | 8 | 8 | 100 | 4 | 4 | 100 | ||||
| 63, 70, 77, 84 | 8 | 8 | 100 | 4 | 4 | 100 | ||||
| Total | 26 | 100 | 13 | 84.62 | ||||||
| (B) | ||||||||||
| Sample-35 °C (storage time/d) | Calibration data | Prediction data | ||||||||
| Full acceptance period | Acceptance period | Unacceptance period | Total | Correctly classified (%) | Full acceptance period | Acceptance period | Unacceptance period | Total | Correctly classified (%) | |
| 0, 14, 28, 42 | 8 | 8 | 100 | 4 | 4 | 100 | ||||
| 56, 70, 84, 98, 112, 126 | 12 | 12 | 100 | 6 | 6 | 100 | ||||
| 140, 154 | 4 | 4 | 100 | 2 | 2 | 100 | ||||
| Total | 24 | 100 | 12 | 100 | ||||||
| Quality Indices | Arrhenius Model | Eyring Model | ||||||
|---|---|---|---|---|---|---|---|---|
| R2 | RSME | ∆H* (kJ/mol) | ∆S* (J/(mol·K)) | R2 | RSME | |||
| Total acid | 47.23 | −1.0616 | 0.9567 | 0.0018 | -- | -- | -- | -- |
| L* Rd | 65.18 | 0.1024 | 0.9943 | 0.0010 | 62.60 | −60.98 | 0.9942 | 0.0010 |
| L* v | 72.09 | 0.0554 | 0.9995 | 0.0017 | 69.51 | −43.66 | 0.9995 | 0.0017 |
| Hardness Rd | 45.76 | 3.8813 | 0.9075 | 0.3766 | 43.19 | −93.75 | 0.9075 | 0.3774 |
| Hardness v | 58.10 | 1.3682 | 0.9779 | 0.0443 | 55.52 | −62.38 | 0.9778 | 0.0446 |
| Sensory score | 70.07 | 0.0453 | 0.9955 | 0.0024 | 67.48 | −51.92 | 0.9995 | 0.0023 |
| Quality Indexes | Prediction Model |
|---|---|
| Total acid | |
| L* Rd | |
| L* v | |
| Hardness Rd | |
| Hardness v | |
| Sensory score |
Publisher’s Note: MDPI stays neutral with regard to jurisdictional claims in published maps and institutional affiliations. |
© 2022 by the authors. Licensee MDPI, Basel, Switzerland. This article is an open access article distributed under the terms and conditions of the Creative Commons Attribution (CC BY) license (https://creativecommons.org/licenses/by/4.0/).
Share and Cite
Du, J.; Zhang, M.; Zhang, L.; Law, C.L.; Liu, K. Shelf-Life Prediction and Critical Value of Quality Index of Sichuan Sauerkraut Based on Kinetic Model and Principal Component Analysis. Foods 2022, 11, 1762. https://doi.org/10.3390/foods11121762
Du J, Zhang M, Zhang L, Law CL, Liu K. Shelf-Life Prediction and Critical Value of Quality Index of Sichuan Sauerkraut Based on Kinetic Model and Principal Component Analysis. Foods. 2022; 11(12):1762. https://doi.org/10.3390/foods11121762
Chicago/Turabian StyleDu, Jie, Min Zhang, Lihui Zhang, Chung Lim Law, and Kun Liu. 2022. "Shelf-Life Prediction and Critical Value of Quality Index of Sichuan Sauerkraut Based on Kinetic Model and Principal Component Analysis" Foods 11, no. 12: 1762. https://doi.org/10.3390/foods11121762