

Ultra-Processed Foods in the Mediterranean Diet according to the NOVA Classification System; A Food Level Analysis of Branded Foods in Greece


Abstract
:1. Introduction
2. Materials and Methods
2.1. Data Source
2.2. Classification of Foods to the NOVA System Groups
2.3. Classification of Branded Foods under the Mediterranean Diet Pyramid
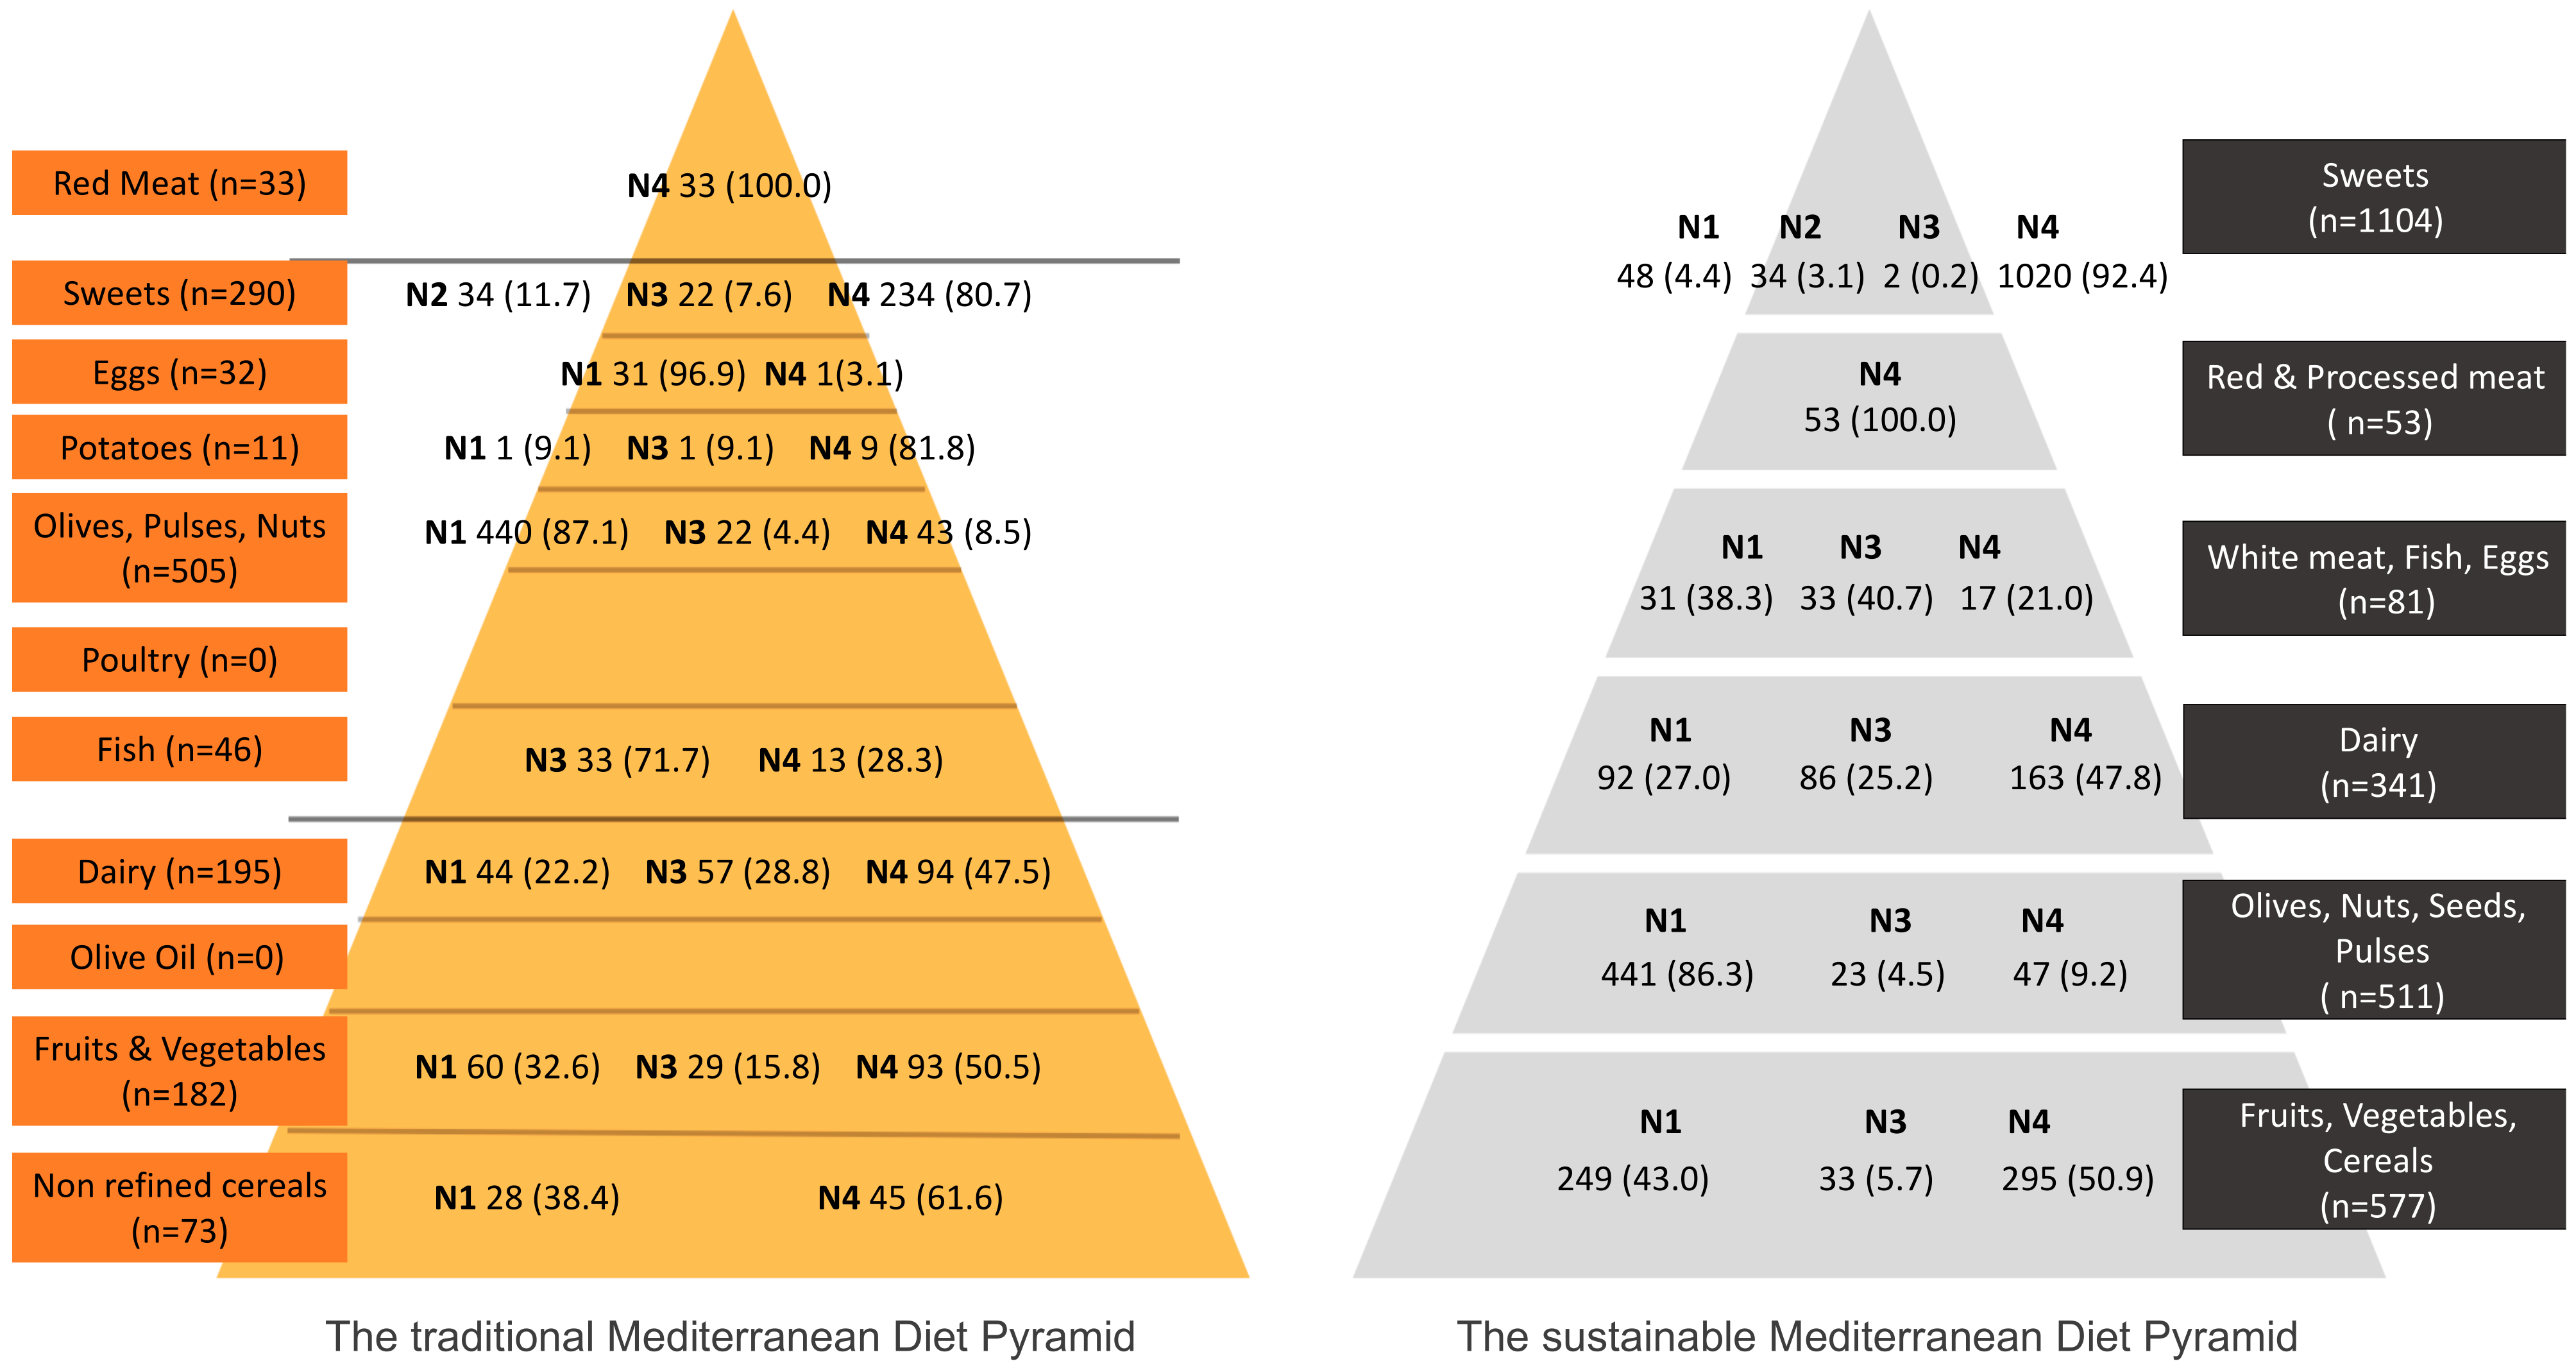
- The traditional MD Pyramid (tMDP) [9,33] describes the MD as documented in the 1960s in Crete, Greece. The tMDP describes a diet that is rich in unprocessed, fresh, or minimally processed foods. The basis of this diet is formed by fresh, seasonal fruits and vegetables and cereal-based foods that are primarily wholegrain. This diet excludes any novel foods or foods produced with modern processing techniques and it is also based on local produce, i.e., foods produced in Greece.
- The sustainable MD Pyramid (sMDP) [13], which is the most recent revision of the tMDP and has included all traditional Mediterranean foods, along with a variety of modern foods and drinks (such as sodas, sweets, and savory snacks). The sMDP has also included the element of food processing more explicitly within each MDP tier.
2.4. Application of the Nutri-Score Algorithm
2.5. Statistical Analysis
3. Results
3.1. Distribution of Branded Foods among the NOVA Groups
3.2. Nutritional Quality of Branded Foods Included in the MD Pyramids
3.3. The NOVA Classification System and Nutri-Score
4. Discussion
5. Conclusions
Author Contributions
Funding
Data Availability Statement
Conflicts of Interest
References
- Lăcătușu, C.M.; Grigorescu, E.D.; Floria, M.; Onofriescu, A.; Mihai, B.M. The Mediterranean Diet: From an Environment-Driven Food Culture to an Emerging Medical Prescription. Int. J. Environ. Res. Public Health 2019, 16, 942. [Google Scholar] [CrossRef] [PubMed] [Green Version]
- Dominguez, L.J.; di Bella, G.; Veronese, N.; Barbagallo, M. Impact of Mediterranean Diet on Chronic Non-Communicable Diseases and Longevity. Nutrients 2021, 13, 2028. [Google Scholar] [CrossRef] [PubMed]
- Trichopoulou, A.; Benetou, V. Impact of Mediterranean Diet on Longevity. In Centenarians; Springer: Berlin/Heidelberg, Germany, 2019; pp. 161–168. [Google Scholar] [CrossRef]
- Berry, E.M. Sustainable Food Systems and the Mediterranean Diet. Nutrients 2019, 11, 2229. [Google Scholar] [CrossRef] [Green Version]
- Dernini, S.; Berry, E.M. Mediterranean Diet: From a Healthy Diet to a Sustainable Dietary Pattern. Front. Nutr. 2015, 2, 15. [Google Scholar] [CrossRef] [Green Version]
- Dernini, S.; Berry, E.M.; Serra-Majem, L.; la Vecchia, C.; Capone, R.; Medina, F.X.; Aranceta-Bartrina, J.; Belahsen, R.; Burlingame, B.; Calabrese, G.; et al. Med Diet 4.0: The Mediterranean Diet with Four Sustainable Benefits. Public Health Nutr. 2017, 20, 1322–1330. [Google Scholar] [CrossRef] [PubMed] [Green Version]
- Mantzioris, E.; Villani, A. Translation of a Mediterranean-Style Diet into the Australian Dietary Guidelines: A Nutritional, Ecological and Environmental Perspective. Nutrients 2019, 11, 2507. [Google Scholar] [CrossRef] [PubMed] [Green Version]
- Jiménez-Morales, M.; Montaña Blasco, M. Presence and Strategic Use of the Mediterranean Diet in Food Marketing: Analysis and Association of Nutritional Values and Advertising Claims from 2011 to 2020. NFS J. 2021, 24, 1–6. [Google Scholar] [CrossRef]
- Willett, W.C.; Sacks, F.; Trichopoulou, A.; Drescher, G.; Ferro-Luzzi, A.; Helsing, E.; Trichopoulos, D. Mediterranean Diet Pyramid: A Cultural Model for Healthy Eating. Am. J. Clin. Nutr. 1995, 61, 1402S–1406S. [Google Scholar] [CrossRef]
- Vitiello, V.; Germani, A.; Capuzzo Dolcetta, E.; Donini, L.M.; del Balzo, V. The New Modern Mediterranean Diet Italian Pyramid. Ann. Ig. 2016, 28, 179–186. [Google Scholar] [CrossRef]
- Trichopoulou, A.; Costacou, T.; Bamia, C.; Trichopoulos, D. Adherence to a Mediterranean Diet and Survival in a Greek Population. N. Engl. J. Med. 2003, 26, 2599–2608. [Google Scholar] [CrossRef] [Green Version]
- Martimianaki, G.; Peppa, E.; Valanou, E.; Papatesta, E.M.; Klinaki, E.; Trichopoulou, A. Today’s Mediterranean Diet in Greece: Findings from the National Health and Nutrition Survey-HYDRIA (2013–2014). Nutrients 2022, 14, 1193. [Google Scholar] [CrossRef] [PubMed]
- Serra-Majem, L.; Tomaino, L.; Dernini, S.; Berry, E.M.; Lairon, D.; de la Cruz, J.N.; Bach-Faig, A.; Donini, L.M.; Medina, F.X.; Belahsen, R.; et al. Updating the Mediterranean Diet Pyramid towards Sustainability: Focus on Environmental Concerns. Int. J. Environ. Res. Public Health 2020, 17, 8758. [Google Scholar] [CrossRef] [PubMed]
- Adams, J.; Hofman, K.; Moubarac, J.C.; Thow, A.M. Public Health Response to Ultra-Processed Food and Drinks. BMJ 2020, 369, m2391. [Google Scholar] [CrossRef] [PubMed]
- Srour, B.; Kordahi, M.C.; Bonazzi, E.; Deschasaux-Tanguy, M.; Touvier, M.; Chassaing, B. Ultra-Processed Foods and Human Health: From Epidemiological Evidence to Mechanistic Insights. Lancet Gastroenterol. Hepatol. 2022, 7, 1128–1140. [Google Scholar] [CrossRef]
- Srour, B.; Fezeu, L.K.; Kesse-Guyot, E.; Allès, B.; Debras, C.; Druesne-Pecollo, N.; Chazelas, E.; Deschasaux, M.; Hercberg, S.; Galan, P.; et al. Ultraprocessed Food Consumption and Risk of Type 2 Diabetes Among Participants of the NutriNet-Santé Prospective Cohort. JAMA Intern. Med. 2020, 180, 283–291. [Google Scholar] [CrossRef]
- Srour, B.; Fezeu, L.K.; Kesse-Guyot, E.; Allès, B.; Méjean, C.; Andrianasolo, R.M.; Chazelas, E.; Deschasaux, M.; Hercberg, S.; Galan, P.; et al. Ultra-Processed Food Intake and Risk of Cardiovascular Disease: Prospective Cohort Study (NutriNet-Santé). BMJ 2019, 365, l1451. [Google Scholar] [CrossRef] [PubMed] [Green Version]
- Martínez Steele, E.; Juul, F.; Neri, D.; Rauber, F.; Monteiro, C.A. Dietary Share of Ultra-Processed Foods and Metabolic Syndrome in the US Adult Population. Prev. Med. 2019, 125, 40–48. [Google Scholar] [CrossRef] [PubMed]
- De Deus Mendonça, R.; Souza Lopes, A.C.; Pimenta, A.M.; Gea, A.; Martinez-Gonzalez, M.A.; Bes-Rastrollo, M. Ultra-Processed Food Consumption and the Incidence of Hypertension in a Mediterranean Cohort: The Seguimiento Universidad de Navarra Project. Am. J. Hypertens. 2017, 30, 358–366. [Google Scholar] [CrossRef] [PubMed] [Green Version]
- Fiolet, T.; Srour, B.; Sellem, L.; Kesse-Guyot, E.; Allès, B.; Méjean, C.; Deschasaux, M.; Fassier, P.; Latino-Martel, P.; Beslay, M.; et al. Consumption of Ultra-Processed Foods and Cancer Risk: Results from NutriNet-Santé Prospective Cohort. BMJ 2018, 360, k322. [Google Scholar] [CrossRef] [Green Version]
- Adjibade, M.; Julia, C.; Allès, B.; Touvier, M.; Lemogne, C.; Srour, B.; Hercberg, S.; Galan, P.; Assmann, K.E.; Kesse-Guyot, E. Prospective Association between Ultra-Processed Food Consumption and Incident Depressive Symptoms in the French NutriNet-Santé Cohort. BMC Med. 2019, 17, 78. [Google Scholar] [CrossRef] [Green Version]
- Schnabel, L.; Kesse-Guyot, E.; Allès, B.; Touvier, M.; Srour, B.; Hercberg, S.; Buscail, C.; Julia, C. Association Between Ultraprocessed Food Consumption and Risk of Mortality Among Middle-Aged Adults in France. JAMA Intern. Med. 2019, 179, 490–498. [Google Scholar] [CrossRef]
- NOVA. The Star Shines Bright|World Nutrition. Available online: https://worldnutritionjournal.org/index.php/wn/article/view/5 (accessed on 23 January 2023).
- Monteiro, C.A.; Cannon, G.; Lawrence, M.; Laura Da Costa Louzada, M.; Machado, P.P. Ultra-Processed Foods, Diet Quality, and Health Using the NOVA Classification System; FAO: Rome, Italy, 2019; Volume 48, pp. 3–5. [Google Scholar]
- Monteiro, C.A.; Cannon, G.; Moubarac, J.C.; Levy, R.B.; Louzada, M.L.C.; Jaime, P.C. The UN Decade of Nutrition, the NOVA Food Classification and the Trouble with Ultra-Processing. Public Health Nutr. 2018, 21, 5–17. [Google Scholar] [CrossRef] [PubMed] [Green Version]
- Braesco, V.; Souchon, I.; Sauvant, P.; Haurogné, T.; Maillot, M.; Féart, C.; Darmon, N. Ultra-Processed Foods: How Functional Is the NOVA System? Eur. J. Clin. Nutr. 2022, 76, 1245–1253. [Google Scholar] [CrossRef] [PubMed]
- Katidi, A.; Vlassopoulos, A.; Kapsokefalou, M. Development of the Hellenic Food Thesaurus (HelTH), a Branded Food Composition Database: Aims, Design and Preliminary Findings. Food Chem. 2021, 347, 129010. [Google Scholar] [CrossRef] [PubMed]
- Katidi, A.; Pavlopoulou, A.; Vlassopoulos, A.; Kapsokefalou, M. The Nutritional Composition of Natural and Organic Branded Food Products: A Cross-Sectional Analysis of the Greek Foodscape. Nutrients 2022, 14, 808. [Google Scholar] [CrossRef] [PubMed]
- Katidi, A.; Vlassopoulos, A.; Xanthopoulou, S.; Boutopoulou, B.; Moriki, D.; Sardeli, O.; Rufián-Henares, J.Á.; Douros, K.; Kapsokefalou, M. The Expansion of the Hellenic Food Thesaurus; Allergens Labelling and Allergens-Free Claims on Greek Branded Food Products. Nutrients 2022, 14, 3421. [Google Scholar] [CrossRef]
- Katidi, A.; Xypolitaki, K.; Vlassopoulos, A.; Kapsokefalou, M. Nutritional Quality of Plant-Based Meat and Dairy Imitation Products and Comparison with Animal-Based Counterparts. Nutrients 2023, 15, 401. [Google Scholar] [CrossRef]
- Drewnowski, A. Perspective: Identifying Ultra-Processed Plant-Based Milk Alternatives in the USDA Branded Food Products Database. Adv. Nutr. 2021, 12, 2068. [Google Scholar] [CrossRef]
- Monteiro, C.A.; Cannon, G.; Levy, R.B.; Moubarac, J.-C.; Louzada, M.L.; Rauber, F.; Khandpur, N.; Cediel, G.; Neri, D.; Martinez-Steele, E.; et al. Ultra-Processed Foods: What They Are and How to Identify Them. Public Health Nutr. 2019, 22, 936–941. [Google Scholar] [CrossRef]
- Food-Based Dietary Guidelines—Greece. Available online: https://www.fao.org/nutrition/education/food-dietary-guidelines/regions/countries/greece/en/ (accessed on 26 January 2023).
- Vlassopoulos, A.; Katidi, A.; Savvidou, T.; Kapsokefalou, M. Alignment of Nutri-Score with Mediterranean Diet Pyramid: A Food Level Analysis. Nutrients 2022, 14, 5097. [Google Scholar] [CrossRef] [PubMed]
- Vlassopoulos, A.; Katidi, A.; Kapsokefalou, M. Performance and Discriminatory Capacity of Nutri-Score in Branded Foods in Greece. Front. Nutr. 2022, 9, 2359. [Google Scholar] [CrossRef] [PubMed]
- Nutri-Score. Available online: https://www.santepubliquefrance.fr/en/nutri-score (accessed on 21 December 2022).
- Bonaccio, M.; di Castelnuovo, A.; Ruggiero, E.; Costanzo, S.; Grosso, G.; de Curtis, A.; Cerletti, C.; Donati, M.B.; de Gaetano, G.; Iacoviello, L. Joint Association of Food Nutritional Profile by Nutri-Score Front-of-Pack Label and Ultra-Processed Food Intake with Mortality: Moli-Sani Prospective Cohort Study. BMJ 2022, 378, e070688. [Google Scholar] [CrossRef]
- Nutri-Score and Ultra-Processing: Two Dimensions, Complementary and Not Contradictory—NUTRI-SCORE. Available online: https://nutriscore.blog/2020/11/07/nutri-score-and-ultra-processing-two-dimensions-complementary-and-not-contradictory/ (accessed on 14 February 2023).
- Srour, B.; Hercberg, S.; Galan, P.; Monteiro, C.; de Edelenyi, F.S.; Bourhis, L.; Fialon, M.; Sarda, B.; Druesne-Pecollo, N.; Esseddik, Y.; et al. Effect of a New Graphically Modified Nutri-Score on the Objective Understanding of Foods’ Nutrient Profile and Ultra-Processing—A Randomised Controlled Trial. medRxiv 2022, medRxiv:2022.11.18.22282494. [Google Scholar] [CrossRef]
- Romero Ferreiro, C.; Lora Pablos, D.; Gómez de la Cámara, A. Two Dimensions of Nutritional Value: Nutri-Score and NOVA. Nutrients 2021, 13, 2783. [Google Scholar] [CrossRef]
- Dinu, M.; Asensi, M.T.; Pagliai, G.; Lotti, S.; Martini, D.; Colombini, B.; Sofi, F. Consumption of Ultra-Processed Foods Is Inversely Associated with Adherence to the Mediterranean Diet: A Cross-Sectional Study. Nutrients 2022, 14, 2073. [Google Scholar] [CrossRef]
- Godos, J.; Giampieri, F.; Al-Qahtani, W.H.; Scazzina, F.; Bonaccio, M.; Grosso, G. Ultra-Processed Food Consumption and Relation with Diet Quality and Mediterranean Diet in Southern Italy. Int. J. Environ. Res. Public Health 2022, 19, 11360. [Google Scholar] [CrossRef]
- Da Rocha, B.R.S.; Rico-Campà, A.; Romanos-Nanclares, A.; Ciriza, E.; Barbosa, K.B.F.; Martínez-González, M.Á.; Martín-Calvo, N. Adherence to Mediterranean Diet Is Inversely Associated with the Consumption of Ultra-Processed Foods among Spanish Children: The SENDO Project. Public Health Nutr. 2021, 24, 3294–3303. [Google Scholar] [CrossRef] [PubMed]
- Vandevijvere, S.; de Ridder, K.; Fiolet, T.; Bel, S.; Tafforeau, J. Consumption of Ultra-Processed Food Products and Diet Quality among Children, Adolescents and Adults in Belgium. Eur. J. Nutr. 2019, 58, 3267–3278. [Google Scholar] [CrossRef]
- Ruggiero, E.; Esposito, S.; Costanzo, S.; di Castelnuovo, A.; Cerletti, C.; Donati, M.B.; de Gaetano, G.; Iacoviello, L.; Bonaccio, M. Ultra-Processed Food Consumption and Its Correlates among Italian Children, Adolescents and Adults from the Italian Nutrition & Health Survey (INHES) Cohort Study. Public Health Nutr. 2021, 24, 6258–6271. [Google Scholar] [CrossRef]
- Martini, D.; Godos, J.; Bonaccio, M.; Vitaglione, P.; Grosso, G. Ultra-Processed Foods and Nutritional Dietary Profile: A Meta-Analysis of Nationally Representative Samples. Nutrients 2021, 13, 3390. [Google Scholar] [CrossRef] [PubMed]
- Pagliai, G.; Dinu, M.; Madarena, M.P.; Bonaccio, M.; Iacoviello, L.; Sofi, F. Consumption of Ultra-Processed Foods and Health Status: A Systematic Review and Meta-Analysis. Br. J. Nutr. 2021, 125, 308–318. [Google Scholar] [CrossRef] [PubMed]

| NOVA1 n (%) | NOVA2 n (%) | NOVA3 n (%) | NOVA4 n (%) | |
|---|---|---|---|---|
| HelTH (n = 4824) | 983 (20.4) | 69 (1.4) | 367 (7.6) | 3405 (70.6) |
| tMDP (n = 1367) | 604 (44.2) | 34 (2.5) | 164 (12.0) | 565 (41.3) |
| sMDP (n = 2667) | 861 (32.1) | 34 (1.3) | 177 (7.4) | 1595 (58.7) |
| Food Tiers of the Traditional Mediterranean Diet Pyramid | Food Subcategory | NOVA Classification System | |||
|---|---|---|---|---|---|
| NOVA1 | NOVA2 | NOVA3 | NOVA4 | ||
| Red Meat (n = 33) | Preserved Meat (n = 11) | - | - | - | 11 (100.0) |
| Sausage or similar meat product (n = 21) | - | - | - | 21 (100.0) | |
| Meat dish (n = 1) | - | - | - | 1 (100.0) | |
| Sweets (n = 290) | Fine Bakery Ware (n = 92) | - | - | - | 92 (100.0) |
| Sugar, Honey or Syrup (n = 35) | - | 34 (97.1) | 1 (2.9) | - | |
| Jam or Marmalade (n = 69) | - | - | - | 69 (100.0) | |
| Non-chocolate confectionary or other sugar product (n = 64) | - | - | 21 (32.8) | 43 (67.2) | |
| Prepared Food Product (n = 30) | - | - | - | 30 (100.0) | |
| Eggs (n = 32) | Fresh or Processed Egg (n = 32) | 31 (96.9) | - | - | 1 (3.1) |
| Potatoes (n = 11) | Starchy Root or Potato (n = 11) | 1 (9.1) | - | 1 (9.1) | 9 (81.8) |
| Olives, Pulses, Nuts (n = 505) | Pulses (n = 422) | 422 (100.0) | - | - | - |
| Nut or Seed Product (n = 12) | 5 (41.7) | - | - | 7 (58.3) | |
| Seeds or Kernel (n = 31) | - | - | 16 (51.6) | 15 (48.4) | |
| Nuts (n = 38) | 12 (31.6) | - | 6 (15.8) | 20 (52.6) | |
| Vegetable (n = 1) | 1 (100.0) | ||||
| Prepared Food Product (n = 1) | - | - | - | 1 (100.0) | |
| Fish (n = 46) | Seafood Product (n = 46) | - | - | 33 (71.7) | 13 (28.3) |
| Dairy (n = 195) | Milk (n = 55) | 28 (50.9) | - | 3 (5.5) | 24 (43.6) |
| Yogurt (n = 51) | 16 (31.4) | - | - | 35 (68.6) | |
| Cheese (n = 89) | - | - | 54 (60.7) | 35 (39.3) | |
| Fruits and Vegetables (n = 182) | Vegetable (n = 159) | 59 (37.1) | - | 27 (17.0) | 73 (45.9) |
| Processed fruit (n = 23) | 1 (4.3) | - | 2 (8.7) | 20 (87.0) | |
| Non refined cereals (n = 73) | Rice or Similar Product (n = 7) | 7 (100.0) | - | - | - |
| Pasta or Similar product (n = 22) | 21 (95.5) | - | - | 1 (4.5) | |
| Bread or similar product (n = 44) | - | - | - | 44 (100.0) | |
| Food Tiers of the Sustainable MD Pyramid | Food Subcategory | NOVA Classification System | |||
|---|---|---|---|---|---|
| NOVA1 | NOVA2 | NOVA3 | NOVA4 | ||
| Sweets (n = 1104) | Fine Bakery Ware (n = 278) | - | - | - | 278 (100.0) |
| Sugar, Honey or Syrup (n = 35) | - | 34 (97.1) | 1 (2.9) | - | |
| Jam or Marmalade (n = 69) | - | - | - | 69 (100.0) | |
| Non-chocolate confectionary or other sugar product (n = 64) | - | - | - | 64 (100.0) | |
| Prepared Food Product (n = 40) | - | - | - | 40 (100.0) | |
| Frozen dairy dessert (n = 38) | - | - | - | 38 (100.0) | |
| Cereal or cereal milling product (n = 2) | - | - | - | 2 (100.0) | |
| Chocolate (n = 208) | - | - | - | 208 (100.0) | |
| Juice or Nectar (n = 163) | 48 (29.4) | - | 1 (0.6) | 114 (69.9) | |
| Non-alcoholic beverages (n = 207) | - | - | - | 207 (100.0) | |
| Red and processed Meat (n = 53) | Preserved Meat (n = 31) | - | - | - | 31 (100.0) |
| Sausage or similar meat product (n = 21) | - | - | - | 21 (100.0) | |
| Meat dish (n = 1) | 1 (100.0) | ||||
| White meat, fish, eggs (n = 81) | Fresh or Processed Egg (n = 32) | 31 (96.9) | - | - | 1 (3.1) |
| Seafood Product (n = 46) | - | - | 33 (71.7) | 13 (28.3) | |
| Prepared Food Product (n = 3) | - | - | - | 3 (100.0) | |
| Dairy (n = 341) | Milk (n = 122) | 68 (55.7) | - | 6 (4.9) | 48 (39.3) |
| Yogurt (n = 84) | 24 (28.6) | - | - | 60 (71.4) | |
| Cheese (n = 135) | - | - | 80 (59.3) | 55 (40.7) | |
| Olives, Pulses, Nuts (n = 511) | Pulses (n = 422) | 422 (100.0) | - | - | - |
| Nut or Seed Product (n = 12) | 5 (41.7) | - | - | 7 (58.3) | |
| Seeds or Kernel (n = 31) | - | - | 16 (51.6) | 15 (48.4) | |
| Nuts (n = 38) | 12 (31.6) | - | 6 (15.8) | 20 (52.6) | |
| Vegetable (n = 7) | 2 (28.6) | - | 1 (14.3) | 4 (57.1) | |
| Prepared Food Product (n = 1) | - | - | - | 1 (100.0) | |
| Fruits, Vegetables, Cereals (n = 577) | Processed fruit (n = 23) | 1 (4.3) | 2 (8.7) | 20 (87.0) | |
| Vegetable (n = 153) | 58 (37.9) | - | 26 (17.0) | 69 (45.1) | |
| Starchy Root or Potato (n = 11) | 1 (9.1) | - | 1 (9.1) | 9 (81.8) | |
| Rice or Similar Product (n = 62) | 50 (80.6) | - | - | 12 (19.4) | |
| Pasta or Similar product (n = 162) | 139 (85.8) | - | 4 (2.5) | 19 (11.7) | |
| Bread or similar product (n = 166) | - | - | - | 166 (100.0) | |
| Traditional Mediterranean Diet Pyramid | |||||||||||||
|---|---|---|---|---|---|---|---|---|---|---|---|---|---|
| Traditional MD Pyramid Tiers | NOVA Classification System | Nutritional Composition per 100 g/mL | |||||||||||
| Energy (kcal) | p-Value | Protein (g) | p-Value | Total Fat (g) | p-Value | SFA (g) | p-Value | Total Sugars (g) | p-Value | Salt (g) | p-Value | ||
| Red Meat (n = 26) | NOVA4 (n = 26) | 210 (140, 302) | n.a. | 13.8 (12.2, 17.0) | n.a. | 15.5 (5.0, 25.2) | n.a. | 5.5 (2.2, 9.7) | n.a. | 1.0 (0.5, 1.2) | n.a. | 2.40 (2.00, 2.50) | n.a. |
| Sweets (n = 192) | NOVA3 (n = 10) | 359 (312, 526) | 0.914 | 5.9 (0.8, 12.2) | 0.692 | 6.5 (0.1, 33.3) | 0.855 | 0.1 (0.1, 3.7) | 0.134 | 65.0 (35.0, 72.0) | 0.01 | 0.10 (0.00, 0.15) | 0.084 |
| NOVA4 (n = 182) | 458 (267, 509) | 5.4 (0.9, 8.0) | 19.0 (0.3, 26.3) | 6.6 (0.0, 10.9) | 33.0 (20.1, 49.8) | 0.17 (0.03, 0.54) | |||||||
| Eggs (n = 28) | NOVA1 (n = 27) | 138 (138, 150) | n.a. | 13.0 (12.6, 13.0) | n.a. | 11.0 (10.6, 11.0) | n.a. | 3.2 (3.2, 3.2) | n.a. | 0.0 (0.0, 0.0) | n.a. | 0.29 (0.13, 0.31) | n.a. |
| NOVA4 (n = 1) | 46 (n.a.) | 11.0 (n.a.) | 0.3 (n.a.) | 0.0 (n.a.) | 0.3 (n.a.) | 0.44 (n.a.) | |||||||
| Potatoes (n = 11) | NOVA1 (n = 1) | 78 (n.a.) | n.a. | 2.4 (2.4, 2.4) | n.a. | 0.6 (0.6, 0.6) | n.a. | 0.0 (0.0, 0.0) | n.a. | 0.8 (0.8, 0.8) | n.a. | 0.06 (0.06, 0.06) | n.a. |
| NOVA3 (n = 1) | 156 (n.a.) | 2.5 (2.5, 2.5) | 5.9 (5.9, 5.9) | 1.0 (1.0, 1.0) | 0.8 (0.8, 0.8) | 0.06 (0.06, 0.06) | |||||||
| NOVA4 (n = 9) | 136 (82, 180) | 2.2 (1.8, 2.6) | 4.0 (1.0, 5.8) | 0.7 (0.3, 1.0) | 0.9 (0.5, 4.5) | 0.25 (0.11, 0.59) | |||||||
| Olives, Pulses, Nuts (n = 503) | NOVA1 (n = 441) | 331 (302, 347) | 0.044 | 22.0 (20.3, 24.6) * | <0.01 | 1.7 (1.2, 2.4) * | <0.01 | 0.3 (0.2, 0.5) * | <0.01 | 2.4 (1.5, 3.7) | <0.01 | 0.02 (0.00, 0.03) * | <0.01 |
| NOVA3 (n = 21) | 278 (229, 496) | 1.6 (1.2, 8.6) * | 26.6 (19.4, 36.5) | 2.9 (2.4, 4.9) | 0.2 (0.0, 0.8) | 2.70 (1.62, 3.70) | |||||||
| NOVA4 (n = 41) | 495 (251, 593) | 14.2 (1.9, 20.2) | 30.3 (19.9, 49.0) | 5.5 (3.0, 7.7) | 2.6 (0.1, 5.8) | 2.00 (0.10, 4.21) | |||||||
| Fish (n = 39) | NOVA3 (n = 27) | 185 (101, 283) | 0.831 | 20.0 (16.0, 24.0) | 0.002 | 10.7 (0.6, 24.8) | 0.975 | 3.0 (0.2, 4.1) | 0.235 | 0.0 (0.0, 0.1) | <0.01 | 1.00 (0.95, 1.30) | 0.543 |
| NOVA4 (n = 12) | 195 (94, 237) | 12.2 (8.5, 14.8) | 8.8 (4.4, 14.3) | 1.2 (0.5, 2.0) | 1.0 (0.8, 1.5) | 1,05 (1.00, 1.83) | |||||||
| Dairy (n = 152) | NOVA1 (n = 36) | 47 (46, 70) * | <0.01 | 3.5 (3.3, 4.4) * | <0.01 | 1.5 (1.5, 4.0) * | <0.01 | 1.0 (0.9, 2.0) | <0.01 | 4.7 (4.3, 4.7) | <0.01 | 0.10 (0.10, 0.12) * | <0.01 |
| NOVA3 (n = 35) | 308 (201, 357) * | 23.0 (16.5, 27.0) * | 23.0 (12.0, 28.1) * | 15.8 (8.2, 20.0) * | 0.6 (0.0, 1.2) * | 1.75 (1.30, 2.00) * | |||||||
| NOVA4 (n = 81) | 96 (69, 202) | 6.9 (3.9, 12.2) | 3.9 (1.7, 8.4) | 2.2 (1.0, 4.8) | 4.9 (3.1, 11.6) | 0.15 (0.10, 0.76) | |||||||
| Fruits and Vegetables (n = 169) | NOVA1 (n = 59) | 33 (30, 77) | 0.078 | 2.6 (1.7, 4.2) * | <0.01 | 0.3 (0.2, 0.5) | 0.361 | 0.1 (0.1, 0.1) | 0.993 | 2.2 (1.1, 4.5) * | <0.01 | 0.03 (0.00, 0.10) * | <0.01 |
| NOVA3 (n = 21) | 85 (63, 102) | 4.0 (2.4, 4.4) * | 0.4 (0.2, 1.1) | 0.1 (0.0, 0.3) | 5.2 (3.3, 13.1) | 0.40 (0.08, 0.60) | |||||||
| NOVA4 n = 89) | 32 (25, 258) | 1.5 (1.2, 2.1) | 0.4 (0.1, 0.2) | 0.1 (0.0, 0.2) | 3.6 (2.2, 14.8) | 0.13 (0.03, 0.63) | |||||||
| Non refined cereals (n = 56) | NOVA1 (n = 28) | 354 (352, 359) | 0.016 | 12.0 (9.3, 12.0) | 0.478 | 1.5 (1.3, 2.0) | <0.01 | 0.3 (0.2, 0.4) | <0.01 | 3.3 (1.0, 3.8) | <0.01 | 0.03 (0.01, 0.05) | <0.01 |
| NOVA4 (n = 28) | 406 (310, 443) | 11.0 (9.4, 12.0) | 7.5 (3.6, 15.1) | 2.8 (0.8, 5.0) | 4.5 (3.4, 5.5) | 1.10 (0.9, 1.5) | |||||||
| Sustainable Mediterranean Diet Pyramid | |||||||||||||
|---|---|---|---|---|---|---|---|---|---|---|---|---|---|
| Sustainable MD Pyramid Tiers | NOVA Classification System | Nutritional Composition per 100 g/mL | |||||||||||
| Energy (kcal) | p-Value | Protein (g) | p-Value | Total Fat (g) | p-Value | SFA (g) | p-Value | Total Sugars (g) | p-Value | Salt (g) | p-Value | ||
| Sweets (n = 928) | NOVA 1 (n = 48) | 48 (46, 52) * | <0.01 | 0.5 (0.3, 0.6) * | <0.01 | 0.0 (0.0, 0.1) * | <0.01 | 0.0 (0.0, 0.0) * | <0.01 | 10.8 (9.9, 12.0) * | <0.01 | 0.00 (0.00, 0.00) * | <0.01 |
| NOVA 3 (n = 11) | 340 (283, 519) | 1.0 (0.9, 11.5) | 2.0 (0.1, 32.3) | 0.1 (0.1, 2.8) | 64.5 (20.0, 71.8) * | 0.10 (0.00, 0.23) | |||||||
| NOVA 4 (n = 869) | 383 (49, 513) | 4.6 (0.3, 7.2) | 15.4 (0.0, 28.2) | 6.4 (0.0, 14.0) | 20.5 (10.6, 41.6) | 0.11 (0.01, 0.39) | |||||||
| Red and processed meat (n = 43) | NOVA 4 (n = 43) | 210 (158, 292) | n.a. | 13.3 (11.5, 17.3) | n.a. | 14.8 (7.8, 23.4) | n.a. | 5.1 (2.9, 8.8) | n.a. | 0.5 (0.0, 1.0) | n.a. | 2.50 (2.11, 2.60) | n.a. |
| White meat, fish, eggs (n=69) | NOVA 1 (n = 27) | 138 (138, 150) | 0.031 | 13.0 (12.6, 13.0) | <0.01 | 11.0 (10.6, 11.0) | 0.973 | 3.2 (3.2, 3.2) | 0.047 | 0.0 (0.0, 0.0) * | <0.01 | 0.29 (0.13, 0.31) * | <0.01 |
| NOVA 3 (n = 27) | 185 (101, 283) | 20.1 (16.0, 24.0) * | 10.7 (0.6, 24.8) | 3.0 (0.2, 4.1) | 0.0 (0.0, 0.1) * | 1.00 (0.95, 1.30) | |||||||
| NOVA 4 (n = 15) | 195 (90, 306) | 12.0 (10.0, 13.0) | 9.9 (4.3, 26.0) | 1.2 (0.5, 2.1) | 1.0 (0.6, 1.6) | 1.05 (0.95, 1.77) | |||||||
| Dairy (n = 289) | NOVA 1 (n = 81) | 48 (46, 68) * | <0.01 | 3.4 (3.3, 3.7) * | <0.01 | 1.5 (1.5, 3.9) * | <0.01 | 1.1 (0.9, 2.3) * | <0.01 | 4.7 (4.5, 4.7) * | <0.01 | 0.10 (0.10, 0.12) * | <0.01 |
| NOVA 3 (n = 63) | 282 (186, 364) * | 23.5 (16.4, 27.0) * | 23.0 (13.0, 28.4) * | 15.5 (9.2, 20.0) * | 0.5 (0.0, 0.9) * | 1.75 (1.3, 2.2) * | |||||||
| NOVA 4 (n = 145) | 96.0 (65.5, 168.5) | 6.7 (3.8, 11.0) | 3.8 (1.6, 8.9) | 2.2 (1.0, 5.4) | 5.2 (3.8, 10.6) | 0.15 (0.10, 0.78) | |||||||
| Olives, nuts, seeds, legumes (n = 476) | NOVA 1 (n = 412) | 331 (302, 347) | 0.049 | 22.0 (20.3, 24.6) * | <0.01 | 1.7 (1.2, 2.4) * | <0.01 | 0.3 (0.2, 2.4) * | <0.01 | 2.4 (1.5, 3.7) | <0.01 | 0.02 (0.00, 0.03) * | <0.01 |
| NOVA 3 (n = 22) | 278 (211, 492) | 1.6 (1.2, 6.5) * | 25.9 (17.9, 36.3) | 2.9 (2.4, 4.8) | 0.4 (0.4, 1.0) | 2.70 (1.54, 3.64) | |||||||
| NOVA 4 (n = 42) | 493 (245, 592) | 13.6 (1.9, 19.9) | 30.1 (15.5, 49.0) | 5.5 (3.0, 7.8) | 2.6 (0.1, 5.8) | 2.00 (0.10, 4.21) | |||||||
| Fruits, Vegetables, Cereals (n = 497) | NOVA 1 (n = 238) | 354 (152, 358) | 0.005 | 11.5 (5.2, 12.0) * | <0.01 | 1.5 (0.6, 2.0) * | <0.01 | 0.3 (0.2, 0.4) * | <0.01 | 3.0 (1.7, 3.5) * | <0.01 | 0.02 (0.01, 0.05) * | <0.01 |
| NOVA 3 (n = 25) | 96 (73, 120) * | 4.2 (2.7, 5.3) | 0.5 (0.2, 1.8) * | 0.1 (0.0, 0.5) * | 4.9 (3.3, 12.7) | 0.45 (0.08, 0.70) | |||||||
| NOVA 4 (n = 234) | 292 (93, 406) | 8.9 (2.0, 11.4) | 4.0 (0.5, 10.0) | 1.0 (0.1, 3.0) | 3.6 (2.0, 5.5) | 0.85 (0.20, 1.42) | |||||||
| Traditional Mediterranean Diet Pyramid | ||||||||
|---|---|---|---|---|---|---|---|---|
| Tiers of the Traditional Mediterranean Diet Pyramid | NOVA Classification System | Nutri-Score | ||||||
| Score | p-Value | A [n (%)] | B [n (%)] | C [n (%)] | D [n (%)] | E [n (%)] | ||
| Red Meat (n = 23) | NOVA 4 (n = 23) | 16.174 ± 4.418 | n.a. | - | - | 1 (4.3) | 14 (60.9) | 8 (34.8) |
| Sweets (n = 168) | NOVA 3 (n = 7) | 10.714 ± 5.736 | 0.068 | 1 (14.3) | - | - | 6 (85.7) | - |
| NOVA 4 (n = 161) | 15.522 ± 6.824 | 4 (2.5) | 3 (1.9) | 22 (13.7) | 69 (42.9) | 63 (39.1) | ||
| Eggs (n = 27) | NOVA 1 (n = 26) | −0.500 ± 0.860 * | n.a. | 10 (38.5) | 16 (61.5) | - | - | - |
| NOVA 4 (n = 1) | −4.000 | 1 (100.0) | - | - | - | - | ||
| Potatoes (n = 11) | NOVA 1 (n = 1) | −2.000 | n.a. | 1 (100.0) | - | - | - | - |
| NOVA 3 (n = 1) | −3.000 | 1 (100.0) | - | - | - | - | ||
| NOVA 4 (n = 9) | −0.222 ± 1.394 | 3 (33.3) | 6 (66.7) | - | - | - | ||
| Olives, Pulses, Nuts (n = 312) | NOVA 1 (n = 253) | −1.103 ± 3.872 * | <0.01 | 195 (77.1) | 35 (13.8) | 17 (6.7) | 4 (1.6) | 2 (0.8) |
| NOVA 3 (n = 19) | 11.947 ± 5.126 * | - | 1 (5.3) | 6 (31.6) | 11 (57.9) | 1 (5.3) | ||
| NOVA 4 (n = 40) | 12.400 ± 4.187 | - | - | 14 (35.0) | 24 (60.0) | 2 (5.0) | ||
| Fish (n = 34) | NOVA 3 (n = 23) | 6.000 ± 6.00 | 0.293 | 1 (4.3) | 7 (30.4) | 7 (30.4) | 8 (34.8) | - |
| NOVA 4 (n = 11) | 3.818 ± 4.490 | 1 (9.1) | 5 (45.5) | 4 (36.4) | 1 (9.1) | - | ||
| Dairy (n = 128) | NOVA 1 (n = 30) | −0.700 ± 1.119 * | <0.01 | 20 (66.7) | 10 (33.3) | - | - | - |
| NOVA 3 (n = 30) | 13.267 ± 5.166 * | 2 (6.7) | - | 2 (3.5) | 25 (83.3) | 1 (3.3) | ||
| NOVA 4 (n = 68) | 4.206 ± 7.049 | 22 (32.4) | 23 (33.8) | 8 (11.8) | 13 (19.1) | 2 (2.9) | ||
| Fruits and Vegetables (n = 155) | NOVA 1 (n = 57) | −6.597 ± 2.802 * | <0.01 | 56 (98.2) | 1 (1.8) | - | - | - |
| NOVA 3 (n = 21) | −4.619 ± 2.081 * | 21 (100.0) | - | - | - | - | ||
| NOVA 4 (n = 77) | 1.143 ± 10.782 | 50 (64.9) | 10 (13.0) | 5 (6.5) | 1 (1.3) | 11 (14.3) | ||
| Non refined cereals (n = 56) | NOVA 1 (n = 28) | −2.464 ± 2.064 * | <0.01 | 26 (92.9) | 2 (7.1) | - | - | - |
| NOVA 4 (n = 28) | 7.429 ± 8.153 | 10 (35.7) | 1 (3.6) | 7 (25.0) | 7 (25.0) | 3 (10.7) | ||
| Sustainable Mediterranean Diet Pyramid | ||||||||
|---|---|---|---|---|---|---|---|---|
| Tiers of the Sustainable Mediterranean Diet Pyramid | NOVA Classification System | Nutri-Score | ||||||
| Score | p-Value | A [n (%)] | B [n (%)] | C [n (%)] | D [n (%)] | E [n (%)] | ||
| Sweets (n = 870) | NOVA 1 (n = 48) | 9.958 ± 2.073 * | <0.01 | - | - | 2 (4.2) | 17 (35.4) | 29 (60.4) |
| NOVA 3 (n = 8) | 9.750 ± 5.970 * | 1 (12.5) | - | 1 (12.5) | 6 (75.0) | - | ||
| NOVA 4 (n = 814) | 15.491 ± 7.792 | 5 (0.6) | 58 (7.1) | 72 (8.8) | 223 (27.4) | 456 (56.0) | ||
| Red and processed meat (n = 39) | NOVA 4 (n = 39) | 16.385 ± 3.958 | n.a. | - | - | 1 (2.6) | 24 (61.5) | 14 (35.9) |
| White meat, fish, eggs (n = 62) | NOVA 1 (n = 26) | −0.500 ± 0.860 * | <0.01 | 10 (38.5) | 16 (61.5) | - | - | - |
| NOVA 3 (n = 23) | 6.000 ± 6.000 | 1 (4.3) | 7 (30.4) | 7 (30.4) | 8 (34.8) | - | ||
| NOVA 4 (n = 13) | 4.385 ± 6.384 | 2 (15.4) | 5 (29.4) | 4 (30.8) | 1 (7.7) | 1 (7.7) | ||
| Dairy (n = 251) | NOVA 1 (n = 68) | −0.427 ± 1.189 * | <0.01 | 39 (57.4) | 29 (42.6) | - | - | - |
| NOVA 3 (n = 55) | 13.655 ± 5.247 * | 4 (7.3) | - | 4 (7.3) | 42 (76.4) | 5 (9.1) | ||
| NOVA 4 (n = 128) | 4.156 ± 7.047 | 35 (27.3) | 52 (40.6) | 14 (10.9) | 23 (18.0) | 4 (3.1) | ||
| Olives, nuts, seeds, legumes (n = 514) | NOVA 1 (n = 254) | −1.126 ± 3.88 * | <0.01 | 196 (77.2) | 35 (13.8) | 17 (6.7) | 4 (1.6) | 2 (0.8) |
| NOVA 3 (n = 20) | 11.300 ± 5.768 | 1 (5.0) | 1 (5.0) | 6 (30.0) | 11 (55.0) | 1 (5.0) | ||
| NOVA 4 (n = 40) | 12.400 ± 4.187 | - | - | 14 (35.0) | 24 (60.0) | 2 (5.0) | ||
| Fruits, Vegetables, Cereals (n = 464) | NOVA 1 (n = 221) | −3.860 ± 2.744 * | <0.01 | 214 (96.8) | 5 (2.3) | 2 (0.9) | - | - |
| NOVA 3 (n = 25) | −2.560 ± 5.621 * | 21 (84.0) | 1 (4.0) | 2 (8.0) | 1 (4.0) | - | ||
| NOVA 4 (n = 218) | 3.826 ± 8.657 | 89 (40.8) | 39 (17.9) | 47 (21.6) | 26 (11.9) | 17 (7.8) | ||
Disclaimer/Publisher’s Note: The statements, opinions and data contained in all publications are solely those of the individual author(s) and contributor(s) and not of MDPI and/or the editor(s). MDPI and/or the editor(s) disclaim responsibility for any injury to people or property resulting from any ideas, methods, instructions or products referred to in the content. |
© 2023 by the authors. Licensee MDPI, Basel, Switzerland. This article is an open access article distributed under the terms and conditions of the Creative Commons Attribution (CC BY) license (https://creativecommons.org/licenses/by/4.0/).
Share and Cite
Katidi, A.; Vlassopoulos, A.; Noutsos, S.; Kapsokefalou, M. Ultra-Processed Foods in the Mediterranean Diet according to the NOVA Classification System; A Food Level Analysis of Branded Foods in Greece. Foods 2023, 12, 1520. https://doi.org/10.3390/foods12071520
Katidi A, Vlassopoulos A, Noutsos S, Kapsokefalou M. Ultra-Processed Foods in the Mediterranean Diet according to the NOVA Classification System; A Food Level Analysis of Branded Foods in Greece. Foods. 2023; 12(7):1520. https://doi.org/10.3390/foods12071520
Chicago/Turabian StyleKatidi, Alexandra, Antonis Vlassopoulos, Stamoulis Noutsos, and Maria Kapsokefalou. 2023. "Ultra-Processed Foods in the Mediterranean Diet according to the NOVA Classification System; A Food Level Analysis of Branded Foods in Greece" Foods 12, no. 7: 1520. https://doi.org/10.3390/foods12071520
APA StyleKatidi, A., Vlassopoulos, A., Noutsos, S., & Kapsokefalou, M. (2023). Ultra-Processed Foods in the Mediterranean Diet according to the NOVA Classification System; A Food Level Analysis of Branded Foods in Greece. Foods, 12(7), 1520. https://doi.org/10.3390/foods12071520