Article

Effect of Corynebacterium glutamicum Fermentation on the Volatile Flavors of the Enzymatic Hydrolysate of Soybean Protein Isolate

1
Key Laboratory of Fermentation Engineering (Ministry of Education), Cooperative Innovation Center of Industrial Fermentation (Ministry of Education & Hubei Province), National “111” Center for Cellular Regulation and Molecular Pharmaceutics, Hubei Key Laboratory of Industrial Microbiology, School of Life Sciences and Health, Hubei University of Technology, Wuhan 430068, China
2
ABI Group, Laboratory of Phycosphere Microbiology, College of Marine Science and Technology, Zhejiang Ocean University, Zhoushan 316022, China
3
Hubei Key Laboratory of Yeast Function, Angel Yeast Co., Ltd., Yichang 443000, China
*
Authors to whom correspondence should be addressed.
Foods 2024, 13(16), 2591; https://doi.org/10.3390/foods13162591
Submission received: 5 July 2024 / Revised: 8 August 2024 / Accepted: 13 August 2024 / Published: 19 August 2024
(This article belongs to the Section Food Biotechnology)

Abstract

:
This study focused on improving the flavor quality of seasonings, and enzymatic hydrolysis of soybean protein isolate (SPI) seasoning via traditional technology may lead to undesirable flavors. Herein, we aimed to develop a new type of SPI seasoning through microbial fermentation to improve its flavor quality. The effect of Corynebacterium glutamicum fermentation on the flavoring compounds of seasonings in SPI enzymatic hydrolysate was examined. Sensory evaluation showed that the SPI seasoning had mainly aromatic and roasted flavor, and the response signals of S18 (aromatic compounds), S24 (alcohols and aldehydes), and S25 (esters and ketones) sensors of the electronic nose differed significantly. Overall, 91 volatile compounds were identified via gas chromatography–mass spectrometry. SPI seasonings contained a higher number of alcohols, ketones, aromatics, and heterocyclic compounds than traditional seasonings, which had stronger cheese, fatty, and roasted aromas. According to the relative odor activity value (ROAV) analysis, n-pentylpyrzine, 2,6-dimethylpyrazine, and tetramethylpyrazine are the key flavoring compounds (ROAV ≥ 1) of SPI seasoning, which may impart a unique roasted and meaty aroma. Therefore, the fermentation of SPI enzymatic hydrolysate with C. glutamicum may improve the flavor quality of its products, providing a new method for the development and production of new seasoning products.

Graphical Abstract

1. Introduction

Good flavor is a key factor that affects food quality, which is the combination of taste, smell, and mouthfeel, and is usually related to specific volatile flavoring compounds such as aldehydes, alcohols, ketones, terpenes, and aromatic compounds [1]. These compounds contribute to food sweetness and aroma, improve undesirable flavor, and alleviate the loss of appetite. Hence, food flavor has become a hot topic in current research. Soybean protein isolate (SPI) is a plant food raw material that contains high levels of proteins, nutrients, aliphatic compounds, aromatic compounds, heterocyclic compounds, terpenes, and other key flavoring compounds [2]. SPI enzymatic hydrolysate is obtained from the enzymatic hydrolysis of soy protein isolate. As a flavor precursor, SPI is mainly used in the research of seasoning base material [3]. SPI foods prepared via commercial proteases often have unpleasant odors such as bitter taste and bean odor, which directly affect the sensory properties of SPI enzymatic hydrolysate [4]. Therefore, the flavor profile of SPI seasoning must be improved for its further application and development.
Microbial fermentation is considered a sustainable method for excellent flavor formation. This method effectively improved the sensory quality and overall characteristics of bean products [5]. For example, Liang et al. [6] enriched volatile flavoring compounds of mung bean powder through lactic acid bacteria fermentation, which reduced unpleasant flavor and improved the flavor and functional characteristics of the mung bean powder. Bai et al. [7] also examined the effect of Lactiplantibacillus plantarum and Saccharomyces cerevisiae fermentation on the volatile flavoring compounds of highland barley and revealed significant changes in these compounds; moreover, the flavor and functional characteristics of highland barley were effectively improved. However, the formation of good flavoring compounds is dependent on the selection of microorganisms and ingredients. SPI enzymatic hydrolysate is considered an essential substrate for the promotion of microbial growth and accumulation of volatile flavoring compounds [8]. Therefore, to overcome the problem of unpleasant flavor, this study prepared a new type of seasoning via microbial fermentation of SPI enzymatic hydrolysate to improve the characteristics of flavoring compounds.
C. glutamicum is an ideal microbial chassis for industrial production, with advantages such as biosafety, low nutrient requirements, rapid growth, and broad substrate spectrum [9]. Previously, we revealed that this strain can industrially produce the flavor enhancer L–glutamate from carbohydrates, which imparts a unique flavor and texture to fermented products [10]. The use of SPI enzymatic hydrolysate as the main raw material of the culture medium may significantly improve the properties of various umami substances of fermented products, and C. glutamicum is a potential fermentation strain for the industrial production of new seasonings with improved flavoring compounds [11]. Only a few studies have reported the use of C. glutamicum to produce economical and safe flavoring substances from enzymatic soybean meal hydrolysates and confirmed that it may produce other excellent flavoring substances [12]. Therefore, to prepare a new seasoning, C. glutamicum could be used for the fermentation of SPI enzymatic hydrolysate to enrich its volatile flavoring compounds and improve its flavor quality.
To analyze and characterize the overall flavor and subtle differences in volatile flavoring compounds of different seasoning samples, quantitative descriptive analysis (QDA), electronic nose (E–nose) technology, and gas chromatography–mass spectrometry (GC–MS) were employed. QDA, which is a highly intuitive and comprehensive sensory evaluation method, is widely used for the systematic analysis of food flavor profiles. E-nose serves as an efficient, time-saving, and low-cost method for detecting the overall odor of a seasoning sample, providing a more accurate and objective indication of the sample’s quality than traditional sensory evaluations [13]. GC–MS is a compound-type detection technology with a high resolution and accuracy that can be used to detect volatile and nonvolatile compounds in hot sauce and other seasoning samples [14]. Compared with GC–ion migration spectroscopy (GC–IMS), which only focuses on the detection of volatile flavoring compounds, GC–MS has a wider detection range. All components of unknown compounds in the sample can be quantitatively analyzed [15]. Therefore, GC–MS can be used to comprehensively analyze the flavor profiles of seasonings.
In this study, QDA and E-nose were used to identify the overall flavor profiles of different seasoning samples, and the combination of GC–MS with statistical multivariate analysis tools (principal component analysis [PCA]) was used to systematically characterize and distinguish volatile flavoring compounds in different seasoning samples. In addition, key flavor active components were identified based on their relative odor activity value (ROAV), and the correlation between sensory properties and important flavoring compounds was investigated using PCA. This research is beneficial in enhancing the added value of SPI and providing a theoretical basis for developing new seasonings.

2. Materials and Methods

2.1. Materials and Chemicals

Yeast powder was purchased from Angel Yeast Co., Ltd. (Yichang, China), SPI (food grade) from Linyi Shansong Biological Products Co., Ltd. (Linyi, China), L-methionine (purity ≥ 99%) and biotin (purity ≥ 99%) from Guangzhou Saiguo Biotechnology Co., Ltd. (Guangzhou, China), vitamin B1 (purity ≥ 99%) from Shanghai Yuanye Biotechnology Co., Ltd. (Shanghai, China), and other chemicals (analytically pure) from Sinopharm Chemical Reagent Co., Ltd. (Beijing, China).
Corynebacterium glutamicum P-45 was selected as the fermentation strain, which was obtained via atmospheric and room-temperature plasma mutagenesis [10]. The fermentation medium of this strain contained glucose (27.0 g/L), yeast powder (41.0 g/L), succinic acid (1.0 g/L), urea (12.0 g/L), MgSO4·7H2O (0.4 g/L), L-methionine (0.5 g/L), K2HPO4·3H2O (2.4 g/L), biotin (0.3 mg/L), vitamin B1 (0.2 mg/L), and MnSO4·H2O (10.0 mg/L).

2.2. Preparation of Three Seasoning Samples

In this study, sample S was prepared via the traditional enzymatic hydrolysis of SPI, sample F was prepared via the traditional C. glutamicum fermentation method, and sample SF was prepared via the C. glutamicum fermentation method using SPI enzymatic hydrolysate. The preparation steps of the three samples were as follows:
S was prepared according to the enzymatic hydrolysis process optimized in our previous experiments (20,000 U/g neutral protease and complex protease were added to soy protein isolate in a 1:1 ratio under the following conditions: pH 7.0, substrate concentration of 15 g/100 mL, and hydrolysis at 45 °C for 13 h) [16]. F was prepared via C. glutamicum fermentation according to the parameters obtained in previous experiments [11]. SF was prepared by adding 40% (v/v) SPI enzymatic hydrolysate into the fermentation medium as a substrate for C. glutamicum and using the fermentation parameters of F [11].
The abovementioned samples were prepared in triplicate. After centrifugation (12,000 rpm for 10 min), the supernatants obtained from the seasoning samples prepared via different methods were tested. Each sample was tested thrice, and the average was considered the final effective value.

2.3. Sensory Evaluation

QDA was used for sensory analysis [17]. The sensory evaluation team comprised 12 students majoring in food (6 males and 6 females, aged 20–30 years), who received training in professional sensory assessment to evaluate the odor characteristics in terms of woody, sour, beany, grassy, fatty, and aroma flavors. The strength of each property was recorded from 1 (low strength) to 8 (high strength). The sensory experiments were conducted, including the smelling of seasoning samples obtained via fermentation with C. glutamicum, a generally recognized as safe microbe [18], in accordance with national regulations (China). Moreover, the medium used in the process was safe and harmless. Therefore, no further ethical permission was required. Appropriate protocols for protecting the rights and privacy of all participants were utilized during the execution of this research. Informed consent was obtained from all participants.

2.4. E-Nose Measurement

cNose-18 electronic nose (Shanghai Baosheng Industrial Development Co., Ltd., Shanghai, China) was used to analyze the overall odor characteristics of the seasoning samples [19]. The E-nose system was equipped with 27 sensors that have varying degrees of response to carbonaceous substances and nitrogenous substances; alkanes; and aromatic compounds such as alcohols, aldehydes, and ketones (Table A1). Moreover, 30 mL of the seasoning sample was diluted to 60 mL in a 1:1 (water-to-seasoning sample) ratio. The diluted seasoning sample was then evenly placed into a special bottle for E-nose analysis. Before testing, each seasoning sample was sealed with a plastic wrap and maintained at 37 °C for 30 min. The detection and cleaning times were set to 120 and 100 s, respectively. Different seasoning samples were measured simultaneously eight times. To reduce systematic errors, the stable values of the last four measurements were taken as response values for analysis [20].

2.5. GC–MS Analysis

Volatile flavoring compounds present in seasoning samples were detected using HP6890/5975C GC–MS (Agilent, CA, USA).
Sample treatment: To extract volatile compounds, each sample (5 g) was mixed with 3 mL of saturated NaCl and 1 μL of the internal standard (1,2-dichlorobenzene; 221 μg/mL) in a 20 mL headspace extract bottle. With a magnetic stirrer (Gongyi Yuhua instrument Co., Ltd., Gongyi, China), the mixture is thoroughly mixed for 1min at a speed of 1300 rpm to disperse the sample and ensure that the internal standard was evenly mixed in the sample. The headspace bottle containing the mixture was then placed in a 50 °C water bath and oscillated at 300 rpm for 30 min before the headspace sampling to balance its headspace. Then, the SPME (Supelco, Bellefone, PA, USA) fibers, which had been treated at 250 °C for 60 min in the gas chromatograph inlet, were exposed to the top space of the headspace vial and extracted at 50 °C for 20 min. Once the headspace volatiles had been collected, the fibers were retrieved and immediately transferred to the GC instrument’s injector. The sample purge time, sample preheating time, sample desorption temperature, and sample purge temperature were 30 min, 5 min, 180 °C, and 70 °C, respectively. The seasoning samples were tested for volatile flavoring compounds under specific GC and MS conditions.
GC conditions: Chromatography was performed using an Agilent DB-WAX column (30 m × 0.25 mm × 0.25 μm) at a column temperature of 40 °C (hold for 2 min). The column was heated up to 250 °C at a rate of 2 °C/min for 5 min. The total running time was 112 min, and the vaporization chamber temperature was 250 °C. The carrier gas was high purity He (99.999%), and the precolumn pressure, carrier gas flow rate, and solvent delay time were 18.411 psi, 3.0 mL/min, and 2 min, respectively [21].
MS conditions: The ion source, ion source temperature, quaternary bar temperature, electron source energy, and activation voltage were Electron impact ion source (EI), 230 °C, 150 °C, 70 eV, and 1.6 V, respectively [22]. Data analysis was performed using Qualitative Navigator B.08.00 software.
Volatile compounds were identified by comparing their linear retention indexes (RIs) with the linear RI of the alkane standard solution (C7–C30) based on a comparison of the mass spectrum with the available mass spectrum in the NIST 11 mass spectrum library. Samples with a matching degree of >80% were extracted and analyzed. Based on the method of Wang et al. [23], the relative percent content of each volatile compound was calculated by dividing the peak area of a single compound by that of the total compound. All analyses were performed in triplicate.

2.6. ROAV

ROAV can be used to assess the contribution of each volatile flavoring compound to the overall aroma and flavor of the seasoning sample [24]. Owing to the variety of volatile flavoring compounds in seasoning samples (such as alcohols, aldehydes, ketones, esters, acids, aromatics, and heterocycles), these samples often contain hundreds of volatile flavoring compounds. To more conveniently analyze the influence of various volatile flavor substances on the overall aroma and flavor of the seasoning sample, ROAV was used to evaluate the contribution of each volatile flavoring compound [25], and the compound that contributed the most to the odor of the seasoning sample was defined as ROAVmax, which was given a value of 100. The ROAV of other volatile flavoring compounds was calculated as follows:
R O V A i 100 × C i C max × T max T i
where Ci and Ti represent the relative content (%) (the peak intensity of each compound to the total peak intensity of all compounds) and sensory threshold (mg/kg) of each volatile flavoring compound, respectively. Cmax and Tmax represent the relative content (%) and sensory threshold (mg/kg) of the compound that contributed the most to the total odor of the seasoning sample, respectively. The threshold for ROAV calculation was derived from the olfactory threshold in water obtained from the literature [26].
In this method, ROAV < 1 indicates that the substance has a lower contribution to the overall flavor of the product, whereas ROAV > 1 indicates that the substance has a greater contribution to the overall flavor of the product.

2.7. Statistical Analysis

All experiments were repeated thrice, and the experimental results were expressed as mean ± standard deviation. IBM SPSS Statistics for Windows version 23 (IBM Corp., Armonk, NY, USA) was used for analysis, and the Duncan multiple range test was used to assess significance; p-values of <0.05 were considered to indicate statistical significance. Charts were constructed using OriginPro 2021, and PCA (PCA-X) and orthogonal partial least squares discriminant analysis (OPLS-DA) were performed via SIMCA 14.1.

3. Results and Discussion

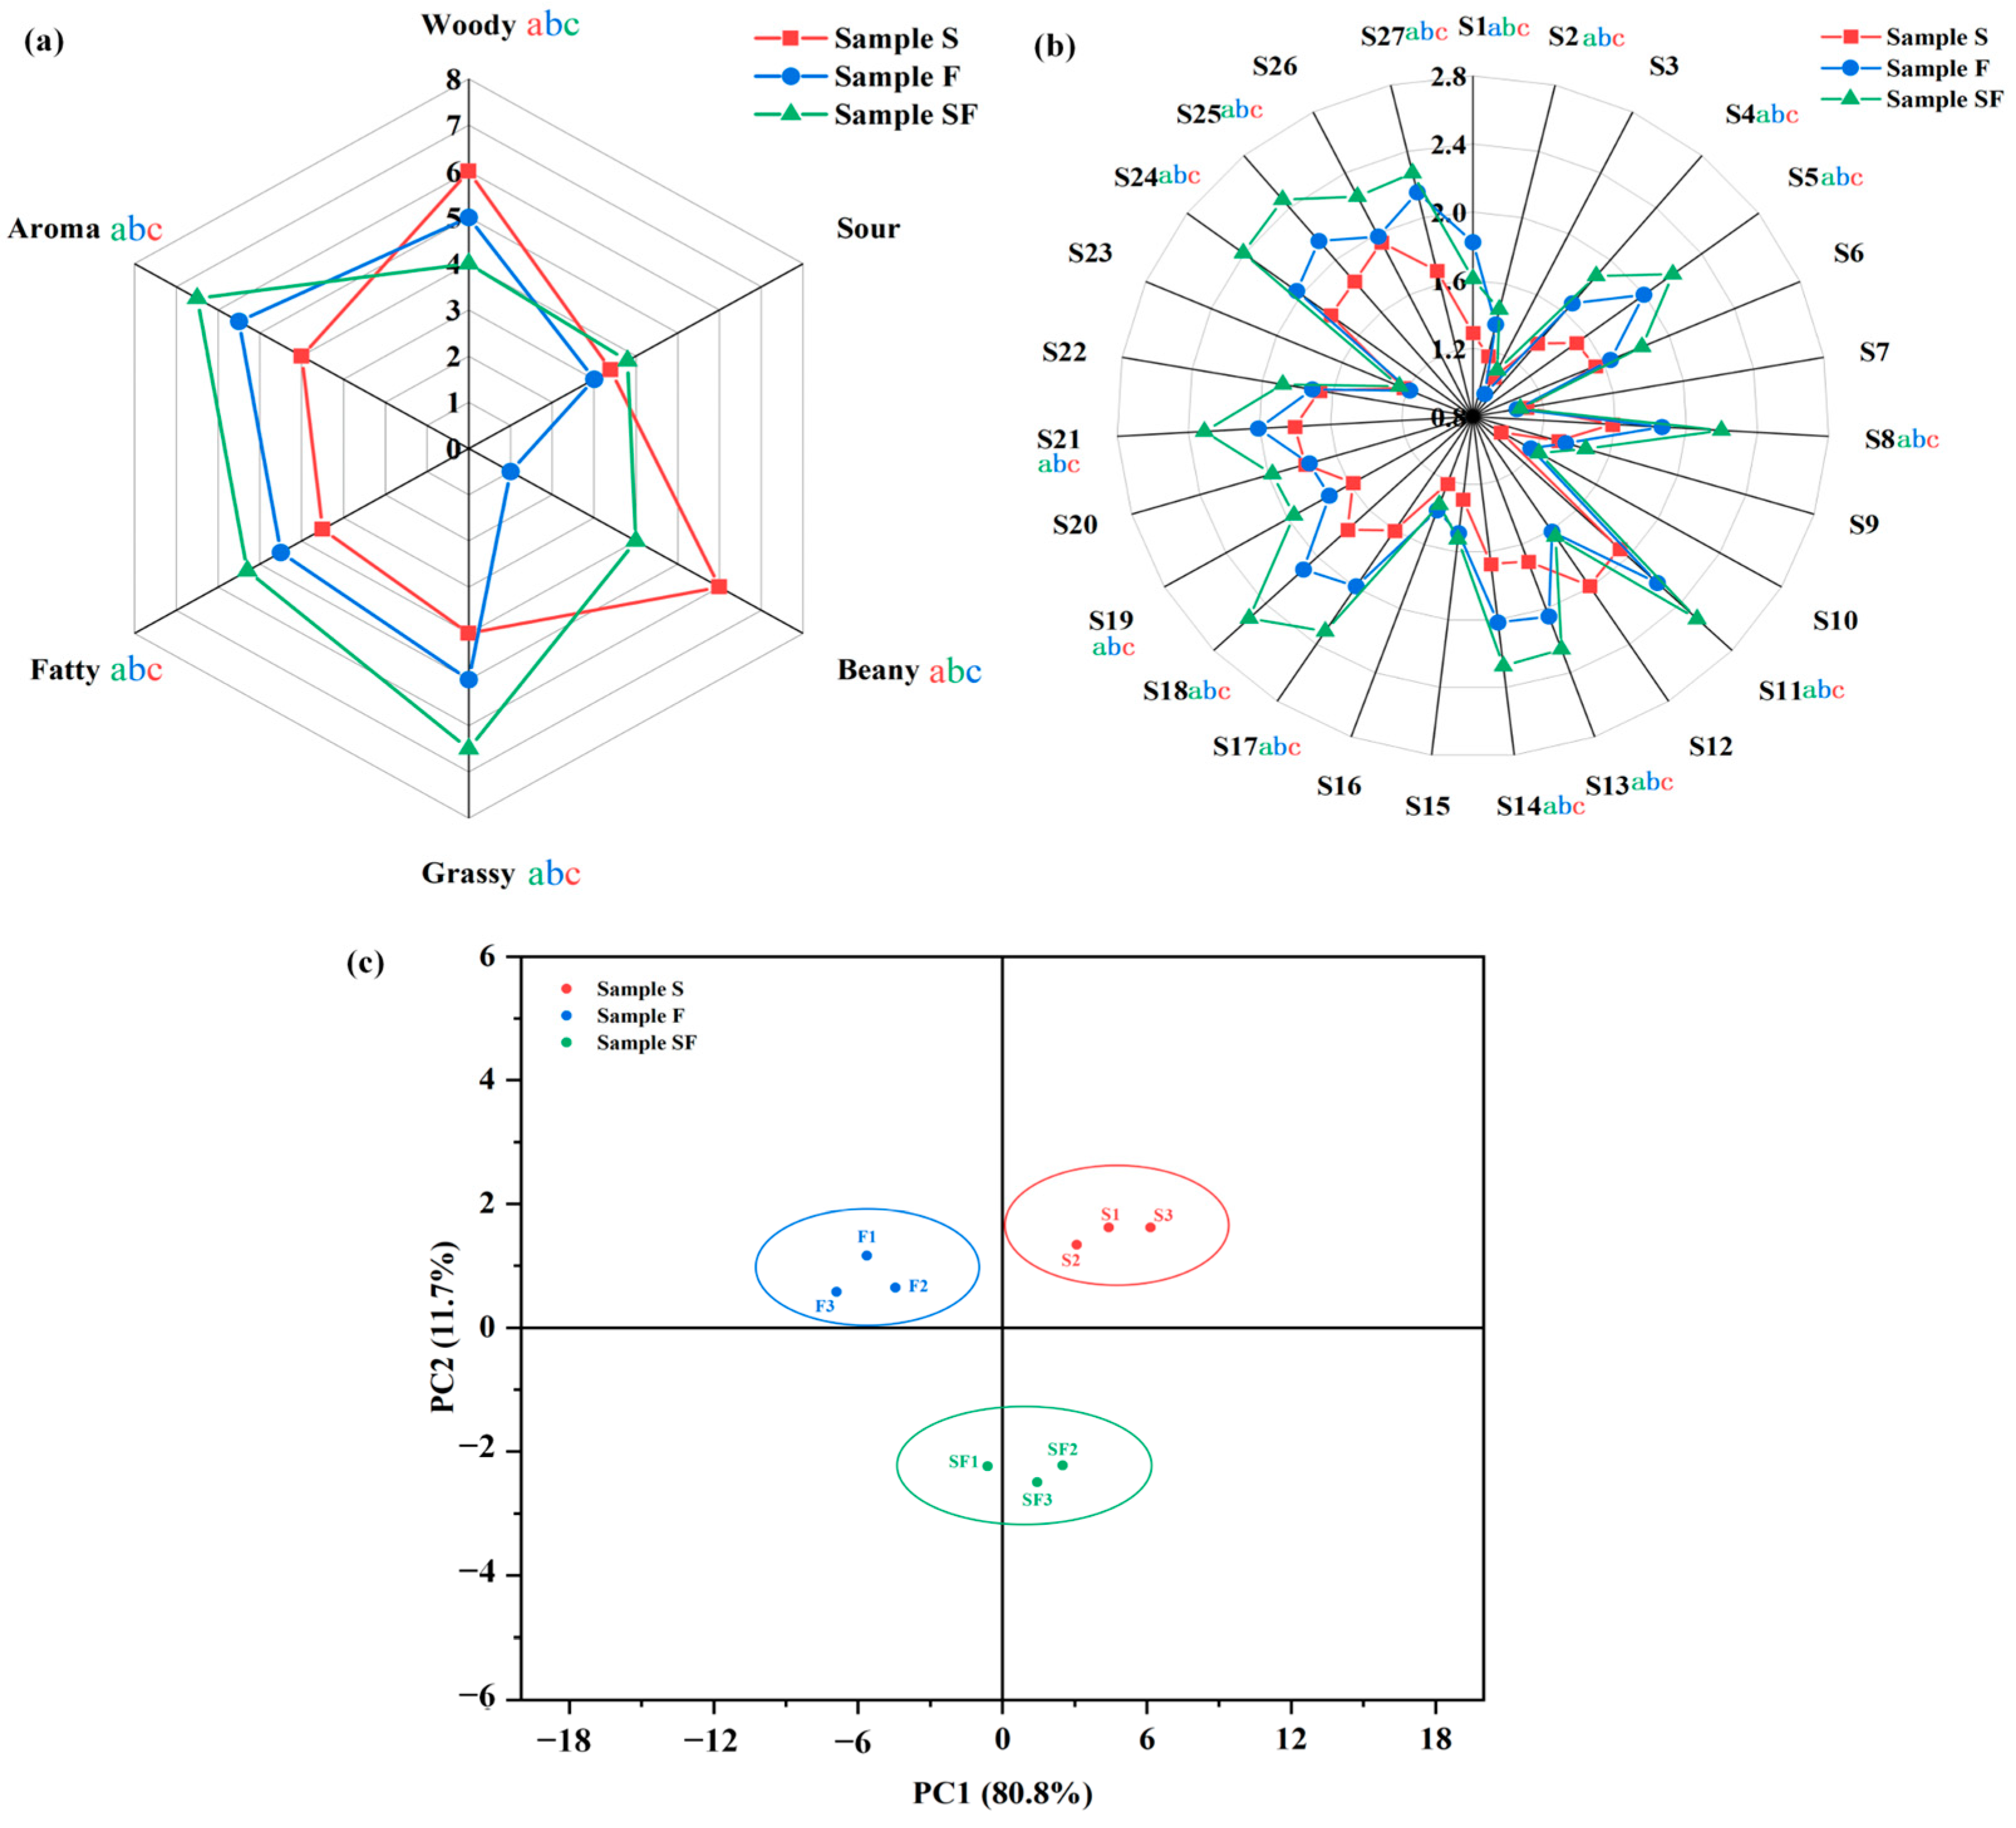
3.1. Sensory Evaluation of Seasoning Samples

To identify the flavor profiles of different seasonings, the flavor profiles of three seasonings were evaluated via sensory scoring (Figure 1a). In general, the sensory properties of fermentation seasonings are affected by raw materials, preparation technology, and other conditions. The results showed that the acidic odor of samples S, F, and SF was not noticeable, which may be due to the high odor threshold of acid; however, this had little effect on the overall sour taste of the seasoning samples [27]. Samples F and SF mainly had aromatic and roasted flavor. Compared with F, the aromatic and roasted flavor of SF were significantly increased (p < 0.05), which may be because SPI samples produce more volatile flavoring substances such as ketones, aromas, and heterocycles during fermentation [7]. The bean odor score was significantly higher in S (p < 0.05) than in F and SF, which may be attributed to the presence of some odorous compounds produced during enzymatic hydrolysis [28]. In addition, sample S showed low scores in almost all sensory attributes, except for beaniness, which may be due to the relatively small number or type of compounds detected in the seasoning sample.

3.2. E-Nose Analysis of Seasoning Samples

To evaluate the flavor profiles of different seasonings, E-nose technology was used to detect the overall flavor profile of the three seasoning samples. Based on E-nose analysis (Figure 1b), the E-nose radar profiles of the three seasoning samples were basically identical, among which S3 (hydrogen), S7 (flammable gas of short-chain alkanes), S10 (sensitive to hydrogen), and S23 (sensitive to alkanes, olefins, and hydrogen) sensors showed small response values to volatile flavoring compounds of the seasoning samples. These volatile flavoring compounds had little effects on the flavor of the seasoning samples [29]. Compared with other sensors, S5, S8, S11, S13, S14, S17, S18, S21, S24, S25, S26, and S27 sensors were more responsive to volatile flavoring compounds in various seasoning samples. In particular, S18 (sensitive to alcohols, aldehydes, ketones, and aromatic compounds), S24 (sensitive to alkanes, carbon monoxide, enaldehydes, alcohols, nitrogen oxides, ketones, and aldehydes), and S25 (sensitive to aromatic hydrocarbons, aliphatic hydrocarbons, alicyclic hydrocarbons, and halogenated hydrocarbons) were the most significant sensors. The three flavoring samples might have higher contents of alcohols, aldehydes, ketones, hydrocarbons, nitrogen oxides, and aromatic compounds. In contrast, the response values of S18, S24, and S25 sensors in F were significantly (p < 0.05) greater than those in S. The response values of S18, S24, and S25 sensors in SF were significantly higher than those in S and F, indicating that SF may contain a higher number of alcohols, aldehydes, ketones, and aromatic compounds. This phenomenon may be attributed to the presence of C. glutamicum and the use of soybeans to separate sugars from protease hydrolysate to produce corresponding volatile flavoring compounds such as alcohols, aldehydes, ketones, and aromatic compounds through glycolysis, pentose phosphate, shikimate, and their overflow pathways [30].
To further analyze the differences in the flavor profiles of different seasoning samples, PCA of E-nose data was performed to obtain response signals (Figure 1c). PC1 and PC2 are two key PCA components, and the proportions of the two most important directions in the original data reflect the degree of data differences in these directions [11]. As shown in Figure 1b, PC1 (11.7%) and PC2 (80.8%) accounted for 92.5% of the data differences, indicating that these two PCs reflect the overall flavor profile of the seasoning sample. Samples S, F, and SF were distributed in different regions without any overlap, showing a significant (p < 0.05) difference between their PCs. Samples S, F, and SF were located close to each other, with a high flavor similarity. Therefore, the combination of E-nose and PCA could effectively distinguish the overall flavor profiles of different seasoning samples.

3.3. Volatile Flavoring Compounds in Seasoning Samples Detected via GC–MS

The quality of the seasoning sample is the main factor that determines its aroma and the volatile flavoring compounds produced during fermentation [31]. Under the combined action of microorganisms and enzymes, fats, proteins, and other substrates present in the SPI enzymatic hydrolysate are broken down to produce free amino acids, peptides, aldehydes, ketones, and other nutrients [16,32,33]. Small-molecule flavoring compounds, such as alcohol, pyrazines, and furan compounds, play a key role in determining the flavor and quality of the final seasoning. To more accurately understand the varieties of volatile flavoring compounds in different seasoning samples, GC–MS was used to detect the category and relative content of volatile flavoring compounds in different seasoning samples (Figure 2a,b, and Table A2). From the three seasoning samples, a total of 91 volatile flavoring compounds, including 13 alcohols, 3 aldehydes, 19 ketones, 6 esters, 8 acids, 4 amines, 10 aromatics, and 28 heterocyclic compounds, were identified. Most compounds were found in fermented seasoning products. Examples of such products include shrimp paste [34], soy sauce [35], and fish sauce [36].
Alcohol compounds are the by-products of lipid oxidation, which may impart a lipid flavor to the seasoning sample [37]. The types and abundances of various alcohols in a seasoning sample vary depending on how the sample was prepared. Among the 3 seasoning samples, 13 alcohol compounds were detected, and SF had the most types of alcohols (10), followed by F (9) and S (8). The compounds 2,6-dimethyl-3-heptanol, 4-ethylcyclohexanol, 5-indenol, (S)-(+)-3-methyl-2-butanol, and 1-[1-methyl-2-(2-propenyloxy) ethoxy]-2-propanol were detected in S, F, and SF samples and imparted a fruity flavor to the seasoning [38]. However, 1-pentanol, 1-amantanol, 1-octanol, 2-ethylhexanol, and citronellol were detected only in F and SF and were closely related to the typical mushroom odor and grassy aroma [31]. SF had a higher relative content of alcohols (20.0789%) than S and F. Straight and branched alcohols may be formed during microbial fermentation or as degradation products of lipid oxidation; however, alcohols with higher odor thresholds may have limited effects on the overall flavor of the seasoning [39].
Aldehydes with low odor thresholds and strong odor characteristics play important roles in determining the flavor profiles of seasonings. In the three seasoning samples, three aldehydes were detected, namely, 3-(4-hydroxyphenyl)-propionaldehyde, 2,4-dimethylbenzaldehyde, and hexanal. The compound 2,4-dimethylbenzaldehyde had the highest content and contributed the most to the flavor of seasonings, mainly imparting almond, cherry, and nut flavor aromas [40]. In addition, hexanal, which imparts fatty and grassy aromas, was potentially formed through various biosynthetic pathways [41]. Therefore, the relative content of C. glutamicum in fermented samples was higher, indicating that the samples fermented by C. glutamicum, particularly those fermented by SPI enzymatic solution (SF), have stronger fatty and grassy aromas.
Meanwhile, in plant-based fermentation products, ketones may be produced via amino acid metabolism or lipid oxidation. Their sensory thresholds are higher than those of aldehydes, and they have a unique fragrance and fruity aroma [42]. Nineteen ketones were detected in the three seasonings. The number of ketone types in SF (16) was significantly higher than the numbers of ketone types in S (7) and F (7), and the relative content of ketones in SF (3.2954%) was significantly higher than the relative contents in F (2.4120%) and S (2.3856%) (p < 0.05). The significant increase in the number of ketone types and relative content of ketones in SF may be closely related to the use of SPI enzymatic hydrolysate by C. glutamicum for lipid decomposition or amino acid metabolism [11,43]. Among these ketones, acetone, 2-heptanone, and 2-nononone have minty and fruity aromas; 3-octene-2-one, 2-decanone, and acetoin have fatty and dairy aromas and are detected only in SPI seasoning samples, which may be the key compounds affecting the flavor and quality of the seasonings [44].
Moreover, acids formed through the oxidative degradation of fatty acids usually have a pungent, unpleasant odor [40]. Eight types of acids were detected in the three seasoning samples, and the relative proportion of acid substances was 7.1080–8.1422%. Significant differences were noted among the seasoning samples (p < 0.05), mainly manifested as the contents of octanoic acid, decanoic acid, and hexanoic acid, which were detected in all seasoning samples [11,27]. Therefore, acids have little effect on the flavor of the seasoning samples.
Moreover, acids formed mainly from the oxidative degradation of fatty acids usually have a pungent unpleasant odor [45]. Eight kinds of acids were detected in the three seasoning samples, and the relative proportion of acid substances was 7.1080–8.1422%. Significant differences were found among the seasoning samples (p < 0.05), mainly manifested as octanoic acid, decanoic acid, and hexanoic acid, which were detected in all seasoning samples, Therefore, acids have little effect on the flavor of the seasoning samples.
Compared with S and F, the relative ester content in SF was higher (7.5797%), with the relative content of methyl 2-hydroxy-4-methylvalerate being the highest (3.4326%), followed by phenethyl acetate (3.3734%). The high content of esters may be due to the catalytic effects of esterase secreted by microorganisms on acids and alcohols during fermentation [46]. Many esters have fruity and floral flavors that could neutralize bitter and unpleasant odors caused by fatty acids and amines [47]. Meanwhile, esters may be produced via the cracking of hydrocarbons, lipids, and other compounds at high temperatures or from the aromatic substances present in spices, which were the second most prominent compounds in the seasoning samples after heterocyclic compounds. A total of 10 aromatic substances were detected. The variation trend was similar to that of other compounds, and the types and relative contents of aromatic substances in different seasonings were significantly different (p < 0.05). In particular, SF prepared using SPI enzymatic hydrolysate as the base material of C. glutamicum had higher ketone contents than S and F. The relative content of ketones was also high, which was 6.2846% in SF, 6.2267% in F, and 5.5899% in S, which may have caused the differences in the flavor of seasonings, consistent with the significant difference in the response values of E-nose S18 and S25 sensors (Figure 1a).
Heterocyclic compounds are mainly produced via the Maillard reaction and fatty oxidation, and their odor threshold was low [37]; thus, they have greater effects on the overall flavor of seasonings. In total, 28 heterocyclic compounds were detected in the three seasonings, of which 18, 22, and 23 were detected in S, F, and SF, respectively. The relative content of heterocyclic compounds in SF (42.3100%) was higher than the relative contents in S (41.9973%) and F (41.1449%). Kleekayai et al. [48] reported that the main aroma substances in traditional Thai fermentation seasonings were nitrogen-containing compounds, particularly pyrazines. Pyrazine is an important class of nitrogenous flavoring compounds that mainly imparts meaty and roasted aromas. Pyrazine accounted for 40.2509% and 53.0544% of the 22 (F) and 23 (SF) heterocyclic classes detected in fermentation samples, respectively. Tetramethylpyrazine was the main pyrazine that imparted a unique flavor, accounting for 12.5390% and 12.1259% of the relative content in F and SF, respectively, followed by 2,6-dimethylpyrazine. The relative contents were 1.2300% and 1.4220% in F and SF, respectively. In addition, various heterocyclic flavoring compounds such as furan, pyridine, pyrrole, and thiazole were detected in the seasoning samples, which have a unique flavor, such as 2,3-dihydrobenzofuran, 2-n-heptylfuran, 2-acetyl pyrrole, and 3-tert-butyl-1H-1,2,4-triazole that could impart flavoring fragrance, fragrance, lactone aroma, pork aroma, and nut aroma [49]. These results indicate that nonenzymatic browning and microbial mechanisms during fermentation could produce various heterocyclic flavoring compounds in seasonings, which was conducive to enriching the aroma richness in the final product [31].
Therefore, these results indicate that microbial fermentation can induce aroma changes in seasonings. When SPI enzymatic hydrolysate was used as the base medium to prepare new seasonings, the variety and content of volatile flavoring substances in products increased significantly, resulting in the formation of various fermentation aromas, such as cheese and meaty aromas, in SF, consistent with the results of the previous sensory analysis.

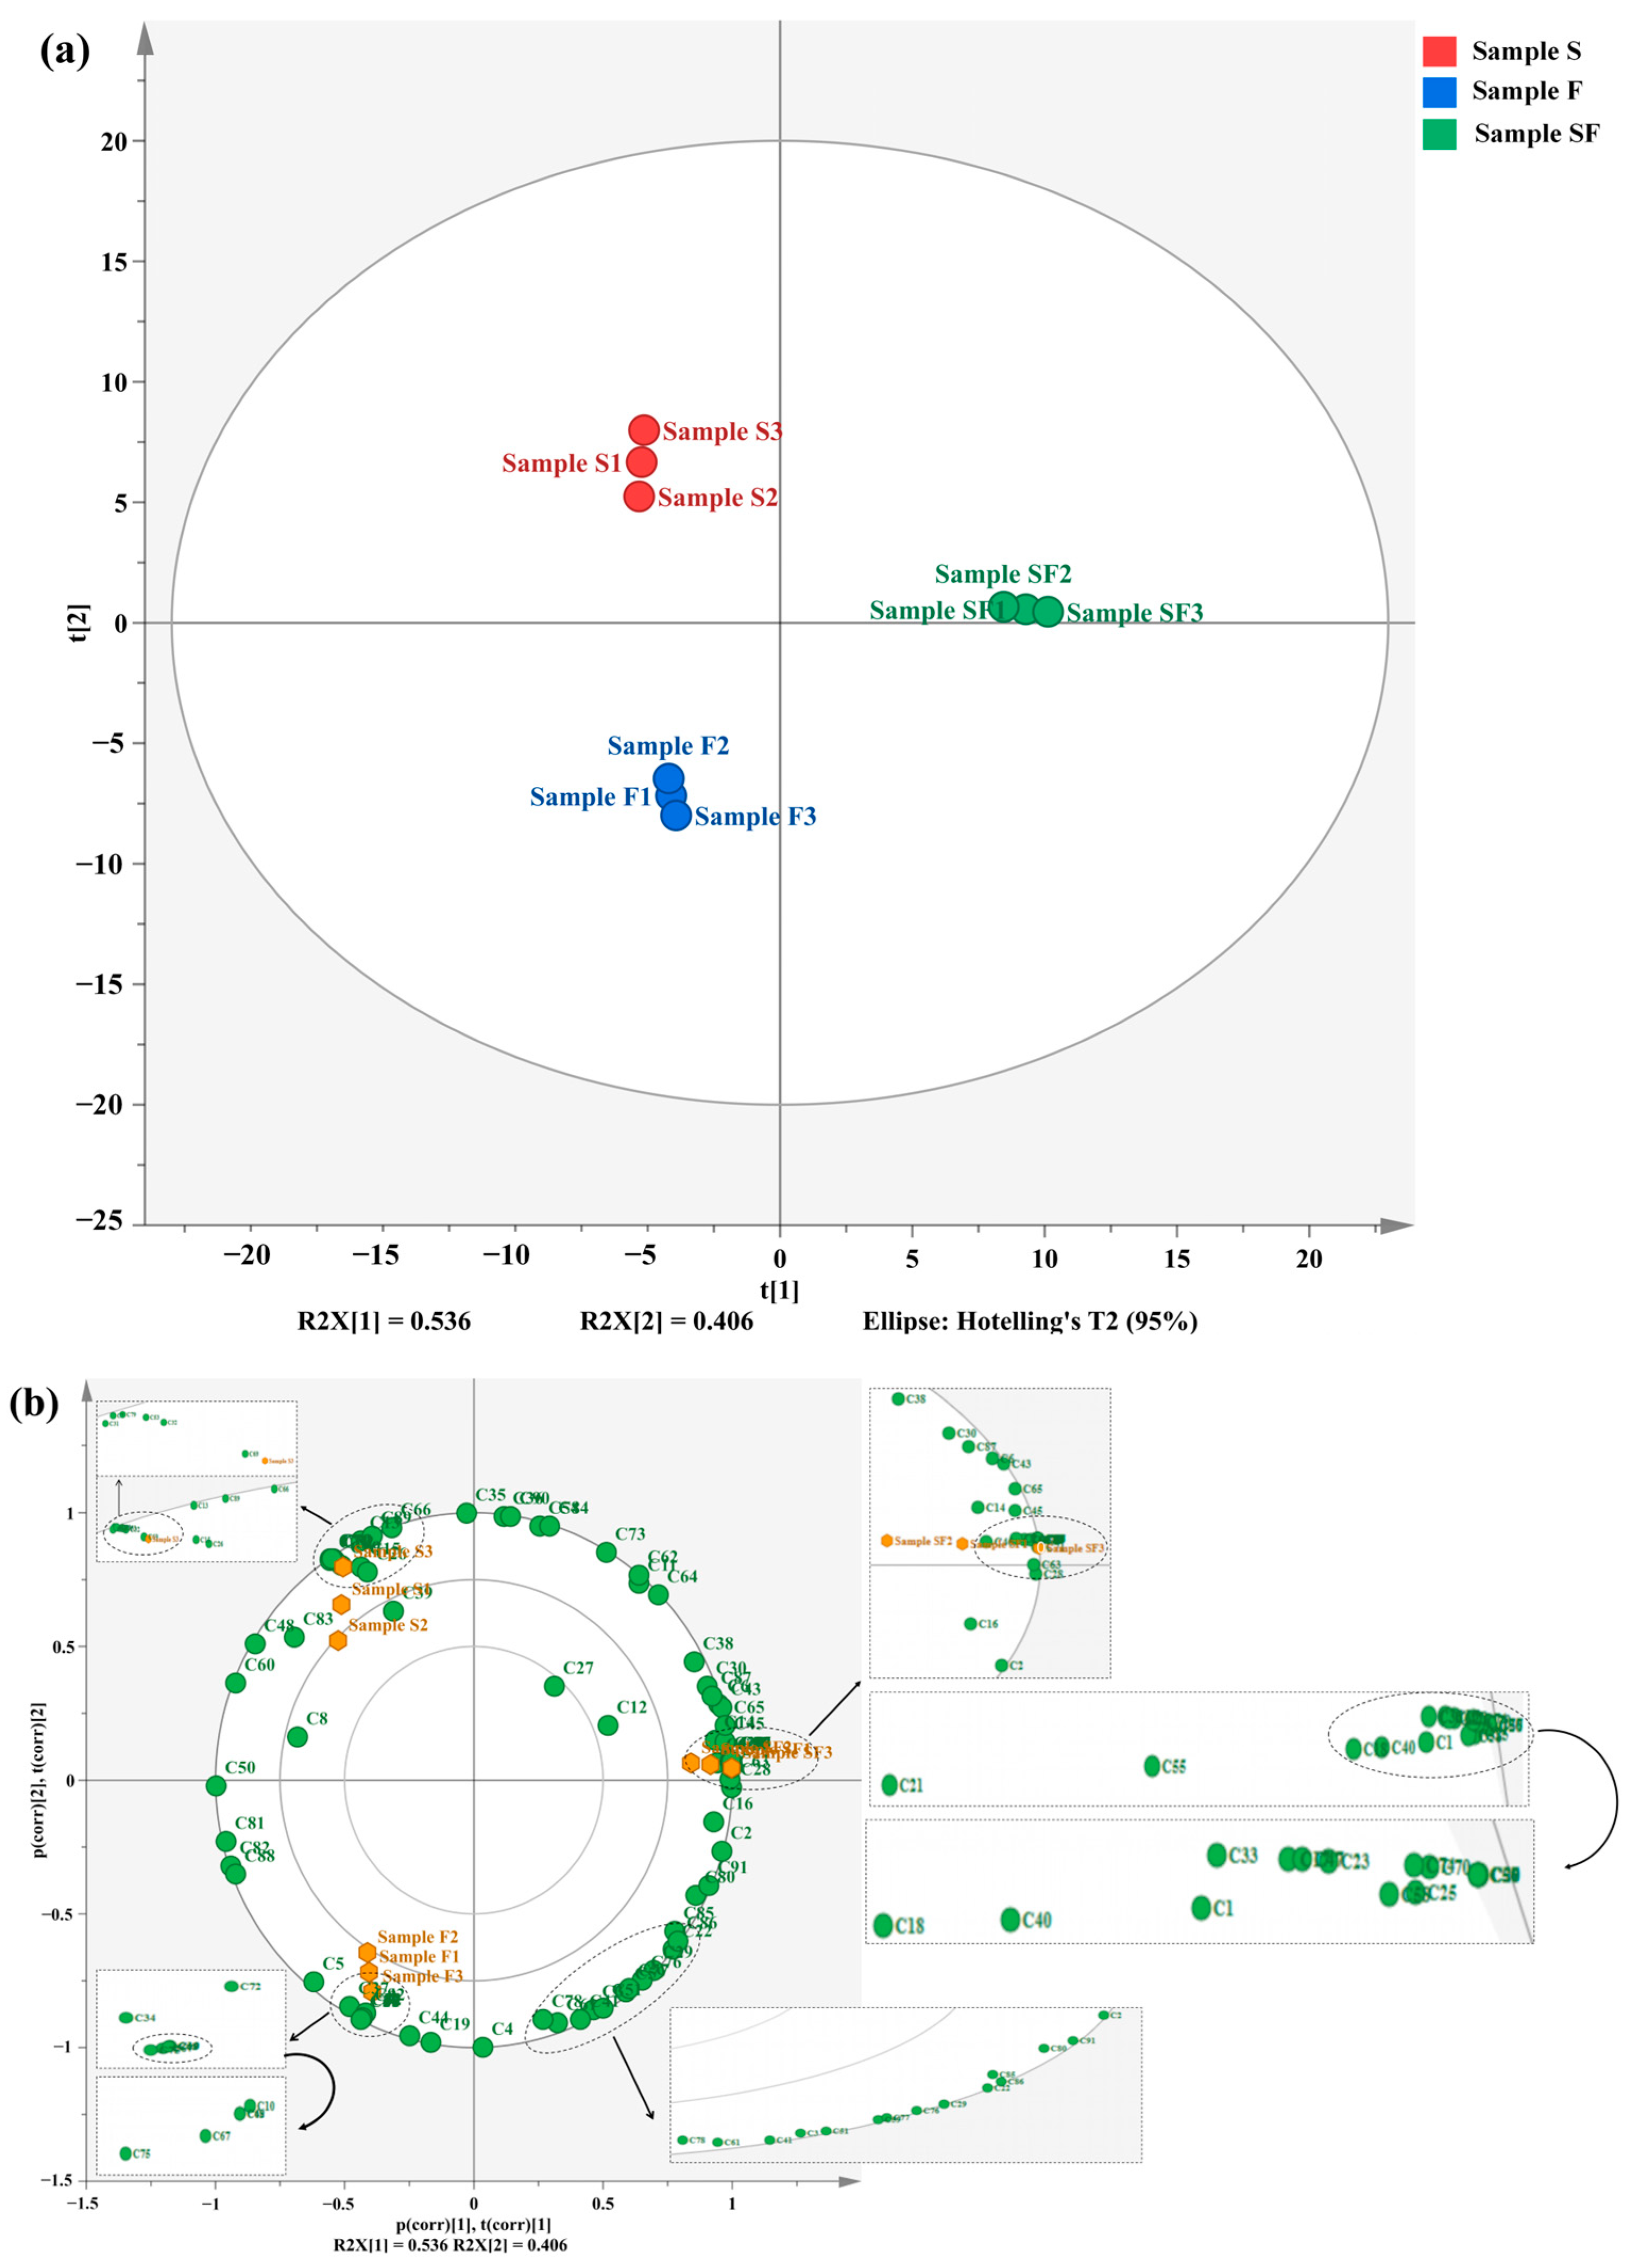
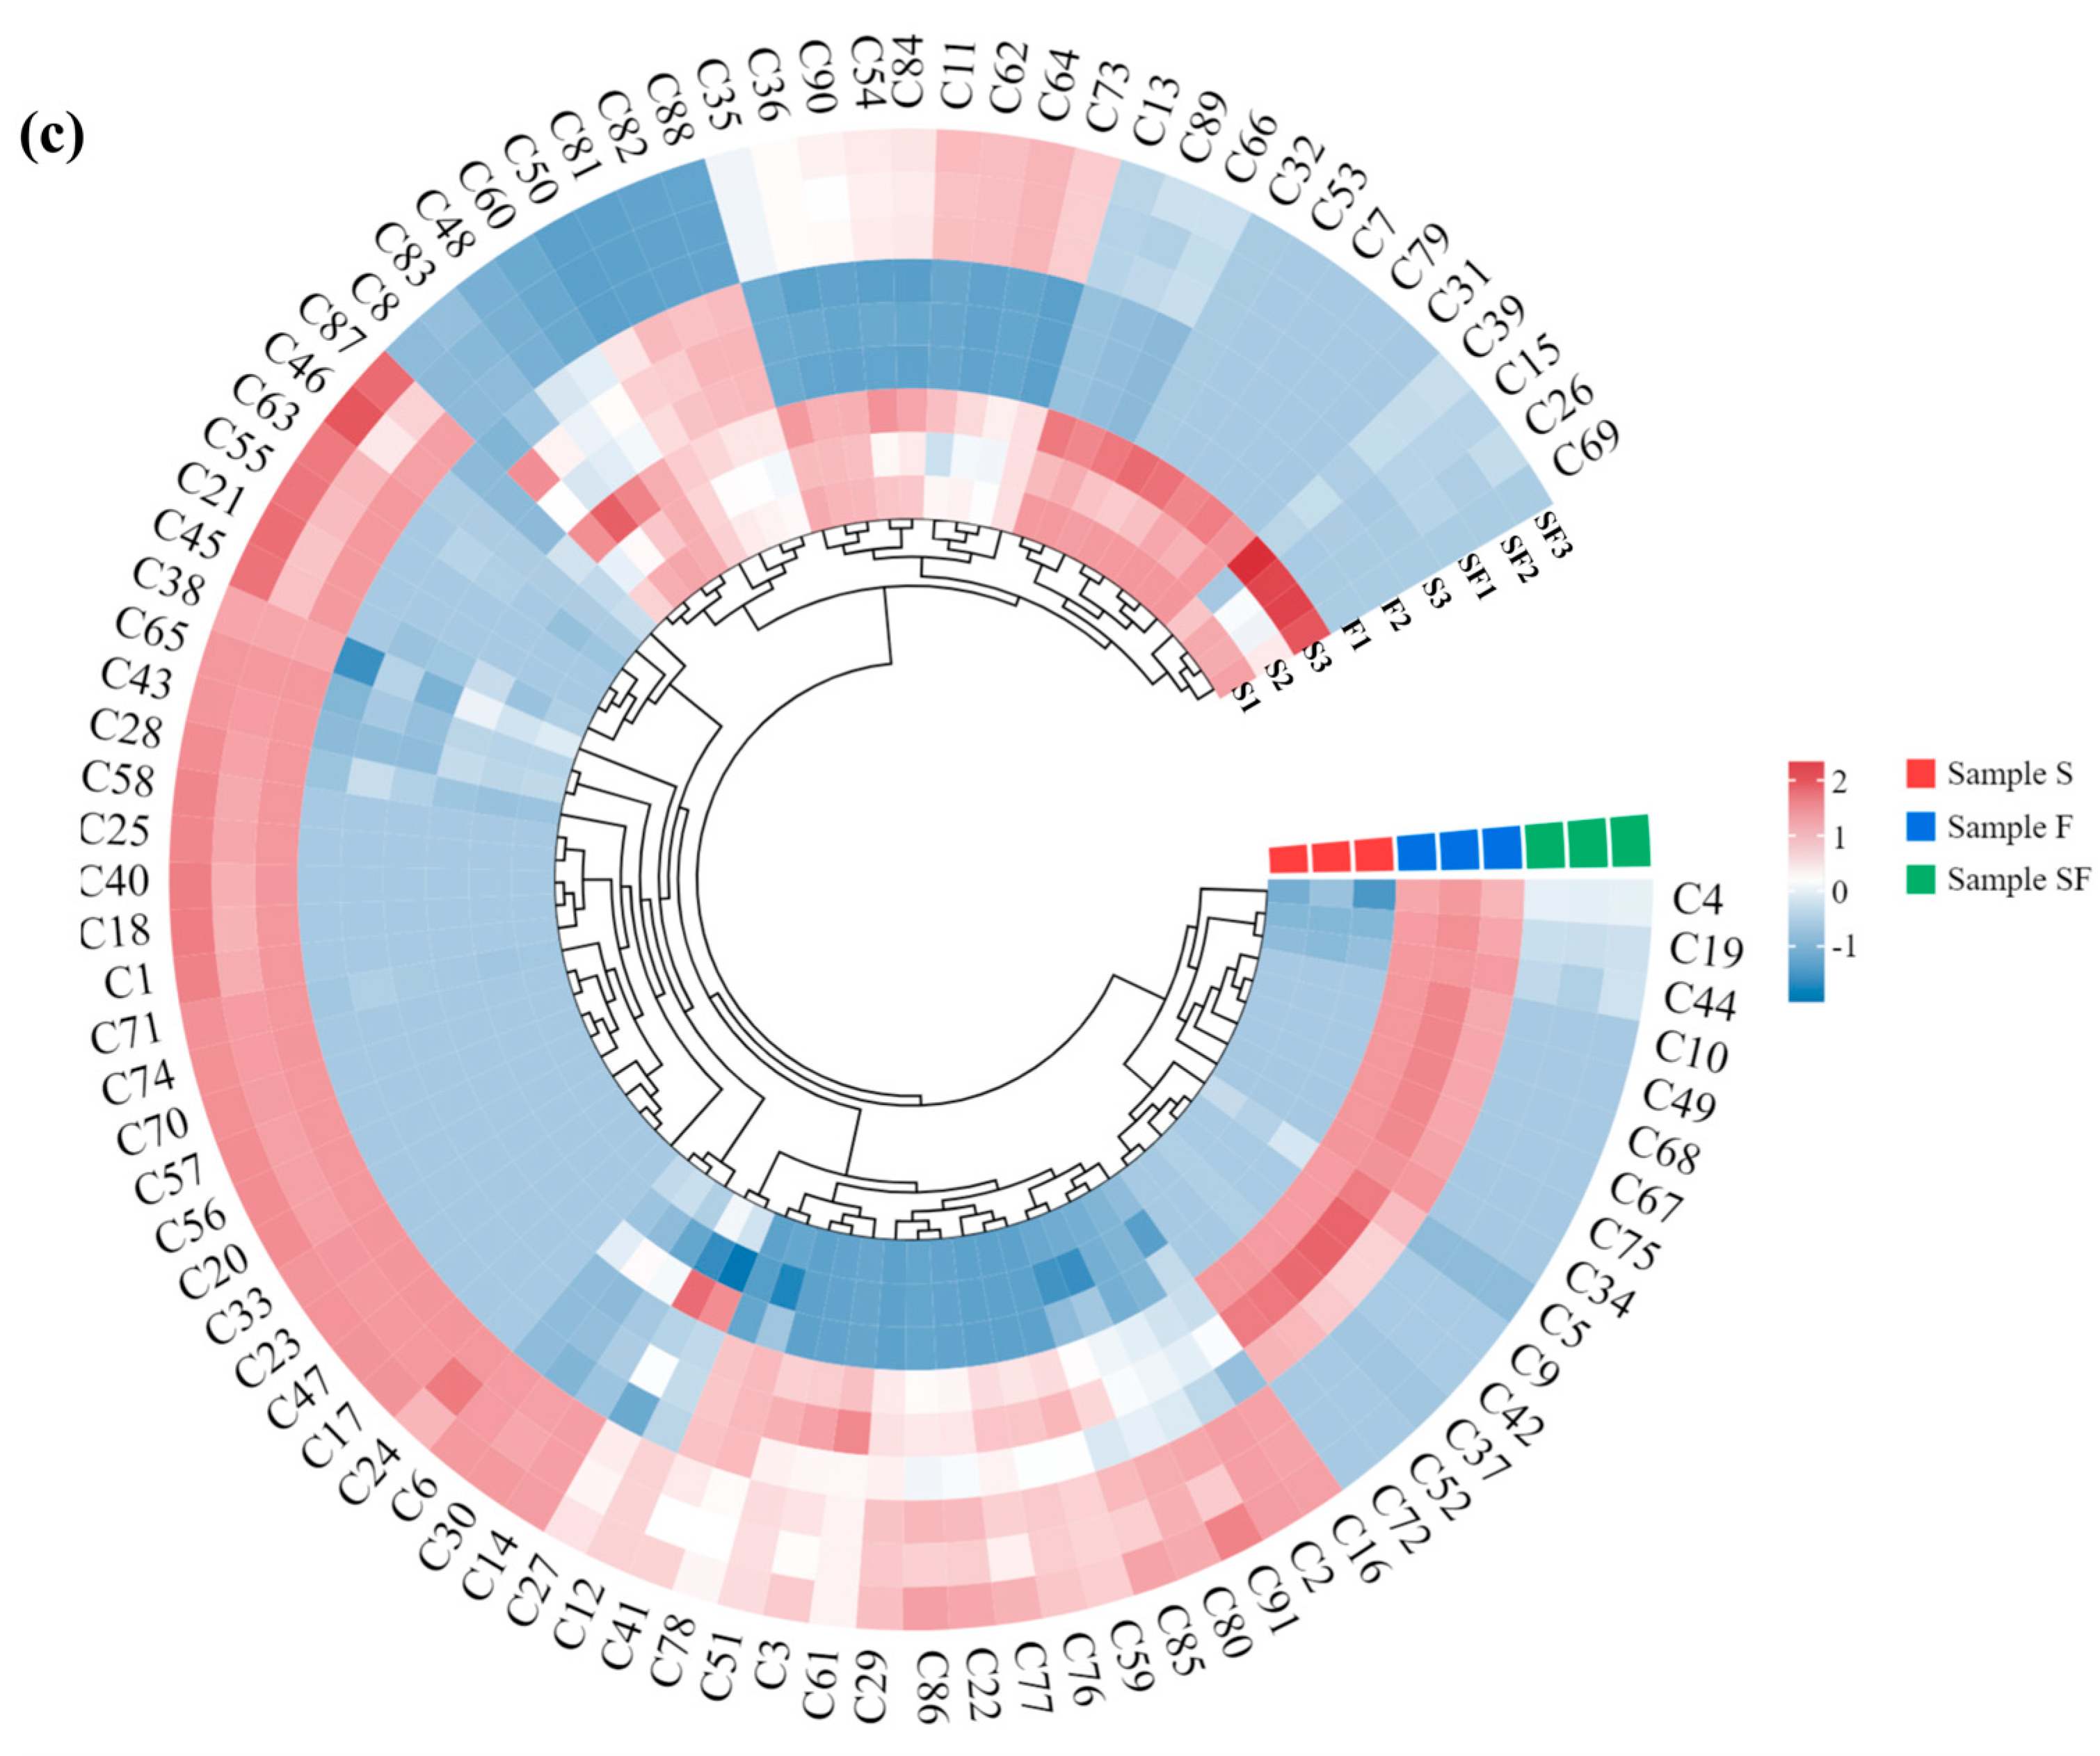
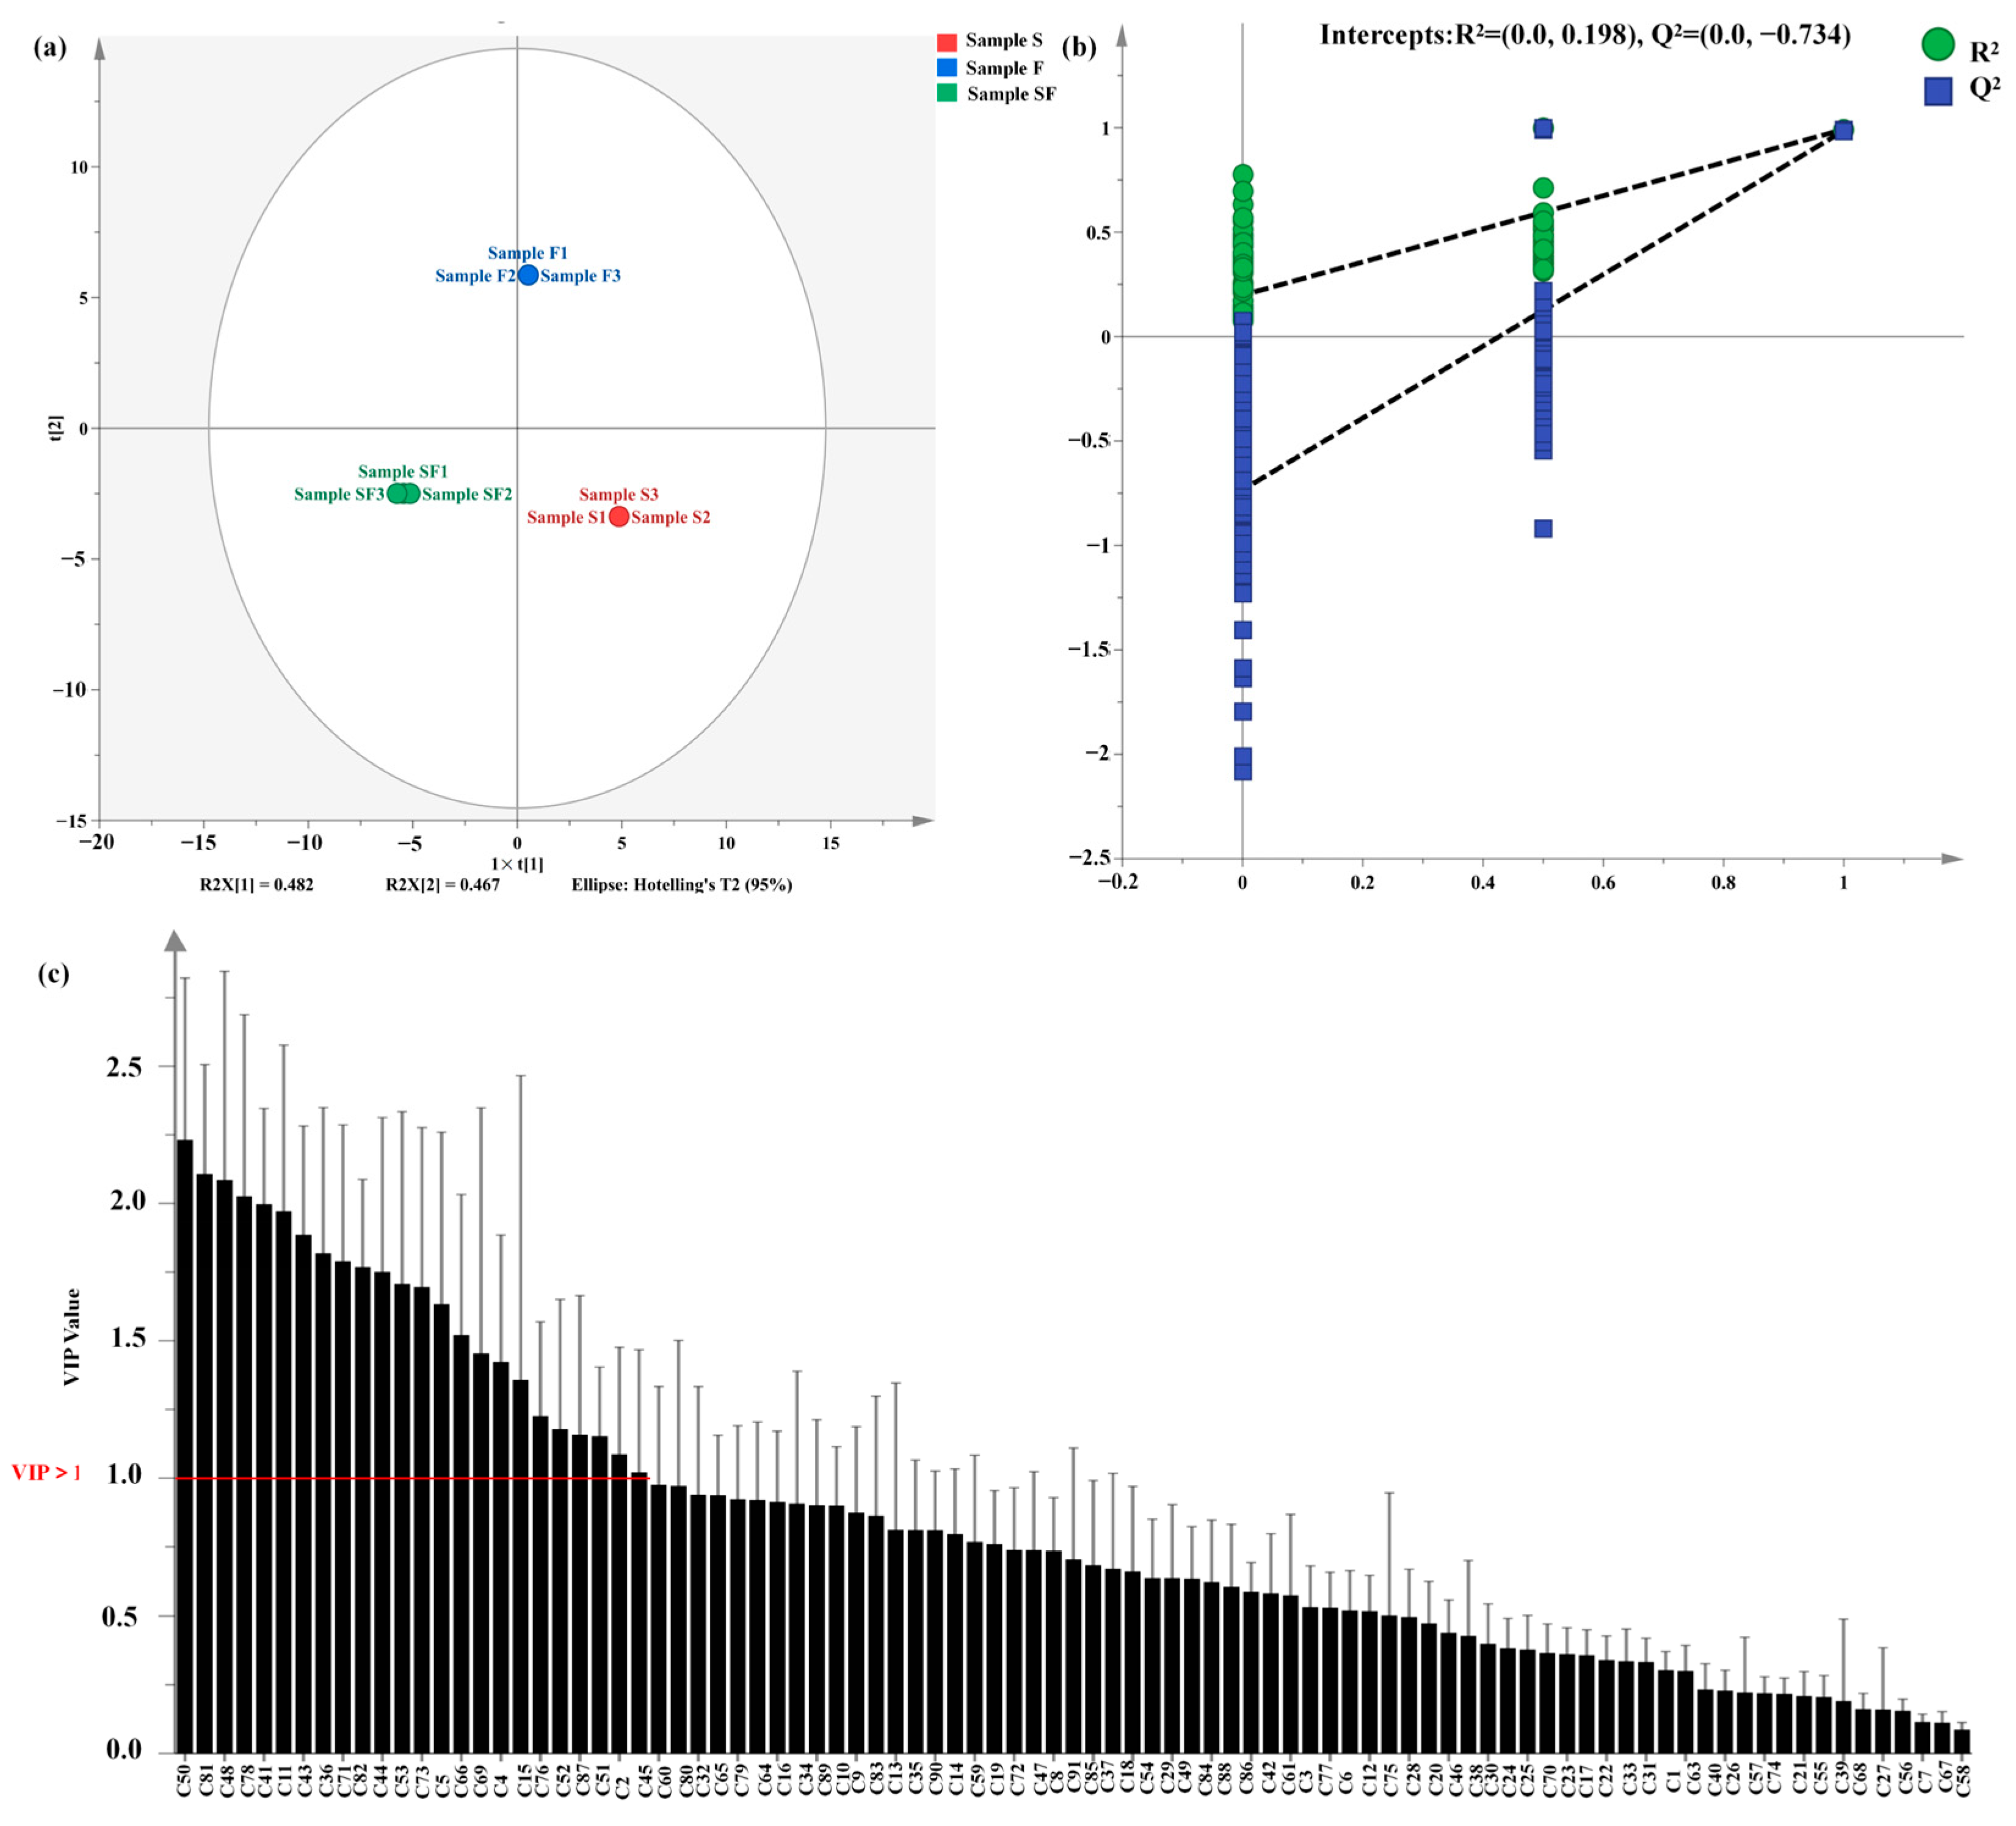
3.4. Correlation Analysis of Volatile Flavoring Compounds in Seasoning Samples

To visualize the relationship between different volatile flavoring substances in seasoning samples, PCA and heatmap clustering were used for analysis. The PCA (PCA-X) diagram (Figure 3a) highlights the differential characteristics of volatile flavoring substances in different seasoning samples. R2X [1] and R2X [2] explained 53.6% and 40.6% of the variances in the PCA-X plots, respectively, with a cumulative explanatory variance of 94.2%, and the confidence of the PCA reached 95.0%. Dispersion was apparent among the three seasoning samples, indicating significant differences. As shown in the biplot (Figure 3b), most of the volatile flavoring compounds had greater effects on SF, whereas a few volatile flavoring compounds influenced S and F. The relative contents of volatile flavoring compounds were color-coded in the heatmap (the higher the content of related species in the corresponding seasoning sample, the darker the red color, whereas the lower the content, the darker the blue color), and the types of flavoring compounds were horizontally clustered (Figure 3c). SF contained a higher number of volatile flavoring compounds, particularly alcohols (1-pentanol, 1-adamantanol, and benzyl alcohol), aldehydes (3-(4-hydroy-phenyl)-propionaldehyde and hexanal), ketones (acetone, 2-heptanone, 2-nonone, 3-octen-2-one, 2-cyclohexen-1-one, 3,5-dimethyl-, 3,5-diethyl-2,6-dimethylcyclohex-2-en-1-one, bicycl [3.3.1]nonane-2,6-dione, 2,3-pentanedione, 2, 3-pentadecanone, 2, 3-pentadecanone, 2-hexanedione, 2-pentadecanone, and acetoin), esters (gamma-octanoic lactone and 4-hexanolide), aromatics (olivetol, 4-hydroxy-3-methoxystyrene, benzimidazole, naphthalene, and benzothiazole), and heterocyclics (2,5-dimethyl pyrazine, 2-butyl-3-methylpyrazine, n-amylpyrazine, 2-propylpyrazine, tetramethylpyrazine, 1-(2-furyl)pentan-1-one, pyridine, 2-acetyl pyrrole, 3-tert-butyl-1H-1,2,4-triazole, dodecamethylcyclohexasiloxane and pyrazine, and 2,3,5-trimethyl-6-propyl-). Among them, naphthalene, benzothiazole, 2, 5-dimethylpyrazine, 2-valerylfuran, and tetramethylpyrazine contributed significantly to the flavor of seasoning samples. They may exert synergistic enhancement effects along with low contents of other aroma substances [50]. During the fermentation of SPI enzymatic hydrolysate, the relative contents of the abovementioned compounds increase significantly, which greatly improves the flavor of fermentation samples.
To further understand the differences in volatile flavoring compounds among different seasoning samples, an OPLS-DA regression model combined with variable importance in projection (VIP) was used to screen the differential compounds in different seasoning samples (Figure 4). The addition of speciation variables to compensate for the limitations of PCA could better reflect the interspecific differences between seasoning samples than PCA. In this model, R2X and R2Y represent the explanatory rates of the constructed model to the X and Y matrices, respectively. Q2 represents the predictive ability of the model, and the closer the R2 and Q2 values are to 1, the higher the degree of fit [51]. As shown in Figure 4a, the variance explanation rate of the OPLS-DA model was 94.9% (48.2% and 46.7%; Figure 4a), and the difference between the varieties of compounds was apparent (distributed in different quadrants), indicating that the model was more effective in explaining the differences in volatile flavoring compounds in the three seasoning samples. The accuracy of the OPLS-DA model was demonstrated by 200 countervalidated alignment tests (Figure 4b), where the R2X, R2Y, and Q2 values were 0.953, 1, and 0.991, respectively, indicating that the model had better predictive power and could better explain and predict differences between seasoning samples.
According to the results of OPLS-DA model analysis, VIP is a commonly used parameter to evaluate the contribution degree of variables. Variables with VIP > 1.0 could reflect some differences in statistical models [52]. Therefore, in the current study, we selected 24 volatile flavoring compounds with significant differences in the model and VIP > 1.0 as the index (Figure 4c), including 2-(aziridin-1-yl)ethanamine, 2,3-dihydro-2-methyl-,3,4-dimethoxycinnamic acid, tetramethylpyrazine, methyl 2-hydroxy-4-methylvalerate, (S)-(+)-3-methyl-2-butanol-, octanoic acid, phenethyl acetate, n-pentylpyrzine, 2,3-dihydrobenzofuran, hexanoic acid, 2-methyl-4-methoxyaniline, 2-acetyl-3,5-dimethylpyrazine, 4-ethylcyclohexanol, 2-ethyl-6-methyl-, pyrazine, ethyltrimethyl-(8CI,9CI), 3-heptanol, 2,6-dimethyl-, 2,4-dimethylbenzaldehyde, 2,6-dimethylpyrazin, aniline, 3-tert-butyl-1H-1,2,4-triazole, acetamide, 1-amantadanol, and capric acid. Among them, 2-acetyl-3-5dimethylpyrazine, pyrazine, ethyltrimethyl-(8CI,9CI), and 2,6-dimethylpyrazine are the main flavoring compounds produced by C. glutamicum using a soybean-isolated protease solution as the base material, primarily imparting nutty and chocolate aromas [12].

3.5. Analysis of the Relative Odor Activity Values

No direct relationship was noted between the relative content of volatile flavoring compounds and the overall flavor profile. The contribution of volatile flavoring compounds to the overall flavor is determined based on the relative content and sensory threshold [53]. Therefore, ROAV analysis of flavoring compounds was performed. In this method, species with ROAV ≥ 1 are classified as key flavoring compounds, and those with 0.1 ≤ ROAV < 1 have an important modification effect on the overall flavor. That is, the higher the ROAV, the greater the contribution of the compound to the overall flavor. Only flavoring compounds with ROAV ≥ 0.1 were selected in this study [54].
As shown in Table 1, 32 key flavoring compounds (12, 19, and 22 compounds from S, F, and SF, respectively) and 7 modified flavoring compounds were identified from the three seasonings, mainly including heterocyclic substances, alcohols, ketones, esters, and aromatic substances. Eight of the key flavoring compounds were present in three different seasonings, including gamma-octanoic lactone, octanoic acid, decanoic acid, benzothiazole, 2,5-dimethylpyrazine, n-amylpyrazine, tetramethylpyrazine, and pyridine. These flavoring compounds were relatively abundant in each seasoning sample. In addition to the high flavor thresholds of caprylic acid (3.00 mg/kg) and n-capric acid (10.00 mg/kg), the other key compounds greatly contribute to the flavor of the seasoning because of their low flavor thresholds. For example, tetramethylpyrazine was a major contributor to the flavor profile of the seasoning, with the highest ROAV (100) and a low odor threshold (2.53 mg/kg) to impart flavoring with nutty, peanut, and coffee aromas [42]. Gamma-octanoic lactone can impart a sweet herb taste to the seasoning and is a key ester in reducing the spicy taste of fatty acids and the bitterness of amino acids (ROAV 22.47–51.01) [55]. Benzothiazole is a key aromatic compound with an extremely low flavor threshold (0.08 mg/kg), imparting a nutty flavor to the seasoning. Furthermore, 2,5-dimethylpyrazine and n-amylpyrazine are pyrazine compounds, which are the products of the Maillard reaction after fatty oxidation and mainly impart a meaty and roasted aroma [56]. These results indicate that the key flavoring compounds of S, F, and SF have high similarity; thus, the flavors of the three seasonings are similar. This may explain why the three seasonings in Figure 1a are located relatively close to each other.
In addition, six key flavoring compounds, including citronellol, 3,5-octadien-2-one, 2-ethyl-3, 3-ethyl-2,5-dimethylpyrazine, 2-ethyl-5-methylpyrazine, 2,3-dimethyl-5-ethylpyrazine, and pyrazine, 2,5-dimethyl-3-propyl-(8CI,9CI) were detected in S. Compared with S and F, the types and contents of key flavoring compounds in SF were significantly different, showing that 1-octanol, acetone, 2-heptanone, 2-nonone, 3-octen-2-one, 4-hydroxy-3-methoxystyrene, naphthalene, 2-butyl-3-methylpyrazine, and 2-propylpyrazine were only detected in SF. Therefore, the difference in the number and content of SF key flavoring compounds in the samples is an important factor affecting the difference in flavor profiles. In addition, the ROAV values of benzyl alcohol, 2-ethylhexanol, 2-phenylethyl propionate, gamma-octanoic lactone, 2-methylpyrazine, and 2-acetyl pyrrole were all <1, which had flower, fruity sweetness, baking, and chocolate aromas and played an important role in the overall flavor of the seasoning. The differences in the content and types of these important and modified flavoring compounds contribute to the unique flavors of different seasonings.

3.6. Correlation Analysis between E-Nose Data and Important Volatile Flavoring Compounds

PCA-X was used to analyze the correlation between flavor profiles and characteristic flavoring compounds. Based on the 24 volatile flavoring compounds with VIP > 1.0 (Figure 4c), combined with ROAV values (Table 1), 8 (Figure 5a) important flavoring compounds (ROAV ≥ 0.1) and 27 E-nose responses (Table A1) were selected to construct the loading plot of the PCA-X model, also known as the correlation plot. The coordinates of each variable in Figure 5b correspond to the correlation and directivity of PC1 and PC2, respectively. Variances of 59.5% (PC1) and 15.8% (PC2) were noted, and the cumulative contribution rate was 75.3%, indicating that PC can better reflect the overall information of the sample and can be effectively used in the correlation analysis between flavor profiles and characteristic flavoring compounds. The shorter the distance between the response of the compound and E-nose data, the higher the correlation between the compound and sensor response. Among them, S2, S6, S9, S11, S15, S19, S22, S24, S25, and S26 were distributed in the square direction of PC1 and PC2 and were close to 1-amantadanol, octanoic acid, hexanoic acid, and n-amylpyrazine, indicating that these response signals are positively correlated with the contents of these important compounds. S1, S5, S8, S10, S13, S14, S17, S18, S21, and S27 were distributed in the positive direction of PC1 and the negative direction of PC2 and clustered together with 2,6-dimethylpyrazine and tetramethylpyrazine, indicating that these sensors were positively and strongly correlated with 2,6-dimethylpyrazine and tetramethylpyrazine. The results revealed that PCA-X could analyze the positive and negative correlations between the E-nose response signal and volatile flavoring compounds. Therefore, E-nose can rapidly identify the unique flavor of different flavoring samples through the specific response to volatile flavoring compounds.

4. Conclusions

High-quality flavor is a critical factor in attracting consumers to products, thus making research and innovation in flavor development a focal point within the food industry. In this study, a new method to improve the flavor of traditional seasoning was proposed, wherein SPI enzymatic hydrolysate was used as the fermentation base of C.glutamicum. Based on sensory evaluation, E-nose, and GC–MS methods, the overall flavor and volatile flavoring compounds of different seasoning samples were analyzed. Compared with S and F, SF had a richer aroma and roasted flavor. Its response signals to E-nose sensors S18 (aromatic compounds), S24 (alcohols, aldehydes), and S25 (esters, ketones) were more significant (p < 0.05). A total of 91 volatile flavoring compounds, including 13 alcohols, 3 aldehydes, 19 ketones, 6 esters, 8 acids, 4 amines, 10 aromatics, and 28 heterocyclic compounds, were detected via GC–MS. Compared with S and F, SF contained a higher number of alcohols, ketones, aromas, and heterocyclic compounds, which have a stronger cheesy, fatty, and roasted odor. Furthermore, ROAV analysis identified 32 key flavoring compounds (ROAV ≥ 1) and 7 modified flavoring compounds (0.1 ≤ ROAV < 1). Compared with S and F, nine additional key flavoring compounds were detected in SF. Among them, pyrazines such as n-pentylpyrzine, 2,6-dimethylpyrazine, and tetramethylpyrazine were the key flavoring compounds in SF seasoning (ROAV ≥ 1), which could impart unique meaty and roasted aromas to SPI seasoning. In addition, PCA showed a high correlation between the E-nose response signals and key volatile flavoring compounds. These results showed that the fermentation of C. glutamicum can effectively increase the content and types of flavoring compounds and promote the accumulation of flavoring compounds with fragrance. Furthermore, a previous study showed that the enhancement of umami substances is closely related to C. glutamicum fermentation [11]. However, the impact of SPI enzymatic hydrolysate is not only related to umami and flavor but also includes nutritional and functional properties; therefore, further research on the potential nutritional and functional properties of SPI enzymolysis using C. glutamicum is the focus of future research. In addition, it is extremely important to determine the influence of microbial metabolism on the types and contents of flavor and umami substances produced in the fermentation enzymatic hydrolysate. Therefore, it is particularly important to understand the mechanism of microbial metabolism to produce flavor and umami substances.

Author Contributions

Methodology, Validation, Investigation, Formal analysis, Writing—Original Draft, L.S.; Methodology, Investigation, Formal analysis, Z.L. and L.X.; Writing—Review and Editing, Q.Y.; Investigation, X.Z. and L.Y.; Resources, Writing—Review and Editing, P.L. and X.C.; Conceptualization, Resources, Supervision, Project administration, Funding acquisition, Writing—Review and Editing, J.D. All authors have read and agreed to the published version of the manuscript.

Funding

This research was funded by the National Natural Science Foundations of China [Grant Nos. 31871789 and 41876114], the key project of Hubei Provincial Department of Education [No. T2022011], the Natural Science Foundation of Hubei Province [No. 2024AFB803], the Natural Science Foundation of Zhejiang Province [No. LY23D060005], and the Science Foundation of Donghai Laboratory [No. DH-2022KF0218].

Institutional Review Board Statement

The sensory analysis laboratory in the faculty was dedicated to the researchers for training and research. The descriptive sensory analysis conducted by Xiong Xiao et al. was carried out in the sensory analysis laboratory with the required permission.

Informed Consent Statement

Informed consent was obtained from all subjects involved in the study.

Data Availability Statement

The original contributions presented in the study are included in the article, further inquiries can be directed to the corresponding authors.

Conflicts of Interest

Author Pei Li was employed by the Angel Yeast Co., which had the role of project administration and funding acquisition in this study. The remaining authors declare that the research was conducted in the absence of any commercial or financial relationships that could be construed as a potential conflict of interest.

Appendix A

Table A1. Response types of electronic nose sensors to different compounds.
No.SensorResponding CompoundsFeature Descriptions
1S1Short-chain alkanesPropane, smoke, etc.
2S2Carbonaceous materials, etc.Alcohol, smoke, isobutane, formaldehyde, etc.
3S3HydrogenHydrogen, hydrogen-containing gas, etc.
4S4P-sulfur compoundsHydrogen sulfide, sulfide, etc.
5S5Nitrogenous substancesAmmonia, amines, etc.
6S6Aldehydes and ketonesToluene, acetone, ethanol, hydrogen, etc.
7S7Short-chain alkanes flammable gases, etc. Methane, natural gas, biogas, etc.
8S8Liquefied gasLiquefied gas
9S9Alkanes, alcohols, ketones, etc. Toluene, formaldehyde, benzene, alcohol, acetone, etc.
10S10Pair containing hydrogen, hydrogen, etc. Hydrogen
11S11P-alkanes, carbon monoxide, etc. Liquefied gas, alkanes, etc.
12S12For some organic solventsLiquefied gas and methane
13S13Short-chain alkanesMethane
14S14For short-chain alkanesMethane, gas, smoke, etc.
15S15Sensitive to nitrogenous substancesAmmonia, amines, etc.
16S16Sulfide sensitiveHydrogen sulfide, sulfide, etc.
17S17Alcohols, some organic solvents, etc. Aromatic hydrocarbons, aliphatic hydrocarbons, alicyclic hydrocarbons, halogenated hydrocarbons, ethers, esters, diol derivatives, acetonitrile, pyridine, phenol, etc.
18S18Sensitive to alcohols, aldehydes, ketones, and benzenesAlcohols, ketones, aldehydes, aromatic compounds, etc.
19S19Sensitive to short-chain alkanesMethane, biogas, natural gas, etc.
20S20Flammable gas, etc. Flammable gas, etc.
21S21VOCFor example, phenols, ketones, ethyl acetate, cyclohexanone, chlorobenzene, methyl benzene, ether, etc.
22S22Sensitive to alkanes, olefins, aromatics, etc.Liquefied gas, natural gas, gas, propane, propylene, butane, butene, etc.
23S23Sensitive to alkanes, olefins, hydrogen, etc.Liquefied gas, flammable gas, etc.
24S24Sensitive to alkanes, carbon monoxide, aldehydes, alcohols, nitrogen oxides, ketones, aldehydes, etc. Alkanes, alcohol, gas fumes, etc.
25S25Sensitive to some organic solventsAldehydes, ethers, esters, ketones, aromatic hydrocarbons, aliphatic hydrocarbons, alicyclic hydrocarbons, and halogenated hydrocarbons
26S26Sulfides, nitrides, carbides, hydrocarbons and nitrogen hydrogen compounds, etc. Smoke, cooking odor, etc.
27S27Sensitive to short-chain alkanesMethane, gas, etc.
Table A2. Relative contents and flavor characteristics of volatile compounds in the three seasoning samples.
No.CompoundsCASFormulaOdor PerceptionRelative Content (%)
SFSF
Alcohols (13)
C11-Pentanol71-41-0C5H12Ograssy aromaNDND0.0792 ± 0.0127
C21-Adamantanol768-95-6C10H16OND0.4002 ± 0.14141.1873 ± 0.0099
C31-Octanol111-87-5C8H18Ofruit aromaND0.2673 ± 0.08490.2359 ± 0.0495
C43-Heptanol, 2,6-dimethyl-19549-73-6C9H20Ograssy aroma1.1082 ± 0.4132 c3.1254 ± 0.1697 a2.0569 ± 0.5632 b
C54-Ethylcyclohexanol4534-74-1C8H16O1.4172 ± 0.2828 b3.4030 ± 0.5657 a0.7901 ± 0.0011 c
C6Benzyl alcohol100-51-6C7H8Ocherry fruit, nutty, tropical fruit0.0555 ± 0.0566ND0.2609 ± 0.0035
C7(R,R)-2,3-Butanediol24347-58-8C4H10O2fruit, cream aroma0.0114 ± 0.0014NDND
C85-Indanol1470-94-6C9H10Ofloral, fruity aroma1.7133 ± 0.4243 a1.5143 ± 0.7071 a1.0475 ± 0.2134 a
C92-Ethylhexanol104-76-7C8H18Osweet, floral scentND0.6647 ± 0.2828ND
C10Citronellol106-22-9C10H20Ocitrus, fruity aromaND0.6654 ± 0.0849ND
C11(S)-(+)-3-Methyl-2-butanol-1517-66-4C5H12O9.1506 ± 1.5556 a6.3878 ± 0.0000 b10.2621 ± 2.5431 a
C121-[1-Methyl-2-(2-propenyloxy)ethoxy]-2-propanolhoxy]-55956-25-7C9H18O33.6892 ± 0.9617 a3.6236 ± 0.0283 a4.0728 ± 0.9988 a
C134,5-Octanediol, 2,7-dimethyl-154468-18-5C10H22O20.6098 ± 0.1414ND0.0862 ± 0.0035
Aldehydes (3)
C143-(4-Hydroxy-phenyl)-propionaldehyde20238-83-9C9H10O20.7552 ± 0.2828 b0.7207 ± 0.0283 b1.2925 ± 0.5637 a
C152,4-Dimethylbenzaldehyde15764-16-6C9H10Oalmond, burnt sugar odor8.6542 ± 1.4142 a6.8828 ± 1.0283 b7.0034 ± 1.5423 b
C16Hexanal66-25-1C6H12Ofatty aroma, grass aroma2.0000 ± 0.2828 b2.2275 ± 0.2927 b2.8765 ± 0.8965 a
Ketones (19)
C17Acetone67-64-1C3H6Omint-like aromaNDND0.1013 ± 0.0045
C182-Heptanone110-43-0C7H14Ofruit aromaNDND0.3588 ± 0.0596
C193-Ethylcyclopentanone10264-55-8C7H14Opungent smellND0.5360 ± 0.04240.1547 ± 0.0014
C202-Nonanone821-55-6C9H18Oas fruit, flower,
oil and herbs like aroma
NDND0.1691 ± 0.0023
C213-Octen-2-one1669-44-9C8H14O fatty, nutty, spicyNDND0.0390 ± 0.0000
C223,5-Dimethyl-2-cyclohexen-1-one1123-09-7C8H12OND0.0797 ± 0.01270.1121 ± 0.0001
C233,5-Diethyl-2,6-dimethylcyclohex-2-en-1-one65416-17-3C12H20ONDND0.1121 ± 0.0261
C242-Decanone693-54-9C10H20Ofatty, wheat aromaNDND0.1281 ± 0.0000
C25Bicycl [3.3.1]nonane-2,6-dione16473-11-3C9H12O2NDND0.1173 ± 0.0008
C262-Tridecanone593-08-8C13H26Ofatty, earthy, dairy0.0485 ± 0.0424ND0.0036 ± 0.0002
C273-Ethyl-4-methyl-pyrrole-2,5-dione-20189-42-8C7H9NO20.3765 ± 0.1414 a0.3418 ± 0.0566 a0.3966 ± 0.0056 a
C282,3-Pentanedione600-14-6C5H8O20.2031 ± 0.0042 b0.2239 ± 0.0284 b0.4114 ± 0.0156 a
C292,3-Hexanedione3848-24-6C6H10O2creamy, fruity, burnt sugar odorND0.3154 ± 0.02120.3875 ± 0.0099
C302-Pentadecanone2345-28-0C15H30Ofatty, spicy flowers0.2473 ± 0.0566 b0.2057 ± 0.0071 b0.3551 ± 0.0001 a
C31Acetophenone98-86-2C8H8Osweet, almond aroma0.0809 ± 0.0013NDND
C322-Hexanoylfuran14360-50-0C10H14O20.7719 ± 0.2828NDND
C33Acetoin513-86-0C4H8O2sweet, dairy aromaNDND0.0975 ± 0.0036
C343,5-Octadien-2-one30086-02-3C8H12OfattyND0.7095 ± 0.0127ND
C35Acetylvaleryl96-04-8C7H12O20.6574 ± 0.0707ND0.3509 ± 0.0038
Esters (6)
C362-Phenylethyl hexanoate6290-37-5C14H20O2fresh, light fatty, wine aroma4.4708 ± 0.0990 a1.1902 ± 0.1413 c3.3734 ± 0.7785 b
C37Phenethyl acetate103-45-7C10H12O2sweet honey, floral0.0302 ± 0.00030.4031 ± 0.0215ND
C38Gamma-octanoic lactone104-50-7C8H14O2strong sweet herb aroma0.3100 ± 0.0141 b0.2410 ± 0.0656 c0.4092 ± 0.0002 a
C392-Phenylethyl propionate122-70-3C11H14O2sweet red rose aromas, fruity undertones, strong sweet honey0.3583 ± 0.0707 a0.3149 ± 0.0057 a0.3186 ± 0.0007 a
C404-Hexanolide695-06-7C6H10O2Fruity aromaNDND0.0461 ± 0.0023
C41Methyl 2-hydroxy-4-methylvalerate40348-72-9C7H14O30.3037 ± 0.1414 c4.1476 ± 1.1123 a3.4326 ± 0.2103 b
Acids (6)
C42Valeric acid109-52-4C5H10O2cheese aromaND0.2964 ± 0.1273ND
C43Octanoic acid124-07-2C8H16O2bouquet, wine, fruit aroma1.3609 ± 0.0849 b0.6334 ± 0.0425 c4.0491 ± 1.0051 a
C44Hexanoic acid142-62-1C6H12O2Fatty aroma0.6793 ± 0.0990 c3.6271 ± 0.9130 a1.2895 ± 0.0999 b
C45Decanoic acid334-48-5C10H20O2soapy, waxy0.9065 ± 0.9899 b0.8339 ± 0.0464 b1.8000 ± 0.4561 a
C46Butanoic acid107-92-6C4H8O2sour, cheesy, creamyNDND0.1701 ± 0.0027
C472-Methylcaproic acid4536-23-6C7H14O2cheesyNDND0.4775 ± 0.1458
C483,4-Dimethoxycinnamic acid14737-89-4C11H12O40.9899 ± 0.1235 a0.2828 ± 0.0211 b0.0071 ± 0.0001 c
C492-Oxo-octanoic acid328-51-8C8H14O3ND0.0424 ± 0.0004ND
Amines (4)
C502-(Aziridin-1-yl)ethanamine4025-37-0C4H10N24.5000 ± 0.14144.2438 ± 0.8698ND
C51Acetamide60-35-5C2H5NOND1.2182 ± 0.29701.1371 ± 0.2356
C52Aniline62-53-3C6H7Npungent odorND1.2157 ± 0.2354ND
C532-Methyl-4-methoxybenzenamine102-50-1C8H11NO2.5419 ± 0.7651NDND
Aromatics (10)
C543-(Ethylamino)phenol621-31-8C8H11NO0.6035 ± 0.1414 a0.2147 ± 0.0198 b0.5262 ± 0.0056 a
C55Olivetol500-66-3C11H16O2NDND0.0375 ± 0.0021
C564-Hydroxy-3-methoxystyrene7786-61-0C9H10O2smoky bacon, spicy, clove phenolic, woody notesNDND0.0212 ± 0.0012
C57Benzimidazole51-17-2C7H6N2nutty NDND0.0422 ± 0.0001
C58Naphthalene91-20-3C10H8floral and fruity aroma NDND0.0067 ± 0.0000
C59Benzonitrile100-47-0C7H5NND0.5005 ± 0.02450.5280 ± 0.3214
C601-Ethylindan4830-99-3C11H145.0058 ± 0.0000 a4.5770 ± 1.0023 b4.0342 ± 0.7598 c
C61Phenylethyl Alcohol60-12-8C8H10Orose scentND0.2858 ± 0.11310.2123 ± 0.0236
C62o-Tolidine, N,N′-bis(trimethylsilyl)-149388-08-9C20H32N2Si20.6093 ± 0.1414ND0.8182 ± 0.1518
C63Benzothiazole95-16-9C7H5NSmushroom, smoke0.0082 ± 0.0028 b0.0120 ± 0.0028 b0.0582 ± 0.0000 a
Heterocyclics (28)
C642-Methylpyrazine109-08-0C5H6N2roasted, chocolate, nutty aromas0.7610 ± 0.0846 b0.2239 ± 0.0042 c1.0492 ± 0.04586 a
C652,5-Dimethylpyrazine123-32-0C6H8N2fried potatoes, dark chocolate aromas0.3881 ± 0.0113 b0.2623 ± 0.0849 c1.0932 ± 0.5623 a
C66Pyrazine, 2-Ethyl-6-methyl-13925-03-6C7H10N2roasted hazelnut aromas2.4744 ± 0.5657 a0.2339 ± 0.0044 c0.8331 ± 0.00114 b
C672-Ethyl-5-methylpyrazine-13360-64-0C7H10N2roasted and nutty aromasND0.0110 ± 0.0001ND
C683-Ethyl-2,5-dimethylpyrazine13360-65-1C8H12N2roasted, chocolate, nutty aromaND0.0226 ± 0.0013ND
C69Pyrazine, ethyltrimethyl- (8CI,9CI)17398-16-2C9H14N2peanut, hazelnut, cocoa1.8934 ± 1.1314NDND
C702-Butyl-3-methylpyrazine15987-00-5C9H14N2caramel, baked goods aromaNDND0.1148 ± 0.0036
C71N-pentylpyrzine6303-75-9C9H14N20.8319 ± 0.0424 b0.8986 ± 0.1273 b3.6800 ± 0.8895 a
C725-Ethyl-2,3-dimethylpyrazine15707-34-3C8H12N2ND0.4770 ± 0.0990ND
C732-Acetyl-3,5-dimethylpyrazine4300-08-25C8H10N2Oroasted, chocolate, nutty aroma2.5950 ± 0.0000 b0.2159 ± 0.0212 c2.8398 ± 0.0127 a
C742-Propylpyrazine18138-03-9C7H10N2soft nuttyNDND0.0413 ± 0.0023
C75Pyrazine, 2,5-dimethyl-3-propyl- (8CI,9CI)18433-97-1C9H14N2nuttyND0.2147 ± 0.0198ND
C762,6-Dimethylpyrazine108-50-9C6H8N2nutty, coffee, cocoa, musty bread, meatyND1.2300 ± 0.31111.4220 ± 0.0236
C77Pyrazine, 2,3-dimethyl-5910-89-4C6H8N2nutty, almond aromaND0.2324 ± 0.03250.2480 ± 0.0365
C78Tetramethylpyrazine1124-11-4C8H12N2nutty, weedy earth, cocoa, peanut, coffee, asparagus8.1366 ± 1.4142 c12.5390 ± 2.356 b11.1259 ± 3.2658 a
C792-n-Butyl furan4466-24-4C8H12O0.7429 ± 0.1414NDND
C801-(2-Furyl)pentan-1-one3194-17-0C9H12O24.8815 ± 0.2828 c5.3408 ± 1.2832 a5.8141 ± 0.9865 b
C81Benzofuran, 2,3-dihydro-2-methyl-1746-11-8C9H10O3.4637 ± 0.5657 b4.2814 ± 0.9685 c0.0126 ± 0.0001 a
C822,3-Dihydrobenzofuran496-16-2C8H8Osweet and nutty2.2616 ± 0.2828 b3.0904 ± 0.3625 a0.0251 ± 0.0005 c
C832-n-Heptylfuran3777-71-7C11H18Ogreen, fatty, greasy, lactone, pork8.7422 ± 0.4243 a8.2710 ± 1.4786 b8.0197 ± 1.3664 b
C843-Cyano-4,6-dimethyl-2-hydroxypyridine769-28-8C8H8N2Oastringent, burnt taste0.5630 ± 0.0849 a0.2193 ± 0.0023 b0.5067 ± 0.0269 b
C85Pyridine110-86-1C5H5Nspicy0.7783 ± 0.0990 c1.0955 ± 0.2369 b1.2557 ± 0.0085 a
C862-Acetyl pyrrole1072-83-9C6H7NOwalnuts, licorice, toast, fried hazelnuts and fish-like aromaND0.2303 ± 0.25890.3402 ± 0.0566
C873-Tert-butyl-1H-1,2,4-triazole96440-78-7C6H11N3nutty0.3582 ± 0.0707ND1.3425 ± 0.4808
C885-Methyl-[1,2,4]triazolo [1,5-a]pyrimidin-7-ol2503-56-2C6H6N4O0.3302 ± 0.00424 b0.4351 ± 0.0071 a0.0911 ± 0.0016 c
C89Cyclotetrasiloxane, octamethyl-556-67-2C8H24O4Si40.7738 ± 0.0990ND0.1501 ± 0.0707
C90Dodecamethylcyclohexasiloxane540-97-6C12H36O6Si62.0215 ± 0.283 a1.3961 ± 0.0085 b1.8237 ± 0.0325 c
C912,3,5-Trimethyl-6-propylpyrazine92233-82-4C10H16N2ND0.2237 ± 0.03860.4810 ± 0.1131
“—” indicates that the relevant data were not found. “ND” indicates that the compound was not detected; Relative content was calculated as the mean ± standard deviation (n = 3). Different lowercases within the same row denote significant differences between means at p < 0.05. Statistical analysis was performed using one-way ANOVA (Duncan’s test).

References

  1. Meng, J.; Wang, J.; Hao, Y.; Zhu, M.; Wang, J. Effects of Lactobacillus fermentum GD01 fermentation on the nutritional components and flavor substances of three kinds of bean milk. Food Sci. Technol. 2023, 184, 115006. [Google Scholar] [CrossRef]
  2. Pinto, T.; Aires, A.; Cosme, F.; Bacelar, E.; Morais, M.C.; Oliveira, I.; Ferreira-Cardoso, J.; Anjos, R.; Vilela, A.; Gonçalves, B. Bioactive (Poly)phenols, Volatile Compounds from Vegetables, Medicinal and Aromatic Plants. Foods 2021, 10, 106. [Google Scholar] [CrossRef]
  3. Cao, C.; Waterhouse, G.; Sun, W.; Zhao, M.; Sun-Waterhouse, D.; Su, G. Effects of Fermentation with Tetragenococcus halophilus and Zygosaccharomyces rouxii on the Volatile Profiles of Soybean Protein Hydrolysates. Foods 2023, 12, 4513. [Google Scholar] [CrossRef]
  4. Seo, W.H.; Lee, H.G.; Baek, H.H. Evaluation of Bitterness in Enzymatic Hydrolysates of Soy Protein Isolate by Taste Dilution Analysis. J. Food Sci. 2008, 73, S41–S46. [Google Scholar] [CrossRef]
  5. Ashaolu, T.J. Applications of soy protein hydrolysates in the emerging functional foods: A review. Int. J. Food Sci. Technol. 2020, 55, 421–428. [Google Scholar] [CrossRef]
  6. Liang, Z.; Yi, M.; Sun, J.; Zhang, T.; Wen, R.; Li, C.; Reshetnik, E.I.; Gribanova, S.L.; Liu, L.; Zhang, G. Physicochemical properties and volatile profile of mung bean flour fermented by Lacticaseibacillus casei and Lactococcus lactis. LWT 2022, 163, 113565. [Google Scholar] [CrossRef]
  7. Bai, J.; He, L.; Zhang, J.; Gu, X.; Wu, B.; Wang, A.; Zhu, Y.; Zhang, J.; Zhao, Y.; Yuan, J.; et al. Influences of Lactiplantibacillus plantarum and Saccharomyces cerevisiae fermentation on the nutritional components, flavor property and lipid-lowering effect of highland barley. J. Future Foods 2024, 4, 258–266. [Google Scholar] [CrossRef]
  8. Xiang, H.; Sun-Waterhouse, D.; Waterhouse, G.I.N.; Cui, C.; Ruan, Z. Fermentation-enabled wellness foods: A fresh perspective. Food Sci. Hum. Wellness 2019, 8, 203–243. [Google Scholar] [CrossRef]
  9. Bampidis, V.; Azimonti, G.; Bastos, M.L.; Christensen, H.; Dusemund, B.; Fasmon, D.M.; Kouba, M.; Lopez-Alonso, M.; Lopez, P.S.; Marcon, F.; et al. Safety and efficacy of a feed additive consisting of monosodium L-glutamate produced by fermentation with Corynebacterium glutamicum KCCM 80187 for all animal species (CJ Europe GmbH). EFSA J. 2021, 19, e6982. [Google Scholar]
  10. Shangguan, L.; Zhang, H.; Liu, Z.; An, F.; Yang, Q.; Zhang, X.; Yao, L.; Yang, S.; Dai, J.; Chen, X. Improved Glutamic Acid Production Capacity of Corynebacterium glutamicum by the ARTP Mutagenesis Method. Fermentation 2023, 9, 599. [Google Scholar] [CrossRef]
  11. Shangguan, L.; Liu, Z.; Zhang, H.; Yang, Q.; Zhang, X.; Yao, L.; Li, P.; Chen, X.; Dai, J. Improved umami taste of the enzymatic hydrolysate of soybean protein isolate by Corynebacterium glutamicum P-45 fermentation. Food Biosci. 2024, 58, 103565. [Google Scholar] [CrossRef]
  12. Fadel, H.H.M.; Lotfy, S.N.; Asker, M.M.S.; Mahmoud, M.G.; Al-Okbi, S.Y. Nutty-like flavor production by Corynbacterium glutamicum 1220T from enzymatic soybean hydrolysate. Effect of encapsulation and storage on the nutty flavoring quality. J. Adv. Res. 2018, 10, 31–38. [Google Scholar] [CrossRef] [PubMed]
  13. Yin, X.; Lv, Y.; Wen, R.; Wang, Y.; Chen, Q.; Kong, B. Characterization of selected Harbin red sausages on the basis of their flavour profiles using HS-SPME-GC/MS combined with electronic nose and electronic tongue. Meat Sci. 2021, 172, 108345. [Google Scholar] [CrossRef]
  14. Yu, J.; Lu, K.; Zi, J.; Yang, X.; Xie, W. Characterization of aroma profiles and aroma—Active compounds in high-salt and low-salt shrimp paste by molecular sensory science. Food Biosci. 2022, 45, 101470. [Google Scholar] [CrossRef]
  15. Feng, X.; Wang, H.; Wang, Z.; Huang, P.; Kan, J. Discrimination and characterization of the volatile organic compounds in eight kinds of huajiao with geographical indication of China using electronic nose, HS-GC-IMS and HS-SPME-GC-MS. Food Chem. 2022, 375, 131671. [Google Scholar] [CrossRef] [PubMed]
  16. Shangguan, L.; Zhang, H.; Wang, W.; Li, P.; Chen, X.; Dai, J. Optimization of soybean isolated protein enzymatic process and its application in fermented seasonings. Sci. Technol. Food Ind. 2023, 44, 272–280. [Google Scholar]
  17. Putri, S.L.E.; Suantika, G.; Situmorang, M.L.; Christina, J.; Nikijuluw, C.; Putri, S.P.; Fukusaki, E. Shrimp count size: GC/MS-based metabolomics approach and quantitative descriptive analysis (QDA) reveal the importance of size in white leg shrimp (Litopenaeus vannamei). Metabolomics 2021, 17, 19. [Google Scholar] [CrossRef] [PubMed]
  18. Wang, Y.; Hu, L.; Huang, H.; Wang, H.; Zhang, T.; Chen, J.; Du, G.; Kang, Z. Eliminating the capsule-like layer to promote glucose uptake for hyaluronan production by engineered Corynebacterium glutamicum. Nat. Commun. 2020, 11, 3120. [Google Scholar] [CrossRef] [PubMed]
  19. Cai, W.; Xue, Y.A.; Wang, Y.; Wang, W.; Shu, N.; Zhao, H.; Tang, F.; Yang, X.; Guo, Z.; Shan, C. The Fungal Communities and Flavor Profiles in Different Types of High-Temperature Daqu as Revealed by High-Throughput Sequencing and Electronic Senses. Front. Microbiol. 2021, 12, 784651. [Google Scholar] [CrossRef] [PubMed]
  20. Duan, Z.; Dong, S.; Dong, Y.; Gao, Q. Geographical origin identification of two salmonid species via flavor compound analysis using headspace-gas chromatography-ion mobility spectrometry combined with electronic nose and tongue. Food Res. Int. 2021, 145, 110385. [Google Scholar] [CrossRef]
  21. Tian, D.; Huang, G.; Ren, L.; Li, Y.; Yu, J.; Lu, Q.; Yang, Y.; Deng, X.; Li, Y.; Zhou, H. Effects of Monascus purpureus on ripe Pu-erh tea in different fermentation methods and identification of characteristic volatile compounds. Food Chem. 2024, 440, 138249. [Google Scholar] [CrossRef] [PubMed]
  22. Chen, W.; Qi, D.; Wang, W.; Miao, A.; Ma, C. GC-MS analysis combined with sensory analysis revealed the various aroma characteristics of black tea resulted from different grafting rootstocks. J. Food Sci. 2021, 86, 813–823. [Google Scholar] [CrossRef] [PubMed]
  23. Wang, Y.; He, Y.; Liu, Y.; Wang, D.W. Analyzing Volatile Compounds of Young and Mature Docynia delavayi Fruit by HS-SPMEGC-MS and rOAV. Foods. 2022, 12, 59. [Google Scholar] [CrossRef] [PubMed]
  24. Xiao, M.; Peng, Z.; Hardie, W.J.; Huang, T.; Liu, Z.; Zhang, Y.; Xie, M.; Xiong, T. Exploring the typical flavours formation by combined with metatranscriptomics and metabolomics during Chinese Sichuan paocai fermentation. LWT 2022, 153, 112474. [Google Scholar] [CrossRef]
  25. Xiao, Y.; Huang, Y.; Chen, Y.; Zhu, M.; He, C.; Li, Z.; Wang, Y.; Liu, Z. Characteristic fingerprints and change of volatile organic compounds of dark teas during solid-state fermentation with Eurotium cristatum by using HS-GC-IMS, HS-SPME-GC-MS, E-nose and sensory evaluation. LWT—Food Sci. Technol. 2022, 169, 113925. [Google Scholar] [CrossRef]
  26. Huang, Y.; Chen, R.; Chen, Y.; Ho, C.; Hou, A.; Zhang, X.; Zhu, M.; Zhang, C.; Wang, Y.; Liu, Z.; et al. Dynamics changes in volatile profile, non-volatile metabolites and antioxidant activities of dark tea infusion during submerged fermentation with Eurotium cristatum. Food Biosci. 2023, 55, 102966. [Google Scholar] [CrossRef]
  27. Sun, Y.; Zhang, Y.; Song, H. Variation of aroma components during frozen storage of cooked beef balls by SPME and SAFE coupled with GC-O-MS. J. Food Process Pres. 2021, 45, e15036. [Google Scholar] [CrossRef]
  28. Wang, B.; Zhang, Q.; Zhang, N.; Bak, K.H.; Soladoye, O.P.; Aluko, R.E.; Fu, Y.; Zhang, Y. Insights into formation, detection and removal of the beany flavor in soybean protein. Trends Food Sci. Tech. 2021, 112, 336–347. [Google Scholar] [CrossRef]
  29. Mu, H.; Dai, T.; Huang, S.; Wu, K.; Wang, M.; Tan, C.; Zhang, F.; Sheng, J.; Zhao, C. Physical and Chemical Properties, Flavor and Organoleptic Characteristics of a Walnut and Purple Rice Fermented Plant Drink. Foods 2024, 13, 400. [Google Scholar] [CrossRef]
  30. Leonard, W.; Zhang, P.; Ying, D.; Fang, Z. Surmounting the off-flavor challenge in plant-based foods. Crit. Rev. Food Sci. Nutr. 2023, 63, 10585–10606. [Google Scholar] [CrossRef]
  31. Yu, J.; Lu, K.; Zi, J.; Yang, X.; Zheng, Z.; Xie, W. Halophilic bacteria as starter cultures: A new strategy to accelerate fermentation and enhance flavor of shrimp paste. Food Chem. 2022, 393, 133393. [Google Scholar] [CrossRef] [PubMed]
  32. Cao, C.; Sun, H.; Song, X.; Zhao, M.; Lin, W.; Sun, W.; Lin, L.; Li, W.; Su, G. Effect of fermentation with Tetragenococcus halophilus and Zygosaccharomyces rouxii on selected non-volatile taste compounds in soybean protein hydrolysates. Food Sci. Technol. 2023, 184, 115053. [Google Scholar] [CrossRef]
  33. Fadel, H.; Saad, R.; Asker, M.; Mahmoud, M.; Lotfy, S.; Abd El-Aleem, F.; Ahmed, M.; Elmansy, E. Production of enzymatically hydrolyzed soybean protein isolate by a novel neutral protease from Enterobacter sp. NRCM1 to be used as a base precursor of thermal process flavours. Egypt. J. Chem. 2021, 64, 2127–2140. [Google Scholar] [CrossRef]
  34. Li, Y.; Yuan, L.; Liu, H.; Liu, H.; Zhou, Y.; Li, M.; Gao, R. Analysis of the changes of volatile flavor compounds in a traditional Chinese shrimp paste during fermentation based on electronic nose, SPME-GC-MS and HS-GC-IMS. Food Sci. Hum. Wellness 2023, 12, 173–182. [Google Scholar] [CrossRef]
  35. Cai, W.; Wang, Y.; Wang, W.; Shu, N.; Hou, Q.; Tang, F.; Shan, C.; Yang, X.; Guo, Z. Insights into the Aroma Profile of Sauce-Flavor Baijiu by GC-IMS Combined with Multivariate Statistical Analysis. J. Anal. Methods Chem. 2022, 2022, 4614330. [Google Scholar] [CrossRef] [PubMed]
  36. Gao, P.; Xia, W.; Li, X.; Liu, S. Use of Wine and Dairy Yeasts as Single Starter Cultures for Flavor Compound Modification in Fish Sauce Fermentation. Front. Microbiol. 2019, 10, 2300. [Google Scholar] [CrossRef] [PubMed]
  37. Song, S.; Tang, Q.; Fan, L.; Xu, X.; Song, Z.; Hayat, K.; Feng, T.; Wang, Y. Identification of pork flavour precursors from enzyme-treated lard using Maillard model system assessed by GC–MS and partial least squares regression. Meat Sci. 2017, 124, 15–24. [Google Scholar] [CrossRef]
  38. Zhou, Y.; Wu, S.; Peng, Y.; Jin, Y.; Xu, D.; Xu, X. Effect of lactic acid bacteria on mackerel (Pneumatophorus japonicus) seasoning quality and flavor during fermentation. Food Biosci. 2021, 41, 100971. [Google Scholar] [CrossRef]
  39. Hu, M.; Wang, S.; Liu, Q.; Cao, R.; Xue, Y. Flavor profile of dried shrimp at different processing stages. LWT 2021, 146, 111403. [Google Scholar] [CrossRef]
  40. Wang, W.; Cha, Y. Volatile Compounds in Seasoning Sauce Produced from Soy Sauce Residue by Reaction Flavor Technology. Prev. Nutr. Food Sci. 2018, 23, 356–363. [Google Scholar] [CrossRef]
  41. Prihanto, A.A.; Nurdiani, R.; Jatmiko, Y.D.; Firdaus, M.; Kusuma, T.S. Physicochemical and sensory properties of terasi (an Indonesian fermented shrimp paste) produced using Lactobacillus plantarum and Bacillus amyloliquefaciens. Microbiol. Res. 2021, 242, 126619. [Google Scholar] [CrossRef] [PubMed]
  42. Lee, S.M.; Oh, J.; Hurh, B.S.; Jeong, G.H.; Shin, Y.K.; Kim, Y.S. Volatile Compounds Produced by Lactobacillus paracasei during Oat Fermentation. J. Food Sci. 2016, 81, C2915–C2922. [Google Scholar] [CrossRef] [PubMed]
  43. Zhao, X.; Liu, Y.; Shu, L.; He, Y. Study on metabolites of Bacillus producing soy sauce-like aroma in Jiang-flavor Chinese spirits. Food Sci. Nutr. 2020, 8, 97–103. [Google Scholar] [CrossRef] [PubMed]
  44. Fang, D.L.; Yang, W.J.; Kimatu, B.M.; Zhao, L.Y.; An, X.X.; Hu, Q.H. Comparison of flavour qualities of mushrooms (Flammulina velutipes) packed with different packaging materials. Food Chem. 2017, 232, 1–9. [Google Scholar]
  45. Reyes-Díaz, R.; González-Córdova, A.F.; Del Carmen Estrada-Montoya, M.; Méndez-Romero, J.I.; Mazorra-Manzano, M.A.; Soto-Valdez, H.; Vallejo-Cordoba, B. Volatile and sensory evaluation of Mexican Fresco cheese as affected by specific wild Lactococcus lactis strains. J. Dairy. Sci. 2020, 103, 242–253. [Google Scholar] [CrossRef] [PubMed]
  46. Li, J.; Sun, C.; Zhang, M.; He, J.; Shen, Z.; Geng, L.; Yuan, L.; Wang, S.; Wang, C. Study on the factors affecting the sauce-flavor compounds of soybean paste in fermentation. Food Biosci. 2024, 59, 103872. [Google Scholar] [CrossRef]
  47. Inoue, Y.; Kato, S.; Saikusa, M.; Suzuki, C.; Otsubo, Y.; Tanaka, Y.; Watanabe, H.; Hayase, F. Analysis of the cooked aroma and odorants that contribute to umami aftertaste of soy miso (Japanese soybean paste). Food Chem. 2016, 213, 521–528. [Google Scholar] [CrossRef] [PubMed]
  48. Kleekayai, T.; Pinitklang, S.; Laohakunjit, N.; Suntornsuk, W. Volatile components and sensory characteristics of Thai traditional fermented shrimp pastes during fermentation periods. J. Food Sci. Technol.-Mysore 2016, 53, 1399–1410. [Google Scholar] [CrossRef]
  49. Xi, J.; Xu, D.; Wu, F.; Jin, Z.; Yin, Y.; Xu, X. The aroma compounds of Chinese steamed bread fermented with sourdough and instant dry yeast. Food Biosci. 2020, 38, 100775. [Google Scholar] [CrossRef]
  50. Kawtharani, H.; Beaufort, S.; Anson, P.; Taillandier, P.; Mathieu, F.; Snini, S.P. Impact of the Inoculation Method of Geotrichum candidum, Used as Biocontrol Agent, on T-2 Toxin Produced by Fusarium sporotrichioides and F. langsethiae during the Malting Process. Toxins 2022, 14, 239. [Google Scholar] [CrossRef] [PubMed]
  51. Chen, Y.; Zhang, X.; Liu, X.; Liu, Y.; Hou, A.; Wang, Y.; Li, L.; Peng, X.; Xiao, Y. Discrimination and characterization of volatile organic compounds and nutritional values of three varieties of chopped pepper seeds. Food Chem. X 2024, 21, 101150. [Google Scholar] [CrossRef] [PubMed]
  52. Ruan, L.; Ju, Y.; Zhan, C.; Hou, L. Improved umami flavor of soy sauce by adding enzymatic hydrolysate of low-value fish in the natural brewing process. LWT 2022, 155, 112911. [Google Scholar] [CrossRef]
  53. Xia, D.; Tan, X.; Wang, L.; Li, Z.; Hou, A.; Zhu, Y.; Lai, L.; Wang, Y. GC-MS Coupled with Rate-All-That-Apply (RATA) to Analyse the Volatile Flavor Substances of Yellow Wine during Fermentation. Foods 2023, 12, 1992. [Google Scholar] [CrossRef] [PubMed]
  54. Wang, M.; Zhang, J.; Chen, J.; Jing, B.; Zhang, L.; Yu, X. Characterization of Differences in Flavor in Virgin Rapeseed Oils by Using Gas Chromatography-Mass Spectrometry, Electronic Nose, and Sensory Analysis. Eur. J. Lipid Sci. Tech. 2020, 122, 1900205. [Google Scholar] [CrossRef]
  55. Wang, J.; Wang, R.; Xiao, Q.; Liu, C.; Deng, F.; Zhou, H. SPME/GC-MS characterization of volatile compounds of Chinese traditional-chopped pepper during fermentation. Int. J. Food Prop. 2019, 22, 1863–1872. [Google Scholar] [CrossRef]
  56. Shahidi, F.; Oh, W.Y. Lipid-derived flavor and off-flavor of traditional and functional foods: An overview. J. Food Bioact. 2020, 10, 20–31. [Google Scholar] [CrossRef]
Figure 1. Sensory evaluation and electronic nose analysis of seasoning samples (different letters indicate significant differences [p < 0.05]). (a) Sensory scoring radar map, (b) odor radar map of the response of the electronic nose sensor, and (c) correlation of odor with the electronic nose sensor response data (PC1 and PC2 were the directions with the largest and smallest differences, respectively).
Foods 13 02591 g001
Figure 2. (a) Types of volatile compounds in three seasoning samples. (b) Relative levels of volatile compounds in three seasoning samples.
Foods 13 02591 g002
Figure 3. (a) PCA-X diagram of different flavoring samples (red, blue, and green dots represent samples S, F, and SF, respectively). (b) Biplots of different flavor samples (green and orange dots represent volatile flavor substances and flavor samples, respectively). (c) Heatmap based on the relative content distribution of volatile flavor substances in different flavor samples (red and blue colors represent the high and low concentrations of volatile flavor substances, respectively; the higher the concentration of volatile flavor substances, the darker the color).
Foods 13 02591 g003aFoods 13 02591 g003b
Figure 4. (a) OPLS-DA regression projection of volatile compounds. (b) Validation via the permutation test. (c) VIP value calculated based on the OPLS-DA regression model.
Foods 13 02591 g004
Figure 5. (a) ROAV values of eight important volatile compounds. (b) Correlation graph between the electronic nose sensor and eight important volatile flavoring compounds.
Foods 13 02591 g005
Table 1. Relative odor activity values of volatile compounds in different seasoning samples.
No. CompoundsCASThreshold Value (mg/kg)ROAV Values
SFSF
Alcohols (7)
C11-Pentanol71-41-00.15023.7313.14
C21-Adamantanol768-95-62.000039.6214.80
C31-Octanol111-87-50.1258 46.77
C6Benzyl alcohol100-51-65.10000.341.28
C7(R,R)-2,3-Butanediol24347-58-80.09513.73
C92-Ethylhexanol104-76-725.48220.49
C10Citronellol106-22-92.20005.64
Ketones (6)
C17Acetone67-64-10.83203.04
C182-Heptanone110-43-00.140063.91
C202-Nonanone821-55-60.082051.42
C213-Octen-2-one1669-44-90.250033.82
C31Acetophenone98-86-21.60001.57
C343,5-Octadien-2-one30086-02-30.150088.21
Esters (4)
C37Acetic acid, phenethyl acetate103-45-70.24963.7530.12
C38Gamma-octanoic lactone104-50-70.200048.1022.4751.01
C392-Phenylethyl propionate122-70-318.00000.620.330.44
C404-Hexanolide695-06-712.50000.09
Acids (4)
C43Octanoic acid124-07-23.000014.083.9433.66
C45Decanoic acid334-48-510.00002.811.564.49
Amines (2)
C51Acetamide60-35-5160.00000.140.18
C52Aniline62-53-370.10000.32
Aromatics (3)
C564-Hydroxy-3-methoxystyrene7786-61-00.012044.04
C58Naphthalene91-20-30.006027.71
C63Benzothiazole90-05-10.08003.162.8118.14
Heterocyclics (15)
C642-Methylpyrazine109-08-030.00000.790.140.87
C652,5-Dimethylpyrazine123-32-01.75006.882.8026.98
C672-Ethyl-5-methylpyrazine-13360-64-00.016012.79
C683-Ethyl-2,5-dimethylpyrazine13360-65-10.008649.05
C702-Butyl-3-methylpyrazine15987-00-50.260011.00
C71N-pentylpyrzine6303-75-99.00002.871.8610.20
C725-Ethyl-2,3-dimethylpyrazine15707-34-30.530016.78
C742-Propylpyrazine18138-03-90.15966.46
C75Pyrazine, 2,5-dimethyl-3-propyl- (8CI,9CI)18433-97-12.00002.00
C762,6-Dimethylpyrazine108-50-90.71805.9749.38
C77Pyrazine, 2,3-dimethyl5910-89-40.80005.427.73
C78Tetramethylpyrazine1124-11-42.5250100.00100.00100.00
C792-n-Butyl furan4466-24-410.00002.31
C85Pyridine110-86-12.000012.0810.2215.66
C862-Acetyl pyrrole1072-83-958.58530.070.145
“—” indicates that ROAV cannot be calculated without retrieving the relevant data of the substance.
Disclaimer/Publisher’s Note: The statements, opinions and data contained in all publications are solely those of the individual author(s) and contributor(s) and not of MDPI and/or the editor(s). MDPI and/or the editor(s) disclaim responsibility for any injury to people or property resulting from any ideas, methods, instructions or products referred to in the content.

