
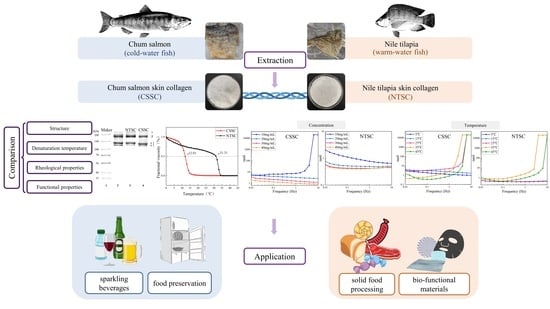
Comparison of Structural and Physicochemical Characteristics of Skin Collagen from Chum Salmon (Cold-Water Fish) and Nile Tilapia (Warm-Water Fish)

Abstract
:
1. Introduction
2. Materials and Methods
2.1. Materials
2.2. Preparation of Collagen from Fish Skin
2.3. Structural Analysis
2.3.1. Sodium Dodecyl Sulphate-Polyacrylamide Gel Electrophoresis (SDS-PAGE)
2.3.2. Protein Sequence Analysis
2.3.3. Ultraviolet (UV) Absorption Spectra
2.3.4. Fourier Transform Infrared (FTIR) Spectra
2.3.5. FTIR Spectral Curve Fitting
2.3.6. X-ray Diffraction (XRD)
2.4. Determination of Denaturation Temperature (Td)
2.5. Rheological Properties
2.5.1. Dynamic Frequency Sweep Tests
2.5.2. Steady Shear Tests
2.6. Functional Properties
2.6.1. Water Holding Capacity (WHC)
2.6.2. Oil Holding Capacity (OHC)
2.6.3. Foaming Capacity (FC) and Foaming Stability (FS)
2.6.4. Emulsifying Activity Index (EAI) and Emulsifying Stability Index (ESI)
2.7. Statistical Analysis
3. Results and Discussion
3.1. Yield
3.2. Structural Analysis
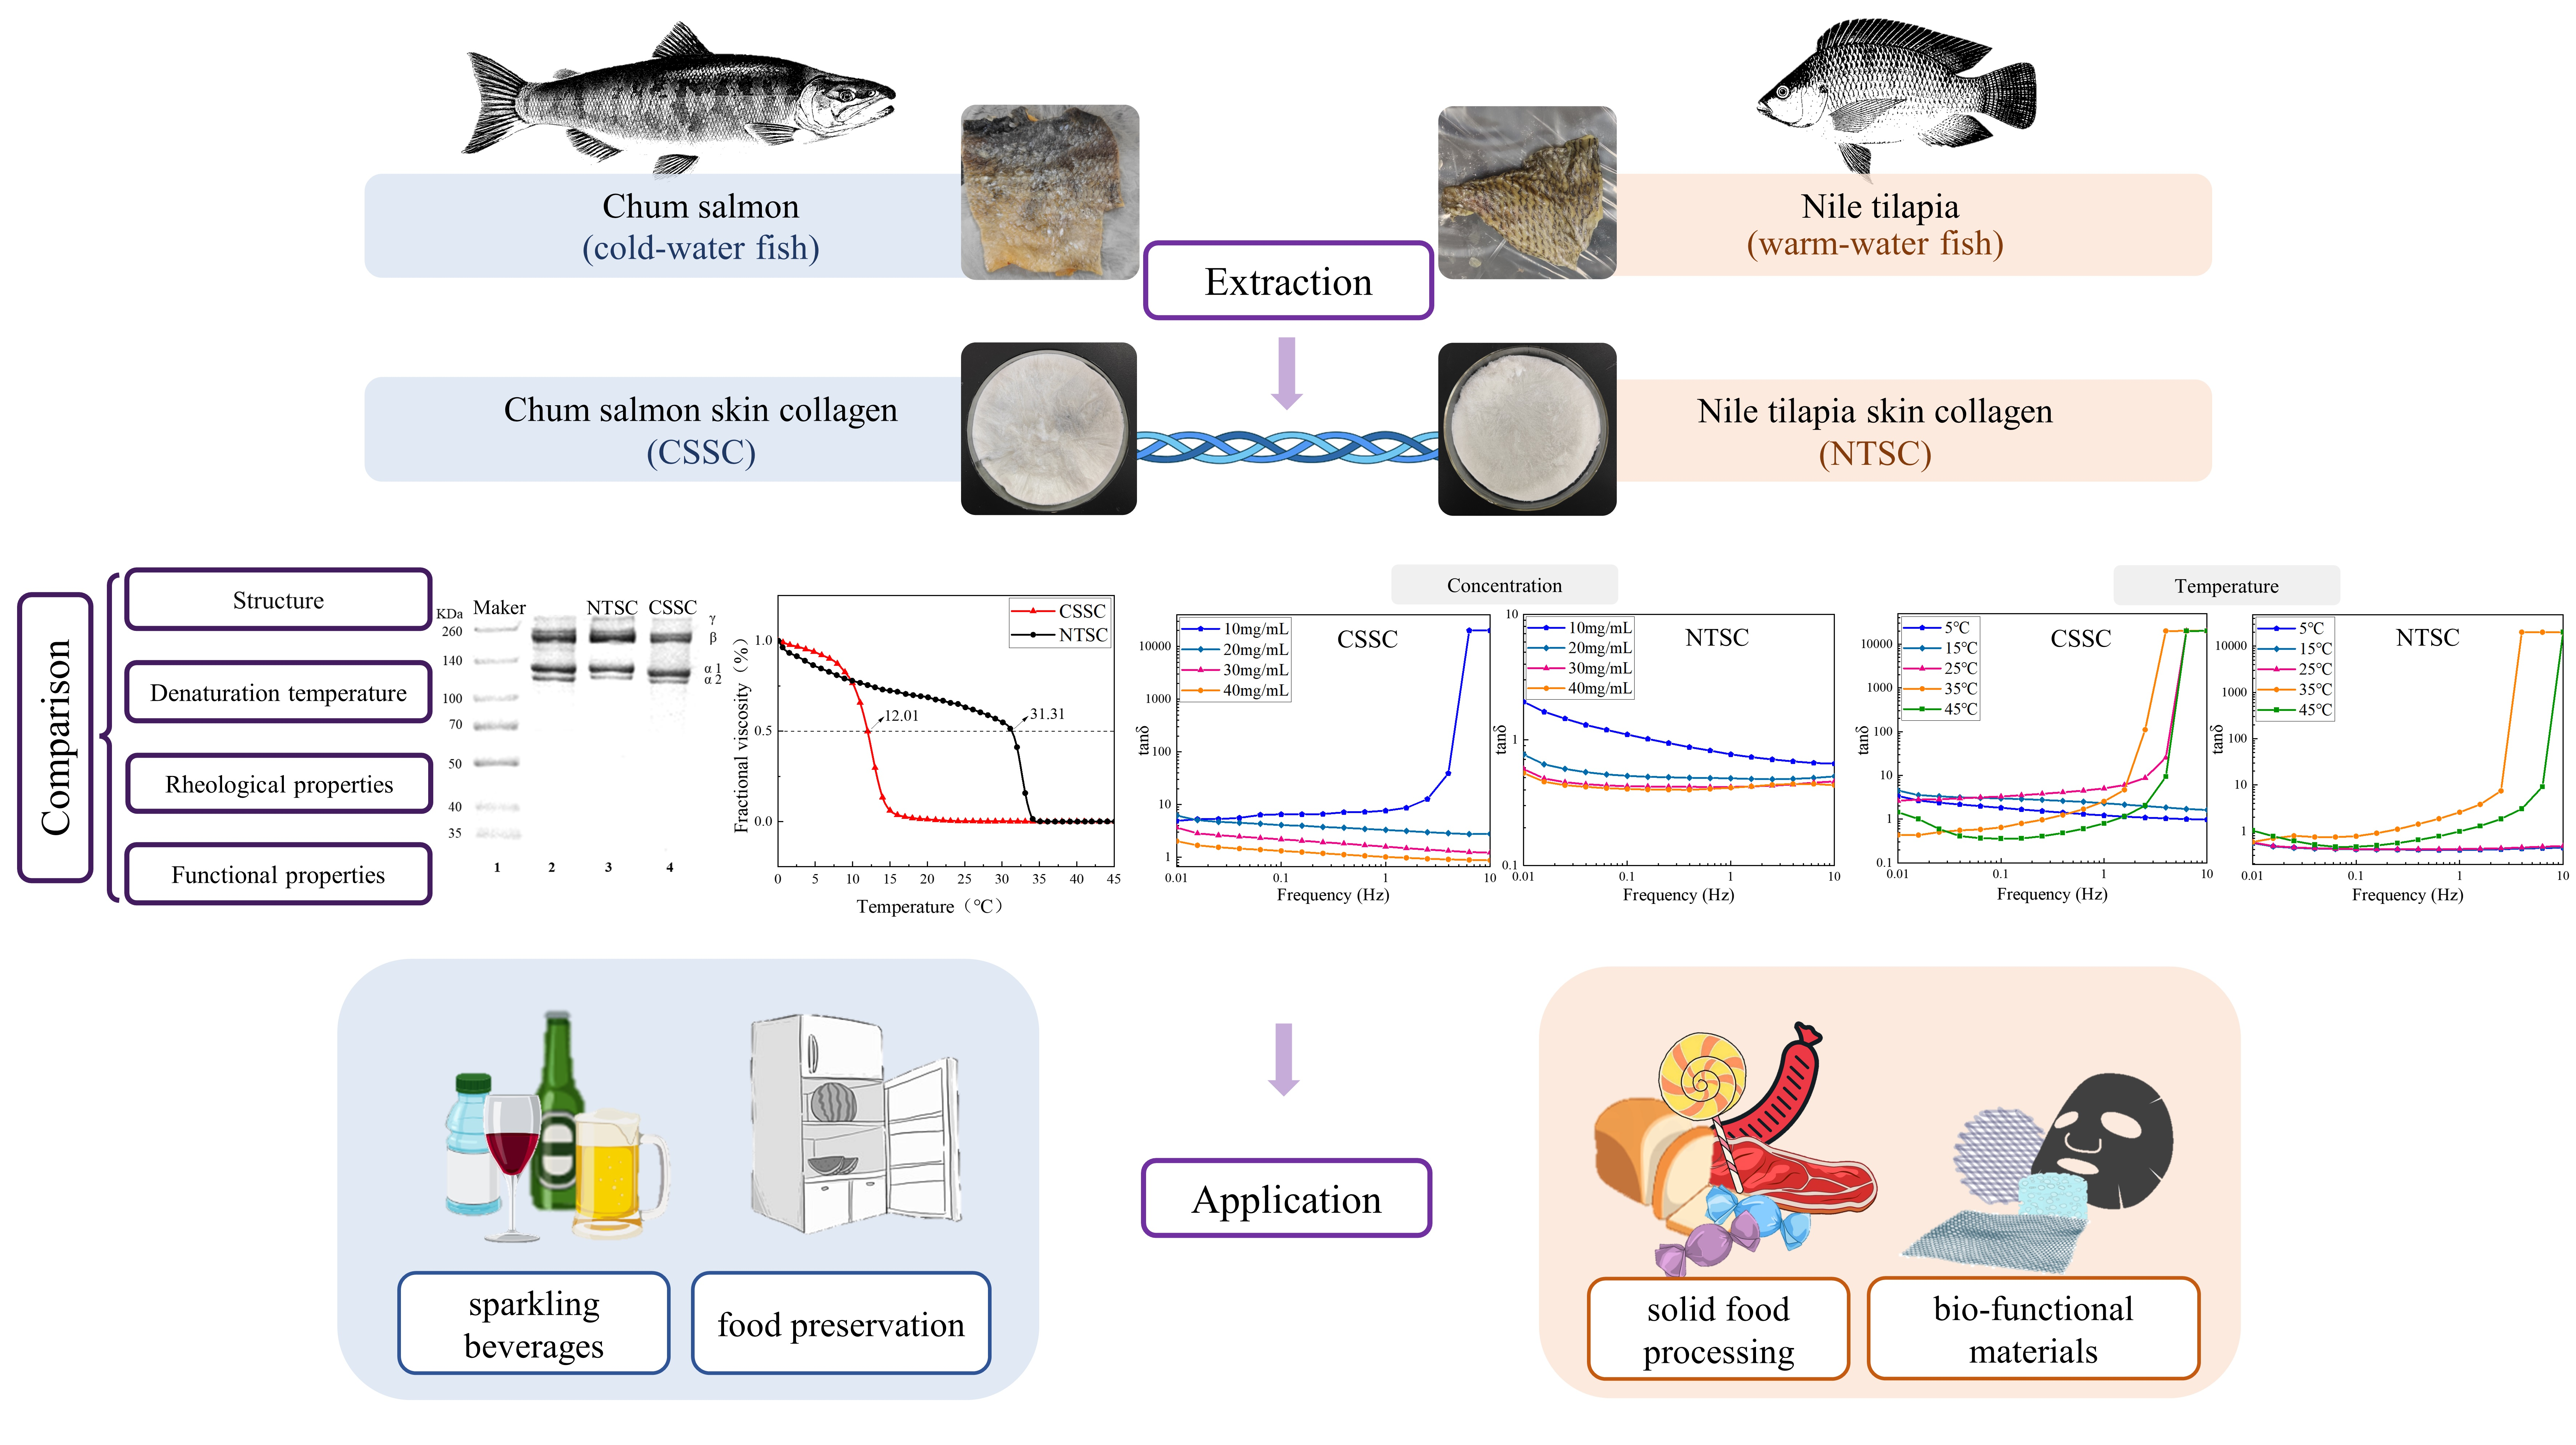
3.2.1. SDS-PAGE
3.2.2. Protein Sequence Analysis
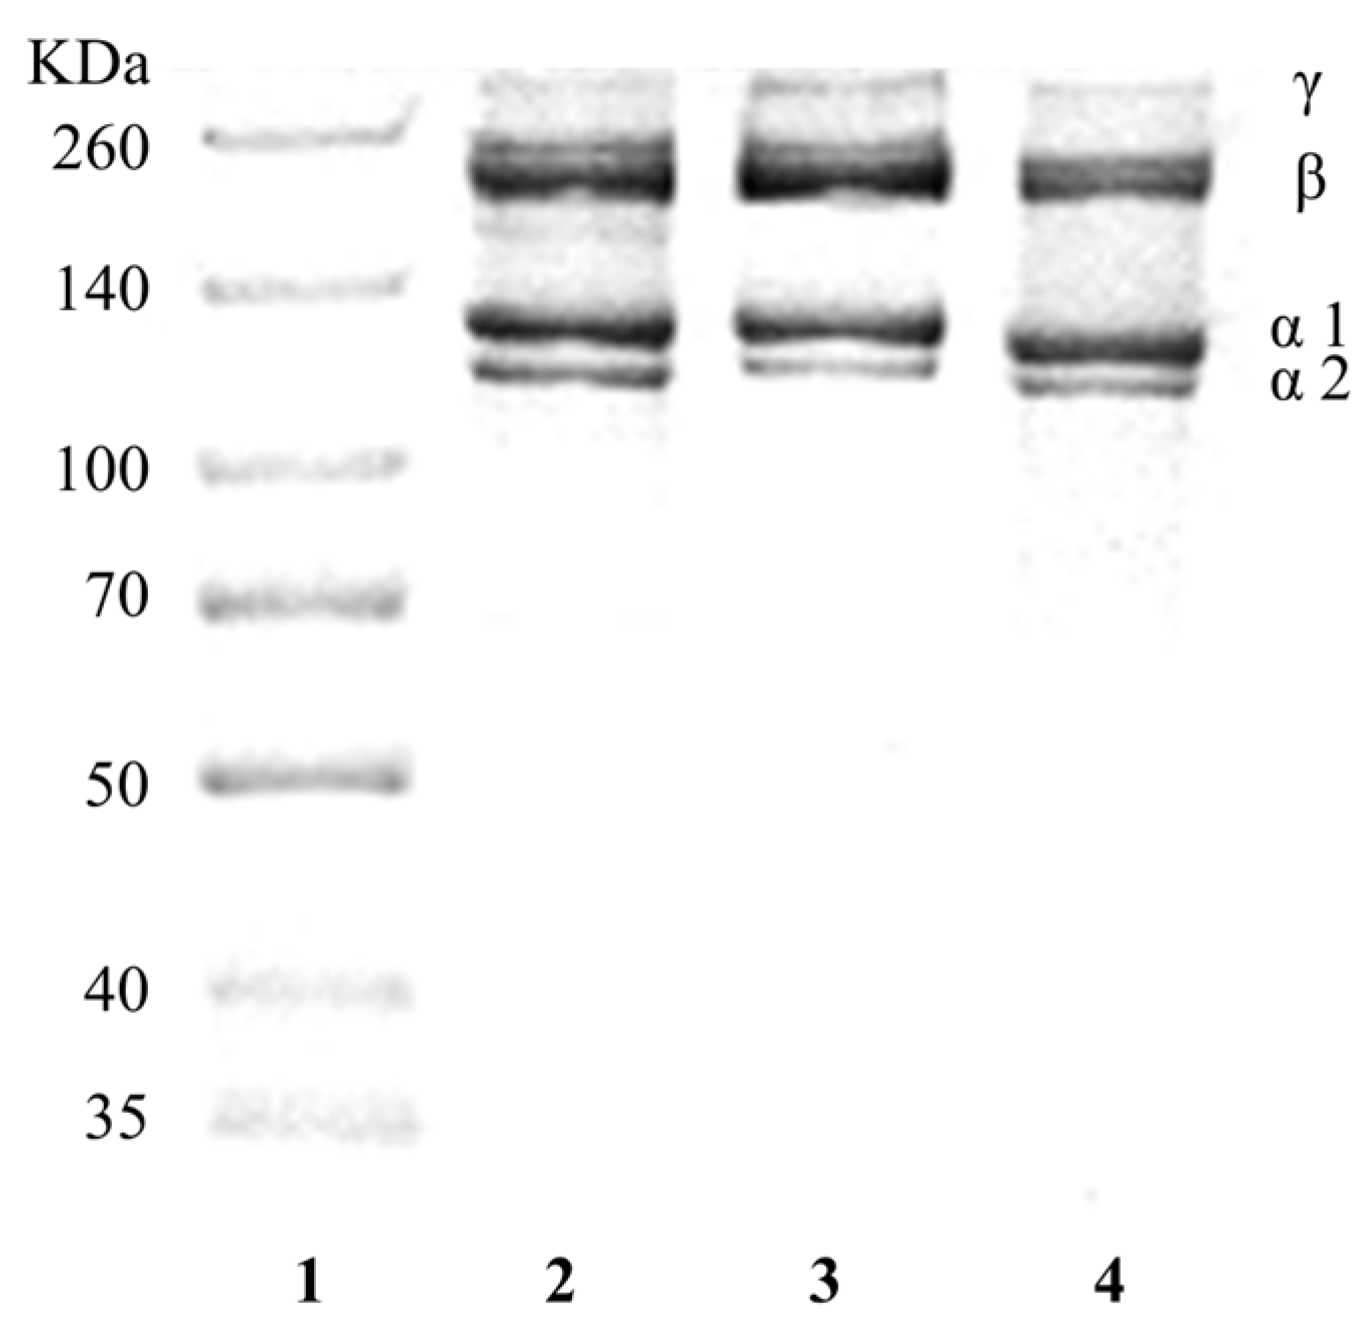
3.2.3. UV
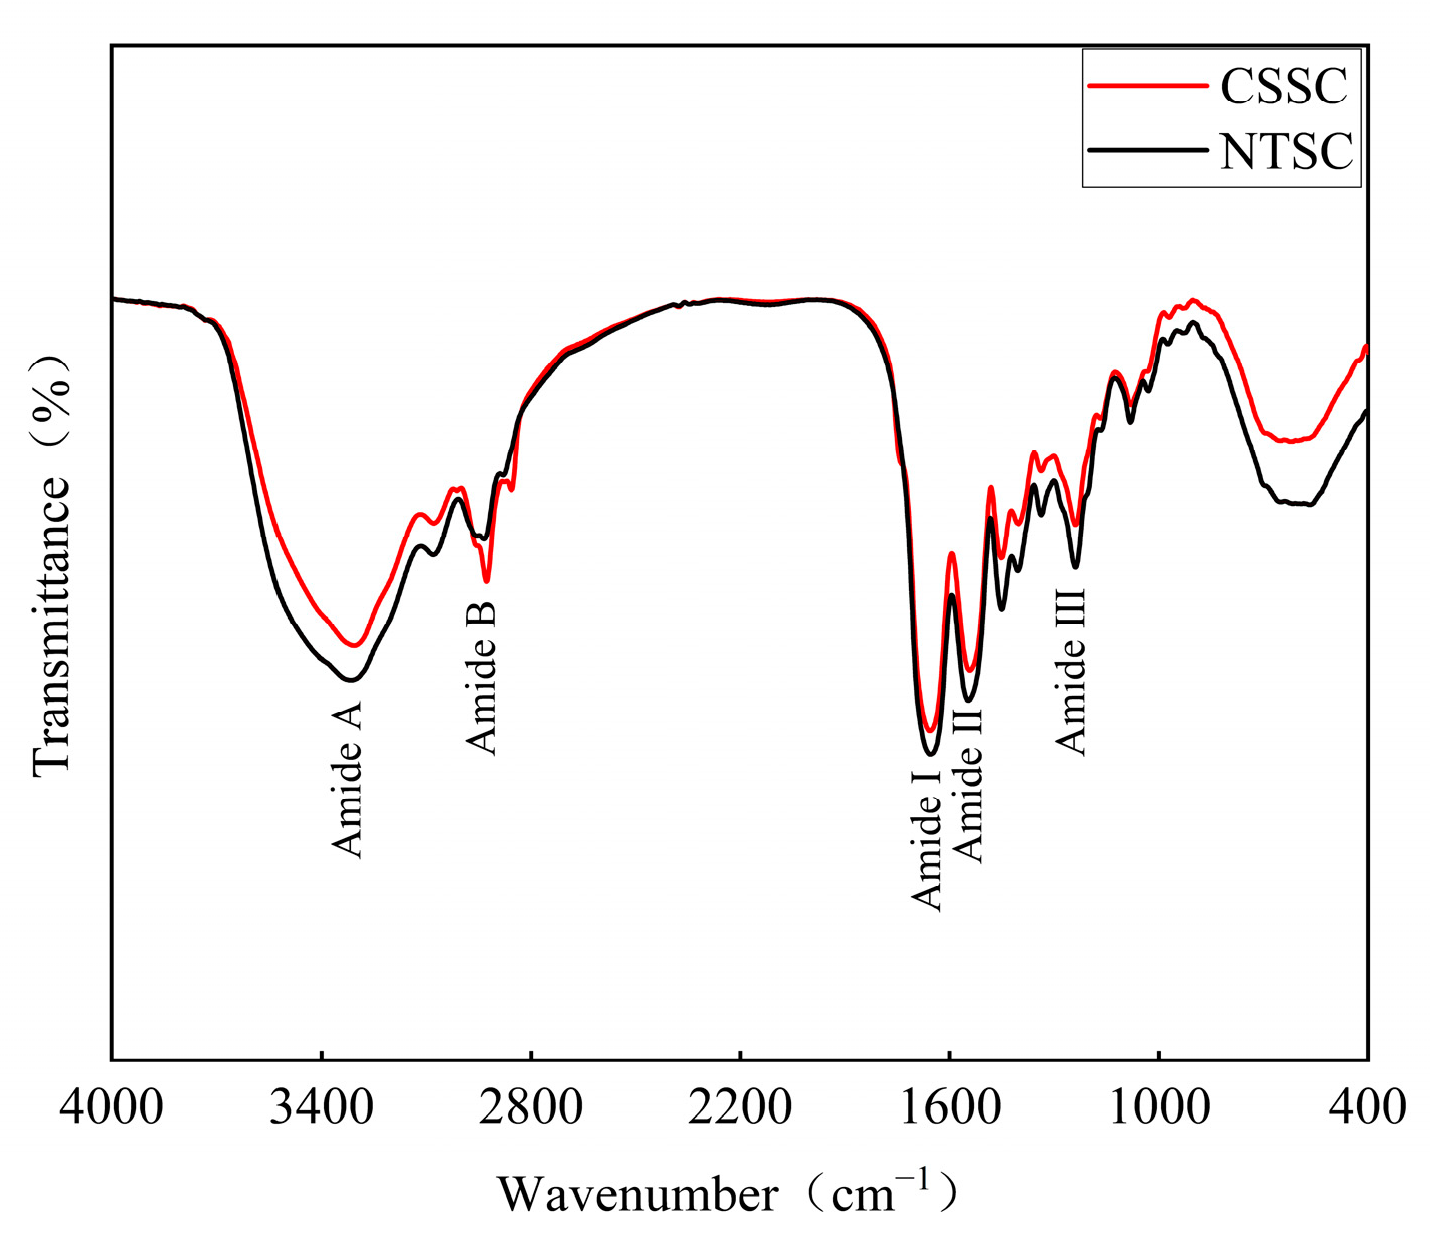
3.2.4. FTIR
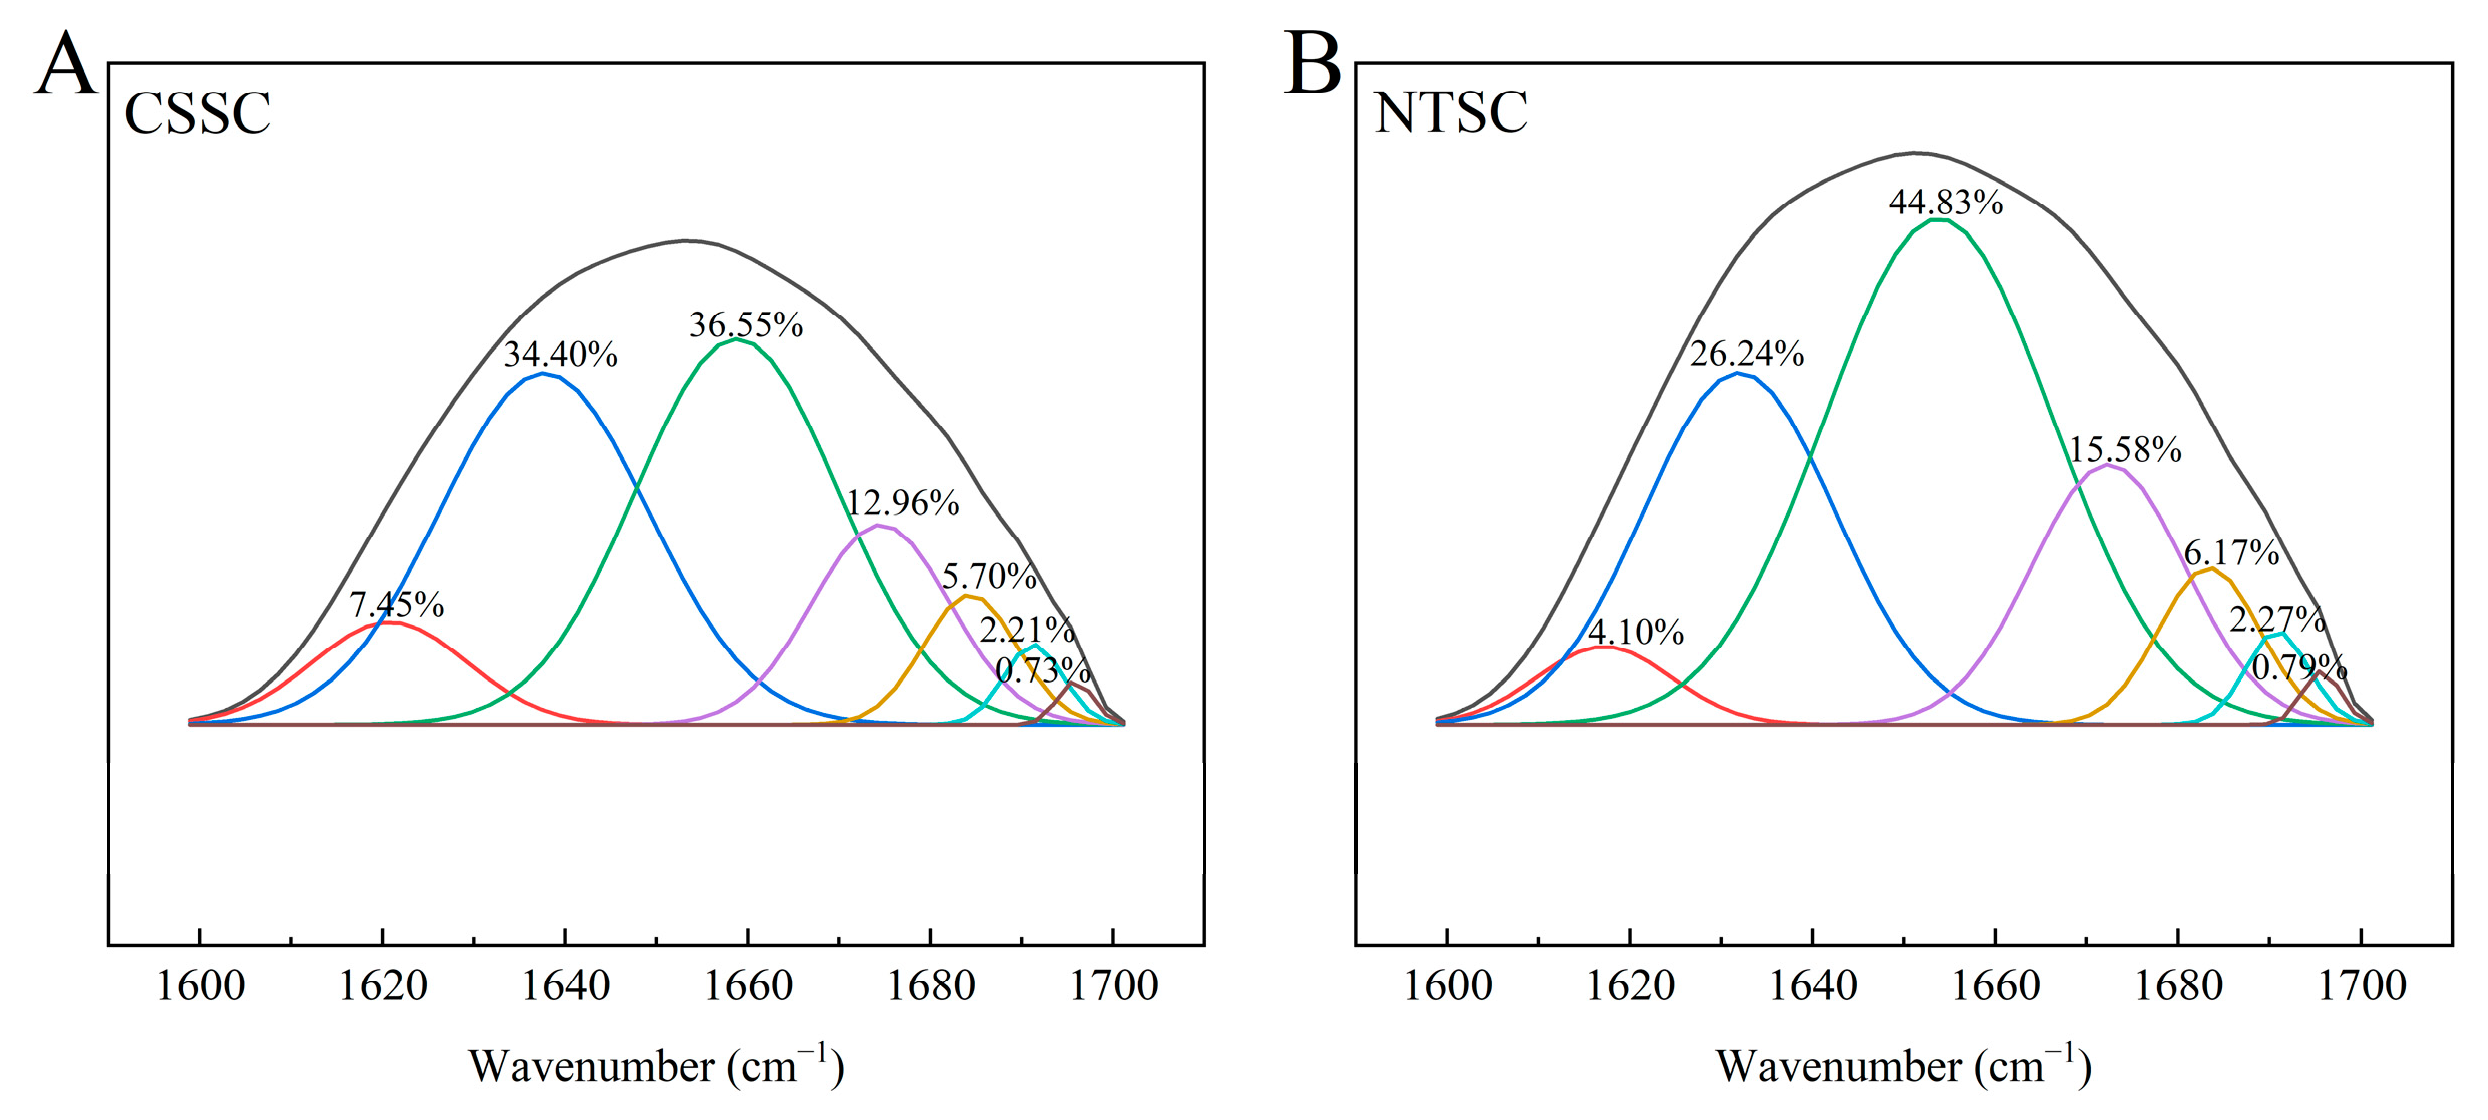
3.2.5. FTIR Spectral Curve Fitting
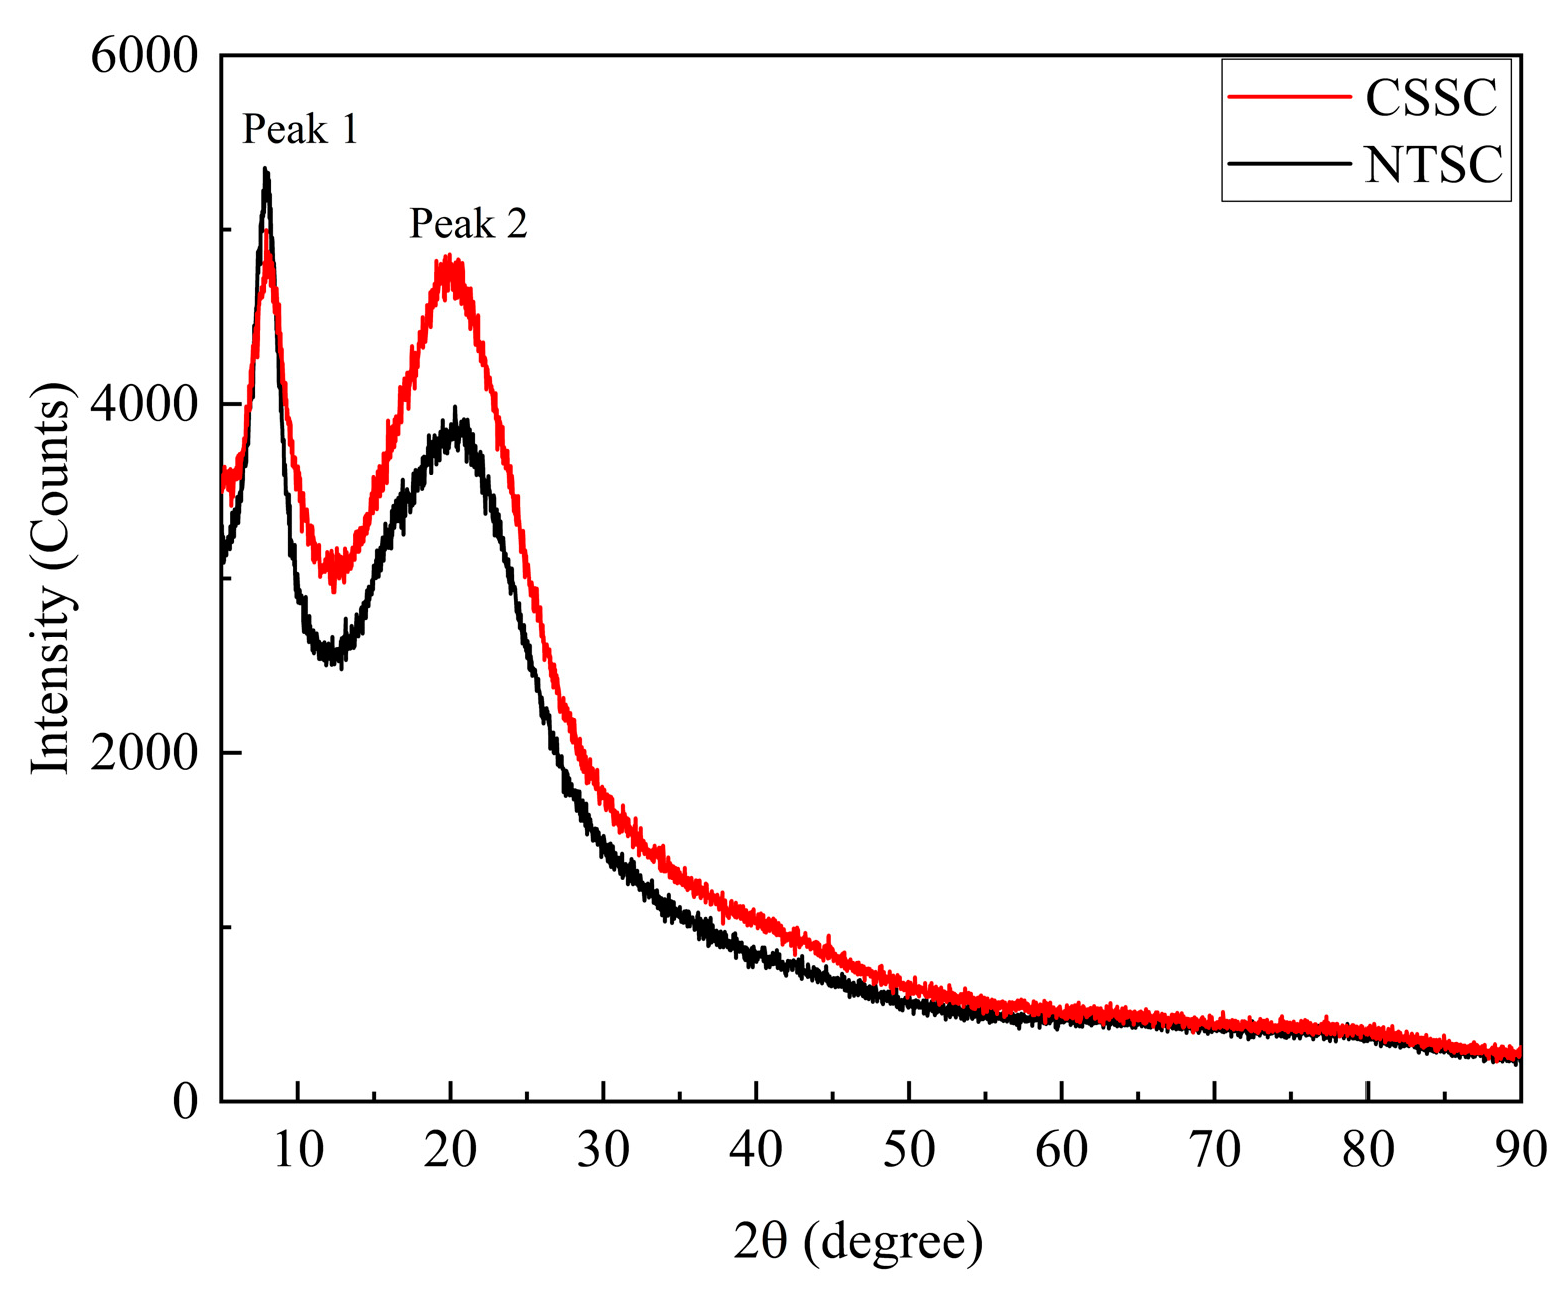
3.2.6. XRD
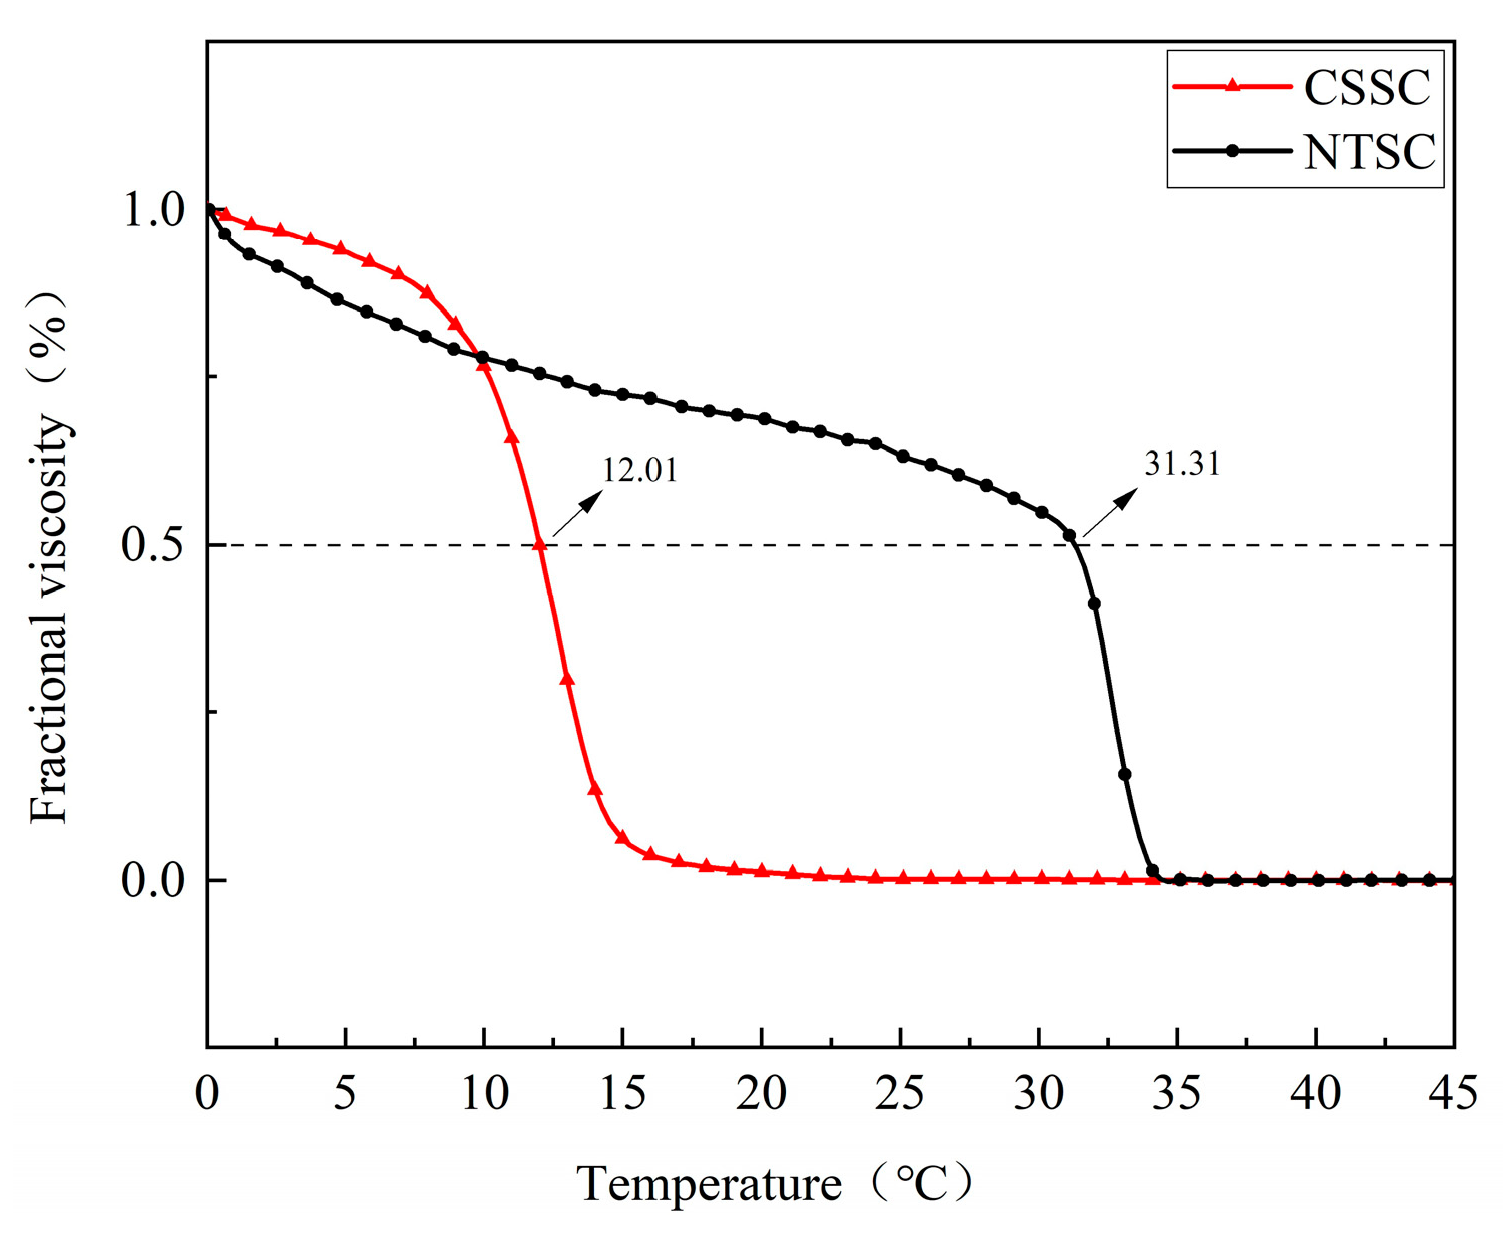
3.3. Td
3.4. Rheological Properties
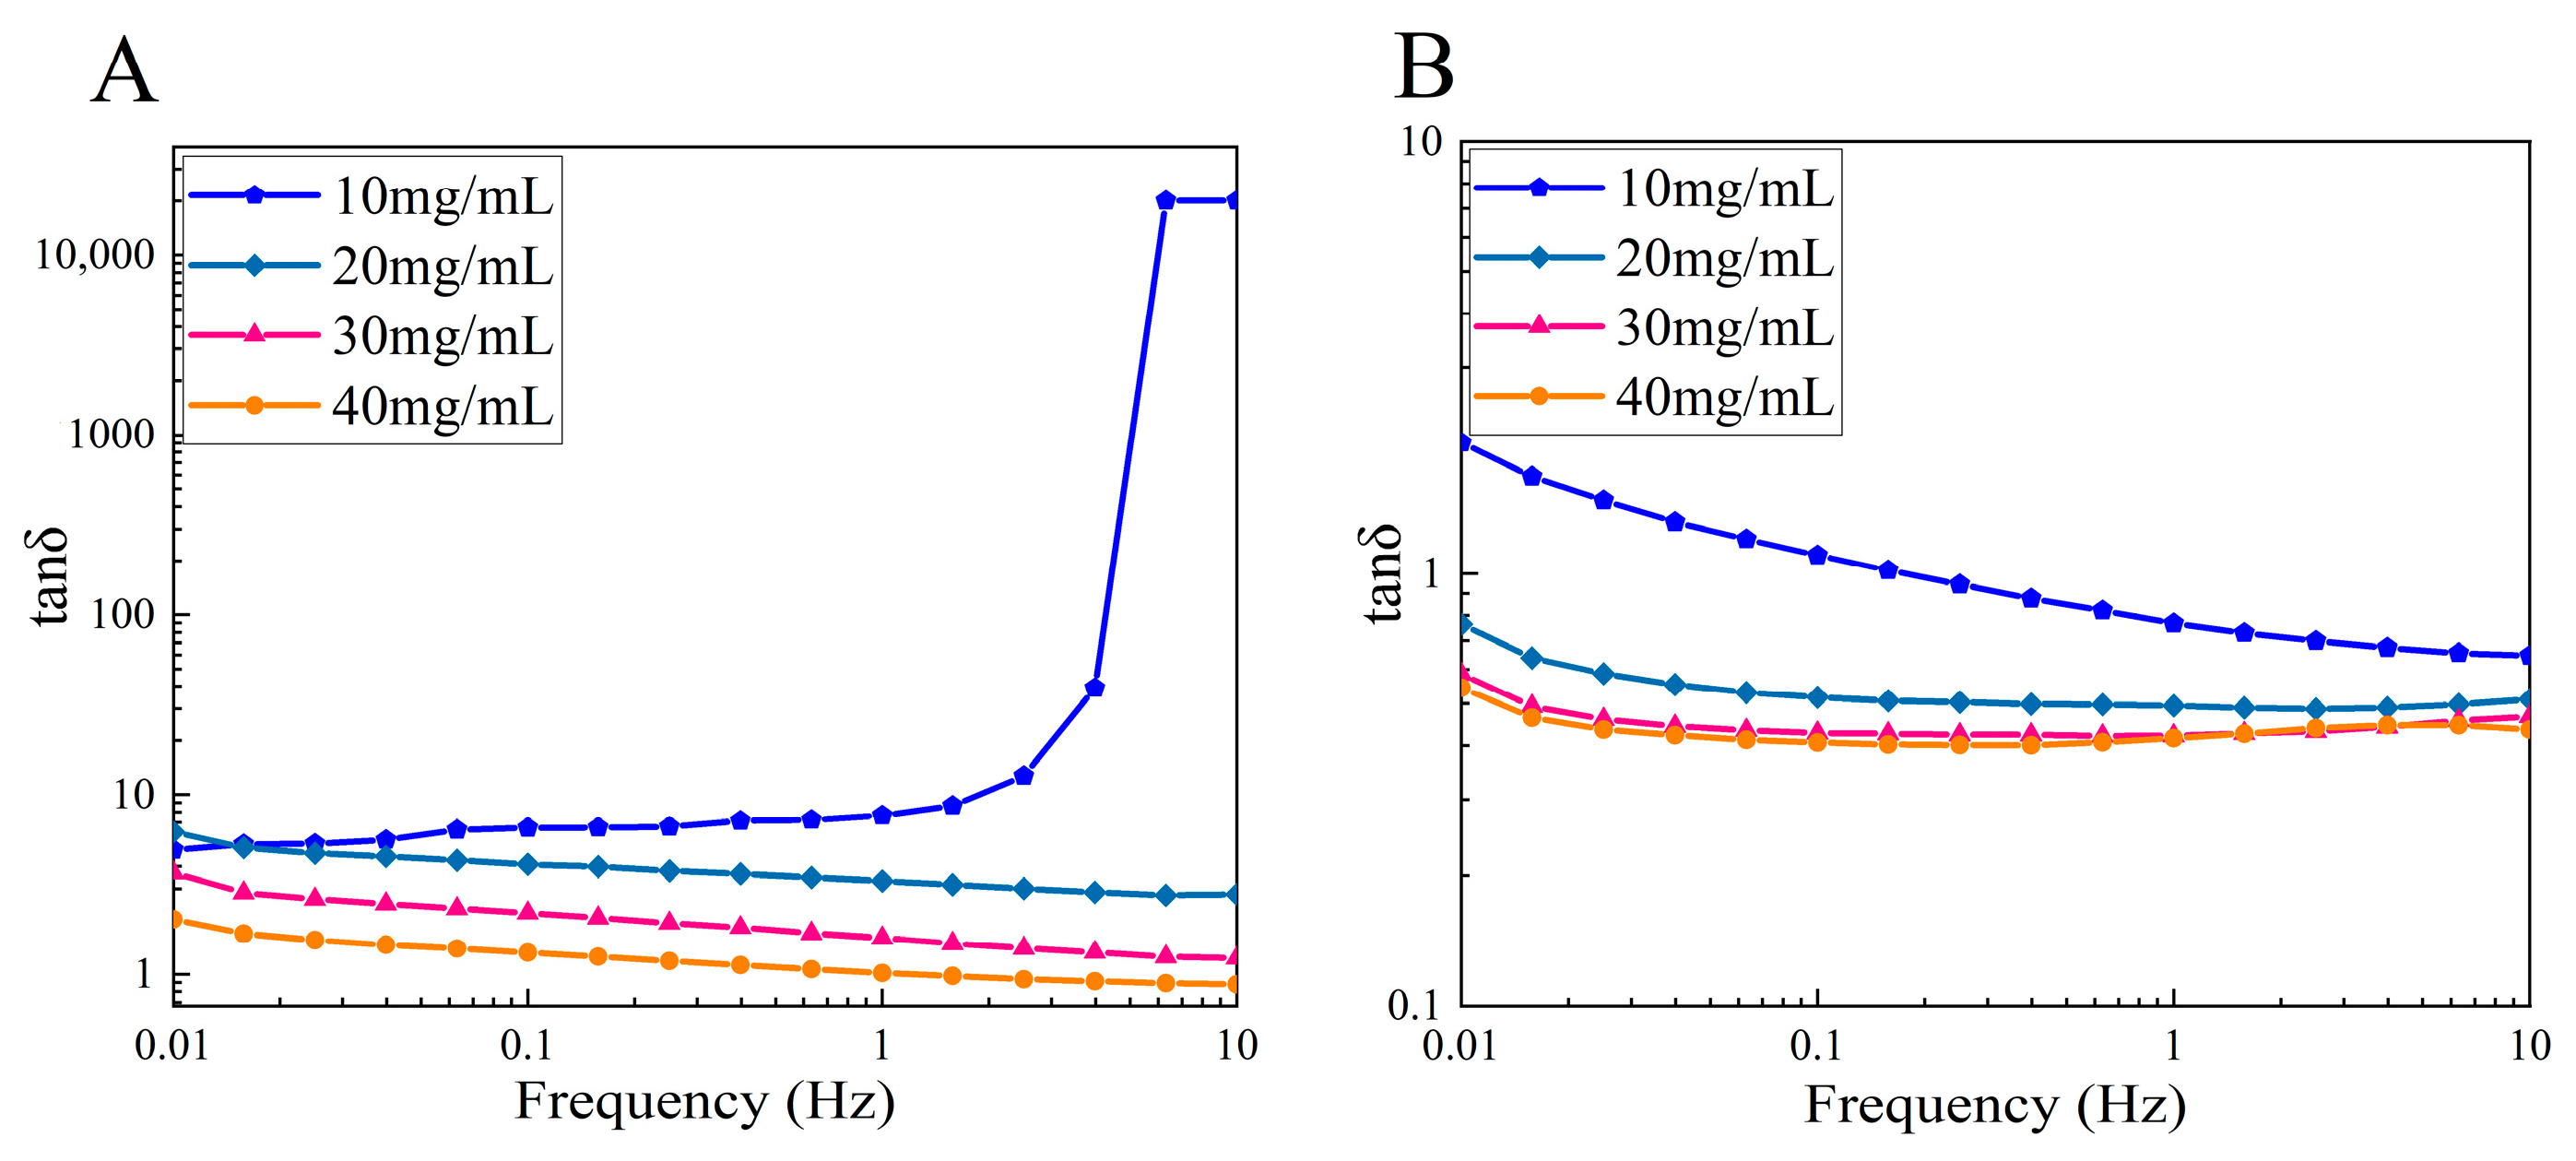
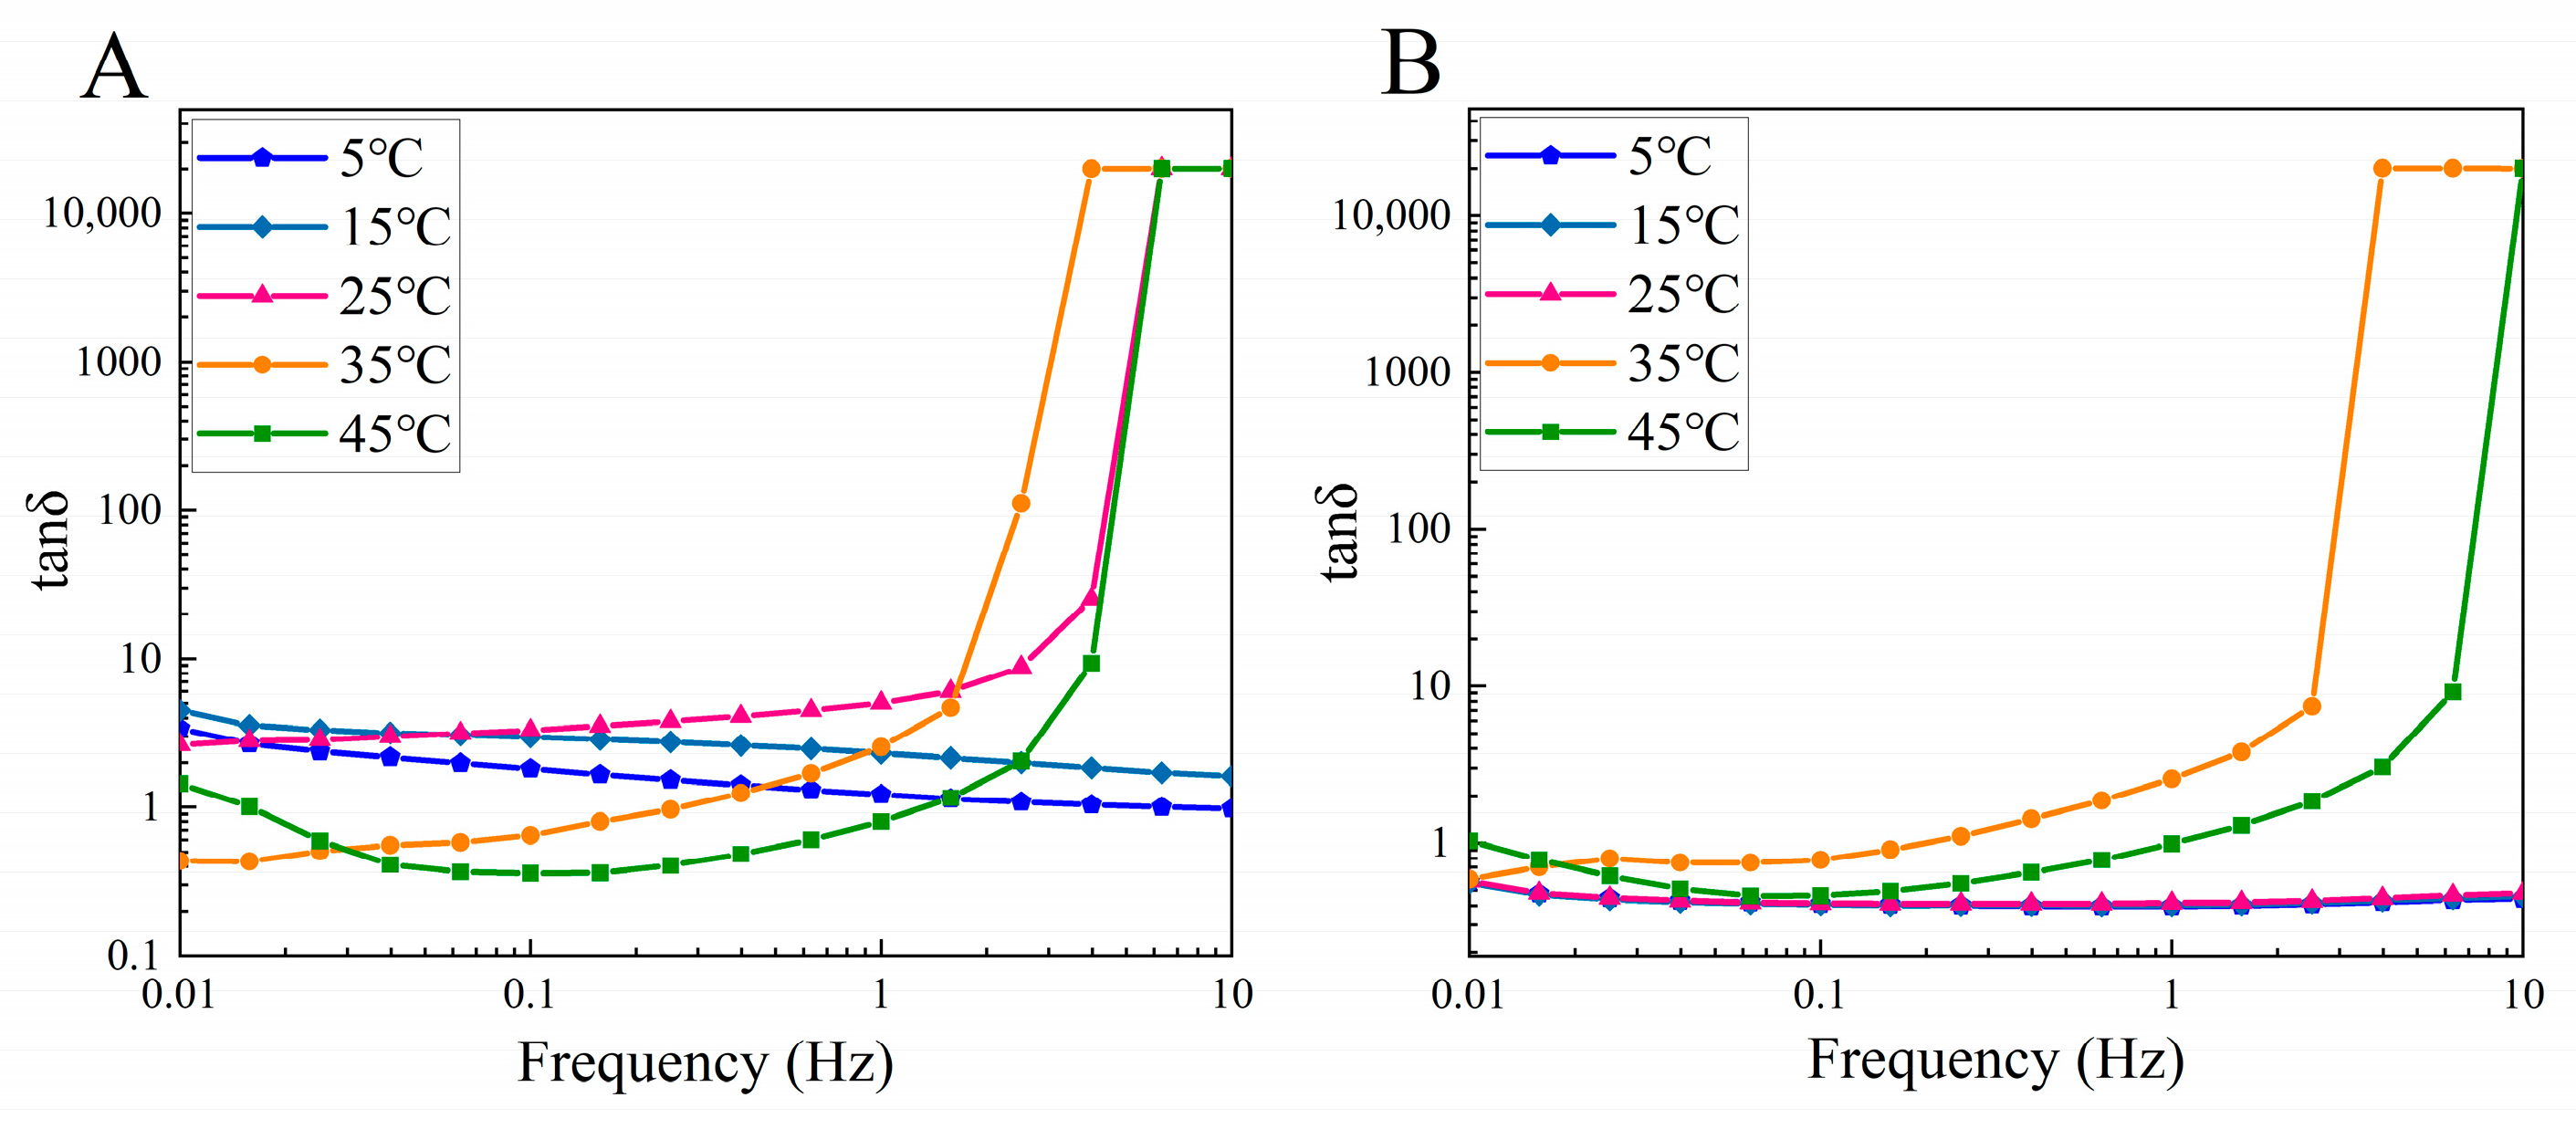
3.4.1. Dynamic Frequency Sweep Tests
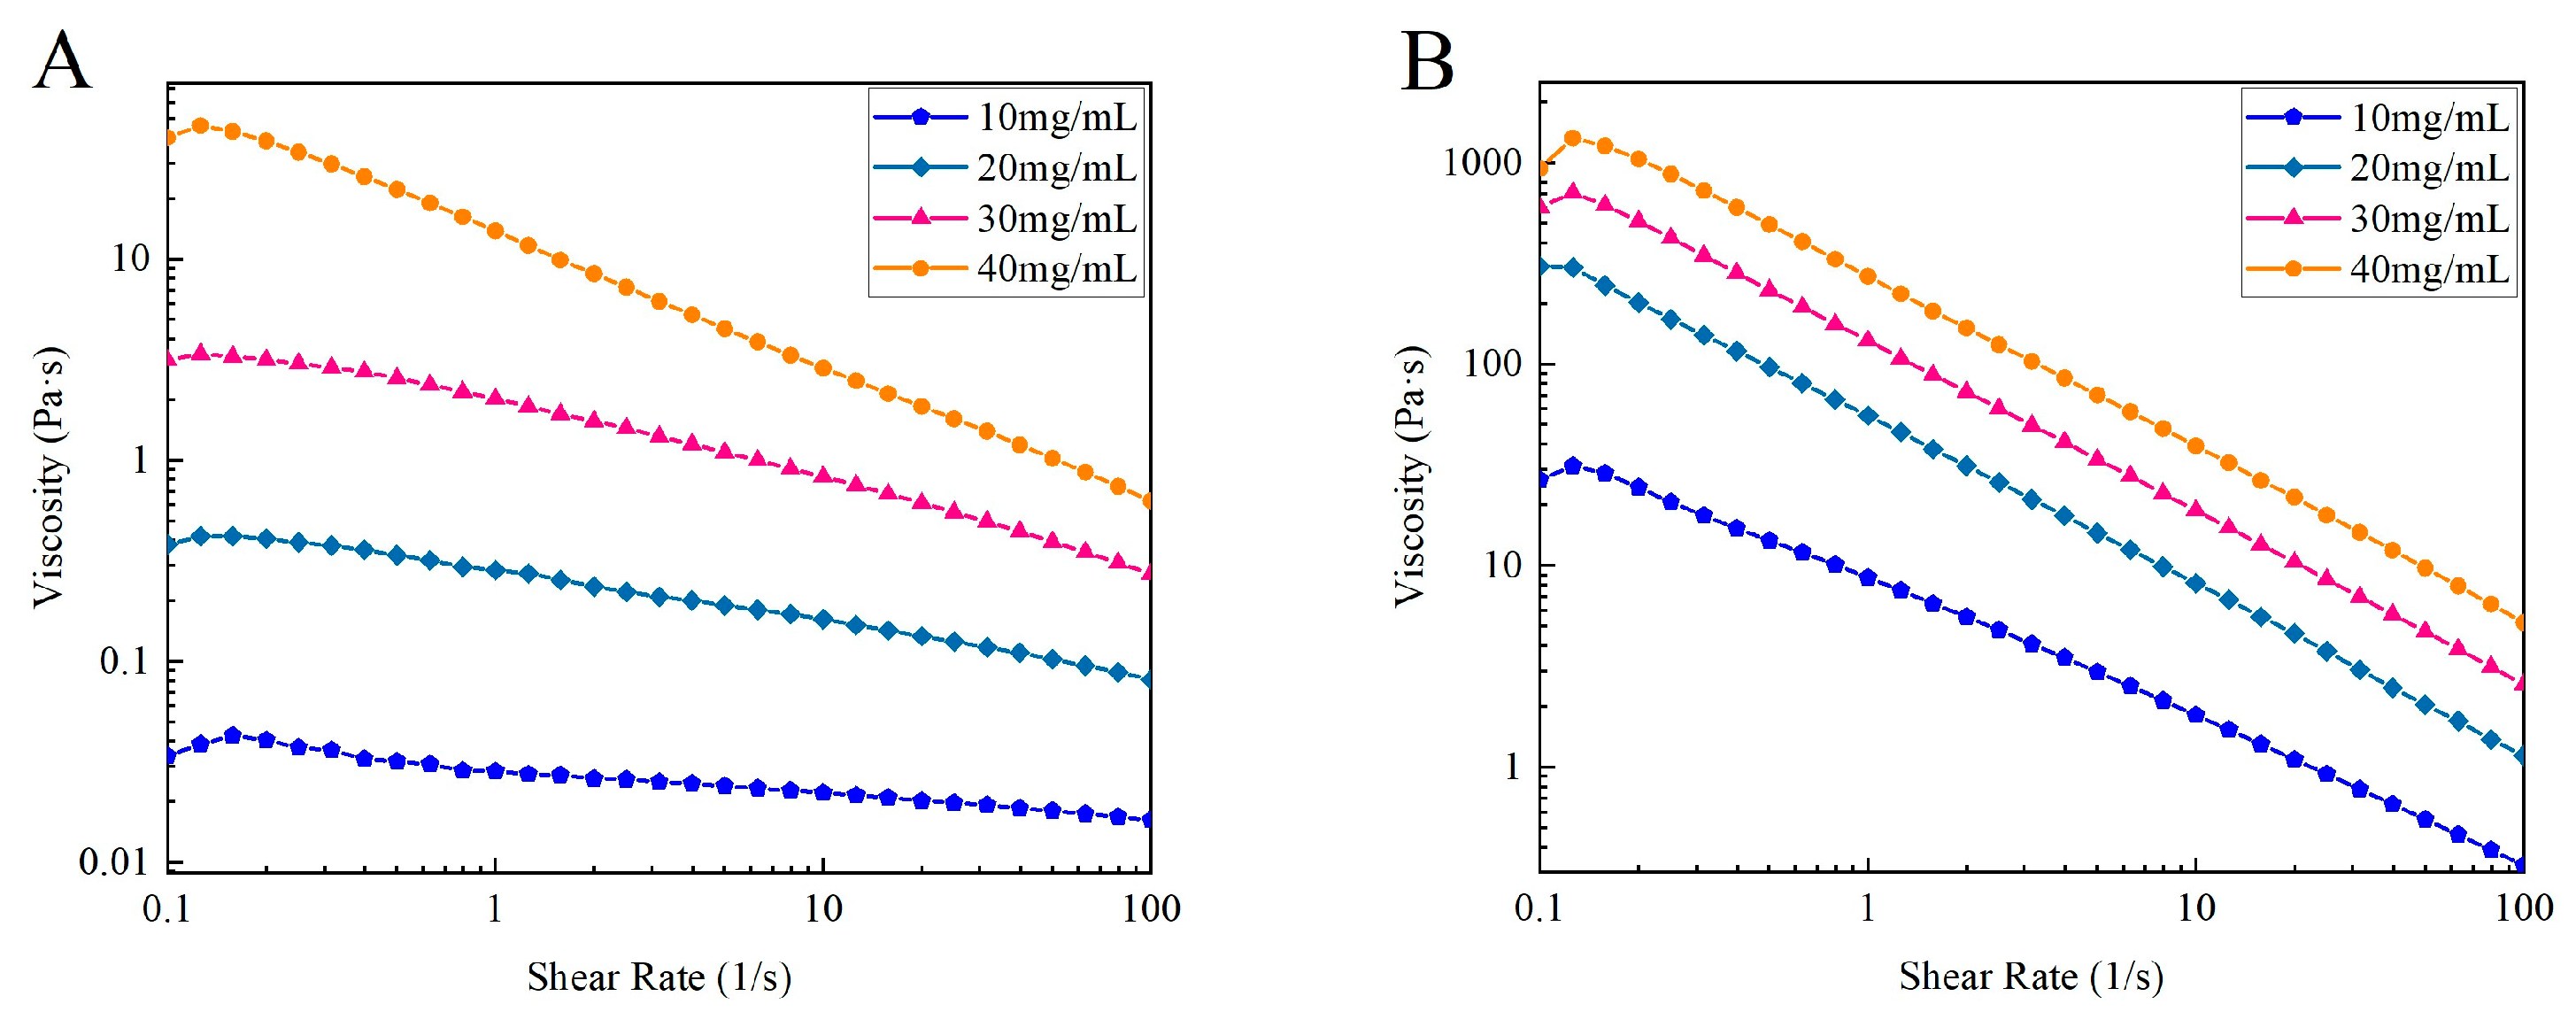
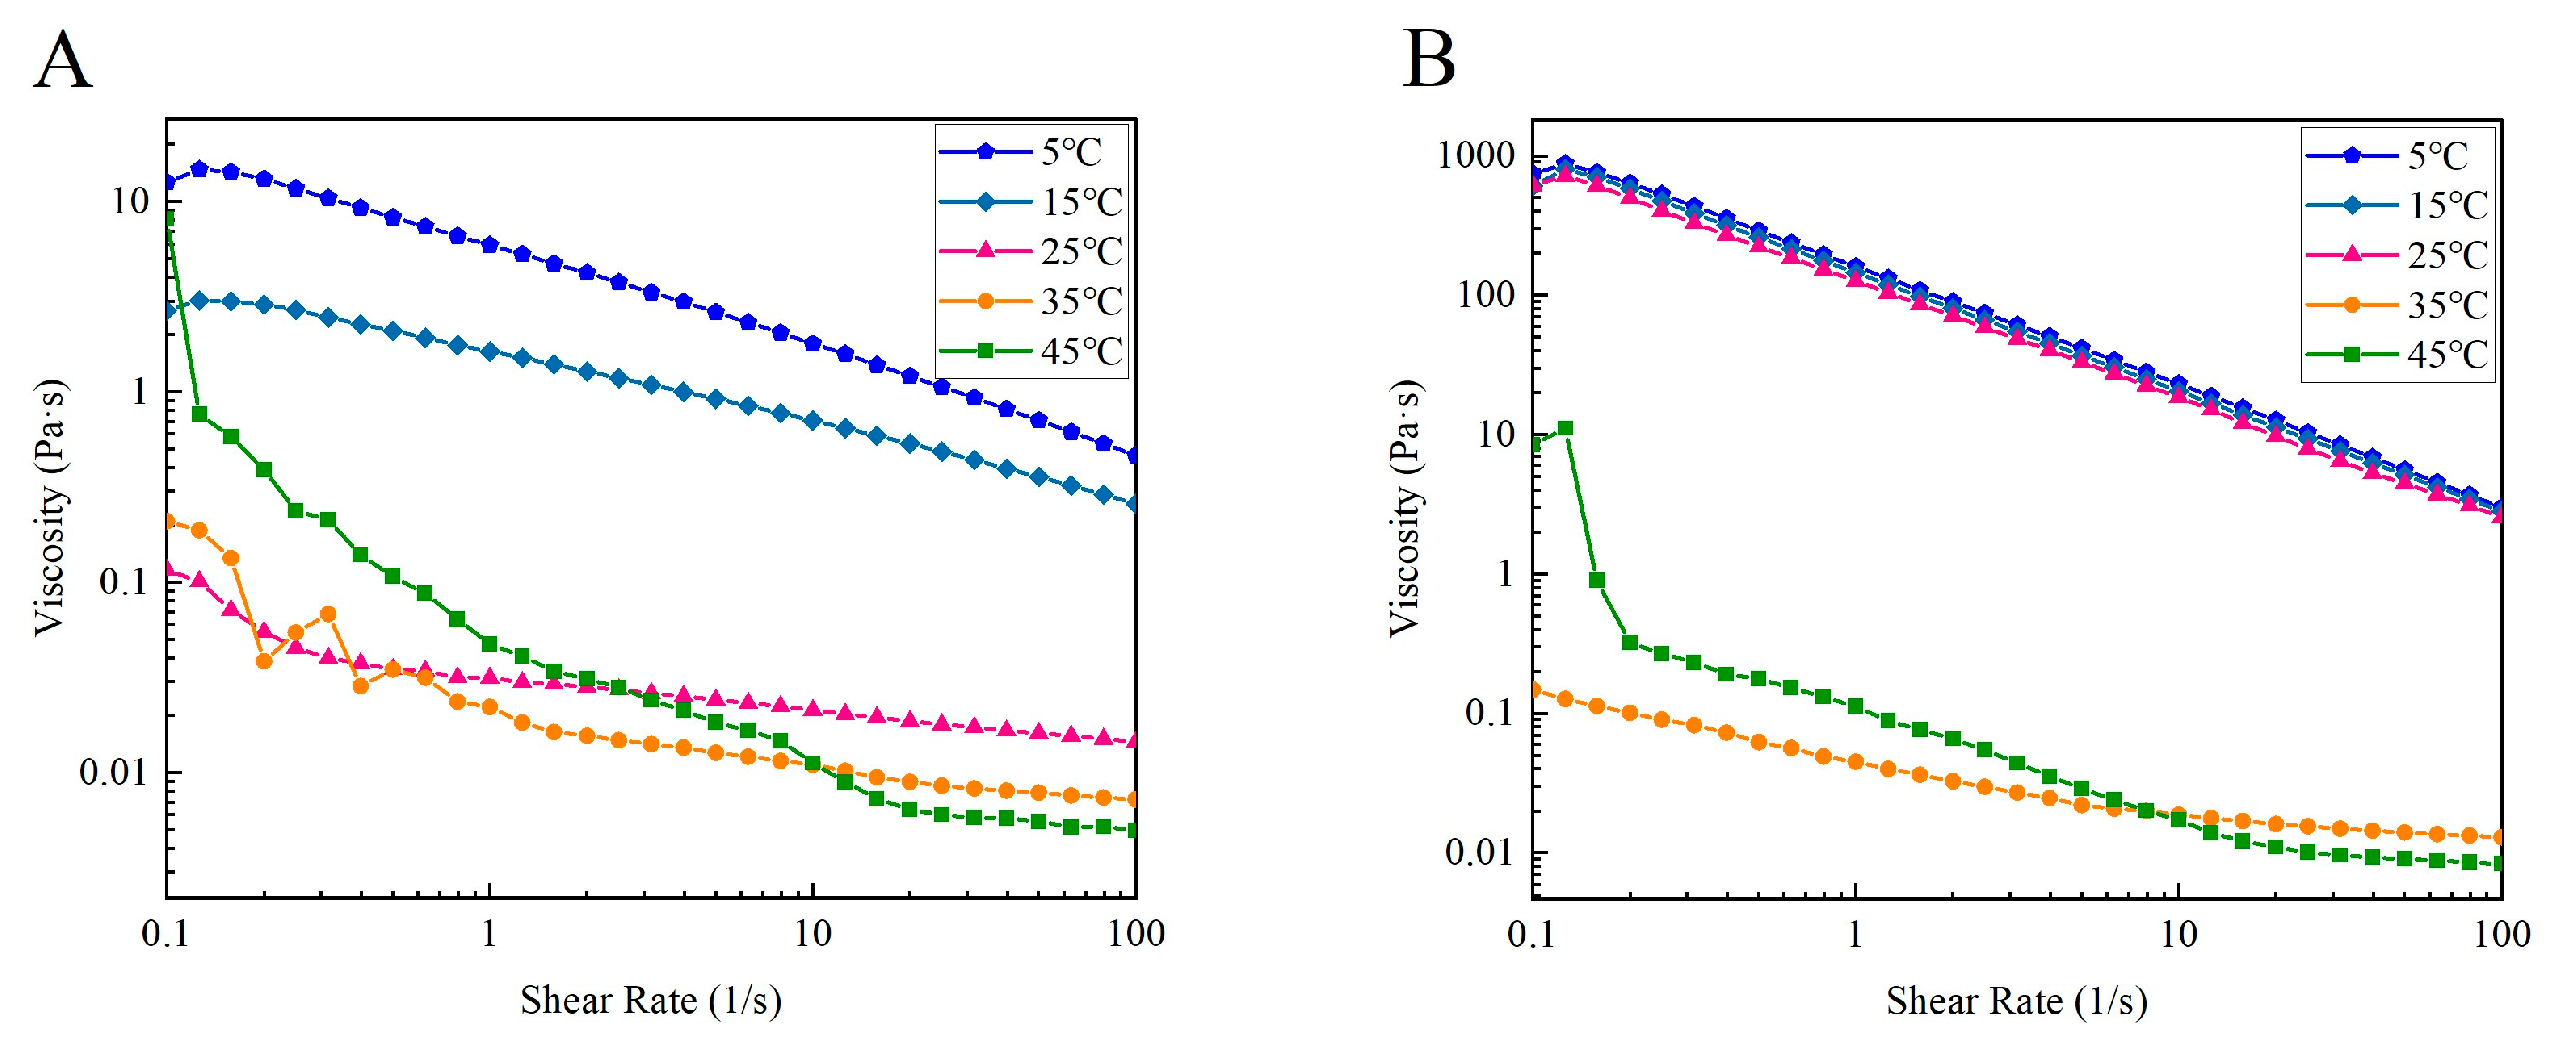
3.4.2. Steady Shear Tests
3.5. Functional Properties
3.5.1. WHC
3.5.2. OHC
3.5.3. FC and FS
3.5.4. EAI and ESI
4. Conclusions
Supplementary Materials
Author Contributions
Funding
Institutional Review Board Statement
Informed Consent Statement
Data Availability Statement
Conflicts of Interest
References
- Huang, J.Y.; Wong, T.Y.; Tu, T.Y.; Tang, M.J.; Lin, H.H.; Hsueh, Y.Y. Assessment of Tilapia Skin Collagen for Biomedical Research Applications in Comparison with Mammalian Collagen. Molecules 2024, 29, 402. [Google Scholar] [CrossRef]
- Atef, M.; Ojagh, S.M.; Latifi, A.M.; Esmaeili, M.; Udenigwe, C.C. Biochemical and Structural Characterization of Sturgeon Fish Skin Collagen (Huso huso). J. Food Biochem. 2020, 44, e13256. [Google Scholar] [CrossRef] [PubMed]
- Tang, C.; Zhou, K.; Zhu, Y.C.; Zhang, W.D.; Xie, Y.; Wang, Z.M.; Zhou, H.; Yang, T.T.; Zhang, Q.; Xu, B.C. Collagen and Its Derivatives: From Structure and Properties to Their Applications in Food Industry. Food Hydrocoll. 2022, 131, 107748. [Google Scholar] [CrossRef]
- Li, Z.R.; Wang, B.; Chi, C.F.; Zhang, Q.H.; Gong, Y.D.; Tang, J.J.; Luo, H.Y.; Ding, G.F. Isolation and Characterization of Acid Soluble Collagens and Pepsin Soluble Collagens from the Skin and Bone of Spanish Mackerel (Scomberomorous niphonius). Food Hydrocoll. 2013, 31, 103–113. [Google Scholar] [CrossRef]
- Jia, Y.J.; Wang, H.B.; Wang, H.Y.; Li, Y.Y.; Wang, M.; Zhou, J. Biochemical Properties of Skin Collagens Isolated from Black Carp (Mylopharyngodon piceus). Food Sci. Biotechnol. 2012, 21, 1585–1592. [Google Scholar] [CrossRef]
- Li, X.M.; Deng, Y.; Qiu, W.Q.; Feng, Y.H.; Jin, Y.S.; Deng, S.G.; Tao, N.P.; Jin, Y.Z. Alteration of Collagen Thermal Denaturation, Structural and the Abrogation of Allergenicity in Eel Skin Induced by Ohmic Heating. Food Chem. 2022, 391, 133272. [Google Scholar] [CrossRef] [PubMed]
- Tang, L.L.; Chen, S.L.; Su, W.J.; Weng, W.J.; Osako, K.; Tanaka, M. Physicochemical Properties and Film-Forming Ability of Fish Skin Collagen Extracted from Different Freshwater Species. Process Biochem. 2015, 50, 148–155. [Google Scholar] [CrossRef]
- Akita, M.; Nishikawa, Y.; Shigenobu, Y.; Ambe, D.; Morita, T.; Morioka, K.; Adachi, K. Correlation of Proline, Hydroxyproline and Serine Content, Denaturation Temperature and Circular Dichroism Analysis of Type I Collagen with the Physiological Temperature of Marine Teleosts. Food Chem. 2020, 329, 126775. [Google Scholar] [CrossRef] [PubMed]
- Yoon, S.; Watanabe, E.; Ueno, H.; Kishi, M.J. Potential Habitat for Chum Salmon (Oncorhynchus keta) in the Western Arctic Based on a Bioenergetics Model Coupled with a Three-Dimensional Lower Trophic Ecosystem Model. Prog. Oceanogr. 2015, 131, 146–158. [Google Scholar] [CrossRef]
- North Pacific Anadromous Fish Commission. Available online: https://www.npafc.org/statistics/ (accessed on 12 April 2024).
- Lee, J.K.; Jeon, J.K.; Byun, H.G. Antihypertensive Effect of Novel Angiotensin I Converting Enzyme Inhibitory Peptide from Chum Salmon (Oncorhynchus keta) Skin in Spontaneously Hypertensive Rats. J. Funct. Foods 2014, 7, 381–389. [Google Scholar] [CrossRef]
- El Asely, A.M.; Reda, R.M.; Salah, A.S.; Mahmoud, M.A.; Dawood, M.A.O. Overall Performances of Nile Tilapia (Oreochromis niloticus) Associated with Using Vegetable Oil Sources under Suboptimal Temperature. Aquacult. Nutr. 2020, 26, 1154–1163. [Google Scholar] [CrossRef]
- Lin, S.T.; Hu, X.; Li, L.H.; Yang, X.Q.; Chen, S.J.; Wu, Y.Y.; Yang, S.L. Preparation, Purification and Identification of Iron-Chelating Peptides Derived from Tilapia (Oreochromis niloticus) Skin Collagen and Characterization of the Peptide-Iron Complexes. LWT-Food Sci. Technol. 2021, 149, 111796. [Google Scholar] [CrossRef]
- Gaikwad, S.; Kim, M.J. Fish By-Product Collagen Extraction Using Different Methods and Their Application. Mar. Drugs 2024, 22, 60. [Google Scholar] [CrossRef] [PubMed]
- Patil, U.; Nilsuwan, K.; Benjakul, S. Functional Ingredients from Seafood Processing Wastes: Protein Hydrolysate and Biocalcium. Turk. J. Fish. Aquat. Sci. 2024, 24, 25347. [Google Scholar] [CrossRef]
- Chen, J.D.; Li, L.; Yi, R.Z.; Xu, N.H.; Gao, R.; Hong, B.H. Extraction and Characterization of Acid-Soluble Collagen from Scales and Skin of Tilapia (Oreochromis niloticus). LWT-Food Sci. Technol. 2016, 66, 453–459. [Google Scholar] [CrossRef]
- Gao, X.Y.; He, J.L.; Chen, J.D.; Zheng, Y.; Li, Y.S.; Ye, T. Double-Spotted Pufferfish (Takifugu bimaculatus) Skin Collagen: Preparation, Structure, Cytocompatibility, Rheological, and Functional Properties. Arab. J. Chem. 2023, 16, 104402. [Google Scholar] [CrossRef]
- Li, Y.S.; Yang, L.H.; Wu, S.J.; Chen, J.D.; Lin, H.W. Structural, Functional, Rheological, and Biological Properties of the Swim Bladder Collagen Extracted from Grass Carp (Ctenopharyngodon idella). LWT-Food Sci. Technol. 2022, 153, 112518. [Google Scholar] [CrossRef]
- Zheng, T.T.; Tang, P.P.; Shen, L.R.; Bu, H.H.; Li, G.Y. Rheological Behavior of Collagen/Chitosan Blended Solutions. J. Appl. Polym. Sci. 2021, 138, 50840. [Google Scholar] [CrossRef]
- Chandi, G.K.; Sogi, D.S. Functional Properties of Rice Bran Protein Concentrates. J. Food Eng. 2007, 79, 592–597. [Google Scholar] [CrossRef]
- Çelik, M.; Güzel, M.; Yildirim, M. Effect of pH on Protein Extraction from Sour Cherry Kernels and Functional Properties of Resulting Protein Concentrate. J. Food Sci. Technol. 2019, 56, 3023–3032. [Google Scholar] [CrossRef]
- Chen, J.D.; Li, J.Y.; Li, Z.B.; Yi, R.Z.; Shi, S.J.; Wu, K.Y.; Li, Y.S.; Wu, S.J. Physicochemical and Functional Properties of Type I Collagens in Red Stingray (Dasyatis akajei) Skin. Mar. Drugs 2019, 17, 558. [Google Scholar] [CrossRef] [PubMed]
- Heidari, M.G.; Rezaei, M. Extracted Pepsin of Trout Waste and Ultrasound-Promoted Method for Green Recovery of Fish Collagen. Sustain. Chem. Pharm. 2022, 30, 100854. [Google Scholar] [CrossRef]
- Yu, D.; Chi, C.F.; Wang, B.; Ding, G.F.; Li, Z.R. Characterization of Acid-and Pepsin-Soluble Collagens from Spines and Skulls of Skipjack Tuna (Katsuwonus pelamis). Chin. J. Nat. Med. 2014, 12, 712–720. [Google Scholar] [CrossRef] [PubMed]
- Chen, S.J.; Hong, Z.; Wen, H.M.; Hong, B.H.; Lin, R.R.; Chen, W.Z.; Xie, Q.N.; Le, Q.Q.; Yi, R.Z.; Wu, H. Compositional and Structural Characteristics of Pepsin-Soluble Type I Collagen from the Scales of Red Drum Fish, Sciaenops Ocellatus. Food Hydrocoll. 2022, 123, 107111. [Google Scholar] [CrossRef]
- Kleinnijenhuis, A.J.; Van Holthoon, F.L. Domain-Specific Proteogenomic Analysis of Collagens to Evaluate De Novo Sequencing Results and Database Information. J. Mol. Evol. 2018, 86, 293–302. [Google Scholar] [CrossRef] [PubMed]
- Faralizadeh, S.; Rahimabadi, E.Z.; Bahrami, S.H.; Hasannia, S. Extraction, Characterization and Biocompatibility Evaluation of Silver Carp (Hypophthalmichthys molitrix) Skin Collagen. Sustain. Chem. Pharm. 2021, 22, 100454. [Google Scholar] [CrossRef]
- Smith, D.W.; Sandberg, L.B.; Leslie, B.H.; Wolt, T.B.; Minton, S.T.; Myers, B.; Rucker, R.B. Primary Structure of a Chick Tropoelastin Peptide: Evidence for a Collagen-like Amino Acid Sequence. Biochem. Biophys. Res. Commun. 1981, 103, 880–885. [Google Scholar] [CrossRef] [PubMed]
- Badii, F.; Howell, N.K. Fish Gelatin: Structure, Gelling Properties and Interaction with Egg Albumen Proteins. Food Hydrocoll. 2006, 20, 630–640. [Google Scholar] [CrossRef]
- Bhuimbar, M.V.; Bhagwat, P.K.; Dandge, P.B. Extraction and Characterization of Acid Soluble Collagen from Fish Waste: Development of Collagen-Chitosan Blend as Food Packaging Film. J. Environ. Chem. Eng. 2019, 7, 102983. [Google Scholar] [CrossRef]
- Sun, L.L.; Li, B.F.; Song, W.K.; Si, L.L.; Hou, H. Characterization of Pacific Cod (Gadus macrocephalus) Skin Collagen and Fabrication of Collagen Sponge as a Good Biocompatible Biomedical Material. Process Biochem. 2017, 63, 229–235. [Google Scholar] [CrossRef]
- Bi, C.H.; Li, X.H.; Xin, Q.; Han, W.; Shi, C.P.; Guo, R.H.; Shi, W.Z.; Qiao, R.R.; Wang, X.C.; Zhong, J. Effect of Extraction Methods on the Preparation of Electrospun/Electrosprayed Microstructures of Tilapia Skin Collagen. J. Biosci. Bioeng. 2019, 128, 234–240. [Google Scholar] [CrossRef]
- Xu, J.; Chen, Z.J.; Han, D.; Li, Y.Y.; Sun, X.T.; Wang, Z.J.; Jin, H. Structural and Functional Properties Changes of β-Conglycinin Exposed to Hydroxyl Radical-Generating Systems. Molecules 2017, 22, 1893. [Google Scholar] [CrossRef]
- Ciarlo, A.S.; Paredi, M.E.; Fraga, A.N. Isolation of Soluble Collagen from Hake Skin (Merluccius hubbsi). J. Aquat. Food Prod. Technol. 1997, 6, 65–77. [Google Scholar] [CrossRef]
- Rose, C.; Kumar, M.; Mandal, A.B. A Study of the Hydration and Thermodynamics of Warm-Water and Cold-Water Fish Collagens. Biochem. J. 1988, 249, 127–133. [Google Scholar] [CrossRef]
- Karim, A.A.; Bhat, R. Fish Gelatin: Properties, Challenges, and Prospects as an Alternative to Mammalian Gelatins. Food Hydrocoll. 2009, 23, 563–576. [Google Scholar] [CrossRef]
- Pan, H.; Zhang, X.H.; Ni, J.B.; Liang, Q.Q.; Jiang, X.; Zhou, Z.H.; Shi, W.Z. Effects of Ultrasonic Power on the Structure and Rheological Properties of Skin Collagen from Albacore (Thunnus alalunga). Mar. Drugs 2024, 22, 84. [Google Scholar] [CrossRef] [PubMed]
- Sobanwa, M.; Foster, T.J.; Yakubov, G.; Watson, N.J. How Hydrocolloids Can Control the Viscoelastic Properties of Acid-Swollen Collagen Pastes. Food Hydrocoll. 2022, 126, 107486. [Google Scholar] [CrossRef]
- Sionkowska, A.; Lewandowska, K.; Adamiak, K. The Influence of UV Light on Rheological Properties of Collagen Extracted from Silver Carp Skin. Materials 2020, 13, 4453. [Google Scholar] [CrossRef] [PubMed]
- Dhakal, D.; Koomsap, P.; Lamichhane, A.; Sadiq, M.B.; Anal, A.K. Optimization of Collagen Extraction from Chicken Feet by Papain Hydrolysis and Synthesis of Chicken Feet Collagen Based Biopolymeric Fibres. Food Biosci. 2018, 23, 23–30. [Google Scholar] [CrossRef]
- Li, C.H.; Liu, W.T.; Duan, L.; Tian, Z.H.; Li, G.Y. Surface Activity of Pepsin-solubilized Collagen Acylated by Lauroyl Chloride along with Succinic Anhydride. J. Appl. Polym. Sci. 2014, 131, 40174. [Google Scholar] [CrossRef]
- Lassoued, I.; Jridi, M.; Nasri, R.; Dammak, A.; Hajji, M.; Nasri, M.; Barkia, A. Characteristics and Functional Properties of Gelatin from Thornback Ray Skin Obtained by Pepsin-Aided Process in Comparison with Commercial Halal Bovine Gelatin. Food Hydrocoll. 2014, 41, 309–318. [Google Scholar] [CrossRef]
- Zou, Y.; Wang, L.; Cai, P.P.; Li, P.P.; Zhang, M.; Sun, Z.L.; Sun, C.; Xu, W.M.; Wang, D.Y. Effect of Ultrasound Assisted Extraction on the Physicochemical and Functional Properties of Collagen from Soft-Shelled Turtle Calipash. Int. J. Biol. Macromol. 2017, 105, 1602–1610. [Google Scholar] [CrossRef] [PubMed]
- Narsimhan, G.; Xiang, N. Role of Proteins on Formation, Drainage, and Stability of Liquid Food Foams. Annu. Rev. Food Sci. Technol. 2018, 9, 45–63. [Google Scholar] [CrossRef]
- Campbell, G.M.; Mougeot, E. Creation and Characterisation of Aerated Food Products. Trends Food Sci. Technol. 1999, 10, 283–296. [Google Scholar] [CrossRef]


| Sample | Concentration (mg/mL) | K | n | R2 |
|---|---|---|---|---|
| CSSC | 10 | 0.030 | 0.870 | 0.942 |
| 20 | 0.273 | 0.777 | 0.974 | |
| 30 | 1.864 | 0.693 | 0.968 | |
| 40 | 14.416 | 0.459 | 0.969 | |
| NTSC | 10 | 8.941 | 0.435 | 0.975 |
| 20 | 57.900 | 0.242 | 0.994 | |
| 30 | 148.581 | 0.301 | 0.970 | |
| 40 | 319.440 | 0.376 | 0.933 |
| Sample | Temperature (°C) | K | n | R2 |
|---|---|---|---|---|
| CSSC | 5 | 5.863 | 0.567 | 0.970 |
| 15 | 1.585 | 0.680 | 0.972 | |
| 25 | 0.036 | 0.613 | 0.810 | |
| 35 | 0.013 | −0.224 | 0.919 | |
| 45 | 0.000 | −8.575 | 0.991 | |
| NTSC | 5 | 184.941 | 0.303 | 0.969 |
| 15 | 168.724 | 0.318 | 0.951 | |
| 25 | 141.830 | 0.279 | 0.972 | |
| 35 | 0.048 | 0.533 | 0.989 | |
| 45 | 0.038 | −1.427 | 0.776 |
Disclaimer/Publisher’s Note: The statements, opinions and data contained in all publications are solely those of the individual author(s) and contributor(s) and not of MDPI and/or the editor(s). MDPI and/or the editor(s) disclaim responsibility for any injury to people or property resulting from any ideas, methods, instructions or products referred to in the content. |
© 2024 by the authors. Licensee MDPI, Basel, Switzerland. This article is an open access article distributed under the terms and conditions of the Creative Commons Attribution (CC BY) license (https://creativecommons.org/licenses/by/4.0/).
Share and Cite
Zheng, Y.; Li, Y.; Ke, C.; Gao, X.; Liu, Z.; Chen, J. Comparison of Structural and Physicochemical Characteristics of Skin Collagen from Chum Salmon (Cold-Water Fish) and Nile Tilapia (Warm-Water Fish). Foods 2024, 13, 1213. https://doi.org/10.3390/foods13081213
Zheng Y, Li Y, Ke C, Gao X, Liu Z, Chen J. Comparison of Structural and Physicochemical Characteristics of Skin Collagen from Chum Salmon (Cold-Water Fish) and Nile Tilapia (Warm-Water Fish). Foods. 2024; 13(8):1213. https://doi.org/10.3390/foods13081213
Chicago/Turabian StyleZheng, Yan, Yushuang Li, Cong Ke, Xiyuan Gao, Zhiyu Liu, and Junde Chen. 2024. "Comparison of Structural and Physicochemical Characteristics of Skin Collagen from Chum Salmon (Cold-Water Fish) and Nile Tilapia (Warm-Water Fish)" Foods 13, no. 8: 1213. https://doi.org/10.3390/foods13081213