Abstract
Integrating advanced computing techniques into food safety management has attracted significant attention recently. Machine learning (ML) algorithms offer innovative solutions for Hazard Analysis Critical Control Point (HACCP) monitoring by providing advanced data analysis capabilities and have proven to be powerful tools for assessing the safety of Animal-Source Foods (ASFs). Studies that link ML with HACCP monitoring in ASFs are limited. The present review provides an overview of ML, feature extraction, and selection algorithms employed for food safety. Several non-destructive techniques are presented, including spectroscopic methods, smartphone-based sensors, paper chromogenic arrays, machine vision, and hyperspectral imaging combined with ML algorithms. Prospects include enhancing predictive models for food safety with the development of hybrid Artificial Intelligence (AI) models and the automation of quality control processes using AI-driven computer vision, which could revolutionize food safety inspections. However, handling conceivable inclinations in AI models is vital to guaranteeing reasonable and exact hazard assessments in an assortment of nourishment generation settings. Moreover, moving forward, the interpretability of ML models will make them more straightforward and dependable. Conclusively, applying ML algorithms allows real-time monitoring and predictive analytics and can significantly reduce the risks associated with ASF consumption.
1. Introduction
Foods derived from animal sources are rich in essential micronutrients that are crucial to the human diet and difficult to obtain from a plant-based diet [1]. Animal-Source Foods (ASFs) are vulnerable to biological, chemical, and physical hazards that compromise food safety and pose risks to human and animal health [2,3]. Food supply chains require strict measures to ensure food safety [4,5,6]. Framework conditions for food security deal with these concerns by systematically identifying these concerns, adhering to legal standards and implementing risk management measures [7,8]. The Hazard Analysis Critical Control Point (HACCP) management system is a fundamental component of food safety frameworks due to its systematic hazard identification and control of food safety risks [9]. The HACCP system covers stages from primary production to initial food preparation and processing, as well as subsequent handling after production [10]. Through its focus on Critical Control Points, the HACCP system enables proactive food safety management, reducing dependence on the testing of the final products [11]. The HACCP system’s effectiveness relies on manual inspections, which require extensive labor and are prone to human error [12]. The growing complexity of the global food supply chain poses issues for traditional HACCP monitoring approaches [13].
Technological developments in machine learning (ML) enable the automation of monitoring processes and enhance predictive capabilities, leading to improved food safety measures [14]. By analyzing extensive datasets, ML algorithms can detect microbial contamination, predict spoilage, and improve the traceability optimization of ASF supply chains [14,15]. ML differs from traditional methods by enabling immediate hazard detection and predictive analytics [16,17]. The enhancement of HACCP procedures through ML stems from its ability to process and analyze extensive data collected from sensor-based techniques that detect irregularities that manual inspections might miss [15,18,19]. ML enhances food safety compliance through anomaly detection (AD) and predictive modeling to maintain regulatory standards and decrease manual monitoring efforts [20,21]. The integration of ML into HACCP systems shows great potential but remains under development as multiple challenges continue to exist. ML has succeeded in food processing and distribution sectors but remains largely unimplemented at primary production stages, such as monitoring feed quality and farm animal health [22,23,24]. Current food safety frameworks reveal a critical weakness in their dependence on manual assessments during the initial stages of ASF production. To bridge this crucial gap, food safety frameworks require automated systems that leverage ML to reduce human input while maintaining high accuracy [25,26]. Automation poses substantial technological obstacles, such as real-time data integration requirements, high computational demands, and the need for systems to work across different food production stages [27,28]. The main challenge is obtaining standardized data while ensuring its availability. ML models deliver accurate results when trained on high-quality, well-labeled datasets. ML model performance suffers from inconsistent data quality, which simultaneously generates issues related to bias transparency and regulatory compliance in decision-making processes [29].
To encourage the adoption of ML within food safety frameworks and the HACCP system and to provide insight for future research, the present review explores the use of ML applications to improve food safety and HACCP monitoring in ASFs. While various studies have explored ML applications in food safety [25,28,30,31,32] and animal farming [22,33], few have explicitly linked ML to food safety in ASFs [34]. In this study, ASFs include meat derived from pigs and poultry, ruminants (including cattle and sheep), dairy products, eggs, fish, and related processed food items. The literature review utilized multiple databases, including Scopus, Web of Science, PubMed, and JSTOR. The search strategy used predetermined keywords (such as “machine learning”, “supervised learning”, “deep learning”, “neural networks”, and “unsupervised learning”) along with ASF-related terms (such as “dairy”, “milk”, “cheese”, “meat”, “fish”, and “eggs”). Additionally, the search strings included terms like “food safety” and “HACCP”.
2. Feature Selection and Feature Extraction
In ML and data science, high-dimensional data processing presents many challenges for researchers. Using high-dimensional data to train ML algorithms may lead to an overfitted model that identifies noise and erratic variations as learned concepts, making it function inadequately on unseen data [35]. Dimensionality reduction is essential to avoid overfitting because it minimizes computational costs, improves model interpretations, and reduces redundancy by simplifying models [36]. Feature selection and feature extraction have one primary distinction: feature selection retains a subset of the original features, while feature extraction creates a completely new subset [37].
2.1. Feature Selection
Feature variable or attribute selection involves selecting a subset of distinct features for developing ML and data science application models. Removing unnecessary or insignificant features simplifies a model and speeds up the training of ML algorithms. Identifying the relevant and optimal subset of chosen features can reduce the risk of overfitting when building ML models. Feature selection is a fundamental concept in ML and significantly influences the effectiveness of the target model [38].
Feature selection algorithms encompass various techniques, including Analysis of Variance (ANOVA), Recursive Feature Elimination (RFE), Genetic Algorithms (GA), stepwise regression, Least Absolute Shrinkage and Selection Operator (LASSO), and the Boruta algorithm. ANOVA has been utilized to extract features from the Raman spectra for the Convolutional Neural Networks (CNN) [39]. The RFE algorithm with cross-validation has been employed to select the optimal input feature sets from datasets associated with milk quality for predicting subclinical mastitis [40,41]. Alshejari et al. [42] used seven feature selection algorithms to predict total viable counts through multispectral imaging. These included RFE, GA, LASSO, relative importance from linear regression, Partial Least Squares (PLS), and the Boruta algorithm. The Boruta algorithm has also been used to select features in near-infrared spectra [43].
2.2. Feature Extraction
In ML-based models, feature extraction enhances understanding of the data, boosts prediction accuracy, and reduces computational cost and training time. In the feature extraction process, the original set of features is reduced, creating a new set of features. Data obtained from spectroscopic techniques are high-dimensional with multicollinearity issues [44]; therefore, feature extraction is frequently applied. Principal Component Analysis (PCA) is commonly used as a dimensionality-reduction technique to extract a lower-dimensional space and create new components, known as principal components [45,46]. PCA has been applied by Lu et al. [19] for the feature extraction of the Raman spectra for monitoring the antibiotic ofloxacin in meat. Another feature extraction algorithm is Competitive Adaptive Reweighted Sampling (CARS), based on Monte Carlo sampling and PLS regression. The CARS algorithm has been applied by Feng et al. [47] in Raman spectra to identify dairy fraud. Two pre-trained CNNs, SqueezeNet and InceptionV3, have been used by Yasin et al. [48] for feature extraction on an image dataset.
3. Machine Learning Algorithms
ML involves exploring and developing mathematical models and algorithms that enable computers to learn from the provided input data. In this context, learning is defined as the process (based on a learning algorithm) of translating the input of experience (such as historical data) into the output of expertise (e.g., classification and prediction) [49,50]. Supervised ML algorithms are primarily utilized for applications relating to food safety [25,30,32]. Supervised ML algorithms analyze labeled datasets and training examples to derive a function. Supervised learning is typically employed when specific goals are defined based on a set of inputs, taking a task-driven approach. The prevalent supervised tasks are classification (which separates the data) and regression (which fits the data). Classification concerns educating the computer program on a training dataset, which enables it to categorize the data according to the class labels [37,51]. There are several established supervised ML algorithms, including Support Vector Machine (SVM), Naive Bayes (NB), Decision Trees (DT), K-Nearest Neighbors (KNN), Logistic Regression (LR), Random Forest (RF), Discriminant Analysis (DA), and Gradient Boosting (GB). The food safety monitoring process frequently employs unsupervised learning, which can analyze unlabeled datasets that are exclusive to human assistance. Additionally, unsupervised AD can identify atypical data points (that are notably different from the majority of data in a dataset) by using historical data to determine which readings fall within the acceptable range [52]. This approach is critical in maintaining the quality and security of data across numerous domains (including food safety).
3.1. Naive Bayes
The NB algorithm applies Bayes’ theorem while assuming that features are conditionally independent once the class label is known. The robust assumption enables NB to function with little training data when estimating parameters, which results in computational efficiency [53]. The independence assumption of the NB algorithm can hinder its performance especially when features exhibit high correlation. NB classifiers come in multiple variations such as Gaussian, Multinomial, Complement, Bernoulli, and Categorical [54].
The Gaussian Naïve Bayes (GNB) algorithm (Figure 1) has been utilized for multiple classification tasks including animal disease prediction. Satoła and Satoła [40] applied the GNB algorithm for the detection of subclinical mastitis in dairy cows. The research utilized milk sample data from dairy farms which included somatic cell count (SCC), milk composition parameters such as fat and protein content along with environmental factors. The dataset served as the benchmark for evaluating GNB’s performance in comparison to ensemble methods including bagging, boosting, stacking, and super-learners. GNB provided an easy-to-understand method, but its effectiveness depended on the distribution of features in the data and the normality assumption for continuous variables.
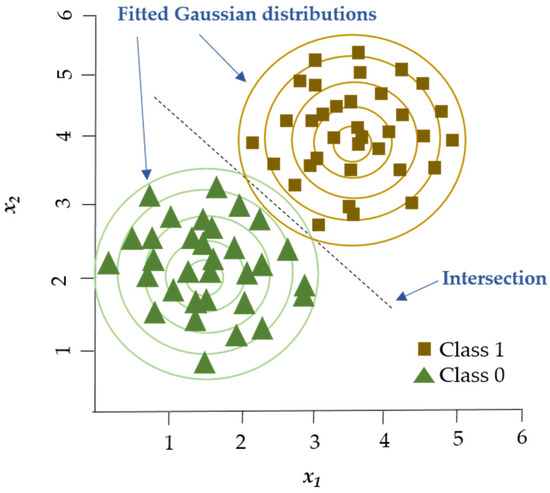
Figure 1.
GNB algorithm. GNB classifier models two Gaussian distributions corresponding to the labeled groups in the dataset. The decision boundary is established at the location where the probability densities of the two groups are equal. Adapted from Shyrokykh et al. [55].
3.2. K-Nearest Neighbors
The KNN algorithm employs proximity to classify new data points (e.g., Euclidean distance function) and is applied for both regression and classification. Classification is calculated from a simple majority vote of the KNN of each separate point. The KNN algorithm’s accuracy relies on the data’s quality and is relatively resistant to noisy training data. An important issue that must be considered in this algorithm is the selection of the optimal number of neighbors K (Figure 2) [56].
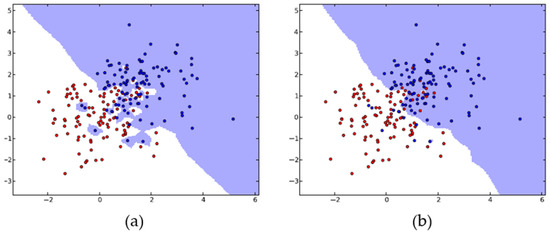
Figure 2.
KNN algorithm with K = 1 (a) and K = 20 (b). The KNN generalizes for larger K values, while it tends to overfit for small numbers of neighbors. Adapted from Kramer [56].
The KNN algorithm has been used in spectroscopic data to predict fish quality and safety [57,58,59], in images datasets to evaluate fish freshness [48], in identifying foodborne pathogens and spoilage bacteria in milk [60], and to predict subclinical mastitis in dairy cows [40]. In these studies researchers adapted the KNN algorithm by implementing customized preprocessing and optimization procedures to improve classification accuracy. The performance of the dataset improved through feature engineering methods like PCA, normalization, and feature selection which reduced dimensionality and enhanced data representation. The common approach to measuring the similarity between data points used Euclidean distance as the primary metric, although some studies tested Manhattan and cosine similarity depending on the dataset characteristics. Through cross-validation, researchers determined the best number of neighbors K, which maintained a balance between underfitting and overfitting.
3.3. Discriminant Analysis
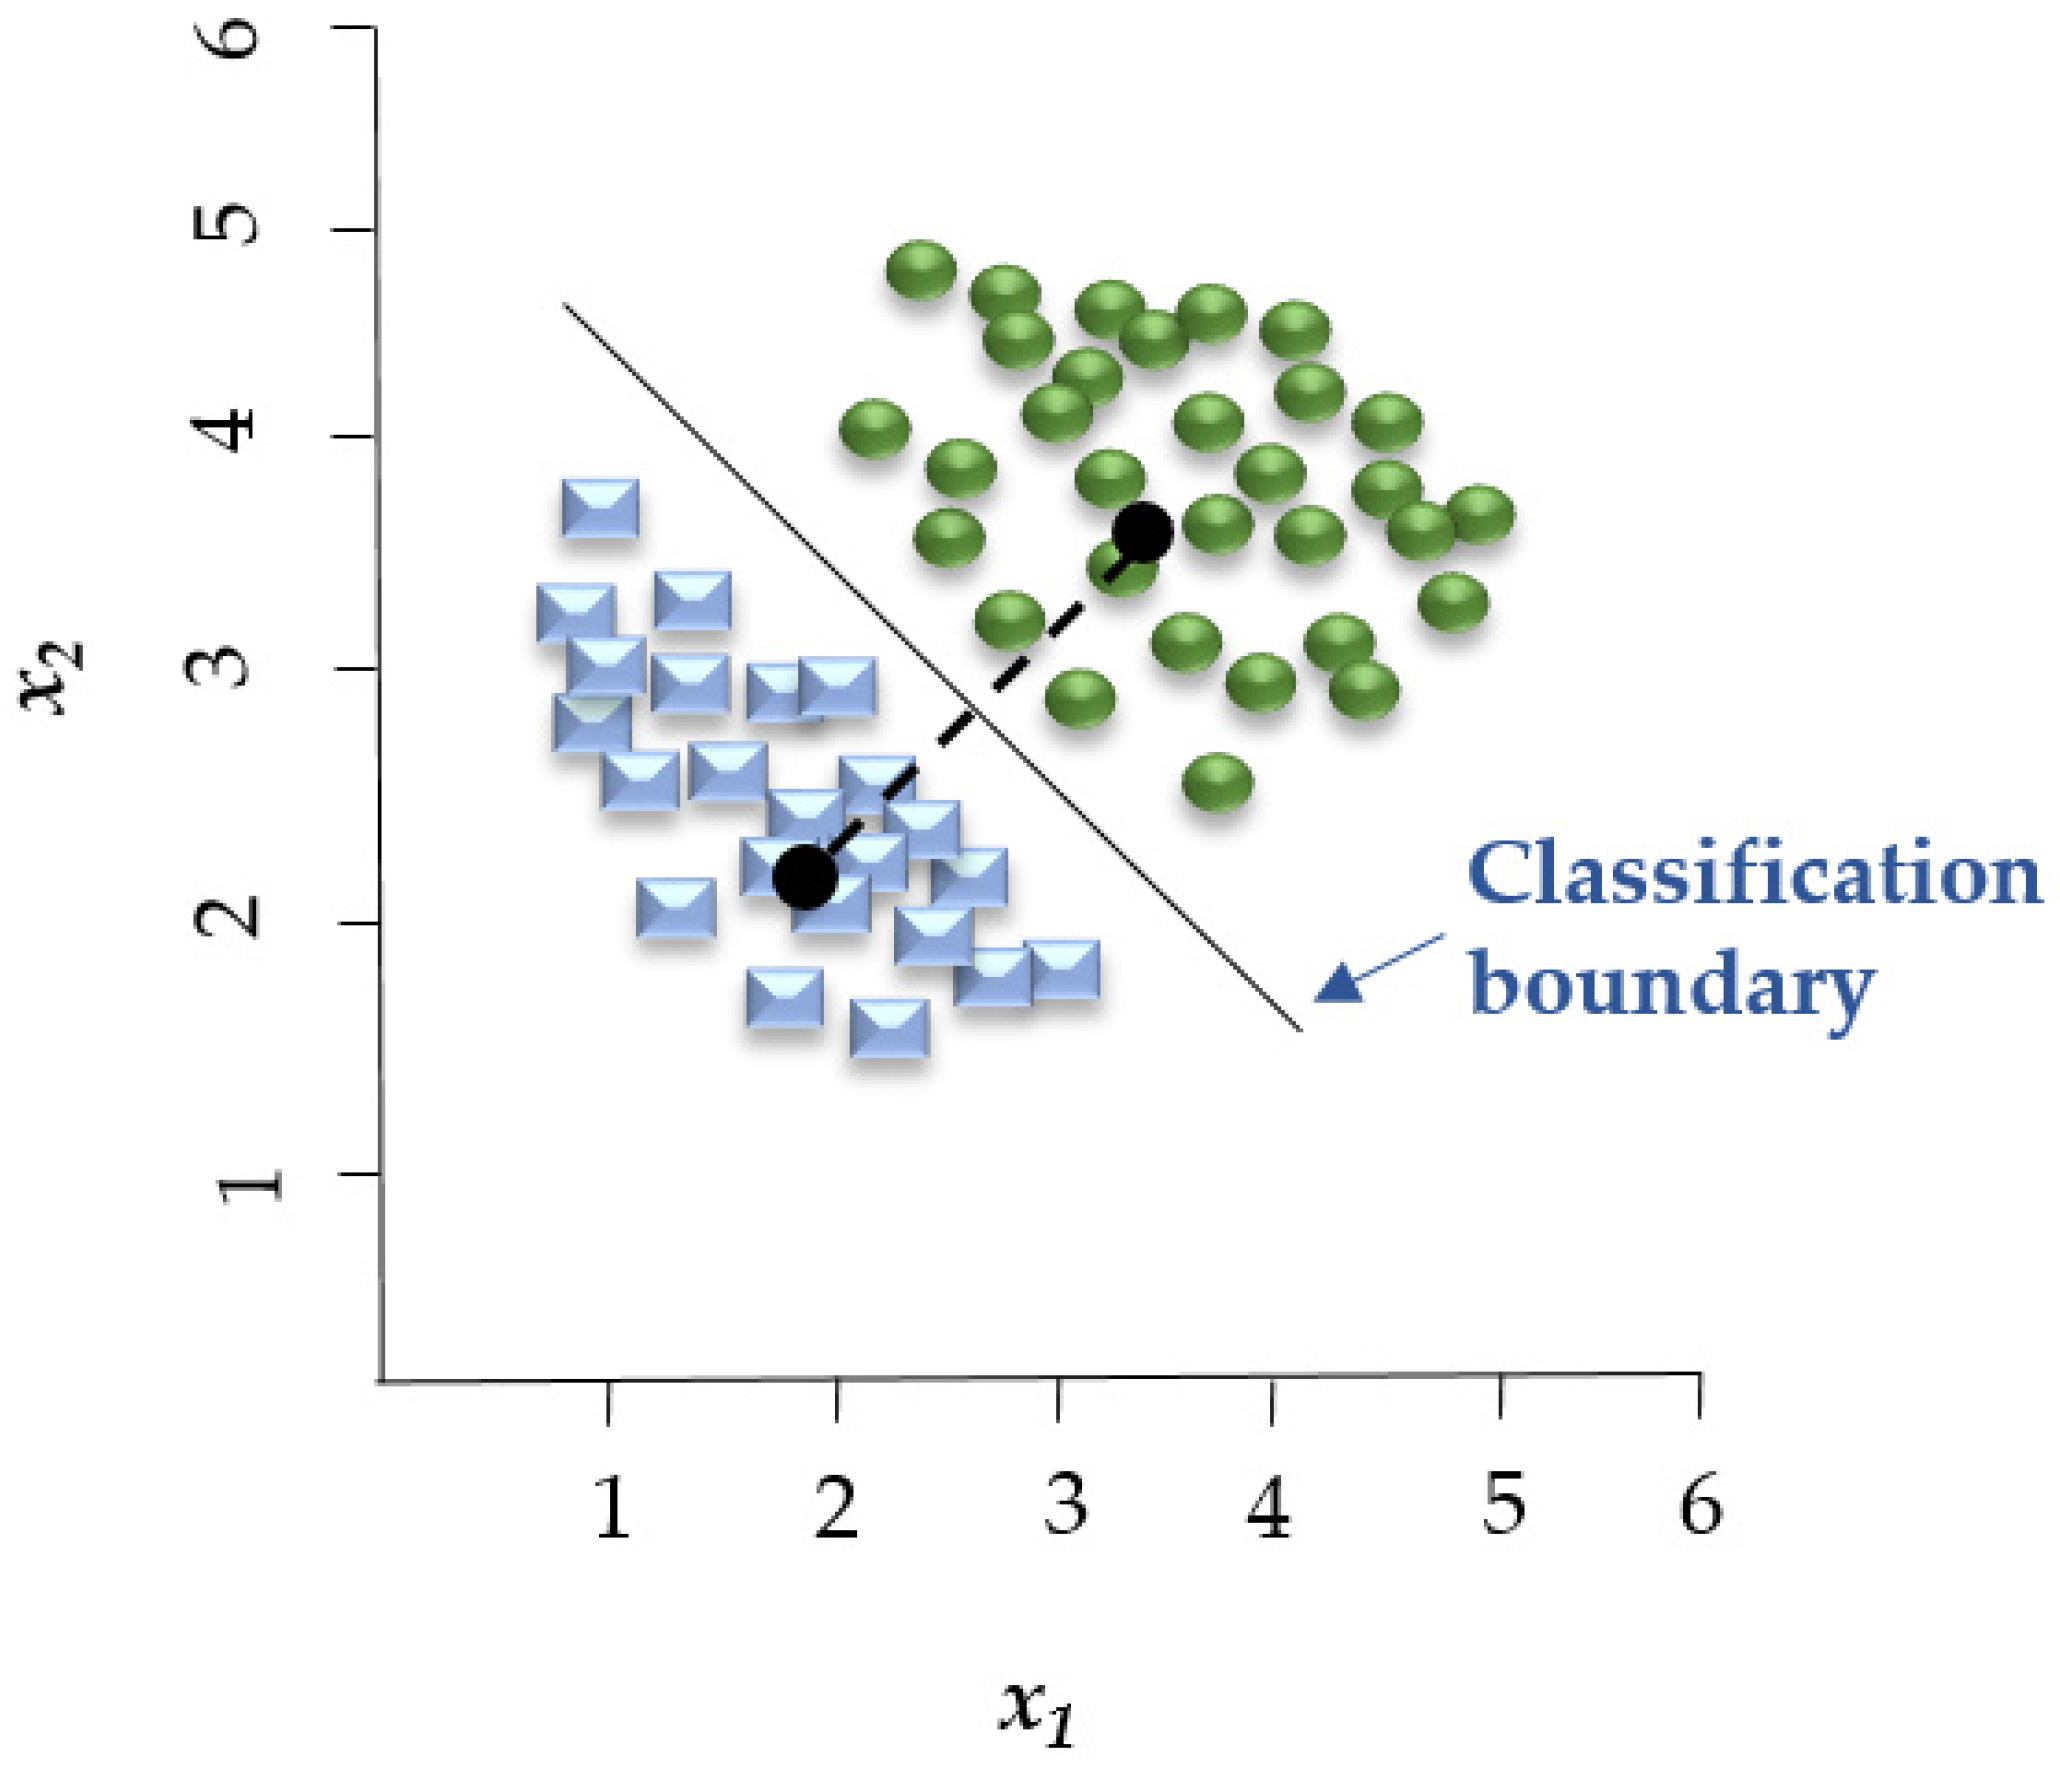
Linear Discriminant Analysis (LDA) is a linear decision boundary classifier generated by fitting class conditional densities to the data and subsequently applying Bayes’ rule (Figure 3). As an extension of Fisher’s Discriminant Analysis, LDA reduces the dimensionality of a given dataset to lower the model’s complexity and associated computational costs [61]. Based on the assumption that all categories share the same covariance matrix, the LDA model associates each category with a Gaussian density. LDA has similar characteristics to regression analysis and ANOVA, which represent each dependent variable as a linear combination of features [37,61]. LDA has been employed in spectroscopic data to assess the quality of fish [59] and detect adulteration in beef [62].
Another Discriminant Analysis algorithm is Partial Least Squares Discriminant Analysis (PLS-DA), which combines Partial Least Squares Regression (PLSR) with Discriminant Analysis. PLSR is utilized for both prediction and dimension reduction. It facilitates the analysis of overlapping absorption peaks derived from samples containing multiple components [63]. PLS-DA combines dimensionality reduction and Discriminant Analysis into a single algorithm for modeling high-dimensional data. Furthermore, PLS-DA is more flexible than LDA as it does not require the data to follow a specific distribution [64].
PLS-DA has been used on spectroscopic data to classify milk from cows with subclinical mastitis [65] and identify the freshness grades of sea bass [39]. The two studies used preprocessing methods, including normalization and baseline correction, alongside feature extraction, to remove noise from the spectra dataset. Through PLS-DA dimensionality reduction, data simplification was achieved by selecting the essential features from complex high-dimensional spectral data. The dimensionality reduction process enabled the PLS-DA algorithm to concentrate on essential patterns that were relevant to the classification task. PLS-DA is especially useful in analyzing complicated spectral data since it works without requiring data distribution assumptions.
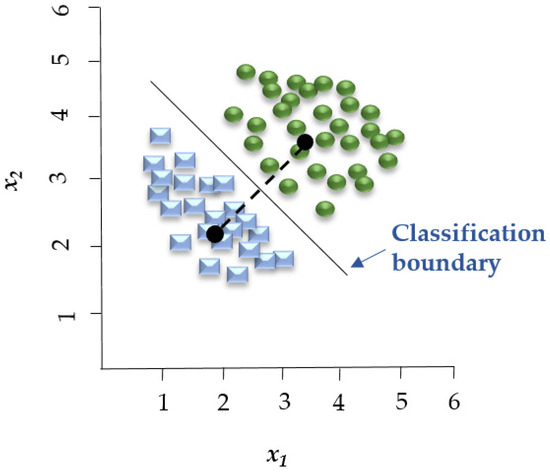
Figure 3.
LDA establishes a linear boundary that separates the groups, effectively dividing the space between the centroids of these groups. Adapted from Adams [66].
Figure 3.
LDA establishes a linear boundary that separates the groups, effectively dividing the space between the centroids of these groups. Adapted from Adams [66].
3.4. Support Vector Machine
SVM can be used for classification and regression. In high- or infinite-dimensional space, an SVM constructs a hyperplane (or a set of hyperplanes) to achieve a strong separation of groups (Figure 4) [67]. Typically, this separation occurs because the greater the margin, the smaller the generalization error of the classifier. Therefore, it is effective in high-dimensional spaces and behaves differently depending on various functions (radial basis function, polynomial, etc.) [68].
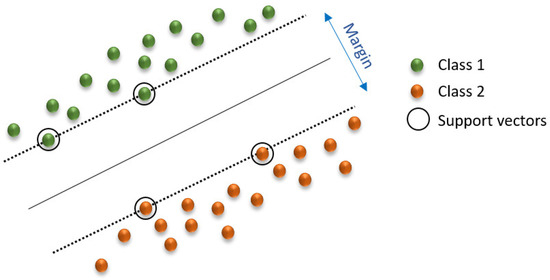
Figure 4.
Linear SVM model. Adapted from Ahmetoglou and Das [67].
The SVM algorithm is used in various applications to assess food safety and quality due to its effectiveness in managing high-dimensional data classification tasks. Wang et al. [60] utilized the SVM algorithm in a single-stranded DNA sensor array to detect multiple foodborne pathogens and spoilage bacteria found in milk. The algorithm processed sensor-generated information, which classified bacterial species according to their unique hybridization patterns. Feng et al. [47] utilized SVM with Raman spectroscopy for dairy fraud detection by training models to distinguish between authentic and contaminated dairy products based on spectral changes. Talari et al. [69] applied SVM within a data-driven system designed for hazard prioritization to classify dairy product risks from microbial and chemical sources using open-source food safety databases. In spectroscopic applications, Currò et al. [43] utilized SVM to classify histamine concentrations in tuna through near-infrared (NIR) spectral data analysis. Similarly, Kashani Zadeh et al. [59] used multi-mode spectroscopy combined with fusion-based AI systems for the assessment of fish freshness across various supply chain nodes, with SVM playing an essential role in freshness detection. Ninh et al. [57,58] employed SVM and NIR spectroscopy to determine the levels of histamine and urea in fish samples. Their research demonstrated the algorithm’s effectiveness in processing complex spectral data for assessing food quality. The researchers optimized SVM through feature selection and kernel tuning methods, such as radial basis function and polynomial kernels, combined with cross-validation. This approach led to precise classification results in sensor-based and spectral food safety applications and database-driven solutions.
3.5. Random Forest
RF (Figure 5) is an algorithm employed in various ML and data science areas. It employs a parallel ensemble technique that fits numerous Decision Tree classifiers in parallel (across diverse dataset sub-samples) and uses majority voting (or averages) to arrive at an outcome. This approach minimizes overfitting while increasing prediction accuracy. As a result, the multiple Decision Tree RF learning model is acknowledged as more accurate than a model based on a single Decision Tree. Bootstrap aggregation (bagging) and random feature selection are combined in this method to produce a set of Decision Trees with controlled variation, making it appropriate for both classification and regression [70,71].
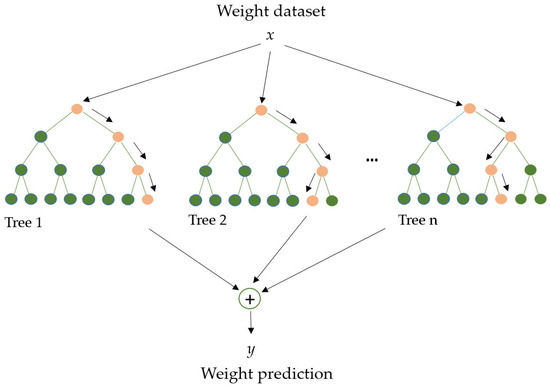
Figure 5.
Random Forest model. Adapted from Yang et al. [72].
Researchers applied the RF algorithm to sensor-collected data for spoilage detection, as shown by Surjith et al. [73] and Wang et al. [60]. The study by Surjith et al. [73] employed an ensemble model combining RF-CNN-GRU techniques for beef quality evaluation. In ensemble modeling, RF ranks feature importance and manage high-dimensional data while acting as a base learner. RF processed biosensor signal data in milk bacterial identification through a DNA sensor array [60] using bootstrapped Decision Trees for classifying multiple foodborne pathogens and spoilage bacteria.
Cao et al. [74] employed RF to colorimetric sensor data to evaluate fish freshness. The sensor response data revealed important colorimetric features that helped identify patterns linked to fish freshness. RF constructed multiple Decision Trees to analyze how sensor color changes relate to total volatile basic nitrogen levels, which indicate spoilage. Through bootstrapping and feature randomness, the algorithm reduced overfitting while improving generalization to achieve a reliable classification of freshness states.
Currò et al. [43] applied RF to improve feature selection for histamine level classification in frozen-thawed tuna fish. The Boruta algorithm enabled RF to select important wavelengths from NIR spectral data while removing irrelevant and noisy features. The classification accuracy improved significantly because this step concentrated on spectral bands which showed the strongest correlation with histamine concentration. The analysis showed that selected wavelengths existed mainly in the visible and near-infrared regions which demonstrated interactions between histamine and the molecular structure of tuna. RF optimized the histamine detection process by decreasing data dimensionality and boosting predictive performance.
Several studies used the RF algorithm for food safety and microbiological risk prediction. Al et al. [75] used RF to predict E. coli growth rates in raw ground beef. Date were preprocessed using standard normal variate transformation followed by training of the RF model with temperature and time inputs to predict bacterial populations.
The RF algorithm was utilized to develop an early warning system for predicting Salmonella outbreaks in northwestern Italy [76]. The dataset contained information about human infection cases together with food safety audit results and spatial-temporal prediction factors. The RF algorithm demonstrated its ability to handle high-dimensional data while utilizing bootstrapping techniques to achieve strong generalization performance and, by ranking feature importance, it proved to be an effective tool for food safety monitoring and microbiological risk assessment across these studies.
The classification of milk into distinct quality grades (low, medium, high) relied on physicochemical parameters using RF, as analyzed by Bhavsar et al. [77]. The preprocessing stage required label encoding for categorical features and Min–Max normalization of numerical features while also confirming the absence of missing data points. Through the application of bagging techniques and feature importance evaluation, the model determined pH and fat content as the most critical indicators of milk quality.
3.6. Decision Trees
Problems involving classification and regression can be resolved by applying a DT algorithm, which observes data about an instance and generates an accurate report of its target value. Creating a tree that represents the complete dataset to minimize the error rate for each leaf or producing a result for each one are the fundamental ideas behind a DT. A decision rule (represented by a branch) and an internal node determine the structure of a DT. A distinct leaf node represents each result (Figure 6). A DT has a topmost node (root node), which partitions the tree via the feature value and employs recursive partitioning to create a clear diagram with a logical structure [78].

Figure 6.
Structure of a DT. Adapted from Chiu et al. [79].
Talari et al. [69] used the DT model to categorize food safety alerts regarding chemical contaminants in dairy products, implementing recursive splits based on crucial predictors. The model utilized classification and regression trees to determine decision points, including reference dose, substance amount, notification type, product category, and contaminant type, to differentiate between “serious” and “non-serious” alerts. The tree was pruned to six levels to minimize overfitting and enhance generalization. Satoła and Satoła [40] utilized DT as a classification model to predict subclinical mastitis in dairy cows by analyzing milk performance data. The model segmented the dataset into smaller subsets through a recursive process of selecting the most relevant features at each step. To avoid overfitting, the tree was pruned by limiting its depth, and the training set was split 80:20 to prevent data leakage. Ninh et al. [57,58] utilized the DT model in NIR spectroscopy data. The model classified fish samples into “Safe” and “Unsafe” categories based on urea and histamine content in fish samples by organizing the information into a hierarchical tree structure where nodes acted as decision rules based on specific wavelengths’ spectral absorbance values. The algorithm identified spectral features by recursively splitting the data according to key wavelengths and absorbance values using specific contamination thresholds such as Safe (<100 ppm) and Unsafe (>100 ppm) for histamine classification. Pruning methods were used to reduce overfitting, while the synthetic minority over-sampling technique generated additional synthetic instances of minority class samples to tackle class imbalance. Internal tail NIR spectra provided the DT model with a moderate classification accuracy of 87.2% for histamine detection and yielded comparable results for urea detection.
3.7. Gradient Boosting
GB is an example of an ensemble learning algorithm that creates a definitive model by implementing a series of individual models (such as DT). In this approach, the gradient is employed to minimize the loss function (similar to how neural networks utilize gradient descent to optimize weights) [80,81]. Extreme Gradient Boosting (XGBoost) (Figure 7) is a variant of GB that considers detailed approximations when establishing the most effective model. By calculating the second-order gradients of the loss function to reduce loss and employing advanced regularization (L1 and L2), XGBoost can minimize overfitting, improve model generalization, and enhance performance. Additionally, this approach can be interpreted rapidly and efficiently to manage large datasets [80,82].
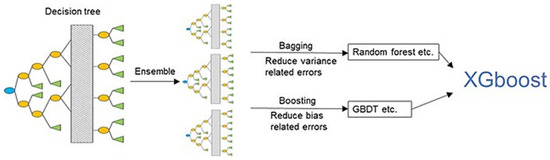
Figure 7.
XGBoost model. From Jiang et al. [83].
Another form of GB is the Light Gradient Boosting Machine (LightGBM), a tree-based ensemble method designed to overcome the efficiency and scalability challenges faced when using XGBoost with high-dimensional input features and large datasets. LightGBM prioritizes computational efficiency while maintaining acceptable levels of accuracy. In this context, the term “light” indicates that this algorithm delivers faster performance compared to other Gradient Boosting methods (such as XGBoost, which requires extensive training when handling large datasets) [84]. Category boosting (CatBoost) is specifically designed to handle categorical variables in contrast to other ML algorithms that necessitate converting categorical variables into a numerical format using techniques like one-hot encoding. CatBoost can process these variables directly, streamlining the data preparation process and enhancing performance.
Feng et al. [47] used XGBoost and LightGBM algorithms to identify dairy brands and measure their fat content. XGBoost and LightGBM analyzed Raman spectral data through high-dimensional feature pattern recognition while concentrating on Raman shifts that identify dairy products. Gradient descent-based optimization guided the training of models to progressively diminish misclassification errors and preserve interpretability. XGBoost demonstrated marginally better performance than LightGBM in discerning complex spectral variable interactions, while both models maintained a classification accuracy above 90%. Yan et al. [85] utilized XGBoost Regression for analyzing Escherichia coli O157:H7. The model refined weak learners using gradient descent optimization in iterative steps to reduce residual errors. The signal intensity at 1335 cm−1 in the Raman spectral data was the input feature that established a correlation with bacterial concentration. XGBoost Regression provided better predictive results than linear regression. Son et al. [86] utilized XGBoost, LightGBM, and CATboost to evaluate hyperspectral imaging data for predicting nitrate levels in pork sausages. Hyperspectral images spanning the 1000–2500 nm range served as input for the models. The 1080 and 1280 nm wavelengths were selected as markers for nitrite effects on protein matrix interactions and water-binding capacity. The sequential boosting approach applied in this study reduced residual errors and enhanced predictive accuracy.
3.8. Deep Learning
Deep learning, also known as a deep neural network, is a category of representational learning that enables the extraction of features from raw data for detection, classification, or regression, while refining multi-level representations through Artificial Neural Networks (ANNs). Unlike traditional ML, which necessitates significant human collaboration to yield results, deep learning can learn from its errors [87]. ANNs consist of a series of computational algorithms, including activations and weights that transform data from input to output, designed to uncover underlying relationships in a dataset. The self-learning capability of ANNs depends on loss, Back Propagation, and gradient descent algorithms. Training a neural network may involve manual supervision, unsupervised learning, or a blend of both methods, and can be tailored based on the availability and characteristics of the training data [88].
There are two principal classes of ANNs: Feedforward Neural Networks and Recurrent/Feedback Networks. Feedforward Neural Networks are founded on biological neural networks and consist of basic neuron-like computational units organized in layers. In these systems, the input data are circulated throughout the network until received at the outputs. When this operation occurs as expected, it serves as a classifier and no feedback is presented in these layers [89]. The primary difference between Feedforward and Recurrent/Feedback neural networks is that Feedforward networks convey the data forward (from input to output), whereas Recurrent networks possess a feedback loop that enables the data to be transferred back to the input and fed forward again for additional processing before arriving at a final output. Types of Feedforward Neural Networks include Single-Layer Perceptron (SLP), Multilayer Perceptron (MLP), Radial Basis Neural Networks (RBNN), and Extreme Learning Machines (ELM) [90].
Research by Jia et al. [91,92] revealed that feed-forward neural networks can process sensor data, enabling the concurrent tracking of multiple pathogens. Utilizing a standard rectified linear unit activation function accelerated learning and mitigated vanishing gradients in the hidden layers. In the output, the SoftMax activation function produced bacterial classification probability distributions. The use of the Adam optimizer, combined with the cross-entropy loss function, improved both convergence speed and classification accuracy. A five-fold cross-validation strategy was employed to assess model robustness.
The MLP neural networks have been used in sensor-obtained data for quality monitoring and traceability in the dairy chain [93]. The model processed 11 milk parameters to identify deviations from standard milk quality levels. The MLP architecture consisted of an input layer with 9 features, two hidden layers with 20 neurons each, and an output layer with 4 nodes, corresponding to the identified anomaly classes. Each node in the hidden layers utilized the sigmoid activation function, whereas the output layer employed SoftMax activation to classify milk samples into their corresponding anomaly groups. The model underwent training through a Back Propagation algorithm with gradient descent, implementing an early stopping technique to avert overfitting. Daily standardization of data countered sensor drift, and a grid search method fine-tuned the number of neurons in each layer by minimizing the mean-square error. Cui et al. [94] used RBNN and ELM to determine seafood freshness. The RBNN demonstrated high performance by mapping complex nonlinear relationships in data with strong global approximation power while avoiding local minima traps. The activation mechanism of the network based on a Gaussian function enabled efficient pattern recognition, while the careful choice of 54 neurons maintained both accuracy and computational efficiency. The ELM model achieved fast learning capabilities through random weight initialization and output weight determination via least squares computation. ELM outperforms traditional feedforward networks by optimizing the output weights through a single training step which speeds up learning and achieves high prediction accuracy.
Recurrent/Feedback Networks can process data comparable to the human brain. When in operation, recurrent networks are small in size (compared to Feed Forward Networks), can be employed in a variety of contexts, and exhibit robust computational power. Currently, there are several varieties of Recurrent/Feedback Networks including the Kohonen Self-organizing Map Networks (SOM), Hopfield Networks, Adaptive Resonance Theory (ART) Models, Long Short-Term Memory (LSTM) Networks, and CNN [89,90].
The application of LSTM and CNN architectures in computer vision has been utilized to evaluate beef quality ([95]). Image feature extraction for classification tasks was conducted by CNNs. The models employed pre-trained CNN architectures, including VGG16, ResNet50, and AlexNet, to process RGB images and spectral data, enabling them to capture hierarchical visual patterns and spectral variations. The study achieved improved classification accuracy by combining handcrafted color features from multiple color spaces with CNN-extracted deep features and further enhanced results with a Bi-LSTM-augmented fusion model, reaching an accuracy of 98.9%. CNNs have been applied to detect beef adulteration by identifying the presence of colorants and curing agents [96]. The model extracted significant spectral features from 344 to 1040 nm using AlexNet. Additionally, gradient-weighted class activation mapping indicated that the 580–600 nm region was essential for the classification of samples.
An important application of deep learning is AD, which concerns identifying samples significantly distinct from the bulk of the data and representing irregular, atypical, or unreliable observations [97]. AD plays a crucial role in instances where not all existing classes can be defined during training and is particularly compatible with food distribution and safety inspection data because most high-risk samples are atypical. Therefore, AD algorithms can facilitate the practical assessment of food safety hazards [98]. Auto-encoder (AE) is a neural network that is commonly employed for AD. This type of neural network has a symmetric structure consisting of an encoder and a decoder designed to find a compressed representation of the provided input data. This process involves finding a representation (or code) to conduct beneficial transformations on the input data, and, typically, AEs are recommended for dimensionality reduction or feature learning [99,100].
Anomaly score-based risk early warning systems using AE neural networks (Figure 8) have been developed for food safety monitoring of HACCP procedures to detect potentially unqualified products [18]. During the reconstruction of input data, the system detected anomalies through reconstruction error analysis. The AE model analyzed 2.158 milk samples with variables including lactose levels, acidity, non-fat milk solids, fat, protein percentages, and aflatoxin concentrations. The model accurately reconstructed normal samples due to the consistent distribution of “qualified” food samples. It demonstrated significantly higher reconstruction errors for unqualified samples because these samples deviated from the normal pattern it had learned. The error measurement provided the foundation for calculating the anomaly score, which determined the sample’s risk level. The de-noising Auto-encoder variant enhanced robustness by effectively handling noisy data and incomplete datasets through the introduction of Gaussian white noise to the inputs.
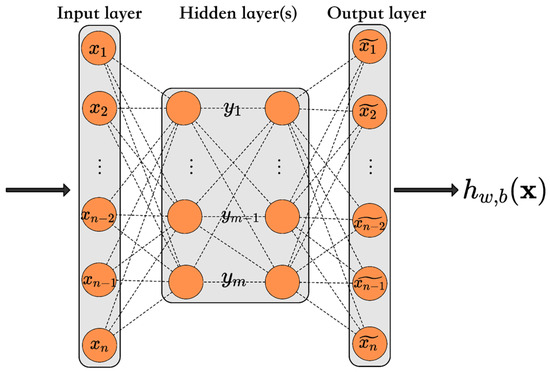
Figure 8.
Auto-encoder. It has a symmetric structure with an encoding and a decoding phase. In the encoding phase, there is a compressed representation of the data, and in the decoding phase, the original input is reconstructed. From Zuo et al. [18].
4. Applications of Machine Learning Algorithms in Food Safety and HACCP
Table 1, Table 2 and Table 3 summarize the main applications of ML algorithms in assessing the food safety of ASFs, including risk assessment and HACCP monitoring, identification and prevention of chemical and microbiological hazards, fraud/adulteration detection, and quality assessment. Databases, various spectroscopic techniques, imaging (RGB, multispectral, hyperspectral), and sensors have been utilized as data sources for the application of ML. The literature shows that the most widely utilized algorithms are various types of neural networks (MLP, LSTM, CNN) followed by SVM and RF. Neural networks have the advantage of processing large datasets, and, therefore, they are frequently applied in imaging, sensor, and spectroscopic data. However, neural networks are difficult to interpret and slow to train. SVM and RF are simpler and more straightforward to interpret, providing the advantage of avoiding overfitting compared to other ML algorithms [49,50].
4.1. Food Safety Risk and HACCP Monitoring
Food safety early warning systems function in three ways: to detect any potential issues via risk analysis, to control risk in the food decision-making process, and to provide information to support improvements in food standards regulation and decision-making; therefore, a robust risk analysis model is crucial for effective warning systems [101].
To facilitate the effectiveness of an early warning system for food safety risk assessment, Zuo et al. [18] presented two unsupervised AE neural networks. This study amalgamated neural network modeling with food supply chains (in parallel with the HACCP protocols) to identify the crucial elements of risk warning and regulate risk via an in-depth hazard analysis of each testing index. The raw data used in this study concerned fresh milk, and the indicators used for the AE algorithm were acidity, nonfat milk solids, fat, lactose, protein, and aflatoxin M1 (AM1). The subsequent model attained elevated levels of accuracy (0.9954), which indicates its effectiveness in analyzing data regarding dairy products.
Utilizing large datasets from databases has become critical for assessing and addressing food safety hazards. The World Health Organization’s Global Environmental Monitoring System (GEMS) is an important database. The GEMS is a comprehensive food database that encapsulates data about chemicals (e.g., heavy metals, pesticides, persistent organic pollutants, veterinary drug residues) and biological contaminants, such as mycotoxins, biotoxins, and radionuclides [102]. The Rapid Alert System for Food and Feed (RASFF) is another important database operated by the European Union, which provides data on allergens, foodborne pathogens, heavy metals, pesticides, mycotoxins, and biotoxins [103]. Talari et al. [69] employed ML models (such as DT, RF, KNN, LDA, GNB, and SVM) to classify food safety alerts concerning the chemical and microbial contamination of dairy products using data from RASFF and GEMS databases. The results indicated that the most accurate ML models were DT and SVM (0.98) followed by RF (0.94), GNB (0.91), and KNN (0.85). The results of their exploratory data analysis ascertained the highest priority microbial hazards in dairy products: Listeria monocytogenes, Escherichia coli, Salmonella, Pseudomonas spp., Staphylococcus spp., Bacillus cereus, Clostridium spp., and Cronobacter sakazakii, and Bacillus cereus. Additionally, the study identified the primary chemical hazards (based on their potential negative impact on public health) as follows: nitrate, nitrite, ergocornine, 3-MCPD ester, ergosine, lead, arsenic, ochratoxin A, cadmium, mercury, followed by aflatoxins (G1, B1, G2, B2, G5, and M1).
Unsupervised AD (based on a Bayesian network algorithm) has been employed [104] to determine if the environmental, social, economic, and technological variables related to the milk supply chain can provide early warning for potential food safety hazards. The Bayesian network model was trained on the records contained in the Quality Program for Agricultural Products (KAP) database, which contains data regarding chemical hazards (e.g., dioxins, mycotoxins, pesticides, heavy metals, antibiotics) in food and animal feed from the Netherlands [105]. The total accuracy and specificity of the training and validation sets can be evaluated as good (>85%). The results indicated that the occurrence of an anomaly in certain areas (such as milk cost, feed cost, and average monthly precipitation) statistically correlates with specific food safety hazards (reported by monitoring programs) several months later.
An alternative, the HACCP-like approach, can be used to ensure safety by focusing on Points of Particular Attention (POPAs). POPAs are conditions that pose a threat to animal or human health or the management of the farm. Monitoring of POPAs may allow for better understanding and management [106]. To evaluate quality control and traceability in dairy production, Dragone et al. [93] employed a patented HACCP-analogous remote diagnostic (sensor-driven) system called BEST for the monitoring of variations in markers at CCP and POPAs (e.g., temperature, O2, CO2, redox potential, pH, conductivity, Ca2+, NH4+, NO3−, Cl−, and milk yield). The BEST system underwent daily examinations on a dairy farm regarding its ability to reliably distinguish additional indicators of safety and quality anomalies in milk production. The results were confirmed using supervised classification based on the MLP neural network and unsupervised classification (clustering) based on the SOM neural network, which spotted cows with specific characteristics.

Table 1.
Applications of machine learning algorithms in dairy products.
Table 1.
Applications of machine learning algorithms in dairy products.
| Product | Purpose of Study | Data | Machine Learning Algorithm | Output | Year | Reference |
|---|---|---|---|---|---|---|
| Food safety risk and HACCP monitoring | ||||||
| Milk | Risk control by conducting a comprehensive hazard analysis of each parameter | Protein, fat, NMS 1, lactose, AM1 2, acidity | Unsupervised anomaly detection AE 3, K-Means, Isolation Forest, KNN 4, LOF 5, COF 6, SO-GAAL 7 | AE achieved 0.9954 prediction accuracy | 2022 | Zuo et al. [18] |
| Milk | Hazards identification associated with an anomaly, prediction of food safety hazards | Raw milk price, number of patents related to the dairy sector, feed price, income of dairy farms, usage of antibiotics, usage of antibiotics, average temperature, average precipitation, total population, average age of dairy farmers, urban population, investment in R&D related to dairy sector, level of adoption of technology | Unsupervised anomaly detection BN 8 | >85% total accuracy | 2022 | Liu et al. [104] |
| Milk | Early Hazard Analysis and Critical Control Points and traceability in the dairy supply chain | Temperature, O2, CO2, redox potential, pH, conductivity, Ca2+, NH4+, NO3−, Cl−, milk yield | MLP 9 | Cows with specific characteristics were spotted | 2024 | Dragone et al. [93] |
| Dairy products | Classifying food safety alerts related to chemical and microbial contaminants | Data obtained from RASFF 10 WHO 11 GEMS 12 databases | MLP, DT 13, SVM 14, GNB 15, CNN 16 | The highest accuracy was achieved by DT and SVM (98%) | 2024 | Talari et al. [69] |
| Microbiological hazards | ||||||
| Milk and beef | Detection of E. coli O157:H7 | Surface-enhanced Raman scattering–based lateral flow assay | XGBoost 17 | Successfully forecast E. coli in samples spiked with 10 CFU/mL | 2020 | Yan et al. [85] |
| Milk | Identification of practices affecting PPC 18 | Bacterial spoilage indicators dataset (Pseudomonas spp.) | RF 19, MMI 20 | Factors for reducing PPC were identified (quality control, sanitation, staff training) | 2021 | Murphy et al. [107] |
| Meat, eggs, shellfish, dairy products, infant formula, etc. | Identification of parameters associated with the occurrence of Salmonella spp. | Salmonella spp. occurrence based on: product, region, and stage data | RF | Accuracy achieved 77.2% | 2023 | Rodríguez et al. [108] |
| Meat, eggs, dairy products, processed food salad, fish, etc. | Identification of potential sources of Campylobacter spp. | Campylobacter spp. occurrence based on: product, region, and stage data | RF | Accuracy achieved 83.1% | 2024 | Sacristán et al. [109] |
| Cheddar cheese | Pathogen identification | Salmonella enteritidis, E. coli O157:H7 identification by paper chromogenic array sensor dataset | DFFNN 21 | Accuracies ranging between 72 ± 11% and 92 ± 3% | 2024 | Jia et al. [91] |
| Eggs, milk, meats, bakery products, seafood, etc. | Prevention of foodborne Salmonella outbreaks | Food surveillance data (month, longitude, latitude, area, food prevalence, food categories) | Tree regression, RF, GB 22 | RF and GB (R2 = 0.55) outperformed the tree regression algorithm (R2 = 0.42) | 2024 | Garcia-Vozmediano et al. [76] |
| Milk | Identification of foodborne pathogenic and spoilage bacteria | Escherichia coli, Listeria innocua, Salmonella enterica, Staphylococcus aureus, Shigella sonnei, Bacillus cereus, Lactococcus lactis, Pseudomonas fluorescens identification by single-stranded DNA sensor array dataset | PLS-DA 23, KNN, RF, SVM, MLP, KAN 24 | MLP neural networks achieved the highest accuracy at 98.4% | 2025 | Wang et al. [60] |
| Milk | Detection of Staphylococcus aureus | Nanogap-assisted surface-enhanced Raman scattering biosensor dataset | VCPA-PLS 25, RF-PLS 26, BOSS-PLS 27 | BOSS-PLS achieved the best results (Rp = 0.967) | 2025 | Xu et al. [110] |
| Chemical hazards | ||||||
| Milk, wheat, rice, coffee, maize | Detection of mycotoxins | Cystamine-derived carbon dot array concentration of mycotoxins | XGBoost | A 100% accuracy and mycotoxin detection at 10 pmol | Aggarwal et al. [111] | |
| Milk | Detection of antibiotics | Optical immunosensor data concentration of antibiotics | PLSR 28 | Detection from pg/mL to ng/mL with an accuracy of >99% | 2024 | Zhou et al. [112] |
| Milk | Detection of the antibiotic levofloxacin | Quasi-ratiometric fluorescent probe provided fluorescence images | Hierarchical clustering | Low detection limit (4.53 nM) and excellent recovery rates (101.7–103.4%) were obtained | 2025 | Liu et al. [113] |
| Milk | Detection of the antibiotics norfloxacin and ciprofloxacin | Surface-enhanced Raman scattering data | SVR 29, RF, XGBoost | The coefficient of determination (R2) was 0.996, with a detection limit of 10 ppb | 2025 | Liu et al. [114] |
| Fraud/adulteration detection | ||||||
| Milk | Adulteration detection | Fat, protein, non-fat solid, total solid, lactose, relative density, freezing point depression, acidity, infrared spectra | Ensemble model of ExtraTrees and XGBoost | A 0.9924 accuracy achieved | 2022 | Chung et al. [115] |
| Milk | Fraud detection | Raman spectra | LightGBM 30, SVM, RF, XGBoost | The accuracy of each algorithm surpassed 90%, while the fusion model achieved an accuracy of 99% | 2024 | Feng et al. [47] |
| Milk | Adulteration detection | Hyperspectral imaging | LR 31, DT, SVM, LDA 32 | LDA obtained 100% validation accuracy | 2025 | Aqeel et al. [116] |
| Quality assessment | ||||||
| Milk | Prediction of subclinical mastitis | Daily milk production, fat, protein, casein, lactose, pH, urea, somatic cell count, differential somatic cell count, beta-hydroxybutyrate, electrical conductivity, rennet coagulation time, curd firmness 30 min after rennet addition | Generalized Linear Models, SVM, RF, Neural Network | The neural network achieved the highest accuracy of 0.754 | 2023 | Bobbo et al. [41] |
| Milk | Prediction of subclinical mastitis | Near-infrared spectra | PLS-DA, RF, SVM | The precision of SVM in detecting non-mastitis milk reached 0.81 | 2024 | da Silva Pereira [65] |
| Milk | Prediction of subclinical mastitis | Daily milk yield, fat percentage, protein percentage, lactose percentage, milk urea concentration, somatic cell score | Dummy classifier, Logistic Regression, DT, SVM, GNB, KNN | 2024 | Satoła and Satoła [40] | |
1 NMS: Nonfat Milk Solid; 2 AM1: Aflatoxin M1; 3 AE: Auto-encoder; 4 KNN: K-Nearest Neighbors; 5 LOF Local Outlier Factor; 6 COF: Connectivity-Based Outlier Factor; 7 SO-GAAL: Single-Objective Generative Adversarial Active Learning; 8 BN: Bayesian Network; 9 MLP: Multilayer Perceptron; 10 RASFF: Rapid Alert System for Food and Feed; 11 WHO: World Health Organization; 12 GEMS: Global Environmental Monitoring System; 13 DT: Decision Trees; 14 SVM: Support Vector Machines; 15 GNB: Gaussian Naive Bayes; 16 CNN: Convolutional Neural Networks; 17 XGBoost: Extreme Gradient Boosting; 18 PPC: Post-Pasteurization Contamination; 19 RF: Random Forest; 20 MMI: Multimodel Inference; 21 DFFNN: Deep Feed-Forward Neural Network; 22 GB: Gradient Boosting; 23 PLS-DA: Partial Least Square Discriminant Analysis; 24 KAN: Kolmogorov-Arnold Networks; 25 VCPA-PLS: Variable Combined Cluster Analysis Partial Least-Squares; 26 RF-PLS: Randomized Frog Hopping Partial Least-Squares; 27 BOSS-PLS: Bootstrap Flexible Shrinkage Variable Selection Partial Least Squares; 28 PLSR: Partial Least Square Regression; 29 SVR: Support Vector Regression; 30 LightGBM: Light Gradient Boosting Machine; 31 LR: Logistic Regression; 32 LDA: Linear Discriminant Analysis.
4.2. Identification of Microbiological Hazards
Bacterial growth in food products may result in contamination and has the potential to instigate foodborne infection when pathogen-contaminated foods are consumed [117]. Globally, contamination presents a substantial risk to public health and well-being: the Center for Disease Control and Prevention (CDC) reports that, annually, approximately forty-eight million people in the United States experience foodborne illnesses caused by inadequate food handling and preparation procedures [118]. Therefore, guaranteeing the safety of food via the timely and precise identification of pathogenic bacteria presents a fundamental challenge for the food supply chain [119]. Al et al. [75] employed ML models (such as ANN, RF, Support Vector Regression (SVR), and Multiple Linear Regression) to analyze the growth of E. coli O157:H7 at different temperatures in uncooked ground beef treated with cocktail inoculum. Detection of E. coli was based on ISO 16654:2001. The RF model exhibited the highest levels of performance in predicting microbial growth with a coefficient of determination (R2) of 0.98, followed by ANN (0.96), SVR (0.85), and Multiple Linear Regression (0.66). An existing dataset of bacterial spoilage indicators (Pseudomonas spp.) was used by Murphy et al. [107], acquired from samples of pasteurized milk taken from 23 processing sites. Multimodel Inference (MMI) and RF algorithms identified several factors which correlate with Post-Pasteurization Contamination (PPC). These factors (such as cleaning and sanitation procedures, manufacturing practices, type of container, in-house product assessment, and the presence of a quality control department) can be used to identify potential areas of action for minimizing cases of PPC.
Alshejari et al. [42] created a stacking-based ensemble prediction approach to determine the total viable number of microorganisms in samples of beef filet via multispectral imaging (Table 2). Two advanced clustering-based neuro-fuzzy network prediction models were developed: the first used information concerning average reflectance values, and the second utilized the standard deviation of pixel intensity per wavelength. The performance of each neuro-fuzzy model was evaluated against conventional algorithms (such as MLP, SVM, PLS) and revealed that the neuro-fuzzy models (R2 = 0.974 and 0.982) produced the highest levels of performance when compared with a wavelet neural network (R2 = 0.974), MLP (R2 = 0.967), SVM (R2 = 0.965), and PLS (R2 = 0.965).
Bacterial species detection in food matrices is a demanding task. The plate counting method of bacterial detection is reliable but has a tedious workflow, while the detection by Enzyme-Linked Immunosorbent Assay (ELISA) requires trained personnel and antibodies of high cost [120,121]. An alternative detection method for overcoming these shortcomings are the sensor arrays which analyze the structure and composition of bacteria, obtaining multiplex responses with high sensitivity [122]. Sensor arrays are based on nanomaterials, such as conjugated polymers, quantum dots, gold nanoparticles, carbon nanomaterials, etc. [123,124,125,126]. In response to the traditional approaches for identifying multiple pathogenic bacteria in contaminated milk (plate counting and ELISA), Wang et al. [60] developed a non-specific optical sensor array using two-dimensional nanoparticles and fluorescence-labeled single-stranded DNA. This study analyzed several bacteria cultures (E. coli, Listeria innocua, Salmonella enterica, Staphylococcus aureus, Shigella sonnei, Bacillus cereus, Lactococcus lactis, and Pseudomonas fluorescens) and employed the classification algorithms PLS-DA, KNN, RF classifier, Support Vector Classifier (SVC), and two Artificial Neural Networks: MLP, and Kolmogorov–Arnold Networks (KAN). In the testing sets, SVC, KNN, and the RF classifier exhibited elevated levels of accuracy (between 80% and 90%), while the MLP and KAN neural networks demonstrated 93.8% accuracy (following a 30 min incubation period). It should be noted that a 120 min incubation period increased the accuracy of the MLP neural networks to 98.4%.
A study conducted by Jia et al. 2024 [91] utilized paper chromogenic array sensors with a deep feed-forward neural network (DFFNN) to detect Salmonella Enteritidis and E. coli O157:H7 within a high level of background microflora in shredded cheddar cheese. This approach facilitated the accurate detection of S. Enteritidis and E. coli O157:H7 in monocultures and cocktail cultures and was able to identify them among a significant level of background microflora (~7.5 log CFU/g) at accuracies ranging between 72 ± 11% and 92 ± 3%. Additionally, this method effectively identified S. Enteritidis and E. coli O157:H7 at concentrations as low as 1 log CFU/g (within one day) and with an accuracy of 72 ± 11%. Jia et al. [92] employed the same approach (paper chromogenic array sensors and a DFFNN) to concurrently detect Listeria monocytogenes, Salmonella spp., and E. coli O157:H7 in chicken at levels as low as 1 log CFU/g and with an accuracy of more than 90%. Yang et al. 2022 [127] combined a paper chromogenic array with a neural network to identify viable pathogens in the presence of background microflora and microbial spoilage in seafood (via volatile organic compound sensors). The model pathogen and spoilage bacteria employed in the same study were Morganella morganii and Shewanella putrefaciens. Additionally, it evaluated microbial detection via monoculture and cocktail multiplex detection. The initial accuracy assessments were conducted on standard media and validated on seafood samples (such as cod and salmon) containing pathogenic and spoilage bacteria and background microflora. The neural network was trained on a digitized Red, Green, Blue (RGB) image dataset from the paper chromogenic array images. This approach effectively identified microorganisms from microflora (with and without the prevalent spoilage microbe) and S. putrefaciens in seafood with an accuracy level of between 90% and 99%. Potentially, this technique can enhance smart packaging by accomplishing nondestructive pathogen food monitoring without additional procedures such as enrichment, incubation, or sample preparation.
Xu et al. [110] created an integrated ML-based nanogap-assisted Surface-Enhanced Raman Scattering (SERS)/Polymerase Chain Reaction (PCR) biosensor that enables the identification of Staphylococcus aureus in milk samples. The bimetallic Au/Ag FL nanoflowers, which have been modified with iodide ions and magnesium sulfate, generate “hot spots” that amplify the Raman signals of S. aureus’ main gene target. The analysis used three univariate screening algorithms for spectral prediction modeling: The study compared Variable Combined Cluster Analysis Partial Least-Squares (VCPA-PLS), Randomized Frog Hopping Partial Least-Squares (RF-PLS), and Bootstrap Flexible Shrinkage Variable Selection Partial Least Squares (BOSS-PLS) and found BOSS-PLS to be superior with an Rp value of 0.967. The proposed SERS/PCR biosensor proved an efficient and cost-effective alternative to traditional bacterial detection methods.
Electronic nose (e-nose) is a non-destructive and cost-effective technique with increased sensitivity used in food quality and safety monitoring. E-nose uses sensor arrays to detect the effects of odorants in the headspace of samples, simulating the human olfactory system. By applying e-nose, a “fingerprint” of each component in the sample is obtained, which, combined with ML algorithms, provides important information about the sample [128]. One study developed an innovative hybrid model consisting of RF, CNN for local feature extraction, and Gated Recurrent Unit (GRU) for global feature extraction [73]. By employing data from eleven e-nose sensors (including ammonia, hydrogen, and hydrogen sulfide sensors), this hybrid model was able to differentiate between fresh and decayed beef (from twelve different cuts) with higher precision (up to 0.9977) against other ML models such as SVM (0.9864), KNN (0.9887), and CNN (0.9932).
Table 2.
Applications of machine learning algorithms in meat, meat products, and eggs.
Table 2.
Applications of machine learning algorithms in meat, meat products, and eggs.
| Product | Purpose of Study | Data | Machine Learning Algorithm | Output | Year | Reference |
|---|---|---|---|---|---|---|
| Microbiological hazards | ||||||
| Milk and beef | Detection of Escherichia coli O157:H7 | Surface-enhanced Raman scattering–based lateral flow assay | XGBoost 1 | Successfully forecast E. coli in samples spiked with 10 CFU/mL | 2020 | Yan et al. [85] |
| Beef | Prediction of total viable counts of microorganisms | Multispectral imaging (wavelength attributes) | Neuro-fuzzy model MLP 2, SVM 3, PLS 4 | The neuro-fuzzy model achieved the highest accuracy of 0.982 | 2023 | Alshejari et al. [42] |
| Meat, eggs, shellfish, dairy products, infant formula, etc. | Identification of parameters associated with the occurrence of Salmonella spp. | Salmonella spp. occurrence based on: product, region, and stage | RF 5 | Accuracy achieved 77.2% | 2023 | Rodríguez et al. [108] |
| Meat, eggs, dairy products, processed food salad etc. | Identification of potential sources of Campylobacter spp. | Campylobacter spp. occurrence based on product, region, and stage data | RF | Accuracy achieved 83.1% | 2024 | Sacristán et al. [109] |
| Eggs, milk, meats, bakery products etc. | Prevention of foodborne Salmonella outbreaks | Food surveillance data (month, longitude, latitude, area, food prevalence, food categories) | Tree regression, RF, GB 6 | RF and GB (R2 = 0.55) outperformed the tree regression algorithm (R2 = 0.42) | 2024 | Garcia-Vozmediano et al. [76] |
| Chicken | Simultaneous monitoring of multiple pathogens | Listeria monocytogenes, Salmonella, and E. coli O157:H7 detection by paper chromogenic array sensor | DFFNN 7 | Detection as low as 1 log CFU/g with more than 90% accuracy | 2024 | Jia et al. [92] |
| Meat | Spoilage detection | pH sensing patch images dataset | CNN 8 | Accuracy achieved 0.98 | 2024 | Kadian et al. [129] |
| Beef | Prediction of E. coli O157:H7 growth | Shiga toxin-producing E. coli counts | ANN 9, RF, SVM, MLR 10 | RF model exhibited the highest performance (R2 = 0.98) | 2024 | Al et al. [75] |
| Beef | Spoilage detection | Data from 11 e-nose sensors (including ammonia, hydrogen sulfide, and hydrogen sensors) | SVM, KNN, CNN, hybrid (RF and CNN), hybrid (RF, CNN and GRU 10) | The hybrid model of RF, CNN, and GRU achieved 0.9977 accuracy | 2024 | Surjith et al. [73] |
| Chemical hazards | ||||||
| Pork sausages | Monitor residual nitrite concentrations | Hyperspectral imaging (images at the spectral range of 1000–2500 nm) | XGBoost, CATboost 11, LightGBM 12 | XGBoost achieved the highest accuracy (0.999) | 2024 | Son et al. [86] |
| Beef | Predict ofloxacin concentration | Thin-layer chromatography-surface-enhanced Raman scattering sensor | BPNN 13 | A 0.01 ppm sensitivity with an accuracy level of 0.995 | 2024 | Lu et al. [19] |
| Fraud/adulteration detection | ||||||
| Beef | Colorant and curing agent adulteration | Diffuse reflectance spectra, color images (RGB components) | AlexNet (with CNN architecture), SVM, Logistic Regression | AlexNet achieved the highest accuracy at 98.84% | 2023 | Jo et al. [96] |
| Beef | Detection of adulteration with duck meat | Point discharge microplasma optical emission spectrometer (atomic emission spectra) | LDA 14 | Accuracy achieved 99.5% | 2024 | Ren et al. [62] |
| Quality assessment | ||||||
| Eggs | Detection of cracked eggs | Images (RGB components) | SVM | Accuracy achieved 98.75% | 2020 | Haoran et al. [130] |
| Eggs | Detection of defective eggs | Machine vision system (images dataset) | BiLSTM 15 | Accuracy achieved 99.17%. | 2021 | Turkoglu [131] |
| Eggs | Detection of defective eggs | Machine vision system (images dataset), weight measurements | CNN and RF | Accuracy achieved 94.8%, and R2 96.0% | 2023 | Yang et al. [72] |
| Beef | Determine beef quality | RGB images dataset | Deep neural network, LSTM 16, GRU 17, Bi-GRU 18, Bi-LSTM | Bi-LSTM achieved the highest accuracy at 0.989 | 2024 | Büyükarıkan [95] |
1 XGBoost: Extreme Gradient Boosting; 2 MLP: Multilayer Perceptron; 3 SVM: Support Vector Machine; 4 PLS: Partial Least Squares; 5 RF: Random Forest; 6 GB: Gradient Boosting; 7 DFFNN: Deep Feed-Forward Neural Network; 8 CNN: Convolutional Neural Networks; 9 ANN: Artificial Neural Networks; 10 MLR: Multiple Linear Regression; 11 CATboost: Category Boosting; 12 LightGBM: Light Gradient Boosting Machine; 13 BPNN: Back Propagation Neural Network; 14 LDA: Linear Discriminant Analysis; 15 BiLSTM: Bi-Directional Long-Short-Term Memory; 16 LSTM: Long Short-Term Memory; 17 GRU: Gated Recurrent Unit; 18 Bi-GRU: Bi-Directional Gated Recurrent Unit.
Meat spoilage can be easily and accurately detected by measuring the pH value due to the methylamines released during bacterial decomposition. According to reports, fresh meat should have a pH between 5.5 and 6.2, while a pH higher than 6.7 indicates unsafe meat. To detect meat spoilage, Kadian et al. [129] developed a microneedle-based colorimetric pH sensing patch. The sensing patch proof-of-concept study utilized a smartphone to determine the pH levels of spoiled and unspoiled meat samples. A CNN classified the images according to their pH values with an accuracy of 0.98.
Evaluation of the various food chain stages (preharvest, processing, and post-harvest) is necessary to control microbiological hazards [132]. Two studies from Sacristán et al. [109] and Rodríguez et al. [108] used data from the Spanish Agency for Food Safety and Nutrition to identify and assess the occurrence of Campylobacter spp. and Salmonella spp., respectively, in the Spanish food chain employing the RF algorithm.
In the study by Sacristán et al. [109], the RF algorithm showed an accuracy of 83.1%. The results indicated that the presence of Campylobacter spp. was influenced by three variables: primarily product, followed by region and stage of production. Meat products (particularly poultry and sheep) displayed the highest probability of Campylobacter spp. occurrence during the initial, intermediate, and final stages of the food chain, and its presence in the final stage (wholesale and retail) suggests potential consumer exposure to bacteria. Rodríguez et al. [108] employed the RF algorithm, achieving an accuracy of 77.2% (for the model with resampling). The study analyzed how product, region, and stage impacted the presence of Salmonella spp. and found that the primary determining product was meat while the most crucial stage was identified as the slaughterhouse. Pig and poultry meats displayed the highest values and Salmonella spp. probability was defined as high at the initial and final stages (but not in the intermediate stage). The presence of Salmonella spp. in the final stage of the food chain (retail) is particularly concerning as it can cause outbreaks of salmonellosis among the exposed population. Garcia-Vozmediano et al. [76] used food safety audit data from different databases combined with ML algorithms (tree regression, RF, and GB) to predict spatiotemporal patterns of salmonellosis in northwestern Italy. Several factors (including the occurrence of Salmonella spp. in food, spatial characteristics, and efficient monitoring of milk, fruits, vegetables, and meat from pigs) contributed to the predictive power of the models. RF and GB (R2 = 0.55) outperformed the tree regression algorithm (R2 = 0.42). This study demonstrated the effectiveness of combining data from human and veterinary health services in developing predictive models of salmonellosis incidence in humans. In addition, it has been confirmed that such an approach can provide early warning to consumers and mitigate the public health impact of foodborne illnesses.
4.3. Identification of Chemical Hazards
One of the significant chemical hazards posed by consuming ASFs is the presence of antibiotic residues. In livestock and poultry, antibiotics are frequently used to prevent and control infectious diseases. Nevertheless, overuse of antibiotics results in their residues in food, which enter the body through food consumption [133] and can lead to chronic toxicity and antibiotic resistance [134]. The detection of antibiotics in food can be performed using microbiological methods, High-Performance Liquid Chromatography (HPLC), ELISA, and flow cytometry immunochromatography, although these processes have several limitations such as low sensitivity (microbiological methods, ELISA), requirement of trained operators, and tedious sample pre-treatment (HPLC) [135,136,137,138,139]. Using optical biosensors combined with ML algorithms is a promising alternative with several advantages, such as strong anti-interference ability, fast and cost-effective detection, and on-site application [140]. Zhou et al. [112] combined an optical immunosensor with polystyrene nanoparticles with PLS regression to simultaneously detect the presence of chloramphenicol, kanamycin, and neomycin in milk. The optical immunosensor detected antibiotics in a broad linear range from pg/mL to ng/mL within 30 min and exhibited overall accuracy levels above 99%. Another method developed for the detection of antibiotics is the combination of Thin-Layer Chromatography (TLC), SERS spectroscopy, and the PCA-Back Propagation Neural Network by Lu et al. [19]. The method was applied to detect the quinolone antibiotic ofloxacin in beef. The beef juice was cast directly onto the diatomite TLC plate for separation and detection. The sensitivity was recorded at 0.01 ppm, and the process attained an accuracy level 0.995. Liu et al. [113] created a quasi-ratiometric fluorescent probe for detecting the fluoroquinolone antibiotic levofloxacin in milk. A Europium-based metal–organic framework was designed and paired with levofloxacin’s blue autofluorescence to build a detection system with a large linear detection range (0.01–175 μM) and a low detection limit (4.53 nM). A hierarchical clustering algorithm was developed in combination with a smartphone test strip platform to speed up the detection process. The system produced excellent recovery rates (101.7–103.4%) while minimizing deviations. Liu et al. [114] employed SERS and ML to identify the quinolone drugs norfloxacin and ciprofloxacin in milk. A prediction model that utilized various ML methods, such as SVR, RF, and XGBoost, was used to achieve an R2 value of 0.996 with a sensitivity threshold of 10 ppb.
Another important chemical hazard is the presence of mycotoxins, which are secondary metabolites of phytopathogenic fungi that have detrimental effects on both human and animal health. They frequently appear as foodborne contaminants that are introduced during the manufacturing or storage of food [141]. A study performed by Aggarwal et al. [111] applied array sensing with Alizarin Red S and cystamine-derived carbon dot in combination with an XGBoost model for the detection of mycotoxins (citrinin, aflatoxin B1, and ochratoxin A). The method was applied in several foods including milk, obtaining 100% accuracy and detection at low concentrations (10 pmol of mycotoxin).
Residual nitrites present serious health risks in cured meat products. The use of nitrites is vital for creating desirable quality attributes, including flavor enhancement, color development, oxidative stability, and microbiological safety. Although 30% to 60% of nitrites react with the lipids and proteins in the muscles, 5% to 20% of the nitrites remain residual nitrites in the final product. These residual nitrites may react with secondary amines to produce carcinogenic nitrosamines [142]. Son et al. [86] evaluated the combination of hyperspectral imaging and ML algorithms (XGBoost, CATboost, and LightGBM) to predict and monitor the concentrations of residual nitrites in emulsified pork sausages. The hyperspectral imaging measurements were captured through images of the cross-section and lateral sides of sausage samples in line scan mode (with a spectral range of 1000–2500 nm). The resulting analysis indicated that increased nitrite concentrations could affect the protein matrix and hydrogen-bonding capacities, resulting in increased reflectance at approximately 1080 nm and 1280 nm. The accuracy levels of the ML models were XGBoost (0.999), CATboost (0.998), and LightGBM (0.990). Using urea and ice to preserve seafood causes an endothermic reaction that decreases the water temperature as the urea dissolves, extending the fish’s freshness. As a result, seafood is vulnerable to urea contamination. One study [58] investigated the classification of fish samples (mackerel, tuna, and pompano) as safe or unsafe (based on their urea content) through a combination of near-infrared (NIR) spectroscopy (Figure 9) and ML algorithms (DT, KNN, SVM, CNN, and XGBoost) (Table 3). CNN showed the highest accuracy at 83.9%, followed by XGBoost at 81.6%, DT at 79.6%, KNN at 78.9%, and SVM at 78.1%.
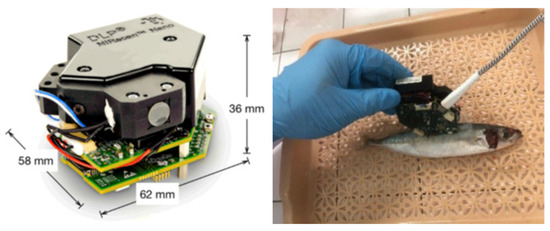
Figure 9.
The NIR device (left). An example of spectrum measurement on fish (right). From Ninh et al. [58].
Table 3.
Applications of machine learning algorithms in fish.
Table 3.
Applications of machine learning algorithms in fish.
| Product | Purpose of Study | Data | Machine Learning Algorithm | Output | Year | Reference |
|---|---|---|---|---|---|---|
| Microbiological hazards | ||||||
| Cod, salmon | Detection of viable pathogens | Paper chromogenic array images dataset for Morganella morganii, Shewanella putrefaciens detection | Neural network | Accuracy reached 90% to 99% | 2022 | Yang et al. [127] |
| Chemical hazards | ||||||
| Fish | IoT 1 sensors for formaldehyde detection, fish freshness detection | Formaldehyde sensor ppm level concentration data, images dataset | CNN 2, DNN 3 | Accuracy reached 99.02% | 2024 | Harish et al. [143] |
| Mackerel, tuna, and pompano species | Classification of fish into safe and unsafe based on urea content | Near-infrared spectroscopy data | DT 4, KNN 5, SVM 6, XGBoost 7, CNN | CNN achieved the highest accuracy at 83.9% | 2024 | Ninh et al. [58] |
| Fish | Determine the freshness and formaldehyde | Formaldehyde sensor data, Images dataset | CNN | Accuracy reached 98.2% | 2024 | Joy et al. [144] |
| Tuna | Assessment of histamine levels | Near-infrared spectroscopy data | PLSR 8, RF 9, SVM | SVM binary and multiclass models achieved the highest accuracy at 100% and 93% respectively | 2025 | Currò et al. [43] |
| Fishery products | Detection of biogenic amines | LA-DBD-TLC-MS 10 data | PCA 11, RF, SVM, MLP 12 | MLP achieved 100% accuracy and detection limit of 0.230 pg/mm2 | 2025 | Zhang et al. [145] |
| Quality assessment | ||||||
| Fish | Evaluation of fish freshness | Images dataset | KNN, SVM, LR 13, RF, ANN 14 | Accuracy ranged from 99.6 to 100% | 2023 | Yasin et al. [48] |
| Salmon and sablefish filets | Quality assessment | Visible near-infrared, short-wave infrared reflectance, and fluorescence spectroscopy data | SOM 15, LDA 16, QDA 17, KNN, RF, SVM, linear regression | The highest accuracy at 95% was obtained from the combination of three spectroscopy modes with LDA | 2023 | Kashani Zadeh et al. [59] |
| Indian sardinella, yellowfin tuna | Quality evaluation | Images dataset | Neural Network architectures FishNET-S and FishNET-T | FishNET-S achieved an accuracy of 84.1% and FishNET-T 68.3% | 2023 | Jayasundara et al. [146] |
| Sea bass | Freshness detection | Raman spectra data | PLS-DA18, SVM, CNN | CNN achieved the highest accuracy at 90.6% | 2023 | Wang et al. [39] |
| Fish | Real-time freshness detection | Temperature, total viable count, total volatile basic nitrogen, K-value, electronic nose, gas chromatography-mass spectrometry, sensory analysis data | BP 19, GA-BP 20, RBF 21, ELM 22 | RBF neural network achieved the highest R2 value at 0.9994 | 2024 | Cui et al. [94] |
| Mackerel, tuna, and pompano Species | Evaluating fish quality based on histamine content | Near-infrared spectroscopy data | DT, KNN, SVM, XGBoost, CNN | CNN achieved the highest accuracy at 93% | 2024 | Ninh et al. [57] |
| Fish | Real-time evaluation of balsa fish freshness | Colorimetric sensor array data | PLSR, RF | RF achieved a higher correlation coefficient of prediction value (0.981) than PLS (0.877) | 2025 | Cao et al. [74] |
1 IoT: Internet of Things; 2 CNN: Convolutional Neural Networks; 3 DNN: Dense Neural Networks; 4 DT Decision Trees; 5 KNN: K-Nearest Neighbors; 6 SVM: Support Vector Machines; 7 XGBoost: Extreme Gradient Boosting; 8 PLSR: Partial Least Square Regression; 9 RF: Random Forest; 10 LA-DBD-TLC-MS: Laser Ablation Dielectric Barrier Discharge Thin-Layer Chromatography-Mass Spectrometry; 11 PCA: Principal Component Analysis; 12 MLP: Multilayer Perceptron; 13 LR: Logistic Regression; 14 ANN: Artificial Neural Networks; 15 SOM: Self-Organized Maps; 16 LDA: Linear Discriminant Analysis; 17 QDA: Quadratic Discriminant Analysis; 18 PLS-DA: Partial Least Squares-Discriminant Analysis; 19 BP: Back Propagation; 20 GA-BP: Genetic Algorithm Back Propagation; 21 RBF: Radial Basis Function; 22 ELM: Extreme Learning Machine.
Histamine is a toxic metabolite created by histamine-producing bacteria during the spoilage and fermentation of fish (and its associated products). It is heat-stable which means that traditional industrial and domestic processes (such as cooking) do not decrease its presence in foodstuffs. Additionally, it does not produce any observable changes in the product; therefore, increasing consumer awareness of its presence may be ineffective in reducing the consumption of histamine-contaminated fish. Currò et al. [43] conducted research concerning histamine contamination in samples of tuna by adopting an integrated approach which combined NIR spectroscopy with innovative ML (Modified Partial Least Squares Regression (MPLS) and SVM).
In this study, samples of tuna were treated with four histamine concentrations (0, 50, 150, and 200 mg/kg). For the quantification prediction, the MPLS (which used the full spectrum) exhibited good (R2CV = 0.88) and approximate (R2P = 0.74) predictive performance when estimating the amount of histamine present in the samples. The SVM classification models—both binary (present/absent) and multiclass (four levels)—exhibited prominent levels of accuracy (100% and 93%, respectively) and effectively identified classes with concentrations above 100 mg/kg. Zhang et al. [145] developed a new LA-DBD-TLC-MS device that automates the detection of histamine, tyramine, putrescine, cadaverine, spermine, and phenylethylamine in fishery products. The system merges a diode laser with DBD plasma ionization and mass spectrometry. The detection limit of the LA-DBD-TLC-MS device reached 0.230 pg/mm2, which matches the detection capabilities of high-performance liquid chromatography-mass spectrometry. ML techniques including PCA, RF, SVM, and MLP proved effective for species categorization and spoilage evaluation while MLP achieved perfect accuracy at 100%.
In fish and seafood, formaldehyde has a natural formation pathway; however, it can be added illegally to extend the shelf life. Harish et al. [143] and Joy et al. [144] conducted research regarding the presence of formaldehyde in fish and the detection of fish freshness. Each study combined IoT sensor technology with neural networks and observed accuracy levels of 99.02% and 98.2%, respectively (Table 3).
4.4. Fraud/Adulteration Detection
Misleading food consumers for financial reasons is known as economically motivated adulteration. Compared to other conventional threats, this practice significantly exacerbates food safety problems because the contaminants are often unconventional and have unknown health effects. Milk is one of the most frequently targeted food commodities in food fraud. Fraudsters used nitrogen-rich substances to tamper with milk protein, based on protein specifications, in order to make the protein values seem genuine [147]. The 2008 melamine-tainted infant formulae outbreak caused acute kidney failure, nephrolithiasis, and other abnormalities of the urinary system in infants and young children, illustrating the seriousness of the human cost of food adulteration [148,149,150]. During the 2013 horsemeat scandal in Europe, it was discovered that food labeled as beef actually contained unreported horse meat [151]. Therefore, an efficient protocol is required to identify adulterants that have not yet been discovered. Chung et al. [115] employed an ensemble ML model consisting of ExtraTrees and XGBoost to identify unprecedented adulteration without seeking for specific ingredients, that is, in a non-targeted method. The study used varying concentrations of potassium sulfate, potassium dichromate, citric acid, sodium citrate, ammonium sulfate, melamine, urea, lactose, glucose, sucrose, maltodextrin, fructose, water, whole milk powder, skim milk powder, starch, soy milk, and trisodium citrate to create adulterated samples for testing. The dataset utilized for this study consisted of compositional data of raw milk (fat, protein, non-fat solid, total solid, lactose, relative density, freezing point depression, and acidity) and Fourier Transform Infrared (FTIR) spectra. The proposed ensemble M model achieved an accuracy level of 0.9924.
A study conducted by Feng et al. [47] employed ML models which used Raman spectra to identify dairy fraud. The study combined a LightGBM, RF, and XGBoost with the CARS algorithm as a feature extraction method. The accuracy of each of the adopted algorithms exceeded 90% when differentiating between dairy brands. Additionally, following synergistic combination, the fusion model attained an accuracy level of 99%. Aqeel et al. [116] investigated methods to detect milk adulteration, employing both destructive and nondestructive approaches. The destructive method utilized the Lactoscan system to measure milk properties such as solids-not-fat, density, fat, lactose, conductivity, protein, temperature, and pH. Hyperspectral imaging in the 397–1,003 nm range captured spectral signatures for the nondestructive method. The sample set contained 50 pure samples and 400 samples contaminated with salicylic acid, boric acid, glucose and formalin which underwent processing through radiometric correction and picture scaling methods. One-vs-One LDA achieved perfect validation accuracy of 100% which made it stand out as the most effective algorithm among Logistic Regression, DT, SVM, and LDA. Hyperspectral imaging and ML algorithms performed better than conventional methods in detecting milk adulteration.
Jo et al. [96] developed a deep-learning model based on diffuse reflectance spectroscopy and color images for the identification of counterfeit beef which had been modified to resemble fresh product. The AlexNet model (which utilizes CNN) was applied to the samples using a spectral range of 344–1040 nm and achieved a classification accuracy of 98.84%. In order to detect beef adulteration and enable on-site food freshness assessments, Ren et al. [62] integrated a portable device based on a point discharge microplasma optical emission spectrometer with ML. This device was incorporated into two modular injection units (headspace solid-phase microextraction and headspace purge) to facilitate sample evaluation. This approach was effective at detecting the adulteration of beef samples (containing variable amounts of duck meat) with an accuracy level of 99.5% using LDA.
4.5. Food Quality Assessment
4.5.1. Milk Quality
Subclinical mastitis in cows may impact the nutritional composition of milk and compromise consumer safety. It does not instigate any observable changes in the udder or the milk; therefore, it is more challenging to identify than clinical mastitis. A study conducted by da Silva Pereira et al. [65] examined the use of NIR spectroscopy by utilizing a portable spectrometer to identify milk which had been contaminated with subclinical mastitis. PCA, PLS-DA, RF, and SVM were employed to analyze the NIR spectra. The PCA disclosed that the clustering of mastitis and non-mastitis milk samples correlated with lactose content fluctuations, which aligns with the PLS-DA (which achieved an accuracy of 78%). RF and SVM both attained accuracy levels of 62% in detecting mastitis milk. However, it should be noted that RF displayed higher levels of sensitivity (recall) of 78% for detecting mastitis, while SVM achieved elevated levels of accuracy for detecting non-mastitis milk (81%). Additionally, the use of an Isolation Forest to eradicate outliers enhanced the performance of RF and SVM models based on NIR spectra and improved precision by up to 25%. The results of this research indicate that the portable spectrometer shows potential as a screening method for the detection of mastitis milk samples in the dairy industry. Satoła and Satoła [40] employed ML to classify Polish Holstein–Friesian cows as healthy or at risk of subclinical mastitis. Their research utilized a dataset containing information gathered during routine milk procedures such as daily milk yield; fat, protein, and lactose percentage; milk urea concentration; and somatic cell count (SCC). They created ensemble ML models (specifically bagging, boosting, stacking, and super-learner) and single ML models (such as SVM, LR, GNB, KNN, and DT). GB (0.767) and SVM (0.767) exhibited the highest levels of accuracy for the training datasets, followed by Super-Learner LR (0.765), LR (0.765), RF (0.763), Voting Ensemble RFC (0.754), GNB (0.753), KNN (0.736), and DT (0.685). Bobbo et al. [41] combined a dataset containing routine milk recording procedures and climatic data with ML algorithms (Generalized Linear Model (GLM), SVM, RF, and neural networks) to predict the existence or nonexistence of subclinical mastitis among Italian Mediterranean buffalo. When examining the data, the most relevant animal-based information concerned Somatic Cell Score, differential SCC, electrical conductivity, and milk production. Among the climate data, the most useful features concerned temperature and relative humidity. The SVM was the most effective method for predicting an elevated or reduced somatic cell count at the subsequent test-day record in the validation set; therefore, this approach was employed to appraise the contribution of each characteristic to the most appropriate model. The neural network was the most effective at making predictions on the test set. Splitting the original dataset by record obtained the following levels of accuracy: GLM (0.752), SVM (0.739), RF (0.740), and the neural network (0.754).
4.5.2. Meat Quality
The quality and color of meat are influenced by various factors, including temperature, microbial activity, humidity, and freezing and thawing. To assess meat quality and safety, both subjective and objective evaluation methods are employed [152]. Since subjective evaluation relies on appearance to gauge quality, replicating results can be challenging [153]. Laboratory tests are utilized to determine several meat characteristics in objective evaluation, including pH, color, temperature, and microbial testing [154]. These evaluation methods can result in significant food waste and are time-consuming. Alternatively, color analysis can be conducted using computer vision. The researchers of [95] carried out a non-destructive assessment of beef quality (fresh, half-fresh, and spoiled) based on RGB images obtained for color analysis. This was accomplished by combining learning-based global and handcrafted color features through the LSTM, bi-directional long short-term memory (Bi-LSTM), GRU, and bi-directional Gated Recurrent Unit (Bi-GRU) of the neural networks. The highest levels of accuracy (0.989) were achieved via an amalgamation of the following features: Visual Geometry Group 16 (VGG16); hue, lightness, and saturation (HLS); hue, saturation, and value (HSV); RGB; and Bi-LSTM neural network.
4.5.3. Fish Quality
Ninh et al. [57] combined NIR spectroscopy with ML techniques to classify fish samples (mackerel, tuna, and pompano) as either safe or unsafe according to whether their histamine content exceeded the permissible limit of 100 ppm. When combined with an optimized CNN, a feature extraction technique (using pre-processed NIR spectra and their second derivatives) surpassed the accuracy of traditional ML classifiers (DT—87.2%, KNN—83.2%, SVM—86.3%, and XGBoost—90.3%) by exhibiting an accuracy of 93.1%. To facilitate the efficient classification of the quality of sea bass filets, Wang et al. [39] employed a CNN to model Raman spectra data. This study concluded that ANOVA was a suitable method for extracting the Raman spectral features and that the most effective model for assessing the freshness of sea bass fillets was the feature-selected CNN model, which produced a classification accuracy of 90.6%. Kashani Zadeh et al. [59] combined data fusion of visible near-infrared (VIS-NIR) with Short Wave Infrared (SWIR) and fluorescence spectroscopy data to classify the condition of salmon and sablefish as either fresh or spoiled. This research utilized several ML algorithms (including PCA, SOM, LDA, QDA, KNN, RF, SVM, and LR). The results demonstrated that multi-mode spectroscopy achieved 95% accuracy and enhanced the precision of single-mode spectroscopies as follows: FL by 26%, VIS-NIR by 10%, and SWIR by 9%.
Yasin et al. [48] used KNN, SVM, ANN, RF, and LR ML algorithms to classify the freshness of fish by employing an image dataset of deceased fish which had been categorized as either fresh or stale. Following this, SqueezeNet and InceptionV3 algorithms were utilized for the feature extraction process. The results of the study revealed that the SVM, ANN, and LR models result in an accuracy rate of 100% for each ML algorithm while accuracy for RF was 99.7% and KNN was 99.9%. Jayasundara et al. [146] employed two Convolutional Neural Network architectures (FishNET-S and FishNET-t) to evaluate the quality of Indian Sardinella and Yellowfin Tuna via RGB images taken by smartphone cameras. The selected CNN architectures employ two different methodologies: FishNET-S is founded on the VGG-16 with the addition of a Block Attention Module (BAM) which directs the model to learn the physical features associated with evaluating the quality of a fish (specifically via the area around the eye region); contrastingly, FishNET-T conducts a color decomposition analysis (based on saturation, hue, and transformations in intensity) and forwards the saturation and hue elements to the CNN to determine the quality grade of each fish via its flesh. This research reveals that FishNET-S has attained an accuracy level of 84.1% and FishNET-T has an accuracy level of 68.3%. A comparison analysis of these two architectures (conducted via standard ML and advanced deep learning models) concludes that the performance of FishNET-S and FishNET-T is superior to that of alternative models.
A study conducted by Cao et al. [74] created a colorimetric sensor array to facilitate the real-time monitoring of the freshness of balsa fish. This was achieved by loading various acid-base indicators onto Attapulgite/Polyimide Nanofiber Composite Aerogels (ATP/PI NFAs). PCA was utilized for feature extraction and, subsequently, PLS and RF regression models were established via the preferred color characteristic values. The correlation coefficient of prediction (Rp) values are as follows: PLS (0.877) and RF (0.981).
Cui et al. [94] applied Back Propagation (BP), Radial Basis Function (RBF), Genetic Algorithm-BP (GA-BP), and ELM to predict the shelf life of five varieties of marine fish (Sciaenops ocellatus, Epinephelus akaara, Trachinotus ovatus, Larimichthys crocea, and Rainbow trout). The dataset contained several parameters including temperature, total viable count, total volatile basic nitrogen, K-value, electronic nose-Gas Chromatography-Tandem Mass Spectrometry (GC-Ms/Ms), and sensory evaluation. The R2 values were reported as follows: RBF neural network (0.9994), GA-BP (0.9989), ELM (0.9986), and BP (0.9981).
4.5.4. Egg Quality
For both financial and safety reasons, separating defective eggs (i.e., those that are cracked, dirty, or externally contaminated) from quality eggs is a critical issue. One study developed a real-time machine vision system based on deep learning to facilitate the identification of defective eggs [131]. In this procedure, a pre-trained residual network model extracted deep features, which were then supplied to the Bi-LSTM neural network. The effectiveness of this approach was evaluated by presenting a selection of defective and quality eggs to the machine vision system, resulting in an impressive accuracy level of 99.17%. Another study by Haoran et al. [130] utilized SVM to create an egg crack image recognition method. The image of the egg crack was pre-processed to eliminate environmental noise and enhance the efficient extraction of the egg crack area. This process enabled the model to achieve accuracy levels of 98.75%, confirming its recognition and classification capabilities.
5. Summary of Findings
The implementation of ML algorithms in ASF food safety procedures has led to substantial improvements in risk assessment while enabling better hazard identification, fraud detection, and quality evaluation. ML models such as neural networks (MLP, LSTM, CNN), SVM, and RF algorithms are frequently applied to large datasets from spectroscopic techniques, imaging methods, and sensor-based monitoring. Neural networks demonstrate superior performance when processing complex imaging and sensor data but present challenges in interpretability, while SVM and RF models provide better interpretability and stronger protection against overfitting. Implementing WHO’s GEMS and the EU’s RASFF databases improved predictive food safety risk monitoring models by enhancing early hazard detection abilities. ML models combined with new technologies like electronic noses and hyperspectral imaging enable quick and precise non-invasive tests of microbiological and chemical hazards, significantly impacting food safety.
The deployment of unsupervised AE networks and Bayesian models for anomaly detection in dairy supply chains represents a significant innovation in early warning systems. ML techniques applied to HACCP monitoring through remote sensor diagnostics like the BEST system demonstrate a transition to automated real-time food safety solutions. New sensor-based techniques such as fluorescence-labeled DNA probes and paper chromogenic arrays have made fast pathogen detection possible for milk, meat, and seafood products. The new detection methods outperform traditional culture-based techniques in terms of speed and sensitivity since neural network models produce pathogen identification classification accuracies above 90%. IoT-connected models show exceptional accuracy when measuring spoilage signals such as volatile organic compounds and formaldehyde in seafood, which marks a shift towards advanced food monitoring systems.
ML applications have a significant impact on food in the detection of chemical hazards and represent a novel path for innovative advancements. ML models, including XGBoost, LightGBM, and CNN, have been integrated with optical biosensors and Raman spectroscopy alongside hyperspectral imaging to achieve near-perfect detection rates for antibiotic residues as well as mycotoxins and nitrite levels. ML-enhanced sensors enable quick multi-contaminant detection which revolutionizes traditional labor-heavy laboratory approaches. Non-targeted ML techniques like ensemble learning and deep-learning spectral analysis now enable fraud detection in dairy and meat products to achieve unprecedented accuracy levels. Portable spectrometers combined with smartphone classifiers make food safety diagnostics more accessible and provide affordable on-site detection options.
Another impactful application of ML is the detection of food adulteration. The melamine contamination of infant formula underscored the necessity for enhanced ML techniques. The ExtraTrees and XGBoost ensemble learning models successfully identified milk adulteration by utilizing compositional data in conjunction with FTIR spectral analysis. Deep learning-based spectral analysis tools have served to detect fraudulent changes in beef products while promoting transparent labeling. ML applications enhance food safety and protect consumers from fraud and health risks which improves the security and reliability of the global food supply chain.
This study demonstrates the capability of ML to revolutionize food safety methods by replacing traditional reactive measures with proactive real-time monitoring systems. ML combined with new digital and sensor technologies now allows fast and precise evaluations throughout the food supply chain starting from production until retail. This study surpasses former literature reviews [6,16,17,25,28,30,155,156] by merging deep learning and big data analysis with sensor-based food safety monitoring and HACCP systems to enhance food safety risk management in ASF. Reviewed studies enhance food safety monitoring through higher accuracy and scalability which results in better proactive management abilities than those offered by traditional risk assessment techniques.
6. Categorization of Machine Learning Applications in Food Safety, Limitations, and Future Directions
The field of food safety has been revolutionized by ML which provides versatile applications in multiple areas. Auto-encoder networks and Bayesian models as ML tools in risk assessment help detect hazards early, which enhances both real-time monitoring and regulatory compliance. These applications encounter difficulties due to demanding computational requirements and challenges in data integration. Fluorescence-labeled DNA probes and chromogenic sensors enable the quick non-invasive detection of pathogens, which helps minimize contamination risks in microbiological hazard detection. Despite technological progress, these methods still face problems with detecting background microflora and environmental fluctuations.
ML applications help chemical hazard identification processes by combining optical biosensors and Raman spectroscopy to achieve a better detection accuracy of harmful chemicals. Although these methods improve food safety, they depend on expensive technological solutions and regulatory permissions which act as barriers to broad implementation. ML serves as an important tool for detecting fraud and adulteration by utilizing ensemble learning models and spectral analysis approaches to authenticate food goods and combat economic fraud. When detecting various forms of adulterants, these models require big datasets to ensure proper generalization.
Neural networks used in food quality assessments predict both freshness and spoilage which helps to reduce food waste and ensure quality control but model precision suffers due to environmental fluctuations. Smart packaging and storage systems with integrated ML technology and IoT-enabled e-nose sensors deliver real-time monitoring of food quality while improving shelf life. These technological advancements encounter adoption challenges because of their expensive infrastructure requirements. ML advancements in food safety remain limited without further research into cost efficiency and standardization to enable regulatory compliance for expanded use.
ML and sensor-based technologies reveal promise in food safety monitoring but encounter major limitations. The training and validation of ML models depend on extensive high-quality datasets which often reveal inconsistencies and gaps when transferred to various food production systems or regional contexts. Different data sources with chemical contaminants and microbiological hazards create biases which reduce model generalizability. Unsupervised models and advanced neural networks perform exceptionally well at detecting foodborne pathogens and contaminants. Food safety professionals cannot comprehend how results are obtained because the decision-making processes of these technologies stay unclear [73]. The deployment of paper chromogenic arrays and e-nose systems results in quick detection capabilities and high sensitivity but faces practical deployment difficulties because of high costs and scalability challenges and environmental interference in real-world applications [92,157].
Future research needs to prioritize developing standardized datasets accessible to the public and cover a range of food matrices and hazards from various regions. This initiative will boost the adaptability of models across different applications and improve the robustness of predictive analytics in diverse settings. As ML models become more intricate, their development must integrate features to support non-expert users in making well-informed decisions. Future studies ought to investigate ML models that combine spectroscopic methods with e-nose sensor arrays and real-time monitoring systems to enhance accuracy in detecting contamination from both chemical and microbiological hazards. Additionally, research should prioritize the integration of ML and IoT technology to create automated systems for monitoring food safety in real-time. The employment of AI on portable spectrometers, along with hyperspectral imaging and biosensors, allows users to make decisions on-site. Self-learning ML models, such as reinforcement learning, hold the potential to reduce labeled data requirements while enhancing adaptability and predictive accuracy, which will facilitate the cost-effective scaling of ML food safety systems.
7. Conclusions
As the landscape and scope of food safety evolve, it is evident that ML can have a positive impact on quality assurance protocols throughout the agri-food sector. To our knowledge, studies that explicitly linked ML with HACCP monitoring in ASFs are limited. The findings of this review emphasize the revolutionary potential for ML to reinforce and enhance existing food safety and HACCP monitoring protocols in the domain of ASFs. However, as supervised and unsupervised ML algorithms continue to augment the detection of anomalies and enhance the risk prediction of foodborne pathogens, proactive monitoring and analysis become increasingly necessary. Adopting spectroscopic techniques, such as NIR, FTIR, and Raman spectroscopy, could complement ML algorithms and facilitate the development of rapid and non-destructive techniques for analyzing Animal-Source Foods. Advancements in sensory technology (including smartphone-based sensors and paper chromogenic arrays) permit the implementation of real-time monitoring techniques for assessing food freshness and detecting pathogens to enhance food safety management. Additionally, machine vision and neural networks provide a rapid and non-destructive alternative to the currently established methodologies. To further enhance food safety, future research should explore the use of real-time monitoring paradigms (involving ML algorithms) to assess data along the entire food supply chain continuously.
Author Contributions
Conceptualization, P.-K.R., E.T., A.B. and I.F.S.; methodology, P.-K.R., E.T., A.B. and I.F.S.; formal analysis, P.-K.R.; literature research, P.-K.R., E.T., A.B. and I.F.S.; writing—original draft preparation, P.-K.R.; writing—review and editing, E.T., A.B. and I.F.S.; visualization, P.-K.R. and A.B.; project administration, P.-K.R., E.T., A.B., and I.F.S.; funding acquisition, P.-K.R., A.B. and I.F.S. All authors have read and agreed to the published version of the manuscript.
Funding
This research received no external funding.
Institutional Review Board Statement
Not applicable.
Informed Consent Statement
Not applicable.
Data Availability Statement
No new data were created or analyzed in this study. Data sharing is not applicable to this article.
Conflicts of Interest
The authors declare no conflicts of interest.
Abbreviations
The following abbreviations are used in this manuscript:
| ML | Machine Learning |
| HACCP | Hazard Analysis Critical Control Points |
| ASF | Animal-Source Foods |
| ANOVA | Analysis of Variance |
| RFE | Recursive Feature Elimination |
| GA | Genetic Algorithms |
| LASSO | Least Absolute Shrinkage and Selection Operator |
| CNN | Convolutional Neural Networks |
| PLS | Partial Least Squares |
| PCA | Principal Component Analysis |
| CARS | Competitive Adaptive Reweighted Sampling |
| NB | Naive Bayes |
| DT | Decision Trees |
| KNN | K-Nearest Neighbors |
| SVM | Support Vector Machine |
| LR | Logistic Regression |
| RF | Random Forest |
| DA | Discriminant Analysis |
| GB | Gradient Boosting |
| GNB | Gaussian Naïve Bayes |
| LDA | Linear Discriminant Analysis |
| PLS-DA | Partial Least Squares-Discriminant Analysis |
| PLSR | Partial Least Squares Regression |
| XGBoost | Extreme Gradient Boosting |
| LightGBM | Light Gradient Boosting Machine |
| CatBoost | Category boosting |
| ANN | Artificial Neural Networks |
| SLP | Single-Layer Perceptron |
| MLP | Multilayer Perceptron |
| RBNN | Radial Basis Neural Networks |
| ELM | Extreme Learning Machines |
| SOM | Self-organizing Map |
| ART | Adaptive Resonance Theory |
| LSTM | Long Short-Term Memory |
| AE | Auto-encoder |
| AM1 | Aflatoxin M1 |
| GEMS | Global Environmental Monitoring System |
| RASFF | Rapid Alert System for Food and Feed |
| KAP | Quality Program for Agricultural Products |
| POPAs | Points of Particular Attention |
| CDC | Centers for Disease Control and Prevention |
| PPC | Post-Pasteurization Contamination |
| ELISA | Enzyme-Linked Immunosorbent Assay |
| SVC | Support Vector Classifier |
| SVR | Support Vector Regression |
| KAN | Kolmogorov–Arnold Networks |
| DFFNN | Deep Feed-Forward Neural Network |
| GRU | Gated Recurrent Unit |
| HPLC | High-Performance Liquid Chromatography |
| TLC | Thin-Layer Chromatography |
| SERS | Surface-Enhanced Raman Scattering |
| NIR | Near-Infrared |
| MPLS | Modified Partial Least Squares Regression |
| FTIR | Fourier Transform Infrared |
| SCC | Somatic Cell Count |
| GLM | Generalized Linear Model |
| Bi-LSTM | Bi-Directional Long-Short-Term Memory |
| Bi-GRU | Bi-Directional Gated Recurrent Unit |
| VGG16 | Visual Geometry Group 16 |
| RGB | Red, Green, Blue |
| HLS | Hue, Lightness, Saturation |
| HSV | Hue, Saturation, Value |
| ATP/PI NFAs | Attapulgite/Polyimide Nanofiber Composite Aerogels |
| BP | Back Propagation |
| RBF | Radial Basis Function |
| GA-BP | Genetic Algorithm-Back Propagation |
| GC-Ms/Ms | Gas Chromatography-Tandem Mass Spectrometry |
| NMS | Nonfat Milk Solid |
| LOF | Local Outlier Factor |
| COF | Connectivity-Based Outlier Factor |
| SO-GAAL | Single-Objective Generative Adversarial Active Learning |
| BN | Bayesian Network |
| WHO | World Health Organization |
| KAN | Kolmogorov–Arnold Networks |
| MMI | Multimodel Inference |
| MLR | Multiple Linear Regression |
| BPNN | Back Propagation Neural Network |
| DNN | Dense Neural Networks |
| QDA | Quadratic Discriminant Analysis |
| VIS-NIR | Visible Near-Infrared |
| SWIR | Short Wave Infrared |
| LA-DBD-TLC-MS | Laser Ablation Dielectric Barrier Discharge Thin-Layer Chromatography-Mass Spectrometry |
| VCPA-PLS | Variable Combined Cluster Analysis Partial Least-Squares |
| RF-PLS | Randomized Frog Hopping Partial Least-Squares |
| BOSS-PLS | Bootstrap Flexible Shrinkage Variable Selection Partial Least Squares |
| PCR | Polymerase Chain Reaction |
References
- Sheffield, S.; Fiorotto, M.L.; Davis, T.A. Nutritional Importance of Animal-Sourced Foods in a Healthy Diet. Front. Nutr. 2024, 11, 1424912. [Google Scholar] [CrossRef] [PubMed]
- Newell, D.G.; Koopmans, M.; Verhoef, L.; Duizer, E.; Aidara-Kane, A.; Sprong, H.; Opsteegh, M.; Langelaar, M.; Threfall, J.; Scheutz, F.; et al. Food-Borne Diseases—The Challenges of 20 Years Ago Still Persist While New Ones Continue to Emerge. Int. J. Food Microbiol. 2010, 139 (Suppl. 1), S3–S15. [Google Scholar] [CrossRef]
- Grace, D. Food Safety in Low and Middle Income Countries. Int. J. Environ. Res. Public Health 2015, 12, 10490–10507. [Google Scholar] [CrossRef]
- Frazzoli, C.; Mantovani, A. Toxicants Exposures as Novel Zoonoses: Reflections on Sustainable Development, Food Safety and Veterinary Public Health. Zoonoses Public Health 2010, 57, e136–e142. [Google Scholar] [CrossRef]
- Vilar, M.J.; Rodríguez-Otero, J.L.; Sanjuán, M.L.; Diéguez, F.J.; Varela, M.; Yus, E. Implementation of HACCP to Control the Influence of Milking Equipment and Cooling Tank on the Milk Quality. Trends Food Sci. Technol. 2012, 23, 4–12. [Google Scholar] [CrossRef]
- Prache, S.; Adamiec, C.; Astruc, T.; Baéza-Campone, E.; Bouillot, P.E.; Clinquart, A.; Feidt, C.; Fourat, E.; Gautron, J.; Girard, A.; et al. Review: Quality of Animal-Source Foods. Animal 2022, 16, 100376. [Google Scholar] [CrossRef] [PubMed]
- Garcia, M.; Fearne, A.; Caswell, J.; Henson, S. Co-Regulation as a Possible Model for Food Safety Governance: Opportunities for Public-Private Partnerships. Food Policy 2007, 32, 299–314. [Google Scholar] [CrossRef]
- Owusu-Apenten, R.; Vieira, E. Food Safety Management, GMP & HACCP. In Elementary Food Science; Springer: Cham, Switzerland, 2023; pp. 217–236. ISBN 978-3-030-65431-3. [Google Scholar]
- Mortimore, S.; Wallace, C. An Introduction to HACCP and Its Role in Food Safety Control. In HACCP: A Practical Approach; Mortimore, S., Wallace, C., Eds.; Springer US: Boston, MA, USA, 2013; pp. 1–36. ISBN 978-1-4614-5028-3. [Google Scholar]
- Awuchi, C.G. HACCP, Quality, and Food Safety Management in Food and Agricultural Systems. Cogent Food Agric. 2023, 9, 2176280. [Google Scholar] [CrossRef]
- Wallace, C.; Sperber, W.; Mortimore, S. Food Safety for the 21st Century: Managing HACCP and Food Safety Throughout the Global Supply Chain; Wiley: Hoboken, NJ, USA, 2010; p. 310. ISBN 978-1-4051-8911-8. [Google Scholar]
- Noordhuizen, J.; da Silva, J.C.; Boersema, S.-J.; Vieira, A. Critical Control Points (CCP) and Points of Particular Attention (POPA): Their Standards and Tolerances or Targets, Their Monitoring, and Corrective Measures. In Applying HACCP-Based Quality Risk Management on Dairy Farms; Brill: Leiden, The Netherlands, 2007. [Google Scholar]
- Huang, J.Y. Infection with Pathogens Transmitted Commonly Through Food and the Effect of Increasing Use of Culture-Independent Diagnostic Tests on Surveillance—Foodborne Diseases Active Surveillance Network, 10 U.S. Sites, 2012–2015. MMWR Morbidity Mortal. Wkly. Rep. 2016, 65, 368–371. [Google Scholar] [CrossRef]
- Pandey, V.K.; Srivastava, S.; Dash, K.K.; Singh, R.; Mukarram, S.A.; Kovács, B.; Harsányi, E. Machine Learning Algorithms and Fundamentals as Emerging Safety Tools in Preservation of Fruits and Vegetables: A Review. Processes 2023, 11, 1720. [Google Scholar] [CrossRef]
- Shine, P.; Murphy, M.D. Over 20 Years of Machine Learning Applications on Dairy Farms: A Comprehensive Mapping Study. Sensors 2022, 22, 52. [Google Scholar] [CrossRef] [PubMed]
- Lin, Y.; Ma, J.; Wang, Q.; Sun, D.-W. Applications of Machine Learning Techniques for Enhancing Nondestructive Food Quality and Safety Detection. Crit. Rev. Food Sci. Nutr. 2023, 63, 1649–1669. [Google Scholar] [CrossRef]
- Yu, W.; Ouyang, Z.; Zhang, Y.; Lu, Y.; Wei, C.; Tu, Y.; He, B. Research Progress on the Artificial Intelligence Applications in Food Safety and Quality Management. Trends Food Sci. Technol. 2025, 156, 104855. [Google Scholar] [CrossRef]
- Zuo, E.; Du, X.; Aysa, A.; Lv, X.; Muhammat, M.; Zhao, Y.; Ubul, K. Anomaly Score-Based Risk Early Warning System for Rapidly Controlling Food Safety Risk. Foods 2022, 11, 2076. [Google Scholar] [CrossRef]
- Lu, X.; Ma, Y.; Jiang, S.; Wang, Z.; Yu, Q.; Ji, C.; Guo, J.; Kong, X. Quantitative Monitoring Ofloxacin in Beef by TLC-SERS Combined with Machine Learning Analysis. Spectrochim. Acta—Part A: Mol. Biomol. Spectrosc. 2024, 308, 123790. [Google Scholar] [CrossRef]
- El Naqa, I.; Murphy, M.J. What Is Machine Learning? In Machine Learning in Radiation Oncology: Theory and Applications; El Naqa, I., Li, R., Murphy, M.J., Eds.; Springer International Publishing: Cham, Switzerland, 2015; pp. 3–11. ISBN 978-3-319-18305-3. [Google Scholar]
- Liberty, J.T.; Habanabakize, E.; Adamu, P.I.; Bata, S.M. Advancing Food Manufacturing: Leveraging Robotic Solutions for Enhanced Quality Assurance and Traceability across Global Supply Networks. Trends Food Sci. Technol. 2024, 153, 104705. [Google Scholar] [CrossRef]
- Curti, P.d.F.; Selli, A.; Pinto, D.L.; Merlos-Ruiz, A.; Balieiro, J.C.d.C.; Ventura, R.V. Applications of Livestock Monitoring Devices and Machine Learning Algorithms in Animal Production and Reproduction: An Overview. Anim. Reprod. 2023, 20, e20230077. [Google Scholar] [CrossRef] [PubMed]
- Dineva, K.; Atanasova, T. Health Status Classification for Cows Using Machine Learning and Data Management on AWS Cloud. Animals 2023, 13, 3254. [Google Scholar] [CrossRef]
- Ding, H.; Tian, J.; Yu, W.; Wilson, D.; Young, B.; Cui, X.; Xin, X.; Wang, Z.; Li, W. The Application of Artificial Intelligence and Big Data in the Food Industry. Foods 2023, 12, 4511. [Google Scholar] [CrossRef]
- Rugji, J.; Erol, Z.; Taşçı, F.; Musa, L.; Hamadani, A.; Gündemir, M.G.; Karalliu, E.; Siddiqui, S.A. Utilization of AI—Reshaping the Future of Food Safety, Agriculture and Food Security—A Critical Review. Crit. Rev. Food Sci. Nutr. 2024, 1–45. [Google Scholar] [CrossRef]
- van Leeuwen, S.P.J.; Verschoor, A.M.; van der Fels-Klerx, H.J.; van de Schans, M.G.M.; Berendsen, B.J.A. A Novel Approach to Identify Critical Knowledge Gaps for Food Safety in Circular Food Systems. npj Sci. Food 2024, 8, 34. [Google Scholar] [CrossRef] [PubMed]
- Cabrera, V.E.; Bewley, J.; Breunig, M.; Breunig, T.; Cooley, W.; De Vries, A.; Fourdraine, R.; Giordano, J.O.; Gong, Y.; Greenfield, R.; et al. Data Integration and Analytics in the Dairy Industry: Challenges and Pathways Forward. Animals 2025, 15, 329. [Google Scholar] [CrossRef]
- Dhal, S.B.; Kar, D. Leveraging Artificial Intelligence and Advanced Food Processing Techniques for Enhanced Food Safety, Quality, and Security: A Comprehensive Review. Discov. Appl. Sci. 2025, 7, 75. [Google Scholar] [CrossRef]
- Ikram; Mehmood, H.; Arshad, M.T.; Rasheed, A.; Noreen, S.; Gnedeka, K. Applications of Artificial Intelligence (AI) in Managing Food Quality and Ensuring Global Food Security. CyTA—J. Food 2024, 22, 2393287. [Google Scholar] [CrossRef]
- Wang, X.; Bouzembrak, Y.; Lansink, A.O.; van der Fels-Klerx, H.J. Application of Machine Learning to the Monitoring and Prediction of Food Safety: A Review. Compr. Rev. Food Sci. Food Saf. 2022, 21, 416–434. [Google Scholar] [CrossRef]
- Gbashi, S.; Njobeh, P.B. Enhancing Food Integrity through Artificial Intelligence and Machine Learning: A Comprehensive Review. Appl. Sci. 2024, 14, 3421. [Google Scholar] [CrossRef]
- Mu, W.; Kleter, G.A.; Bouzembrak, Y.; Dupouy, E.; Frewer, L.J.; Radwan Al Natour, F.N.; Marvin, H.J.P. Making Food Systems More Resilient to Food Safety Risks by Including Artificial Intelligence, Big Data, and Internet of Things into Food Safety Early Warning and Emerging Risk Identification Tools. Compr. Rev. Food Sci. Food Saf. 2024, 23, e13296. [Google Scholar] [CrossRef]
- Yaseer, A.; Chen, H. A Review of Sensors and Machine Learning in Animal Farming. In Proceedings of the 2021 IEEE 11th Annual International Conference on CYBER Technology in Automation, Control, and Intelligent Systems (CYBER), Jiaxing, China, 27–31 July 2021; pp. 747–752. [Google Scholar]
- Suthar, A.P.; Sindhi, S.H.; Kathiriya, J.B.; Sharma, A.K.; Singh, V.K.; Bhedi, K.R. Use of Artificial Intelligence (AI) in Ensuring Quality and Safety of Food of Animal Origin: A Review. Int. J. Vet. Sci. Anim. Husb. 2024, 9, 240–247. [Google Scholar] [CrossRef]
- Subramanian, J.; Simon, R. Overfitting in Prediction Models—Is It a Problem Only in High Dimensions? Contemp. Clin. Trials 2013, 36, 636–641. [Google Scholar] [CrossRef]
- Pudjihartono, N.; Fadason, T.; Kempa-Liehr, A.W.; O’Sullivan, J.M. A Review of Feature Selection Methods for Machine Learning-Based Disease Risk Prediction. Front. Bioinform. 2022, 2, 927312. [Google Scholar] [CrossRef]
- Sarker, I.H. Machine Learning: Algorithms, Real-World Applications and Research Directions. SN Comput. Sci. 2021, 2, 160. [Google Scholar] [CrossRef] [PubMed]
- Motoda, H.; Liu, H. Feature Selection, Extraction and Construction; Communication of IICM; Institute of Information and Computing Machinery: Taipei, Taiwan, 2002; Volume 5, pp. 67–72. [Google Scholar]
- Wang, K.; Yue, Z.; Lin, H.; Wang, Q.; Wang, L.; Tian, Y.; Ren, L. Rapid Classification of the Freshness Grades of Sea Bass (Lateolabrax japonicus) Fillets Using a Portable Raman Spectrometer with Machine Learning Method. Microchem. J. 2023, 192, 108948. [Google Scholar] [CrossRef]
- Satoła, A.; Satoła, K. Performance Comparison of Machine Learning Models Used for Predicting Subclinical Mastitis in Dairy Cows: Bagging, Boosting, Stacking, and Super-Learner Ensembles versus Single Machine Learning Models. J. Dairy Sci. 2024, 107, 3959–3972. [Google Scholar] [CrossRef]
- Bobbo, T.; Matera, R.; Pedota, G.; Manunza, A.; Cotticelli, A.; Neglia, G.; Biffani, S. Exploiting Machine Learning Methods with Monthly Routine Milk Recording Data and Climatic Information to Predict Subclinical Mastitis in Italian Mediterranean Buffaloes. J. Dairy Sci. 2023, 106, 1942–1952. [Google Scholar] [CrossRef] [PubMed]
- Alshejari, A.; Kodogiannis, V.S.; Leonidis, S. Combining Feature Selection Techniques and Neurofuzzy Systems for the Prediction of Total Viable Counts in Beef Fillets Using Multispectral Imaging. Sensors 2023, 23, 9451. [Google Scholar] [CrossRef]
- Currò, S.; Savini, F.; Fasolato, L.; Indio, V.; Tomasello, F.; Rampazzo, G.; Zironi, E.; Pagliuca, G.; Gazzotti, T.; Prandini, L.; et al. Application of Near-Infrared Spectroscopy as at Line Method for the Evaluation of Histamine in Tuna Fish (Thunnus albacares). Food Control 2025, 167, 110778. [Google Scholar] [CrossRef]
- Hayes, E.; Greene, D.; O’Donnell, C.; O’Shea, N.; Fenelon, M.A. Spectroscopic Technologies and Data Fusion: Applications for the Dairy Industry. Front. Nutr. 2023, 9, 1074688. [Google Scholar] [CrossRef]
- Dhal, P.; Azad, C. A Comprehensive Survey on Feature Selection in the Various Fields of Machine Learning. Appl. Intell. 2022, 52, 4543–4581. [Google Scholar] [CrossRef]
- Luna-Maldonado, A.I.; Rodriguez-Fuentes, H.; Vidales Contreras, J.A. Hyperspectral Imaging in Agriculture, Food and Environment; IntechOpen: Rijeka, Croatia, 2018. [Google Scholar] [CrossRef]
- Feng, Z.; Liu, D.; Gu, J.; Zheng, L. Raman Spectroscopy and Fusion Machine Learning Algorithm: A Novel Approach to Identify Dairy Fraud. J. Food Compos. Anal. 2024, 129, 106090. [Google Scholar] [CrossRef]
- Yasin, E.T.; Ozkan, I.A.; Koklu, M. Detection of Fish Freshness Using Artificial Intelligence Methods. Eur. Food Res. Technol. 2023, 249, 1979–1990. [Google Scholar] [CrossRef]
- Dönmez, P. Introduction to Machine Learning, 2nd Ed., by Ethem Alpaydın. Cambridge, MA: The MIT Press 2010. ISBN: 978-0-262-01243-0. $54/£ 39.95 + 584 Pages. Nat. Lang. Eng. 2013, 19, 285–288. [Google Scholar] [CrossRef]
- Shalev-Shwartz, S.; Ben-David, S. Understanding Machine Learning: From Theory to Algorithms; Cambridge University Press (CUP): Cambridge, UK, 2013. [Google Scholar] [CrossRef]
- Suthaharan, S. Machine Learning Models and Algorithms for Big Data Classification: Thinking with Examples for Effective Learning; Springer: New York, NY, USA, 2015; Volume 36, ISBN 978-1-4899-7640-6. [Google Scholar]
- Bhattacharyya, D.K.; Kalita, J. Network Anomaly Detection: A Machine Learning Perspective; CRC Press: Boca Raton, FL, USA, 2013; ISBN 9781466582088. [Google Scholar]
- Sabry, F. Naive Bayes Classifier: Fundamentals and Applications; Artificial Intelligence; One Billion Knowledgeable: London, UK, 2023. [Google Scholar]
- Berrar, D. Bayes’ Theorem and Naive Bayes Classifier. In Encyclopedia of Bioinformatics and Computational Biology, 2nd ed.; Elsevier: Amsterdam, The Netherlands, 2018; ISBN 978-0-12-809633-8. [Google Scholar]
- Shyrokykh, K.; Girnyk, M.; Dellmuth, L. Short Text Classification with Machine Learning in the Social Sciences: The Case of Climate Change on Twitter. PLoS ONE 2023, 18, e0290762. [Google Scholar] [CrossRef] [PubMed]
- Kramer, O. K-Nearest Neighbors. In Dimensionality Reduction with Unsupervised Nearest Neighbors; Kramer, O., Ed.; Springer: Berlin/Heidelberg, Germany, 2013; pp. 13–23. ISBN 978-3-642-38652-7. [Google Scholar]
- Ninh, D.K.; Phan, K.D.; Vo, C.T.; Dang, M.N.; Le Thanh, N. Classification of Histamine Content in Fish Using Near-Infrared Spectroscopy and Machine Learning Techniques. Information 2024, 15, 528. [Google Scholar] [CrossRef]
- Ninh, D.K.; Phan, K.D.; Nguyen, T.T.; Dang, M.N.; Le Thanh, N.; Ferrero, F. Classification of Urea Content in Fish Using Absorbance Near-Infrared Spectroscopy and Machine Learning. Appl. Sci. 2024, 14, 8586. [Google Scholar] [CrossRef]
- Kashani Zadeh, H.; Hardy, M.; Sueker, M.; Li, Y.; Tzouchas, A.; MacKinnon, N.; Bearman, G.; Haughey, S.A.; Akhbardeh, A.; Baek, I.; et al. Rapid Assessment of Fish Freshness for Multiple Supply-Chain Nodes Using Multi-Mode Spectroscopy and Fusion-Based Artificial Intelligence. Sensors 2023, 23, 5149. [Google Scholar] [CrossRef]
- Wang, Y.; Feng, Y.; Xiao, Z.; Luo, Y. Machine Learning Supported Single-Stranded DNA Sensor Array for Multiple Foodborne Pathogenic and Spoilage Bacteria Identification in Milk. Food Chem. 2025, 463, 141115. [Google Scholar] [CrossRef]
- Meyers, L.S.; Gamst, G.; Guarino, A.J. Applied Multivariate Research: Design and Interpretation; SAGE Publications: Thousand Oaks, CA, USA, 2006; ISBN 978-1-4129-0412-4. [Google Scholar]
- Ren, T.; Lin, Y.; Su, Y.; Ye, S.; Zheng, C. Machine Learning-Assisted Portable Microplasma Optical Emission Spectrometer for Food Safety Monitoring. Anal. Chem. 2024, 96, 5170–5177. [Google Scholar] [CrossRef] [PubMed]
- Cook, R.; Forzani, L. Partial Least Squares Regression: And Related Dimension Reduction Methods; CRC Press: Boca Raton, FL, USA, 2024; ISBN 978-1-00-348247-5. [Google Scholar]
- Lee, L.C.; Liong, C.-Y.; Jemain, A.A. Partial Least Squares-Discriminant Analysis (PLS-DA) for Classification of High-Dimensional (HD) Data: A Review of Contemporary Practice Strategies and Knowledge Gaps. Analyst 2018, 143, 3526–3539. [Google Scholar] [CrossRef]
- da Silva Pereira, E.; Cruz-Tirado, J.P.; Lourenço Crippa, B.; Martins Morasi, R.; Milagres de Almeida, J.; Fernandes Barbin, D.; Barbon Junior, S.; Cristina Cirone Silva, N. Portable near Infrared (NIR) Spectrometer Coupled with Machine Learning to Classify Milk with Subclinical Mastitis. Food Control 2024, 163, 110527. [Google Scholar] [CrossRef]
- Adams, M.J. Chemometrics and Statistics|Multivariate Classification Techniques. In Encyclopedia of Analytical, 2nd ed.; Worsfold, P., Townshend, A., Poole, C., Eds.; Elsevier: Oxford, UK, 2005; pp. 21–27. ISBN 978-0-12-369397-6. [Google Scholar]
- Ahmetoglu, H.; Das, R. A Comprehensive Review on Detection of Cyber-Attacks: Data Sets, Methods, Challenges, and Future Research Directions. Internet Things 2022, 20, 100615. [Google Scholar] [CrossRef]
- Castelli, M.; Vanneschi, L.; Largo, Á.R. Supervised Learning: Classification. In Encyclopedia of Bioinformatics and Computational Biology; Ranganathan, S., Gribskov, M., Nakai, K., Schönbach, C., Eds.; Academic Press: Oxford, UK, 2019; pp. 342–349. ISBN 978-0-12-811432-2. [Google Scholar]
- Talari, G.; Nag, R.; O’Brien, J.; McNamara, C.; Cummins, E. A Data-Driven Approach for Prioritising Microbial and Chemical Hazards Associated with Dairy Products Using Open-Source Databases. Sci. Total Environ. 2024, 908, 168456. [Google Scholar] [CrossRef] [PubMed]
- Cutler, A.; Cutler, D.; Stevens, J. Random Forests. In Machine Learning—ML; Springer: New York, NY, USA, 2011; Volume 45, pp. 157–176. ISBN 978-1-4419-9325-0. [Google Scholar]
- Son, J.; Yang, S. A New Approach to Machine Learning Model Development for Prediction of Concrete Fatigue Life under Uniaxial Compression. Appl. Sci. 2022, 12, 9766. [Google Scholar] [CrossRef]
- Yang, X.; Bist, R.B.; Subedi, S.; Chai, L. A Computer Vision-Based Automatic System for Egg Grading and Defect Detection. Animals 2023, 13, 2354. [Google Scholar] [CrossRef] [PubMed]
- Surjith, S.; Gayathri, R.; SM, A.R. Integrated RF-CNN-GRU Ensemble for Enhanced Beef Quality Classification: A Multi-Modal Approach. J. Food Compos. Anal. 2024, 134, 106503. [Google Scholar] [CrossRef]
- Cao, J.; Chen, Y.; Su, X.; Wang, Z.; Yan, H. Machine Learning-Enabled Attapulgite/Polyimide Nanofiber Composite Aerogels-Based Colorimetric Sensor Array for Real-Time Monitoring of Balsa Fish Freshness. Food Chem. 2025, 463, 141382. [Google Scholar] [CrossRef]
- Al, S.; Uysal Ciloglu, F.; Akcay, A.; Koluman, A. Machine Learning Models for Prediction of Escherichia Coli O157:H7 Growth in Raw Ground Beef at Different Storage Temperatures. Meat Sci. 2024, 210, 109421. [Google Scholar] [CrossRef] [PubMed]
- Garcia-Vozmediano, A.; Maurella, C.; Ceballos, L.A.; Crescio, E.; Meo, R.; Martelli, W.; Pitti, M.; Lombardi, D.; Meloni, D.; Pasqualini, C.; et al. Machine Learning Approach as an Early Warning System to Prevent Foodborne Salmonella Outbreaks in Northwestern Italy. Vet. Res. 2024, 55, 72. [Google Scholar] [CrossRef]
- Bhavsar, D.; Jobanputra, Y.; Swain, N.K.; Swain, D. Milk Quality Prediction Using Machine Learning. EAI Endorsed Trans. Internet Things 2024, 10, 1–5. [Google Scholar] [CrossRef]
- Miller, A.; Panneerselvam, J.; Liu, L. A Review of Regression and Classification Techniques for Analysis of Common and Rare Variants and Gene-Environmental Factors. Neurocomputing 2022, 489, 466–485. [Google Scholar] [CrossRef]
- Chiu, M.-H.; Yu, Y.-R.; Liaw, H.L.; Hao, L.C. The Use of Facial Micro-Expression State and Tree-Forest Model for Predicting Conceptual-Conflict Based Conceptual Change. In Science Education Research: Engaging Learners for a Sustainable Future; ESERA eproceeding; University of Helsinki: Helsinki, Finland, 2016; ISBN 978-951-51-1541-6. [Google Scholar]
- Belyadi, H.; Haghighat, A. Chapter 5—Supervised Learning. In Machine Learning Guide for Oil and Gas Using Python; Belyadi, H., Haghighat, A., Eds.; Gulf Professional Publishing: Oxford, UK, 2021; pp. 169–295. ISBN 978-0-12-821929-4. [Google Scholar]
- Chen, R.; Dai, T.; Zhang, Y.; Zhu, Y.; Liu, X.; Zhao, E. GBDT-IL: Incremental Learning of Gradient Boosting Decision Trees to Detect Botnets in Internet of Things. Sensors 2024, 24, 2083. [Google Scholar] [CrossRef]
- Kotsiopoulos, T.; Sarigiannidis, P.; Ioannidis, D.; Tzovaras, D. Machine Learning and Deep Learning in Smart Manufacturing: The Smart Grid Paradigm. Comput. Sci. Rev. 2021, 40, 100341. [Google Scholar] [CrossRef]
- Jiang, J.; Pan, H.; Li, M.; Qian, B.; Lin, X.; Fan, S. Predictive Model for the 5-Year Survival Status of Osteosarcoma Patients Based on the SEER Database and XGBoost Algorithm. Sci. Rep. 2021, 11, 1–9. [Google Scholar] [CrossRef] [PubMed]
- Thai, H.-T. Machine Learning for Structural Engineering: A State-of-the-Art Review. Structures 2022, 38, 448–491. [Google Scholar] [CrossRef]
- Yan, S.; Liu, C.; Fang, S.; Ma, J.; Qiu, J.; Xu, D.; Li, L.; Yu, J.; Li, D.; Liu, Q. SERS-Based Lateral Flow Assay Combined with Machine Learning for Highly Sensitive Quantitative Analysis of Escherichia Coli O157:H7. Anal. Bioanal. Chem. 2020, 412, 7881–7890. [Google Scholar] [CrossRef] [PubMed]
- Son, W.-Y.; Kang, M.-H.; Hwang, J.; Kim, J.-H.; Dixit, Y.; Kim, H.-W. Hyperspectral Imaging Combined with Machine Learning Can Be Used for Rapid and Non-Destructive Monitoring of Residual Nitrite in Emulsified Pork Sausages. Foods 2024, 13, 3173. [Google Scholar] [CrossRef]
- LeCun, Y.; Bengio, Y.; Hinton, G. Deep Learning. Nature 2015, 521, 436–444. [Google Scholar] [CrossRef]
- Abraham, C.T.; Martin, D.R.; Martin, P.A.; Balakrishnan, G. 1.08—Neural Networks in Medical Imaging. In Comprehensive Precision Medicine, 1st ed.; Ramos, K.S., Ed.; Elsevier: Oxford, UK, 2024; pp. 92–119. ISBN 978-0-12-824256-8. [Google Scholar]
- Katal, A.; Singh, N. Artificial Neural Network: Models, Applications, and Challenges. In Innovative Trends in Computational Intelligence; Tomar, R., Hina, M.D., Zitouni, R., Ramdane-Cherif, A., Eds.; Springer International Publishing: Cham, Switzerland, 2022; pp. 235–257. ISBN 978-3-030-78284-9. [Google Scholar]
- Dematos, G.; Boyd, M.S.; Kermanshahi, B.; Kohzadi, N.; Kaastra, I. Feedforward versus Recurrent Neural Networks for Forecasting Monthly Japanese Yen Exchange Rates. Financ. Eng. Jpn. Mark. 1996, 3, 59–75. [Google Scholar] [CrossRef]
- Jia, Z.; Lin, Z.; Luo, Y.; Cardoso, Z.A.; Wang, D.; Flock, G.H.; Thompson-Witrick, K.A.; Yu, H.; Zhang, B. Enhancing Pathogen Identification in Cheese with High Background Microflora Using an Artificial Neural Network-Enabled Paper Chromogenic Array Sensor Approach. Sens. Actuators B Chem. 2024, 410, 135675. [Google Scholar] [CrossRef]
- Jia, Z.; Luo, Y.; Wang, D.; Holliday, E.; Sharma, A.; Green, M.M.; Roche, M.R.; Thompson-Witrick, K.; Flock, G.; Pearlstein, A.J.; et al. Surveillance of Pathogenic Bacteria on a Food Matrix Using Machine-Learning-Enabled Paper Chromogenic Arrays. Biosens. Bioelectron. 2024, 248, 115999. [Google Scholar] [CrossRef]
- Dragone, R.; Grasso, G.; Licciardi, G.; Di Stefano, D.; Frazzoli, C. Sensors Driven System Coupled with Artificial Intelligence for Quality Monitoring and HACCP in Dairy Production. Sens. Bio-Sens. Res. 2024, 45, 100683. [Google Scholar] [CrossRef]
- Cui, F.; Zheng, S.; Wang, D.; Ren, L.; Meng, Y.; Ma, R.; Wang, S.; Li, X.; Li, T.; Li, J. Development of Machine Learning-Based Shelf-Life Prediction Models for Multiple Marine Fish Species and Construction of a Real-Time Prediction Platform. Food Chem. 2024, 450, 139230. [Google Scholar] [CrossRef] [PubMed]
- Büyükarıkan, B. ConvColor DL: Concatenated Convolutional and Handcrafted Color Features Fusion for Beef Quality Identification. Food Chem. 2024, 460, 140795. [Google Scholar] [CrossRef]
- Jo, E.; Lee, Y.; Lee, Y.; Baek, J.; Kim, J.G. Rapid Identification of Counterfeited Beef Using Deep Learning-Aided Spectroscopy: Detecting Colourant and Curing Agent Adulteration. Food Chem. Toxicol. 2023, 181, 114088. [Google Scholar] [CrossRef] [PubMed]
- Hojjati, H.; Ho, T.K.K.; Armanfard, N. Self-Supervised Anomaly Detection in Computer Vision and beyond: A Survey and Outlook. Neural Netw. 2024, 172, 106106. [Google Scholar] [CrossRef] [PubMed]
- Chen, Y.-M.; Chen, T.-Y.; Li, J.-S. A Machine Learning-Based Anomaly Detection Method and Blockchain-Based Secure Protection Technology in Collaborative Food Supply Chain. Int. J. E-Collab. 2023, 19, 1–24. [Google Scholar] [CrossRef]
- Heaton, J. Ian Goodfellow, Yoshua Bengio, and Aaron Courville: Deep Learning. Genet. Program. Evolvable Mach. 2018, 19, 305–307. [Google Scholar] [CrossRef]
- Cebollada, S.; Payá, L.; Flores, M.; Peidró, A.; Reinoso, O. A State-of-the-Art Review on Mobile Robotics Tasks Using Artificial Intelligence and Visual Data. Expert Syst. Appl. 2021, 167, 114195. [Google Scholar] [CrossRef]
- Godefroy, S.; Alarfaj, R.; Tabarani, A.; Mansour, H. Investments in Food Safety Risk Assessment and Risk Analysis as a Requirement for Robust Food Control Systems: Calling for Regional Centres of Expertise. Food Drug Regul. Sci. J. 2019, 2, 1. [Google Scholar] [CrossRef]
- GEMS/Food—Home. Available online: https://extranet.who.int/gemsfood/ (accessed on 7 December 2024).
- RASFF Window—Search. Available online: https://webgate.ec.europa.eu/rasff-window/screen/search (accessed on 7 December 2024).
- Liu, N.; Bouzembrak, Y.; van den Bulk, L.M.; Gavai, A.; van den Heuvel, L.J.; Marvin, H.J.P. Automated Food Safety Early Warning System in the Dairy Supply Chain Using Machine Learning. Food Control 2022, 136, 108872. [Google Scholar] [CrossRef]
- KAP: Quality Programme for Agricultural Products|RIVM. Available online: https://www.rivm.nl/en/chemkap (accessed on 7 December 2024).
- Lombardo, A.; Boselli, C.; Amatiste, S.; Ninci, S.; Frazzoli, C.; Dragone, R.; De Rossi, A.; Grasso, G.; Mantovani, A.; Brajon, G. From Invention to Innovation: Risk Analysis to Integrate One Health Technology in the Dairy Farm. Front. Public Health 2017, 5, 302. [Google Scholar] [CrossRef]
- Murphy, S.I.; Reichler, S.J.; Martin, N.H.; Boor, K.J.; Wiedmann, M. Machine Learning and Advanced Statistical Modeling Can Identify Key Quality Management Practices That Affect Postpasteurization Contamination of Fluid Milk. J. Food Prot. 2021, 84, 1496–1511. [Google Scholar] [CrossRef] [PubMed]
- Rodríguez, A.; Sacristán, C.; Iglesias, I.; de la Torre, A. Salmonella Assessment along the Spanish Food Chain: Likelihood of Salmonella Occurrence in Poultry and Pig Products Is Maintained across the Food Chain Stages. Zoonoses Public Health 2023, 70, 665–673. [Google Scholar] [CrossRef] [PubMed]
- Sacristán, C.; Rodríguez, A.; Iglesias, I.; de la Torre, A. Campylobacter Assessment along the Spanish Food Chain: Identification of Key Points. Zoonoses Public Health 2024, 71, 755–762. [Google Scholar] [CrossRef] [PubMed]
- Xu, Y.; Zhu, J.; Liu, R.; Jiang, F.; Chen, M.; Kutsanedzie, F.Y.H.; Jiao, T.; Wei, J.; Chen, X.; Chen, Q. Nanogap-Assisted SERS/PCR Biosensor Coupled Machine Learning for the Direct Sensing of Staphylococcus Aureus in Food. J. Agric. Food Chem. 2025, 73, 1589–1597. [Google Scholar] [CrossRef]
- Aggarwal, M.; Sahoo, P.; Saha, S.; Das, P. Machine Learning-Mediated Ultrasensitive Detection of Citrinin and Associated Mycotoxins in Real Food Samples Discerned from a Photoluminescent Carbon Dot Barcode Array. J. Agric. Food Chem. 2023, 71, 12849–12858. [Google Scholar] [CrossRef]
- Zhou, C.; Huang, C.; Zhang, H.; Yang, W.; Jiang, F.; Chen, G.; Liu, S.; Chen, Y. Machine-Learning-Driven Optical Immunosensor Based on Microspheres-Encoded Signal Transduction for the Rapid and Multiplexed Detection of Antibiotics in Milk. Food Chem. 2024, 437, 137740. [Google Scholar] [CrossRef]
- Liu, X.; Zhao, B.; Liu, X.; Cheng, Z.; Yang, X.; Zhang, X.; Feng, X. A Simply Designed Quasi-Ratiometric Fluorescence Probe for the Visual and on-Site Detection of Levofloxacin (LVF) Residues in Milk and Fish Sample. Talanta 2025, 285, 127391. [Google Scholar] [CrossRef]
- Liu, X.; Xu, Z.; Fang, G.; Li, N.; Hasi, W. SERS Combined with Self-Optimizing Machine Learning Algorithm for Quantitative Detection of Norfloxacin and Ciprofloxacin in Milk. Spectrochim. Acta Part A Mol. Biomol. Spectrosc. 2025, 329, 125641. [Google Scholar] [CrossRef]
- Chung, T.; Tam, I.Y.S.; Lam, N.Y.Y.; Yang, Y.; Liu, B.; He, B.; Li, W.; Xu, J.; Yang, Z.; Zhang, L.; et al. Non-Targeted Detection of Food Adulteration Using an Ensemble Machine-Learning Model. Sci. Rep. 2022, 12, 20956. [Google Scholar] [CrossRef]
- Aqeel, M.; Sohaib, A.; Iqbal, M.; Ullah, S.S. Milk Adulteration Identification Using Hyperspectral Imaging and Machine Learning. J. Dairy Sci. 2025, 108, 1301–1314. [Google Scholar] [CrossRef]
- Tao, D.; Zhang, D.; Hu, R.; Rundensteiner, E.; Feng, H. Crowdsourcing and Machine Learning Approaches for Extracting Entities Indicating Potential Foodborne Outbreaks from Social Media. Sci. Rep. 2021, 11, 21678. [Google Scholar] [CrossRef]
- Burden of Foodborne Illness: Overview|Estimates of Foodborne Illness|CDC. Available online: https://www.cdc.gov/foodborneburden/estimates-overview.html (accessed on 7 December 2024).
- Saulat Jahan Epidemiology of Foodborne Illness. In Scientific, Health and Social Aspects of the Food Industry; Valdez, B., Ed.; IntechOpen: Rijeka, Croatia, 2012; Chapter 16; pp. 321–342. [Google Scholar]
- Hamsar, M.N.; Sazili, A.Q.; Md Tohid, S.F. Chemical Probe as Specific Detector of Porcine Protein or Peptide in Meat and Meat-Based Products: Potential Applications, Challenges, and the Way Forward. J. Agric. Food Res. 2024, 15, 101026. [Google Scholar] [CrossRef]
- Hou, S.; Wang, S.; Zhao, X.; Li, W.; Gao, J.; Wang, Y.; Zhang, R.; Gong, L.; Jiang, S.; Zhu, Y. Establishment of Indirect ELISA Method for Salmonella Antibody Detection from Ducks Based on PagN Protein. BMC Vet. Res. 2022, 18, 424. [Google Scholar] [CrossRef] [PubMed]
- Kumar, A.; Castro, M.; Feller, J.-F. Review on Sensor Array-Based Analytical Technologies for Quality Control of Food and Beverages. Sensors 2023, 23, 4017. [Google Scholar] [CrossRef]
- Bai, H.; Lu, H.; Fu, X.; Zhang, E.; Lv, F.; Liu, L.; Wang, S. Supramolecular Strategy Based on Conjugated Polymers for Discrimination of Virus and Pathogens. Biomacromolecules 2018, 19, 2117–2122. [Google Scholar] [CrossRef] [PubMed]
- Qi, P.; Chen, X.; Sun, Y.; Zhang, D. Multivalent Glycosylated Cu:CdS Quantum Dots as a Platform for Rapid Bacterial Discrimination and Detection. Sens. Actuators B Chem. 2018, 254, 431–436. [Google Scholar] [CrossRef]
- Fu, S.; Yang, X.; Pang, L.; Cheng, S.; Song, D.; Qin, X.; Man, C.; Jiang, Y. A Novel Fluorescence Aptasensor Based on Magnetic Beads/Gold Nanoparticles/DNA-Stabilized Silver Nanoclusters for Detection of Salmonella Typhimurium. Foods 2022, 11, 595. [Google Scholar] [CrossRef]
- Nandu, N.; Smith, C.W.; Uyar, T.B.; Chen, Y.-S.; Kachwala, M.J.; He, M.; Yigit, M.V. Machine-Learning Single-Stranded DNA Nanoparticles for Bacterial Analysis. ACS Appl. Nano Mater. 2020, 3, 11709–11714. [Google Scholar] [CrossRef]
- Yang, M.; Luo, Y.; Sharma, A.; Jia, Z.; Wang, S.; Wang, D.; Lin, S.; Perreault, W.; Purohit, S.; Gu, T.; et al. Nondestructive and Multiplex Differentiation of Pathogenic Microorganisms from Spoilage Microflora on Seafood Using Paper Chromogenic Array and Neural Network. Food Res. Int. 2022, 162, 112052. [Google Scholar] [CrossRef]
- Rabehi, A.; Helal, H.; Zappa, D.; Comini, E. Advancements and Prospects of Electronic Nose in Various Applications: A Comprehensive Review. Appl. Sci. 2024, 14, 4506. [Google Scholar] [CrossRef]
- Kadian, S.; Kumari, P.; Sahoo, S.S.; Shukla, S.; Narayan, R.J. Machine Learning Enabled Microneedle-Based Colorimetric pH Sensing Patch for Wound Health Monitoring and Meat Spoilage Detection. Microchem. J. 2024, 200, 110350. [Google Scholar] [CrossRef]
- Chen, H.; He, C.; Jiang, M.; Liu, X. Egg Crack Detection Based on Support Vector Machine. In Proceedings of the 2020 International Conference on Intelligent Computing and Human-Computer Interaction (ICHCI), Sanya, China, 4–6 December 2020; pp. 80–83. [Google Scholar]
- Turkoglu, M. Defective Egg Detection Based on Deep Features and Bidirectional Long-Short-Term-Memory. Comput. Electron. Agric. 2021, 185, 106152. [Google Scholar] [CrossRef]
- European Food Safety Authority; European Centre for Disease Prevention and Control The European Union One Health 2020 Zoonoses Report. EFSA J. 2021, 19, e06971. [CrossRef]
- Ghimpețeanu, O.M.; Pogurschi, E.N.; Popa, D.C.; Dragomir, N.; Drăgotoiu, T.; Mihai, O.D.; Petcu, C.D. Antibiotic Use in Livestock and Residues in Food—A Public Health Threat: A Review. Foods 2022, 11, 1430. [Google Scholar] [CrossRef]
- Bacanlı, M.G. The Two Faces of Antibiotics: An Overview of the Effects of Antibiotic Residues in Foodstuffs. Arch. Toxicol. 2024, 98, 1717–1725. [Google Scholar] [CrossRef] [PubMed]
- Zhang, K.; Gan, N.; Shen, Z.; Cao, J.; Hu, F.; Li, T. Microchip Electrophoresis Based Aptasensor for Multiplexed Detection of Antibiotics in Foods via a Stir-Bar Assisted Multi-Arm Junctions Recycling for Signal Amplification. Biosens. Bioelectron. 2019, 130, 139–146. [Google Scholar] [CrossRef] [PubMed]
- Tumini, M.; Nagel, O.G.; Althaus, R.L. Five-Assay Microbiological System for the Screening of Antibiotic Residues. Rev. Argent. Microbiol. 2019, 51, 345–353. [Google Scholar] [CrossRef]
- Guliy, O.I.; Zaitsev, B.D.; Semyonov, A.P.; Alsowaidi, A.K.M.; Teplykh, A.A.; Karavaeva, O.A.; Borodina, I.A. Microbial Acoustic Sensor Test-System Based on a Piezoelectric Resonator with a Lateral Electric Field for Kanamycin Detection in Liquid. Ultrasonics 2022, 120, 106651. [Google Scholar] [CrossRef]
- Guo, Y.; Sang, P.; Lu, G.; Yang, X.; Xie, Y.; Hu, Z.; Qian, H.; Yao, W. RNA-Cleaving Deoxyribozyme-Linked Immunosorbent Assay for the Ultrasensitive Detection of Chloramphenicol in Milk. Food Chem. 2023, 408, 135174. [Google Scholar] [CrossRef]
- Zergiebel, S.; Ueberschaar, N.; Seeling, A. Development and Optimization of an Ultra-Fast Microextraction Followed by HPLC-UV of Tetracycline Residues in Milk Products. Food Chem. 2023, 402, 134270. [Google Scholar] [CrossRef]
- Singh, A.K.; Mittal, S.; Das, M.; Saharia, A.; Tiwari, M. Optical Biosensors: A Decade in Review. Alex. Eng. J. 2023, 67, 673–691. [Google Scholar] [CrossRef]
- Khan, R.; Anwar, F.; Ghazali, F.M. A Comprehensive Review of Mycotoxins: Toxicology, Detection, and Effective Mitigation Approaches. Heliyon 2024, 10, e28361. [Google Scholar] [CrossRef] [PubMed]
- Shahidi, F.; Pegg, R. Processing of Nitrite-Free Cured Meats. In Advanced Technologies for Meat Processing; CRC Press: Boca Raton, FL, USA, 2006; pp. 309–327. ISBN 978-1-57444-587-9. [Google Scholar]
- Harish, S.; Somesh, K.; Venkatesan, M.; Prabhavathy, P. FinSecure: Utilizing IoT Sensors for Formaldehyde Detection and Fish Freshness Detection for Enhancing Safety in Fish Consumption Using Machine Learning and Deep Learning. In Proceedings of the 2024 International Conference on Signal Processing, Computation, Electronics, Power and Telecommunication (IConSCEPT), Karaikal, India, 4–5 July 2024; pp. 1–8. [Google Scholar]
- Joy, P.; Metilda, M.; Johnraja, I. Identification of Chemicalsin Fish Using Machine Learning and IoT. SN Comput. Sci. 2024, 5, 616. [Google Scholar] [CrossRef]
- Zhang, T.; Mi, H.; Wei, S.; Xu, Y.; Yang, Z.; Liang, S.; Ding, X. Automated LA-DBD-TLC-MS Device for Accurate Detection of Biogenic Amines in Fishery Products Coupled with Machine Learning Algorithms. Food Chem. 2025, 470, 142651. [Google Scholar] [CrossRef]
- Jayasundara, J.M.V.D.B.; Ramanayake, R.M.L.S.; Senarath, H.M.N.B.; Herath, H.M.S.L.; Godaliyadda, G.M.R.I.; Ekanayake, M.P.B.; Herath, H.M.V.R.; Ariyawansa, S. Deep Learning for Automated Fish Grading. J. Agric. Food Res. 2023, 14, 100711. [Google Scholar] [CrossRef]
- Everstine, K.; Sklare, S.A. Food Fraud: A Global Threat with Public Health and Economic Consequences; Hellberg, R.S., Everstine, K., Sklare, S.A., Eds.; Academic Press: London, UK, 2021; ISBN 0-12-817243-6. [Google Scholar]
- Guan, N.; Fan, Q.; Ding, J.; Zhao, Y.; Lu, J.; Ai, Y.; Xu, G.; Zhu, S.; Yao, C.; Jiang, L.; et al. Melamine-Contaminated Powdered Formula and Urolithiasis in Young Children. N. Engl. J. Med. 2009, 360, 1067–1074. [Google Scholar] [CrossRef]
- Ho, S.S.Y.; Chu, W.C.W.; Wong, K.T.; Li, C.K.; Wong, W.; Ng, P.C.; Ahuja, A.T. Ultrasonographic Evaluation of Melamine-Exposed Children in Hong Kong. N. Engl. J. Med. 2009, 360, 1156–1157. [Google Scholar] [CrossRef]
- Langman, C.B. Melamine, Powdered Milk, and Nephrolithiasis in Chinese Infants. N. Engl. J. Med. 2009, 360, 1139–1141. [Google Scholar] [CrossRef]
- Aline, M.; Olivier, F.; Frédéric, D.; Julie, H.; Gilbert, B. The Horse Meat Scandal—The European Analytical Response. In DNA Techniques to Verify Food Authenticity: Applications in Food Fraud; Burns, M., Foster, L., Walker, M., Eds.; The Royal Society of Chemistry: London, UK, 2019; pp. 177–188. ISBN 978-1-78801-178-5. [Google Scholar]
- Li, D.; Wu, G.; Liu, H.; Yang, M.; Xing, K. Recent Progress in Evaluation of Red Meat Quality Using Hyperspectral Imaging Technology. Meat Res 2018, 32, 59–63. [Google Scholar]
- Andersen, P.V.; Wold, J.P.; Gjerlaug-Enger, E.; Veiseth-Kent, E. Predicting Post-Mortem Meat Quality in Porcine Longissimus Lumborum Using Raman, near Infrared and Fluorescence Spectroscopy. Meat Sci. 2018, 145, 94–100. [Google Scholar] [CrossRef]
- Kamruzzaman, M.; Makino, Y.; Oshita, S. Non-Invasive Analytical Technology for the Detection of Contamination, Adulteration, and Authenticity of Meat, Poultry, and Fish: A Review. Anal. Chim. Acta 2015, 853, 19–29. [Google Scholar] [CrossRef] [PubMed]
- Deng, X.; Cao, S.; Horn, A.L. Emerging Applications of Machine Learning in Food Safety. Annu. Rev. Food Sci. Technol. 2021, 12, 513–538. [Google Scholar] [CrossRef] [PubMed]
- Chhetri, K.B. Applications of Artificial Intelligence and Machine Learning in Food Quality Control and Safety Assessment. Food Eng. Rev. 2024, 16, 1–21. [Google Scholar] [CrossRef]
- Harper, W. The Strengths and Weaknesses of the Electronic Nose. Adv. Exp. Med. Biol. 2001, 488, 59–71. [Google Scholar] [CrossRef]

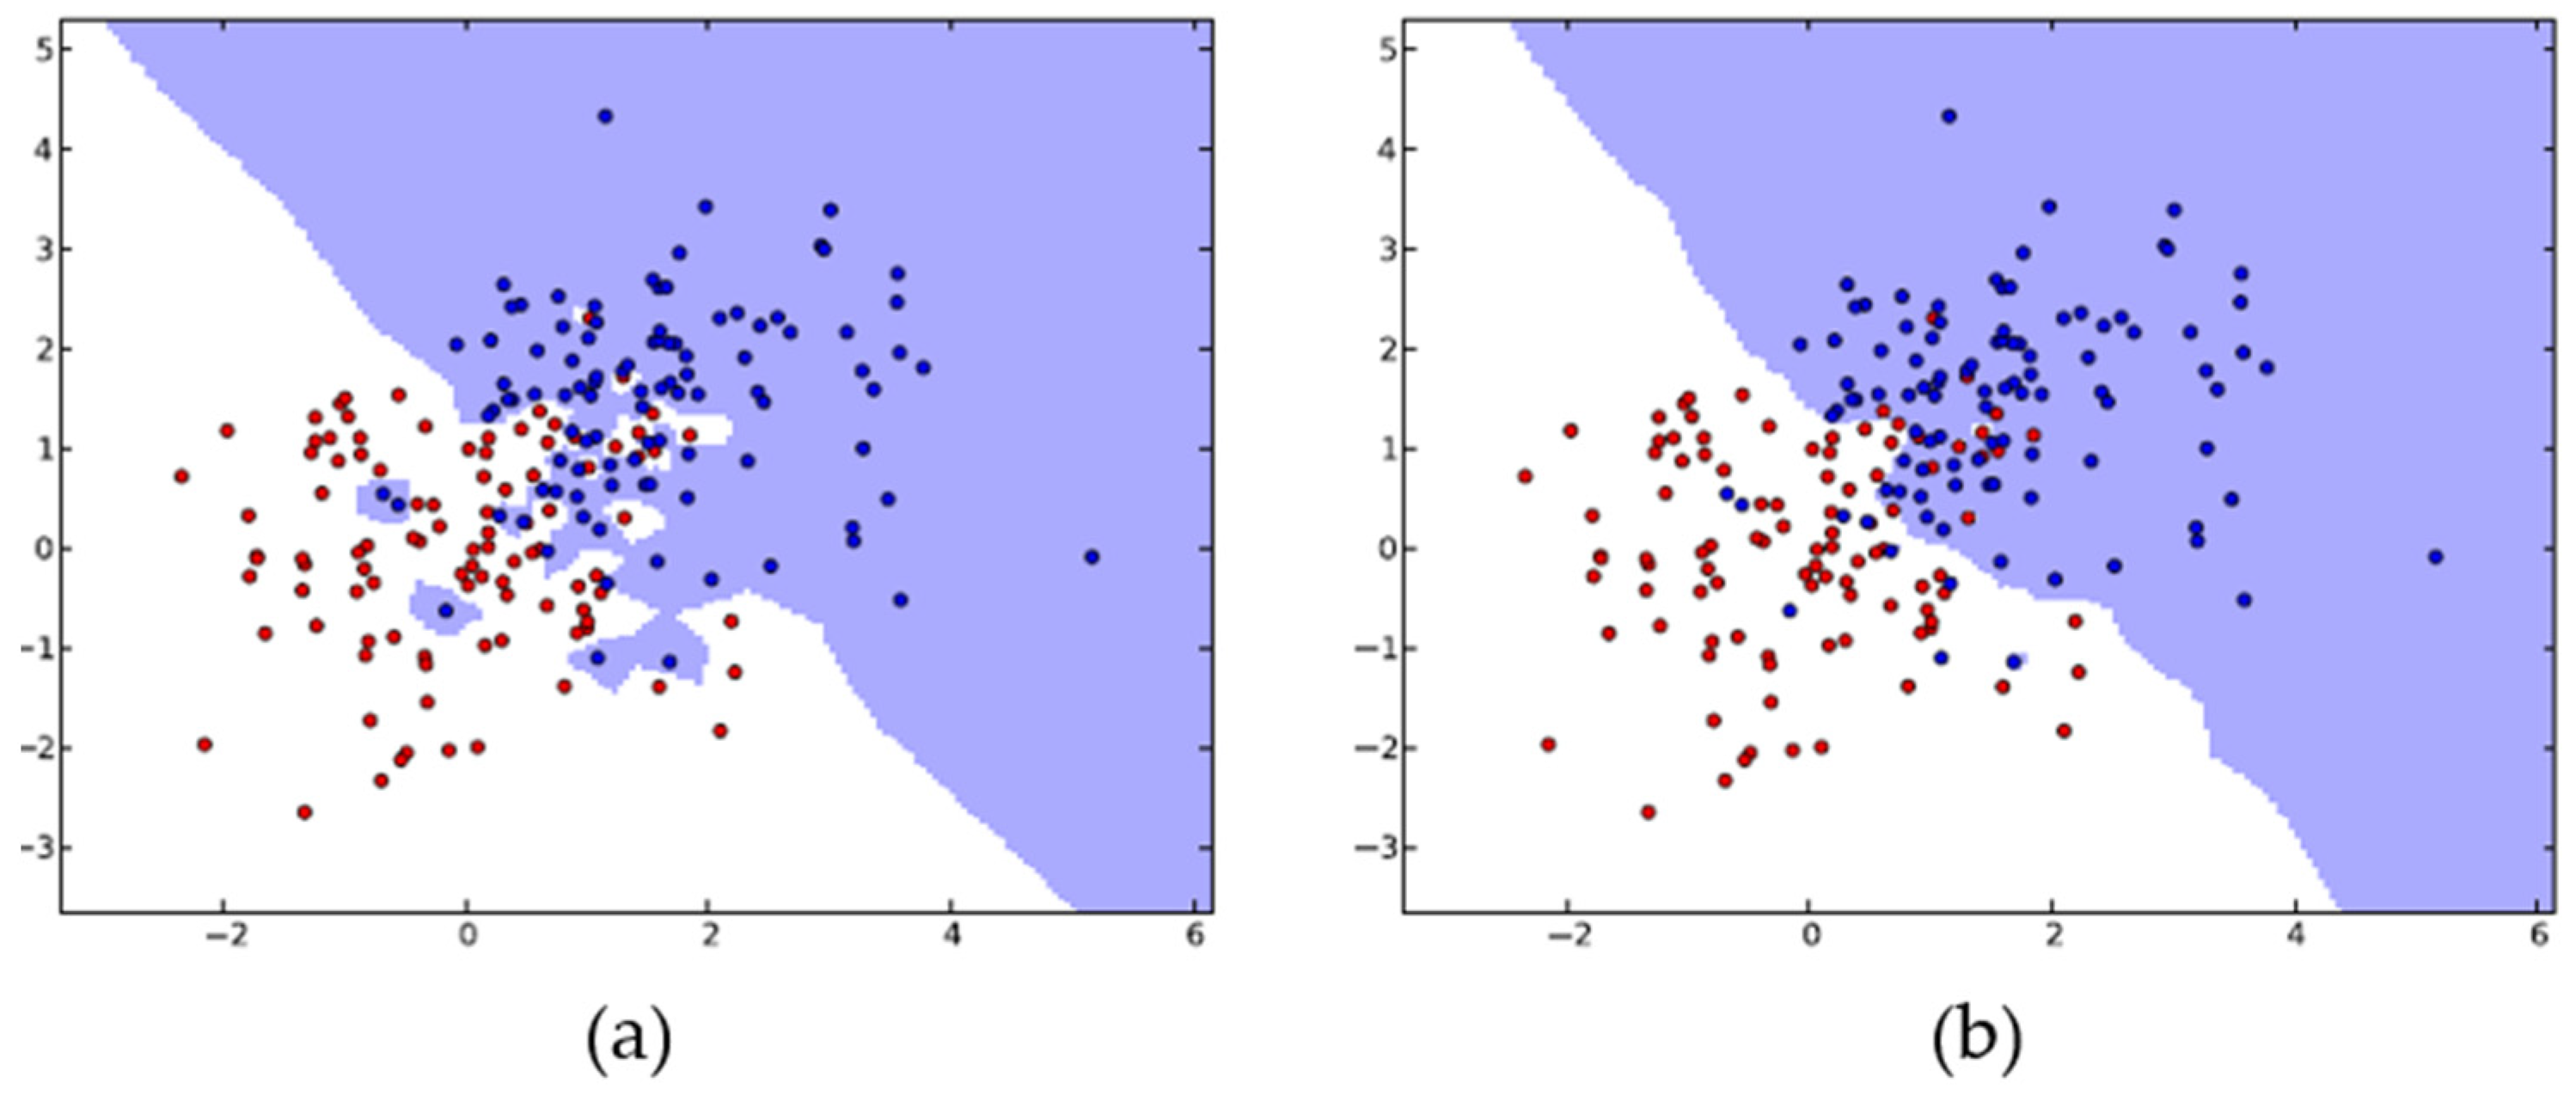

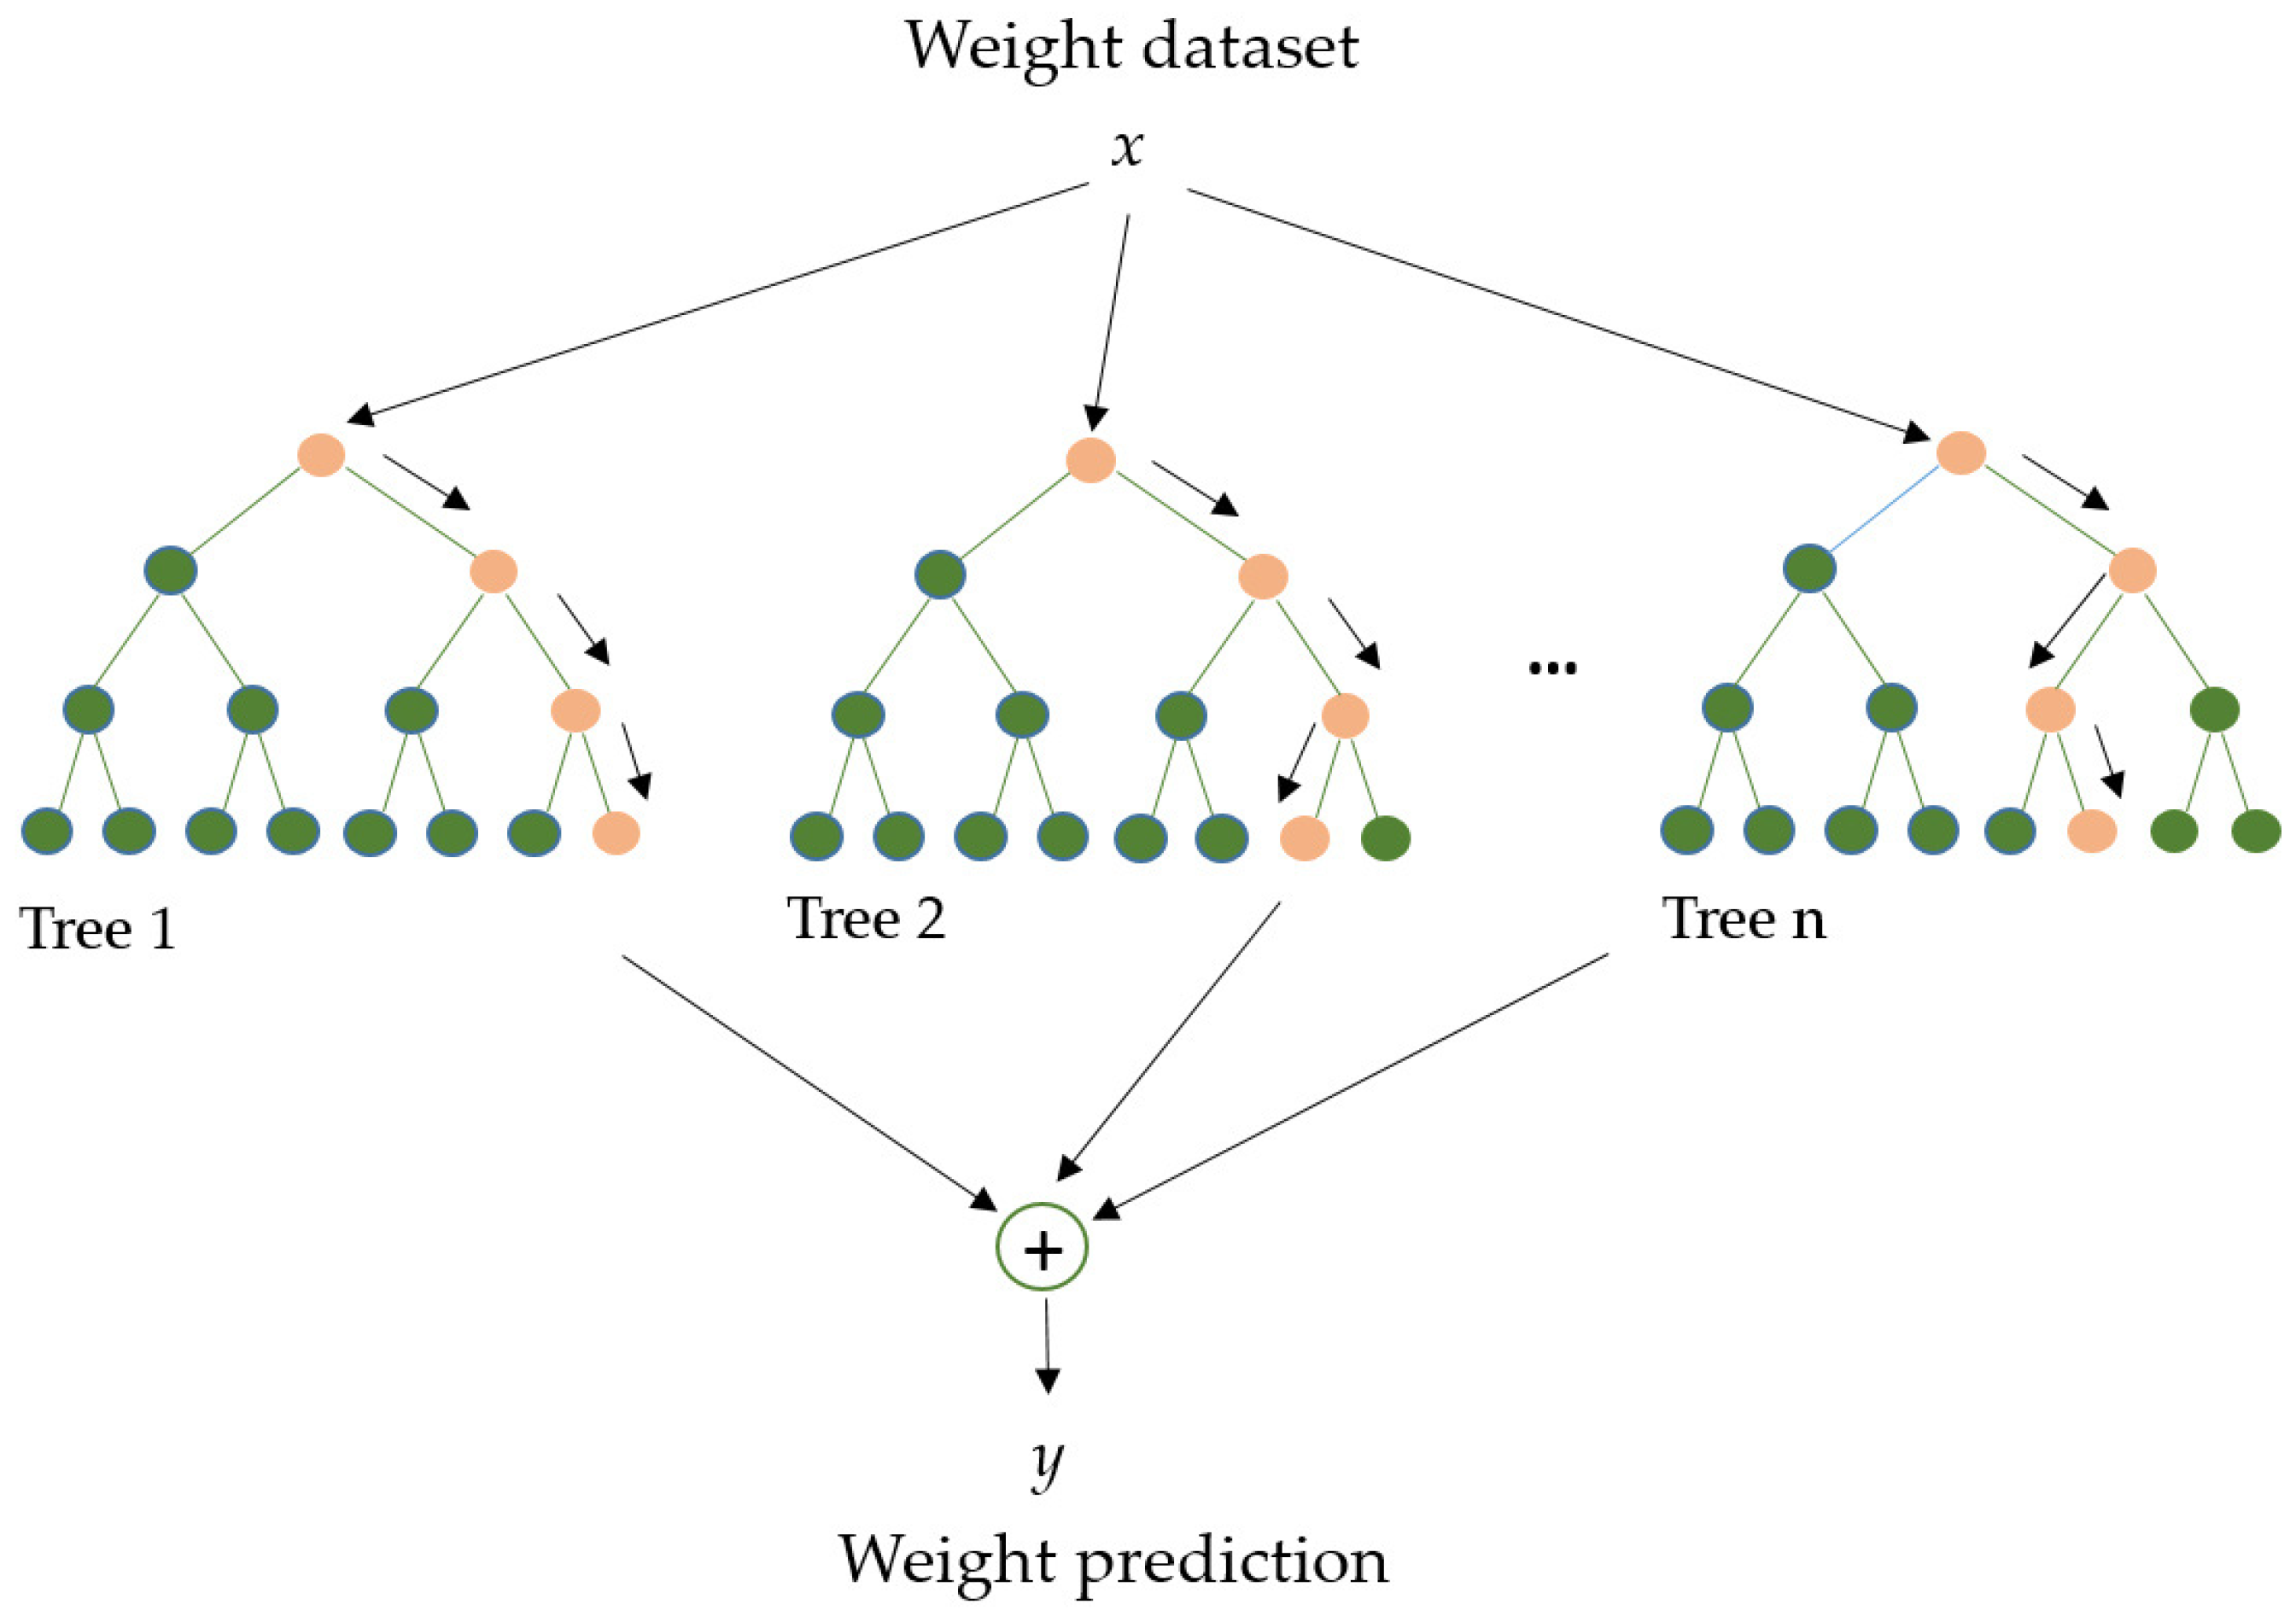
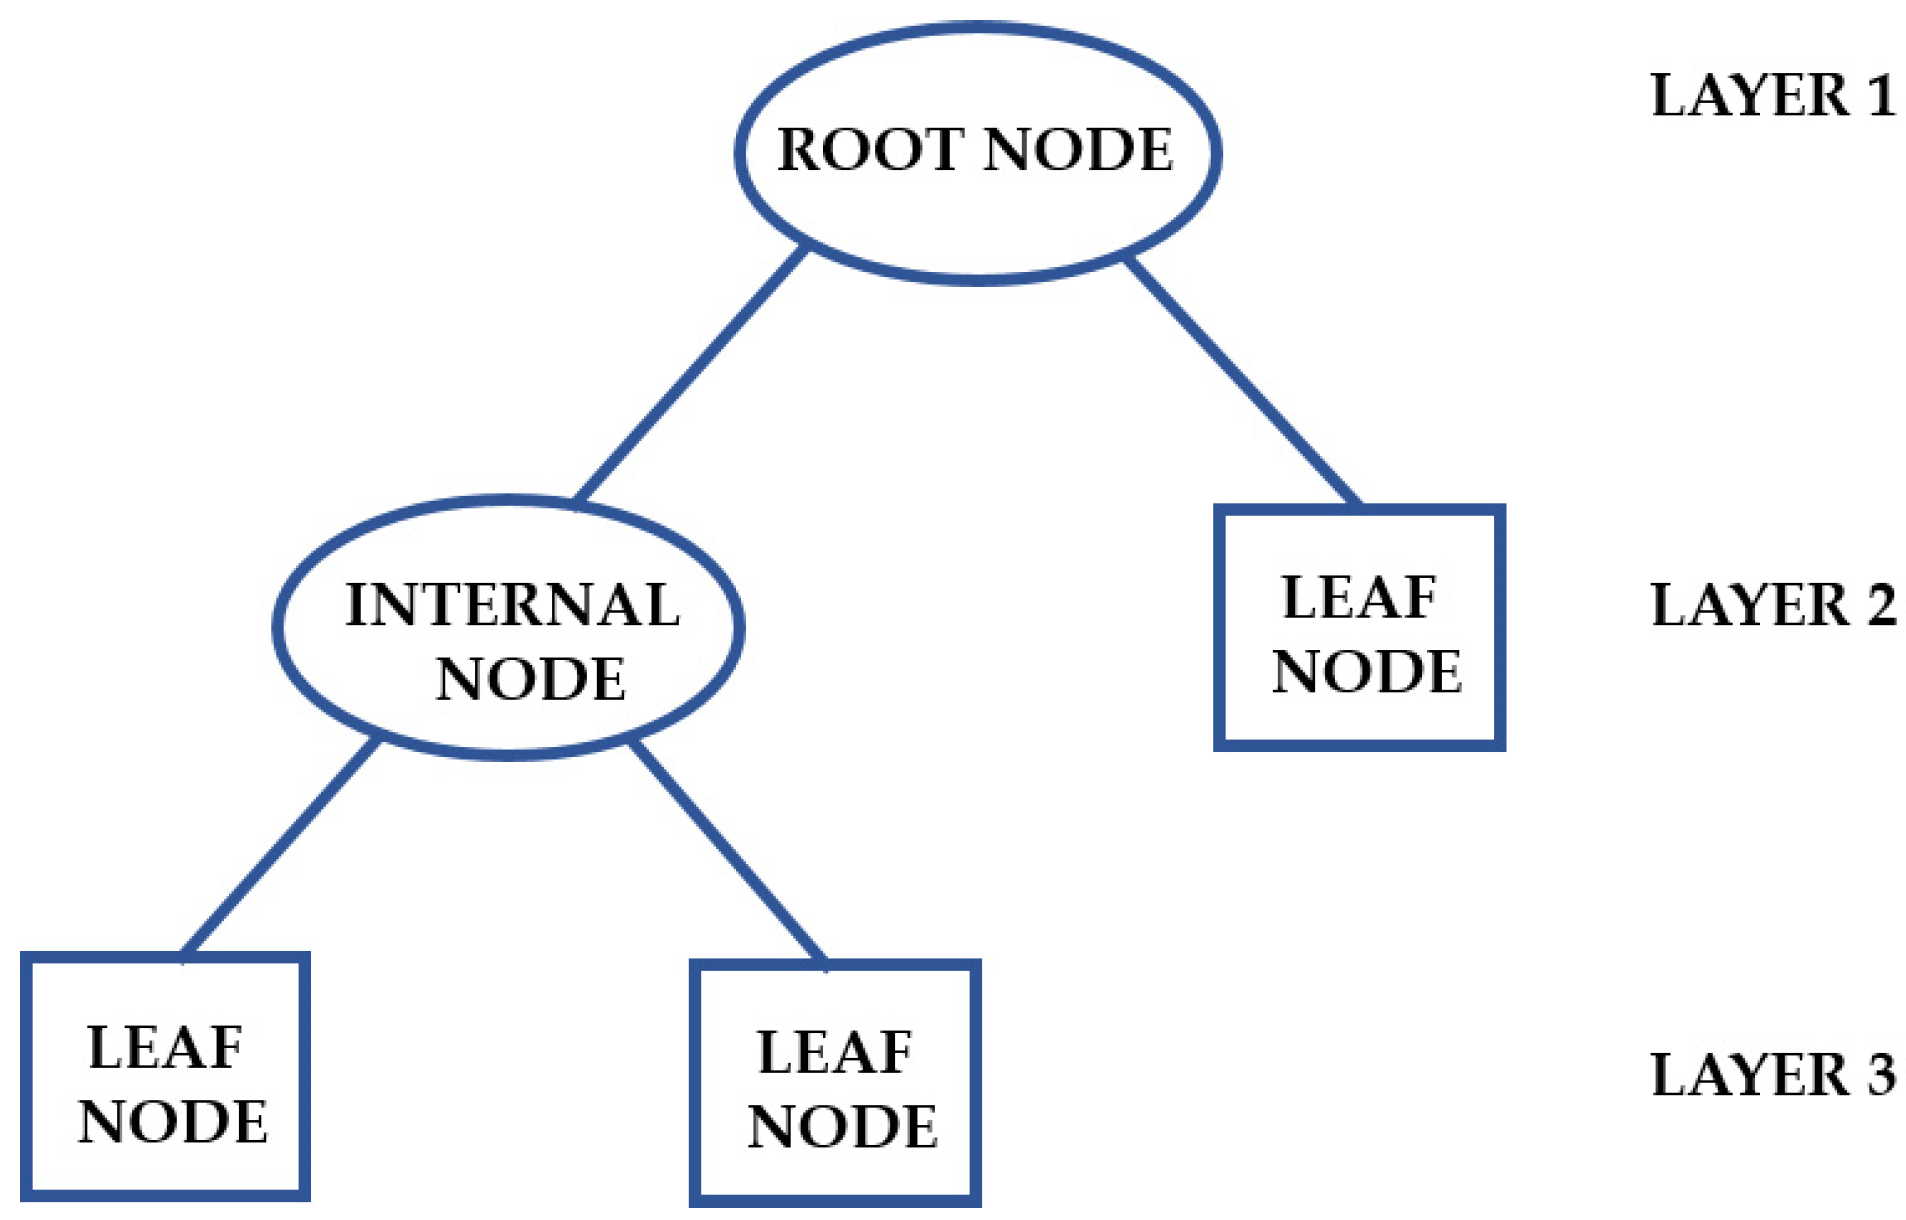
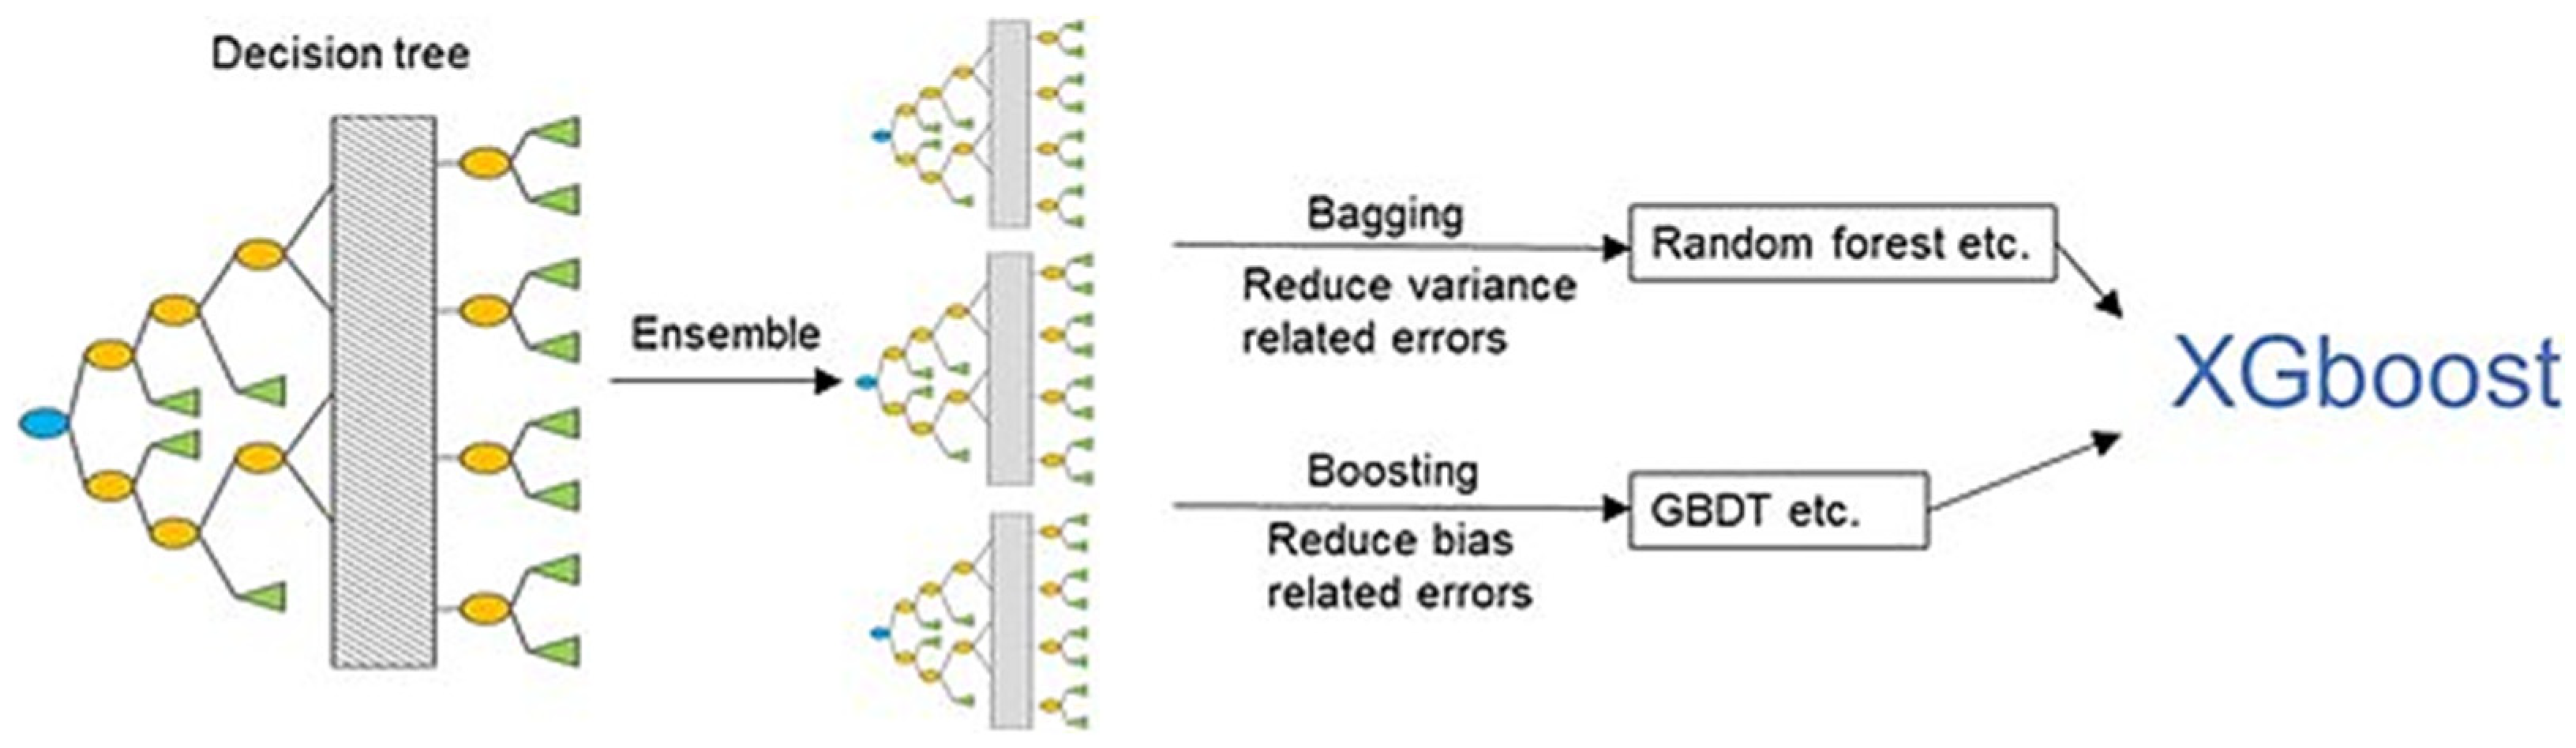
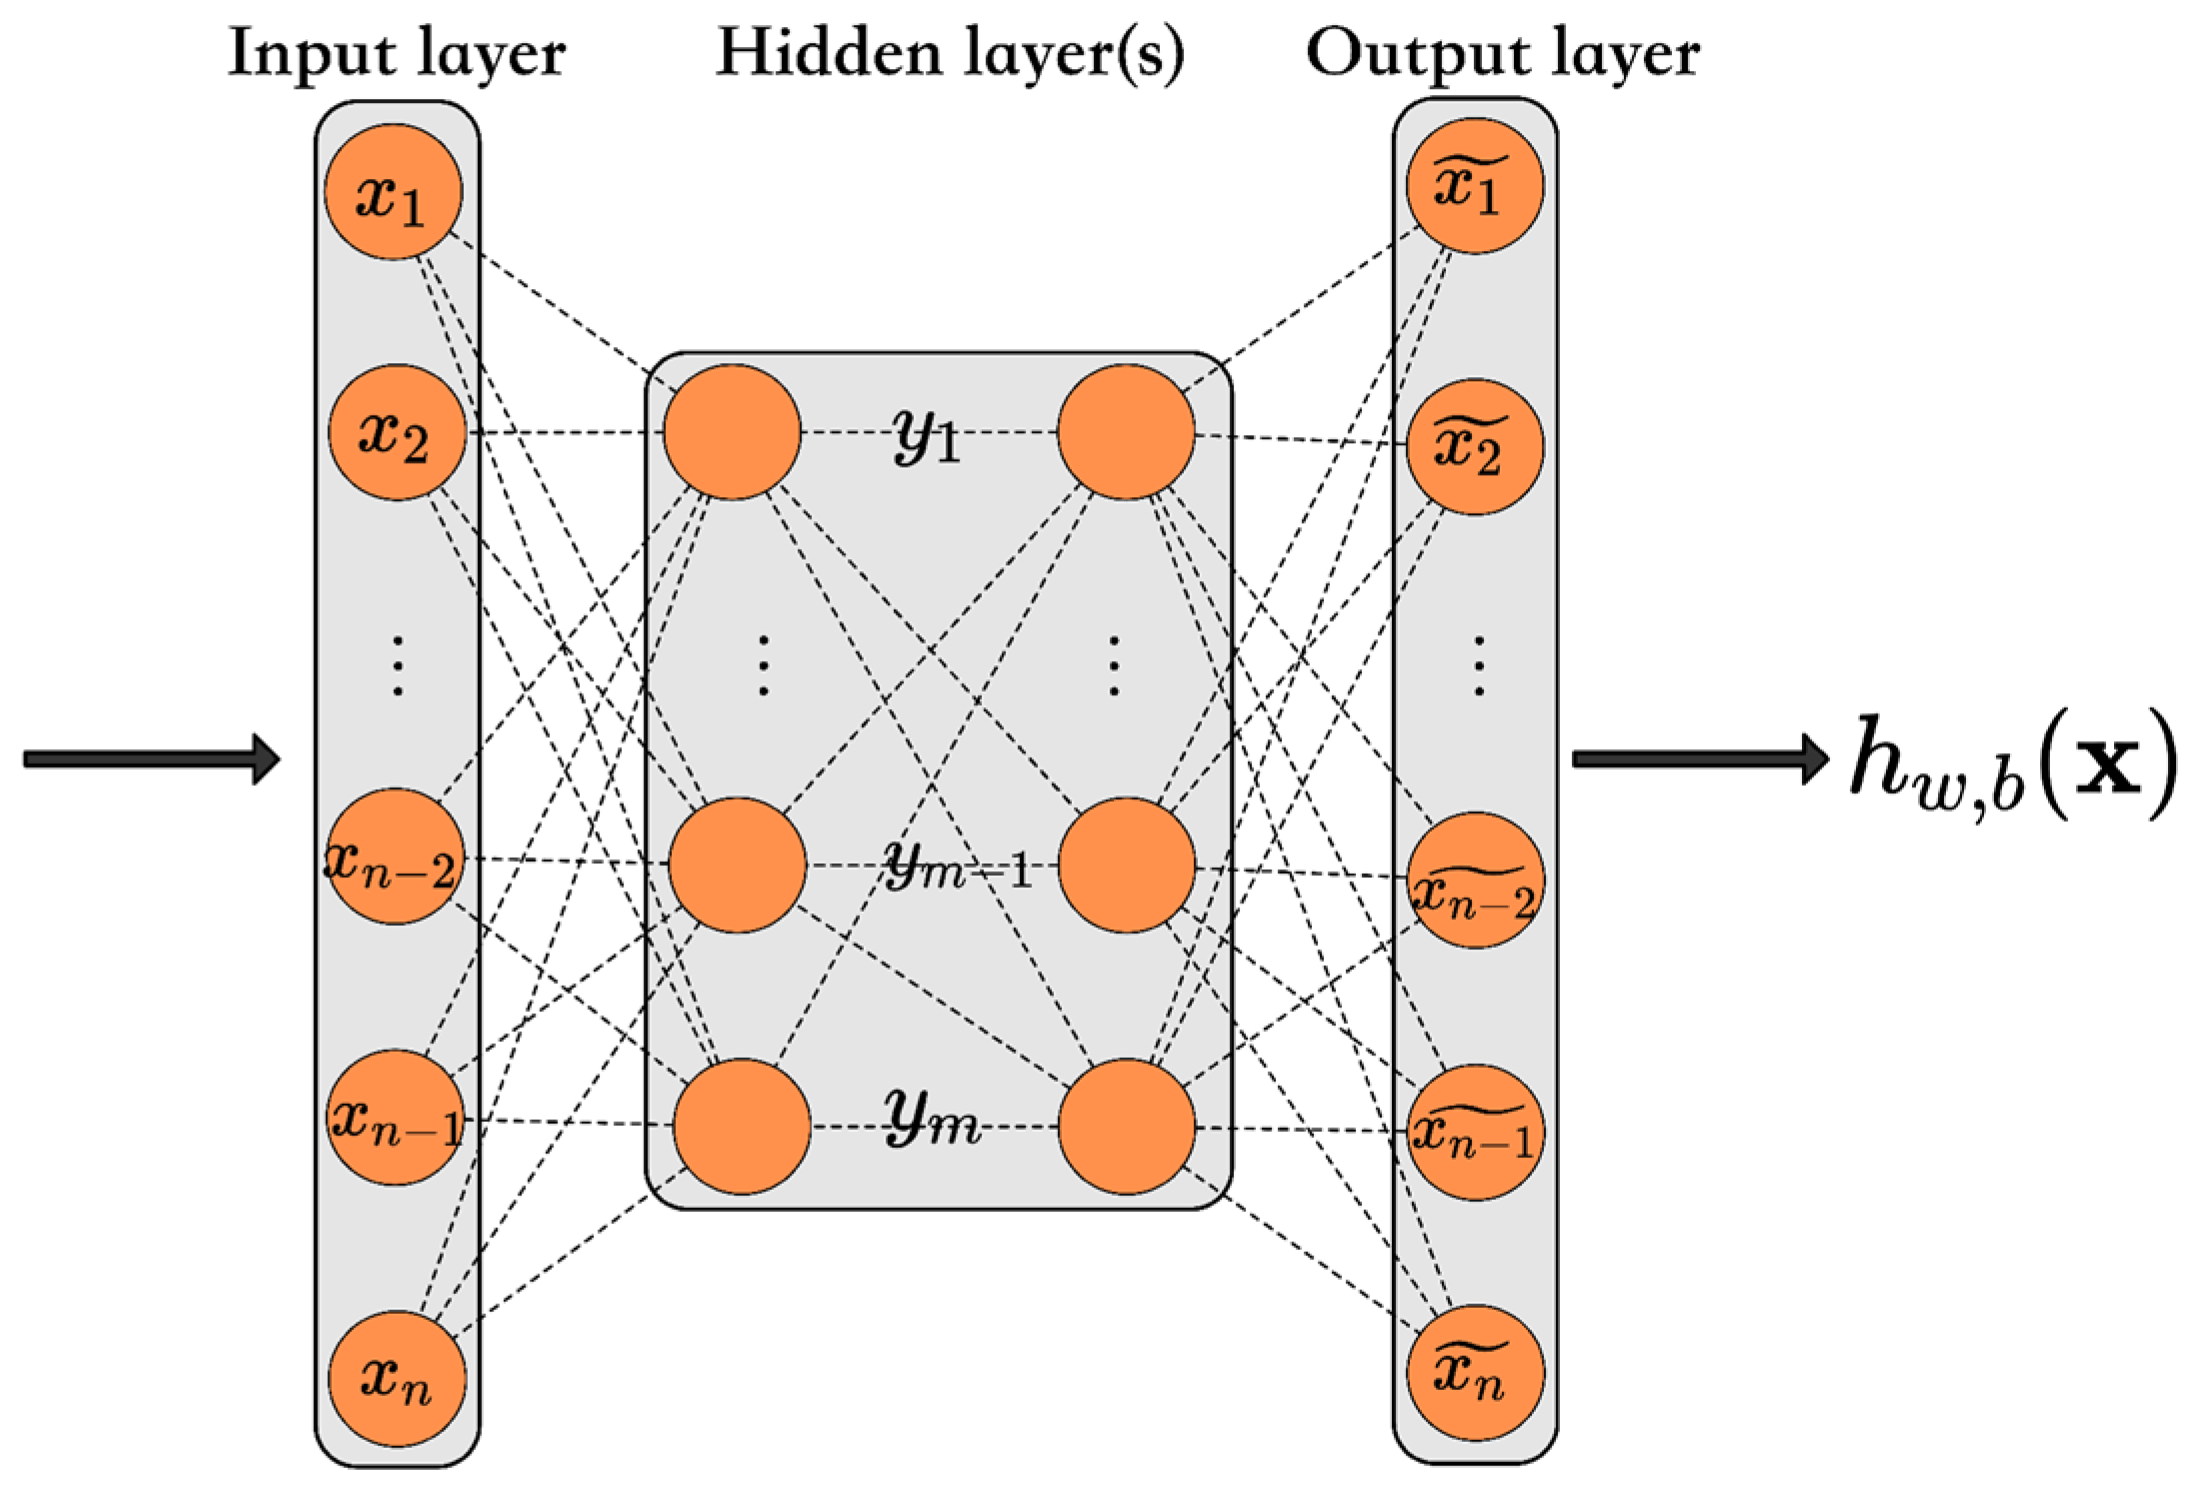

Disclaimer/Publisher’s Note: The statements, opinions and data contained in all publications are solely those of the individual author(s) and contributor(s) and not of MDPI and/or the editor(s). MDPI and/or the editor(s) disclaim responsibility for any injury to people or property resulting from any ideas, methods, instructions or products referred to in the content. |
© 2025 by the authors. Licensee MDPI, Basel, Switzerland. This article is an open access article distributed under the terms and conditions of the Creative Commons Attribution (CC BY) license (https://creativecommons.org/licenses/by/4.0/).