Abstract
Background: Supply chain collaboration technologies (SCCTs) are digital tools designed to enhance communication, coordination, and integration among supply chain stakeholders. These tools are essential for enhancing transparency, efficiency, and traceability within complex supply chain networks, particularly in the food industry. Methods: This study focuses on the statistical analysis of survey data to evaluate the adoption and impact of SCCTs, including blockchain, Internet of Things (IoT), enterprise resource planning (ERP), and artificial intelligence (AI), in Nigeria’s food industry. Results: The results reveal critical insights into the adoption barriers, perceived benefits, and gaps in implementation. Descriptive and inferential statistical techniques highlight significant variations in technology across different sectors, uncovering key factors influencing the integration of SCCTs. The findings demonstrate that while the technologies hold substantial potential to optimize supply chain performance, their acceptance is constrained by infrastructural deficiencies, regulatory challenges, under-developed trust-building mechanisms, and limited technical expertise. Conclusions: This paper underscores the importance of targeted interventions, policy support, and resource allocation to foster the effective utilization of SCCTs. The study provides data-driven recommendations for improving technology uptake, contributing to the sustainability and competitiveness of Nigeria’s food supply chain.
1. Introduction
The food industry, particularly in developing countries like Nigeria, plays a pivotal role in socio-economic development, providing employment and ensuring food security. However, the sector faces numerous challenges, including inefficiencies in supply chains, a lack of transparency, traceability issues, and security concerns. These challenges have intensified due to globalization, increased demand for food safety, and the complexity of supply chain networks [1,2].
Supply chain collaboration technologies (SCCTs) have emerged as promising solutions to address these issues. SCCTs, including blockchain, Internet of Things (IoT), enterprise resource planning (ERP), and artificial intelligence (AI), are being adopted to enhance the transparency, efficiency, traceability, and security of supply chains in the food industry [2]. For instance, blockchain creates a decentralized ledger system that ensures data integrity, enabling end-to-end product traceability [3], while IoT facilitates real-time monitoring and inventory control [1].
Despite the potential benefits, the implementation of SCCTs in Nigeria remains limited due to infrastructural deficits, regulatory hurdles, and resource constraints. For example, the lack of reliable internet connectivity and technically skilled labor significantly hinders the effective implementation of IoT and cloud-based systems [2]. Additionally, regulatory frameworks are often insufficiently developed to support the widespread use of advanced technologies in the food sector, further complicating the adoption process.
This paper critically evaluates the role of SCCTs in Nigeria’s food industry, focusing on their effectiveness in tackling supply chain inefficiencies. It incorporates a comparative analysis of SCCTs suitable for Nigeria, identifies technology gaps, and provides actionable recommendations for stakeholders. By addressing these challenges, this study aims to enhance transparency, efficiency, and competitiveness in Nigeria’s food supply chains.
This research builds on previous studies and aims to provide a deeper understanding of how SCCT technologies can improve supply chain performance in the food sector, with practical recommendations for enhancing collaboration, efficiency, and competitiveness in Nigeria’s food supply chains.
Furthermore, the study incorporates a robust statistical analysis of survey data collected from stakeholders across the food supply chain. Descriptive statistics reveal adoption trends and barriers, while inferential analysis uncovers correlations between factors like organizational size and technology adoption rates. These findings offer actionable insights into the key drivers and inhibitors of SCCT implementation, paving the way for interventions to bridge gaps and bolster supply chain resilience in Nigeria.
2. Related Work
Supply chain collaboration technologies (SCCTs) have become increasingly important in the food industry, particularly for enhancing transparency, efficiency, and security across complex supply chains. This section reviews the role of collaboration in the food industry, focusing on key technologies like blockchain, IoT, cloud-based systems, ERP, and AI.
2.1. Collaboration on the Food Industry
Collaboration plays a critical role in the food industry, where complex and often globalized supply chains are made up of numerous interdependent stakeholders. These stakeholders, including farmers, manufacturers, distributors, and retailers, must work closely together to ensure that food products move efficiently from production to consumption while maintaining high standards of safety, quality, and compliance with regulatory requirements [4]. Effective collaboration should be particularly important in the context of perishable goods, where delays, miscommunication, or a lack of transparency can lead to spoilage, waste, and financial losses.
The integration of SCCTs has emerged as a vital solution to the numerous challenges associated with food supply chains. SCCTs help to address issues such as the lack of real-time information sharing, limited visibility across the supply chain, and the inability to trace products effectively. Technologies such as blockchain, Internet of Things (IoT), and enterprise resource planning (ERP) systems enable stakeholders to collaborate more effectively by providing a shared platform for data collection, monitoring, and decision-making [2].
The theoretical application of SCCTs in the food chain, for those that have examined the opportunities, is seemingly self-evident: for example, in the event of a food safety incident, technologies like blockchain allow for rapid traceability of the affected product, ensuring that contaminated items can be quickly removed from the supply chain. This level of transparency not only protects consumers but also enhances trust between supply chain partners as each participant can verify the authenticity and safety of the products they handle [5].
Establishing a collaborative business model and the associated enabling SCCTs that are required is challenging for stakeholders, wherever in the world one’s supply chain is situated. In developing countries like Nigeria, where supply chains are often fragmented and plagued by inefficiencies, collaboration is particularly challenging. A lack of infrastructure, inconsistent regulatory frameworks, and limited access to technology create significant barriers to seamless cooperation between stakeholders [1]. These inefficiencies can lead to increased costs, delays in product delivery, and reduced competitiveness in both local and global markets. These are not the only barriers; indeed, it is arguable that the biggest challenges to collaborative business models lie with their acceptance as an alternative to the status quo.
The relentless tide of technological advances might suggest that technological barriers, while significant, are not insurmountable in the short or medium term. There is growing interest in adopting SCCTs to mitigate supply chain collaboration challenges. By leveraging technologies such as IoT and cloud-based systems, companies can enhance communication, streamline operations, and improve overall supply chain performance. IoT devices already enable real-time monitoring of environmental conditions (such as temperature and humidity) during transportation and storage, ensuring that food products maintain their quality throughout the supply chain. This level of monitoring is particularly valuable in countries like Nigeria, where inconsistent logistics infrastructure can pose a threat to products [1].
Furthermore, the successful adoption of SCCTs can foster greater collaboration between smallholder farmers and large food corporations, allowing for better integration of local producers into global supply chains. This not only boosts the economic resilience of local communities but also enhances the overall efficiency and sustainability of the food supply chain. In this regard, policy-making, infrastructure development, and education are crucial to ensuring that stakeholders can effectively leverage these technologies for collaborative advantages [4]. A case-in-point is seen among chili farmers in the Telangana region of India: the local government, in partnership with the World Economic Forum (WEF) and the Indian Institute of Science (IISc), set about developing India’s first Agricultural Data Exchange (ADeX) [6]. ADeX, launched in 2023 [7], is an open-source, open standard platform for secure data exchange between agricultural stakeholders. Under a project named Project Saagu Baagu, which aims to leverage greater value from agritech technologies, the chili farmers have piloted the collaboration through data exchange via application programming interfaces (apps), and it is to expand to a further 500,000 farmers, in 10 districts within the state, covering five value chains.
Technological barriers to collaboration largely reflect the complexity of supply chains: the more complex a supply chain, the more visibility is required. Visibility might include the coverage of the many assets, stakeholders, procedures, product and material transfers and transactional points, environmental influences such as climate, infrastructure capacity, interoperability, usage patterns, geo-political and societal interactions and interferences, rules, regulations, standards and agreements (international, regional and national, industry, sector, corporate, or inter-governmental), and so on. The data required and the analytics required to predict, forecast, decide, and react to agreed-upon supply chain metrics is huge. Computing power currently limits the analysis of ultra-large data sets and their interactions. Whether quantum computing, combined with traditional binary computing, is anywhere close to becoming a reality is subjective; quantum computing is arguably a further five or ten years away from fruition in any meaningful commercial application [8]. It has greater potential to determine patterns in data and consequences of differing variables in highly complex systems; yet, it is slower than conventional computing systems for “simpler” algorithmic challenges. Combined, perhaps, they will enhance the visibility and decision-making power of stakeholders, collectively, in a block-chain-enabled collaborative supply chain management ecosystem.
Despite great progress becoming more evident when the appropriate public–private partnerships are established to set in motion collaboration initiatives, industry stakeholders may still need convincing. Trust, or lack of it, appears to be the predominant barrier. In [9] are presented eight “trust drivers” (Figure 1) for the physical Internet, a concept for “the universal interconnection of logistics services and networks” [10].
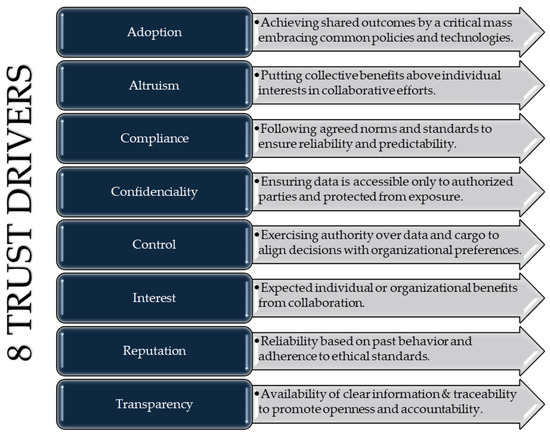
Figure 1.
8 Trust drivers. Source: based on [9].
The physical Internet (PI), in concept, is a large-scale collaborative business model, focused upon determining and organizing optimal freight logistics solutions in real or near-real time. Early trials in the consumer goods sector have demonstrated “that interconnected transportation enabled decrease of 15% in travelled km, an increase of 33% fill rate, and a decrease of 60% CO2 emissions” and that further studies in networked warehouses, distribution and fulfillment centers showed “significant improvement in efficiency (30% order of magnitude), responsiveness, resilience, and security, through a dynamic network approach securing supplies without duplication of safety stocks and fast fulfillment in line with market expectations” [10], and yet, convincing supply chain stakeholders to participate in further trials requires far more than the presence of technical capability.
The research of [9] reveals a picture of those areas of “trust” with which supply chain stakeholders have the most issues. One such issue is a reluctance to be locked into a single central operating platform. They recommend a federated approach. This appears to suggest a blockchain (executing the transactional points), pulling in data from different, isolated databases, and open-source apps for the data exchange. The research also leaned heavily toward the need for a centralized management body, overseeing the collaboration and the establishment and management of the rules of business, the protocols and standards required, and any associated gains being equitably shared among all stakeholders. Open protocols for the establishment of any platform for collaboration, whether PI platforms or otherwise, seem to be essential to allow the interoperability of systems that enable stakeholders to switch to different platforms or use more than one, without being technologically locked into just one platform.
The layered architecture suggested by [9] seems very similar to the model espoused by the Freight Share Lab project in which a neutral third party was advocated, and a gain-sharing model was developed to ensure all logistics assets and services could be made visible, competition was still possible, and profits were equitably shared [11].
The fragmented market and historic inefficiencies of the Nigerian food chain present clear challenges to the successful implementation of collaboration business models; yet, with a public–private partnership and attention to the trust framework posited above, such challenges are not insurmountable.
2.2. Technologies Used for Collaboration
In this section, various technologies are explored that are critical for collaboration in supply chain management within the food industry. These technologies include blockchain, the Internet of Things (IoT), cloud-based systems, enterprise resource planning (ERP) systems, and artificial intelligence. Each subsection discusses the role of these technologies in enhancing supply chain efficiency, traceability, transparency, and overall effectiveness.
2.2.1. Blockchain
Blockchain technology has emerged as a transformative tool in the supply chain sector, particularly within the food industry; this is due to its ability to enhance transparency and traceability. The decentralized nature of blockchain ensures that all transactions are recorded in an immutable and tamper-proof manner, significantly reducing the risks associated with fraud and counterfeiting [12]. In the food supply chain, blockchain facilitates the tracking of products from farm to table, ensuring that every step of the process is documented and transparent. This level of traceability not only boosts consumer confidence but also helps in swiftly addressing issues such as food recalls [13]. In the field of food industry data circulation and sharing, frameworks integrating blockchain and distributed federated learning have been adopted to enhance the security and efficiency of data processing [14]. Blockchain’s secure data management and increased accountability can help mitigate food loss and waste, align with global sustainability efforts, and foster a more resilient and efficient future [15]. Additionally, blockchain supports smart contracts that automate processes like payments and quality checks, thereby improving efficiency and reducing operational costs [16].
In the implementation of blockchain technology for the food supply chain, companies address several key issues and challenges. These relate to (i) the design of smart contracts, (ii) data management, and (iii) channel configuration. A smart contract is simply computer code running on peers’ data and systems platforms, in a network of platforms. However, translating textual contractual clauses into an encoded programming language is difficult for this sector (for example, translating “in case of an unforeseen situation, such as drought, excessive rain, fire” requires increased coding precision). Also, the costs associated with data management, storage, networking, and processing represent further challenges. The assets in blockchain applications can vary, from business documents (such as supply orders and invoices) to images of products, which can often have very large file sizes. Finally, the channel configuration can determine data flows in the network. If multiple parties collaborate on a business process, there are many ways to configure blockchain channels, and this can become complex, especially when confidentiality, data protection, and privacy considerations arise [17].
2.2.2. IoT
The Internet of Things (IoT) is key to the food supply chain, enabling real-time monitoring and data collection. This tool impacts the improvement of the operational efficiency of the supply chain in agriculture [18]. IoT devices, such as sensors and RFID tags, are used to track the location, temperature, and condition of food products throughout the supply chain [19]. This technology helps maintain the integrity of perishable goods by ensuring they are stored and transported under optimal conditions. Moreover, IoT enhances the transparency of the supply chain by providing stakeholders with real-time data, which are critical for making informed decisions [20]. In the context of food safety, IoT devices can be integrated with hazard analysis critical control point (HACCP) systems to monitor and ensure compliance with food safety standards [21]. Thus, the specific IoT application areas identified by [22] in the food supply chain are information sharing, condition monitoring, food safety, and virtual supply chains. Information sharing enables smarter decisions and more efficient operations based on real-time information. The use of IoT for condition monitoring is highly valuable in perishable goods monitoring analytics. Food safety with IoT focuses mainly on their traceability. Finally, IoT enables the virtualization of supply chains. Virtualization of supply chains makes it possible to decouple physical flows with virtual supply networks that dynamically change their configuration depending on the state of the physical supply chain system.
2.2.3. Cloud-Based Systems
Cloud-based systems offer significant advantages for collaboration in the food supply chain by enabling centralized data storage and access. These systems allow for the seamless sharing of information across different stakeholders, which is essential for coordinating activities such as procurement, distribution, and inventory management [16]. Also, cloud-based systems can allow supply chain partners to see risks and rapidly develop mitigation strategies to limit the impact of disruptions, thereby gaining a competitive advantage over supply chains that rely on more traditional SCM systems [23].
The scalability and flexibility of cloud solutions make them particularly valuable for small and medium-sized enterprises that may not have the resources to maintain extensive IT infrastructures. Notwithstanding the aforementioned future development of quantum computing for the most complex of algorithmic computations (see Section 2.1 above), the current generation of cloud-based systems supports advanced data analytics, which can be used to predict market trends, optimize supply chain operations, and improve decision-making processes [21]. Cloud computing is critical to IoT deployment because of the huge volume of data generated by IoT devices and the need for it to be analyzed with high-speed processing computers to enable real-time and efficient decision-making [24]. Furthermore, cloud computing helps transmit and secure data from IoT devices to ERP systems [22].
2.2.4. ERPs
Enterprise resource planning (ERP) systems are integral to managing complex supply chain operations in the food industry. These systems integrate various business processes, including procurement, production, distribution, and sales, into a single platform, providing real-time visibility and control over the entire supply chain [13]. In the food industry, ERP systems are particularly useful for tracking inventory levels, managing orders, and ensuring compliance with food safety regulations [21]. By automating many manual processes, ERP systems enhance efficiency, reduce errors, and improve the overall responsiveness of the supply chain [16]. The most important function of ERP that a food industry enjoys [25] is the reduction in effort and time to fulfill daily tasks. Thus, by improving efficiency, accurate forecasting, increasing productivity, offering flexibility and mobility, and providing integrated information, ERP software has now become a necessity for the manufacturers in food industries, raising speed and efficiency and optimizing productivity.
Breaking the traditional decentralized system and introducing the concept of a single, integrated plan, on which a company could work together with their suppliers, leads to cost reductions and increased efficiency. To do this, interoperability is required between ERPs to support the inter-organizational decision process in order to accomplish better-integrated decision-making in the SC [26].
2.2.5. AI
Artificial intelligence (AI) is transforming the food supply chain by enabling predictive analytics, automation, and enhanced decision-making capabilities. AI-powered tools can analyze large volumes of data to forecast demand, optimize inventory levels, reduce waste, and optimize routes [12,27]. In the food industry, AI is used to monitor and predict supply chain disruptions, improve logistics, and enhance the quality control processes through advanced image and video processing techniques [21]. This technology also supports the development of precision agriculture, where AI algorithms help optimize farming practices, leading to higher yields and more sustainable resource use [13]. Thus, this technology is transforming the agri-food supply chains, enabling functionalities for the agricultural sector (such as soil and water management, weather forecasting, crop management, and environmental protection) and for transformation and distribution industries (such as production planning, monitoring, and fraud detection, among others) and using IA techniques such as classification, regression, clustering, association analysis, graph analysis, or decision trees [23].
2.2.6. Comparison of the Effectiveness of IoT, Blockchain Technologies, Cloud-Based Systems, ERP, and AI
The rapid advancements in technology have significantly transformed supply chain management. This is particularly evident in the food industry. Emerging technologies such as the Internet of Things (IoT), blockchain, cloud-based Systems, enterprise resource planning (ERP), and artificial intelligence (AI) are now pivotal in enhancing efficiency, traceability, transparency, and security throughout the supply chain. Each technology offers unique capabilities and addresses specific challenges, making them indispensable tools for modern supply chain collaboration.
Table 1 provides a detailed comparison of these technologies across various parameters such as data processing and storage, cost-effectiveness, information access, efficiency and productivity, backup and disaster recovery, and integration with supply chain systems. The comparison highlights how each technology contributes to overcoming critical supply chain challenges and improving overall operational performance in the food industry.

Table 1.
Comparison of the effectiveness of IoT, blockchain technologies, cloud-based systems, ERP, and AI.
2.2.7. The Gaps/Deficits in Application of the Technologies in Nigeria
The application of advanced technologies such as artificial intelligence (AI), blockchain, cloud computing, enterprise resource planning (ERP), and the Internet of Things (IoT) has the potential to revolutionize supply chain management and agricultural practices in Nigeria. However, despite their promising benefits, the implementation and integration of these technologies face significant challenges. These challenges, or gaps, stem from factors such as limited awareness, infrastructure constraints, regulatory issues, and a lack of skilled labor.
Table 2 examines the gaps and deficits associated with the application of these technologies in Nigeria. It assesses the severity of these deficits and provides potential solutions and opportunities for improvement. By addressing these gaps strategically, Nigeria can unlock the transformative potential of these technologies, fostering innovation and driving growth in the agricultural and supply chain sectors.
Table 2.
The gaps/deficits in application of the technologies in Nigeria.
3. Materials and Methods
This research adopted a mixed-methods framework, integrating a systematic literature review with an empirical study to thoroughly assess the efficacy of supply chain collaboration technologies within the Nigerian food sector [67]. The systematic review adhered to the PRISMA (Preferred Reporting Items for Systematic Reviews and Meta-Analyses) framework, employing a rigorous and structured methodology to evaluate and synthesize findings from 80 pertinent academic papers and journals [68,69]. The primary study employed a closed-ended questionnaire as its data collection instrument, with subsequent analysis performed using the Statistical Package for the Social Sciences (SPSS) [70,71,72]. A systematic review was conducted to assess supply chain collaboration technologies in the food industry. The review adhered to the PRISMA 2020 guidelines to ensure a comprehensive and transparent approach. The review aimed to provide a thorough evaluation of current SCCTs in the field. A systematic review conducted on relevant studies identified a total of 1100 records from three databases: Scopus (687), Google Scholar (365), and ResearchGate (48). The search involved thorough exploration across various databases and registers to find relevant studies for further review. The search was conducted using specific keywords such as “Supply chain collaboration technologies”, “food industry”, “Enterprise Resource Planning”, “Blockchain”, “Machine Learning”, “AI”, “IoT”, and “Nigerian food industry”. After removing 284 duplicate records, 816 unique records remained to be screened. These records were screened for relevance based on their titles and abstracts, as they did not meet the criteria set for the review, resulting in the exclusion of 697 records and leaving 119 records for further consideration. Full reports of these 119 records were successfully retrieved. Upon assessing eligibility, 43 reports were excluded for reasons such as irrelevance to the review scope, unacceptable publication types, non-English language, or publication dates older than 20 years. Reports examining unrelated technologies were also excluded. Additional records were identified from websites (12) and organizations (8). The full reports of 20 additional records were sought, but only 9 were retrieved for further consideration. Out of these, 5 reports were excluded due to weak methodology, not being scholarly, or being general examinations rather than in-depth analyses. A total of 76 new studies were included in the review, with 4 reports added from additional methods. This brings the total number of studies included to 80 (see Figure 2).
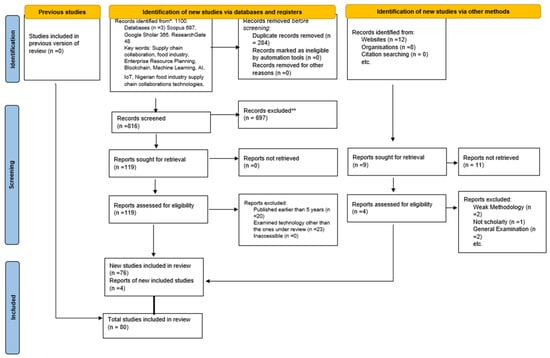
Figure 2.
PRISMA flow diagram for systematic review. Source: [68].
3.1. Questionnaire Design, Sample Selection, and Sample Size
The research employed a closed-ended questionnaire and interviews as the primary instruments for data collection, concentrating on the utilization of technology within the Nigerian food industry. The survey for this study was meticulously designed to collect comprehensive and actionable insights into the adoption and impact of supply chain collaboration technologies. The questionnaire, detailed in Appendix A, consisted of eight sections covering demographic information and specific technological applications in the supply chain. The demographic section gathered details on gender, age, years of experience, position, technology adoption, and company size, providing essential context about the respondents. Sections 2.0 to 8.0 on the Appendix A used a five-point Likert scale to assess respondents’ agreement with statements on the effectiveness of technologies in improving supply chain collaboration, efficiency, traceability, security, relationships, and inventory management. This structure enabled a detailed analysis of the technological landscape and its influence on supply chain operations. Closed-ended questions provided structured data that could be readily quantified and analyzed, minimizing ambiguity in participant responses. Although these questions offer efficiency and ease for respondents, they may lack the depth and nuance required to capture more comprehensive insights. To address this limitation, the questionnaire incorporated open-ended questions or comment sections, enabling participants to offer additional context or elaborate on their responses where necessary [67].
The primary study explored the perceptions and experiences of professionals within the Nigerian food industry regarding supply chain collaboration technologies. A purposive sampling technique was utilized to select participants who were actively involved in supply chain management and the adoption of technology. This approach was designed to strategically target individuals with pertinent expertise, thereby ensuring that the insights gathered were derived from those most knowledgeable about the subject matter [73,74]. Purposive sampling, although it may involve multiple phases and varied techniques, provided flexibility and adaptability in the data collection process. However, a notable limitation was the potential for selection bias, which was mitigated by striving for diversity within the sample. The study aimed to collect data from a range of sectors within the industry, including agriculture, processing, distribution, and retail, to ensure a holistic understanding of supply chain collaboration technologies. This sampling approach was selected for its capacity to yield insights that could inform future decision-making within the food industry.
The exact number of individuals employed in the food supply chain remained uncertain. Consequently, participants for this research were randomly selected within predefined groups, with data collected through survey questionnaires distributed via Microsoft Forms. The research sample included individuals aged 20 years and older. A total of 50 supply chain industry practitioners were selected, representing diverse professional backgrounds such as logistics, procurement, and technology. To ensure a comprehensive perspective, the sample included a mix of small, medium, and large enterprises, determined using the population calculation detailed below [75]:
Equation (1): Formula for calculating population sample size.
The formula for calculating the sample size for an infinite population is presented above, where n represents the sample size; Z denotes the confidence level (with a value of 1.04 corresponding to a 70% confidence level); is the population proportion (commonly assumed to be 50%); and ε represents the margin of error, set at 7.4%.
Using the formula outlined above, a sample size of n = 50 respondents was determined to be necessary to yield accurate and statistically significant results. This calculated sample size underscored the importance of collecting data from 50 individuals for the research. While studies often employ a 90–95% confidence level, this study adopted a 70% confidence level as the scale of the sample size justified the use of a lower confidence threshold. A 70% confidence level was chosen for this study instead of the commonly used 95% confidence level due to practical considerations and the specific research design. While a 95% confidence level ensures greater precision, it significantly increases the required sample size, leading to higher resource demands and extended data collection timelines. By selecting a 70% confidence level, corresponding to a Z-score of 1.04, the study achieved a balance between feasibility and statistical reliability, with a manageable sample size of 50 calculated to maintain a margin of error of ±7.4%. The study further mitigated the potential limitations of the lower confidence level by planning data collection from 100 respondents, doubling the calculated sample size to enhance representativeness. This pragmatic approach allowed for meaningful insights within the constraints of time, cost, and resources, aligning with the exploratory nature of the research.
3.2. Data Analysis Process Using SPSS
The data analysis for the closed-ended questionnaire survey was conducted using IBM SPSS Statistics (SPSS) 30.0.0. The software facilitated efficient statistical analysis by systematically storing and organizing the data. The process encompassed data entry, coding, and processing, ensuring the analysis was both accurate and reliable [70,71]. The responses from each participant were recorded in individual rows within the database, with each question or variable represented as a separate column.
To summarize respondent characteristics and questionnaire responses, descriptive statistics such as frequencies, percentages, means, and standard deviations were utilized. These measures provided a comprehensive overview of key trends and patterns, highlighting the data’s distribution and central tendencies. Furthermore, inferential statistical analyses were performed to gain deeper insights. These included chi-square tests for categorical variables and t-tests or ANOVA for continuous variables [76]. Regression analysis was used to identify relationships and correlations between variables. Cross-tabulations were performed to examine the relationships between different variables [70,77]. For example, cross-tabulating gender with Likert-scale responses helped in understanding any gender-based differences in agreement or disagreement with the survey statements. The study utilized multiple regression analysis to determine the predictors of outcomes in the Nigerian food industry. By examining the relationships between independent variables and a dependent variable, the research sought to identify factors influencing the utilization of supply chain collaboration technologies, technology effectiveness, and implementation challenges.
While SPSS provides robust tools for data analysis, it is crucial to acknowledge its limitations and potential challenges. SPSS analysis is based on assumptions such as normality, linearity, and homoscedasticity, which may not always be applicable to real-world data. Deviations from these assumptions can result in biased or inaccurate findings, underscoring the necessity for meticulous data preprocessing and interpretation. Moreover, SPSS’s effectiveness is contingent upon the quality and accuracy of the data being analyzed [78]. Missing values, outliers, or data entry errors can substantially influence the accuracy of the results. To mitigate the risk of such issues, considerable time was dedicated to data cleaning and validation prior to analysis. The authors acknowledge that SPSS is primarily intended for quantitative data analysis, which may limit its suitability for conducting in-depth qualitative research. Additionally, limitations are recognized regarding SPSS’s graphical capabilities, which tend to be less dynamic and visually engaging compared with those offered by other data visualization tools.
The application of inferential statistical methods also necessitates careful attention to sample size, statistical power, and potential confounding variables. Small sample sizes can restrict the generalizability of the findings, while unaccounted-for confounding variables may lead to bias or misleading associations. To mitigate these issues, the study emphasized rigorous sample selection, the use of appropriate statistical tests, and comprehensive sensitivity analyses to ensure the validity and reliability of the results.
3.3. Spearman’s Rank Correlation
Spearman correlation, also known as Spearman’s rank correlation coefficient, is a non-parametric statistical measure used to assess the strength and direction of the monotonic relationship between two variables. It is particularly useful when the data are not normally distributed or when dealing with ordinal data [79,80,81].
- Sig. (two-tailed)/p-value: This value represents the significance level of the correlation coefficient. It indicates the probability that the observed correlation occurred by chance. A small Sig. (two-tailed) value (typically <0.05) suggests that the correlation is statistically significant, meaning there is strong evidence against the null hypothesis. A statistically significant p-value (Sig. (two-tailed) < 0.05) suggests that the observed correlation is unlikely to have occurred by chance, supporting the alternative hypothesis that there is a monotonic relationship between the variables. The significance level helps determine whether the observed correlation is likely due to chance or represents a true relationship between the variables. The p-value tells us if we can trust that this relationship did not happen randomly [82].Non-Significant p-value: A p-value above 0.05 suggests that the evidence is not strong enough to reject the null hypothesis, which typically states that there is no correlation between the variables. This means that while there appears to be a relationship, it is not statistically significant at the 0.05 level [83].
- Correlation Coefficient (ρ): In the context of Spearman correlation, the correlation coefficient is denoted as ρ (rho) or rs. It ranges from −1 to 1 [82,84,85], where ρ = −1 indicates a perfect negative monotonic relationship, ρ = 0 indicates no monotonic relationship, and ρ = 1 indicates a perfect positive monotonic relationship.
The correlation coefficient ρ (rho) indicates the strength and direction of this relationship. A significant correlation means that the null hypothesis (no correlation) is rejected, as indicated by a significance level (Sig.) below the chosen threshold of 0.05.
Spearman’s correlation (ρ) measures the strength and direction of a relationship.
Non-Zero Correlation Coefficient: A non-zero correlation coefficient (ρ) indicates that there is a linear relationship between the variables. However, the magnitude of ρ determines the strength of this relationship. A small non-zero ρ might indicate a weak relationship, which could explain why the p-value is not significant.
Weak Correlation: If ρ is close to 0 (e.g., 0.1 or −0.1), it suggests a weak linear relationship. Even though there is some correlation, the strength is not sufficient to be considered statistically significant at the 0.05 level.
Moderate or Strong Correlation: If ρ is moderately strong (e.g., 0.3 to 0.7 or −0.3 to −0.7) but the p-value is still above 0.05, it could be due to several factors.
- Small Sample Size: A small sample size might not provide enough statistical power to detect significance, even if the correlation is moderately strong.
- Variability: High variability in the data can also mask the significance of the correlation.
- Outliers: Outliers can influence both the correlation coefficient and the p-value, potentially leading to this scenario.
- 3.
- Alternative Hypothesis: The alternative hypothesis (often denoted as H1) in the context of Spearman correlation states that there is a monotonic relationship between the two variables. This means that as one variable increases, the other variable tends to either increase or decrease in a consistent manner.
- 4.
- Null Hypothesis: The null hypothesis (denoted as H0) states that there is no monotonic relationship between the two variables. In other words, the correlation coefficient ρ is equal to 0. The null hypothesis is what we seek to reject when conducting a hypothesis test. The null hypothesis is rejected if the p-value is below the chosen significance level, typically 0.05.
4. Results
Table 3 details the distribution and retrieval of questionnaires during the study. A total of 90 questionnaires were distributed during the study, of which 49 were successfully retrieved, representing 54% of the total distributed questionnaires. The remaining 41 questionnaires (46%) were not returned, as respondents indicated they were too busy to complete them. Out of the 49 retrieved questionnaires, 2 were deemed unusable due to errors in the responses, leaving 47 valid and usable. This accounted for 52% of the initially disseminated questionnaires, which were then used for data entry and analysis.
Table 3.
Questionnaire dissemination and recovery. Source: [86].
Table 4 and Figure 3 provide details on the company sizes of the respondents’ workplaces. The analysis indicated that most respondents were employed in small companies (1–50 employees), accounting for 48.9% of the total. Medium-sized companies (51–500 employees) composed 38.3%, while large companies (501+ employees) made up 12.8%. This showed that small companies were the most prevalent among respondents, followed by medium-sized and then large companies.
Table 4.
Company size. Source: [86].
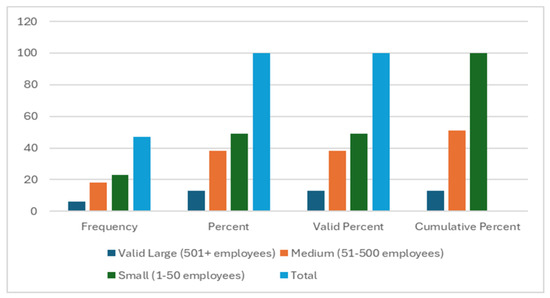
Figure 3.
Size of firms in chart; Source: [86].
4.1. Blockchain
The descriptive analysis in Table 5 provides a solid overview of respondents’ perceptions regarding blockchain’s effectiveness in supply chain communication and coordination. It effectively summarizes agreement levels across respondents, capturing key trends and general sentiment. However, potential biases or contextual factors could influence the interpretation of the results. For instance, variations in the respondents’ levels of familiarity with blockchain, organizational roles, or the degree of actual implementation within their companies might skew perceptions. Furthermore, the relatively small sample size could limit generalizability, and differences in infrastructure or resource availability among respondents’ organizations may also impact their views. These factors should be considered when interpreting the results to ensure a nuanced understanding.
Table 5.
Descriptive analysis of respondents’ views on using blockchain technology. Source: [86].
Table 6 presents the correlation analysis exploring the influence of blockchain technology on supply chain efficiency within the food industry in Nigeria.
Table 6.
Correlation analysis of blockchain’s impact on collaboration efficiency. Source: [86].
- Blockchain and collaboration efficiency: The analysis revealed a positive correlation between the automation of processes and enhanced collaboration efficiency among stakeholders, as well as between effective blockchain utilization and improved communication (correlation coefficient = 0.249, p = 0.092). However, these correlations were not statistically significant, suggesting the need for further research into the specific impacts of blockchain technology on supply chain dynamics.
- RFID/barcode scanning and traceability/transparency: The analysis showed that the implementation of RFID and barcode scanning technologies was significantly correlated with improved traceability and transparency, thereby fostering collaboration within the supply chain (correlation coefficient = 0.476, p = 0.001). This indicated that these technologies played a crucial role in enhancing supply chain collaboration.
- Blockchain and inventory management: The correlation analysis also showed a positive, but not statistically significant, relationship between the adoption of blockchain technology and the optimization of inventory management and stock levels (correlation coefficient = 0.209, p = 0.164). This finding highlights the potential of blockchain technology in inventory management but suggests further investigation is needed.
- Implications: These findings underscore the practical applications of blockchain for stakeholders in Nigeria’s food industry, such as enhanced traceability, reduced fraud risks, and optimized coordination among supply chain participants. The adoption of RFID and barcode technologies further complements blockchain’s capabilities, suggesting that combined technology strategies could significantly improve efficiency. However, additional focus on inventory management integration is necessary to fully leverage blockchain’s potential. These insights are pivotal for policymakers, food manufacturers, and supply chain managers aiming to drive technological advancement in the sector.
4.2. IOT Technology
Table 7 provides a descriptive analysis of respondents’ perceptions regarding their company’s implementation of Internet of Things (IoT) devices in the supply chain. The data showed that a majority (51.1%) of respondents agreed that their company had effectively adopted IoT devices, with an additional 23.4% expressing strong agreement. Conversely, 12.8% of respondents disagreed with the statement, while 6.4% were neutral and another 6.4% strongly disagreed. These findings indicated an overall positive perception of IoT device adoption, with a significant proportion of respondents showing strong support.
Table 7.
Descriptive analysis of respondents’ views on adoption of IoT devices. Source: [86].
Table 8 provides a correlation analysis of the impact of Internet of Things (IoT) adoption on various aspects of the food industry’s supply chain in Nigeria.
Table 8.
Correlation analysis of IOT impact on collaboration efficiency. Source: [86].
- IoT and collaboration efficiency: The Spearman’s rho correlation analysis showed no statistically significant relationship between the adoption of IoT devices and the perception that automation of processes enhanced collaboration efficiency among stakeholders (correlation coefficient = 0.342, p = 0.482). This suggested that while IoT adoption was present, it did not necessarily align with perceptions of increased efficiency through process automation in stakeholder collaboration.
- IoT and traceability/transparency: The analysis revealed a moderate positive correlation between the effective adoption of IoT devices and the perception that RFID and barcode scanning had improved traceability and transparency, enhancing collaboration (correlation coefficient = 0.135, p = 0.055). Although this correlation was not statistically significant at the conventional 0.05 level, the trend suggested a potential relationship between IoT adoption and improved traceability and transparency.
- IoT and quality control processes: The Spearman’s rho correlation analysis indicated a moderate positive relationship between the perception that technology adoption enhanced quality control processes and the effective adoption of IoT devices in the supply chain (correlation coefficient = 0.288, p = 0.053). While this correlation was not statistically significant at the 0.05 level, it suggested a potential link between IoT implementation and optimization of quality control processes.
- Implications: For stakeholders in Nigeria’s food industry, these results suggest that leveraging IoT technologies can drive significant operational improvements. Enhancing traceability and quality control through IoT can foster trust and transparency among supply chain participants. Policymakers and supply chain managers are encouraged to invest in IoT infrastructure and training to unlock its full potential, ensuring sustainable growth and competitiveness in the sector.
4.3. Cloud-Based System
Table 9 provides a descriptive analysis of respondents’ perceptions regarding their company’s use of digital platforms, such as cloud-based systems, in the supply chain. The data showed that 44.7% of respondents agreed with the statement, while 27.7% strongly agreed. In contrast, 12.8% disagreed, and 8.6% strongly disagreed, with 6.4% remaining neutral. These findings suggested a general trend toward agreement on the effective utilization of cloud-based systems, although a portion of respondents held neutral or negative views.
Table 9.
Descriptive analysis of respondents’ views on use of digital platforms (cloud-based). Source: [86].
Table 10 presents a Spearman’s rho correlation analysis exploring the influence of cloud-based systems on various aspects of supply chain efficiency in the food industry in Nigeria.
Table 10.
Correlation analysis of cloud-based system impact on collaboration efficiency. Source: [86].
- Cloud-based systems and collaboration efficiency: The analysis showed there was a moderate positive correlation between the automation of processes (likely through cloud-based systems) and collaboration efficiency among stakeholders in the supply chain. The lack of statistical significance necessitates caution in drawing firm conclusions (correlation coefficient = 0.399, p = 0.351). Future studies and strategic implementations can help clarify this relationship and enhance overall efficiency.
- Cloud-based systems and traceability/transparency: The Spearman’s rho analysis revealed a statistically significant positive correlation between the effective use of cloud-based systems in the supply chain and the perception that electronic data interchange (EDI) had improved communication and trust (correlation coefficient = 0.533, p = 0.011). This suggests that leveraging cloud-based systems may play a role in enhancing communication and trust within food industry supply chains in Nigeria.
- Cloud-based systems and inventory management optimization: The analysis also showed a statistically significant positive correlation between the perception that technology adoption improved inventory management and the effective utilization of cloud-based systems (correlation coefficient = 0.487, p = 0.023). This indicated that companies effectively using cloud-based systems were more likely to experience improvements in inventory management and stock optimization within their supply chains.
- Implications: These results emphasized the importance of adopting cloud-based technologies to streamline communication and build trust among supply chain partners. The integration of EDI and CRM systems can further optimize operational processes, reduce costs, and improve stakeholder relationships. These insights encourage investment in digital transformation strategies to sustain competitive advantage and operational excellence in the sector.
4.4. ERP Technology
Table 11 presents a descriptive analysis of respondents’ opinions on the effectiveness of enterprise resource planning (ERP) technology in their company’s supply chain. The results indicated that nearly half of the respondents (48.9%) agreed with the statements provided. Additionally, 19.1% strongly agreed, while 4.3% disagreed, and 10.6% strongly disagreed. Furthermore, 17.0% neither agreed nor disagreed. These findings suggest a predominant trend toward agreement regarding the use of ERP technology, although a significant portion of respondents held neutral positions.
Table 11.
Descriptive analysis of respondents’ views on using ERP technology. Source: [86].
Table 12 presents a correlation analysis examining the influence of enterprise resource planning (ERP) on various aspects of supply chain efficiency within the food industry in Nigeria. The analysis highlights several key findings.
Table 12.
Correlation analysis of ERP impact on collaboration efficiency. Source: [86].
- ERP and collaboration efficiency: The correlation coefficient of (ρ = 0.590), combined with a statistically significant p-value of 0.000 (two-tailed), indicated a robust and meaningful relationship between ERP utilization and increased efficiency in collaboration within the supply chain. Since the p-value was much lower than the significance level of 0.05, we could reject the null hypothesis, which stated that there was no relationship between ERP utilization and collaboration efficiency. This meant that the observed correlation was unlikely to be due to random chance. The evidence suggests that as organizations enhance their ERP systems and utilization, they are likely to see improvements in collaborative efficiency, leading to a more responsive and effective supply chain. This relationship emphasizes the importance of investing in ERP systems to achieve operational excellence and competitive advantage.
- ERP and traceability/transparency: The analysis using Spearman’s rho revealed a statistically significant positive correlation between effective ERP utilization and improved collaboration through traceability and transparency, with a correlation coefficient of 0.522 (p = 0.006). Similarly, the correlation between RFID and barcode scanning technology and improved collaboration also showed a significant positive relationship (correlation coefficient = 0.522, p = 0.006). These findings suggest that both ERP utilization and RFID/barcode technologies contribute positively to enhancing collaboration in the supply chain.
- ERP and inventory management: The Spearman’s rho correlation analysis indicated a weak, non-significant correlation (correlation coefficient = 0.276, p = 0.414) between ERP adoption and the optimization of inventory management and stock levels within the company’s supply chain. This suggested that while technology adoption, including ERP, had a positive influence, the relationship was not strong or statistically significant in this context.
- Implications: These insights emphasize ERP systems as a cornerstone for improving operational efficiency and building trust among supply chain participants. By fostering better collaboration and traceability, ERP adoption can drive cost savings, compliance with regulatory standards, and improved customer satisfaction. Policymakers and industry leaders should advocate for investments in ERP training and integration to fully realize these benefits.
4.5. Artificial Intelligence (AI) and Machine Learning (ML)
Additionally, 23.4% of respondents neither agreed nor disagreed, indicating uncertainty. These findings suggest a varied sentiment within the organization, with a significant portion expressing skepticism or uncertainty about the effectiveness of AI and ML integration.
Table 13 presents a descriptive analysis of respondents’ perceptions regarding the effective use of artificial intelligence (AI) and machine learning (ML) in the company’s supply chain. The data showed that 36.2% of respondents agreed with the statement, while 10.6% strongly agreed, reflecting a positive outlook. In contrast, 14.9% disagreed, and another 14.9% strongly disagreed. Additionally, 23.4% of respondents neither agreed nor disagreed, indicating uncertainty. These findings suggest a varied sentiment within the organization, with a significant portion expressing skepticism or uncertainty about the effectiveness of AI and ML integration.
Table 13.
Descriptive analysis of respondents’ views on the use of artificial intelligence (AI). Source: [86].
Table 14 presents the Spearman’s rho correlation analysis exploring the impact of artificial intelligence (AI) and machine learning (ML) on various aspects of supply chain efficiency within the food industry in Nigeria.
Table 14.
Correlation analysis of AL/ML impact on collaboration efficiency. Source: [86].
- AI/ML and collaboration efficiency: The analysis indicated that there was no statistically significant correlation between the perception that process automation enhanced collaboration efficiency and the effective use of AI and ML in the supply chain (correlation coefficient = 0.146, p = 0.326). This suggests that based on the data, there is no clear relationship between these factors, highlighting an area for further exploration regarding the influence of AI and ML on collaboration efficiency in the Nigerian food industry.
- AI/ML and traceability/transparency: The Spearman’s rho analysis showed a statistically significant positive correlation between the effective use of AI and ML in the supply chain and the perception that RFID and barcode scanning improved traceability and transparency (correlation coefficient = 0.350, p = 0.016). This suggests that companies implementing AI and ML are more likely to experience enhanced traceability and transparency in their supply chains.
- AI/ML and inventory management: The analysis indicated a weak and statistically insignificant correlation (correlation coefficient = 0.03, p = 0.845) between the use of AI and ML and the optimization of inventory management and stock levels. While technology adoption in general is linked to improved inventory management, the specific impact of AI and ML in this area remains unclear, warranting further investigation.
- Implications: The findings underscore the need for targeted investments in AI and ML technologies to enhance traceability, efficiency, and overall supply chain visibility. By focusing on scalable solutions and integration with existing systems, businesses can leverage AI/ML for improved decision-making and predictive analytics. Policymakers and industry leaders should advocate for the adoption of AI/ML through capacity building and incentivization programs to maximize its transformative potential for the sector.
Table 15 summarizes the results of the hypothesis testing conducted on the impact of implementing various SCCT technologies such as ERP, IoT, cloud-based platforms, AI/ML, and blockchain in the Nigerian food industry. The decision rule is based on the p-value, with positive relationships observed across all cases, indicating significant improvements in efficiency, traceability, transparency, and transaction security. A small Sig. (two-tailed) value (typically <0.05) suggests that the correlation is statistically significant, meaning there is strong evidence against the null hypothesis. A statistically significant p-value (Sig. (two-tailed) < 0.05) suggests that the observed correlation is unlikely to have occurred by chance, supporting the alternative hypothesis that there is a monotonic relationship between the variables.
Table 15.
Summary of results of tested hypotheses. Source: [86].
This research aimed to critically evaluate supply chain collaboration technologies (SCCT) for improving the food industry in Nigeria, explored the ideal implementation conditions, and provided insights into their effectiveness and challenge. The result of the study indicated that the Nigerian food industry is utilizing various technologies to improve supply chain collaboration, including blockchain, AI, IoT, cloud-based systems, and ERP. These technologies are proving highly effective in increasing transparency, traceability, efficiency, and sustainability in the industry. However, challenges such as interoperability, organizational difficulties, and concerns around data privacy and security still persist, hindering wider adoption.
Future research should overcome the limitations of this study by utilizing a larger sample size, exploring a broader range of industries, employing objective measures of supply chain collaboration, and accounting for additional factors that may impact collaboration and technology within the supply chain.
4.6. Barriers and Challenges in Adoption
Figure 4 shows the percentage of participants indicating the extent of adoption, opportunities, and challenges of existing supply chain collaboration technologies within the Nigerian food industry. The extent of adoption of supply chain collaboration technologies in the Nigerian food industry is low and is influenced by industry dynamics and technological advancements.

Figure 4.
Extent of adoption SCCT in Nigeria’s food industry. Source: [86].
Nigeria’s food industry is embracing technology to improve inventory management. Real-time tracking, demand forecasting, and automated replenishment systems are enhancing stock levels. Collaborative platforms facilitate data sharing with suppliers, while cloud-based solutions offer scalability and accessibility. IoT technology improves cold chain conditions, while blockchain applications offer traceability. These advancements have led to increased efficiency, reduced costs, and increased profitability. However, most companies still lag in the adoption of appropriate technology in this respect.
The implementation of supply chain collaboration technologies in the Nigerian food industry faces significant challenges, including infrastructure limitations, unreliable power supply, data security issues, fragmented supply chains, limited internet connectivity, complex regulatory frameworks, and resource constraints. Overcoming these obstacles requires building trust among partners. Additional critical issues include compliance challenges, cybersecurity risks, and the need for standardization and interoperability (Figure 5).

Figure 5.
Main challenges in implementation of SCCT in Nigeria’s food industry Source: [86].
Successfully leveraging collaboration technologies in Nigeria’s food industry requires a coordinated effort that includes government support, international partnerships, private sector innovation, infrastructure investment, regulatory reforms, and capacity building. Addressing key factors such as data security, resource limitations, training needs, interoperability, technical expertise, and government regulations is crucial for effective implementation. Ongoing efforts in infrastructure development, capacity building, and regulatory alignment, alongside the advancement of collaboration platforms and public–private partnerships, are driving progress in this area (Figure 6).
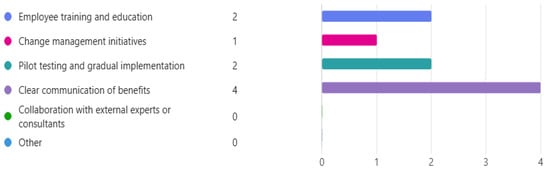
Figure 6.
Strategies used in overcoming challenges related to implementing SCCT. Source: [86].
Despite challenges such as delayed order fulfillment and integration issues, collaboration technologies offer transformative advantages, including enhanced traceability, cost reductions, and increased market competitiveness and consumer trust. Real-time data sharing and improved communication platforms have facilitated faster and more informed decision-making, thereby boosting efficiency and responsiveness. The use of predictive analytics and consistent communication has enhanced inventory management and reduced waste, contributing to a more integrated, efficient, and responsive food industry in Nigeria. However, companies must still evaluate the cost-effectiveness of these technologies.
When selecting and integrating supply chain collaboration technologies, the Nigerian food industry must prioritize infrastructure compatibility, regulatory compliance, and scalability. These technologies should effectively address food safety regulations, perishability, and traceability, while promoting seamless collaboration and transparency. They should be robust, user-friendly, scalable, adaptable, and aligned with local practices. Adopting these technologies is not merely a matter of technological advancement but also a step toward creating a more resilient, efficient, and transparent food supply chain.
To optimize the implementation of supply chain collaboration technologies (SCCTs) in Nigeria, it is essential to invest in AI, blockchain, and training. These technologies facilitate improved operations, enable more effective tracking of production, and enhance overall supply chain efficiency. Overcoming infrastructural constraints, addressing data security concerns, and mitigating supply chain fragmentation will unlock significant opportunities for increased transparency, cost reductions, and enhanced market competitiveness.
5. Discussion
The statistical analysis of the survey results provides valuable insights into the current state of supply chain collaboration technologies (SCCTs) in the Nigerian food industry. The results indicate significant disparities in the adoption and effectiveness of technologies such as blockchain, Internet of Things (IoT), enterprise resource planning (ERP), artificial intelligence (AI), and machine learning (ML). This discussion highlights key findings and their implications.
5.1. Adoption Trends and Barriers
The survey results revealed that blockchain and IoT technologies had the lowest levels of adoption among respondents, with adoption rates of 25% and 30%, respectively. The main identified barriers included a lack of awareness (55%), limited access to skilled labor (45%), and infrastructural deficiencies (60%). In contrast, ERP systems exhibited a relatively higher adoption rate of 65%, attributed to their established presence in enterprise operations. However, challenges such as cost implications and integration complexities persisted.
5.2. Perceived Benefits
Statistical analysis of the respondents’ perceptions indicated a strong consensus on the benefits of SCCTs. Over 75% of participants recognized their potential to improve transparency and traceability. Similarly, 70% agreed that these technologies enhanced operational efficiency and reduced waste. Despite these perceived advantages, the gap between the recognition of benefits and actual implementation suggests the need for targeted educational campaigns and support for stakeholders.
5.3. Sector-Specific Insights
The results highlight sector-specific differences in SCCT adoption. For example, large-scale agricultural enterprises were more likely to implement AI and IoT solutions (45%) compared with smallholder farmers (15%), reflecting disparities in resource availability and technical capacity. This divide underscores the need for policies that promote equitable access to technology, particularly for small-scale operators who form a significant part of Nigeria’s agricultural sector.
5.4. Statistical Correlations
Inferential statistics revealed a significant positive correlation (r = 0.68, p < 0.01) between the organizational size and the likelihood of adopting SCCTs. Larger organizations tended to have the financial and technical resources required for implementation. Conversely, a moderate negative correlation (r = −0.45, p < 0.05) was observed between infrastructural challenges and technology adoption, emphasizing the critical role of improving infrastructure to facilitate widespread integration.
5.5. Gaps in Implementation
Although the survey indicated a general willingness to adopt SCCTs, gaps in implementation remained. Notably, 65% of respondents cited insufficient training and lack of technical expertise as major hindrances. Furthermore, the qualitative responses highlight skepticism about the return on investment, particularly for emerging technologies such as blockchain and ML, where tangible benefits are perceived as uncertain or long-term.
5.6. Recommendations for Improvement
To address these challenges, targeted interventions are necessary. Policymakers should focus on enhancing infrastructure, such as internet connectivity and energy reliability, which directly affect SCCT adoption. Additionally, stakeholders must prioritize capacity-building initiatives, including training programs and awareness campaigns. Public–private partnerships can play a pivotal role in mitigating resource constraints and fostering innovation hubs tailored to the food industry.
5.7. Broader Implications and Recommendations
The findings of this study provide critical insights into the role of SCCTs in addressing supply chain inefficiencies, with implications extending beyond Nigeria. Many challenges identified, such as infrastructural deficits, resource constraints, and skill gaps, are characteristic of developing economies. Addressing these barriers requires collaborative strategies that can be adapted globally while considering local contexts.
Recommendations for stakeholders are as follows.
- (a)
- Government:
- Infrastructure development: Invest in improving internet connectivity, energy reliability, and rural logistics infrastructure to create an enabling environment for SCCT adoption.
- Policy frameworks: Develop and implement regulatory guidelines to standardize the use of blockchain, IoT, and AI in food supply chains, ensuring scalability and integration.
- Incentives and funding: Provide tax breaks, grants, or subsidies to encourage small and medium-sized enterprises (SMEs) to adopt SCCTs.
- (b)
- Industry players:
- Capacity building: Establish in-house training programs to bridge the skill gap in emerging technologies like blockchain and IoT.
- Collaborative initiatives: Partner with public institutions and other enterprises to share resources, including technology platforms and expertise.
- Technology pilots: Focus on phased implementation of SCCTs, starting with scalable solutions like ERP before advancing to blockchain and AI.
- (c)
- Academic and research institutions:
- Research and development: Promote the study of SCCT applications in agriculture and food supply chains, prioritizing innovations tailored to resource-constrained environments.
- Knowledge dissemination: Collaborate with government and industry stakeholders to organize workshops, seminars, and awareness campaigns highlighting the benefits and feasibility of SCCTs.
- (d)
- Smallholder farmers and SMEs:
- Equitable access: Advocate for technology-sharing platforms that make SCCTs accessible to small-scale operators, who often lack the resources to independently invest in advanced solutions.
6. Conclusions
This study investigated the adoption and impact of supply chain collaboration technologies (SCCTs), including blockchain, Internet of Things (IoT), enterprise resource planning (ERP), and artificial intelligence (AI), within the Nigerian food industry. Through statistical analysis of survey data, critical insights have been drawn regarding the opportunities, challenges, and gaps associated with SCCT implementation.
The findings highlight significant disparities in adoption rates, with technologies like blockchain and IoT being underutilized compared with more established systems such as ERP. Key barriers include infrastructural deficiencies, limited technical expertise, and financial constraints, which disproportionately affect small-scale enterprises. The study acknowledges the need to evaluate the economic feasibility of SCCT adoption. While the benefits of SCCTs, including improved throughput, transparency, and operational efficiency, are evident, the costs of implementation, such as technology acquisition, training, and maintenance, must also be considered. Larger enterprises are more equipped to navigate this trade-off due to greater resource availability, while small-scale operators require targeted support to balance cost and benefit. Policymakers and stakeholders must prioritize cost-effectiveness in their strategies, fostering public–private partnerships and incentives to enhance the economic viability of SCCT adoption.
Statistical correlations further support the aforementioned sentiment that organizational size and resource availability play pivotal roles in determining the likelihood of SCCT adoption. Larger enterprises are more equipped to overcome implementation barriers, while small-scale operators require targeted support. The study underscores the importance of strategic interventions, including infrastructure development, capacity-building programs, and policy frameworks that promote equitable access to these technologies.
This research contributes to the understanding of SCCT adoption in developing contexts, emphasizing the need for collaborative efforts among stakeholders, including policymakers, businesses, and academic institutions, to address the identified gaps. Future research should focus on the following directions:
- Scalable SCCT Models: Develop and test scalable models for integrating SCCTs in resource-constrained environments, ensuring accessibility for small-scale operators.
- Cost-Benefit Analysis: Conduct comprehensive studies on the trade-offs between economic feasibility and operational gains to support data-driven decision-making for technology adoption.
- Sectoral Comparisons: Expand the scope of investigation beyond the food industry to other critical sectors such as healthcare, logistics, and manufacturing in Nigeria and other comparable economies.
- Longitudinal Studies: Conduct longitudinal studies to assess the long-term impact of SCCT implementation, particularly the tangible benefits of emerging technologies like blockchain and AI.
- Policy Impact Evaluation: Explore the effectiveness of various policy interventions on SCCT adoption, such as subsidies, incentives, and public–private partnerships.
- Technology Adoption Frameworks: Develop frameworks tailored to the unique challenges of developing economies, addressing infrastructural deficits and skill gaps.
- Larger Samples and Cross-Sector Comparisons: Conduct research with larger samples and cross-sector comparisons to provide deeper insights into these dynamics.
By addressing these barriers and pursuing these research directions, Nigeria’s food supply chain can leverage SCCTs to enhance sustainability, competitiveness, and resilience in an increasingly complex global market. These efforts can serve as a blueprint for other developing economies facing similar challenges.
Additionally, the closed-ended questionnaire design employed in this study effectively aligns with the research objectives, focusing on SCCT adoption, barriers, and perceived benefits. The use of SPSS for both descriptive and inferential analysis provided robust insights into adoption trends and predictors. While the methodological approach was adequate for the scope of this research, future studies could benefit from incorporating qualitative approaches or mixed-methods designs. These approaches could offer richer, more nuanced insights and enhance the generalizability of findings across diverse contexts.
Author Contributions
E.A. designed and conducted the survey under the guidance of A.V. A.T. contributed to the analysis of collaboration within the food industry. A.B. and L.C. provided critical input on technologies for collaboration and contributed to data interpretation and discussion. E.A. and A.V. analyzed the data and collaborated on manuscript preparation, with A.T. proofreading and contributing to collaboration business-trust-models and the final conclusions. All authors have read and agreed to the published version of the manuscript.
Funding
This research received no external funding.
Institutional Review Board Statement
The study was conducted in accordance with the Declaration of Helsinki and approved by the Ethics Committee of University of Hertfordshire under protocol number: aSPECS/PGT/UH/05573(1) and, with a date of approval of 21 March 2024.
Data Availability Statement
The raw data supporting the conclusions of this article will be made available by the authors on request.
Conflicts of Interest
The authors declare no conflicts of interest.
Appendix A. Survey Questionnaire
| 1.0 Demographic Information | |||||
| 1.1 Gender | Male [ ] | Female [ ] | Other [ ] | ||
| 1.2 Age | 18–25 [ ] | 26–35 [ ] | 36–45 [ ] | 46–55 [ ] | 56+ [ ] |
| 1.3 Years of experience | Less than 5 years [ ] | 5–10 years [ ] | 11–20 years [ ] | More than 20 years [ ] | |
| 1.4 Position | Executive management | Supply chain manager | IT manager | Operations manager | Logistics manager |
| 1.5 Company’s adoption of technology | Early adopter | Average adopter | Late adopter | ||
| 1.6 Company size | Small (1–50 employees) | Medium (51–500 employees) | Large (501+ employees) | ||
| 2.0 The Current Landscape of Supply Chain Collaboration Technologies | Strongly Disagree | Disagree | Neither Disagree nor Agree | Agree | Strongly Agree |
| 2.1 My company effectively utilizes enterprise resource planning (ERP) in its supply chain. | 1 | 2 | 3 | 4 | 5 |
| 2.2 My company has effectively adopted the Internet of Things (IoT) devices in its supply chain. | 1 | 2 | 3 | 4 | 5 |
| 2.3 My company has effectively leveraged digital platforms, such as cloud-based systems, in its supply chain. | 1 | 2 | 3 | 4 | 5 |
| 2.4 My company has effectively leveraged artificial intelligence (AI) and machine learning (ML) in its supply chain. | 1 | 2 | 3 | 4 | 5 |
| 2.5 My company effectively employs blockchain for improved communication and coordination in its supply chain. | 1 | 2 | 3 | 4 | 5 |
| 3.0 Technology-Driven Efficiency | Strongly Disagree | Disagree | Neither Disagree nor Agree | Agree | Strongly Agree |
| 3.1 The automation of processes contributes to increased efficiency in collaboration among different stakeholders in my company’s supply chain. | 1 | 2 | 3 | 4 | 5 |
| 3.2 GPS and route optimization has minimized delays and disruptions thereby optimizing collaboration in my company’s supply chain. | 1 | 2 | 3 | 4 | 5 |
| 3.3 Technology-driven data analytics have improved decision-making among stakeholders for supply chain processes in my company. | 1 | 2 | 3 | 4 | 5 |
| 3.4 Automated inventory management systems have improved productivity and collaboration in my company’s supply chain. | 1 | 2 | 3 | 4 | 5 |
| 3.5 I have observed a reduction in lead times throughout my company’s supply chain owing to the automated order processing systems. | 1 | 2 | 3 | 4 | 5 |
| 3.6 The adoption of electronic data interchange (EDI) has reduced operational costs and resource wastage in supply chain activities. | 1 | 2 | 3 | 4 | 5 |
| 4.0 Technology-Driven Traceability/Transparency | Strongly Disagree | Disagree | Neither Disagree nor Agree | Agree | Strongly Agree |
| 4.1 RFID and barcode scanning have improved traceability and transparency in my company’s supply chain, improving collaboration. | 1 | 2 | 3 | 4 | 5 |
| 4.2 Blockchain has contributed to ensuring traceability and transparency in sourcing and production processes within my company’s supply chain. | 1 | 2 | 3 | 4 | 5 |
| 4.3 Real-time location systems (RTLSs) have provided real-time visibility and transparency in the movement of goods through my company’s supply chain. | 1 | 2 | 3 | 4 | 5 |
| 4.4 Sensors and IoT devices have positively influenced the quality control processes in my company’s supply chain. | 1 | 2 | 3 | 4 | 5 |
| 4.5 Supply chain management (SCM) software for end-to-end visibility and transparency has improved collaboration in the supply chain. | 1 | 2 | 3 | 4 | 5 |
| 4.6 Cloud-based platforms have enhanced collaboration and transparency in information sharing among different stakeholders in my company’s supply chain. | 1 | 2 | 3 | 4 | 5 |
| 5.0 Technology-Driven Security of Transactions | Strongly Disagree | Disagree | Neither Disagree nor Agree | Agree | Strongly Agree |
| 5.1 Secure payment gateways and encryption technologies have improved the security of financial transactions within my company’s supply chain. | 1 | 2 | 3 | 4 | 5 |
| 5.2 Cybersecurity measures have enhanced the security of transactions in my company’s supply chain. | 1 | 2 | 3 | 4 | 5 |
| 5.3 Blockchain contributes to ensuring the security and integrity of transactions within my company’s supply chain. | 1 | 2 | 3 | 4 | 5 |
| 5.4 Secure socket layer (SSL) certificates ensure the security of online transactions within my company’s supply chain. | 1 | 2 | 3 | 4 | 5 |
| 5.5 Two-factor authentication has enhanced the security of transactions and data access within my company’s supply chain. | 1 | 2 | 3 | 4 | 5 |
| 6.0 Technology-Driven Relationships/Trust | Strongly Disagree | Disagree | Neither Disagree nor Agree | Agree | Strongly Agree |
| 6.1 Customer relationship management (CRM) systems have contributed to building trust and relationships with customers within my company’s supply chain. | 1 | 2 | 3 | 4 | 5 |
| 6.2 Supplier relationship management (SRM) systems foster trust and collaboration with suppliers in my company’s supply chain. | 1 | 2 | 3 | 4 | 5 |
| 6.3 Collaborative online platforms enhance communication and trust among different stakeholders within my company’s supply chain. | 1 | 2 | 3 | 4 | 5 |
| 6.4 Enterprise social networking (ESN) platforms have helped in fostering open communication and trust within my company’s supply chain. | 1 | 2 | 3 | 4 | 5 |
| 6.5 Electronic data interchange (EDI) has improved communication and trust in the supply chain. | 1 | 2 | 3 | 4 | 5 |
| 7.0 Technology-Driven Optimized Inventory Management System | Strongly Disagree | Disagree | Neither Disagree nor Agree | Agree | Strongly Agree |
| 7.1 Radio frequency identification (RFID) in inventory management has positively impacted collaboration with suppliers in my company’s supply chain (IoT Device). | 1 | 2 | 3 | 4 | 5 |
| 7.2 Autonomous inventory management systems have contributed to optimized inventory levels and collaboration within my company’s supply chain (IoT device). | 1 | 2 | 3 | 4 | 5 |
| 7.3 Demand forecasting software has enhanced collaboration by ensuring optimal stock levels in my company’s food supply chain (ERP systems). | 1 | 2 | 3 | 4 | 5 |
| 7.4 Cloud-based inventory systems have positively impacted collaboration and real-time information sharing within my company’s supply chain (cloud-based platforms). | 1 | 2 | 3 | 4 | 5 |
| 7.5 RFID has aided in tracking inventory movement and enhanced collaboration with distributors and retailers in my company’s supply chain (IoT device). | 1 | 2 | 3 | 4 | 5 |
| 7.6 Advanced planning and scheduling (APS) systems have ensured timely and efficient inventory management collaboration within my company’s supply chain. | 1 | 2 | 3 | 4 | 5 |
| 8.0 Supply Chain Collaboration | Strongly Disagree | Disagree | Neither Disagree nor Agree | Agree | Strongly Agree |
| 8.1 My company’s current supply chain collaboration technologies contribute to seamless communication and information sharing among different stakeholders. | 1 | 2 | 3 | 4 | 5 |
| 8.2 The existing supply chain collaboration technologies in my company foster trust and collaboration among the stakeholders. | 1 | 2 | 3 | 4 | 5 |
| 8.3 The implemented technologies in my company ensure real-time visibility and transparency throughout the entire supply chain processes. | 1 | 2 | 3 | 4 | 5 |
| 8.4 The current supply chain collaboration technologies streamline decision-making processes within my company’s supply chain. | 1 | 2 | 3 | 4 | 5 |
| 8.5 The adoption of technology has positively influenced the optimization of inventory management and stock levels within my company’s supply chain. | 1 | 2 | 3 | 4 | 5 |
References
- Aamer, A.M.; Al-Awlaqi, M.A.; Affia, I.; Arumsari, S.; Mandahawi, N. The internet of things in the food supply chain: Adoption challenges. Benchmarking Int. J. 2021, 28, 2521–2541. [Google Scholar] [CrossRef]
- Abideen, A.Z.; Sundram, V.P.K.; Pyeman, J.; Othman, A.K.; Sorooshian, S. Food supply chain transformation through technology and future research directions—A systematic review. Logistics 2021, 5, 83. [Google Scholar] [CrossRef]
- Akazue, M.I.; Yoro, R.E.; Malasowe, B.O.; Nwankwo, O.; Ojugo, A.A. Improved services traceability and management of a food value chain using block-chain network: A case of Nigeria. Indones. J. Electr. Eng. Comput. Sci. 2023, 29, 1623–1633. [Google Scholar] [CrossRef]
- Dania, W.A.P.; Xing, K.; Amer, Y. Collaboration and sustainable agri-food suply chain: A literature review. MATEC Web Conf. 2016, 58, 02004. [Google Scholar] [CrossRef]
- Akazue, M. Application of Blockchain Technology Model in Food Palliative Distribution in Developing Countries. J. Sci. Ind. Res. 2023, 7, 81–90. [Google Scholar]
- WEF. BRIEFING PAPER AUGUST 2021, WEF, Centre for the Fourth Industrial Revolution Japan. 2021. Available online: https://www3.weforum.org/docs/WEF_DCPI_Governance_Structure_Towards_Data_Exchanges_2021.pdf (accessed on 23 November 2024).
- WEF. AI for Agriculture Innovation (AI4AI) [Internet]. 2024. Available online: https://initiatives.weforum.org/ai4ai/home (accessed on 23 November 2024).
- Choi, S.; Moses, W.S.; Thompson, N. The Quantum Tortoise and the Classical Hare: A simple framework for understanding which problems quantum computing will accelerate (and which it will not). arXiv 2023, arXiv:231015505. [Google Scholar]
- Sun, S.; Michiels, P.; Macharis, C.; Cant, A.; Van Bever, D.; Mommens, K. Unlocking the Potential of the Physical Internet: A Trust-enabling Decentralized Process Sharing Connector. In Proceedings of the IPIC 2024 Conference Papers and Posters Contributions Proceedings, Savannah, GA, USA, 29–31 May 2024. [Google Scholar]
- Ballot, E.; Montreuil, B.; Zacharia, Z.G. Physical Internet: First results and next challenges. J. Bus. Logist. 2021, 42, 101–107. [Google Scholar] [CrossRef]
- Vargas, A.; Fuster, C.; Corne, D. Towards sustainable collaborative logistics using specialist planning algorithms and a gain-Sharing business model: A UK case study. Sustainability 2020, 12, 6627. [Google Scholar] [CrossRef]
- Bhatia, S.; Albarrak, A.S. A Blockchain-Driven Food Supply Chain Management Using QR Code and XAI-Faster RCNN Architecture. Sustainability 2023, 15, 2579. [Google Scholar] [CrossRef]
- Peng, X.; Zhang, X.; Wang, X.; Li, H.; Xu, J.; Zhao, Z. Multi-Chain Collaboration-Based Information Management and Control for the Rice Supply Chain. Agriculture 2022, 12, 689. [Google Scholar] [CrossRef]
- Zhang, X.; Ren, Y.; Xu, J.; Chi, C. Research and Application Framework for Trusted Circulation of Food Industry Data Based on Blockchain and Federated Learning. In Proceedings of the 2024 IEEE International Conference on Blockchain (Blockchain), Copenhagen, Denmark, 19–22 August 2024; pp. 530–535. [Google Scholar]
- Shiraishi, C.S.; Roriz, C.L.; Carocho, M.; Prieto, M.A.; Abreu, R.M.; Barros, L.; Heleno, S.A. Blockchain revolution in food supply chains: A positive impact on global food loss and waste. Food Chem. 2024, 467, 142331. [Google Scholar] [CrossRef]
- Bagheri, R.; Zomorodi, P.; Rezaeian, A. Identifying and ranking key technological capabilities in supply chain sustainability using ISM approach: Case of food industry in Iran. Environ. Dev. Sustain. 2023, 26, 1–38. [Google Scholar] [CrossRef]
- Kumar, A.; Liu, R.; Shan, Z. Is Blockchain a Silver Bullet for Supply Chain Management? Technical Challenges and Research Opportunities. Decis. Sci. 2019, 51, 8–37. [Google Scholar] [CrossRef]
- Fadlillah, M.S.; Pramundito, R.J. Impact of Digital Supply Chain in Agriculture: A Systematic Literature Review. SISFO 2024, 11, 36–52. [Google Scholar]
- Strous, L.; Cerf Vinton, G. Internet of Things—Information Processing is an Increasingly Connected World. In Cyber Resilience of Systems and Networks; Springer Nature: Poznan, Poland, 2018. [Google Scholar]
- Ben-Daya, M.; Hassini, E.; Bahroun, Z.; Banimfreg, B.H. The role of internet of things in food supply chain quality management: A review. Qual. Manag. J. 2020, 28, 17–40. [Google Scholar] [CrossRef]
- Annosi, M.C.; Brunetta, F.; Bimbo, F.; Kostoula, M. Digitalization within food supply chains to prevent food waste. Drivers, barriers and collaboration practices. Ind. Mark. Manag. 2021, 93, 208–220. [Google Scholar] [CrossRef]
- Ben-Daya, M.; Hassini, E.; Bahroun, Z. Internet of Things and supply chain management: A literature review. Int. J. Prod. Res. 2019, 57, 4719–4742. [Google Scholar] [CrossRef]
- Kochan, C.G.; Nowicki, D.; Glassburner, A. Understanding the influence of cloud-based information and communication technology on supply chain resilience. Benchmarking Int. J. 2024. [Google Scholar] [CrossRef]
- Lee, I.; Lee, K. The Internet of Things (IoT): Applications, investments, and challenges for enterprises. Bus Horiz. 2015, 58, 431–440. [Google Scholar] [CrossRef]
- Rahul, K.; Banyal, R.K.; Sati, H. ERP Module Functionalities for the Food Supply Chain Industries. In Lecture Notes in Networks and Systems; Springer: Singapore, 2022. [Google Scholar]
- Boza, A.; Cuenca, L.; Poler, R.; Michaelides, Z. The interoperability force in the ERP field. Enterp. Inf. Syst. 2013, 9, 257–278. [Google Scholar] [CrossRef]
- Panigrahi, R.R.; Singh, N.; Muduli, K. Digital technologies and food supply chain: A scoping view from 2010 to 2024. Int. J. Ind. Eng. Oper. Manag. 2024. ahead of print. [Google Scholar] [CrossRef]
- Lezoche, M.; Hernandez, J.E.; Díaz, M.d.M.E.A.; Panetto, H.; Kacprzyk, J. Agri-food 4.0: A survey of the supply chains and technologies for the future agriculture. Comput. Ind. 2020, 117, 103187. [Google Scholar] [CrossRef]
- Dong, Y.; Ahmad, S.F.; Irshad, M.; Al-Razgan, M.; Ali, Y.A.; Awwad, E.M. The Digitalization Paradigm: Impacts on Agri-Food Supply Chain Profitability and Sustainability. Sustainability 2023, 15, 15627. [Google Scholar] [CrossRef]
- Zhang, Z.; Song, C.; Zhang, J.; Chen, Z.; Liu, M.; Aziz, F.; Kurniawan, T.A.; Yap, P.-S. Digitalization and innovation in green ports: A review of current issues, contributions and the way forward in promoting sustainable ports and maritime logistics. Sci. Total. Environ. 2023, 912, 169075. [Google Scholar] [CrossRef]
- Dinesh Kumar, K.; Manoj Kumar, D.S.; Anandh, R. Blockchain technology in food supply chain security. Int. J. Sci. Technol. Res. 2020, 9, 3446–3450. [Google Scholar]
- Rejeb, A.; Simske, S.; Rejeb, K.; Treiblmaier, H.; Zailani, S. Internet of Things research in supply chain management and logistics: A bibliometric analysis. Internet Things 2020, 12, 100318. [Google Scholar] [CrossRef]
- Wang, S.; Ghadge, A.; Aktas, E. Digital Transformation in Food Supply Chains: A Review and Implementation Roadmap. In Proceedings of the 30th EurOMA Conference, Leuven, Belgium, 3–5 July 2023; Available online: https://dspace.lib.cranfield.ac.uk/items/6167a309-a095-4dea-a798-55b1d1fb692e (accessed on 16 November 2024).
- Nugroho, G.; Tedjakusuma, F.; Lo, D.; Romulo, A.; Pamungkas, D.H.; Kinardi, S.A. Review of The Application of Digital Transformation in Food Industry. J. Curr. Sci. Technol. 2023, 13, 774–790. [Google Scholar] [CrossRef]
- Kopishynska, O.; Utkin, Y.; Sliusar, I.; Muravlov, V.; Makhmudov, K.; Chip, L. Application of Modern Enterprise Re-source Planning Systems for Agri-Food Supply Chains as a Strategy for Reaching the Level of Industry 4.0 for Non-Manufacturing Organizations. Eng. Proc. 2023, 40, 15. [Google Scholar] [CrossRef]
- Coppolino, L.; Romano, L.; Scaletti, A.; Sgaglione, L. Fuzzy set theory-based comparative evaluation of cloud service offerings: An agro-food supply chain case study. Technol. Anal. Strat. Manag. 2020, 33, 900–913. [Google Scholar] [CrossRef]
- Gammelgaard, B.; Nowicka, K. Next generation supply chain management: The impact of cloud computing. J. Enterp. Inf. Manag. 2023, 37, 1140–1160. [Google Scholar] [CrossRef]
- Movahed, A.B.; Aliahmadi, A.; Parsanejad, M.; Nozari, H. A systematic review of collaboration in supply chain 4.0 with meta-synthesis method. Supply Chain Anal. 2023, 4, 100052. [Google Scholar] [CrossRef]
- Santoso, I.; Purnomo, M.; Sulianto, A.A.; Choirun, A. Machine learning application for sustainable agri-food supply chain performance: A review. IOP Conf. Series Earth Environ. Sci. 2021, 924, 012059. [Google Scholar] [CrossRef]
- Oyedijo, A.; Adams, K.; Koukpaki, S. Supply Chain Management Systems in Africa: Insights from Nigeria. In Business in Africa in the Era of Digital Technology: Essays in Honour of Professor William Darley; Springer: Berlin/Heidelberg, Germany, 2021. [Google Scholar]
- Micheal, N. The Influence of Information Technology Capability on Supply Chain Integration and Marketing Performance of Downstream Petroleum Sector in Nigeria. Gusau Int. J. Manag. Soc. Sci. 2021, 4, 13. [Google Scholar]
- Cuenca, L.; Boza, A.; Ortiz, A. An enterprise engineering approach for the alignment of business and information technology strategy. Int. J. Comput. Integr. Manuf. 2011, 24, 974–992. [Google Scholar] [CrossRef]
- Taneja, A.; Nair, G.; Joshi, M.; Sharma, S.; Sharma, S.; Jambrak, A.R.; Roselló-Soto, E.; Barba, F.J.; Castagnini, J.M.; Leksawasdi, N.; et al. Artificial Intelligence: Implications for the Agri-Food Sector. Agronomy 2023, 13, 1397. [Google Scholar] [CrossRef]
- Camaréna, S. Artificial Intelligence (AI) for Sustainable Institutional Food Systems: Implementation of AI Tools for School Nutrition Program Management in the United States of America. Front. Sustain. Food Syst. 2022, 6, 743810. [Google Scholar] [CrossRef]
- Kumari, S.; Venkatesh, V.G.; Tan, F.T.C.; Bharathi, S.V.; Ramasubramanian, M.; Shi, Y. Application of machine learning and artificial intelligence on agriculture supply chain: A comprehensive review and future research directions. Ann. Oper. Res. 2023, 1–45. [Google Scholar] [CrossRef]
- Zorić, N.; Marić, R.; Đurković-Marić, T.; Vukmirović, G. The Importance of Digitalization for the Sustainability of the Food Supply Chain. Sustainability 2023, 15, 3462. [Google Scholar] [CrossRef]
- Oriekhoe, O.I.; Ashiwaju, B.I.; Ihemereze, K.C.; Ikwue, U.; Udeh, C.A. Review of technological advancement in food supply chain management: Comparison between USA and Africa. World J. Adv. Res. Rev. 2023, 20, 1681–1693. [Google Scholar] [CrossRef]
- Monteiro, J.; Barata, J. Artificial intelligence in extended agri-food supply chain: A short review based on bibliometric analysis. Procedia Comput. Sci. 2021, 192, 3020–3029. [Google Scholar] [CrossRef]
- Kumar, R.; Kumar, D. Blockchain-based smart dairy supply chain: Catching the momentum for digital transformation. J. Agribus. Dev. Emerg. Econ. 2023. ahead of print. [Google Scholar] [CrossRef]
- Zhong, R.; Xu, X.; Wang, L. Food supply chain management: Systems, implementations, and future research. Ind. Manag. Data Syst. 2017, 117, 2085–2114. [Google Scholar] [CrossRef]
- Akella, G.K.; Wibowo, S.; Grandhi, S.; Mubarak, S. A Systematic Review of Blockchain Technology Adoption Barriers and Enablers for Smart and Sustainable Agriculture. Big Data Cogn. Comput. 2023, 7, 86. [Google Scholar] [CrossRef]
- Palazzo, M.; Vollero, A. A systematic literature review of food sustainable supply chain management (FSSCM): Building blocks and research trends. TQM J. 2021, 34, 54–72. [Google Scholar] [CrossRef]
- Jang, H.-W.; Jung, H.S.; Cho, M. Blockchain adoption in the food and beverage industry from a behavioral reasoning perspective: Moderating roles of supply chain partnerships. J. Hosp. Tour. Technol. 2023, 15, 138–155. [Google Scholar] [CrossRef]
- Alqudhaibi, A.; Krishna, A.; Jagtap, S.; Williams, N.; Afy-Shararah, M.; Salonitis, K. Cybersecurity 4.0: Safeguarding trust and production in the digital food industry era. Discov. Food 2024, 4, 1–18. [Google Scholar] [CrossRef]
- Bamigboye, F.O.; Ademola, E.O. Internet of Things: The Present Status, Future Impacts and Challenges in Nigerian Agriculture. In IFIP Advances in Information and Communication Technology; Springer International Publishing: Cham, Switzerland, 2019. [Google Scholar]
- Olanrewaju, K.O.; Akintunde, O.K.; Popoola, M.A.; Busari, A.O.; Omotosho, M.O. Towards the digitalization of poultry industry in Nigeria: An investigation of farmers’ knowledge and practices. Afr. J. Sci. Technol. Innov. Dev. 2023, 15, 562–567. [Google Scholar] [CrossRef]
- Arulogun, O.; Olaniyi, O.; Oke, O.; Fenwa, D. Development of Mobile Intelligent Poultry Feed Dispensing System. J. Eng. Appl. Sci. 2010, 5, 229–233. [Google Scholar] [CrossRef]
- Buhari, B.A.; Muhammad, B.S.; Bodinga, B.A.; Sifawa, M.D. Adoption of Cloud Computing by IT Based Small And Medium Scale Enterprises In Northwestern Nigeria. Int. J. Adv. Netw. Appl. 2022, 13, 5119–5127. [Google Scholar] [CrossRef]
- Alshawabkeh, R.O.; Abu Rumman, A.R.; Al-Abbadi, L.H. The nexus between digital collaboration, analytics capability and supply chain resilience of the food processing industry in Jordan. Cogent Bus. Manag. 2024, 11, 2296608. [Google Scholar] [CrossRef]
- Tarigan, Z.J.H.; Siagian, H.; Jie, F. Impact of enhanced enterprise resource planning (ERP) on firm performance through green supply chain management. Sustainability 2021, 13, 4358. [Google Scholar] [CrossRef]
- Ihunwo, E.C.; Opara, B.C. Supply chain collaboration and operational effectiveness in food and beverages firms in Nigeria. Adv. J. Account. Manag. Mark. Res. 2021, 8, 2. [Google Scholar]
- Dora, M.; Kumar, A.; Mangla, S.K.; Pant, A.; Kamal, M.M. Critical success factors influencing artificial intelligence adoption in food supply chains. Int. J. Prod. Res. 2021, 60, 4621–4640. [Google Scholar] [CrossRef]
- Khan, R. Artificial Intelligence and Machine Learning in Food Industries: A Study. J. Food Chem. Nanotechnol. 2021, 7, 60–67. [Google Scholar]
- Kipkorir-Songol, M.; Mzee-Awuor, F.; Maake, B. Adoption of Artificial Intelligence in Agriculture in the Developing Nations: A Review. J. Lang. Technol. Entrep. Afr. 2021, 12, 208–229. [Google Scholar]
- Echegaray, N.; Hassoun, A.; Jagtap, S.; Tetteh-Caesar, M.; Kumar, M.; Tomasevic, I.; Goksen, G.; Lorenzo, J.M. Meat 4.0: Principles and Applications of Industry 4.0 Technologies in the Meat Industry. Appl. Sci. 2022, 12, 6986. [Google Scholar] [CrossRef]
- Ogunmola, O.S.; Arogundade, K.K. Effects of Supply Chain Design and Collaboration on Customers’ Satisfaction of Instant Noodles in Ekiti State, Nigeria. Logistics 2018, 3, 2. [Google Scholar] [CrossRef]
- Flint, D.; Gammelgaard, B.; Golicic, S.L.; Davis, D.F. Implementing mixed methods research in supply chain management. Int. J. Phys. Distrib. Logist. Manag. 2012, 42, 726–741. [Google Scholar] [CrossRef]
- Page, M.J.; McKenzie, J.E.; Bossuyt, P.M.; Boutron, I.; Hoffmann, T.C.; Mulrow, C.D.; Shamseer, L.; Tetzlaff, J.M.; Akl, E.A.; Brennan, S.E.; et al. The PRISMA 2020 statement: An updated guideline for reporting systematic reviews. BMJ 2021, 372, n71. [Google Scholar] [CrossRef] [PubMed]
- Yepes-Nuñez, J.J.; Urrútia, G.; Romero-García, M.; Alonso-Fernández, S. The PRISMA 2020 statement: An updated guideline for reporting systematic reviews Declaración PRISMA 2020: Una guía actualizada para la publicación de revisiones sistemáticas. Rev. Esp. Cardiol. 2021, 74, 790–799. [Google Scholar] [CrossRef]
- Cronk, B.C. How to Use SPSS: A Step-By-Step Guide to Analysis and Interpretation, 11th ed.; Routledge: New York, NY, USA, 2019. [Google Scholar]
- Pallant, J. SPSS Survival Manual: A Step by Step Guide to Data Analysis using IBM SPSS; Routledge: London, UK, 2020; p. 378. [Google Scholar] [CrossRef]
- George, D.; Mallery, P. IBM SPSS Statistics 29 Step by Step; Routledge: London, UK, 2024; p. 440. [Google Scholar] [CrossRef]
- Reja, U.; Manfreda, K.L.; Hlebec, V.; Vehovar, V. Open-ended vs. Close-ended Questions in Web Questionnaires. Dev. Appl. Stat. 2003, 19, 159–177. [Google Scholar]
- Etikan, I.; Musa, S.A.; Alkassim, R.S. Comparison of Convenience Sampling and Purposive Sampling. Am. J. Theor. Appl. Stat. 2016, 5, 1–4. [Google Scholar] [CrossRef]
- Nanjundeswaraswamy, T.S.; Divakar, S. Determination of sample size and sampling methods in applied research. Proc. Eng. Sci. 2021, 3, 25–32. [Google Scholar] [CrossRef]
- Andy, F. Discovering Statistics Using IBM SPSS Statistics. Angew. Chem. Int. Ed. 2015, 6, 951–952. [Google Scholar]
- Field, A. Discovering Statistics Using IBM SPSS Statistics; Statistics: Singapore, 2013; Volume 58. [Google Scholar]
- Tabachnick, B.G.; Fidell, L.S.; Ullman, J.B. Using Multivariate Statistics, 7th ed.; Pearson: Boston, MA, USA, 2018. [Google Scholar]
- Laerd Statistics. Spearman’s Rank-Order Correlation. Available online: https://statistics.laerd.com/statistical-guides/spearmans-rank-order-correlation-statistical-guide.php (accessed on 30 December 2024).
- Rebekic, A.; Loncaric, Z.; Petrovic, S.; Maric, S. Pearson’s or spearman’s correlation coefficient–which one to use? Pearsonov ili Spearmanov koeficijent korelacije–koji koristiti? Poljoprivreda 2015, 21, 47–54. [Google Scholar] [CrossRef]
- Pirie, W. Spearman Rank Correlation: Introduction. In Statistics Reference Online; Wiley: Hoboken, NJ, USA, 2014. [Google Scholar] [CrossRef]
- Schober, P.; Boer, C.; Schwarte, L.A. Correlation Coefficients: Appropriate Use and Interpretation. Anesth. Analg. 2018, 126, 1763–1768. [Google Scholar] [CrossRef] [PubMed]
- Laerd Statistics. Spearman’s Rank-Order Correlation using SPSS Statistics. Available online: https://statistics.laerd.com/spss-tutorials/spearmans-rank-order-correlation-using-spss-statistics.php (accessed on 30 December 2024).
- Puth, M.T.; Neuhäuser, M.; Ruxton, G.D. Effective use of Spearman’s and Kendall’s correlation coefficients for association between two measured traits. Anim. Behav. 2015, 102, 77–84. [Google Scholar] [CrossRef]
- de Winter, J.C.F.; Gosling, S.D.; Potter, J. Comparing the Pearson and Spearman correlation coefficients across distributions and sample sizes: A tutorial using simulations and empirical data. Psychol. Methods 2016, 21, 273–290. [Google Scholar] [CrossRef]
- Akinbamini, E.O. Critical Review of Supply Chain Collaboration Technologies in The Food Industry. Master’s Thesis, University of Hertfordshire, Hatfield, UK, 2024. [Google Scholar]
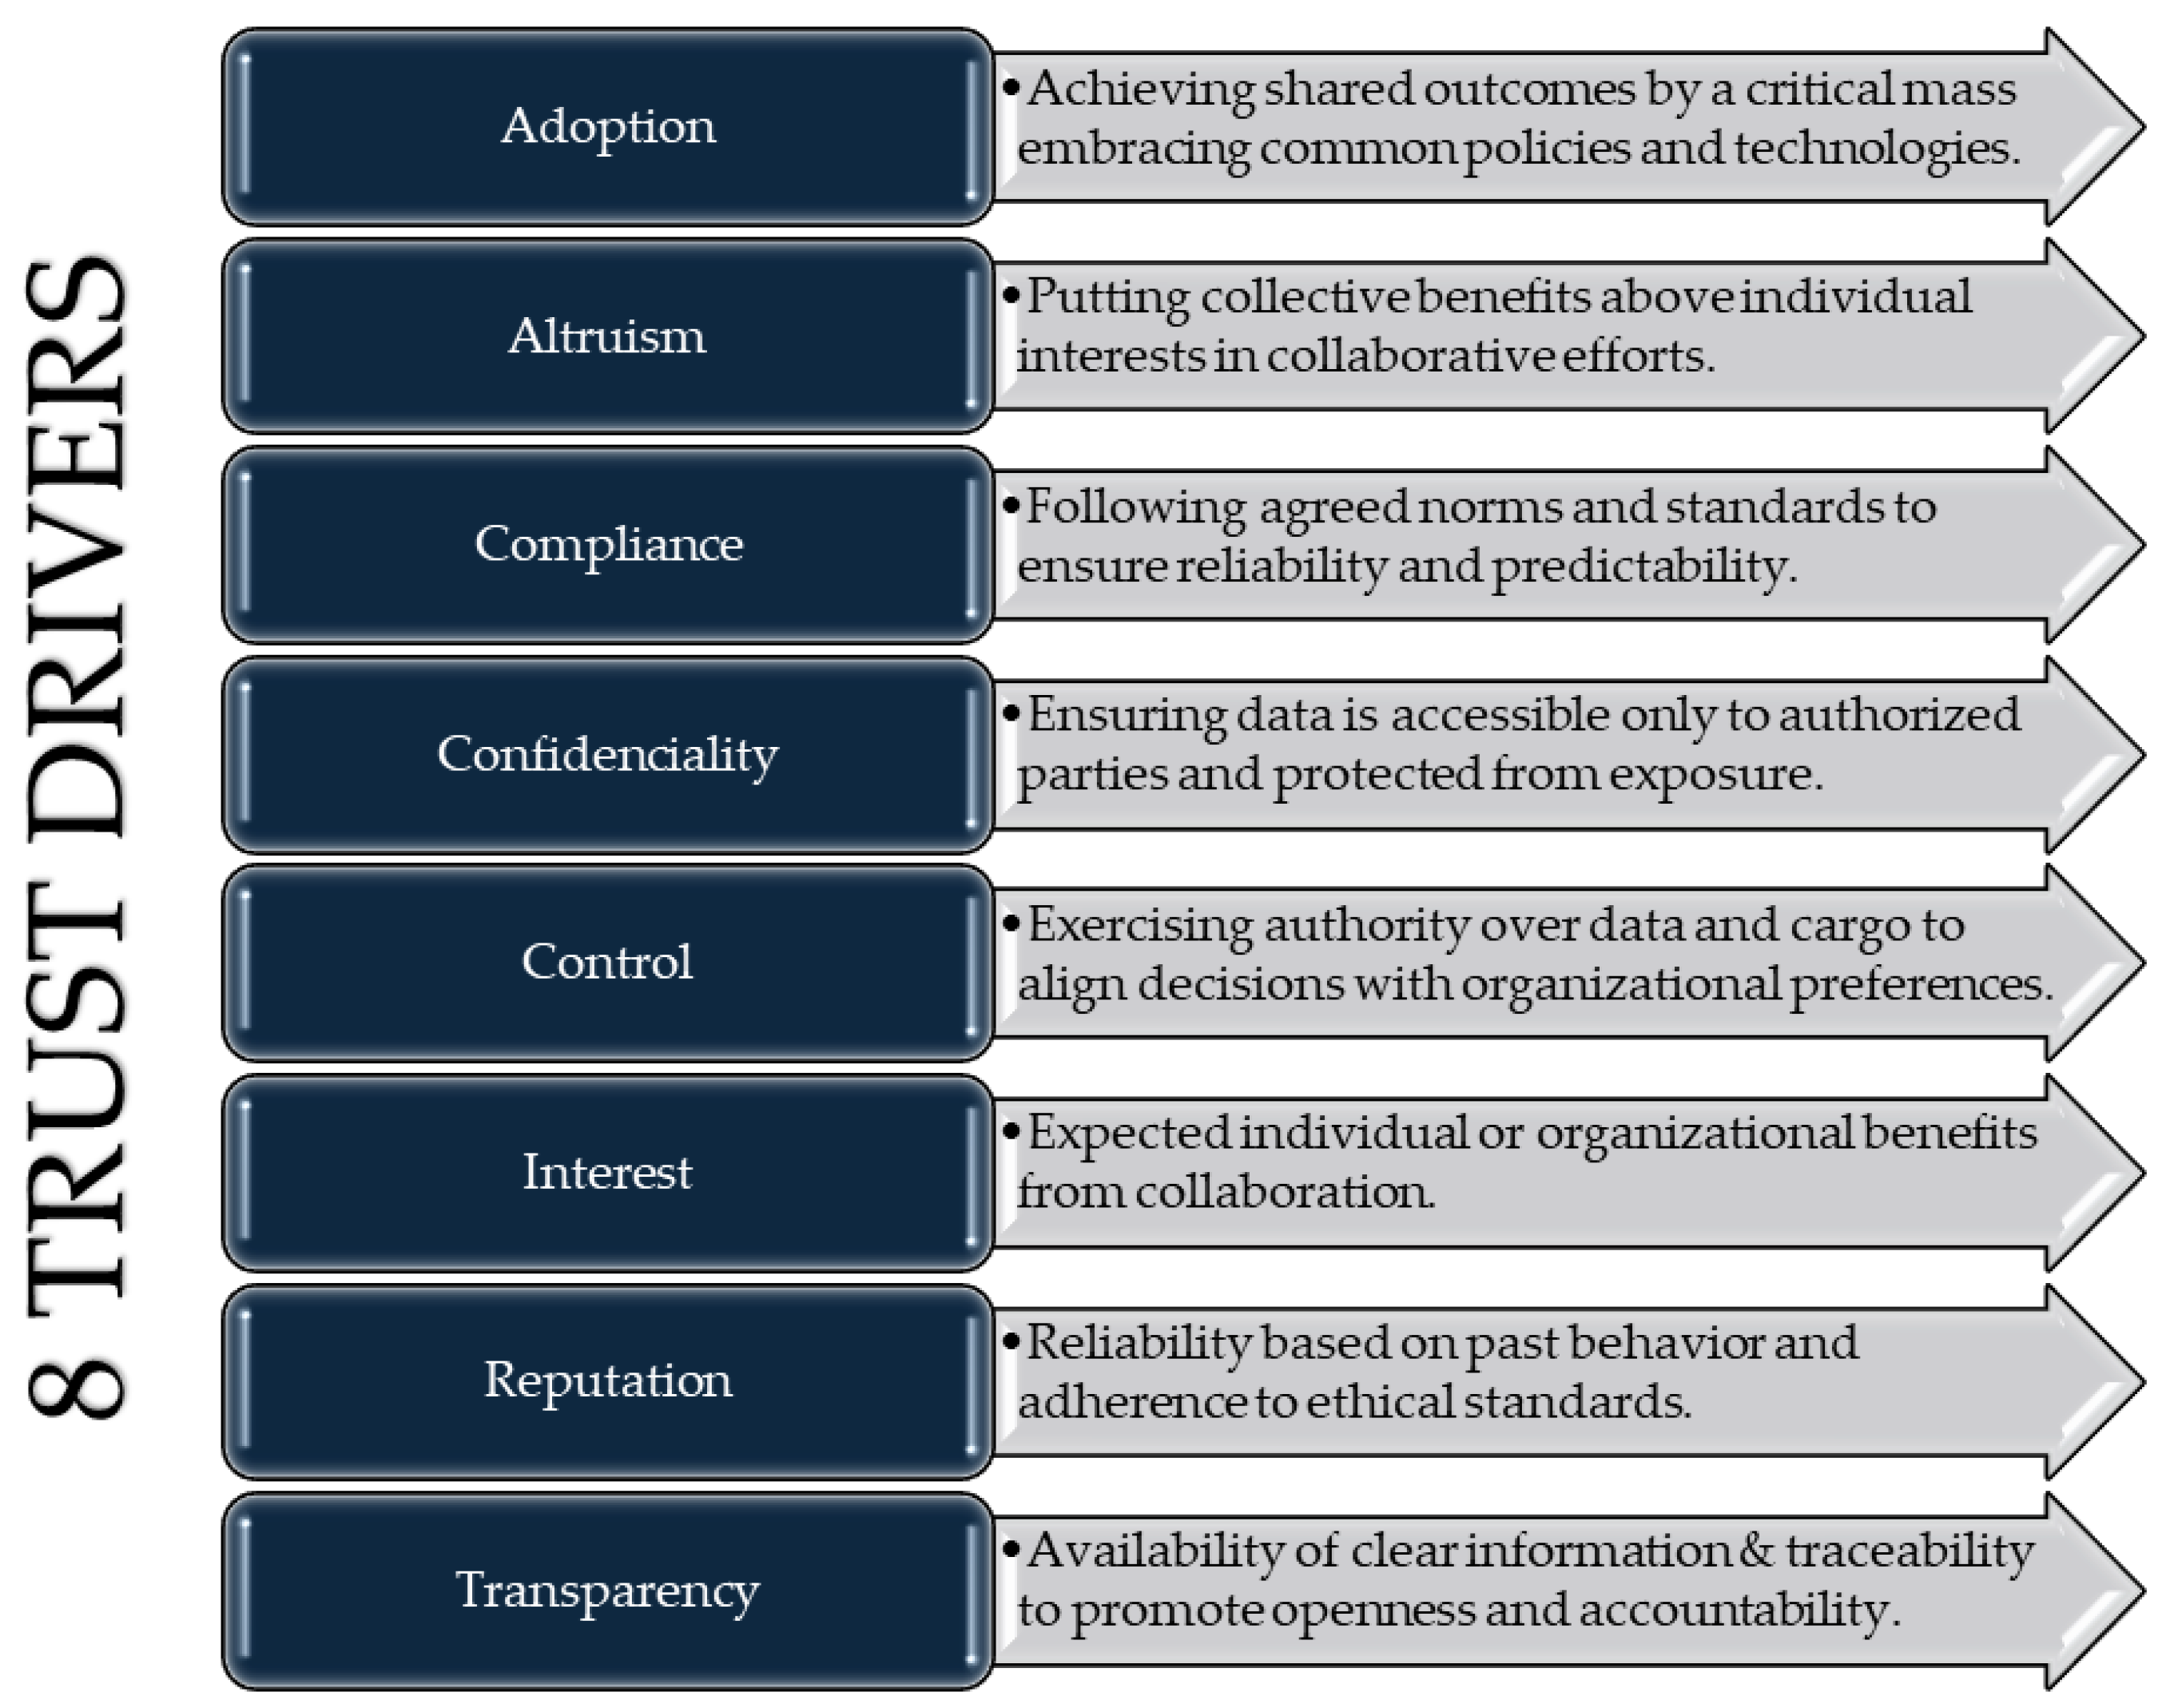
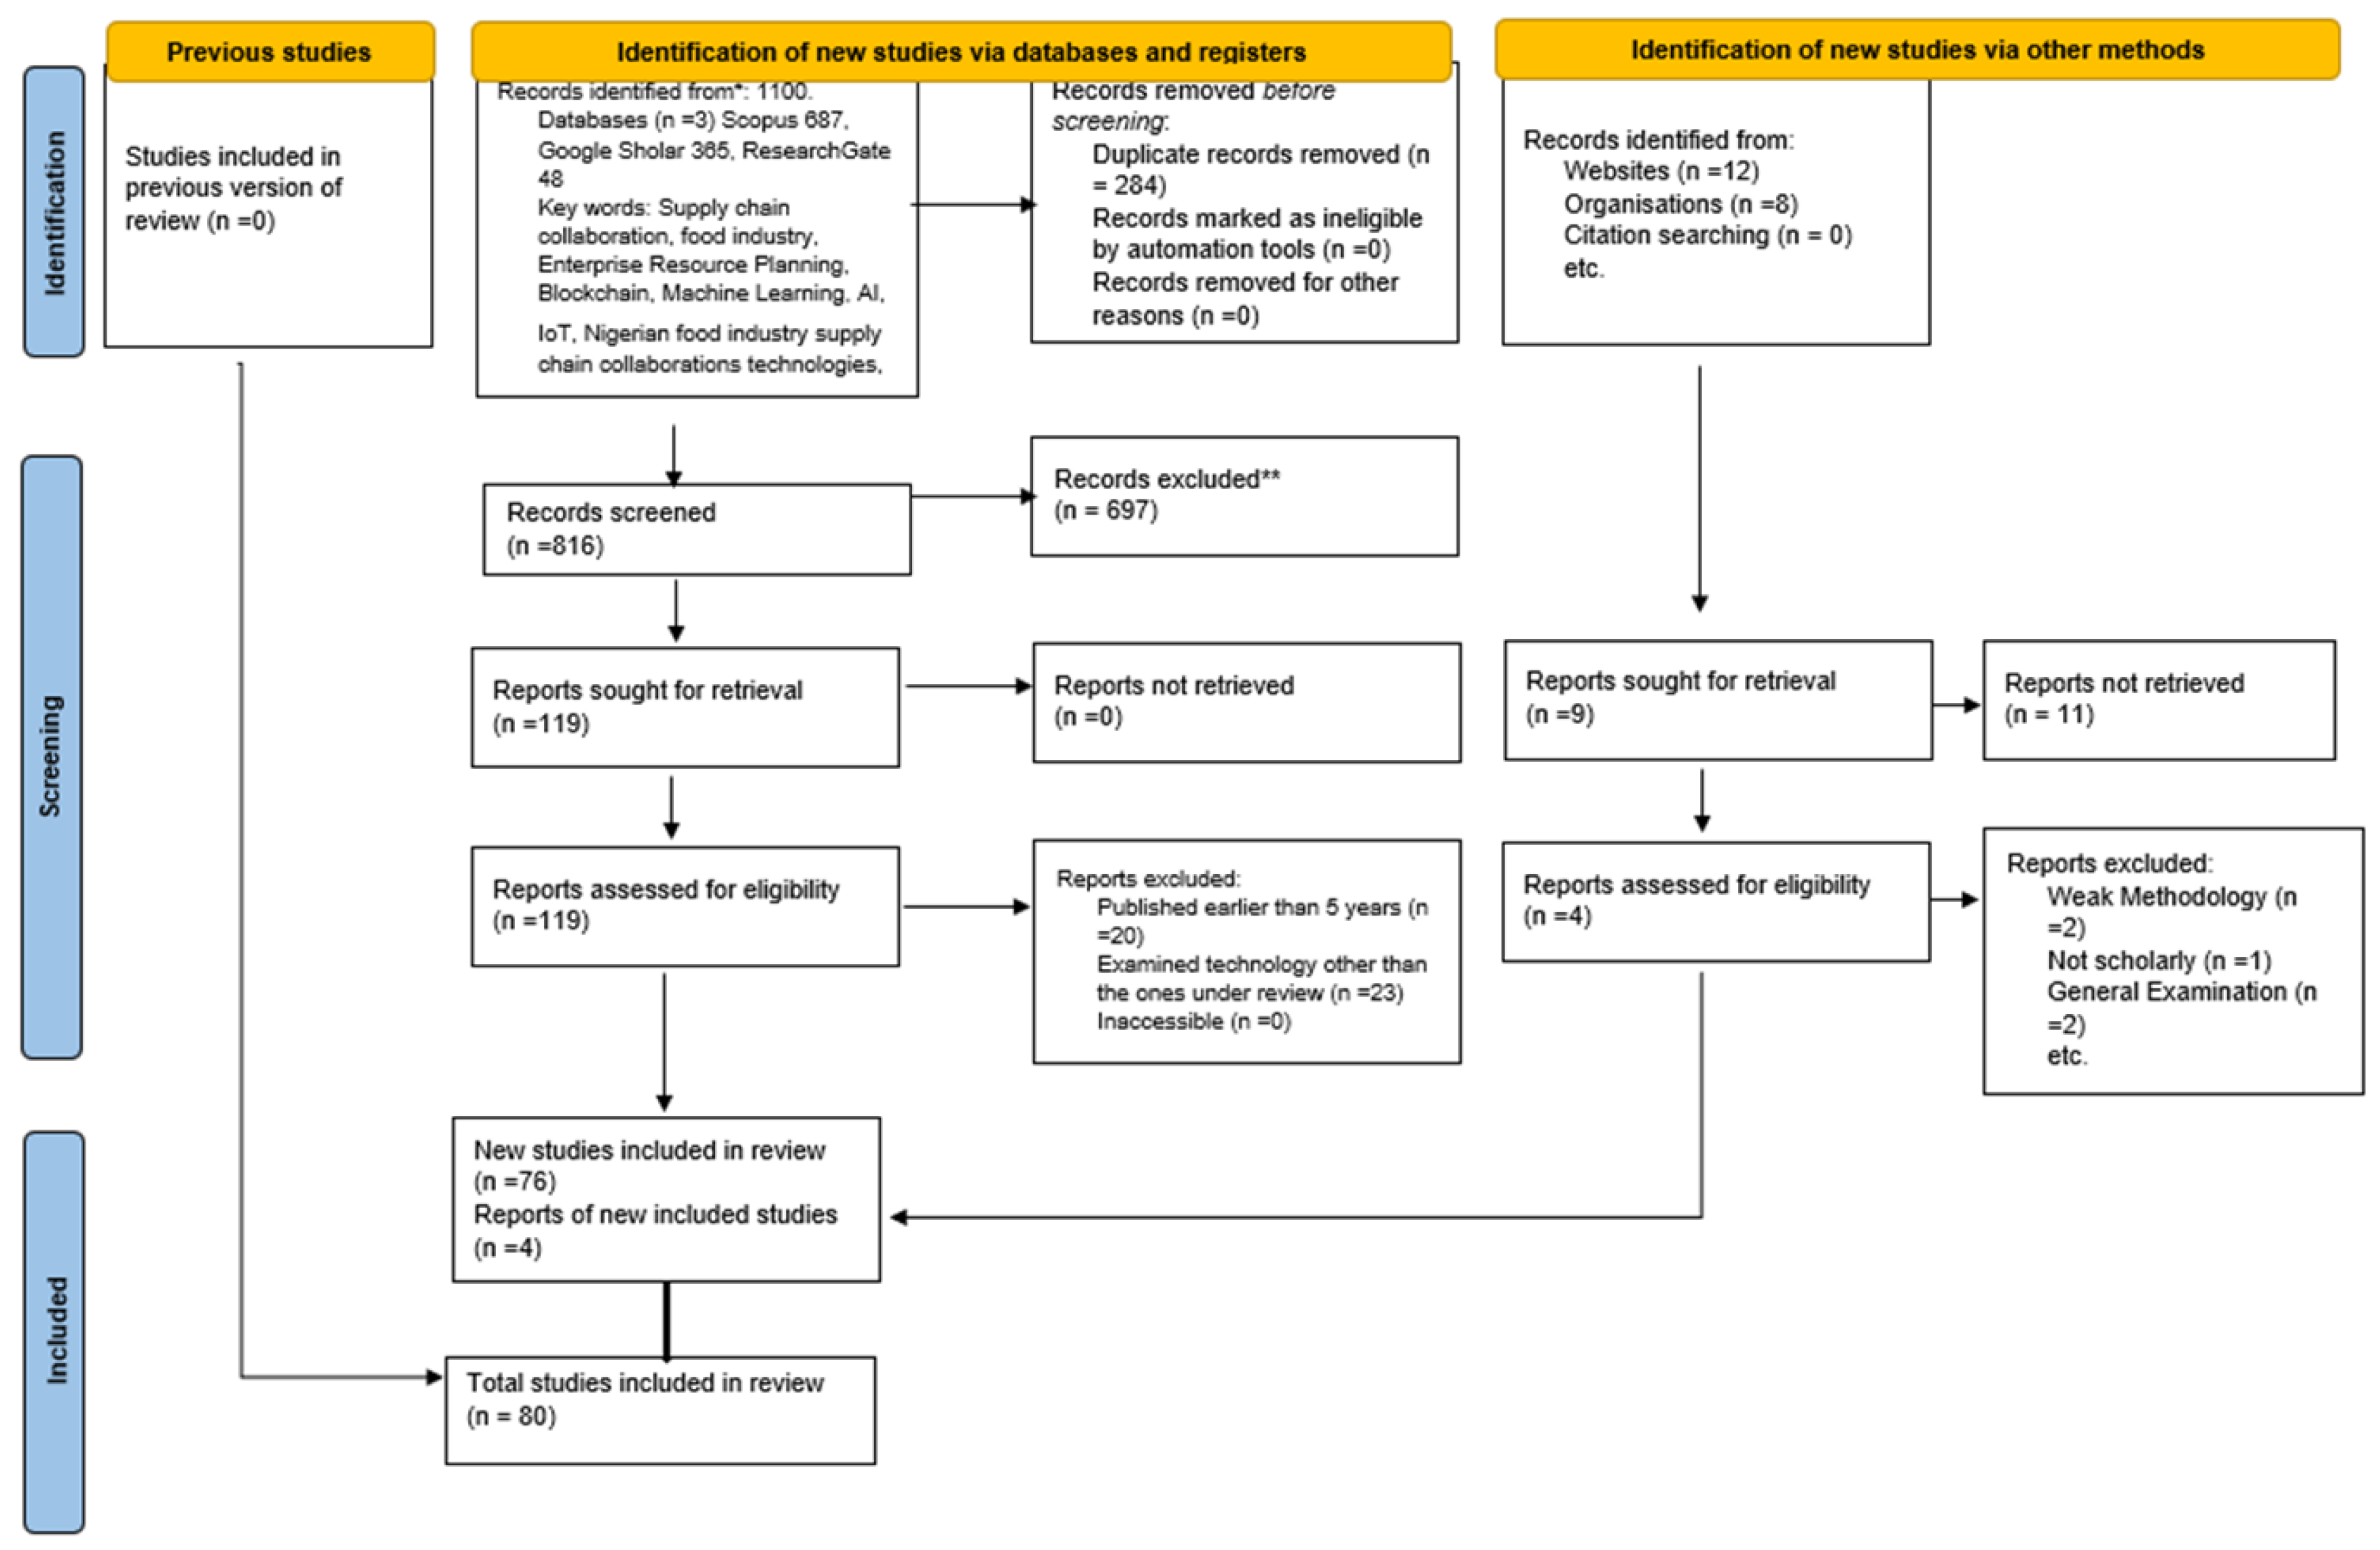

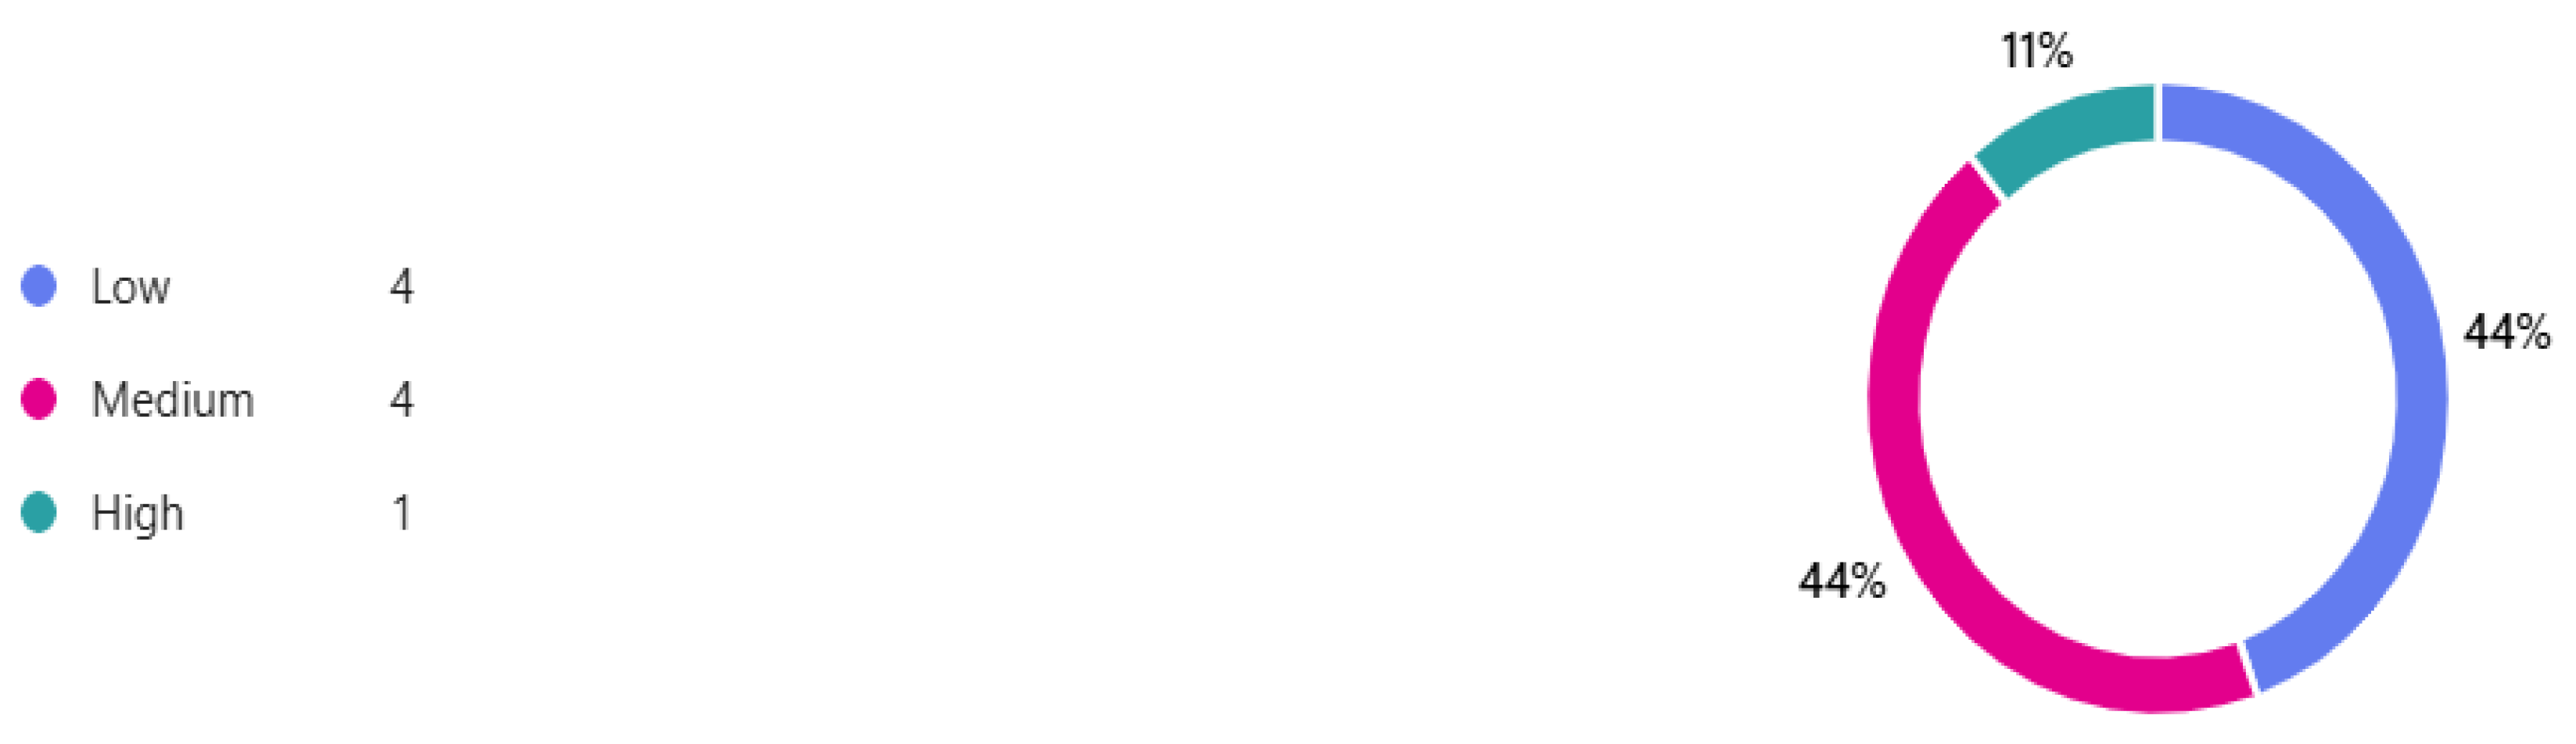
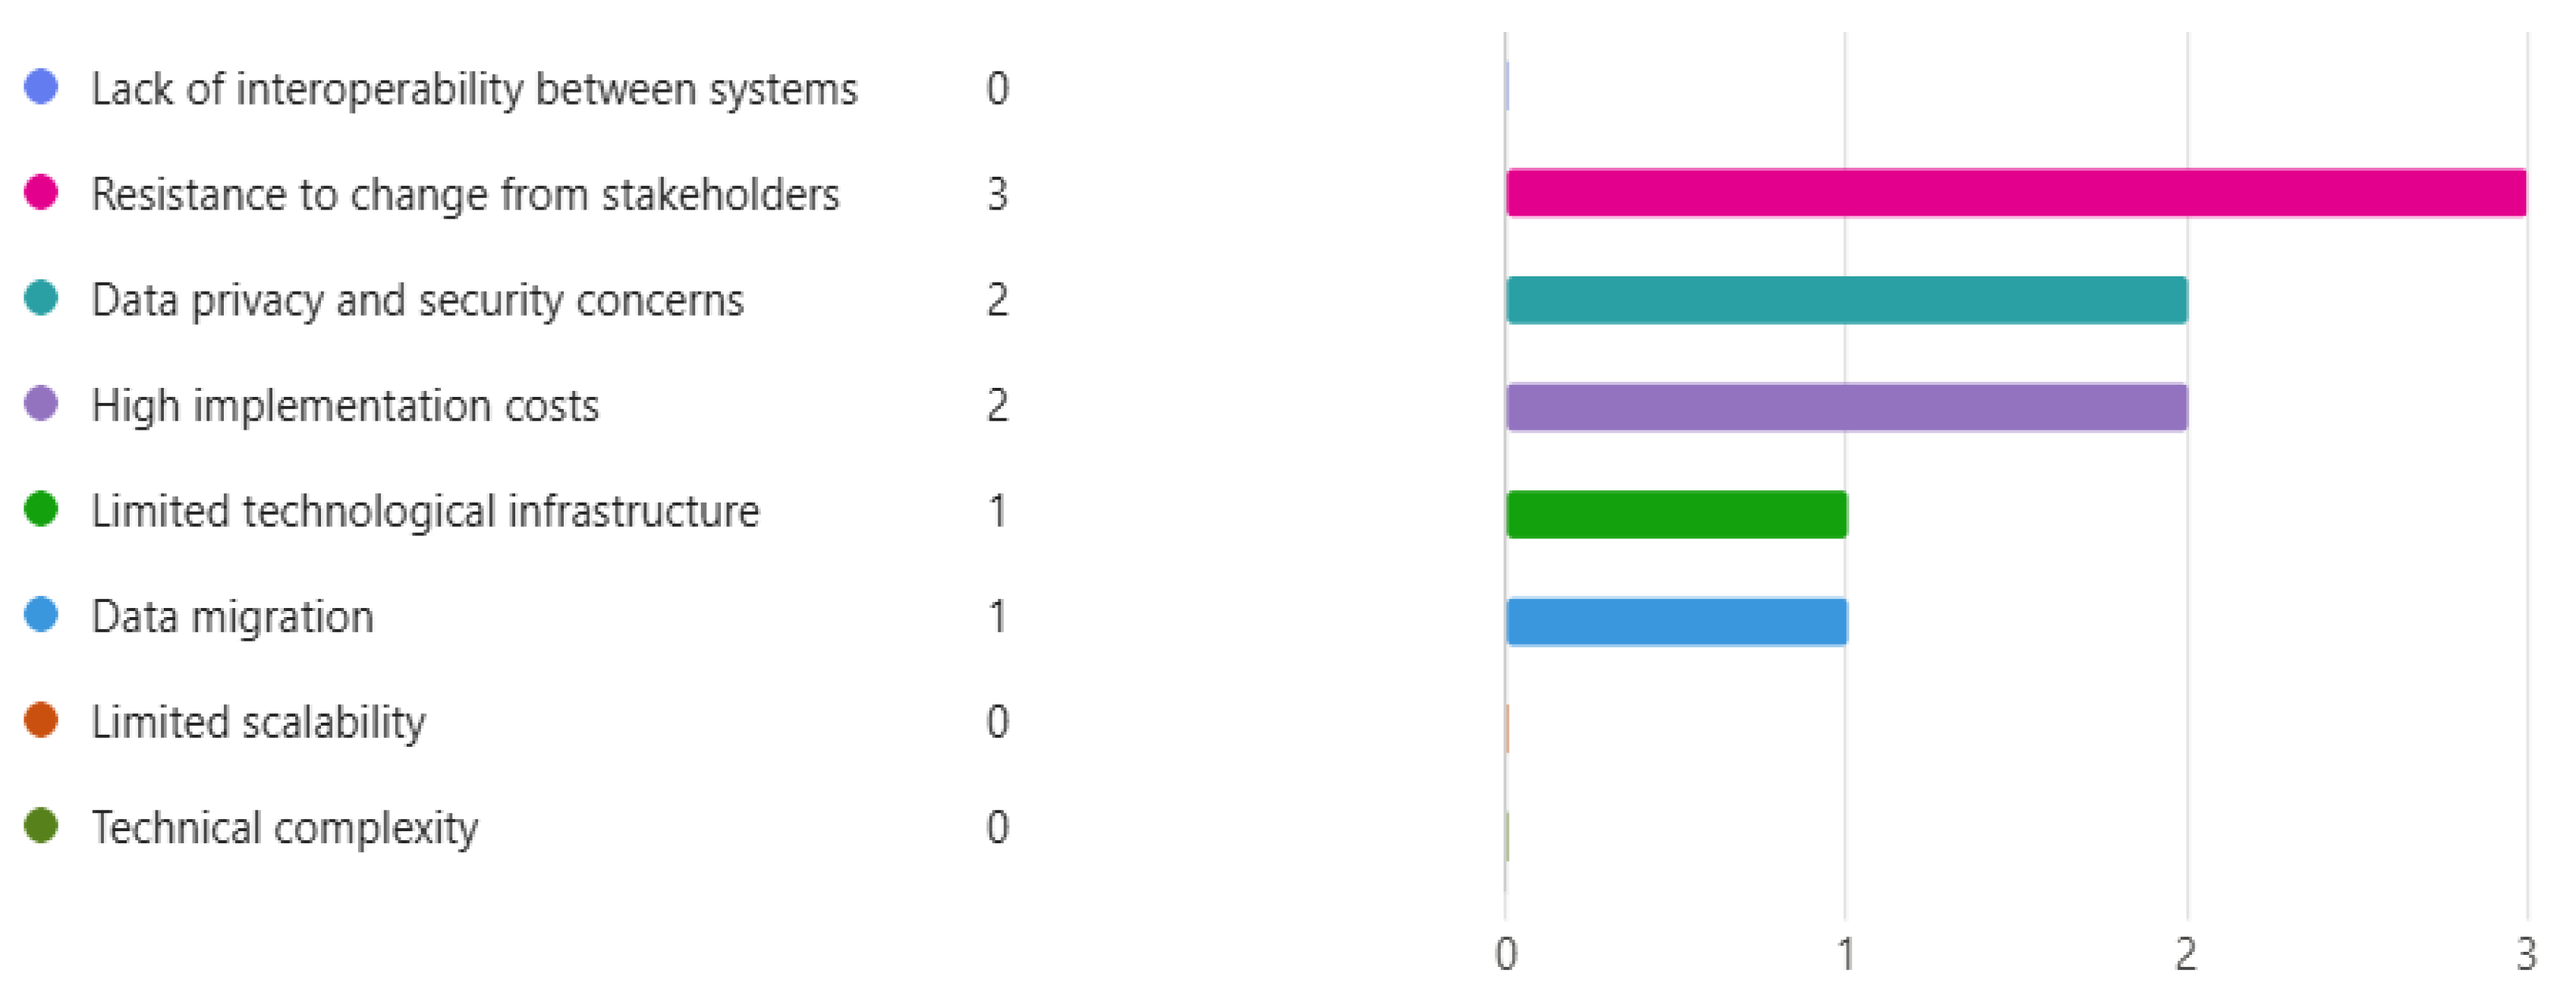
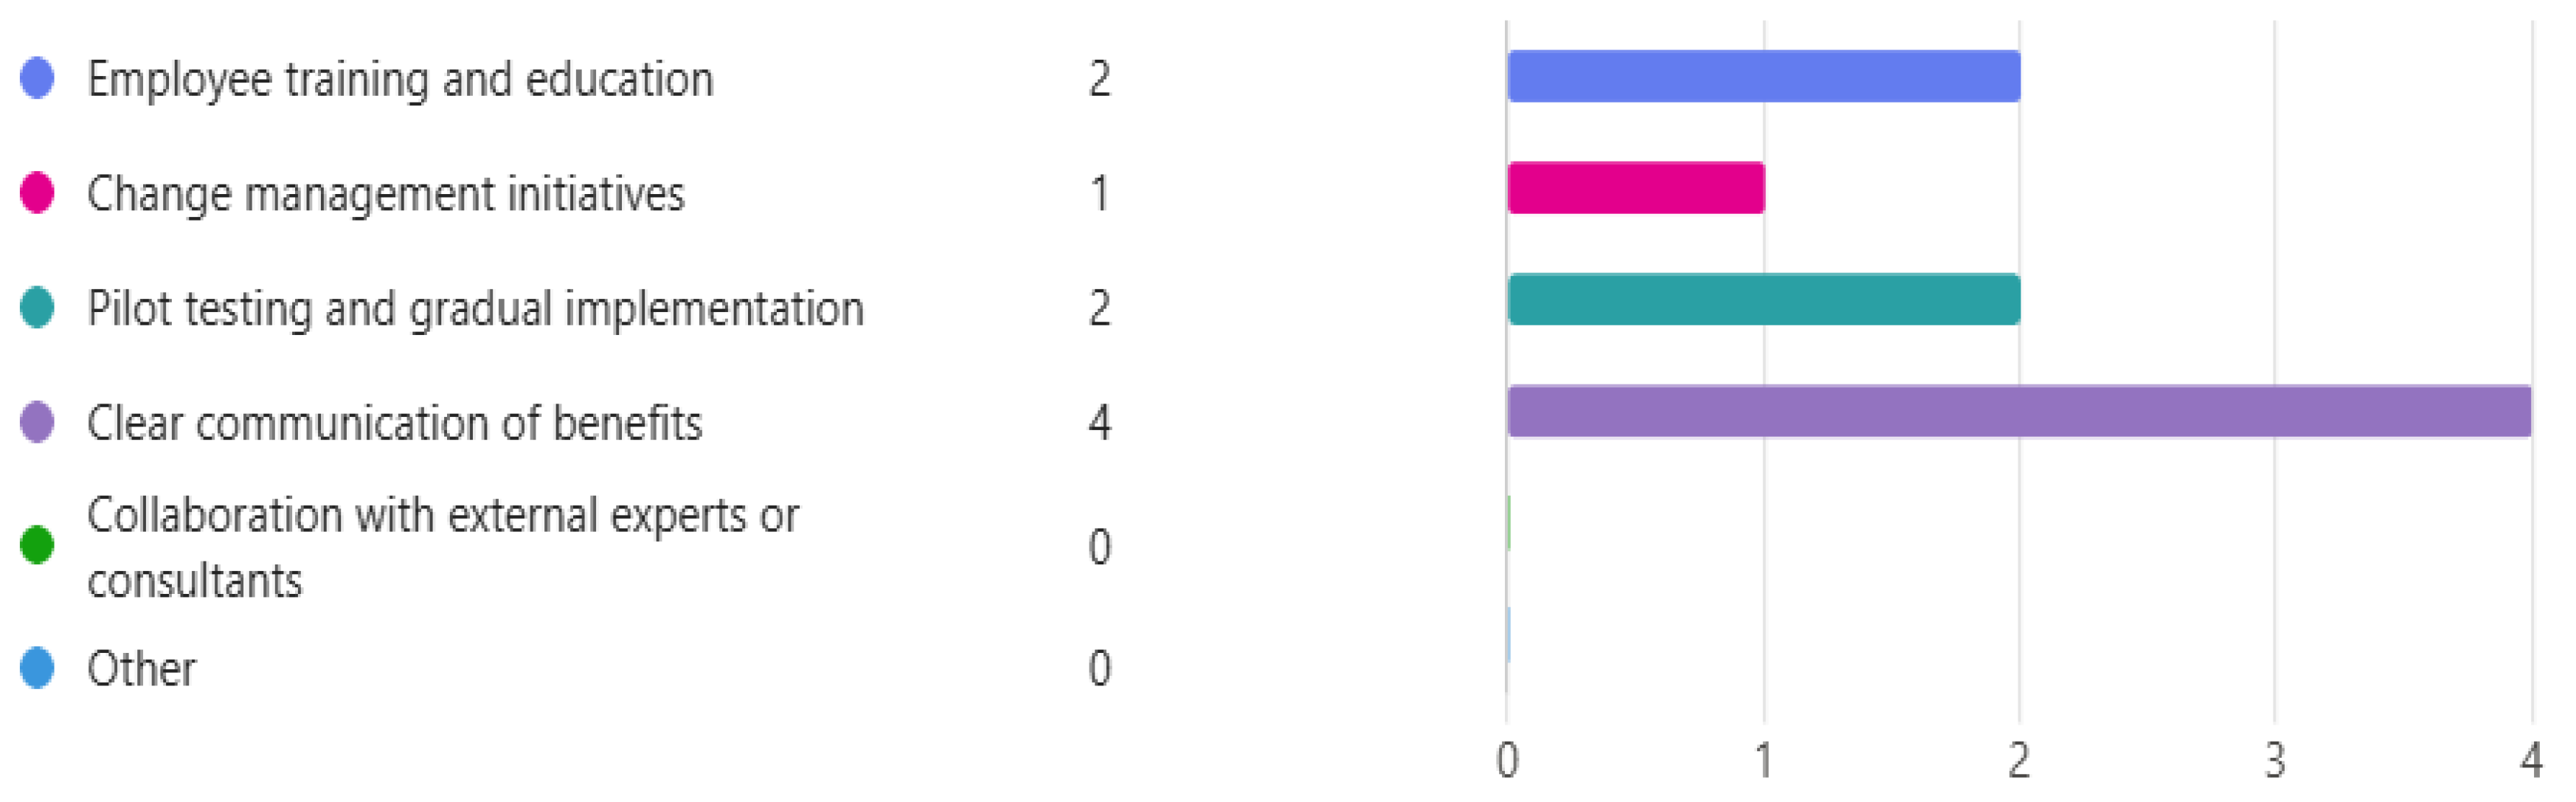
Disclaimer/Publisher’s Note: The statements, opinions and data contained in all publications are solely those of the individual author(s) and contributor(s) and not of MDPI and/or the editor(s). MDPI and/or the editor(s) disclaim responsibility for any injury to people or property resulting from any ideas, methods, instructions or products referred to in the content. |
© 2025 by the authors. Licensee MDPI, Basel, Switzerland. This article is an open access article distributed under the terms and conditions of the Creative Commons Attribution (CC BY) license (https://creativecommons.org/licenses/by/4.0/).