Abstract
Sulfate (SO42−) is an essential chemical species in atmospheric aerosols and plays an influential role in their physical–chemical characteristics. The mechanisms of secondary SO42− aerosol have been intensively studied in air-polluted cities. However, few studies have focused on cities with good air quality. One-year PM2.5 samples were collected in the tropical island city of Haikou, and water-soluble inorganic ions, as well as water-soluble Fe and Mn, were analyzed. The results showed that non-sea-salt SO42− (nss-SO42−) was the dominant species of water-soluble inorganic ions, accounting for 40–57% of the total water-soluble inorganic ions in PM2.5 in Haikou. The S(IV)+H2O2 pathway was the main formation pathway for secondary SO42− in wintertime in Haikou, contributing to 57% of secondary SO42− formation. By contrast, 54% of secondary SO42− was produced by the S(IV)+Fe×Mn pathway in summer. In spring and autumn, the S(IV)+H2O2, S(IV)+Fe×Mn, and S(IV)+NO2 pathways contributed equally to secondary SO42− formation. The ionic strength was the controlling parameter for the S(IV)+NO2 pathway, while pH was identified as a key factor that mediates the S(IV)+H2O2 and S(IV)+Fe×Mn pathways to produce secondary SO42−. This study contributes to our understanding of secondary SO42− production under low PM2.5 concentrations but high SO42− percentages.
1. Introduction
Sulfate (SO42−) is an important component of water-soluble inorganic ions in fine particulate matter (PM2.5, aerodynamic diameter ≤ 2.5 µm), accounting for 44–60% of the mass fraction in PM2.5 [1,2,3,4,5]. It is well known that sources of SO42− in the atmosphere include primary emission sources (such as sea salt and dust) and secondary SO42− formation (the oxidation of SO2 to SO42− in the atmosphere), with the latter being the dominant contributor of fine particulate SO42− [6,7]. Atmospheric secondary SO42− formation pathways include gas-phase reactions, aqueous-phase reactions in aerosols or clouds, and heterogeneous reactions on aerosol surfaces (Figure S1). The gas-phase reaction is the oxidation of SO2 by OH· to produce gaseous sulfuric acid (H2SO4(g)) [8]; subsequently, gas-phase H2SO4(g) reacts with alkaline substances (such as NH3(g) and CaCO3) to produce particulate SO42−. Aqueous-phase reactions include the generation of S(IV) (S(IV) = SO2·H2O + HSO3− + SO32−) and the oxidation of S(IV) by NO2, H2O2, O3, and O2 catalyzed by transition-metal ions (TMIs, e.g., Fe(III) and/or Mn(II)) to form secondary SO42−. The heterogeneous reactions are generally referred to as the direct oxidation of SO2 to SO42− on aerosol surfaces [9,10]. Among these formation pathways, aqueous-phase reactions are thought to be the most important reactions for secondary SO42− formation and have attracted the most attention.
Due to strong public concerns about air pollution in China and the important contribution of secondary SO42− to PM2.5, the aqueous-phase formation of secondary SO42− in aerosols or cloud/fog droplets has received extensive interest in the past decades in air-polluted areas in China. Based on WRF-CMAQ analysis, Cheng et al. reported that S(IV)+NO2 was the dominant pathway for secondary SO42− formation under a pH ranging from 5.4 to 6.2 during haze pollution periods in Beijing [11]. By combining observational datasets with an observation-based model for simulating secondary inorganic aerosol, Xue et al. found that the S(IV)+NO2 pathway was prevalent during haze–fog events in Shanghai, Nanjing, and Guangzhou [12]. By combining atmospheric measurements and laboratory simulations, Wang et al. reported that the aqueous oxidation of SO2 by NO2 was a key pathway for secondary SO42− formation during air-polluted periods [13]. By using online observations and developing an improved solute intensity-dependent chemical thermodynamics and kinetics model, Gao et al. reported that the S(IV)+H2O2 pathway dominates sulfate formation in Tianjin during haze pollution periods [14]. By coupling a laboratory simulation and a state-of-the-art multiphase model, Song et al. suggested that the TMI-catalyzed pathway was the most important one for secondary SO42− formation in North China [15]. Although much research has been conducted on the secondary SO42− aqueous-phase formation rate, previous studies have mainly focused on haze pollution periods [11,12,13,14,15,16,17]. Few studies have explored the secondary SO42− aqueous-phase formation rate under the condition of low PM2.5 concentration. In particular, in China, after the implementation of the Clean Air Act and the strengthening of the government resolve on air pollution, the PM2.5 concentration decreased to low levels. However, the changes in secondary SO42− aqueous-phase formation rates remain unclear.
According to the 14th Five-Year Plan of Hainan Province, the annual average PM2.5 concentration in Hainan Province should be lower than 11 μg m−3. However, the average PM2.5 concentration in recent years in Haikou has been 16.7 μg m−3, especially in winter, during which the PM2.5 concentration can be as high as 30 μg m−3. As a pilot zone for ecological conservation and a free trade port with Chinese characteristics, Hainan Province still has the daunting task of managing its atmospheric PM2.5 to establish its ecological environment as a world leader. Previous observations in Haikou in 2011–2012 found that SO42− was the most abundant inorganic ion in PM2.5 [18], but the formation mechanisms and sources of secondary SO42− formation remain undocumented. The multi-resolution emission inventory for China (MEIC) reported that the total emissions of SO2 in Hainan Province in 2020 was 36,114 t, and industry emissions were thought to be the dominant source [19,20]. However, gas-phase SO2 is not equal to SO42− in PM2.5. If one wants to deeply understand the accumulation of secondary SO42− in PM2.5, the first step is to clarify secondary SO42− chemical formation mechanisms. In this study, we collected PM2.5 samples from September 2021 to August 2022 and analyzed the concentrations of water-soluble inorganic ions, and water-soluble Fe and Mn. This study aims to (1) calculate the formation rate of secondary SO42− using chemical kinetic models and (2) explore the influences of ionic strength and pH on secondary SO42− formation rates.
2. Methods
2.1. Sampling
The sampling location was set on a rooftop (24 m above the ground) of the State Key Laboratory of Marine Resource Utilization in the South China Sea, Hainan University (20°06′ N,110°32′ E), Haikou, China (Figure S2). PM2.5 samples were collected using a high-volume sampler equipped with a PM2.5 cascade impactor and quartz filters (TISSUQUARTZ-2500QAT-UP, PALL Corporation, New York, NY, USA). The sampling duration was 24 or 48 h. Before sampling, all filters were combusted at 450 °C for 6 h in a muffle furnace. After sampling, the filters were stored in clear Ziplock bags and immediately refrigerated at −20 °C. A total of 200 PM2.5 samples were obtained from 1 September 2021 to 30 August 2022. We divided the sampling periods into four seasons (autumn (September to November 2021), winter (December 2021 to February 2022), spring (March to May 2022), and summer (June to August 2022)). The meteorological parameters (temperature and RH) were downloaded from http://www.weather.com.cn (accessed from 1 September 2021 to 30 August 2022), and there were no significant seasonal variations for RH in contrast with obvious seasonal differences for temperature (Figure S3a). Hourly air pollutants (such as PM2.5, PM10, SO2, NO2, O3, CO, Figure S3b–d) were obtained from an air quality monitoring station (https://map.zq12369.com; accessed from 1 September 2021 to 30 August 2022) located 300 m from our sampling site.
2.2. Chemical Analysis
Analysis of Water-Soluble Ions, and Water-Soluble Fe and Mn
One-quarter of the filters were placed in clear 50 mL centrifuge tubes, and 30 mL of Milli-Q water (18.2 Ω) was added to immerse the filters, followed by ultrasound for 30 min and then rest for 30 min at room temperature. The extracts were filtered through a membrane filter (0.22 µm). Then, 5 mL extracts were used for water-soluble ion measurements and 9.5 mL extracts were used for water-soluble Fe and Mn analysis. The water-soluble ions (Na+, NH4+, K+, Mg2+, Ca2+, Cl−, NO3−, SO42−) were analyzed by Ion Chromatography (DIONEX AQ-1100, Dionex Aquion RFIC ThermoFisher, CS12A for cations, and AS22 for anions). The anionic eluents comprised 4.5 mM Na2CO3 mixed with 1.4 mM NaHCO3, and the cationic eluents comprised 20 mM methanesulfonic acid (MSA). The concentration of each ion in the blank was subtracted from the measured ion concentrations of each sample to remove possible contamination during the test.
The water-soluble Fe and Mn were analyzed by inductively coupled plasma optical emission spectrometry (Agilent 5100, Agilent Technologies Inc., Santa Clara, CA, USA). Before analysis, 0.5 mL of pure nitric acid (65%) was added to the 9.5 mL extracts. All concentrations were corrected for background concentrations with duplicate filter blanks. The detection limits for water-soluble Fe and Mn were 0.1 µmol L−1 and 0.11 µmol L−1, respectively (3 × blank standard deviation). The accuracy of instrument testing was ensured by inserting a quality control solution every 10 samples, and the 44 repeat analyses of quality control solutions for water-soluble Fe and Mn were 100 ± 0.3 μg L−1.
2.3. Data Analysis
2.3.1. The Concentration of nss-SO42−
The concentration of nss-SO42− in PM2.5 is as follows:
where ss-SO42− represents sea-salt SO42−, SO42− and Na+ are calculated using the unit of mass concentration (µg m−3) of water-soluble ions, and 0.252 is the seawater SO42−/Na+ mass ratio [21,22].
[nss-SO42−] = [SO42−] − [ss-SO42−]
[ss-SO42−] = 0.252 × [Na+]
2.3.2. Aerosol Water Content (AWC), Aerosol pH, and Ionic Strength
The AWC, aerosol pH, and ionic strength were calculated using ISORROPIA II. ISORROPIA II calculates the compositions and phase state of Na+-K+-Ca2+-Mg2+-NH4+-SO42−-NO3−-Cl−-H2O. This model (ISORROPIA v2.1) was developed by Athanasios Nenes and Christors Fountoukis at the University of Miami, Carnegie Mellon University, and the Georgia Institute of Technology. It has two input units (µmol m−3 air and µg m−3 air), two modes (forward and reverse modes), and two aerosol states (stable and metastable states). In this study, we chose µg m−3 air, forward mode, and metastable state and then input the concentration of water-soluble inorganic ions, RH, and thermodynamic temperature to calculate the AWC, aerosol pH, and ionic strength. Detailed information about ISORROPIA II can be in the work of Fountoukis and Nenes [23]. ISORROPIA II has been widely used to calculate AWC, aerosol pH, and ionic strength [14,15,17,24,25].
2.3.3. The Secondary SO42− Formation Rates in Aqueous-Phase Chemistry
The aqueous-phase formation steps of secondary SO42− include the transformation of SO2 into S(IV) and the oxidation of S(IV) into secondary SO42− by various oxidants. The detailed calculations are as follows.
The S(IV) Concentration
Assuming that gas-phase X is in equilibrium with aqueous X in aerosol water, the concentration of dissolved X ([X(aq)], (M)) can be expressed using Equation (3)
where X represents the concentration of SO2 or other oxidants (NO2, H2O2, and O3) and p(X) is the partial pressure of X in the atmosphere (atm). H(X) represents Henry’s law constant for X, and the unit of Henry’s law constant is M−1 atm−1.
[X(aq)] = H(X)p(X)
The concentrations of SO2·H2O, HSO3−, and SO32− in aerosol water are given by Equations (4)–(6) [26],
where HSO2 is Henry’s law constant for SO2 (M−1 atm−1), [H+] = 10−pH M, and pH is calculated via ISORROPIA II. Ks1 (M) and Ks2 (M) are the first and second dissociation equilibrium constants for HSO3− and SO32−, respectively. The detailed calculations for HSO2, Ks1, and Ks2 are described in Text S1.
The total S(IV) (M) (S(IV) = SO2·H2O + HSO3− + SO32−) concentration can be calculated using Equation (7), and the mole fractions of SO2·H2O, HSO3−, and SO32− to total S(IV) can be calculated using Equations (8)–(10) [26],
The Oxidation Rate of S(IV) by NO2
The reaction rate of S(IV)+NO2 pathway was given by Lee and Schwart [27]:
where [S(IV)] (M) can be calculated using Equation (7), [NO2(aq)] (M) is the aqueous concentration of NO2 in aerosol water and can be calculated using Equation (3). Moreover,
where kS(IV)+NO2 is the rate constant: when pH < 5, kS(IV)+NO2,low = 1.4 × 10⁵ M−1 s−1; when pH > 5.8, kS(IV)+NO2,low = 2 × 10⁶ M−1 s−1 [27]; when pH is between 5 and 5.8, kS(IV)+NO2,low = (23.25 × pH − 114.85) × 105 [10]; when pH < 5.3, kS(IV)+NO2,high = 1.24 × 10⁷ M−1 s−1; when pH > 8.7, kS(IV)+NO2,high = 1.67 × 10⁷ M−1 s−1 [28]; and when pH is between 5.3 and 8.7, kS(IV)+NO2,high = (1.26 × pH − 5.70) × 106 [10]. More detailed information can be found in Table S2. The influences of ionic strength on the reaction rate of the S(IV)+NO2 pathway can be found in Text S2.
The Oxidation Rate of S(IV) by H2O2
The reaction rate of the S(IV)+H2O2 pathway was given by Hoffmann and Calvert [29]:
where k(S(IV)+H2O2)1 can be estimated using Equation (14) [11,26],
When the temperature is 298 K, k(S(IV)+H2O2)1(298 K) is equal to 7.45 × 10⁷ M−1 s−1. E/R (K) is listed in Table S2. α is equal to 13 M−1 [14]. [H+] (M) is the H+ concentration, calculated using ISORROPIA II. [HSO3−] (M) is the only species of S(IV) that reacts with H2O2 to form secondary SO42−, calculated using Equation (5). [H2O2] is the mole fraction of H2O2 (nmol mol−1), estimated using an empirical equation [14,30],
where T is the ambient temperature (°C). The influences of ionic strength on the reaction rate of the S(IV)+H2O2 pathway are given in detail in Text S3.
The Oxidation Rate of S(IV) by O3
The reaction rate of S(IV)+O3 pathway was given by Hoffmann and Calvert [29]:
where k(S(IV)+O3)1 = 2.4 × 10⁴ M−1 s−1, and k(S(IV)+O3)2 (M−1 s−1) and k(S(IV)+O3)3 (M−1 s−1) are functions of temperature [11,26],
At a temperature of 298 K, k(S(IV)+O3)2(298 K) and k(S(IV)+O3)3(298 K) are equal to 3.7 × 10⁵ M−1 s−1 and 1.5 × 10⁹ M−1 s−1, respectively (Table S2). [SO2·H2O], [HSO3−], and [SO32−] can be calculated using Equations (4)–(6), respectively. [O3(aq)] (M) can be calculated using Equation (3), and Henry’s law constant for O3 (HO3(298 K)) is equal to 1.1 × 10⁻² M atm−1 (Table S1). The influences of ionic strength on the reaction rate of the S(IV)+O3 pathway are detailed in Text S4.
The Rate of Fe(III)- and Mn(II)-Catalyzed Oxidation of S(IV) into Secondary SO42−
S(IV) oxidation by O2 is known to be catalyzed by means of water-soluble Fe(III) and Mn(II) [14]. The rate expression of Fe(III)-catalyzed and Mn(II)-catalyzed oxidation of S(IV) into secondary SO42− is provided in Text S5. The following rates for the synergistic Fe(III)-Mn(II)-catalyzed oxidation of S(IV) (hereafter referred to as S(IV)+Fe×Mn) into secondary SO42− were obtained [31]:
pH ≤ 4.2:
pH ≥ 4.2:
where k(Fe×Mn+O2)1 and k(Fe×Mn+O2)2 are functions of temperature [14,26]
When the temperature is 297 K, k(Fe×Mn+O2)1(297 K) and k(Fe×Mn+O2)2(297 K) are equal to 3.72 × 10⁷ M−2 s−1 and 2.51 × 10¹³ M−2 s−1, respectively (Table S2). [H+] (M) is the H+ concentration, calculated using ISORROPIA II, [S(IV)] (M) can be calculated using Equation (7), the concentrations of [Fe(III)] and [Mn(II)] (M) and the influences of ionic strength on the reaction rate of S(IV)+Fe×Mn pathway are detailed in Texts S5 and S6.
Mass Transport Limitations Rate
The total reaction rate of oxidation of S(IV) into secondary SO42− (RH,aq) is affected by both the rate of chemical reactions (Raq) and the rate of limiting mass transfer (Jaq,lim) in different media and across interfaces. By following Cheng et al. [11],
where RH,aq (M s−1) is the total reaction rate of oxidation of S(IV) into secondary SO42− by different oxidants (NO2, H2O2, O3, and O2). Raq (M−1 s−1) is the aqueous-phase reaction rate calculated in the Sections dealing with “The Oxidation Rate of S(IV) by NO2”,“The Oxidation Rate of S(IV) by H2O2”, “The Oxidation Rate of S(IV) by O3” and “The Rate of Fe(III) and Mn(II) Catalyzed Oxidation of S(IV) into Secondary SO42−“. Jaq,lim is the limiting mass transfer rate (M s−1), the calculating formula of which is detailed in Text S7.
The final sulfate formation rate was converted to μg m−3 h−1 units, calculated as follows:
where 3600 s h−1 is the time conversion factor; 96 g mol−1 is the molar mass of SO42−; AWC is the aerosol water content (mg m−3), calculated using ISORROPIA II; ρw is the density of water, which is 1 kg L−1; and RH,aq (M s−1) can be calculated using Equation (21).
3. Results and Discussion
3.1. Seasonal Variations in Water-Soluble Inorganic Ions, Fe and Mn in PM2.5
In our observations, SO42− was the most abundant ion, accounting for 41–59% of the total water-soluble inorganic ions in PM2.5, and nearly all SO42− was nss-SO42− (Figure 1), indicating that nss-SO42− dominates water-soluble inorganic ionic compositions in PM2.5 in Haikou. The nss-SO42− in PM2.5 in Haikou has been attributed to secondary sources rather than primary emissions [18]. The highest nss-SO42− concentrations were observed in winter (4.1 ± 1.8 μg m−3), and the lowest nss-SO42− concentrations were observed in summer (1.5 ± 0.7 μg m−3; see Table S3). Similar seasonal patterns for aerosol nss-SO42− concentrations have been widely reported in many Chinese cities, including Shanghai [32], Chongqing [33], Guiyang [5], Guangzhou [34], and Hong Kong [35]. Higher nss-SO42− concentrations in winter than in summer have been widely attributed to the high SO2 emissions and SO2 oxidation rates during winter [19,20,36]. NO3− and NH4+ were the secondary abundant ions, accounting for 6.5–26% and 11–16%, respectively, of the total water-soluble inorganic ions in PM2.5 (Figure 1). The percentages of other water-soluble inorganic ions (Ca2+, Na+, Cl−, K+, and Mg2+) to total water-soluble inorganic ions were 16–25% (Figure 1).
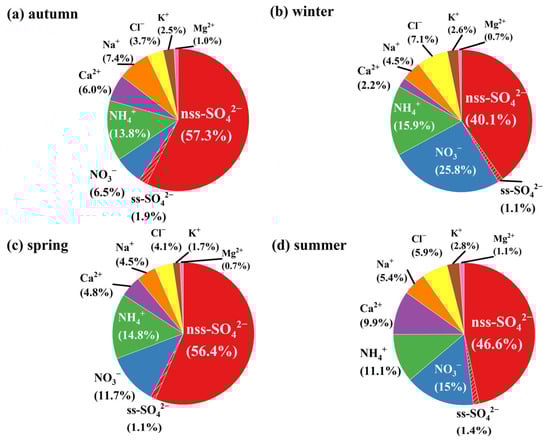
Figure 1.
The percentages of water-soluble inorganic ions in PM2.5 in autumn (a), winter (b), spring (c), and summer (d) in Haikou.
In general, Fe in aerosol is entirely sourced from mineral dust, while Mn originates from both mineral dust and anthropogenic activities [37,38]. The concentrations of water-soluble Fe and Mn were 7.4 ± 6.2 and 3.7 ± 2.4 ng m−3 in autumn, 15 ± 12 and 6.1 ± 4.4 ng m−3 in winter, 12 ± 8.7 and 5.1 ± 2.1 ng m−3 in spring, and 4.2 ± 4.1 and 2.8 ± 1.1 ng m−3 in summer, respectively. The concentrations of water-soluble Fe in our measurements were lower than those in the summertime in Xi’an (297 ± 78 ng m−3) [39] and Singapore (18 ± 2.4 ng m−3) [40]; however, the concentrations of water-soluble Mn were higher than those in Singapore (1.1 ± 0.4 ng m−3) [40]. In winter, water-soluble Fe concentrations in Haikou were lower than those in Beijing (68 ± 46 ng m−3), Handan (59 ± 33 ng m−3), Zhengzhou (32 ± 20 ng m−3), and Hangzhou (24 ± 8.5 ng m−3) [41]. The concentrations of water-soluble Mn during wintertime were also lower than those in North China (e.g., 42 ± 17 ng m−3 in Baoding and 55 ± 33 ng m−3 in Tianjin [42]). The spatial and temporal differences in water-soluble Fe and Mn are influenced by many factors, such as sources, aerosol aging, and aerosol acidity [43].
3.2. Seasonal Differences in H2O2, AWC, Aerosol pH, Ionic Strength, Fe(III)×Mn(II) and S(IV)
The concentrations of H2O2 ranged from 0.3 to 1.5 ppb, displaying significant seasonal variations, with the highest values in summer (1.3 ± 0.1 ppb) and the lowest values in winter (0.6 ± 0.1 ppb, Figure 2a). Our calculated H2O2 concentrations within previous reports ranged from 0.03 ± 0.02 ppb to 2.2 ± 0.03 ppb (see Figure S4). The concentrations of AWC ranged from 0.2 to 175 μg m−3 (Figure 2b), with the highest concentrations in winter (27 ± 30 μg m−3) and the lowest concentrations in summer (1.7 ± 1.7 μg m−3). The ranges and seasonal variations in AWC in our calculations are consistent with previous studies in other cities [44,45].
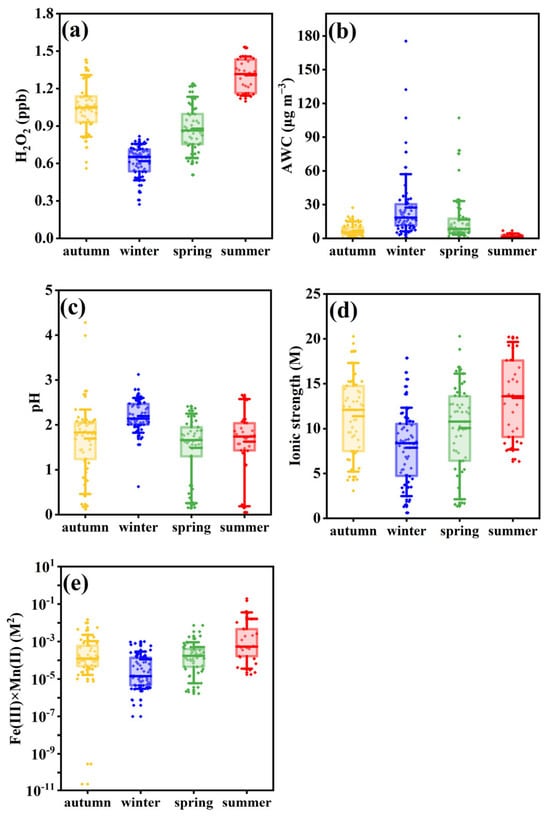
Figure 2.
Box plots of seasonal H2O2 concentrations (a), AWC (b), pH (c), ionic strength (d), and Fe(III)×Mn(II) concentrations (e). The yellow, blue, green, and red boxes represent autumn, winter, spring, and summer, respectively. The large boxes indicate the interquartile range from the 25th to 75th percentile. The dashed line inside the box indicates the average value. The solid line indicates the median value and whiskers indicate the 10th and 90th percentiles.
The pH values spanned from 0.05 to 4.3 across all the observations. Individually, pH values ranged from 0.1 to 4.3, 0.6 to 3.1, 0.2 to 2.4, and 0.05 to 2.7 in autumn, winter, spring, and summer, respectively (Figure 2c). Our calculated pH values agree with the aerosol pH values in Greece (−0.1–3.8) [46], Canada (2.5–5.5) [47], and America (0–2) [48] but are lower than the pH values in Beijing (3.0–4.9,) [49] and Shanghai (4.7–6.6) [50]. The ionic strength levels ranged from 0.6 to 20 M, spanning from 3.1 to 20 M, 0.6 to 18 M, 1.4 to 20 M, and 6.3 to 20 M in autumn (11 ± 4.4 M), winter (7.9 ± 4.0 M), spring (10 ± 4.8 M), and summer (13 ± 4.5 M), respectively (Figure 2d). In autumn, the ionic strength levels recorded in our study are similar to another study in Beijing (11–52 M) [25], but our recorded wintertime and summertime ionic strength levels are lower than those reported in the North China Plain (30–50 M and 20–25 M) [15,42].
Concentrations of Fe(III)×Mn(II) varied from 2.3 × 10⁻¹¹ M2 to 1.9 × 10⁻¹ M2, displaying significant seasonal variations (lower concentrations of Fe(III)×Mn(II) in winter (1.1 × 10⁻⁴ ± 2.2 × 10⁻⁴ M2) than those in summer (1.6 × 10⁻² ± 4.4 × 10⁻² M2, Figure 2e)). The Fe(III)×Mn(II) concentrations in our observations are higher than those recorded in Tianjin (8.2 × 10⁻¹⁸–2.0 × 10⁻⁶) [14]. The calculated partitions of SO2·H2O, HSO3−, and SO32− (Figure S5) are consistent with a previous study, emphasizing the validity of our calculations for S(IV) [26]. When pH < 2, SO2·H2O is the main species of S(IV), accounting for 50–100% of total S(IV). When the pH is between 2 and 4.5, 50–100% of S(IV) is in the form of HSO3−. In our observations, all pH values were lower than 4.5 (Figure 2c); thus, the presence of SO32− in aerosol water can be neglected in our case.
3.3. The Aqueous-Phase Formation Rates of Secondary SO42−
Figure 3 shows the daily secondary SO42− aqueous-phase formation rates by various formation pathways. The results showed that secondary SO42− aqueous-phase formation rates by the S(IV)+NO2, S(IV)+H2O2, and S(IV)+Fe×Mn pathways were 4–7 orders of magnitude faster than the S(IV)+O3, S(IV)+Fe, and S(IV)+Mn pathways. Previous studies during Beijing haze periods found that S(IV)+O3 was an important pathway for secondary SO42− production when pH > 5.8 [11,51]. As shown in Figure S5, when the pH is between 4.5 and 8, S(IV) partitioning shifts in favor of SO32−, and the rate constants for SO32−+O3 ( = 1.5 × 10⁹ M−1 s−1) are almost 4–5 orders of magnitude faster than for SO2·H2O+O3 () and HSO3−+O3 ( (Table S2), highlighting that the S(IV)+O3 pathway is important for secondary SO42− when aerosol pH > 4.5. However, in our observations, the pH range was 0.05–4.3 (Figure 2c), SO2·H2O and HSO3− were the dominant species of S(IV) (Figure S5), and the rate constants of SO2·H2O+O3 and HSO3−+O3 were significantly lower than S(IV)+NO2, S(IV)+H2O2, and S(IV)+Fe×Mn (Table S2); thus, we ignored the S(IV)+O3 pathway for secondary SO42− formation. Using model simulations and in-field observations, previous studies also found that secondary SO42− production by the S(IV)+O3 pathway was unimportant under conditions with pH < 4.5 [10,11,51,52]. In addition, we also neglected the S(IV)+Fe and S(IV)+Mn pathways for secondary SO42− formation due to their extremely low rate constants (Table S2). Although rate constants k(Fe +O2)2 under pH range of 3 and 4.5 were high in the S(IV)+Fe×Mn pathway (Table S2), the extremely low concentrations of Fe(III) (Figure S6) limited secondary SO42− formation by k(Fe+O2)2 [Fe(III)]2[S(IV)] under pH range from 3 to 4.5. The aqueous-phase formation rates of secondary SO42− by S(IV)+Mn reactions also displayed low rates, which was attributed to the lowest rate constant of k(Mn+O2) (Table S2). Therefore, we did not consider the S(IV)+O3, S(IV)+Fe, and S(IV)+Mn pathways due to their low contributions to secondary SO42− production.
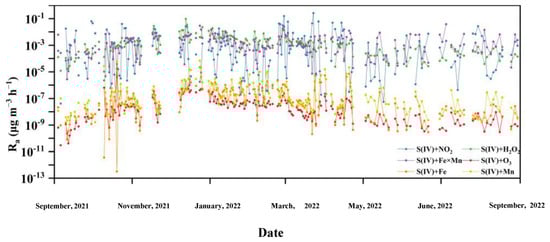
Figure 3.
Time series of secondary SO42− formation rates by six different SO42− aqueous-phase formation pathways, made on the first day of a month.
3.4. S(IV)+NO2 Pathway Formation Rates and their Influencing Factors
The secondary SO42− formation rates by the S(IV)+NO2 pathway exhibited ranges of 4.2 × 10⁻⁸–6.3 × 10⁻² µg m−3 h−1 in autumn, 1.9 × 10⁻⁷–1.6× 10⁻¹ µg m−3 h−1 in winter, 5.6 × 10⁻⁸–2.6 × 10⁻¹ µg m−3 h−1 in spring, and 4.3 × 10⁻⁷–2.7 × 10⁻² µg m−3 h−1 in summer (Figure 3). Our calculated secondary SO42− formation rates by the S(IV)+NO2 pathway in autumn and winter were lower than those from previous studies in Beijing (2.0 × 10⁻⁴–5.9 µg m−3 h−1) [17] and Tianjin (~6.0 µg m−3 h−1) [14]. In addition to the effect of substrate (S(IV) and NO2) concentrations, ionic strength was the main factor that modified secondary SO42− formation by the S(IV)+NO2 pathway. As shown in Figure 4a, when ionic strength increased, the secondary SO42− formation rate by the S(IV)+NO2 pathway increased, which is consistent with previous studies [10,53]. Two possible mechanisms have been proposed to explain secondary SO42− formation by the S(IV)+NO2 pathway. The first is an oxygen atom transfer reaction [28]:
2NO2 + SO32− ↔ (O2N−SO3−NO2)2−
(O2N−SO3−NO2)2− + OH− ↔ (HO−SO3−(NO2)2)3−
(HO−SO3−(NO2)2)3− + OH− ↔ NO2− + SO42− + H2O
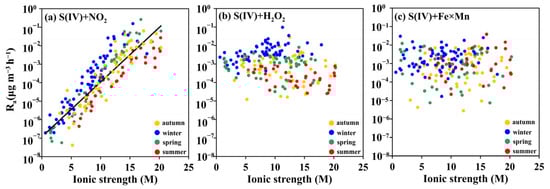
Figure 4.
The effect of ionic strength on secondary SO42− formation rates by the S(IV)+NO2 (a), S(IV)+H2O2 (b), and S(IV)+Fe×Mn (c) pathways (yellow, blue, green, and red dots represent autumn, winter, spring, and summer, respectively).
The second is an electron transfer reaction, followed by the reaction of hydroxyl radical with a sulfite radical [54]:
NO2 + SO32− → NO2− + SO3•−
OH• + SO3•− → H+ + SO42−
For both mechanisms, the controlling step is the reaction of an ion with a neutral molecule [11]. The positive trends between the chemical rate constant kS(IV)+NO2 and ionic strength (Figure S7) as well as the secondary SO42− formation rates by the S(IV)+NO2 pathway and ionic strength (Figure 4a) support the fact that increasing ionic strength enhances secondary SO42− formation rates by the S(IV)+NO2 pathway [14,53,55].
3.5. S(IV)+H2O2 and S(IV)+Fe×Mn Pathway Formation Rates and Their Influencing Factors
The secondary SO42− formation rates by the S(IV)+H2O2 pathway in winter (3.0 × 10⁻⁴–9.5 × 10⁻² µg m−3 h−1) were higher than those in summer (2.6 × 10⁻⁵–9.1 × 10⁻⁴ µg m−3 h−1, Figure 3), which is consistent with a previous study in Tianjin, revealing higher values in winter than summer [14]. By contrast, the S(IV)+ Fe×Mn pathway was more prevalent in summer (2.1 × 10⁻⁵–3.8 ×10⁻² µg m−3 h−1) than those in other seasons (2.8 × 10⁻⁶–8.3 × 10⁻³ µg m−3 h−1 in autumn, 1.6 × 10⁻⁵–3.0 × 10⁻² µg m−3 h−1 in winter, and 7.3 × 10⁻⁶–1.2 × 10⁻² µg m−3 h−1 in spring). A previous study in Tianjin reported that secondary SO42− formation rates by the S(IV)+Fe×Mn pathway were higher in summer than those in other seasons [14]. Our calculated wintertime secondary SO42− formation rates by the S(IV)+Fe×Mn pathway were lower than those in Beijing (~4.6 µg m−3 h−1) [15] and Wangdu (10−1–100 µg m−3 h−1) [15]. In the following section, we will systematically explain what factors impact the secondary SO42− formation rates by the S(IV)+H2O2 and S(IV)+Fe×Mn pathways.
Different from the S(IV)+NO2 pathway, there were no positive or negative relationships between ionic strength and secondary SO42− formation rates by S(IV)+H2O2 and S(IV)+Fe×Mn pathways (Figure 4b,c), indicating that ionic strength has less of an influence on the S(IV)+H2O2 and S(IV)+Fe×Mn pathways to produce secondary SO42−. The positive correlation between aerosol pH and secondary SO42− formation rates by S(IV)+H2O2 (Figure 5a) emphasizes that aerosol pH is the primary controlling factor for the S(IV)+H2O2 pathway. The chemical rate constant kS(IV)+H2O2 is a function of pH; when the pH value increased from 0 to 2, the chemical rate constant kS(IV)+H2O2 showed an increasing trend (Figure S8a). In our in situ observations, when pH < 2, the secondary SO42− formation rate by the S(IV)+H2O2 pathway displayed a positive relationship with the pH value (Figure 5a). This phenomenon is supported by the simultaneous increase in the chemical rate constant kS(IV)+H2O2 (Figure S8a) and HSO3− concentrations (Figure S5) as pH increased from 0 to 2. In addition, our observed results showed that secondary SO42− formation rates by the S(IV)+H2O2 pathway under pH of 2~3 were higher than those under pH of 0~2 (Figure 5a). The influence of the chemical rate constant kS(IV)+H2O2 on the secondary SO42− formation rate can be excluded due to kS(IV)+H2O2 at pH 0~2 being close to those at pH 2~3 (Figure S8a). However, the percentages of HSO3− to S(IV) at a pH of 2~3 (50–90%) were higher than those at pH of 0~2 (~50%, Figure S5). HSO3− is a unique species of S(IV) that can react with H2O2 to form secondary SO42− [29], which explains the high secondary SO42− formation rates by the S(IV)+H2O2 pathway [10,26]. In addition, the higher pH in winter (Figure 2c) results in higher HSO3− concentrations than in other seasons, supporting the faster SO42− formation rates by the S(IV)+H2O2 pathway in winter than in other seasons (Figure 5a).
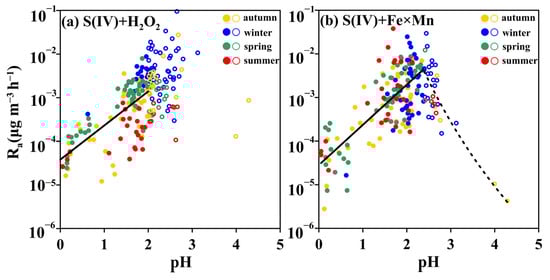
Figure 5.
A scatter plot of aerosol pH with secondary SO42− formation rates by the S(IV)+H2O2 (a) and S(IV)+Fe×Mn (b) pathways. The solid circles represent pH < 2 (a) and pH < 2.4 (b), and the open circles indicate pH > 2 (a) and pH > 2.4 (b).
The pH also has a direct influence on the secondary SO42− formation rate by the S(IV)+Fe×Mn pathway. pH determines not only the water-soluble concentrations of Fe(III) but also the hydrogen ion concentrations [56,57]. When pH < 2.4, there was a positive relationship between the secondary SO42− formation rate by the S(IV)+Fe×Mn pathway and the pH value (Figure 5b). This phenomenon can be attributed to (1) the concentrations of water-soluble Fe(III) and Mn(II) maintaining the highest levels at low pH (Figure S6), (2) the S(IV) concentrations increasing as pH increased from 0 to 2.4 (Figure S8b), and (3) the concentrations of Fe(III) and Mn(II) being influenced not only by pH but also by the AWC. Lower AWC concentrations result in higher Fe(III) and Mn(II) concentrations, favoring secondary SO42− formation [10,15,58]. This also explains the high rate of secondary SO42− formation by the S(IV)+Fe×Mn pathway in summer.
3.6. Comparison of Secondary SO42− Formation Rates under Different PM2.5 Levels
The relative contributions of the S(IV)+NO2, S(IV)+H2O2, and S(IV)+Fe×Mn pathways to total secondary SO42− production in different seasons are shown in Figure 6. In autumn and spring, the relative contributions of each pathway were comparable. In winter, the S(IV)+H2O2 pathway was the main formation pathway, contributing to 57% of secondary SO42− production, but in summer, the S(IV)+Fe×Mn pathway was the largest contributor (54%). A study in Tianjin also reported that the S(IV)+H2O2 pathway played a dominant role in wintertime secondary SO42− production (71%), while S(IV)+Fe×Mn was the main pathway for secondary SO42− production in summer (55%) [14]. In addition, the contribution of the S(IV)+H2O2 and S(IV)+NO2 pathways to total secondary SO42− production had the lowest percentages (17% in summer and 13% in winter).
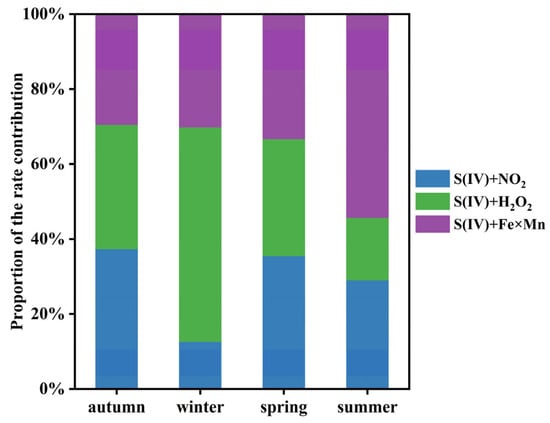
Figure 6.
The relative contributions of S(IV)+NO2, S(IV)+H2O2, and S(IV)+Fe×Mn pathways to total secondary SO42− production.
To understand the secondary SO42− aqueous-phase formation pathways in different regions under different air pollution levels in China, we compared the published datasets of secondary SO42− formation rates and their relative contributions in different cities and seasons (Table 1). During winter, under PM2.5 concentrations < 75 μg m−3, our observations in Haikou showed that S(IV)+H2O2 was the main secondary SO42− formation pathway, while a previous study in Beijing reported that S(IV)+Fe×Mn was the fastest pathway for secondary SO42− production [15]. The discrepancies between this study and the previous study in Beijing may be related to the selection of calculating parameters. In our observations, we measured the water-soluble concentrations of Fe and Mn and estimated the H2O2 concentrations using an empirical equation [14,30]. However, in Song et al.’s study, the authors measured H2O2 concentrations but cited the water-soluble concentrations of Fe and Mn from other studies [15]. By further comparing the calculation processes in different studies, we found that the authors of these studies did not directly measure the water-soluble concentrations of Fe and Mn; instead, they assumed concentrations [11,15,59]. In addition, secondary SO42− formation in Guangzhou and Zhengzhou exhibited different pathways, with these differences potentially being a result of the assumed parameters [58,60,61]. Thus, synchronous analyses of multiple chemical parameters (such as gas-phase NO2 and O3, as well as water-soluble ions) are an important basis for the accurate calculation of secondary SO42− formation rates during winter haze periods.

Table 1.
Summary of the secondary sulfate formation pathway in different regions.
Surprisingly, a limited number of summarized datasets have shown that the S(IV)+Fe×Mn pathway is the highest contributor to secondary SO42− formation in summer in both southern and northern cities of China under different PM2.5 levels (Table 1). These results may be explained by the relatively high Fe(III) and Mn(II) concentrations due to the low pH, which promotes secondary SO42− formation [14,51]. In addition, a low AWC causes relatively higher water-soluble Fe(III) and Mn(II) levels, further enhancing the reactivity of the S(IV)+Fe×Mn pathway in summer [10,15]. Although secondary SO42− formation by the S(IV)+Fe×Mn pathway in Haikou had two to three orders of magnitude difference compared to other studies in Wangdu and Tianjin, the relative contributions of the S(IV)+Fe×Mn pathway to total secondary SO42− formation are comparable with Tianjin.
4. Conclusions
In this study, based on one-year observations of water-soluble inorganic ions, Fe, and Mn, combined with various kinetic models, we calculated the formation rate of secondary SO42− in Haikou and also explored the influences of ionic strength and pH on secondary SO42− formation aqueous-phase oxidation pathways. Our results indicated that the main secondary SO42− formation reactions are the S(IV)+NO2, S(IV)+H2O2, and S(IV)+Fe×Mn pathways for the whole year. On a seasonal scale, the S(IV)+H2O2 reaction dominated the secondary SO42− production rate, contributing to 57% of secondary SO42− formation, while the S(IV)+NO2 reaction only accounted for 13% of secondary SO42− formation in winter. In summer, the S(IV)+Fe×Mn reaction dominated the secondary SO42− production rate, accounting for 54% of secondary SO42− production. Ionic strength directly affects the chemical rate constant of kS(IV)+NO2, thereby controlling the secondary SO42− formation rates from the S(IV)+NO2 pathway. Aerosol pH mediates the concentrations of HSO3− and water-soluble Fe and Mn; thus, the secondary SO42− formation rates by the S(IV)+H2O2 and S(IV)+Fe×Mn pathways are mainly controlled by aerosol pH. In addition, the statistical dataset showed that, in summer, the S(IV)+Fe×Mn pathway is the main reaction for secondary SO42− formation in China.
Supplementary Materials
The following supporting information can be downloaded at: https://www.mdpi.com/article/10.3390/toxics12020105/s1, Figure S1: The schematic of sulfate formation pathways, Figure S2: Sampling location, Figure S3: Hourly concentrations of T, RH, PM2.5, PM10, SO2, NO2, O3, and CO from September 2021 to August 2022 (The yellow, blue, green, and red bars represent autumn, winter, spring, and summer, respectively), Figure S4: Comparisons of H2O2 concentrations at different sites in different seasons, Figure S5: Compositions of S(IV) species with regard to pH, Figure S6: Water-soluble Fe(III) and Mn(II) concentrations as a function of pH, Figure S7: Influence of ionic strength (I) on chemical rate constant kS(IV)+NO2 (kI=i is the rate constant at I = i M, kI=0 is the rate constant at I=0 M, Figure S8: (a) Second-order rate constant for oxidation of S(IV) by H2O2 as a function of pH, (b) Effective Henry’s law constant (H*S(IV)) for SO2 as a function of pH, Table S1: Rate constants for calculating Henry’s law, Table S2: Rate constants and ionic strength effects of the reactions, Table S3: The mean concentrations and ranges of water-soluble inorganic ions (in unit μg m−3) in different seasons [62,63,64,65,66,67,68,69,70,71,72,73,74,75].
Author Contributions
C.W.: conceptualization, methodology, software, validation, formal analysis, writing—review and editing, and visualization. L.L.: conceptualization, methodology, investigation, resources, writing—review and editing, supervision, and project administration. Z.X.: methodology, investigation, resources, and writing—review. S.L., Y.L. and Y.N.: investigation, resources, and writing—review. S.-J.K.: conceptualization, methodology, investigation, resources, writing—review and editing, supervision, and project administration. All authors have read and agreed to the published version of the manuscript.
Funding
This work was supported by the National Natural Science Foundation of China (grant no. 42263001), the Hainan Province Science and Technology Special Foundation (grant no. ZDYF2022SHFZ095), the Collaborative Innovation Center Foundation of Hainan University (grant no. XTCX2022HYB06), and the State Key Laboratory of Marine Resource Utilization in the South China Sea, Hainan University (grant no. MRUKF2023009).
Data Availability Statement
Data are contained within the article and Supplementary Materials.
Conflicts of Interest
The authors declare no conflicts of interest.
References
- Tian, M.; Wang, H.; Chen, Y.; Yang, F.; Zhang, X.; Zou, Q.; Zhang, R.; Ma, Y.; He, K. Characteristics of aerosol pollution during heavy haze events in Suzhou, China. Atmos. Chem. Phys. 2016, 16, 7357–7371. [Google Scholar] [CrossRef]
- He, Q.; Yan, Y.; Guo, L.; Zhang, Y.; Zhang, G.; Wang, X. Characterization and source analysis of water-soluble inorganic ionic species in PM2.5 in Taiyuan city, China. Atmos. Res. 2017, 184, 48–55. [Google Scholar] [CrossRef]
- Tian, M.; Wang, H.; Chen, Y.; Zhang, L.; Shi, G.; Liu, Y.; Yu, J.; Zhai, C.; Wang, J.; Yang, F. Highly time-resolved characterization of water-soluble inorganic ions in PM2.5 in a humid and acidic mega city in Sichuan Basin, China. Sci. Total Environ. 2017, 580, 224–234. [Google Scholar] [CrossRef]
- Guo, W.; Zhang, Z.; Zheng, N.; Luo, L.; Xiao, H.; Xiao, H. Chemical characterization and source analysis of water-soluble inorganic ions in PM2.5 from a plateau city of Kunming at different seasons. Atmos. Res. 2020, 234, 104687. [Google Scholar] [CrossRef]
- Li, Q.; Li, X.; Yang, Z.; Cui, G.; Ding, S. Diurnal and seasonal variations in water-soluble inorganic ions and nitrate dual isotopes of PM2.5: Implications for source apportionment and formation processes of urban aerosol nitrate. Atmos. Res. 2021, 248, 105197. [Google Scholar] [CrossRef]
- Norman, A.; Anlauf, K.; Hayden, K.; Thompson, B.; Brook, J.; Li, S.; Bottenheim, J. Aerosol sulphate and its oxidation on the Pacific NW coast: S and O isotopes in PM2.5. Atmos. Environ. 2006, 40, 2676–2689. [Google Scholar] [CrossRef]
- Li, X.; Bao, H.; Gan, Y.; Zhou, A.; Liu, Y. Multiple oxygen and sulfur isotope compositions of secondary atmospheric sulfate in a mega-city in central China. Atmos. Environ. 2013, 81, 591–599. [Google Scholar] [CrossRef]
- Calvert, J.; Bottenheim, J.; Strausz, O. Mechanism of the homogeneous oxidation of sulfur dioxide in the troposphere. In Sulfur in the Atmosphere; Pergamon: Oxford, UK, 1978; pp. 197–226. [Google Scholar] [CrossRef]
- Ravishankara, A. Heterogeneous and multiphase chemistry in the troposphere. Science 1997, 276, 1058–1065. [Google Scholar] [CrossRef]
- Wang, T.; Liu, M.; Liu, M.; Song, Y.; Xu, Z.; Shang, F.; Huang, X.; Liao, W.; Wang, W.; Ge, M.; et al. Sulfate formation apportionment during winter haze events in North China. Environ. Sci. Technol. 2022, 56, 7771–7778. [Google Scholar] [CrossRef] [PubMed]
- Cheng, Y.; Su, H.; Koop, T.; Mikhailov, E.; Pöschl, U. Size dependence of phase transitions in aerosol nanoparticles. Nat. Commun. 2015, 6, 5923. [Google Scholar] [CrossRef] [PubMed]
- Xue, J.; Yuan, Z.; Griffith, S.M.; Yu, X.; Lau, A.; Yu, J. Sulfate formation enhanced by a cocktail of high NOx, SO2, particulate matter, and droplet pH during haze-fog events in megacities in China: An observation-based modeling investigation. Environ. Sci. Technol. 2016, 50, 7325–7334. [Google Scholar] [CrossRef] [PubMed]
- Wang, G.; Zhang, R.; Gomez, M.; Yang, L.; Levy Zamora, M.; Hu, M.; Lin, Y.; Peng, J.; Guo, S.; Meng, J.; et al. Persistent sulfate formation from London Fog to Chinese haze. Proc. Natl. Acad. Sci. USA 2016, 113, 13630–13635. [Google Scholar] [CrossRef] [PubMed]
- Gao, J.; Shi, G.; Zhang, Z.; Wei, Y.; Tian, X.; Feng, Y.; Russell, A.; Nenes, A. Targeting atmospheric oxidants can better reduce sulfate aerosol in China: H2O2 aqueous oxidation pathway dominates sulfate formation in haze. Environ. Sci. Technol. 2022, 56, 10608–10618. [Google Scholar] [CrossRef] [PubMed]
- Song, H.; Lu, K.; Ye, C.; Dong, H.; Li, S.; Chen, S.; Wu, Z.; Zheng, M.; Zeng, L.; Hu, M.; et al. A comprehensive observation-based multiphase chemical model analysis of sulfur dioxide oxidations in both summer and winter. Atmos. Chem. Phys. 2021, 21, 13713–13727. [Google Scholar] [CrossRef]
- Liu, P.; Ye, C.; Xue, C.; Zhang, C.; Mu, Y.; Sun, X. Formation mechanisms of atmospheric nitrate and sulfate during the winter haze pollution periods in Beijing: Gas-phase, heterogeneous and aqueous-phase chemistry. Atmos. Chem. Phys. 2020, 20, 4153–4165. [Google Scholar] [CrossRef]
- Yue, F.; Xie, Z.; Zhang, P.; Song, S.; He, P.; Liu, C.; Wang, L.; Yu, X.; Kang, H. The role of sulfate and its corresponding S(IV)+ NO2 formation pathway during the evolution of haze in Beijing. Sci. Total Environ. 2019, 687, 741–751. [Google Scholar] [CrossRef]
- Fang, X.; Bi, X.; Xu, H.; Wu, J.; Zhang, Y.; Feng, Y. Source apportionment of ambient PM10 and PM2.5 in Haikou, China. Atmos. Res. 2017, 190, 1–9. [Google Scholar] [CrossRef]
- Li, M.; Liu, H.; Geng, G.; Hong, C.; Liu, F.; Song, Y.; Tong, D.; Zheng, B.; Cui, H.; Man, H.; et al. Anthropogenic emission inventories in China: A review. Natl. Sci. Rev. 2017, 4, 834–866. [Google Scholar] [CrossRef]
- Zheng, B.; Tong, D.; Li, M.; Liu, F.; Hong, C.; Geng, G.; Li, H.; Li, X.; Peng, L.; Qi, J.; et al. Trends in China’s anthropogenic emissions since 2010 as the consequence of clean air actions. Atmos. Chem. Phys. 2018, 18, 14095–14111. [Google Scholar] [CrossRef]
- Keene, W.; Pszenny, A.; Galloway, J.; Hawley, M. Sea-salt corrections and interpretation of constituent ratios in marine precipitation. J. Geophys. Res. Atmos. 1986, 91, 6647–6658. [Google Scholar] [CrossRef]
- Gao, Y.; Arimoto, R.; Duce, R.; Chen, L.; Zhou, M.; Gu, D. Atmospheric non-sea-salt sulfate, nitrate and methanesulfonate over the China Sea. J. Geophys. Res. Atmos. 1996, 101, 12601–12611. [Google Scholar] [CrossRef]
- Fountoukis, C.; Nenes, A. ISORROPIA II: A computationally efficient thermodynamic equilibrium model for K+–Ca2+–Mg2+–NH4+–Na+–SO42−–NO3−–Cl−–H2O aerosols. Atmos. Chem. Phys. 2007, 7, 4639–4659. [Google Scholar] [CrossRef]
- Gao, J.; Wei, Y.; Zhao, H.; Liang, D.; Feng, Y.; Shi, G. The role of source emissions in sulfate formation pathways based on chemical thermodynamics and kinetics model. Sci. Total Environ. 2022, 851, 158104. [Google Scholar] [CrossRef] [PubMed]
- He, P.; Alexander, B.; Geng, L.; Chi, X.; Fan, S.; Zhan, H.; Kang, H.; Zheng, G.; Cheng, Y.; Su, H.; et al. Isotopic constraints on heterogeneous sulfate production in Beijing haze. Atmos. Chem. Phys. 2018, 18, 5515–5528. [Google Scholar] [CrossRef]
- Seinfeld, J.; Pandis, S. Atmospheric Chemistry and Physics: From Air Pollution to Climate Change, 3rd ed.; John Wiley & Sons: Hoboken, NJ, USA, 2016. [Google Scholar] [CrossRef]
- Lee, Y.; Schwartz, S. Kinetics of oxidation of aqueous sulfur (IV) by nitrogen dioxide. Precip. Scav. Dry Depos. Resuspension 1983, 1, 453–470. Available online: https://www.osti.gov/biblio/6567096 (accessed on 30 August 2022).
- Clifton, C.; Altstein, N.; Huie, R. Rate constant for the reaction of nitrogen dioxide with sulfur (IV) over the pH range 5.3–13. Environ. Sci. Technol. 1988, 22, 586–589. [Google Scholar] [CrossRef] [PubMed]
- Hoffmann, M.; Calvert, J. Chemical Transformation Modules for Eulerian Acid Deposition Models: Volume II, the Aqueous-Phase Chemistry; Atmospheric Sciences Research Laboratory, Office of Research and Development, US Environmental Protection Agency: Washington, DC, USA, 1985. [Google Scholar]
- Fu, A. Study on Peroxides Concentration and Its Influencing Factors in the Urban Atmosphere. Master’s Thesis, College of Environmental and Resource Sciences, Zhejiang University, Hangzhou, China, 2014; 56p. (In Chinese). [Google Scholar]
- Ibusuki, T.; Takeuchi, K. Sulfur dioxide oxidation by oxygen catalyzed by mixtures of manganese(II) and iron(III) in aqueous solutions at environmental reaction conditions. Atmos. Environ. 1987, 21, 1555–1560. [Google Scholar] [CrossRef]
- Zhou, M.; Qiao, L.; Zhu, S.; Li, L.; Lou, S.; Wang, H.; Wang, Q.; Tao, S.; Huang, C.; Chen, C. Chemical characteristics of fine particles and their impact on visibility impairment in Shanghai based on a 1-year period observation. J. Environ. Sci. 2016, 48, 151–160. [Google Scholar] [CrossRef]
- Qiao, B.; Chen, Y.; Tian, M.; Wang, H.; Yang, F.; Shi, G.; Zhang, L.; Peng, C.; Luo, Q.; Ding, S. Characterization of water soluble inorganic ions and their evolution processes during PM2.5 pollution episodes in a small city in southwest China. Sci. Total Environ. 2019, 650, 2605–2613. [Google Scholar] [CrossRef] [PubMed]
- Lai, S.; Zhao, Y.; Ding, A.; Zhang, Y.; Song, T.; Zheng, J.; Ho, K.; Lee, S.; Zhong, L. Characterization of PM2.5 and the major chemical components during a 1-year campaign in rural Guangzhou, Southern China. Atmos. Res. 2016, 167, 208–215. [Google Scholar] [CrossRef]
- Huang, X.; Bian, Q.; Ng, W.; Louie, P.; Yu, J. Characterization of PM2.5 major components and source investigation in suburban Hong Kong: A one year monitoring study. Aerosol Air Qual. Res. 2014, 14, 237–250. [Google Scholar] [CrossRef]
- Zheng, G.; Duan, F.; Su, H.; Ma, Y.; Cheng, Y.; Zheng, B.; Zhang, Q.; Huang, T.; Poschl, U.; Cheng, Y.; et al. Exploring the severe winter haze in Beijing: The impact of synoptic weather, regional transport and heterogeneous reactions. Atmos. Chem. Phys. 2015, 15, 2969–2983. [Google Scholar] [CrossRef]
- Lin, Y.; Hsu, S.; Chou, C.; Zhang, R.; Wu, Y.; Kao, S.; Luo, L.; Huang, C.; Lin, S.; Huang, Y.T. Wintertime haze deterioration in Beijing by industrial pollution deduced from trace metal fingerprints and enhanced health risk by heavy metals. Environ. Pollut. 2016, 208, 284–293. [Google Scholar] [CrossRef] [PubMed]
- Li, Y.; Liu, S.; Luo, L.; Yang, S.; Lu, B.; Wang, C.; Hsu, S.; Kao, S. Seasonal variations, source apportionment and dry deposition of chemical species of total suspended particulate in Pengjia Yu Island, East China Sea. Mar. Pollut. Bull. 2023, 187, 114608. [Google Scholar] [CrossRef]
- Lei, Y.; Li, D.; Lu, D.; Zhang, T.; Sun, J.; Wang, X.; Xu, H.; Shen, Z. Insights into the roles of aerosol soluble iron in secondary aerosol formation. Atmos. Environ. 2023, 294, 119507. [Google Scholar] [CrossRef]
- Karthikeyan, S.; Joshi, U.; Balasubramanian, R. Microwave assisted sample preparation for determining water-soluble fraction of trace elements in urban airborne particulate matter: Evaluation of bioavailability. Anal. Chim. Acta 2006, 576, 23–30. [Google Scholar] [CrossRef]
- Zhu, Y.; Li, W.; Lin, Q.; Yuan, Q.; Liu, L.; Zhang, J.; Zhang, Y.; Shao, L.; Niu, H.; Yang, S.; et al. Iron solubility in fine particles associated with secondary acidic aerosols in east China. Environ. Pollut. 2020, 264, 114769. [Google Scholar] [CrossRef] [PubMed]
- Wang, W.; Liu, M.; Wang, T.; Song, Y.; Zhou, L.; Cao, J.; Hu, J.; Tang, G.; Chen, Z.; Li, Z.; et al. Sulfate formation is dominated by manganese-catalyzed oxidation of SO2 on aerosol surfaces during haze events. Nat. Commun. 2021, 12, 1993. [Google Scholar] [CrossRef]
- Hsu, S.; Wong, G.; Gong, G.; Shiah, F.; Huang, Y.; Kao, S.; Tsai, F.; Lung, S.; Lin, F.; Lin, I.; et al. Sources, solubility, and dry deposition of aerosol trace elements over the East China Sea. Mar. Chem. 2010, 120, 116–127. [Google Scholar] [CrossRef]
- Luo, L.; Pan, Y.; Zhu, R.; Zhang, Z.; Zheng, N.; Liu, Y.; Liu, Y.; Liu, C.; Xiao, H.; Xiao, H. Assessment of the seasonal cycle of nitrate in PM2.5 using chemical compositions and stable nitrogen and oxygen isotopes at Nanchang, China. Atmos. Environ. 2020, 225, 117371. [Google Scholar] [CrossRef]
- Wang, Y.; Zhao, Y.; Wang, Y.; Yu, J.; Shao, J.; Liu, P.; Zhu, W.; Cheng, Z.; Li, Z.; Yan, N.; et al. Organosulfates in atmospheric aerosols in Shanghai, China: Seasonal and interannual variability, origin, and formation mechanisms. Atmos. Chem. Phys. 2021, 21, 2959–2980. [Google Scholar] [CrossRef]
- Bougiatioti, A.; Nikolaou, P.; Stavroulas, I.; Kouvarakis, G.; Weber, R.; Nenes, A.; Kanakidou, M.; Mihalopoulos, N. Particle water and pH in the eastern Mediterranean: Source variability and implications for nutrient availability. Atmos. Chem. Phys. 2016, 16, 4579–4591. [Google Scholar] [CrossRef]
- Murphy, J.; Gregoire, P.; Tevlin, A.; Wentworth, G.; Ellis, R.; Markovic, M.; VandenBoer, T. Observational constraints on particle acidity using measurements and modelling of particles and gases. Faraday Discuss. 2017, 200, 379–395. [Google Scholar] [CrossRef]
- Xu, L.; Guo, H.; Boyd, C.; Klein, M.; Bougiatioti, A.; Cerully, K.; Hite, J.; Isaacman-VanWertz, G.; Kreisberg, N.; Knote, C.; et al. Effects of anthropogenic emissions on aerosol formation from isoprene and monoterpenes in the southeastern United States. Proc. Natl. Acad. Sci. USA 2015, 112, 37–42. [Google Scholar] [CrossRef]
- Liu, M.; Song, Y.; Zhou, T.; Xu, Z.; Yan, C.; Zheng, M.; Wu, Z.; Hu, M.; Wu, Y.; Zhu, T. Fine particle pH during severe haze episodes in northern China. Geophys. Res. Lett. 2017, 44, 5213–5221. [Google Scholar] [CrossRef]
- Li, P.; Li, X.; Yang, C.; Wang, X.; Chen, J.; Collett, J., Jr. Fog water chemistry in Shanghai. Atmos. Environ. 2011, 45, 4034–4041. [Google Scholar] [CrossRef]
- Shao, J.; Chen, Q.; Wang, Y.; Lu, X.; He, P.; Sun, Y.; Shah, V.; Martin, R.; Philip, S.; Song, S.; et al. Heterogeneous sulfate aerosol formation mechanisms during wintertime Chinese haze events: Air quality model assessment using observations of sulfate oxygen isotopes in Beijing. Atmos. Chem. Phys. 2019, 19, 6107–6123. [Google Scholar] [CrossRef]
- Liu, T.; Clegg, S.; Abbatt, J. Fast oxidation of sulfur dioxide by hydrogen peroxide in deliquesced aerosol particles. Proc. Natl. Acad. Sci. USA 2020, 117, 1354–1359. [Google Scholar] [CrossRef] [PubMed]
- Chen, T.; Chu, B.; Ge, Y.; Zhang, S.; Ma, Q.; He, H.; Li, S. Enhancement of aqueous sulfate formation by the coexistence of NO2/NH3 under high ionic strengths in aerosol water. Environ. Pollut. 2019, 252, 236–244. [Google Scholar] [CrossRef] [PubMed]
- Nash, T. The effect of nitrogen dioxide and of some transition metals on the oxidation of dilute bisulphite solutions. Atmos. Environ. (1967) 1979, 13, 1149–1154. [Google Scholar] [CrossRef]
- Liu, T.; Abbatt, J. Oxidation of sulfur dioxide by nitrogen dioxide accelerated at the interface of deliquesced aerosol particles. Nat. Chem. 2021, 13, 1173–1177. [Google Scholar] [CrossRef] [PubMed]
- Guieu, C.; Duce, R.; Arimoto, R. Dissolved input of manganese to the ocean: Aerosol source. J. Geophys. Res. Atmos. 1994, 99, 18789–18800. [Google Scholar] [CrossRef]
- Mackie, D.; Boyd, P.; Hunter, K.; McTainsh, G. Simulating the cloud processing of iron in Australian dust: pH and dust concentration. Geophys. Res. Lett. 2005, 32, L06809. [Google Scholar] [CrossRef]
- Wang, S.; Wang, L.; Fan, X.; Wang, N.; Ma, S.; Zhang, R. Formation pathway of secondary inorganic aerosol and its influencing factors in Northern China: Comparison between urban and rural sites. Sci. Total Environ. 2022, 840, 156404. [Google Scholar] [CrossRef] [PubMed]
- Ye, C.; Liu, P.; Ma, Z.; Xue, C.; Zhang, C.; Zhang, Y.; Liu, J.; Liu, C.; Sun, X.; Mu, Y. High H2O2 concentrations observed during haze periods during the winter in Beijing: Importance of H2O2 oxidation in sulfate formation. Environ. Sci. Technol. Lett. 2018, 5, 757–763. [Google Scholar] [CrossRef]
- Xue, J.; Yu, X.; Yuan, Z.; Griffith, S.; Lau, A.; Seinfeld, J.; Yu, J. Efficient control of atmospheric sulfate production based on three formation regimes. Nat. Geosci. 2019, 12, 977–982. [Google Scholar] [CrossRef]
- Yang, J.; Wang, S.; Zhang, R.; Yin, S. Elevated particle acidity enhanced the sulfate formation during the COVID-19 pandemic in Zhengzhou, China. Environ. Pollut. 2022, 296, 118716. [Google Scholar] [CrossRef]
- Denbigh, K. The Principles of Chemical Equilibrium: With Applications in Chemistry and Chemical Engineering, 4th ed.; Cambridge University Press: Cambridge, UK, 1981. [Google Scholar] [CrossRef]
- Herrmann, H. Kinetics of aqueous phase reactions relevant for atmospheric chemistry. Chem. Rev. 2003, 103, 4691–4716. [Google Scholar] [CrossRef]
- Maaß, F.; Elias, H.; Wannowius, K. Kinetics of the oxidation of hydrogen sulfite by hydrogen peroxide in aqueous solution: Ionic strength effects and temperature dependence. Atmos. Environ. 1999, 33, 4413–4419. [Google Scholar] [CrossRef]
- Lagrange, J.; Pallares, C.; Lagrange, P. Electrolyte effects on aqueous atmospheric oxidation of sulphur dioxide by ozone. J. Geophys. Res. Atmos. 1994, 99, 14595–14600. [Google Scholar] [CrossRef]
- Martin, L.; Hill, M. The iron catalyzed oxidation of sulfur: Reconciliation of the literature rates. Atmos. Environ. 1967, 21, 1487–1490. [Google Scholar] [CrossRef]
- Martin, L.; Hill, M.; Tai, A.; Good, T. The iron catalyzed oxidation of sulfur(IV) in aqueous solution: Differing effects of organics at high and low pH. J. Geophys. Res. Atmos. 1991, 96, 3085–3097. [Google Scholar] [CrossRef]
- Siefert, R.; Johansen, A.M.; Hoffmann, M.; Pehkonen, S. Measurements of trace metal (Fe, Cu, Mn, Cr) oxidation states in fog and stratus clouds. J. Air Waste Manag. Assoc. 1998, 48, 128–143. [Google Scholar] [CrossRef]
- Graedel, T.; Weschler, C. Chemistry within aqueous atmospheric aerosols and raindrops. Rev. Geophys. 1981, 19, 505–539. [Google Scholar] [CrossRef]
- Martin, L.; Hill, M. The effect of ionic strength on the manganese catalyzed oxidation of sulfur(IV). Atmos. Environ. 1987, 21, 2267–2270. [Google Scholar] [CrossRef]
- Jacob, D. Heterogeneous chemistry and tropospheric ozone. Atmos. Environ. 2000, 34, 2131–2159. [Google Scholar] [CrossRef]
- Zhang, Y.; Ma, Y.; Zeng, L.; Shao, K.; Qi, B. Study of atmospheric peroxides in Guangzhou city. China Environ. Sci. 2001, 21, 221–225. (In Chinese) [Google Scholar]
- Peng, Y.; Chen, K.; Lai, C.; Lu, P.; Kao, J.H. Concentrations of H2O2 and HNO3 and O3–VOC–NOx sensitivity in ambient air in southern Taiwan. Atmos. Environ. 2006, 40, 6741–6751. [Google Scholar] [CrossRef]
- Hua, W.; Chen, Z.; Jie, C.; Kondo, Y.; Hofzumahaus, A.; Takegawa, N.; Chang, C.; Lu, K.; Miyazaki, Y.; Kita, K.; et al. Atmospheric hydrogen peroxide and organic hydroperoxides during PRIDE-PRD’06, China: Their concentration, formation mechanism and contribution to secondary aerosols. Atmos. Chem. Phys. 2008, 8, 6755–6773. [Google Scholar] [CrossRef]
- Guo, J.; Tilgner, A.; Yeung, C.; Wang, Z.; Louie, P.; Luk, C.; Xu, Z.; Yuan, C.; Gao, Y.; Poon, S.; et al. Atmospheric peroxides in a polluted subtropical environment: Seasonal variation, sources and sinks, and importance of heterogeneous processes. Environ. Sci. Technol. 2014, 48, 1443–1450. [Google Scholar] [CrossRef] [PubMed]
Disclaimer/Publisher’s Note: The statements, opinions and data contained in all publications are solely those of the individual author(s) and contributor(s) and not of MDPI and/or the editor(s). MDPI and/or the editor(s) disclaim responsibility for any injury to people or property resulting from any ideas, methods, instructions or products referred to in the content. |
© 2024 by the authors. Licensee MDPI, Basel, Switzerland. This article is an open access article distributed under the terms and conditions of the Creative Commons Attribution (CC BY) license (https://creativecommons.org/licenses/by/4.0/).