Abstract
The present study investigated the degradation of an aqueous Allura Red AC (AR–AC) solution by activating hydrogen peroxide with bicarbonate using cobalt ion (Co2+) as the catalyst. Four independent variables (H2O2, NaHCO3, Co2+, and dye concentrations) were analyzed in the composite central design (CCD). AR–AC degradation was optimized using the response surface methodology (RSM). Under optimal degradation conditions (41.86 mg/L AR–AC, 5.58 mM H2O2, 2.00 mM NaHCO3, and 9.00 µM Co2+), decolorization > 99.86%, mineralization (CO2 to conversion) of 12.99%, and total nitrogen removal of 51.97% were achieved. The predicted values for the three response variables were consistent with the experimental values, with determination coefficients (R2) greater than 0.9053. Because cobalt ions (Co2+) are a source of water pollution, after oxidation, these were adsorbed on sodium bentonite (Na–Bent), obtaining a final concentration of <0.01 mg/L. Bicarbonate-activated hydrogen peroxide is a potential technology for dye wastewater treatment that operates at an alkaline pH and at ambient temperature.
1. Introduction
Globally, the textile industry generates around $1 trillion annually and comprises 7% of all exports [1,2]. Color is often the first perceived pollutant in wastewater [3], and the discharge of untreated effluents into water bodies is the primary environmental impact that the textile industry causes [2]. Textile dyes are organic substances that absorb light radiation in the visible spectrum range (from 380 to 750 nm) and reflect or diffuse complementary radiation by certain groups of atoms called chromophores [4,5]. Textile dyes are classified based on their chemical structure or the application method to different substrates [4]. Due to the different chemical structures of dyes, they have been classified into eight main categories: azo, anthraquinone, indigo, triarylmethane, heterocyclic, cyanine, sulfur, and phthalocyanine [6]. Depending on the solubility of the dye in the dye bath, these can be classified into soluble and water-insoluble dyes, a characteristic related to their affinity for the different fibers and the nature of the fixation [4,7,8]. Water soluble dyes can be acidic or anionic, basic or cationic, metalliferous, reactive, and direct [4].
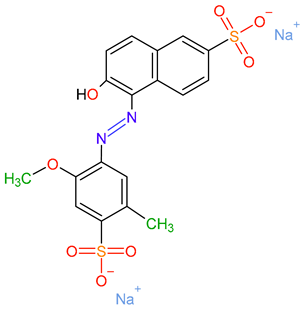
Azo dyes represent 60–70% of all dyes and are most often used in the food and textile industries [9,10,11]. These dyes have one or more –N=N– functional groups attached to benzene or naphthalene rings, with –OH and –SO3H substituents, which makes them very soluble in water, chemically stable, and resistant to biodegradation [12,13,14]. Allura Red AC (AR–AC, C18H14N2Na2O8S2) is an azo dye that is anionic and widely used in the food, pharmaceutical and cosmetic industries. This dye is added to yogurts, confectionery, cereals, bakery products, ice cream, and medicines [15]. Red No. 40 is the name given to this dye in the textile industry, where it is used to color acrylic yarn.
Wastewaters from the textile industry contain a high degree of coloration and relatively high levels of biochemical oxygen demand (BOD) and chemical oxygen demand (COD) [2,4]. Most textile dyes in wastewater are non-biodegradable organic compounds, and their high solubility in water makes it difficult to remove them by conventional methods [2,16]. Textile dyes are highly toxic and potentially carcinogenic [17], associated with various diseases in animals and humans [18].
Different techniques have been used for the elimination/degradation of water polluted with azo dyes, such as adsorption [19], membrane separation [20], ozonation [21], electrochemical treatments [22,23], and advanced oxidation processes (AOPs) [24,25,26,27]. It is important to highlight the use of nanomaterials as catalysts in AOPs for water pollution [28]. For the analysis and modeling of AOPs and electrochemical processes for application in water and wastewater treatment, response surface methodology (RSM) has been successfully utilized [23,29,30].
The use of bicarbonate ions (HCO3−) in AOPs for water treatment has become an emerging technology known as BAP, for its acronym bicarbonate-activated peroxide [31,32]. More reactive oxygen species (ROS) are generated in the BAP system than in conventional AOPs, including peroxymonocarbonate ions (HCO4−), superoxide ions (), singlet oxygen (1O2), and carbonate radical anions () [32]. An advantage of the BAP system is that the bicarbonate ion in an aqueous media forms a buffer solution, with a pH close to neutral or slightly alkaline [32,33].
Oxidation processes based on H2O2 activation with NaHCO3 have shown excellent results in the treatment of colored effluents [31,34], especially those that are cobalt-catalyzed, both in homogeneous [35,36,37,38,39,40] and heterogeneous [41,42,43,44] phases. With the Co2+–HCO3−–H2O2 system, rapid and nearly complete decolorization of methylene blue [35,38], reactive brilliant red X–3B [36], orange II [37,39], and Ponceau 4R [40] has been achieved. However, total organic carbon (TOC) removals have been low, between 13.9 and 19.0%, with the exception of orange II, for which a mineralization of 45.3% has been achieved [39]. So far, only one study has evaluated the optimization of the catalytic decolorization of Ponceau 4R in an aqueous solution using the BAP system with cobalt ions in a homogeneous medium (Co2+–BAP). Although the degree of mineralization was quantified for the maximum decolorization condition, this variable was not optimized [40]. The BAP system has been recently applied to treat industrial tannery wastewater, and the response surface methodology was used to optimize this process. Although a catalyst was not used in these studies, high color and ammoniacal nitrogen (N−NH3) removals and, to a lesser extent, COD and TOC reductions were obtained [45,46]. Given the complexity of the wastewater to be treated and the high organic matter content, reaction temperatures between 57 and 60 °C were required, which could be a limitation for the scaling of the process due to the energy costs for heating.
In the present study, the degradation of Allura Red AC in an aqueous solution was studied at 25 °C, activating H2O2 with NaHCO3 and using cobalt ions in solution (Co2+) as the oxidation reaction catalyst. The two BAP processes that employed response surface methodology to optimize the degradation of industrial tannery wastewater increased the reaction temperature above 50 °C to improve degradation. In contrast, dye oxidation was performed at 25 °C in this study. Because Co2+–BAP oxidation tests are usually performed at specific reagent concentrations, this is the first study focused on multi-objective optimization for azo-dye degradation with the bicarbonate-activated peroxide system. Four independent variables (H2O2, NaHCO3, Co2+, and dye concentrations) were analyzed, and response surface methodology (RSM) based on central composite design (CCD) was used to optimize three response variables (decolorization, mineralization, and total nitrogen removal). Because the cobalt ions used as catalysts in the reaction are a source of water pollution, the post-oxidation adsorption of Co2+ using sodium bentonite was evaluated to make the process environmentally friendly.
2. Materials and Methods
2.1. Reagents
All reagents used in the oxidation reaction, NaHCO3 (≥99.7%), H2O2 (30%) and, CoCl2·6H2O (≥98%), were of analytical grade, obtained from Merck KGaA (Darmstadt, Germany). Allure Red AC (disodium salt of 6–hydroxy–5–[(2–methoxy–5–methyl–4sulfophenyl) azo]–2–naphthalenesulfonic acid) an industrial grade reagent (86% purity, 14% NaCl and NaSO4 combined) was purchased from Retema S.A.S., Colombia. Table 1 shows Allure Red AC’s characteristics and chemical structure [15].

Table 1.
Characteristics and chemical structure of Allura Red AC.
The clay used as adsorbent material corresponded to Colombian bentonite, previously characterized [47]. The clay fraction (<2 μm) was obtained by conventional sedimentation, then exchanged twice with 1.0 M NaCl (≥99.5%, PanReac AppliChem, Barcelona, Spain). The purified sodium bentonite (denoted Na–Bent) has a cation exchange capacity (CEC) of 63.02 cmol(+)/kg [43].
2.2. Analysis Methods
The AR–AC dye concentration was analyzed on a UV–Vis spectrometer (Genesys 150, Thermo Scientific, Madison, WI, USA) at 504 nm by measuring the absorbance of the samples (0.75 mL of sample filtered on 0.45 μm millipore membrane). The degradation efficiency of AR–AC was calculated as decolorization using Equation (1):
where and represent the initial and remaining AR–AC concentrations at given time (t), respectively.
The mineralization and removal of total nitrogen (TN) from the AR–AC solution were monitored through the diminution in the concentration of total organic carbon (TOC) and TN at the beginning and at the end of the reaction, measured on a Multi N/C Analyzer 3100 (Analytik Jena, Thuringia, Germany) equipped with a non-dispersive infrared (NDIR) detector for TOC and, with a chemiluminescence detector (CLD), for TN. Mineralization and TN removal were determined by Equations (2) and (3):
where , , and are the TOC and TN concentrations at the beginning and end of the reaction.
Post-oxidation cobalt ion adsorption experiments were performed using the batch method. For this purpose, 50 mg of clay were mixed with 200 mL of the aqueous solution (after oxidation with the Co2+–BAP system at the optimization conditions). The suspension was stirred for 2 h at 300 rpm at 25 °C. The adsorbent was separated by centrifugation, and the supernatant solution was filtered on a 0.45 μm membrane. Then, the cobalt concentration was quantified through atomic adsorption. The cobalt concentration in the aqueous solution was determined by atomic absorption spectrometry (Thermo iCE 3000 Series, Thermo Fisher Scientific, Waltham, MA, USA) using air/acetylene flame. The Linde Group, Colombia, supplied air (99.99%) and acetylene (99.5%).
2.3. Experimental Design-Catalytic Tests
RSM is an efficient statistical technique for the optimization of multiple variables with the minimum number of experiments [48,49]. Among the different designs by RSM are included three-level factorial design, central composite design (CCD), Box-Behnken, and D-optimal designs [48]. CCD is the most frequently used response surface-designed experiment to analyze the effect of independent variables on system response [50,51]. CCD designs start from a factorial or fractional factorial design with central points before axial points (also called star points) are added to estimate the curvature of the RSM by optimizing an objective function [52].The oxidation experiments were designed and analyzed by Design Expert 8.0 software (StatEase, Inc., Minneapolis, MN, USA). The effect of four independent variables (H2O2, NaHCO3, Co2+ and dye concentrations) on dye degradation was evaluated by using a CCD. Table 2 shows the variables converted to coded values of X1, X2, X3, and X4 at five levels of −1.682, −1, 0, +1, and +1.682. It should be noted that the levels of variables were selected based on the results of the previous tests. Response variables were decolorization (Y1), mineralization (Y2), and total nitrogen removal (Y3). The experimental design consisted of a total of 36 runs, with duplicates at the axial points and four replicates at the central points.

Table 2.
Independent variables, their coded levels and actual values.
All oxidation tests were performed experimentally at a laboratory scale. Reactions were carried out in a batch glass reactor connected to a thermostatic bath regulated at 25 ± 0.2 °C. The reactor was charged with 300 mL of AR–AC solution for each test, specific amounts of Cl2Co·6H2O (a source of Co2+ ions), and NaHCO3, under continuous magnetic stirring at 300 rpm. When H2O2 was added, the reaction started (t = 0). Using the desirability function, the factors (variables) allowing for the obtainment of the maximum degradation of AR–AC were optimized.
3. Results and Discussion
3.1. Experimental Design, Analysis of Variance and Optimization
The simple effects and interactions of the operating variables on the degradation of the Allura Red AC by Co2+–BAP system were analyzed using RSM based on a CCD design. The stages considered for the analysis and optimization of the degradation of the dye were the following [53,54]: random performance of the experimental runs of the design, selection of the mathematical model (linear, quadratic, cubic) for adjustment of experimental data and analysis of variance, analysis of the models using contour plots, and validation of the experimental models and optimization of the process.
Experimental values of the runs carried out in the experimental design and responses observed for 36 experiments are shown in Table 3. The decolorization analysis was performed for t = 20 min because of the 3 h duration of the reaction and color removals in all of the tests were higher than 83.10%. Because the lack-of-fit test showed that the model was inadequate to predict color removals at 3 h (p-value < 0.05), the effects of each factor or their interactions on AR–AC removal were not analyzed. Considering the quantification limit of the dye (0.060 mg/L), the maximum removal obtained in the experimental tests varied between 99.74 and 99.88%, depending on the initial concentration of the dye.

Table 3.
Central composite design experiments and experimental results.
A multiple regression analysis was performed, and response functions were fitted to second-order polynomial equations (suggested by software) to determine the coefficients of the response models and their significance. Analysis of variance (ANOVA) values for the quadratic regression models obtained from CCD in the dye degradation are listed in Table 4, Table 5 and Table 6. A model is considered significant if the p-value < 0.05. For this study, the three models showed p < 0.0001, indicating that such models were highly significant and could be used to predict the response functions accurately.

Table 4.
ANOVA regression model for AR–AC decolorization.

Table 5.
ANOVA regression model for AR–AC mineralization.

Table 6.
ANOVA regression model for total nitrogen removal.
The fitting quality of models was evaluated by the coefficients of determination (R2). If the difference between the “Adjusted R2” and the “Predicted R2” was less than 0.2, then both were reasonably in agreement [55,56]. Additionally, when “Adequate Precision” measured the signal-to-noise ratio, a value greater than 4 became desirable [56,57]. ANOVA results in this study show high R2 values for decolorization, mineralization and TN removal (0.9826, 0.9370 and 0.9053, respectively). Differences between the Adjusted R2 and Predicted R2 were 0.0340–0.1038, indicating the applicability of the quadratic models. In addition, “Adequate Precision” compares the range of predicted values at the design points with the mean prediction error and, for the three response variables analyzed, those values ranked between 14.202 and 29.684, indicating the adequate discrimination of the models.
The concept of “Lack of fit” is essential in regression analysis as it indicates whether the relationship between independent variables and response variables is adequate. Lack of fit can occur when the model does not include interaction or quadratic terms. The “Lack of fit p-value” of 0.1022 (decolorization), 0.1092 (mineralization), and 0.9420 (TN removal) suggests that the lack of fit was not significantly relative to the pure error. Adequacy verification of the proposed models was an important step of the analysis procedure. Plots of the “Actual and Predicted” values, “Residuals vs. Run” and “Residuals vs. Predicted” for the three response variables are shown in Figures S1–S9 of the Supplementary Material.
Response functions with significant coefficients for decolorization (Y1), mineralization (Y2) and TN removal (Y3) are presented in Equations (4)–(6):
Y1 (%) = −17.9884 + 18.0584X1 + 5.0817X2 + 14.7648X3 + 0.5922X4 + 0.1303X3X4 − 1.7103X12 − 1.0401X32 − 0.0193X42
Y2 (%) = −30.5381 + 2.2591X1 + 2.8234X2 + 3.0463X3 − 0.2171X1X2 − 0.2216X2X3 − 0.2450X22 − 0.1219X32 − 0.0108X42
Y3 (%) = −40.1250 − 2.9811X1 − 0.5745X2 + 2.9398X4 − 0.0827X2X4 − 0.1876X32 − 0.0217X42
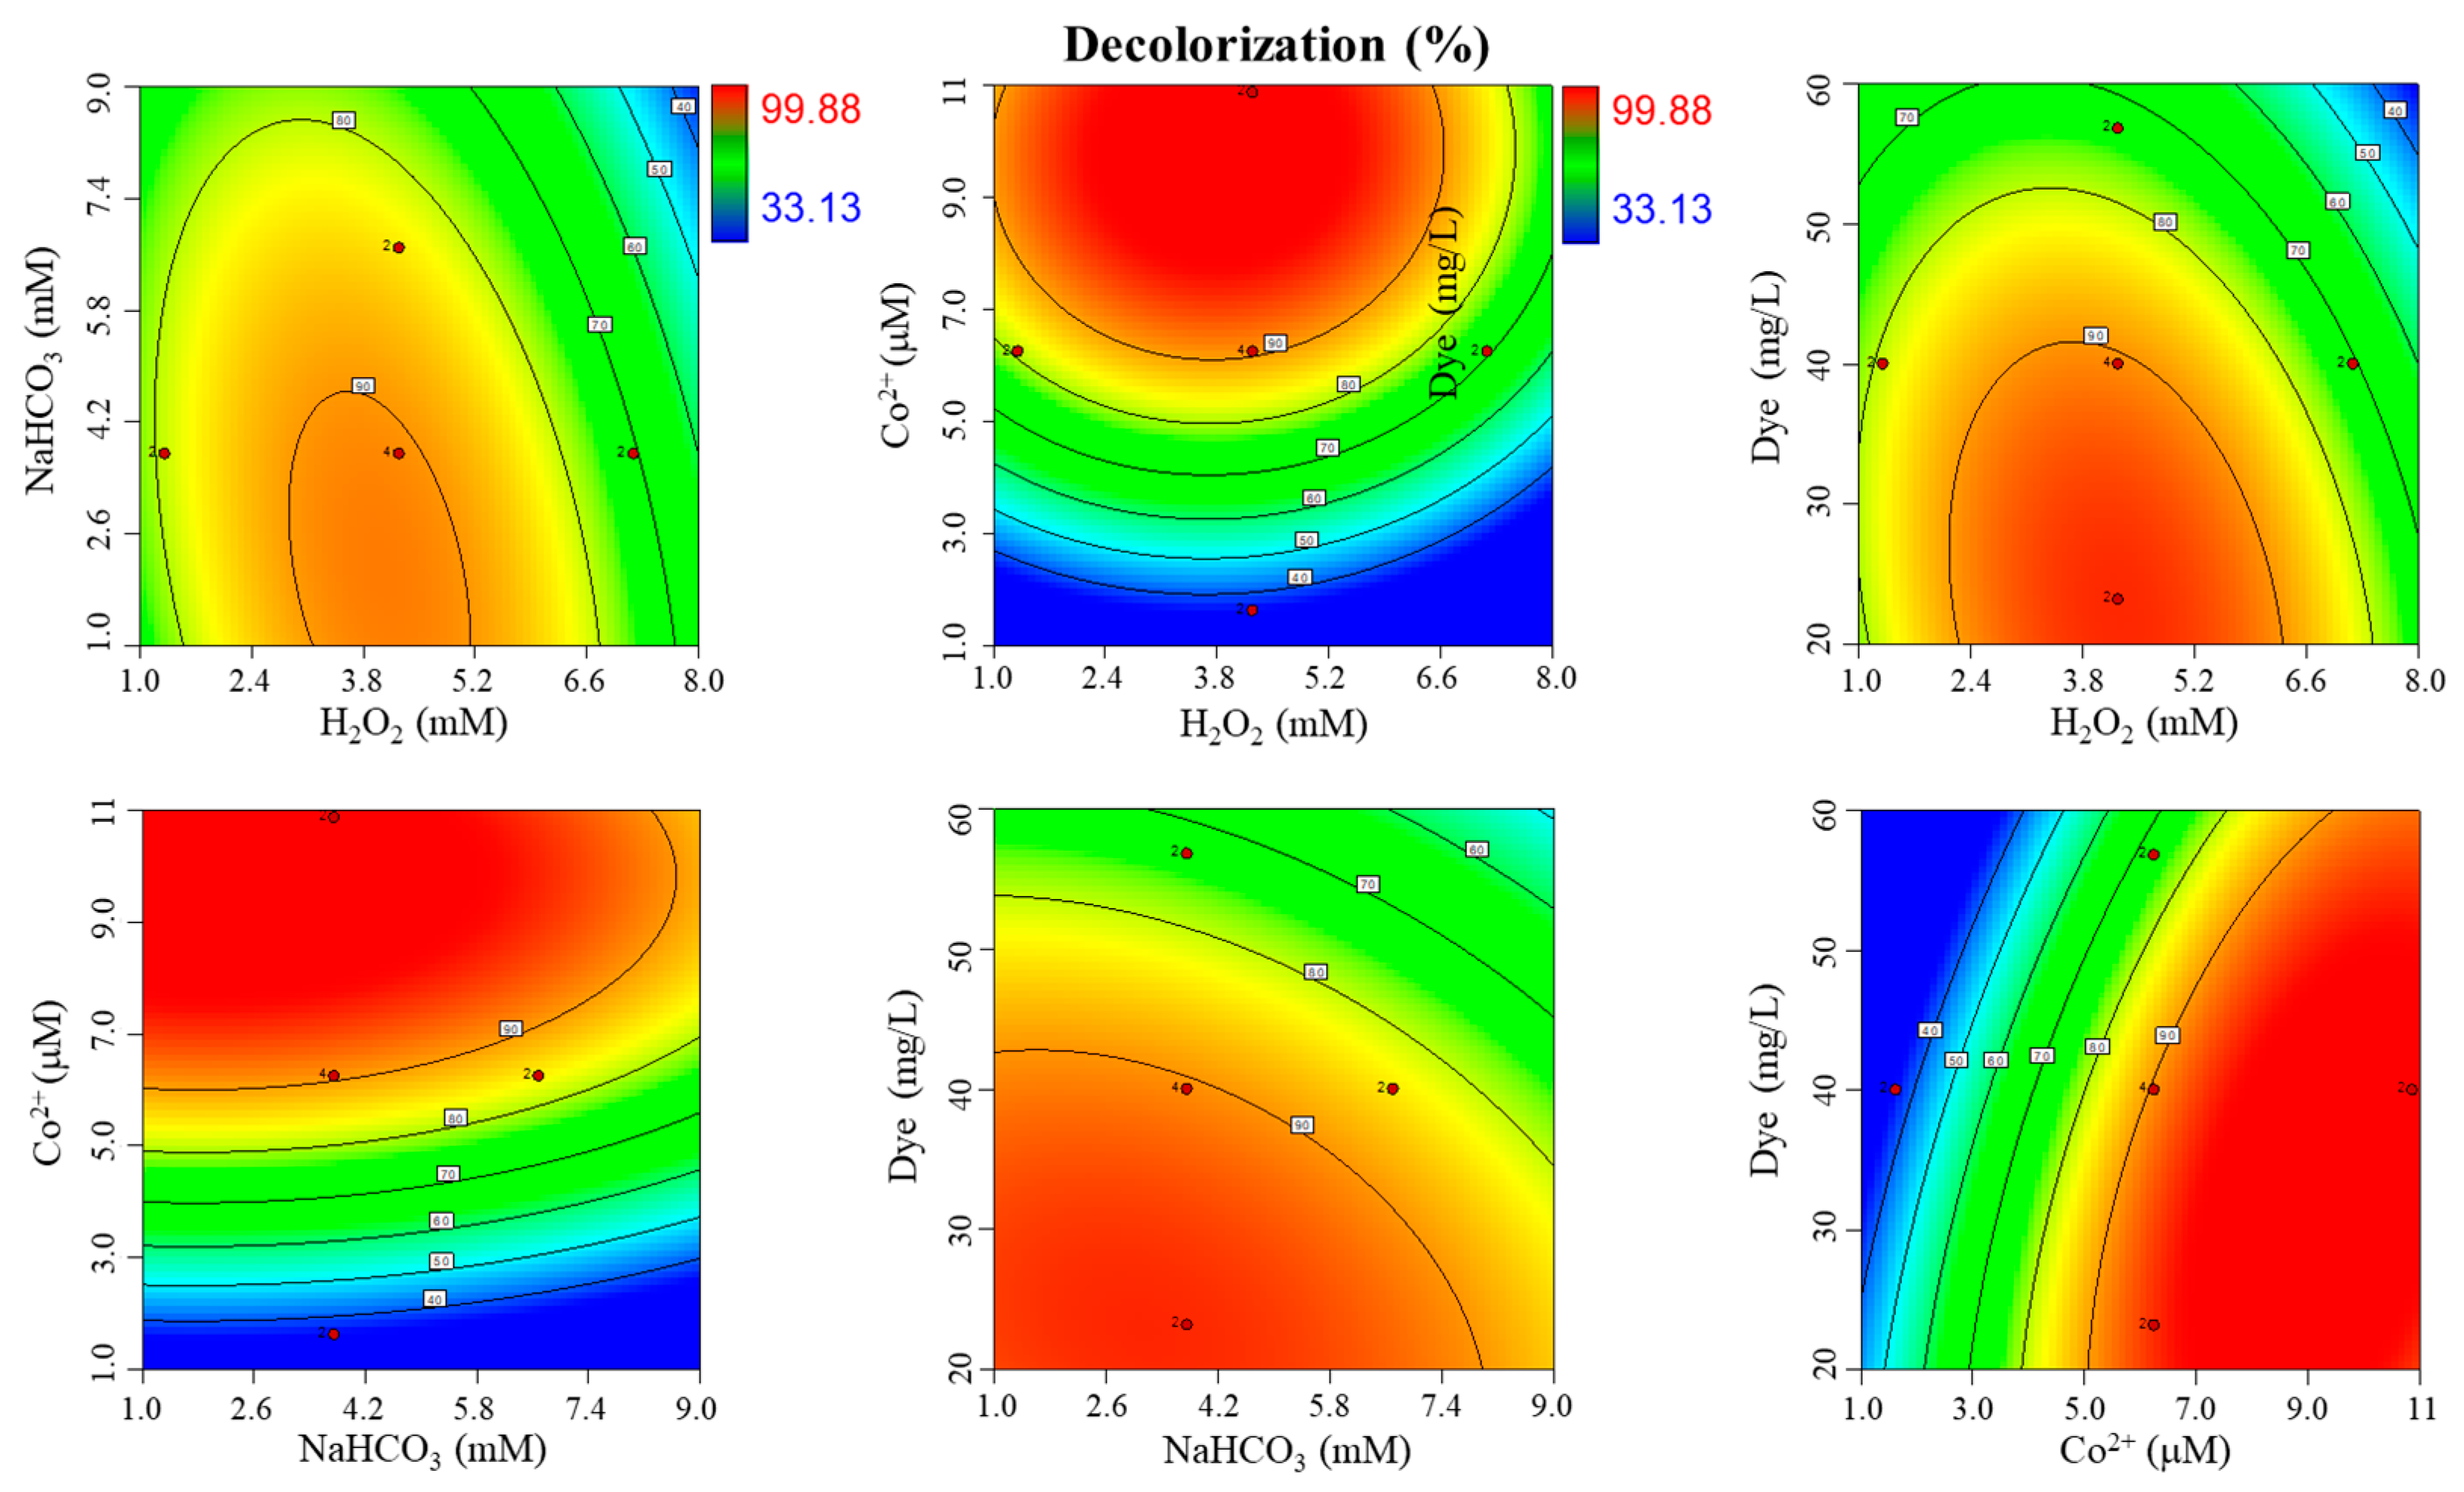
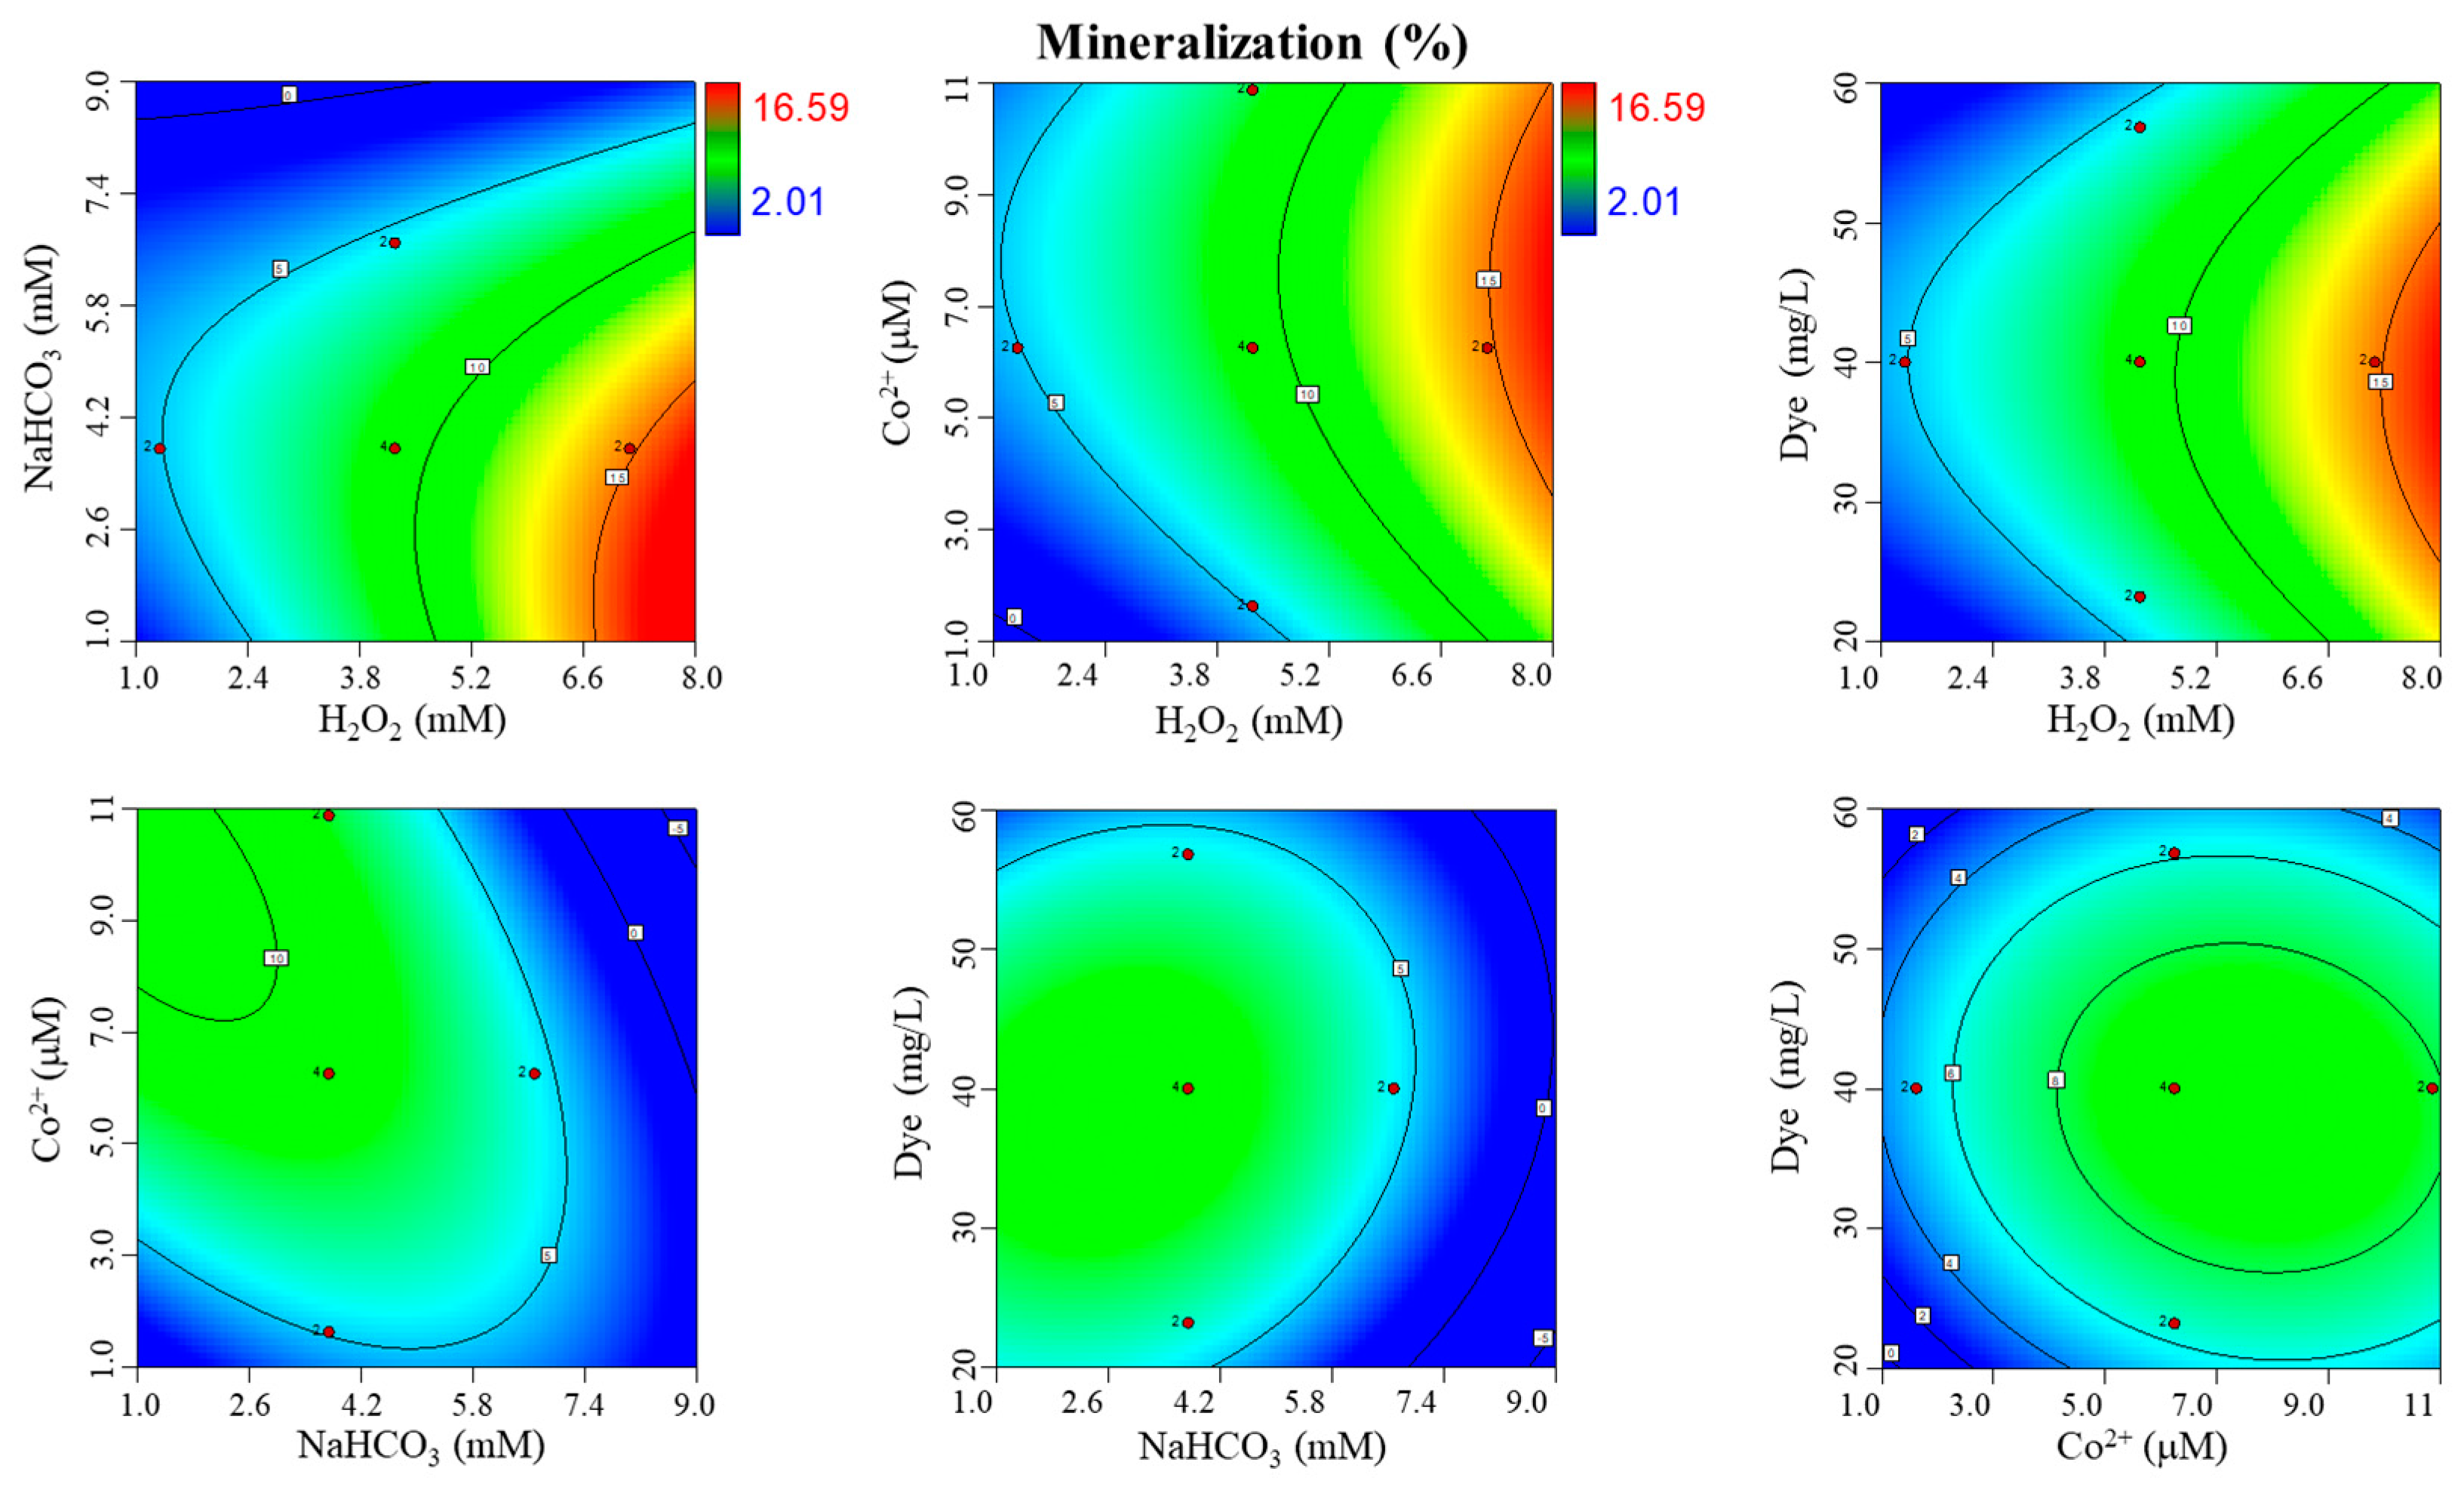
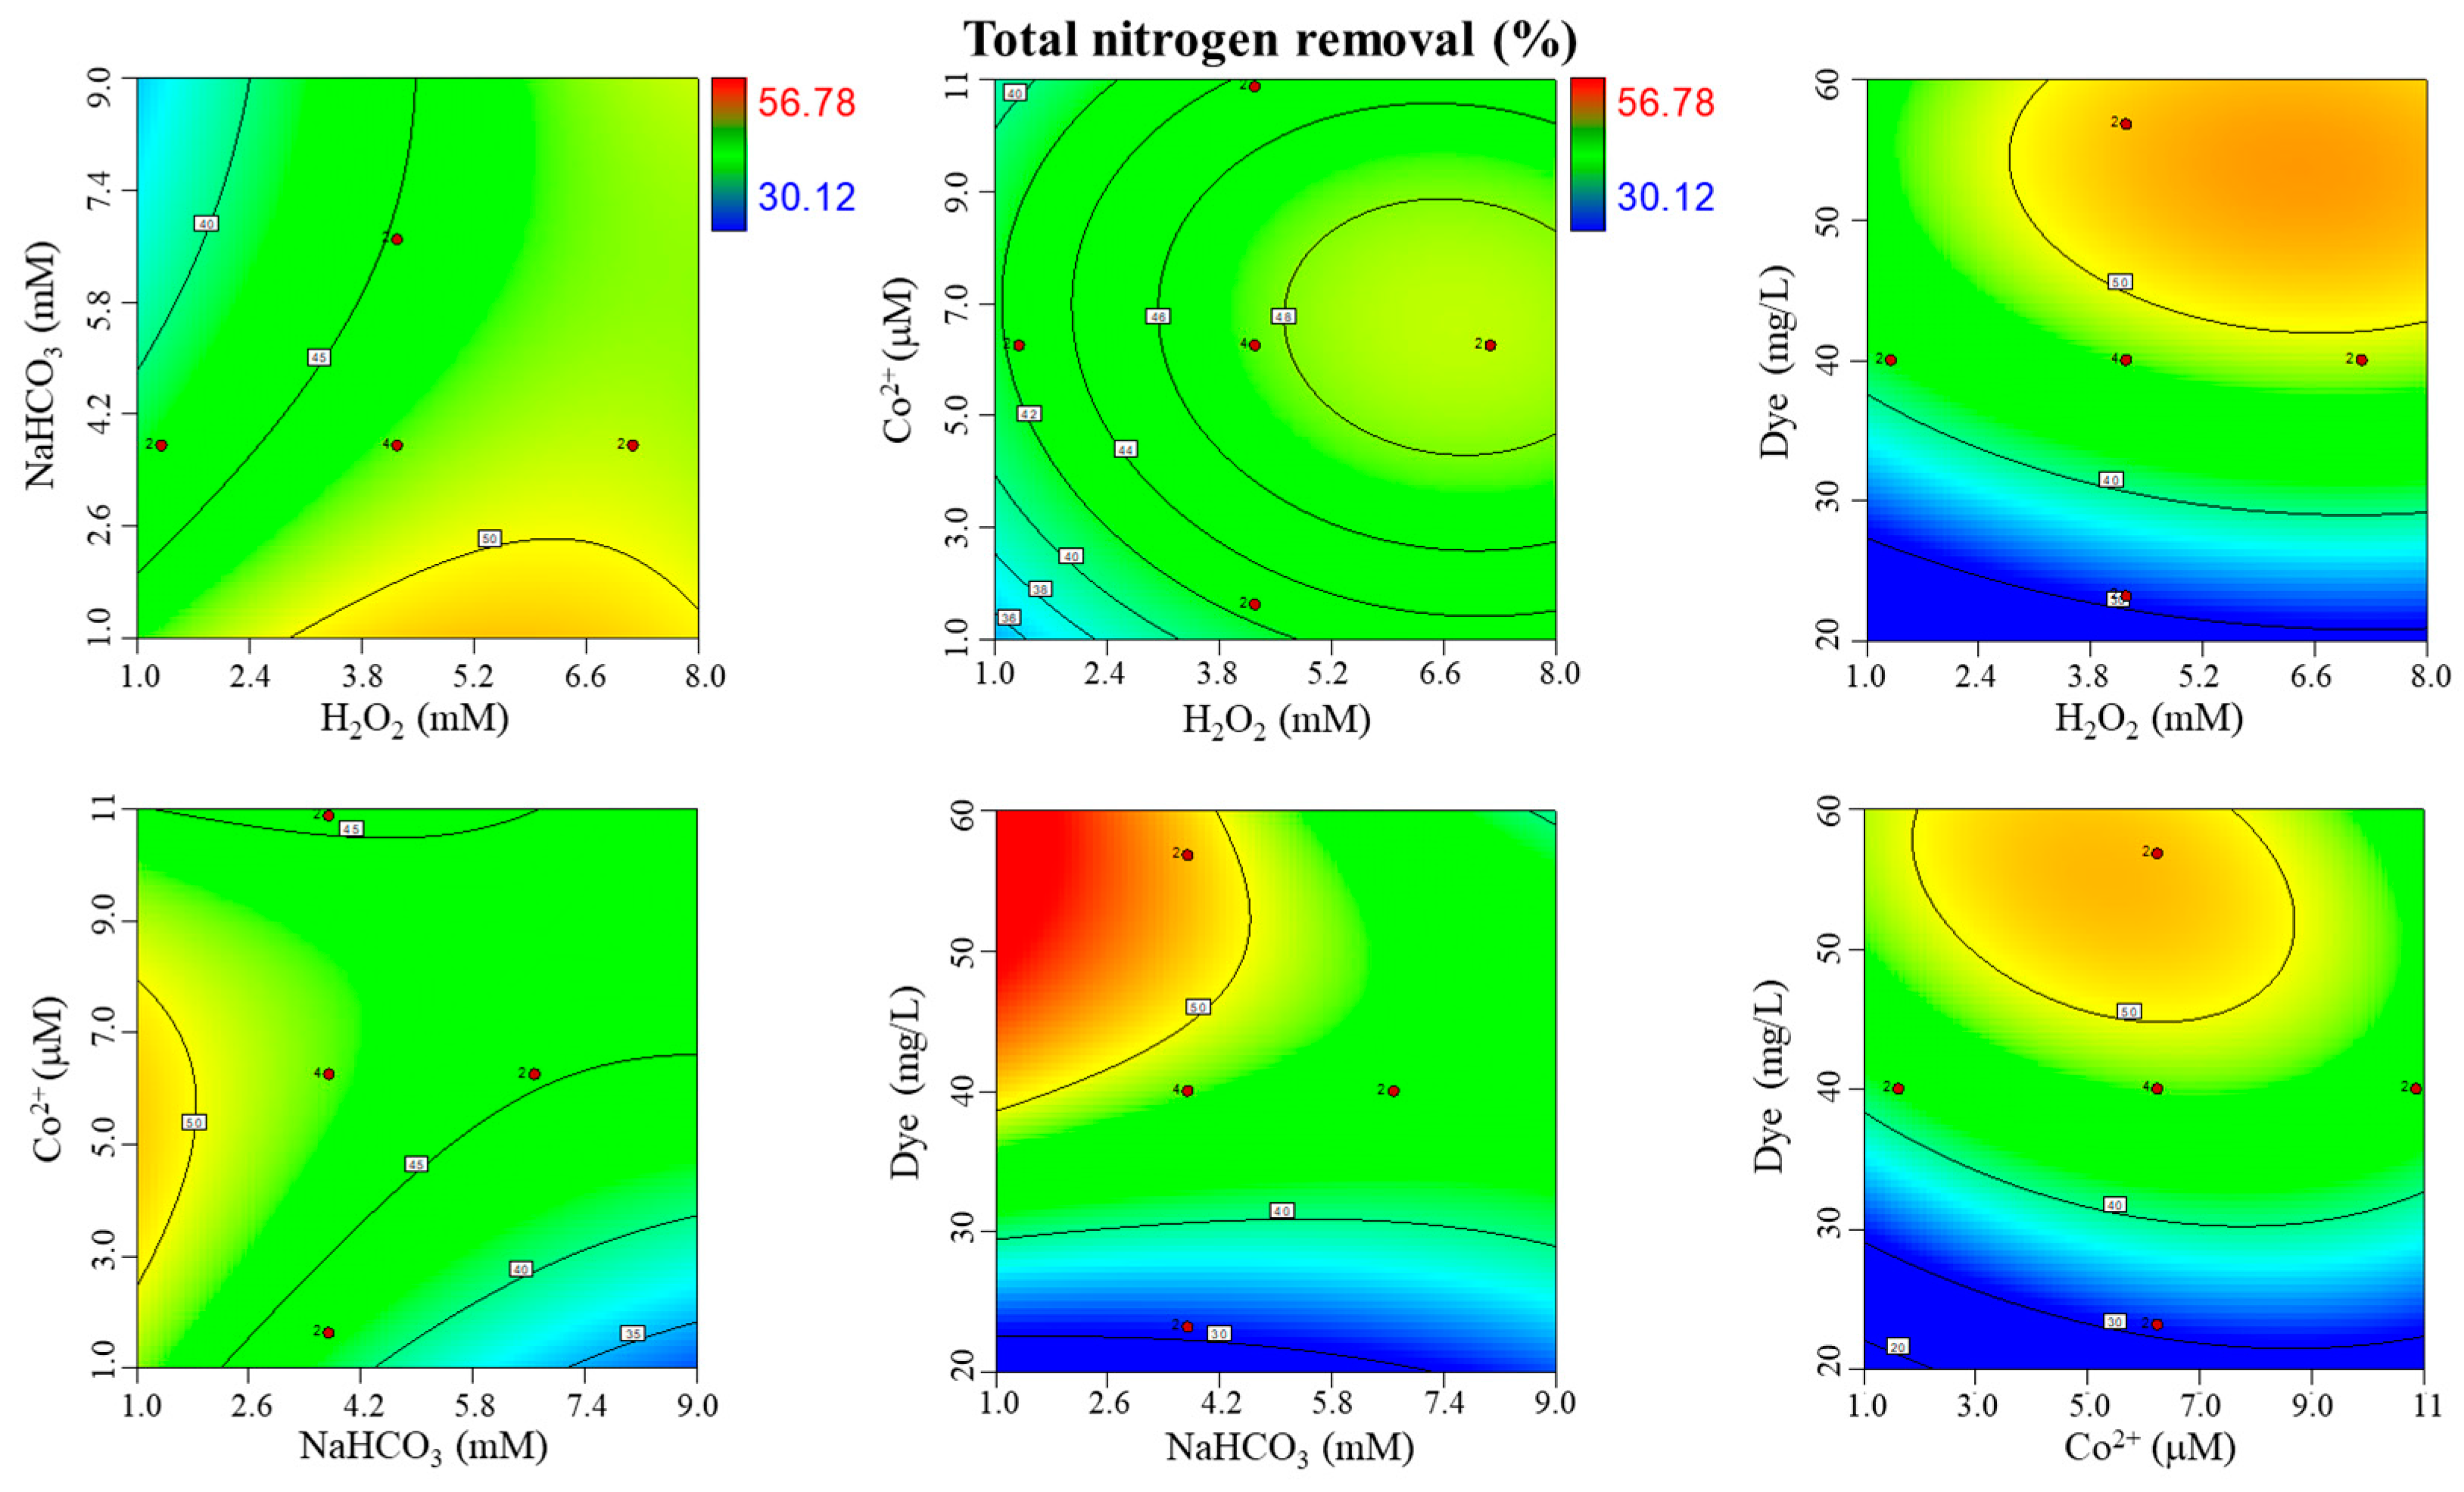
To analyze the integrated effect of independent variables on the dye degradation, contour plots of responses predicted by the models were obtained as follows: Figure 1 (decolorization), Figure 2 (mineralization) and Figure 3 (TN removal). The small ellipses on the contour surfaces indicate the maximum predicted value, while the other two test variables remain at their respective central levels. The contour surface presents an elliptical shape for some interactions (see Figure 1), indicating a maximum response. The highest decolorization (>99.85) was obtained at medium concentrations of H2O2 and NaHCO3, maximum catalyst concentrations (Co2+) and minimum dye concentration. The range of the independent variables for the mineralization response variable only shows a part of the elliptical contour (see Figure 2). The highest level of mineralization was achieved at the maximum concentration of H2O2 and medium concentrations of NaHCO3, catalyst (Co2+), and colorant. The highest nitrogen removal was achieved at H2O2, NaHCO3 and Co2+ concentrations near the central points, and at the maximum dye concentration (see Figure 3). However, no defined maximum response zone was obtained in the range of variables analyzed for TN removal. The differences between the high degrees of decolorization and the low mineralization of the dye suggest that the reactive oxygen species generated during the oxidation reaction broke the chromophore group (–N=N–) [58]. However, only a small fraction of the intermediates was transformed into CO2 and H2O. This result confirms the recalcitrant character of the azo dye Allura Red AC. In all oxidation tests of the experimental design, TN removal was superior to mineralization (TOC removal), suggesting that an important fraction of the nitrogenous compounds was degraded to N2 or NH4+ [59,60].
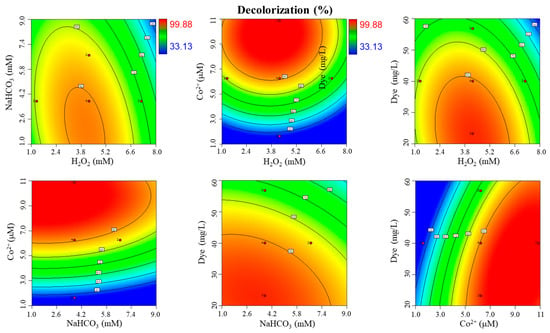
Figure 1.
Contour plots for AR–AC decolorization using the Co2+–BAP system.
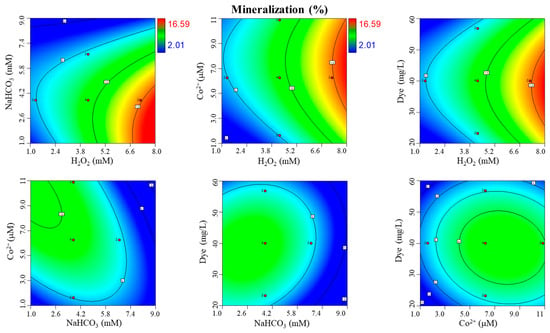
Figure 2.
Contour plots for AR–AC mineralization using the Co2+–BAP system.
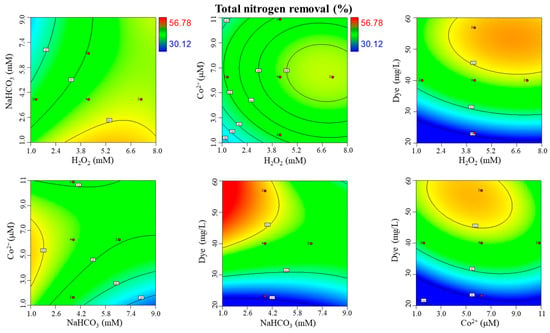
Figure 3.
Contour plots for TN removal using the Co2+–BAP system.
In general, conditions favoring decolorization differed from those obtained for mineralization and TN removal. However, a shared variable favoring all three response variables is the median NaHCO3 concentration. The highest mineralization levels were achieved with an H2O2/NaHCO3 molar ratio of 1.9 and average Co2+ concentrations (6.25 mM).
The amount of H2O2 used in the degradation of the dye can be expressed as a function of the stoichiometric dose (SD) required to completely oxidize one mole of Allura Red AC to CO2 and H2O, according to Equation (7):
In the experimental design, H2O2 amounts between 0.35 and 2.11 times the stoichiometric dosage were used, and the highest degradation was obtained with a stoichiometric ratio of 1.94. For this axial point of the design, decolorization greater than 99.74%, mineralization of 6.72%, and total nitrogen removal of 31.57% were obtained. The amount of H2O2 required to oxidize an azo dye depends on the structure and concentration of compounds, so an excess concerning the stoichiometric dose becomes generally applicable in advanced oxidation processes [61,62].
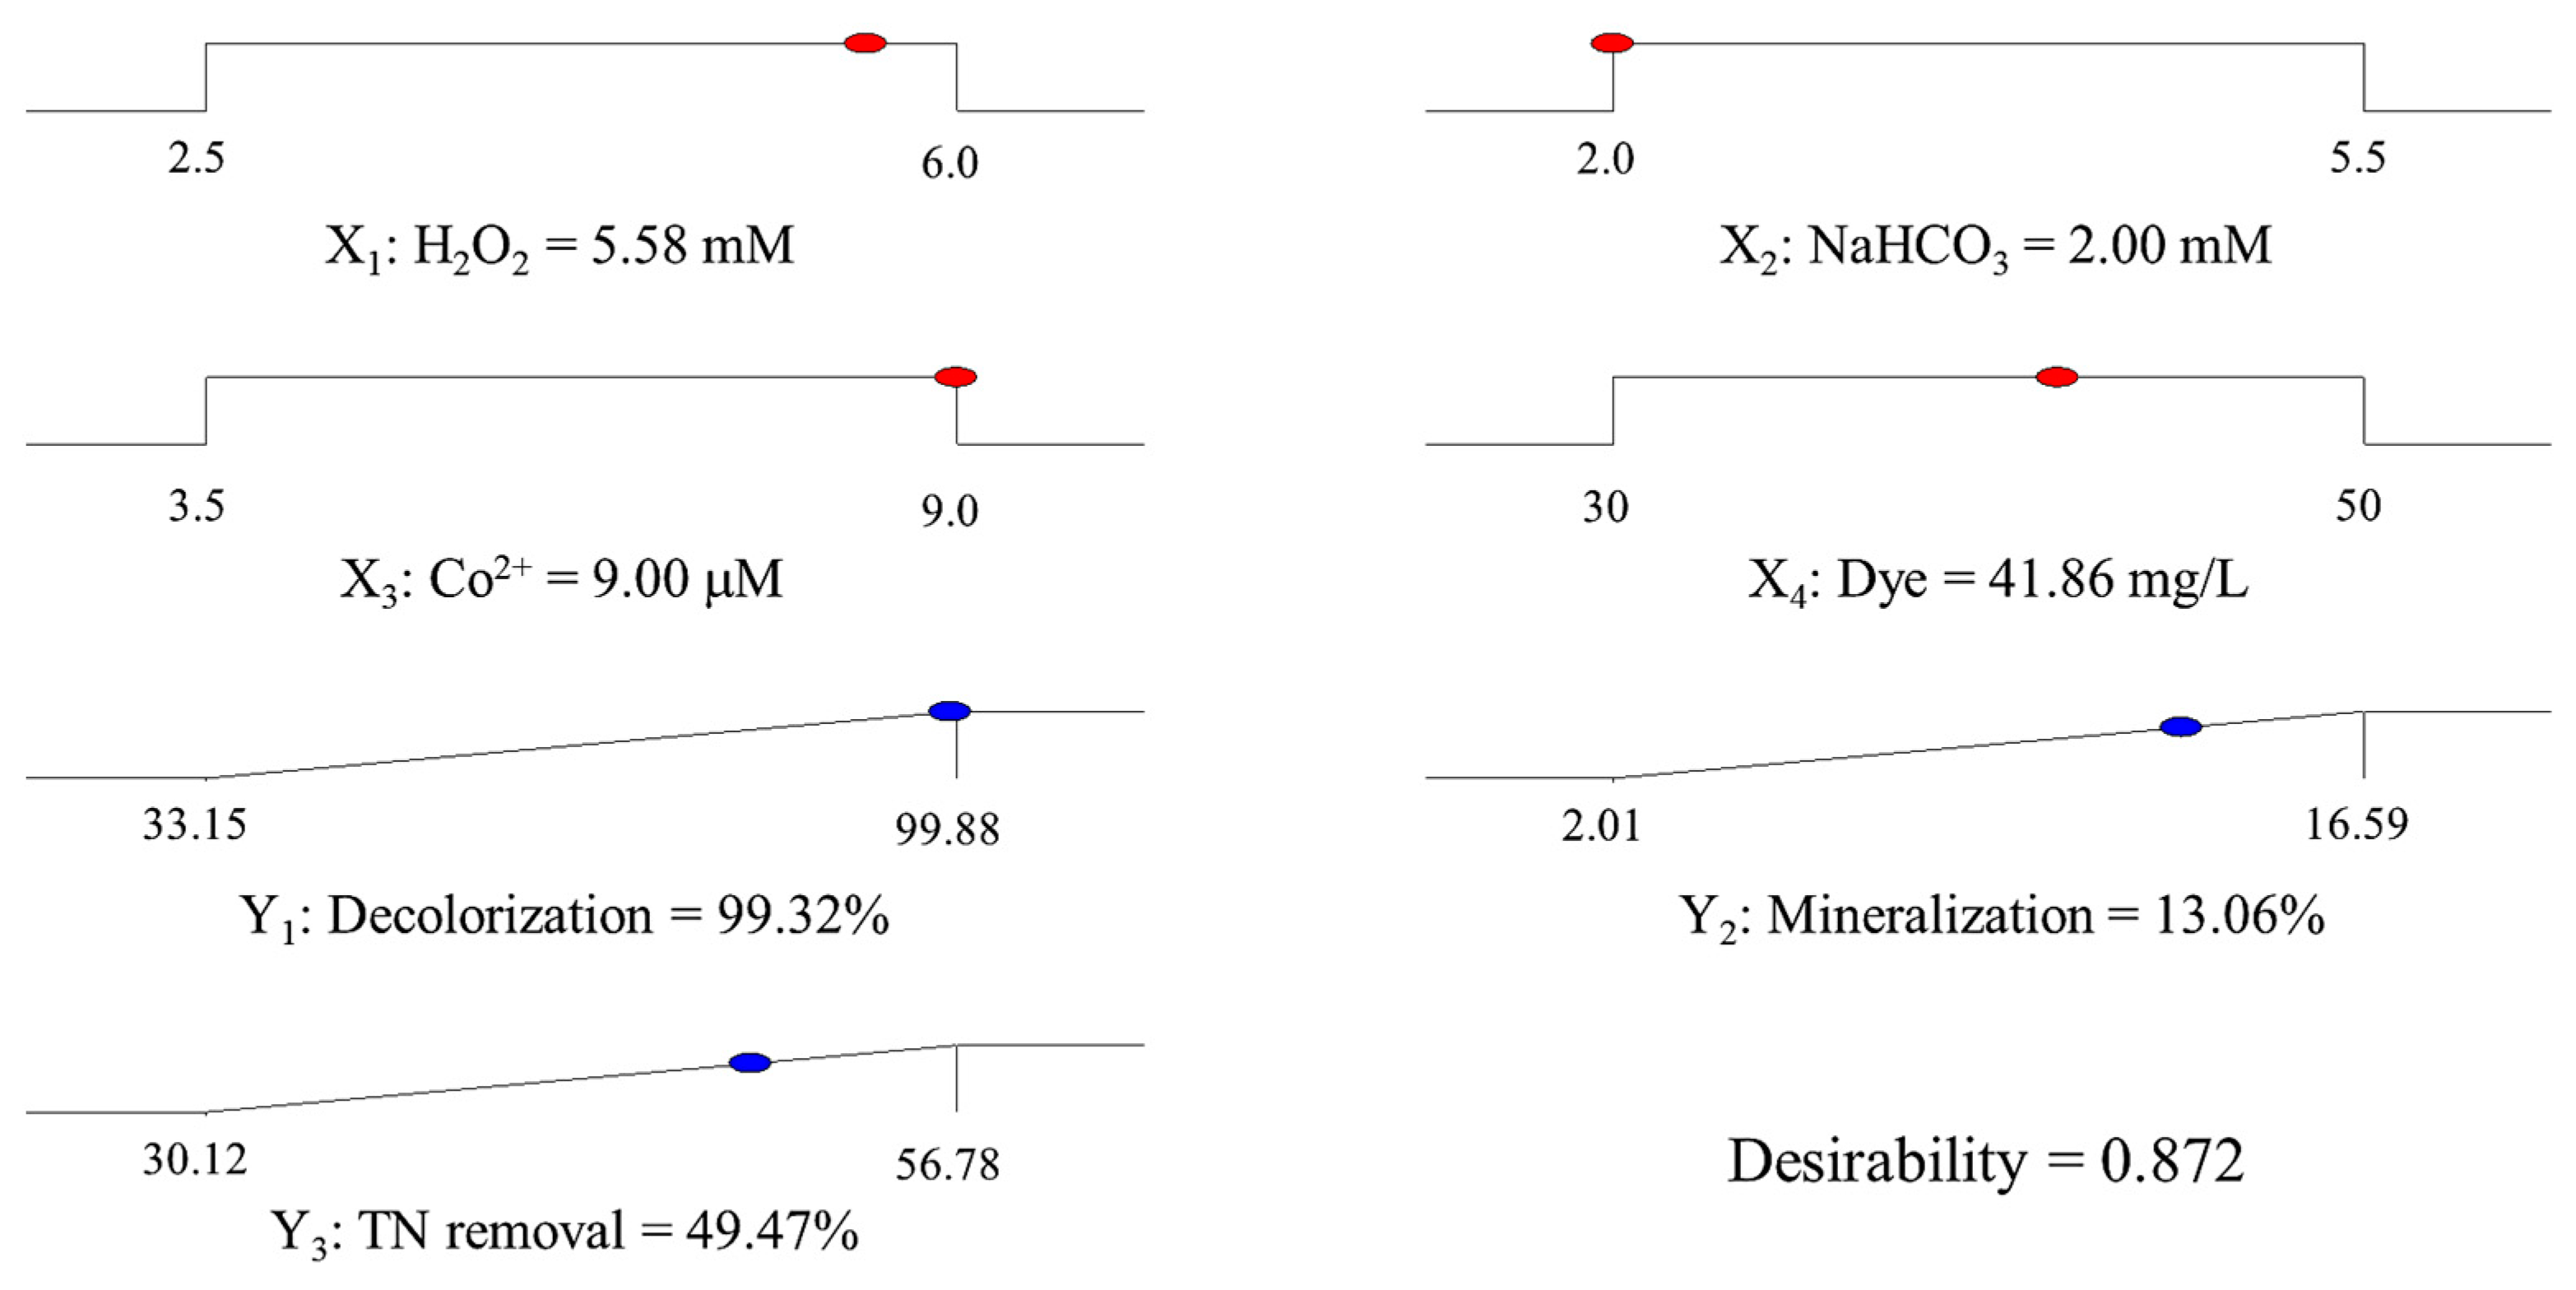
A numerical optimization using the desirability function was performed to obtain the optimum parameters that maximize response variables while maintaining independent variables in the study range. Oxidation conditions of AR–AC with the Co2+–BAP system guaranteeing a maximum decolorization, mineralization, and total nitrogen removal are the following: 5.58 mM H2O2, 2.00 mM NaHCO3, 9.00 µM Co2+, and 41.86 mg/L dye. Figure 4 shows the result of the optimization, where the desirability yielded by the software was 0.872. The desirability function is the most popular tool to optimize multiple responses. It takes values between 0 and 1 with zero (0) being an undesirable response and one (1) an utterly desirable value, i.e., an ideal response [63]. Harrington’s scale for a desirability function indicates that values above 0.80 are highly desirable. The desirable degrees can be consecutively divided as excellent (0.8–1.0), good (0.6–0.8), satisfactory (0.4–0.6), bad (0.4–0.2) and worst (<0.2) degrees [64]. For this study, the desirability of 0.872 suggests that the values of the independent variables obtained in the multi-objective optimization guarantee maximum dye degradation.
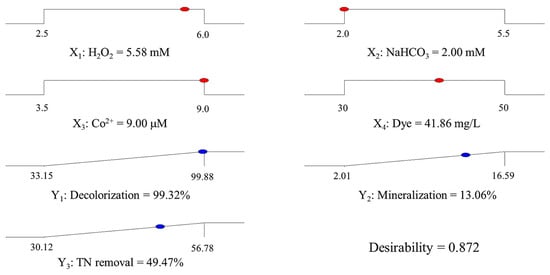
Figure 4.
Desirability ramp for numerical optimization.
Additional experiments were performed at the conditions shown in Table 7 to validate the model’s prediction. The errors between experimental and predicted values for multi-objective optimization were less than 3.0 for decolorization and 7.0% for mineralization and TN removal. Therefore, using the RSM, the generated models are accurate enough to predict the Allura Red AC dye degradation by the Co2+–BAP system.

Table 7.
Comparison of predicted and experimental results for validation points of the experimental design.
An overview of the results of the Co2+–HCO3−–H2O2 system for the degradation of dyes is summarized in Table 8. In all research, a near total decolorization has been achieved while the degree of mineralization has been low. The total organic carbon (TOC) obtained in the degradation of different dyes was between 13.9 and 19.0% [35,36,37,38,40], except for orange II, where a 45.3% mineralization was achieved [39]. For the Co2+–BAP system, this study is the first to optimize the degradation of an azo dye, maximizing decolorization, mineralization, and TN removal. It is difficult to compare the H2O2 and NaHCO3 requirements for the oxidation of dyes as these depend on the structure of the substance to be degraded. Typically, H2O2/NaHCO3 molar ratios of 0.5 to 10 have been used, and the highest degradation efficiencies were obtained for ratios between 1 and 5.

Table 8.
Dye degradation parameters with the Co2+–BAP catalytic system.
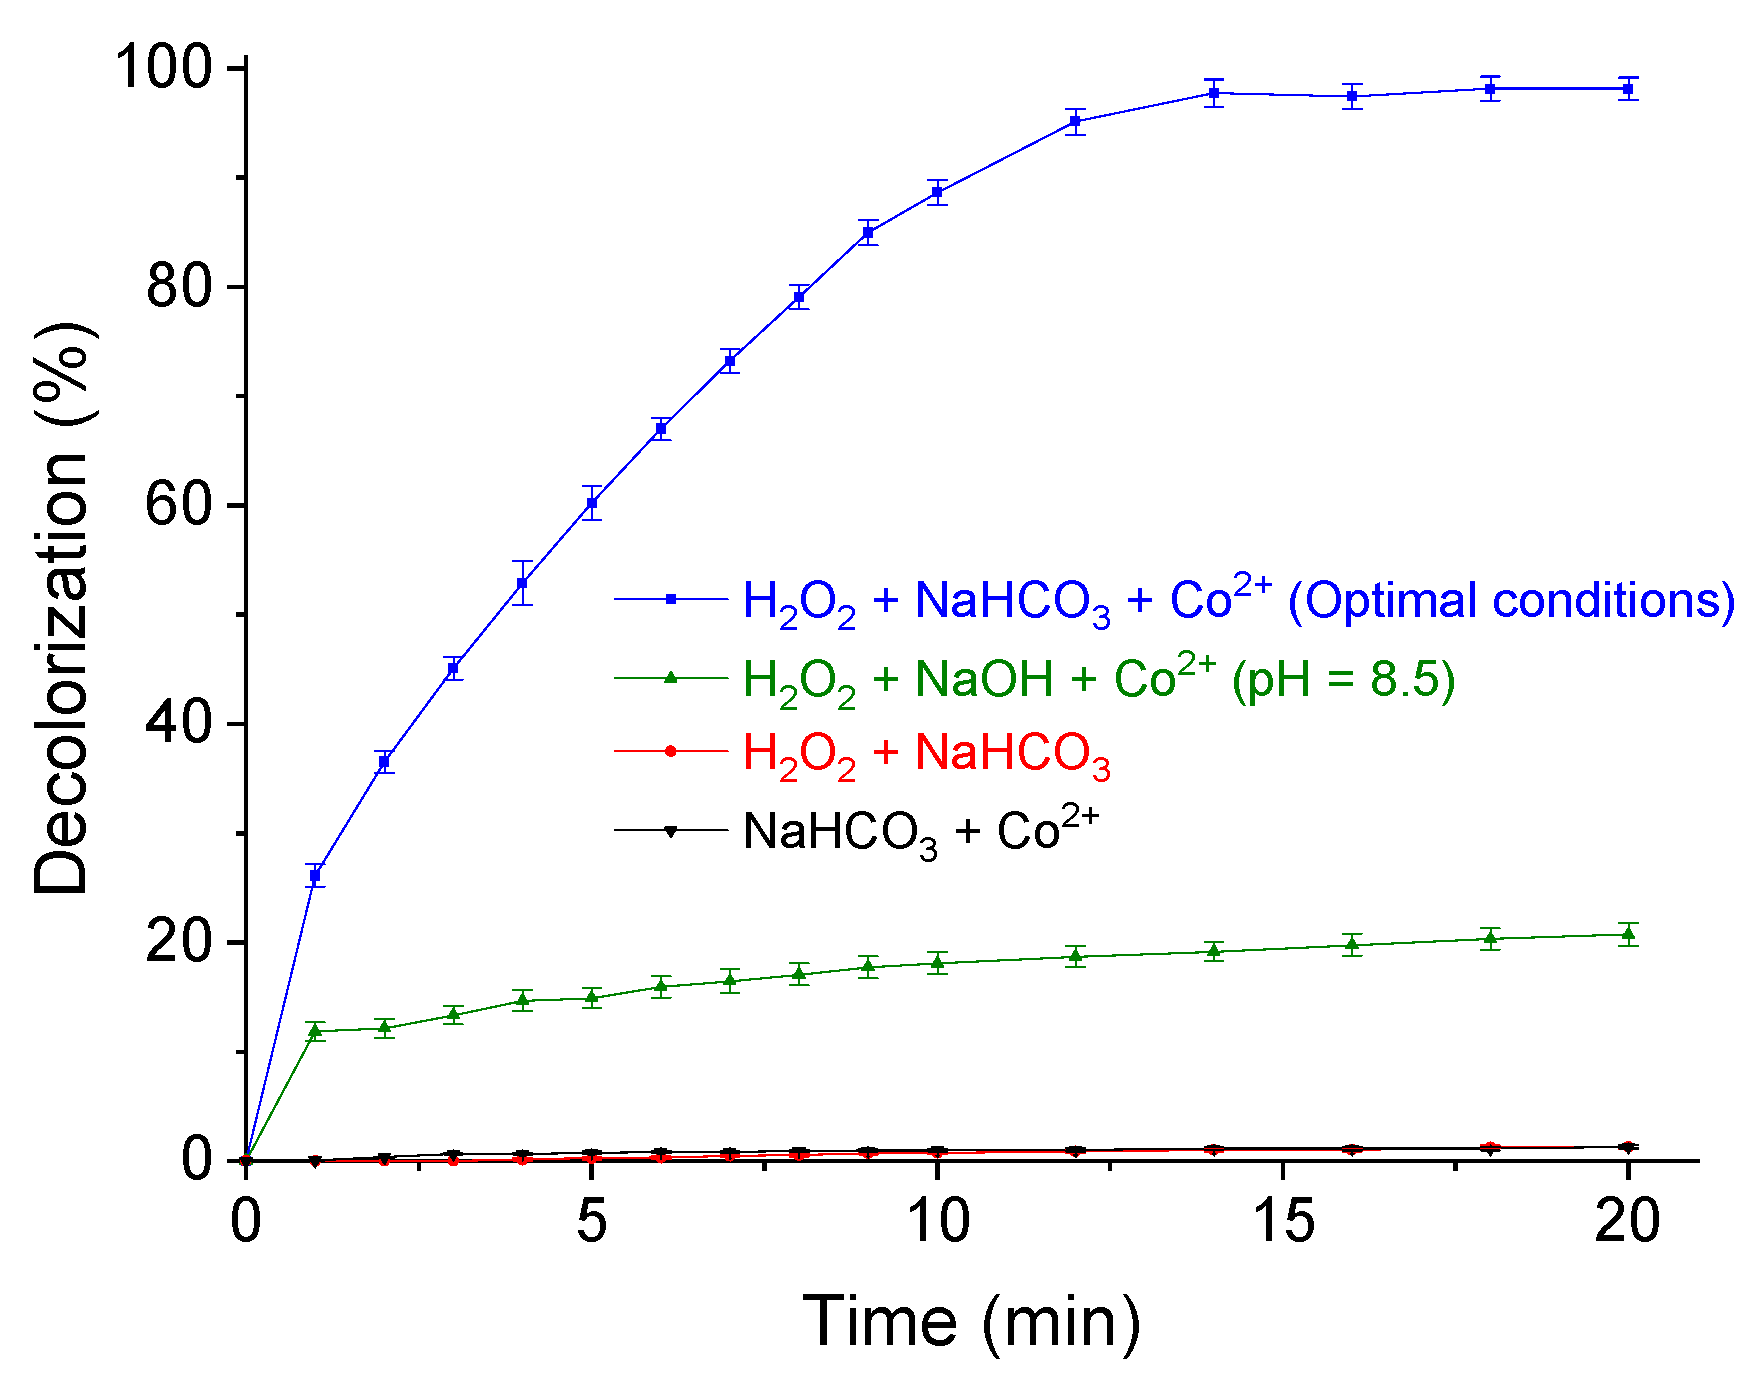
At the optimal conditions of the experimental design, blank tests without NaHCO3, Co2+, and H2O2 were performed to evaluate the effect of different variables on AR–AC degradation (Figure 5). A decolorization of 20.72% and mineralization of 1.2% were obtained at 3 h of oxidation reaction of AR–AC with H2O2 + Co2+ and pH adjustment with NaOH. In reactions without H2O2 or a catalyst (Co2+), decolorizations were lower than 1.31%, and no mineralization occurred. From the results illustrated in Figure 5, it is concluded that the Co2+–BAP system is highly effective for AR–AC oxidation, and that the three reagents (H2O2 + NaHCO3 + Co2+) are needed in adequate concentrations for the degradation of this dye.
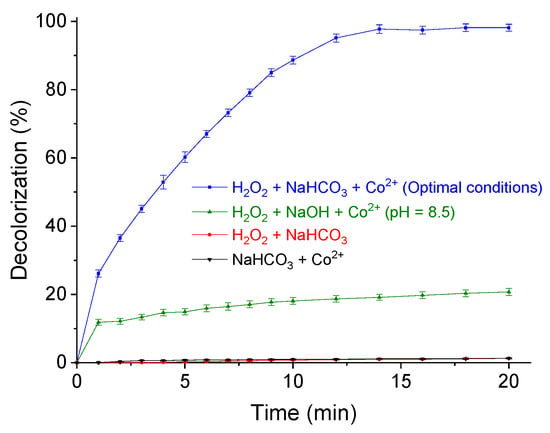
Figure 5.
Decolorization data at optimal reaction conditions and blank tests for AR–AC decolorization.
3.2. Post-Oxidation Co2+ Adsorption
The cobalt (catalyst) present in the post-oxidation solution must be removed as cobalt ions are considered to be primary toxic pollutants in water [65]. Dissolved cobalt concentrations in ocean waters are extremely low, typically <7.1 ng/L in the Pacific and Atlantic oceans [66,67]. Furthermore, the standard level of cobalt in drinking water is 2 μg/L [68]. Experimental details for post-oxidation cobalt adsorption are described in the Supplementary Materials (cobalt species diagram [69] in Figure S10; pH effect in Figure S11 and contact time effect in Figure S12).
Under multi-objective optimization conditions, the Co2+ concentration in the reaction medium is 9.00 μM, equivalent to 530.4 μg/L. After three consecutive adsorptions with sodium bentonite (50 mg g of clay/200 mL of sample, pH of solution post-oxidation = 8.5, contact time = 2 h, stirring speed = 300 rpm, and temperature = 25 °C), the cobalt concentration in the supernatant was <0.01 mg/L, which corresponds to the detection limit of this metal in the equipment used (Thermo iCE 3000 Series atomic absorption spectrometer). For the first and second adsorption, the final concentrations of cobalt were 2.93 and 1.57 μM, corresponding to 67.44 and 46.41% removals, respectively. The final concentration in the third adsorption cycle was less than 1 μM. This study is the first to explore the problem of cobalt ion pollution in the Co2+–BAP system and provides an option for its removal, using a widely available and inexpensive adsorbent such as bentonite.
4. Conclusions
The degradation of Allura Red AC azo dye by bicarbonate-activated hydrogen peroxide (oxidizing agent) and cobalt ions (catalyst) was optimized using CCD-based RSM. Quadratic regression models were proposed to describe the effects of independent variables and their interactions on decolorization, mineralization, and TN removal.
At optimal conditions for the degradation of Allura Red AC (5.58 mM H2O2, 2.00 mM NaHCO3, 9.00 µM Co2+, and 41.86 mg/L dye), total decolorization was achieved, as well as mineralization and TN removal of 12.99 and 51.97%, respectively. The amount of H2O2 used to degrade the dye at optimal conditions corresponded to 1.41 times the stoichiometric dose required for the complete oxidation of Allura Red AC (1 mol of dye requires 47 mol of H2O2). Therefore, this oxidation system is efficient regarding the oxidizing agent’s consumption.
Cobalt ions in the post-oxidation solution can be efficiently removed using sodium bentonite (Na–Bent) as the adsorbent material. Na–Bent could remove at least 98.11% of the Co2+ ions in three successive adsorption cycles.
Supplementary Materials
The following supporting information can be downloaded at: https://www.mdpi.com/article/10.3390/chemengineering7050086/s1, Figure S1: Predicted vs. actual values plot for decolorization; Figure S2: Predicted vs. actual values plot for mineralization; Figure S3: Predicted vs. actual values plot for total nitrogen removal; Figure S4: Residual plot for the assessment of the appropriateness of the decolorization model; Figure S5: Residual plot for the assessment of the appropriateness of the mineralization model; Figure S6: Residual plot for the assessment of the appropriateness of the TN removal model; Figure S7: Studentized residuals vs. predicted response plot for the decolorization model; Figure S8: Studentized residuals vs. predicted response plot for the mineralization model; Figure S9: Studentized residuals vs. predicted response plot for the TN removal model; Figure S10: Diagram of cobalt species at a concentration of Co2+ 9.00 μM and NaHCO3 2.00 mM; Figure S11: Effect of pH on the removal of Co2+ in an aqueous solution at 25 °C. Adsorption conditions: Post-oxidation solution volume = 200 mL, [Co2+] = 9.00 μM, adsorbent mass = 50 mg Na–Bent, stirring speed = 300 rpm, contact time = 2 h, pH adjustment with 0.5 M HCl; Figure S12: Effect of contact time on the removal of Co2+ in an aqueous solution at 25 °C. Adsorption conditions: Post-oxidation solution volume = 200 mL, [Co2+] = 9.00 μM, adsorbent mass = 50 mg Na–Bent, stirring speed = 300 rpm, pH = 8.5.
Author Contributions
Conceptualization, I.F.M.-Q., N.R.S.-G. and M.T.D.-A.; methodology, K.Y.M.-B. and I.F.M.-Q.; validation, K.Y.M.-B. and I.F.M.-Q.; formal analysis, K.Y.M.-B., I.F.M.-Q., N.R.S.-G. and M.T.D.-A.; writing-original draft preparation, N.R.S.-G. and M.T.D.-A.; writing-review and editing, N.R.S.-G. and I.F.M.-Q.; project administration, M.T.D.-A.; funding acquisition, M.T.D.-A. and N.R.S.-G. All authors have read and agreed to the published version of the manuscript.
Funding
This study was partially funded by the Universidad Nacional de Colombia Sede Manizales (DIMA, Hermes project code 51119).
Data Availability Statement
The data that support the findings of this study are available from the corresponding author, upon reasonable request.
Acknowledgments
The authors would like to acknowledge the “Laboratorio de Fisicoquímica Avanzada” of the Universidad Nacional de Colombia Sede Manizales for the experimental support for this research.
Conflicts of Interest
The authors declare no conflict of interest.
References
- Desore, A.; Narula, S.A. An overview on corporate response towards sustainability issues in textile industry. Environ. Dev. Sustain. 2018, 20, 1439–1459. [Google Scholar] [CrossRef]
- Lellis, B.; Fávaro-Polonio, C.Z.; Pamphile, J.A.; Polonio, J.C. Effects of textile dyes on health and the environment and bioremediation potential of living organisms. Biotechnol. Res. Innov. 2019, 3, 275–290. [Google Scholar] [CrossRef]
- Wong, Y.; Yu, J. Laccase-catalyzed decolorization of synthetic dyes. Water Res. 1999, 33, 3512–3520. [Google Scholar] [CrossRef]
- Berradi, M.; Hsissou, R.; Khudhair, M.; Assouag, M.; Cherkaoui, O.; El Bachiri, A.; El Harfi, A. Textile finishing dyes and their impact on aquatic environs. Heliyon 2019, 5, e02711. [Google Scholar] [CrossRef] [PubMed]
- Benkhaya, S.; M’ rabet, S.; El Harfi, A. A review on classifications, recent synthesis and applications of textile dyes. Inorg. Chem. Commun. 2020, 115, 107891. [Google Scholar] [CrossRef]
- Liu, T.; Aniagor, C.O.; Ejimofor, M.I.; Menkiti, M.C.; Wakawa, Y.M.; Li, J.; Akbour, R.A.; Yap, P.-S.; Lau, S.Y.; Jeevanandam, J. Recent developments in the utilization of modified graphene oxide to adsorb dyes from water: A review. J. Ind. Eng. Chem. 2023, 117, 21–37. [Google Scholar] [CrossRef]
- Siddiqua, U.H.; Ali, S.; Iqbal, M.; Hussain, T. Relationship between structure and dyeing properties of reactive dyes for cotton dyeing. J. Mol. Liq. 2017, 241, 839–844. [Google Scholar] [CrossRef]
- Chakraborty, J.N. Chapter 3—Dye–Fibre Interaction. In Fundamentals and Practices in Colouration of Textiles; Chakraborty, J.N., Ed.; Woodhead Publishing: New Delhi, India, 2010; pp. 20–26. [Google Scholar]
- Donkadokula, N.Y.; Kola, A.K.; Naz, I.; Saroj, D. A review on advanced physico-chemical and biological textile dye wastewater treatment techniques. Rev. Environ. Sci. Biotechnol. 2020, 19, 543–560. [Google Scholar] [CrossRef]
- Benkhaya, S.; M’Rabet, S.; El Harfi, A. Classifications, properties, recent synthesis and applications of azo dyes. Heliyon 2020, 6, e03271. [Google Scholar] [CrossRef]
- Gürses, A.; Açıkyıldız, M.; Güneş, K.; Gürses, M.S. Classification of Dye and Pigments. In Dyes and Pigments; Sharma, S.K., Ed.; Springer International Publishing: Cham, Switzerland, 2016; pp. 31–45. [Google Scholar]
- Thiam, A.; Sirés, I.; Garrido, J.A.; Rodríguez, R.M.; Brillas, E. Decolorization and mineralization of Allura Red AC aqueous solutions by electrochemical advanced oxidation processes. J. Hazard. Mater. 2015, 290, 34–42. [Google Scholar] [CrossRef]
- Brillas, E.; Martínez-Huitle, C.A. Decontamination of wastewaters containing synthetic organic dyes by electrochemical methods. An updated review. Appl. Catal. B Environ. 2015, 166–167, 603–643. [Google Scholar] [CrossRef]
- Solís, M.; Solís, A.; Pérez, H.I.; Manjarrez, N.; Flores, M. Microbial decolouration of azo dyes: A review. Process Biochem. 2012, 47, 1723–1748. [Google Scholar] [CrossRef]
- Bastaki, M.; Farrell, T.; Bhusari, S.; Pant, K.; Kulkarni, R. Lack of genotoxicity in vivo for food color additive Allura Red AC. Food Chem. Toxicol. 2017, 105, 308–314. [Google Scholar] [CrossRef] [PubMed]
- Hassan, M.M.; Carr, C.M. A critical review on recent advancements of the removal of reactive dyes from dyehouse effluent by ion-exchange adsorbents. Chemosphere 2018, 209, 201–219. [Google Scholar] [CrossRef]
- Sharma, B.; Dangi, A.K.; Shukla, P. Contemporary enzyme based technologies for bioremediation: A review. J. Environ. Manag. 2018, 210, 10–22. [Google Scholar] [CrossRef]
- Khan, S.; Malik, A. Toxicity evaluation of textile effluents and role of native soil bacterium in biodegradation of a textile dye. Environ. Sci. Pollut. Res. 2018, 25, 4446–4458. [Google Scholar] [CrossRef]
- Gupta, V.K. Suhas Application of low-cost adsorbents for dye removal—A review. J. Environ. Manag. 2009, 90, 2313–2342. [Google Scholar] [CrossRef]
- Thamaraiselvan, C.; Noel, M. Membrane processes for dye wastewater treatment: Recent progress in fouling control. Crit. Rev. Environ. Sci. Technol. 2015, 45, 1007–1040. [Google Scholar] [CrossRef]
- Bilińska, L.; Blus, K.; Bilińska, M.; Gmurek, M. Industrial textile wastewater ozone treatment: Catalyst selection. Catalysts 2020, 10, 611. [Google Scholar] [CrossRef]
- Lin, S.H.; Peng, C.F. Treatment of textile wastewater by electrochemical method. Water Res. 1994, 28, 277–282. [Google Scholar] [CrossRef]
- Pourali, P.; Fazlzadeh, M.; Aaligadri, M.; Dargahi, A.; Poureshgh, Y.; Kakavandi, B. Enhanced three-dimensional electrochemical process using magnetic recoverable of Fe3O4@GAC towards furfural degradation and mineralization. Arab. J. Chem. 2022, 15, 103980. [Google Scholar] [CrossRef]
- Sukanya Devi, R.; Dhurai, B.; Sundaresan, S.; Selvakumar, A. Advanced Oxidation Processes (AOP)—Effective Innovative Treatment Methods to Degrade Textile Dye Effluent. In Advances in Textile Waste Water Treatments; Muthu, S.S., Ed.; Springer: Singapore, 2021; pp. 173–203. [Google Scholar]
- Macías-Quiroga, I.F.; Rengifo-Herrera, J.A.; Arredondo-López, S.M.; Marín-Flórez, A.; Sanabria-González, N.R. Research trends on pillared interlayered clays (PILCs) used as catalysts in environmental and chemical processes: Bibliometric analysis. Sci. World J. 2022, 2022, 5728678. [Google Scholar] [CrossRef] [PubMed]
- Al-Musawi, T.J.; Rajiv, P.; Mengelizadeh, N.; Mohammed, I.A.; Balarak, D. Development of sonophotocatalytic process for degradation of acid orange 7 dye by using titanium dioxide nanoparticles/graphene oxide nanocomposite as a catalyst. J. Environ. Manag. 2021, 292, 112777. [Google Scholar] [CrossRef] [PubMed]
- Luo, Y.; Su, R.; Yao, H.; Zhang, A.; Xiang, S.; Huang, L. Degradation of trimethoprim by sulfate radical-based advanced oxidation processes: Kinetics, mechanisms, and effects of natural water matrices. Environ. Sci. Pollut. Res. 2021, 28, 62572–62582. [Google Scholar] [CrossRef] [PubMed]
- Su, R.; Xie, C.; Alhassan, S.I.; Huang, S.; Chen, R.; Xiang, S.; Wang, Z.; Huang, L. Oxygen reduction reaction in the field of water environment for application of nanomaterials. Nanomaterials 2020, 10, 1719. [Google Scholar] [CrossRef]
- Dargahi, A.; Moradi, M.; Marafat, R.; Vosoughi, M.; Mokhtari, S.A.; Hasani, K.; Asl, S.M. Applications of advanced oxidation processes (electro-Fenton and sono-electro-Fenton) for degradation of diazinon insecticide from aqueous solutions: Optimization and modeling using RSM-CCD, influencing factors, evaluation of toxicity, and degradation pathway. Biomass Convers. Biorefin. 2021, 13, 10615–10632. [Google Scholar]
- Hasani, K.; Peyghami, A.; Moharrami, A.; Vosoughi, M.; Dargahi, A. The efficacy of sono-electro-Fenton process for removal of Cefixime antibiotic from aqueous solutions by response surface methodology (RSM) and evaluation of toxicity of effluent by microorganisms. Arab. J. Chem. 2020, 13, 6122–6139. [Google Scholar] [CrossRef]
- Jawad, A.; Chen, Z.; Yin, G. Bicarbonate activation of hydrogen peroxide: A new emerging technology for wastewater treatment. Chinese J. Catal. 2016, 37, 810–825. [Google Scholar] [CrossRef]
- Pan, H.; Gao, Y.; Li, N.; Zhou, Y.; Lin, Q.; Jiang, J. Recent advances in bicarbonate-activated hydrogen peroxide system for water treatment. Chem. Eng. J. 2021, 408, 127332. [Google Scholar] [CrossRef]
- Richardson, D.E.; Yao, H.; Frank, K.M.; Bennett, D.A. Equilibria, kinetics, and mechanism in the bicarbonate activation of hydrogen peroxide: Oxidation of sulfides by peroxymonocarbonate. J. Am. Chem. Soc. 2000, 122, 1729–1739. [Google Scholar] [CrossRef]
- Kan, H.; Soklun, H.; Yang, Z.; Wu, R.; Shen, J.; Qu, G.; Wang, T. Purification of dye wastewater using bicarbonate activated hydrogen peroxide: Reaction process and mechanisms. Sep. Purif. Technol. 2020, 232, 115974. [Google Scholar] [CrossRef]
- Xu, A.; Li, X.; Ye, S.; Yin, G.; Zeng, Q. Catalyzed oxidative degradation of methylene blue by in situ generated cobalt (II)-bicarbonate complexes with hydrogen peroxide. Appl. Catal. B Environ. 2011, 102, 37–43. [Google Scholar] [CrossRef]
- Yang, Z.; Wang, H.; Chen, M.; Luo, M.; Xia, D.; Xu, A.; Zeng, Q. Fast degradation and biodegradability improvement of Reactive Brilliant Red X-3B by the cobalt(II)/bicarbonate/hydrogen peroxide system. Ind. Eng. Chem. Res. 2012, 51, 11104–11111. [Google Scholar] [CrossRef]
- Luo, M.; Lv, L.; Deng, G.; Yao, W.; Ruan, Y.; Li, X.; Xu, A. The mechanism of bound hydroxyl radical formation and degradation pathway of Acid Orange II in Fenton-like Co2+-HCO3− system. Appl. Catal. A Gen. 2014, 469, 198–205. [Google Scholar] [CrossRef]
- Li, X.; Xiong, Z.; Ruan, X.; Xia, D.; Zeng, Q.; Xu, A. Kinetics and mechanism of organic pollutants degradation with cobalt–bicarbonate–hydrogen peroxide system: Investigation of the role of substrates. Appl. Catal. A Gen. 2012, 411–412, 24–30. [Google Scholar] [CrossRef]
- Long, X.; Yang, Z.; Wang, H.; Chen, M.; Peng, K.; Zeng, Q.; Xu, A. Selective degradation of Orange II with the cobalt(II)–bicarbonate–hydrogen peroxide system. Ind. Eng. Chem. Res. 2012, 51, 11998–12003. [Google Scholar] [CrossRef]
- Macías-Quiroga, I.F.; Rojas-Méndez, E.F.; Giraldo-Gómez, G.I.; Sanabria-González, N.R. Experimental data of a catalytic decolorization of Ponceau 4R dye using the cobalt (II)/NaHCO3/H2O2 system in aqueous solution. Data Brief. 2020, 30, 105463. [Google Scholar] [CrossRef]
- Jawad, A.; Li, Y.; Lu, X.; Chen, Z.; Liu, W.; Yin, G. Controlled leaching with prolonged activity for Co–LDH supported catalyst during treatment of organic dyes using bicarbonate activation of hydrogen peroxide. J. Hazard. Mater. 2015, 289, 165–173. [Google Scholar] [CrossRef]
- Zhou, L.; Song, W.; Chen, Z.; Yin, G. Degradation of organic pollutants in wastewater by bicarbonate-activated hydrogen peroxide with a supported cobalt catalyst. Environ. Sci. Technol. 2013, 47, 3833–3839. [Google Scholar] [CrossRef]
- Macías-Quiroga, I.F.; Pérez-Flórez, A.; Arcila, J.S.; Giraldo-Goméz, G.I.; Sanabria-Gonzalez, N.R. Synthesis and characterization of Co/Al-PILCs for the oxidation of an azo dye using the bicarbonate-activated hydrogen peroxide system. Catal. Lett. 2022, 152, 1905–1916. [Google Scholar] [CrossRef]
- Dong, H.; Feng, X.; Guo, Y.; Jia, Z.; Zhang, X.; Xu, A.; Li, X. Bicarbonate activated hydrogen peroxide with cobalt nanoparticles embedded in nitrogen-doped carbon nanotubes for highly efficient organic dye degradation. Colloids Surf. A Physicochem. Eng. Asp. 2021, 630, 127645. [Google Scholar] [CrossRef]
- Urbina-Suarez, N.A.; Rivera-Caicedo, C.; González-Delgado, Á.D.; Barajas-Solano, A.F.; Machuca-Martínez, F. Bicarbonate-hydrogen peroxide system for treating dyeing wastewater: Degradation of organic pollutants and color removal. Toxics 2023, 11, 366. [Google Scholar] [CrossRef] [PubMed]
- Urbina-Suarez, N.A.; Salcedo-Pabón, C.J.; López-Barrera, G.L.; García-Martínez, J.B.; Barajas-Solano, A.F.; Machuca-Martínez, F. Using the response surface methodology to treat tannery wastewater with the bicarbonate-peroxide system. ChemEngineering 2023, 7, 62. [Google Scholar] [CrossRef]
- Macías-Quiroga, I.F.; Giraldo-Gómez, G.I.; Sanabria-González, N.R. Characterization of colombian clay and its potential use as adsorbent. Sci. World J. 2018, 2018, 5969178. [Google Scholar] [CrossRef] [PubMed]
- Ay, F.; Catalkaya, E.C.; Kargi, F. A statistical experiment design approach for advanced oxidation of Direct Red azo-dye by photo-Fenton treatment. J. Hazard. Mater. 2009, 162, 230–236. [Google Scholar] [CrossRef]
- Francis, F.; Sabu, A.; Nampoothiri, K.M.; Ramachandran, S.; Ghosh, S.; Szakacs, G.; Pandey, A. Use of response surface methodology for optimizing process parameters for the production of α-amylase by Aspergillus oryzae. Biochem. Eng. J. 2003, 15, 107–115. [Google Scholar] [CrossRef]
- Seidmohammadi, A.; Vaziri, Y.; Dargahi, A.; Nasab, H.Z. Improved degradation of metronidazole in a heterogeneous photo-Fenton oxidation system with PAC/Fe3O4 magnetic catalyst: Biodegradability, catalyst specifications, process optimization, and degradation pathway. Biomass Convers. Biorefin. 2023, 13, 9057–9073. [Google Scholar] [CrossRef]
- Samarghandi, M.R.; Dargahi, A.; Shabanloo, A.; Nasab, H.Z.; Vaziri, Y.; Ansari, A. Electrochemical degradation of methylene blue dye using a graphite doped PbO2 anode: Optimization of operational parameters, degradation pathway and improving the biodegradability of textile wastewater. Arab. J. Chem. 2020, 13, 6847–6864. [Google Scholar] [CrossRef]
- Bevilacqua, A.; Corbo, M.; Sinigaglia, M. Design of experiments: A powerful tool in food microbiology. In Current Research, Technology and Education Topics in Applied Microbiology and Microbial Biotechnology; Méndez-Vilas, A., Ed.; Formatex Research Center: Madrid, Spain, 2010; pp. 1419–1429. [Google Scholar]
- Demirel, M.; Kayan, B. Application of response surface methodology and central composite design for the optimization of textile dye degradation by wet air oxidation. Int. J. Ind. Chem. 2012, 3, 24. [Google Scholar] [CrossRef]
- Zhang, Z.; Zheng, H. Optimization for decolorization of azo dye acid green 20 by ultrasound and H2O2 using response surface methodology. J. Hazard. Mater. 2009, 172, 1388–1393. [Google Scholar] [CrossRef]
- Roudi, A.M.; Salem, S.; Abedini, M.; Maslahati, A.; Imran, M. Response surface methodology (RSM)-based prediction and optimization of the Fenton process in landfill leachate decolorization. Processes 2021, 9, 2284. [Google Scholar] [CrossRef]
- Myers, R.H.; Montgomery, D.C.; Anderson-Cook, C.M. Response Surface Methodology: Process and Product Optimization Using Designed Experiments, 4th ed.; John Wiley & Sons Inc.: Hoboken, NJ, USA, 2016. [Google Scholar]
- Leili, M.; Shirmohammadi Khorram, N.; Godini, K.; Azarian, G.; Moussavi, R.; Peykhoshian, A. Application of central composite design (CCD) for optimization of cephalexin antibiotic removal using electro-oxidation process. J. Mol. Liq. 2020, 313, 113556. [Google Scholar] [CrossRef]
- Spadaro, J.T.; Isabelle, L.; Renganathan, V. Hydroxyl radical mediated degradation of azo dyes: Evidence for benzene generation. Environ. Sci. Technol. 1994, 28, 1389–1393. [Google Scholar] [CrossRef] [PubMed]
- Thiam, A.; Brillas, E.; Garrido, J.A.; Rodríguez, R.M.; Sirés, I. Routes for the electrochemical degradation of the artificial food azo-colour Ponceau 4R by advanced oxidation processes. Appl. Catal. B Environ. 2016, 180, 227–236. [Google Scholar] [CrossRef]
- Thiam, A.; Sirés, I.; Garrido, J.A.; Rodríguez, R.M.; Brillas, E. Effect of anions on electrochemical degradation of azo dye Carmoisine (Acid Red 14) using a BDD anode and air-diffusion cathode. Sep. Purif. Technol. 2015, 140, 43–52. [Google Scholar] [CrossRef]
- Herney-Ramirez, J.; Vicente, M.A.; Madeira, L.M. Heterogeneous photo-Fenton oxidation with pillared clay-based catalysts for wastewater treatment: A review. Appl. Catal. B Environ. 2010, 98, 10–26. [Google Scholar] [CrossRef]
- Bobu, M.; Yediler, A.; Siminiceanu, I.; Schulte-Hostede, S. Degradation studies of ciprofloxacin on a pillared iron catalyst. Appl. Catal. B Environ. 2008, 83, 15–23. [Google Scholar] [CrossRef]
- Vera Candioti, L.; De Zan, M.M.; Cámara, M.S.; Goicoechea, H.C. Experimental design and multiple response optimization. Using the desirability function in analytical methods development. Talanta 2014, 124, 123–138. [Google Scholar]
- Tangparitkul, S. Evaluation of effecting factors on oil recovery using the desirability function. J. Pet. Explor. Prod. Technol. 2018, 8, 1199–1208. [Google Scholar] [CrossRef]
- Al-Jlil, S.A. Adsorption of cobalt ions from waste water on activated Saudi clays. Appl. Water Sci. 2017, 7, 383–391. [Google Scholar] [CrossRef]
- Saili, K.S.; Cardwell, A.S.; Stubblefield, W.A. Chronic toxicity of cobalt to marine organisms: Application of a species sensitivity distribution approach to develop international water quality standards. Environ. Toxicol. Chem. 2021, 40, 1405–1418. [Google Scholar] [CrossRef] [PubMed]
- Ellwood, M.J.; van den Berg, C.M.G. Determination of organic complexation of cobalt in seawater by cathodic stripping voltammetry. Mar. Chem. 2001, 75, 33–47. [Google Scholar] [CrossRef]
- Al-Shahrani, S.S. Treatment of wastewater contaminated with cobalt using Saudi activated bentonite. Alex. Eng. J. 2014, 53, 205–211. [Google Scholar] [CrossRef]
- Mnasri-Ghnimi, S.; Frini-Srasra, N. Removal of heavy metals from aqueous solutions by adsorption using single and mixed pillared clays. Appl. Clay Sci. 2019, 179, 105151. [Google Scholar] [CrossRef]
Disclaimer/Publisher’s Note: The statements, opinions and data contained in all publications are solely those of the individual author(s) and contributor(s) and not of MDPI and/or the editor(s). MDPI and/or the editor(s) disclaim responsibility for any injury to people or property resulting from any ideas, methods, instructions or products referred to in the content. |
© 2023 by the authors. Licensee MDPI, Basel, Switzerland. This article is an open access article distributed under the terms and conditions of the Creative Commons Attribution (CC BY) license (https://creativecommons.org/licenses/by/4.0/).

