Abstract
The effectiveness of using enhanced evapotranspiration rates of willow plantation is a modern environmentally friendly practice for advanced treatment of effluent WWTP flow. The key idea is that through advanced willow evapotranspiration rates, a significant proportion of the effluent flow can be transferred into the atmosphere through the physical process of evapotranspiration. This study further discusses the concept in a real-world problem using a wide dataset consisting of a recent PET monthly remote dataset namely RASPOTION, monthly recorded rainfall gauge, and experimental willow evapotranspiration surveys across Ireland, to identify the monthly cropping pattern. A Monte Carlo water balance model has been developed for the period 2003–2016. The model was applied in an existing willow plantation at Donard WWTP co. Wicklow, Ireland to identify the exceedance probability of willow plantation runoff against estimated low flows (i.e., Q95, Q99) at the adjacent small tributary. In this case study, any failure which can lead to river quality deterioration was not assessed. The overall framework aims to provide new insights considering the multiple sources of uncertainty (i.e., monthly willow cropping pattern and WWTP effluent flow) in associated environmental engineering problems.
| To enter water and not to get water |
| Foivos Delivorias, Artist |
1. Introduction
Over the last decade, numerous publications have highlighted the importance of willow in addressing environmental engineering challenges. Some examples are short rotation coppice plantation [1,2,3,4], its use for irrigation with wastewater [5], sewage sludge [6], and leachate [7]. It has been proven that willows can be used for the leaching prevention of hazardous wastes [8,9], phytoremediation of contaminated soils [10,11], treatment wetlands [12,13], urban and agricultural catchment runoff systems [14], and to prevent soil erosion [15]. The comprehensive article by Frédette et al. [16] reviewed numerous scientific articles and presented a holistic view on the use of willow in environmental projects.
Evapotranspiration is one of the most difficult meteorological variables to record in the field and there are reported different definitions in the hydrology domain such as potential evapotranspiration, and real or actual evapotranspiration [17] to describe the water natural conversion to atmospheric losses. Willow real evapotranspiration rates consist of two components: the monthly potential evapotranspiration rates and the monthly cropping pattern which is usually extracted by on-site observations. For the assessment of potential evapotranspiration (PET), numerous models have been developed for which Penman-Monteith model is the most reliable [17,18,19]. On the other hand, willows crop monthly patterns require on-site experimental observations. In Ireland, relevant research has been carried out over the last decade [13,20] and can inform water management studies for providing a better and more resilient river environment. Based on Curneen and Gill [13], it appears that there is no difference in ET willow rates between four willow varieties (Tordis, Sven, Inger, and Torhild). ET willow rates and associated crop factors for all three growing seasons appeared to be affected by the strength of effluent received, with the varieties receiving primary treated effluent outperforming those receiving secondary treated effluent which in turn outperformed those receiving water. There was a noticeable decrease in ET willow rates for all varieties under all three treatments in the second and third years, which shows an increased rate of 50% for fertilized willow and 44% for unfertilized willow over the second growing season. The challenge of quantifying willows plantation runoff regime is critical, especially under the rapidly changing climate conditions which may cause more severe droughts in the near future [21,22,23]. The link between drought and low flow in the riverine system highlights the pivotal role of providing new environmental concepts [24] to deal with the challenges of Water, Soil, Food, Biodiversity, and Energy Security Nexus [25].
A few researchers have been carrying out stochastic/probabilistic hydrology modeling associated with evapotranspiration [26,27,28]. Considering that the uncertainty of willow evapotranspiration rate is high, given the local meteorological influence and limited observed on-site samples, probabilistic modeling of willow crop monthly patterns appears to be irreplaceable as used to be common practice in other hydrological disciplines [29].
In this study, a monthly Monte Carlo approach is presented in real environmental engineering problems. In this model, the real evapotranspiration consumption is presented as a monthly random variable depending on the monthly variance of the nine on-site monthly crop factors surveys over a four-year monitoring period. Meteorological inputs associated with the monthly rainfall and monthly potential evapotranspiration were used from gauge to remote sensing products, respectively. The new model is tested in Donard WWTP, co Wicklow Ireland and the model appears to be promising for similar studies worldwide. The main research questions presented in this article were:
- How can actual monthly ET rates and associated effluent flow provide for irrigation purposes in a willow plantation?
- How critical is the use of willow cropping factors gathered by a specific monitoring period (four years)? Given the limited monitoring period, can a probabilistic approach be beneficial to provide naturalized monthly willow surface plantation runoff for quantifying its influence on the water quality of adjacent rivers during low natural flows?
- Can different types of datasets such as from rain gauges to remote sensing PET products support effective solutions even in small-scale environmental engineering problems?
2. Materials and Methods
2.1. Study Area
The village of Donard is located in west Co. Wicklow, approximately 15 km northeast of Ballinglass. The WWTP (WGS84, 53°01′, 6°37′) includes a semi-combined wastewater collection system discharging to a new wastewater treatment plant. Wastewater receives preliminary treatment consisting of de-gritting and fine screening, and then primary treatment in a large septic tank. Effluent from the septic tank is pumped to an adjacent Willow Plantation at Irishtown East, where it is treated through bio-infiltration. The plantation covers an area of 12.9 hectares, though only 9.6 hectares are currently in use. Wicklow County Council manages the willow growth and harvests the willow on a proper coppice cycle every three years. The primary discharge point from the primary tank disperses effluent to groundwater across the willow plantation land. The willow plantation consists of a single landholding of 12.9 hectares, divided into two zones: Zone A measures 9.6 hectares. Effluent flow is discharged to the willow plantation by irrigation, from a series of equally spaced lateral pipes. Zone A is currently in use. Zone B is reserved for future expansion. The area of land occupied by Zone A is bound to slow down runoff rates, allowing for some physical filtration and purification.
Figure 1 presents WWTP and Willow plantation sites.
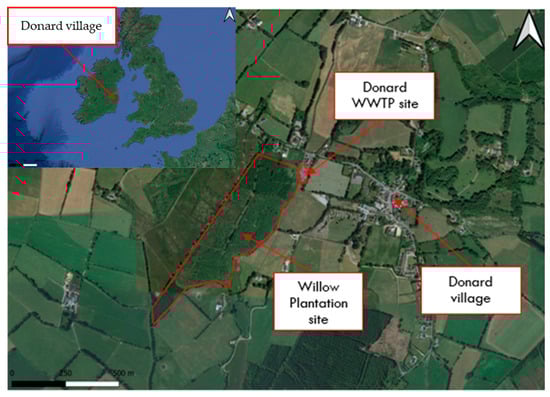
Figure 1.
Study area.
2.1.1. Monthly Rainfall Gauge and River Network Description
Monthly rainfall data were acquired by Met Éireann for two sites (Oak Park and Hackestown). The Hackestown rainfall dataset was ultimately utilized due to the low number of unrecorded rainfall measurements. Figure 2 depicts the monthly rainfall for the period 2003–2016 over the Donard site.
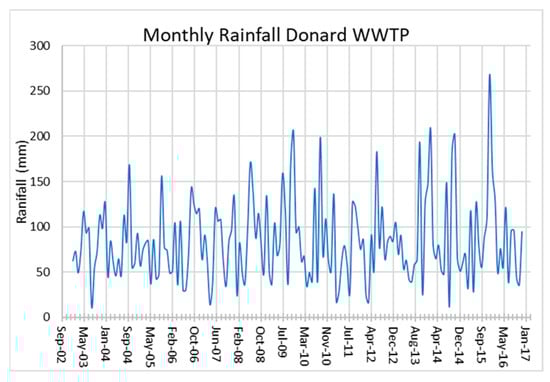
Figure 2.
Monthly Rainfall over Donard WWTP (2003–2016).
The annual rainfall averages around 950 mm, with low values mainly observed during dry periods (such as July), while the wettest month is typically January.
Donard WWTP site is located within the Slaney catchment. The standard annual average rainfall (SAAR) for the site is reported at 1290.85 mm/year (FSU, OPW). The WWTP site is situated on Till derived chiefly from Lower Palaeozoic rocks with moderate permeability subsoil overlain by poorly drained gley soil.
The WWTP site is located near Brown’s Breck Brook tributary upstream of the confluence with Carrigower River. Donark’s brook catchment is estimated as being 12.31 km2.
The average tributary’s flow has been estimated by EPA [30] as ranging from Q1 = 2.97 m3/s to Q99 = 0.035 m3/sec indicating Q95 = 0.056 m3/s.
Figure 3 shows the network in the vicinity of the Donard WWTP site.
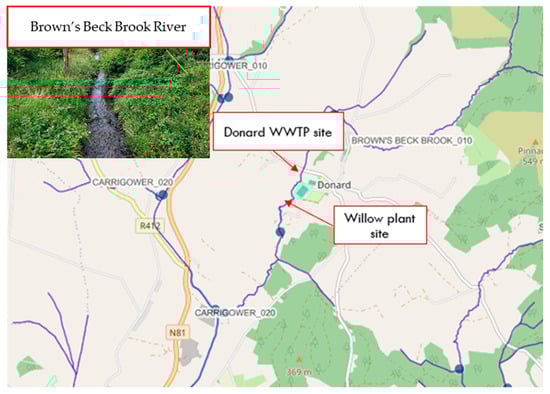
Figure 3.
River network at study area (Copyright: Bing Maps).
2.1.2. Remote Sensing PET Monthly Dataset
A recent spatial monthly remote sensing PET dataset was utilized to capture monthly values of potential evapotranspiration in the site of interest (Figure 4). The remote PET dataset, namely RASPOTION [31], has been developed using parametric modeling based on the simplification of the well-known Penman-Monteith model and remote sensing monthly temperatures [32]. The RASPOTION dataset has been validated with in-situ samples from various locations including the USA, Germany, Spain, Ireland, Greece, Australia, and China, and by using spatial Penman-Monteith estimates in England. The results in both cases are satisfactory. The key idea for using this dataset is the absence of reliable long-term meteorological gauges in the vicinity of the WWTP site which can allow estimating monthly PET. Having considered its reliability as set out above, the use of the remote sensing dataset can benefit the aim of the study.
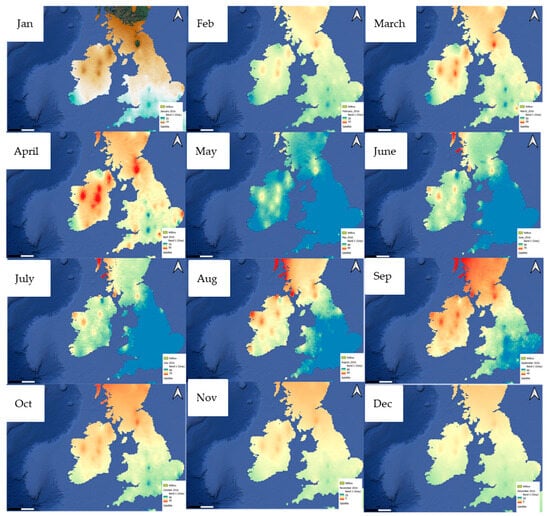
Figure 4.
Monthly PET values over Ireland RASPOTION model (2016).
The graph in Figure 5 below presents PET monthly values over the period 2003–2016 in the willow plantation site as acquired by the RASPOTION dataset. Monthly PET values vary from approximately 11 mm (in December) to 87 mm (in July). For the total PET sample, the minimum is 10.38 mm (in December 2010) and the monthly maximum is 87.59 mm (in July 2013).
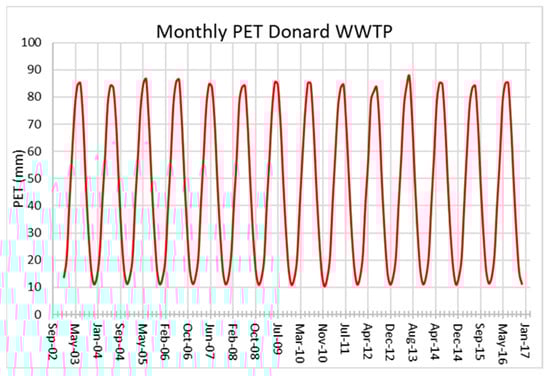
Figure 5.
Monthly PET time series at Donard WWTP plantation site (2003–2016).
The annual cumulative PET rate is estimated as being around 550 mm (see also Figure 5).
2.1.3. Willows Monthly Cropping Coefficients
Potential Evapotranspiration (ETo) represents the evapotranspiration from a hypothetical grass reference crop with an assumed height of 0.12 m and full water availability. The crop coefficient is a measure of the rate of evapotranspiration achieved by a plant in comparison to the reference evapotranspiration. It is determined by measuring the evapotranspiration (ETc) of crops under standard conditions. The ratio of ETc to ETo is referred to as the crop coefficient of a specific plant.
The factors that can affect the crop coefficient (Kc) include plant morphology, plant physiology, irrigation method, and rainfall frequency, all of which affect canopy resistance. To quantify the willow crop coefficient, an extended statistical analysis was carried out based on nine willow sites across Ireland [13,20] mainly in County Wexford and another two sites in Leitrim and Limerick Counties. As part of this study, four years of monitoring surveys were carried out to quantify the efficacy of the effluent treatment through advanced Willow Evapotranspiration. Several criteria were considered such as area requirement, willow clone variety, type of influent, and water distribution networks. The usage of a range willow clones has been observed including Bjorn, Torra, Jorr, Tordis, Torhild, Sven Inger, Olof, and Native (Salix Caprea, Salix atrocinerea, Salix pentandra, and Salix aurita).
Figure 6 shows the monthly crop coefficient samples across nine test sites in counties Wexford, Leitrim, and Limerick. It can be concluded that lower crop coefficient variances are observed from November to March and higher observed from April to October.
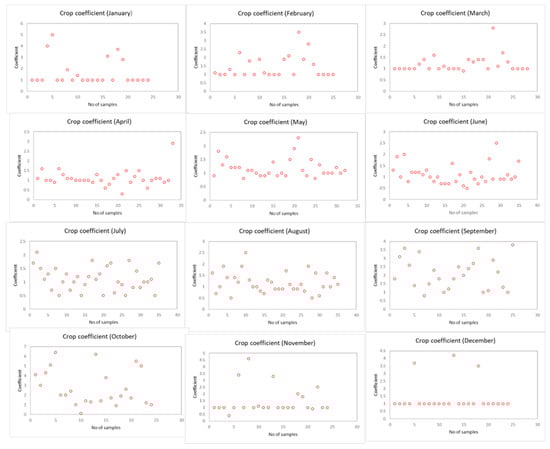
Figure 6.
Monthly Willow crop coefficients across Ireland.
2.2. Monte Carlo Monthly Water Balance Model Set-Up
A Monte Carlo monthly water balance hydrology model has been developed to estimate the monthly actual runoff from willow plantation sites under different crop coefficient conditions outlined in analysis Section 2.1.3.
The methodology employed includes the following:
- Monthly precipitation is input into the water balance model.
- A portion of the monthly rainfall is withdrawn as soil moisture based on the Met Éireann approach for poorly drained areas, which is summarized as follows: Soil moisture saturates on wet winter days, with water surplus drained at very slow rates, around 0.5 mm per day. The minimum Soil Moisture Deficit (SMD) is set at minus 10 mm. When SMD is greater than 10 mm, Actual Evapotranspiration (AE) is less than Potential Evapotranspiration (PE), decreasing linearly to zero when SMD reaches a theoretical maximum of 110 mm.
- Actual site runoff includes the following: (a) The monthly net proportion of rainfall minus soil moisture and minus willow actual evapotranspiration; (b) The effluent flow from WWTP, for which two scenarios have been set up associated with 500 PE, and two scenarios relevant to wastewater flows of 120 L/PE/day and 150 L/PE/day.
- Due to the high uncertainty of the willows’ monthly cropping pattern and monthly effluent flows, monthly random values based on the specified upper and lower limit monthly cropping factors and two wastewater scenarios have been set up. A total number of 100 monthly water balance models have been generated and the results are discussed below.
- The final model step refers to the exceedance probability density of the monthly plant surface runoff against low flow estimates (Q95 and Q99) at the adjacent tributary for quantifying the likelihood of the river’s quality deterioration.
Figure 7 visualizes the process of the new Monte Carlo model.
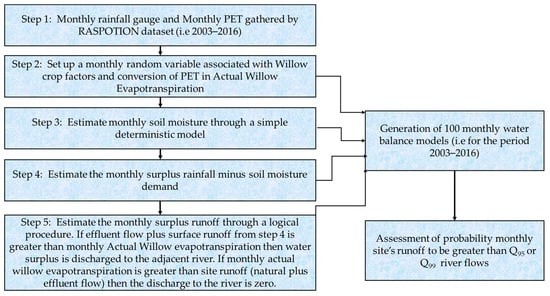
Figure 7.
Monte Carlo water balance model workflow.
3. Results
3.1. Actual Monthly Evapotranspiration Rates
Figure 8 shows the variability of the monthly ET willow over the period 2003–2016. Average monthly ET willows varies from 27.9 mm to 134.71 mm, maximum monthly ET willow rates vary from 43.5 mm to 212.9 mm, and minimum monthly ET willow rates vary from 2.95 mm to 67.49 mm.
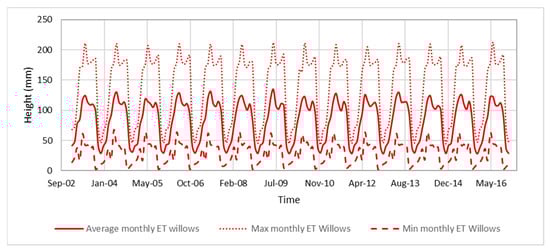
Figure 8.
Means of monthly ET willow rates over the period 2003–2016.
3.2. Monthly Surface Runoff Rates
Figure 9 shows the variability of the total site’s runoff over the period 2003–2016. Average monthly runoff varies from 0 mm to 244.12 mm, maximum monthly runoff varies from 0 mm to 262.5 mm, and minimum monthly runoff varies from 0 mm to 223 mm.
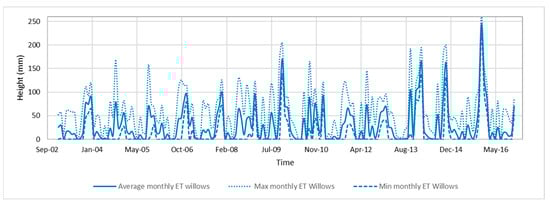
Figure 9.
Means of monthly site’s runoff over the period 2003–2016.
3.3. Actual Runoffs Withdraw Monthly Rates
Figure 10 shows the monthly statistics for average, maximum, and minimum simulated scenarios associated with effluent runoff withdrawal rates over the period 2003–2016.
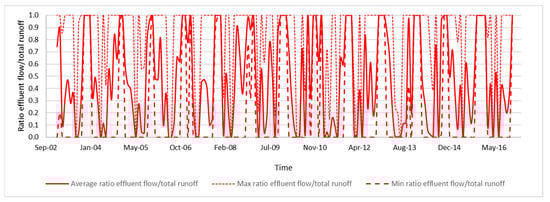
Figure 10.
Means of monthly effluent flow withdrawal rates.
The ratio of runoff is equal to 1 during very wet months of the average sample. During approximately 20% of the total simulated time, effluent flow is not treated/withdrawn through willow evapotranspiration, while for 70% of the average sample, it is partially treated. It has been assessed that for 10% of the time, there is full ET consumption of the effluent flow. The full ET consumption of the effluent in the results of the probabilistic model varies from 10 to 75% of the sample, providing a high variance due to high uncertainty mainly of the monthly willow crop factors.
3.4. Runoff Results vs. Minimum River Flow
The rational idea behind the present probabilistic modeling is to quantify monthly exceedances probabilities of site runoff against minimum river flow threshold (i.e., Q95 and Q99) of the adjacent river where it finally discharges both effluent and site’s surplus runoff.
It can be seen in Figure 11 that for all the simulated period, Donard willow plantation runoff is lower than both Q95 and Q99 river flows and for both zones A and B. Thus, riverine environmental degradation is not expected.
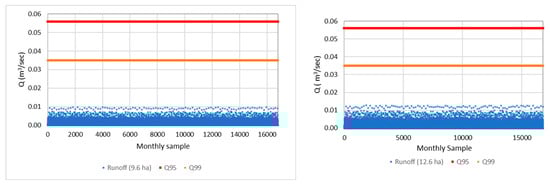
Figure 11.
Willow plant monthly runoff vs. Q99 and Q95 river flows threshold.
Taking advantage of the monthly modeling, failures probabilities can be assessed for a given site plant extension which can be defined as the probability of the site runoff exceedance minimum flows such as Q95 and Q99.
The latter is necessary for future design of willow plantation systems where the size of the plant along with the effluent flow of the WWTP are design parameters considering the low flows of the adjacent river tributary.
In this vein, two scenarios have been developed for a hypothetical plantation extent of 40 and 80 ha at Donard WWTP.
Figure 12 shows the monthly site runoff for both 40 ha and 80 ha scenarios. It can be concluded that for 40 ha site runoff scenario, there is no failure for the Q95 flow, and it is estimated a failure of 0.5% Q99 flow during wet periods. For the scenario associated with 80 ha, it has been assessed that there is an exceedance probability of 5% against Q99 flow and an exceedance probability of 1% against Q95 flow.
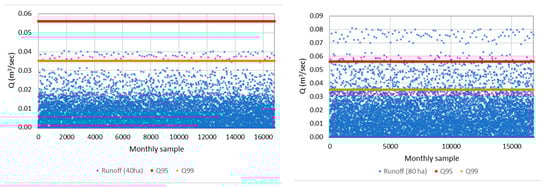
Figure 12.
Willow plant monthly runoff (scenarios 40 ha and 80 ha) vs. Q99 and Q95 river flows.
Following the above examples, it is easy to assess through the proposed Monte Carlo model the failure probabilities for different willow plantation areas scenarios and considering the seasonality of the simulated failures (summer or winter river flows) to provide an optimal design on a specific environmental engineering problem.
In order to thoroughly investigate plantation monthly variability, Figure 13 shows the monthly variability for three different scenarios as set out above. It can be concluded that higher variability is observed during the autumn and winter periods and substantially lower during the spring and summer. It can be seen also that for the scenario of 40 ha December’s runoff associated with outlier of the monthly sample are greater than Q99. For the scenario of 80 ha plantation, greater runoff flows than Q99 have been simulated for all months except the period March to May, while relevant runoff flows greater than Q95 are observed on October, November, December, and February and are referred on monthly outliers.
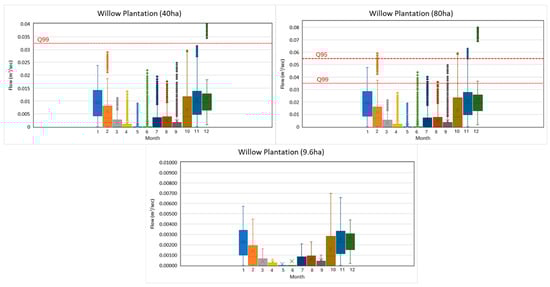
Figure 13.
Monthly willow plantation runoff box-plots for three scenarios (9.6 ha, 40 ha, and 80 ha).
4. Discussion
Herein, we discuss how the analysis can contribute to the existing knowledge, in order to design willow plantation for final treatment of effluent WWTP flows using a suite of remote sensing datasets, gauged records, and surveys from willow crop factors.
The main findings and issues for further consideration are as follows:
- A challenging problem in environmental engineering is the lack of long-term observations of several parameters related to a specific geoscience task. In this case, the limited information of crop monthly variation is crucial for developing a reliable modeling approach. Thus, a probabilistic Monte Carlo approach has been introduced using as random variables the monthly crop willow factors based on previous surveys in Ireland. The high uncertainty nature of these factors and their strong dependence on local meteorological conditions proves that the role of probabilistic modeling approach is necessary even though in this attempt, the probabilistic model did not consider the stochastic nature of the other meteorological variables such as rainfall and potential evapotranspiration. Future models are encouraged to use full stochastic frameworks and freely available integrated computational tools [33,34,35]. In this study, special attention has been given to Willow ET, which is a factor of local meteorological conditions, willow species, and willow management. Following a global review of 57 scientific studies across 16 countries [16] there is a clear linear regression of the water supply and Willow ET rate. The same review concludes that a critical threshold of plant density is 5 plants/m2 since for higher plant densities, ET rates are not linearly correlated.
- An important part of this study is the integration of rainfall gauge records along with PET remote sensing dataset in real world problems. Potential Evapotranspiration remains a challenging meteorological variable even in countries with advanced meteorological networks like Ireland. The recent advantages of using recent PET remote sensing dataset [36] could provide benefits in several tasks of geosciences as the “Electronic Age” offers new and attractive opportunities to hydrologists for remote sensing (RS) of hydrological data [37] as well as offers perspectives in the domain of forest hydrology [38]. In this study, the use of a recent remote sensing PET dataset in a small-scale model highlights its benefit for further use in other geoscience disciplines.
- In this study, monthly soil moisture has been assessed in conjunction with a deterministic model proposed by Met Éireann. In future studies, remote sensing soil moisture products could be considered [39,40], which will benefit modeling accuracy.
- The idea of the expansion of the paradigm on a national scale appears to be attractive and will benefit Irish environmental biodiversity which is key for National Policy [41], recognizing the vital role of ecological engineering in the design of sustainable ecosystems that integrate human society with its natural environment for the benefit of both [42].
- The natural WWTP treatment systems appear to be attractive, efficient, and low-cost solutions [43,44]. In conjunction with modern water reuse options [45], they could especially benefit decentralized communities by decreasing the pressure in natural water bodies. Monte Carlo approaches seem to be very promising in dealing with multiple uncertainty environmental engineering problems [46].
5. Conclusions
The use of enhanced willow evapotranspiration rates has been discussed in this paper as well as its use in treating the effluent flow of WWTP.
In this light, a monthly Monte Carlo water balance was introduced for assessing the actual monthly willow evapotranspiration effluent WWTP flow withdrawn in a real willow plantation system at Donard, co. Wicklow Ireland. The model was applied for the monthly period 2003–2016 when a PET remote sensing spatial dataset was available along with monthly rainfall gauges. The monthly willow cropping factors have been modeled as random variables based on extended monitoring surveys on nine sites across the country.
Given the high uncertainty of the water balance model, the approach appears to be promising for future design scopes associated with optimal extensions of the willow forestry plantation system as treatment systems of the final WWTP outflows. Future research could also focus on specific willow species/ages, water removal efficiency, and different model configurations by providing final open tank evaporation prior surface runoff discharge or catching dams to attenuate the surface surplus within the plantation site. Any other future research ideas should be well documented with financial aspects of willows plantation to prove that the use of this technique is simultaneously an environmental and cost-effective solution.
Funding
This research has not received any funding.
Data Availability Statement
The RASPOTION dataset is open and freely accessible from http://www.itia.ntua.gr/2167/ (accessed on 1 February 2022), where a total number of 168 monthly global raster files (GeoTIFF) are stored.
Acknowledgments
The author appreciates academic editors and also three reviewers’ constructive comments and discussion which helped to improve the manuscript substantially. The author is grateful to the scientific personnel Uisce Éireann, Met Éireann, EPA, OPW for their long-term commitments in establishing and maintaining a highly reliable meteorological, hydrometric, and environmental network. Special thanks to Danny Bourke, Director of Ryan Hanley Ltd. Ireland and Dara White, Uisce Éireann Wastewater Lead for their support and dedication throughout this research.
Conflicts of Interest
The author declares no conflict of interest.
References
- Zsuffa, L.; Mosseler, A.; Raj, Y. Ecology and Management of Forest Biomass Production Systems; Perttu, K.L., Ed.; Swedish University of Agricultural Sciences: Uppsala, Sweden, 1984; pp. 261–281. [Google Scholar]
- Gullberg, U. Towards making willows pilot species for coppicing production. For. Chron. 1993, 69, 721–726. [Google Scholar] [CrossRef]
- Volk, T.A.; Abrahamson, L.P.; Nowak, C.A.; Smart, L.B.; Tharakan, P.J.; White, E.H. The development of short-rotation willow in the northeastern United States for bioenergy and bioproducts, agroforestry and phytoremediation. Biomass Bioenergy 2006, 30, 715–727. [Google Scholar] [CrossRef]
- Guidi, W.; Pitre, F.E.; Labrecque, M. Short-rotation coppice of willows for the 689 production of biomass in eastern Canada. In Biomass Now-Sustainable Growth and Use; IntechOpen: London, UK, 2013. [Google Scholar]
- Lachapelle-T, X.; Labrecque, M.; Comeau, Y. Treatment and valorization of a primary municipal wastewater by a short rotation willow coppice vegetation filter. Ecol. Eng. 2019, 130, 32–44. [Google Scholar] [CrossRef]
- Dimitriou, I.; Rosenqvist, H. Sewage sludge and wastewater fertilisation of Short Rotation Coppice (SRC) for increased bioenergy production—Biological and economic potential. Biomass Bioenergy 2011, 35, 835–842. [Google Scholar] [CrossRef]
- Duggan, J. The potential for landfill leachate treatment using willows in the UK—A critical review. Resour. Conserv. Recycl. 2005, 45, 97–113. [Google Scholar] [CrossRef]
- Rüth, B.; Lennartz, B.; Kahle, P. Water regime of mechanical—Biological pretreated waste materials under fast-growing trees. Waste Manag. Res. 2007, 25, 408–416. [Google Scholar] [CrossRef] [PubMed]
- Mirck, J.; Volk, T.A. Seasonal sap flow of four Salix varieties growing on the Solvay wastebeds in Syracuse, NY, USA. Int. J. Phytoremediat 2009, 12, 1–23. [Google Scholar] [CrossRef]
- Witters, N.; Van Slycken, S.; Ruttens, A.; Adriaensen, K.; Meers, E.; Meiresonne, L.; Filip, M.G.; Tack, T.T.; Laes, E.; Vangronsveld, J. Short-rotation coppice of willow for phytoremediation of a metal-contaminated agricultural area: A sustainability assessment. BioEnergy Res. 2009, 2, 144–152. [Google Scholar] [CrossRef]
- Grenier, V.; Pitre, F.E.; Nissim, W.G.; Labrecque, M. Genotypic differences explain most of the response of willow cultivars to petroleum-contaminated soil. Trees 2015, 29, 871–881. [Google Scholar] [CrossRef]
- Gregersen, P.; Brix, H. Zero-discharge of nutrients and water in a willow dominated constructed wetland. Water Sci. Technol. 2001, 44, 407–412. [Google Scholar] [CrossRef]
- Curneen, S.J.; Gill, L.W. A comparison of the suitability of different willow varieties to treat on-site wastewater effluent in an Irish climate. J. Environ. Manag. 2014, 133, 153–161. [Google Scholar] [CrossRef] [PubMed]
- Hénault-Ethier, L.; Gomes, M.P.; Lucotte, M.; Smedbol, É.; Maccario, S.; Lepage, L.; Juneau, P.; Labrecque, M. High yields of riparian buffer strips planted with Salix miyabena ‘SX64’along field crops in Québec, Canada. Biomass Bioenergy 2017, 105, 219–229. [Google Scholar] [CrossRef]
- Yoder, K.S.; Moser, B.C. 696 (PS 5) pussy willow branches—A new crop for 888 sustainable agriculture. Hort. Sci. 1993, 28, 551. [Google Scholar]
- Frédette, C.; Labrecque, M.; Comeau, Y.; Brisson, J. Willows for environmental projects: A literature review of results on evapotranspiration rate and its driving factors across the genus Salix. J. Environ. Manag. 2019, 246, 526–537. [Google Scholar] [CrossRef]
- McMahon, T.A.; Finlayson, B.L.; Peel, M.C. Historical developments of models for estimating evaporation using standard meteorological data. Water 2016, 3, 788–818. [Google Scholar] [CrossRef]
- Tegos, A.; Malamos, N.; Koutsoyiannis, D. A parsimonious regional parametric evapotranspiration model based on a simplification of the Penman–Monteith formula. J. Hydrol. 2015, 524, 708–717. [Google Scholar] [CrossRef]
- Tegos, A.; Malamos, N.; Efstratiadis, A.; Tsoukalas, I.; Karanasios, A.; Koutsoyiannis, D. Parametric modelling of potential evapotranspiration: A global survey. Water 2017, 9, 795. [Google Scholar] [CrossRef]
- Curneen, S. An Assessment of the Performance of Willow Evapotranspiration Systems for the Treatment of On-Site Wastewater in Ireland. Doctoral Dissertation, Trinity College Dublin, Dublin, Ireland, 2014. [Google Scholar]
- Vicente-Serrano, S.M.; Domínguez-Castro, F.; Murphy, C.; Hannaford, J.; Reig, F.; Peña-Angulo, D.; Tramblay, Y.; Trigo, R.M.; MacDonald, N.; El Kenawy, A.; et al. Long-term variability and trends in meteorological droughts in Western Europe (1851–2018). Int. J. Climatol. 2021, 41, E690–E717. [Google Scholar] [CrossRef]
- Noone, S.; Broderick, C.; Duffy, C.; Matthews, T.K.; Wilby, R.L.; Murphy, C. A 250 year drought catalogue for the island of Ireland (1765-2015). Int. J. Climatol. 2017, 37, 239–254. [Google Scholar] [CrossRef]
- Tegos, A.; Cody, J. Recent insights in developing Standardized-Precipitation-Evapotranspiration index and 152-years drought assessment for Dublin area (1850–2022). In Proceedings of the Irish National Hydrology Conference, Tullamore, Ireland, 14 November 2023. [Google Scholar]
- Tegos, A.; Schlüter, W.; Gibbons, N.; Katselis, Y.; Efstratiadis, A. Assessment of environmental flows from complexity to parsimony—Lessons from Lesotho. Water 2018, 10, 1293. [Google Scholar] [CrossRef]
- Oswald Spring, Ú.; Oswald Spring, Ú. The Nexus among Water, Soil, Food, Biodiversity and Energy Security. In Earth at Risk in the 21st Century: Rethinking Peace, Environment, Gender, and Human, Water, Health, Food, Energy Security, and Migration: With a Foreword by Lourdes Arizpe Schlosser and a Preface by Hans Günter Brauch; Springer: Cham, Switzerland, 2020; pp. 543–578. [Google Scholar]
- Dimitriadis, P.; Tegos, A.; Koutsoyiannis, D. Stochastic analysis of hourly to monthly potential evapotranspiration with a focus on the long-range dependence and application with reanalysis and ground-station data. Hydrology 2021, 8, 177. [Google Scholar] [CrossRef]
- Asfaw, D.T.; Singer, M.B.; Rosolem, R.; MacLeod, D.; Cuthbert, M.; Miguitama, E.Q.; Gaona, M.F.R.; Michaelides, K. stoPET v1. 0: A stochastic potential evapotranspiration generator for simulation of climate change impacts. Geosci. Model. Dev. Discuss. 2023, 16, 557–571. [Google Scholar] [CrossRef]
- Long, T.; Wang, D.; Wu, X.; Chen, X.; Huang, Z. Simulation of Irrigation Strategy Based on Stochastic Rainfall and Evapotranspiration. Agronomy 2023, 13, 2849. [Google Scholar] [CrossRef]
- Koutsoyiannis, D. HESS Opinions “A random walk on water”. Hydrol. Earth Syst. Sci. 2010, 14, 585–601. [Google Scholar] [CrossRef]
- Bree, T. Flow Duration Curves for Ungauged Catchments in Ireland; EPA: Washington, DC, US, 2018.
- Tegos, A.; Malamos, N.; Koutsoyiannis, D. Raspotion—A new global PET dataset by means of remote monthly temperature data and parametric modelling. Hydrology 2022, 9, 32. [Google Scholar] [CrossRef]
- Hooker, J.; Duveiller, G.; Cescatti, A. A global dataset of air temperature derived from satellite remote sensing and weather stations. Sci. Data 2018, 5, 1–11. [Google Scholar] [CrossRef]
- Francesco, C.; Papalexiou, S.M.; Markonis, Y.; Grimaldi, S. PyCoSMoS: An advanced toolbox for simulating real-world hydroclimatic data. Environ. Model. Softw. 2024, 178, 106076. [Google Scholar] [CrossRef]
- Efstratiadis, A.; Dialynas, Y.G.; Kozanis, S.; Koutsoyiannis, D. A multivariate stochastic model for the generation of synthetic time series at multiple time scales reproducing long-term persistence. Environ. Model. Softw. 2014, 62, 139–152. [Google Scholar] [CrossRef]
- Tsoukalas, I.; Kossieris, P.; Makropoulos, C. Simulation of non-Gaussian correlated random variables, stochastic processes and random fields: Introducing the anySim R-Package for environmental applications and beyond. Water 2020, 12, 1645. [Google Scholar] [CrossRef]
- Bhattarai, N.; Wagle, P. Recent Advances in Remote Sensing of Evapotranspiration. Remote Sens. 2021, 13, 4260. [Google Scholar] [CrossRef]
- Schultz, G.A. Remote sensing in hydrology. J. Hydrol. 1988, 100, 239–265. [Google Scholar] [CrossRef]
- Stewart, J.B.; Finch, J.W. Application of remote sensing to forest hydrology. J. Hydrol. 1993, 150, 701–716. [Google Scholar] [CrossRef]
- Mohanty, B.P.; Cosh, M.H.; Lakshmi, V.; Montzka, C. Soil moisture remote sensing: State-of-the-science. Vadose Zone J. 2017, 16, 1–9. [Google Scholar] [CrossRef]
- Brocca, L.; Ciabatta, L.; Massari, C.; Camici, S.; Tarpanelli, A. Soil moisture for hydrological applications: Open questions and new opportunities. Water 2017, 9, 140. [Google Scholar] [CrossRef]
- Morrison, R.; Bullock, C. A National Biodiversity Expenditure Review for Ireland; University College Dublin: Dublin, Ireland, 2018. [Google Scholar]
- Mitsch, W.J.; Jørgensen, S.E. Ecological engineering: A field whose time has come. Ecol. Eng. 2003, 20, 363–377. [Google Scholar] [CrossRef]
- Knight, R.; McKim, T.W.; Kohl, H.R. Performance of a natural wetland treatment system for wastewater management. J. (Water Pollut. Control Fed.) 1987, 59, 746–754. [Google Scholar]
- Brissaud, F. Low technology systems for wastewater treatment: Perspectives. Water Sci. Technol. 2007, 55, 1–9. [Google Scholar] [CrossRef] [PubMed][Green Version]
- Makropoulos, C.; Rozos, E.; Tsoukalas, I.; Plevri, A.; Karakatsanis, G.; Karagiannidis, L.; Makri, E.; Lioumis, C.; Noutsopoulos, C.; Mamais, D.; et al. Sewer-mining: A water reuse option supporting circular economy, public service provision and entrepreneurship. J. Environ. Manag. 2018, 216, 285–298. [Google Scholar] [CrossRef]
- Psarrou, E.; Tsoukalas, I.; Makropoulos, C. A Monte-Carlo-based method for the optimal placement and operation scheduling of sewer mining units in urban wastewater networks. Water 2018, 10, 200. [Google Scholar] [CrossRef]


Disclaimer/Publisher’s Note: The statements, opinions and data contained in all publications are solely those of the individual author(s) and contributor(s) and not of MDPI and/or the editor(s). MDPI and/or the editor(s) disclaim responsibility for any injury to people or property resulting from any ideas, methods, instructions or products referred to in the content. |
© 2024 by the author. Licensee MDPI, Basel, Switzerland. This article is an open access article distributed under the terms and conditions of the Creative Commons Attribution (CC BY) license (https://creativecommons.org/licenses/by/4.0/).