
Assessments of Heavy Metal Contaminants in the Drenica River and Bioremediation by Typha angustifolia

 ,
,  ,
,  , ,
, ,  and
and 
Abstract
1. Introduction
2. Materials and Methods
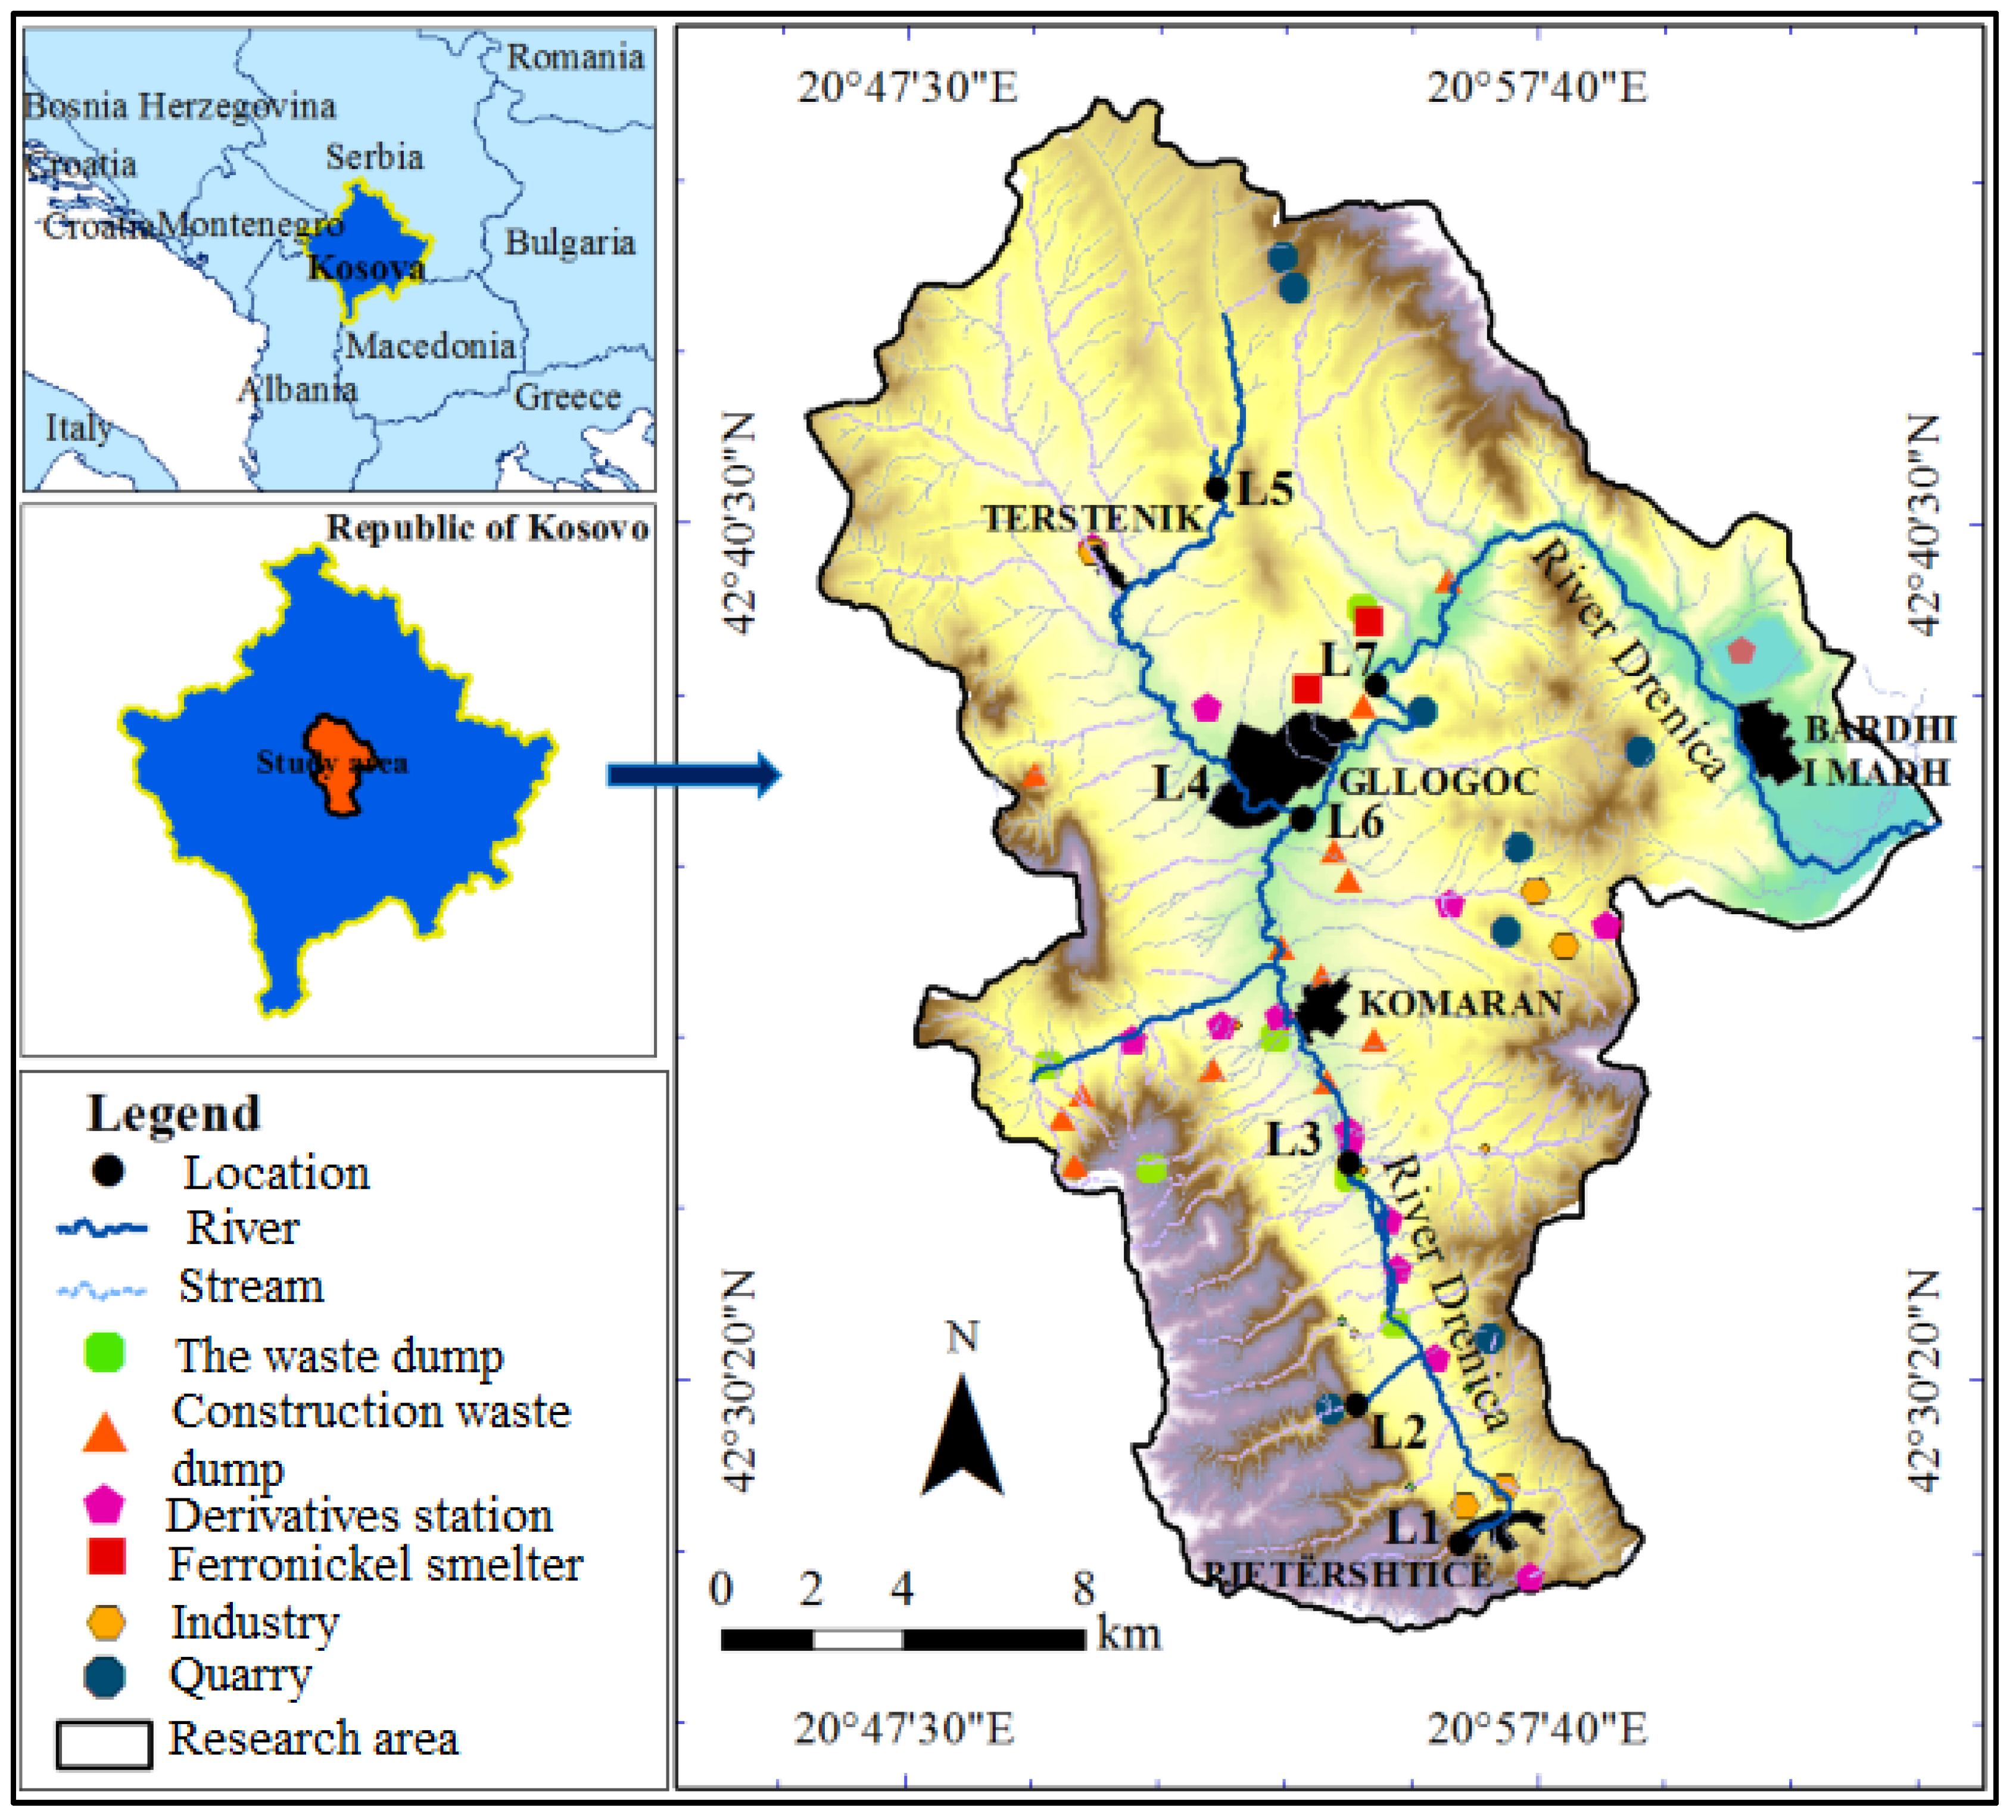
2.1. Study Area
2.2. Preparation of Samples
2.3. Statistical Analysis

| Index | Equation | Category and Description | References |
|---|---|---|---|
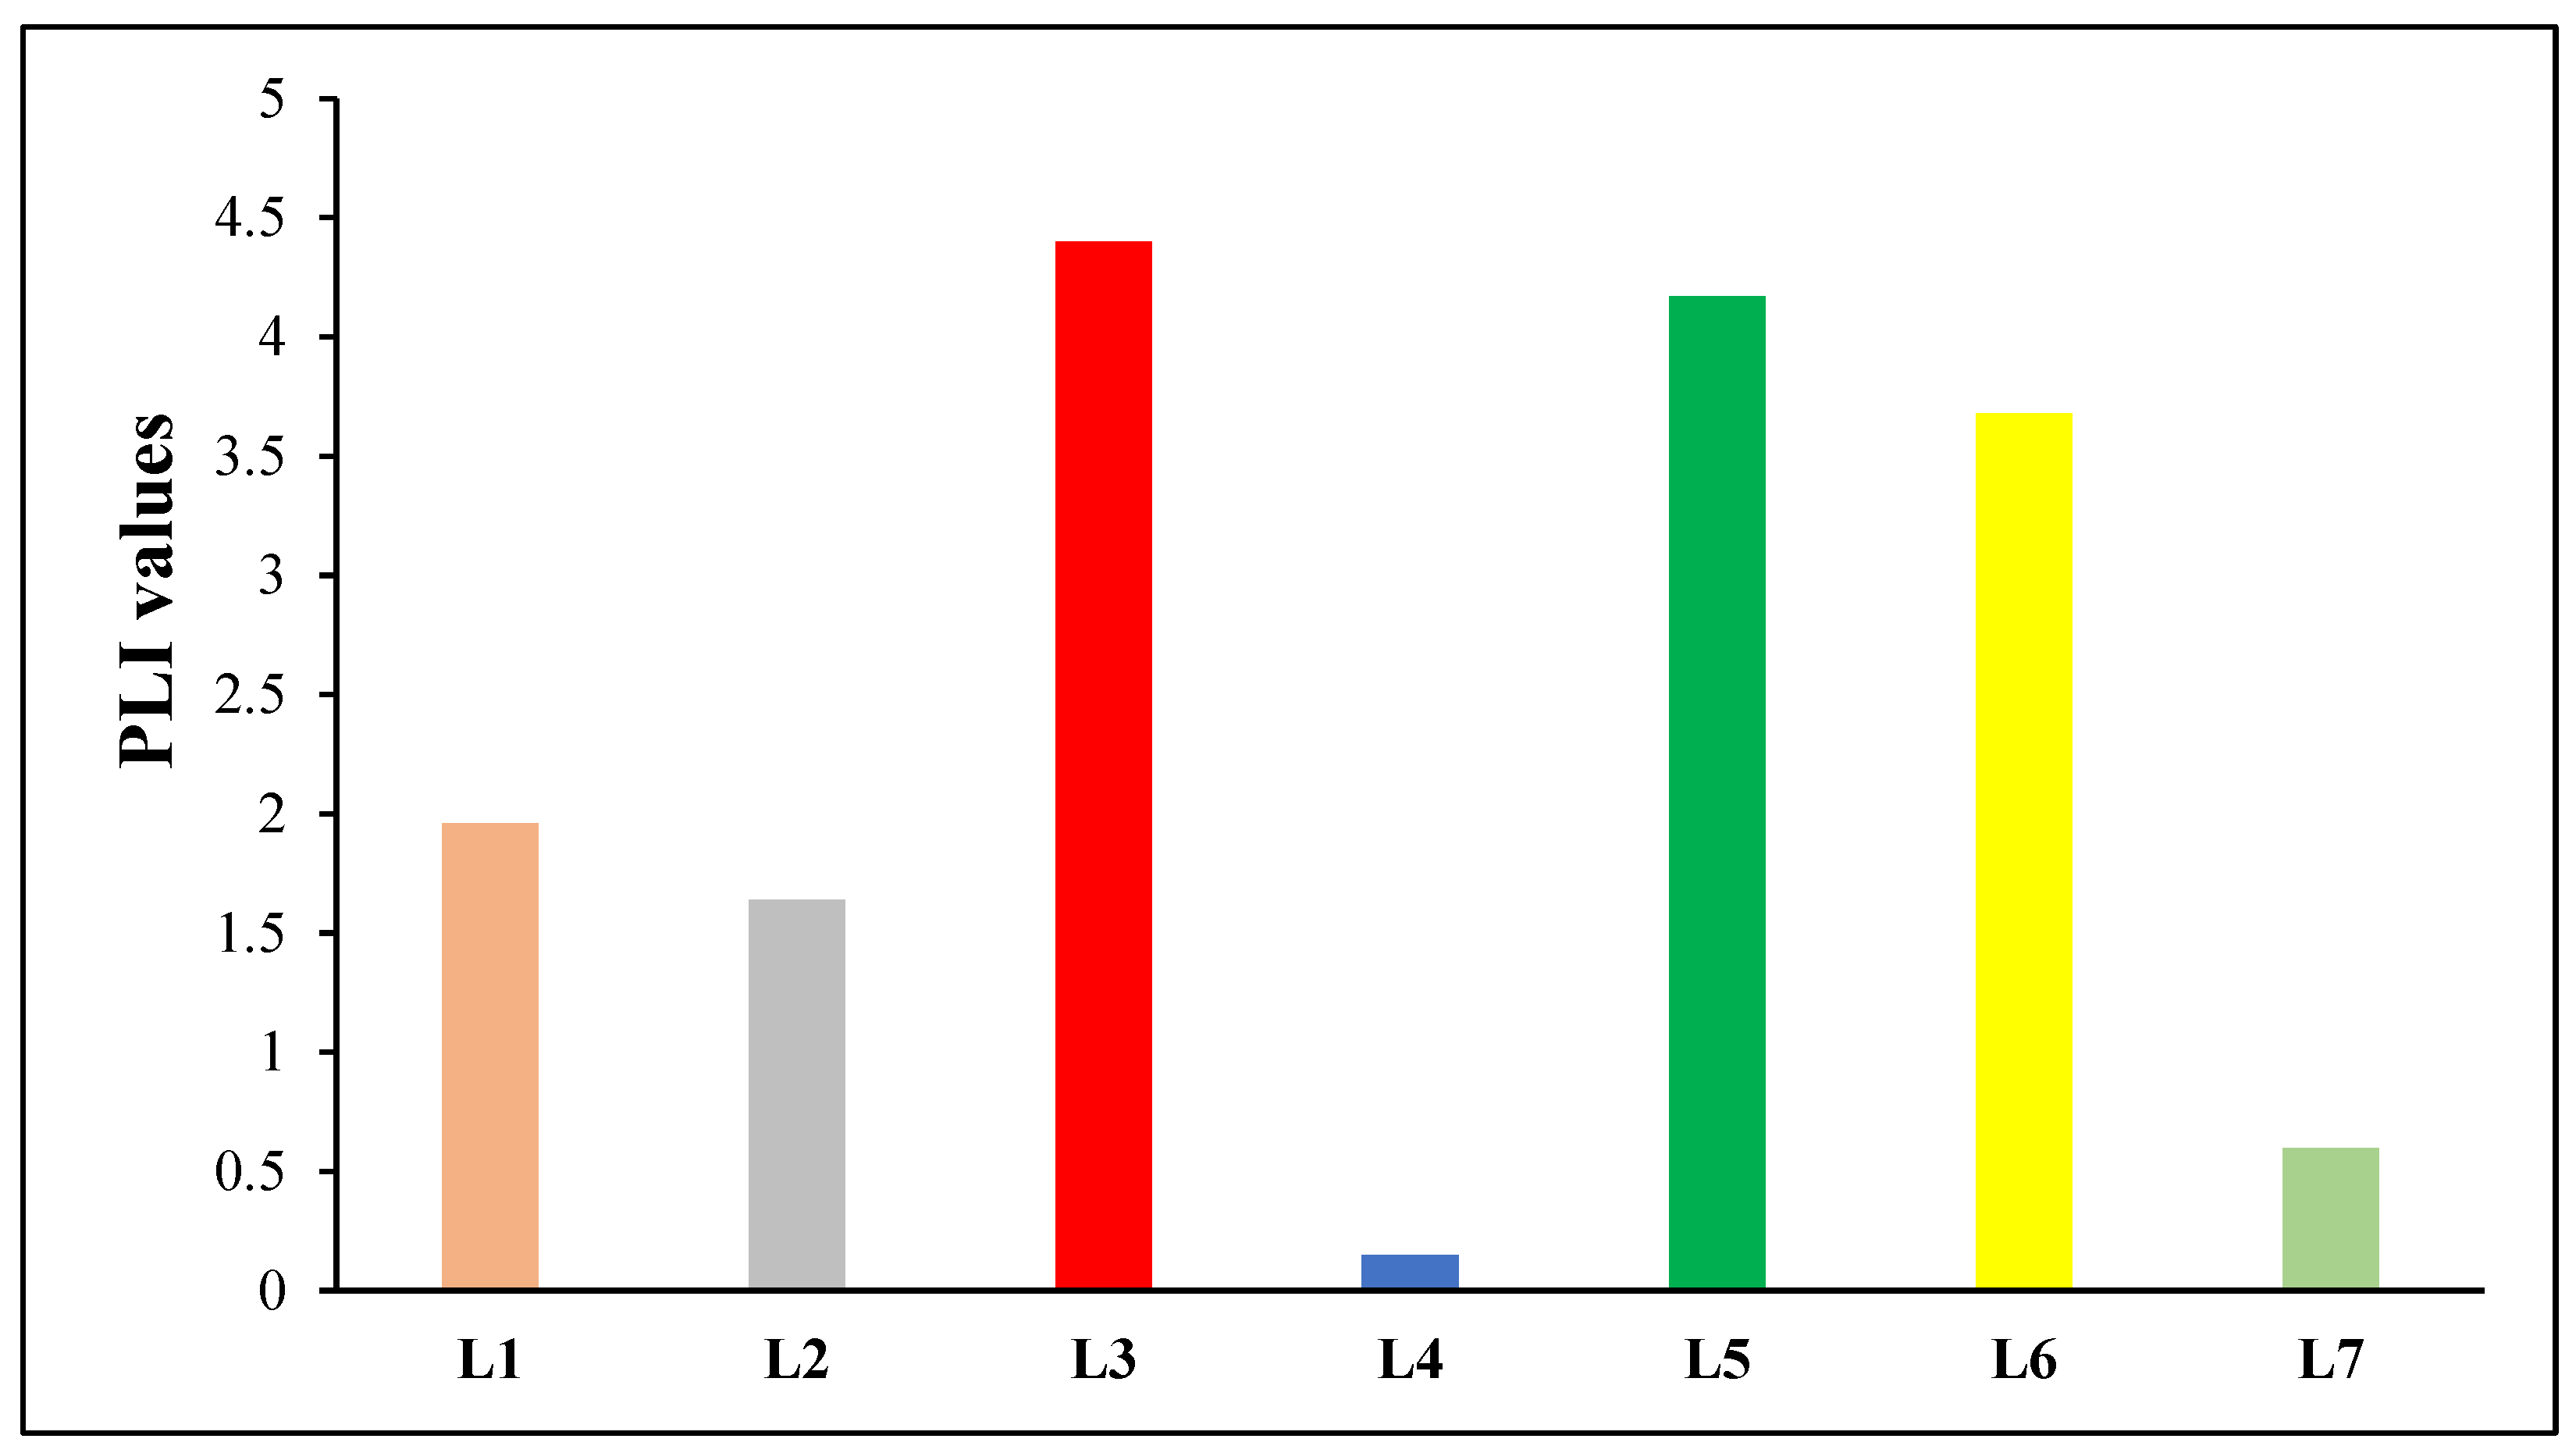
| Pollution load index (PLI) | PLI = , where n is the total number of heavy metals being considered and CF is the contamination factor. | PLI = 0 denotes an ideal condition of no pollution, PLI = 1 denotes the presence of merely baseline levels of pollutants, and PLI > 1 denotes the site’s ongoing deterioration. | [42] |
| Contamination factor (CF) | Cfmetals = Cmetal/Background | The Hakanson (Hakanson, L. 1980) [11] classification method is utilized to classify metal CF. This results in the following four classes: CF ˂ 1 (class 1), 1 ≤ CF < 3 (class 2), 3 ≤ CF < 6 (class 3), and CF ≥ 6 (class 4). These classes indicate varying degrees of contamination, namely low, moderate, considerable, and very high. | [43] |
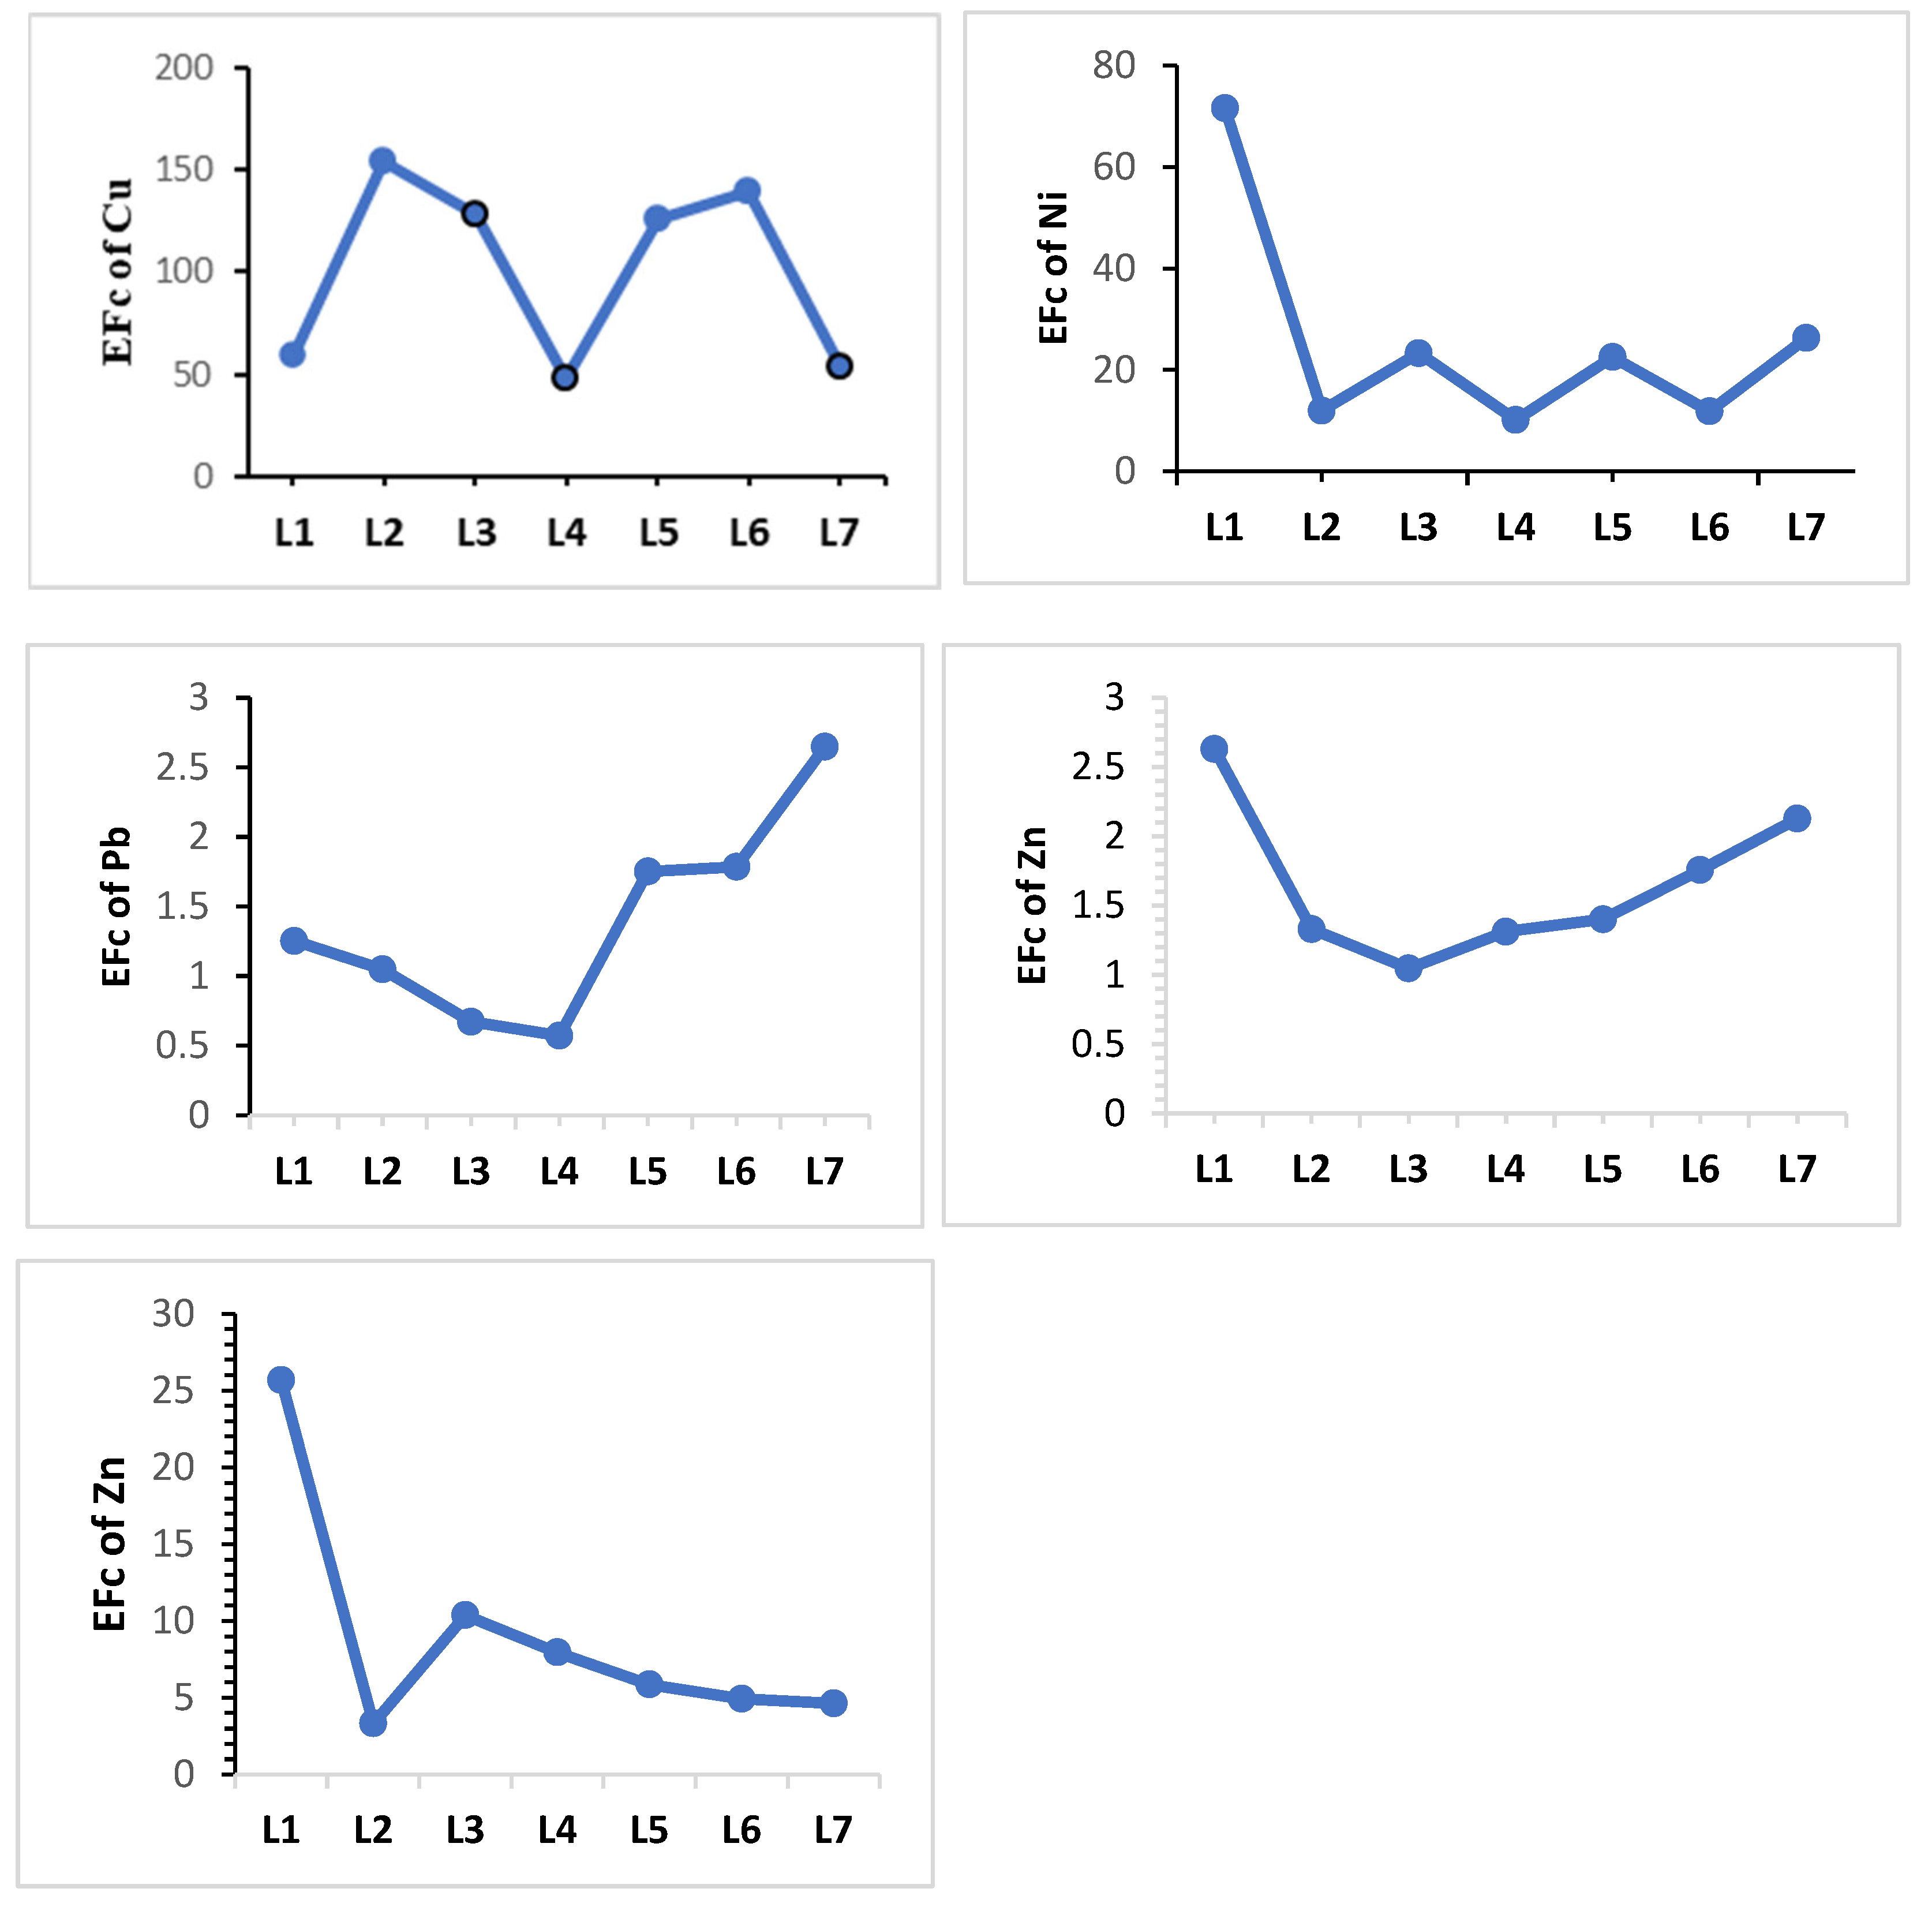
| Enrichment factor (EF) | EF = | The enrichment factor (EF) can be generally understood as follows [44,45]: <2, minimal; 2–5, moderate; 5–20, substantial; 20–40, very high; >40, extremely high. | [44,45] |
| Geoaccumulation index (Igeo) | Igeo = log2[Cn/1.5 Bn], where Bn is the background value for a given metal (n), Cn is the observed concentration of that metal in the sediment, and a factor of 1.5 is applied because the background data may vary due to lithological differences. | Igeo ≤ 0, practically unpolluted; 0 ≤ Igeo ≤1, unpolluted to moderately polluted; 1 ≤ I geo ≤ 2, moderately polluted; 2 ≤ Igeo ≤ 3, moderately to heavily polluted; 3 ≤ Igeo ≤ 4, heavily polluted; 4 ≤ I geo ≤ 5, heavily to highly polluted; 5 ≤ I geo, extremely polluted. | [46,47] |
| Potential ecological risk factor (Eif) | According to Duodu et al. (2016), RI = ∑ Er = ∑ Tr × CF, where Tr indicates each metal’s toxicological response factor, whereas Er denotes the possible ecological danger factor of that particular metal. The contamination factor (CF) for any metal is known. | The Hakanson (1980) [11] standardized response coefficient for heavy metal toxicity was chosen as the evaluation criterion. The corresponding toxicity coefficients were Cd = 30, Cu = 5, Pb = 5, Ni = 5, Cr = 2, and Zn = 1 [47]. RI < 150, low risk; 150 ≤ RI < 300, moderate risk; 80 ≤ Er < 160, considerable risk; 160 ≤ Er < 320, high risk; Er ≥ 320 very high risk | [48,49] |
| Potential ecological risk index (RI) | As per the research conducted by (Hakanson, 1980) [11], the RI is determined using the following equation: Ri = where Er is the ecological risk factor of a given elected at each soil sample location, RI is the integrated potential ecological risk index, calculated as a sum of the Eri for all examined heavy metals. | RI < 150, low risk; 150 ≤ RI < 300, moderate risk; 300 ≤ RI < 600, considerable risk; RI ≥ 600, high risk | [47] |
| Bioaccumulation coefficient | BFC = Cplant parts/Csoil | C plant parts, metal concentration in plant (mg/kg dry weight); C soil, concentration in soil (mg/kg dry weight). | [50] |
3. Results and Discussions
4. Conclusions
Author Contributions
Funding
Data Availability Statement
Acknowledgments
Conflicts of Interest
References
- Borowiak, K.; Kanclerz, J.; Mleczek, M.; Lisiak, M.; Drzewiecka, K. Accumulation of Cd and Pb in Water, Sediment and Two Littoral Plants (Phragmites Australis, Typha Angustifolia) of Freshwater Ecosystem. Arch. Environ. Prot. 2016, 42, 47–57. [Google Scholar] [CrossRef]
- Catalina Cristescu, A.; Covaliu, C.; Popa, L.; Dumitru, D.; Anghelet, A. Study on Use of Typha angustifolia L. in Wastewater Treatment: Promising Method in Removal of Copper Ions Present in Aquatic Solution. In Proceedings of the 17th International Scientific Conference Engineering for Rural Development, Jełgawa, Łotwa, 23–25 May 2018. [Google Scholar]
- Chandra, R.; Yadav, S. Potential of Typha angustifolia for Phytoremediation of Heavy Metals from Aqueous Solution of Phenol and Melanoidin. Ecol. Eng. 2010, 36, 1277–1284. [Google Scholar] [CrossRef]
- Chandra, R.; Yadav, S. Phytoremediation of CD, CR, CU, MN, FE, NI, PB and ZN from Aqueous Solution Using Phragmites Cummunis, Typha Angustifolia and Cyperus Esculentus. Int. J. Phytoremediation 2011, 13, 580–591. [Google Scholar] [CrossRef]
- Ali, H.; Khan, E.; Sajad, M.A. Phytoremediation of Heavy Metals—Concepts and Applications. Chemosphere 2013, 91, 869–881. [Google Scholar] [CrossRef]
- Brankovic, S.; Pavlovic-Muratspahic, D.; Topuzovic, M.; Glišic, R.; Bankovic, D.; Stankovic, M. Environmental Study of Some Metals on Several Aquatic Macrophytes. Afr. J. Biotechnol. 2011, 10, 11956–11965. [Google Scholar]
- Wahab Al-Baldawi, I.A.; Abdullah, S.R.S.; Suja, F.; Anuar, N.; Idris, M. Phytoremediation of Contaminated Ground Water Using Typha Angustifolia. Water Pract. Technol. 2015, 10, 616–624. [Google Scholar] [CrossRef]
- Dobberteen, R.A.; Nickerson, N.H. Use of Created Cattail (Typha) Wetlands in Mitigation Strategies. Environ. Manag. 1991, 15, 797–808. [Google Scholar] [CrossRef]
- Murphy, K.J. Plant Communities and Plant Diversity in Softwater Lakes of Northern Europe. Aquat. Bot. 2002, 73, 287–324. [Google Scholar] [CrossRef]
- Demırezen, D.; Aksoy, A. Accumulation of Heavy Metals in Typha angustifolia (L.) and Potamogeton pectinatus (L.) Living in Sultan Marsh (Kayseri, Turkey). Chemosphere 2004, 56, 685–696. [Google Scholar] [CrossRef]
- Hakanson, L. An ecological risk index for aquatic pollution control. A sedimentological approach. Water Res. 1980, 14, 975–1001. [Google Scholar] [CrossRef]
- Occhipinti-Ambrogi, A.; Savini, D. Biological Invasions as a Component of Global Change in Stressed Marine Ecosystems. Mar. Pollut. Bull. 2003, 46, 542–551. [Google Scholar] [CrossRef] [PubMed]
- Fediuc, E.; Erdei, L. Physiological and Biochemical Aspects of Cadmium Toxicity and Protective Mechanisms Induced in Phragmites Australis and Typha Latifolia. J. Plant Physiol. 2002, 159, 265–271. [Google Scholar] [CrossRef]
- Klavinš, M.; Briede, A.; Rodinov, V.; Kokorite, I.; Parele, E.; Klavina, I. Heavy Metals in Rivers of Latvia. Sci. Total Environ. 2000, 262, 175–183. [Google Scholar] [CrossRef]
- Long-term Changes in Macroinvertebrate Communities of a Heavy Metal Polluted Stream: The River Nent (Cumbria, UK) after 28 Years—Armitage—2007—River Research and Applications—Wiley Online Library. Available online: https://onlinelibrary.wiley.com/doi/10.1002/rra.1022 (accessed on 29 August 2024).
- Okrikata, E.; Nwosu, L.C. Heavy Metals and Pesticides as Hazardous Wastes and Strategies for Minimizing Their Hazards. Int. J. Res. Publ. Rev. 2023, 4, 4920–4934. [Google Scholar]
- Briffa, J.; Sinagra, E.; Blundell, R. Heavy Metal Pollution in the Environment and Their Toxicological Effects on Humans. Heliyon 2020, 6, e04691. [Google Scholar] [CrossRef]
- Luo, L.; Wang, B.; Jiang, J.; Fitzgerald, M.; Huang, Q.; Yu, Z.; Li, H.; Zhang, J.; Wei, J.; Yang, C.; et al. Heavy Metal Contaminations in Herbal Medicines: Determination, Comprehensive Risk Assessments, and Solutions. Front. Pharmacol. 2021, 11, 595335. [Google Scholar] [CrossRef]
- Soliman, M.M.; Hesselberg, T.; Mohamed, A.A.; Renault, D. Trophic Transfer of Heavy Metals along a Pollution Gradient in a Terrestrial Agro-Industrial Food Web. Geoderma 2022, 413, 115748. [Google Scholar] [CrossRef]
- Babu, S.M.O.F.; Hossain, M.B.; Rahman, M.S.; Rahman, M.; Ahmed, A.S.S.; Hasan, M.M.; Rakib, A.; Emran, T.B.; Xiao, J.; Simal-Gandara, J. Phytoremediation of Toxic Metals: A Sustainable Green Solution for Clean Environment. Appl. Sci. 2021, 11, 10348. [Google Scholar] [CrossRef]
- Deng, S.; Zhang, X.; Zhu, Y.; Zhuo, R. Recent Advances in Phyto-Combined Remediation of Heavy Metal Pollution in Soil. Biotechnol. Adv. 2024, 72, 108337. [Google Scholar] [CrossRef]
- Bastviken, S.K.; Eriksson, P.G.; Premrov, A.; Tonderski, K. Potential Denitrification in Wetland Sediments with Different Plant Species Detritus. Ecol. Eng. 2005, 25, 183–190. [Google Scholar] [CrossRef]
- Maine, M.A.; Suñe, N.; Hadad, H.; Sánchez, G.; Bonetto, C. Nutrient and Metal Removal in a Constructed Wetland for Wastewater Treatment from a Metallurgic Industry. Ecol. Eng. 2006, 26, 341–347. [Google Scholar] [CrossRef]
- Sompura, Y.; Bhardwaj, S.; Selwal, G.; Soni, V.; Ashokkumar, K. Unrevealing the Potential of Aquatic Macrophytes for Phytoremediation in Heavy Metal-Polluted Wastewater. J. Curr. Opin. Crop Sci. 2024, 5, 48–61. [Google Scholar] [CrossRef]
- Ansari, A.A.; Naeem, M.; Gill, S.S.; AlZuaibr, F.M. Phytoremediation of Contaminated Waters: An Eco-Friendly Technology Based on Aquatic Macrophytes Application. Egypt. J. Aquat. Res. 2020, 46, 371–376. [Google Scholar] [CrossRef]
- Bytyqi, P.; Czikkely, M.; Shala-Abazi, A.; Fetoshi, O.; Ismaili, M.; Hyseni-Spahiu, M.; Ymeri, P.; Kabashi-Kastrati, E.; Millaku, F. Macrophytes as Biological Indicators of Organic Pollution in the Lepenci River Basin in Kosovo. J. Freshw. Ecol. 2020, 35, 105–121. [Google Scholar] [CrossRef]
- Bytyçi, P.; Shala-Abazi, A.; Zhushi-Etemi, F.; Bonifazi, G.; Hyseni-Spahiu, M.; Fetoshi, O.; Çadraku, H.; Feka, F.; Millaku, F. The Macrophyte Indices for Rivers to Assess the Ecological Conditions in the Klina River in the Republic of Kosovo. Plants 2022, 11, 1469. [Google Scholar] [CrossRef]
- Bytyçi, P.; Ymeri, P.; Czikkely, M.; Fetoshi, O.; Shala-Abazi, A.; Ismaili, M.; Ramshaj, Q.; Millaku, F. The Application of Benthic Diatoms in Water Quality Assessment in Lepenci River Basin, Kosovo. J. Ecol. Eng. 2019, 20, 43–57. [Google Scholar] [CrossRef]
- Zhushi Etemi, F.; Çadraku, H.; Bytyçi, A.; Kuçi, T.; Desku, A.; Ymeri, P.; Bytyçi, P. Correlation between Physical and Chemical Parameters of Water and Biotic Indices: The Case Study the White Drin River Basin, Kosovo. J. Water Land Dev. 2020, 46, 229–241. [Google Scholar] [CrossRef]
- Etemi, F.Z.; Bytyçi, P.; Ismaili, M.; Fetoshi, O.; Ymeri, P.; Shala–Abazi, A.; Muja-Bajraktari, N.; Czikkely, M. The Use of Macroinvertebrate Based Biotic Indices and Diversity Indices to Evaluate the Water Quality of Lepenci River Basin in Kosovo. J. Environ. Sci. Health Part A 2020, 55, 748–758. [Google Scholar] [CrossRef]
- Bytyçi, P.S.; Etemi, F.Z.; Ismaili, M.A.; Shala, S.A.; Serbinovski, M.S.; Çadraku, H.S.; Fetoshi, O.B. Biomonitoring of water quality of river nerodime based on physicochemical parameters and macroinvertebrates. Rasayan J. Chem 2018, 11, 554–568. [Google Scholar] [CrossRef]
- Abd Elnabi, M.K.; Elkaliny, N.E.; Elyazied, M.M.; Azab, S.H.; Elkhalifa, S.A.; Elmasry, S.; Mouhamed, M.S.; Shalamesh, E.M.; Alhorieny, N.A.; Abd Elaty, A.E.; et al. Toxicity of Heavy Metals and Recent Advances in Their Removal: A Review. Toxics 2023, 11, 580. [Google Scholar] [CrossRef]
- Çadraku, H.S.; Bublaku, S.; Krasniqi, V.G. Integrated Management of Water Resources—Case Study Municipality Drenas (Gllogoc), Republic of Kosovo. Rev. Gestão Soc. Ambient. 2024, 18, e07562. [Google Scholar] [CrossRef]
- Ministry of Environment and Spatial Planning. State of Water Report 2015; Ministry of Environment and Spatial Planning: Parramatta, Australia, 2015. [Google Scholar]
- ICMM. Geological Map of Kosovo. (Scale 1: 200 000); ICMM: London, UK, 2006. [Google Scholar]
- ICMM. Hydrogeological Map of Kosovo. (Scale 1: 200 000); ICMM: London, UK, 2006. [Google Scholar]
- Municipal Development Plan of Gllogoc 2020–2028; UN-Habitat Kosovo: Prishtina, Kosovo, 2006.
- Koto, R.; Bani, A.; Topi, T.; Topi, M. Water Quality and Heavy Metal Content of Karavasta Lagoon in Albania. Fresenius Environ. Bull. 2014, 23, 3296–3302. [Google Scholar]
- Koto, R.; Bani, A. Assessment of nutrients and vegetation in Karavasta Lagoon. In Proceedings of the International Conference on Soil Proceedings, Tirana, Albania, 4–6 May 2015; p. 227, ISBN 978-9928-110-58-9. [Google Scholar]
- Koto, R.; Hoxha, L.; Bani, A. Analysis of water quality, heavy metals and nutrient of karavasta lagoon using gis assessment of ecological risk. J. Hyg. Eng. Des. 2022, 41, 162–169. [Google Scholar]
- Koto, R.; Bani, A. Physico-Chemical Characteristics and Heavy Metal Contents of Water from Karavasta Lagoon, Albania. Albanian J. Agric. Sci. 2014, 13, 55–60. [Google Scholar]
- Singh, H.; Pandey, R.; Singh, S.K.; Shukla, D.N. Assessment of Heavy Metal Contamination in the Sediment of the River Ghaghara, a Major Tributary of the River Ganga in Northern India. Appl Water Sci 2017, 7, 4133–4149. [Google Scholar] [CrossRef]
- Turekian, K.K.; Wedepohl, K.H. Distribution of the Elements in Some Major Units of the Earth’s Crust. Geol. Soc. Am. Bull. 1961, 72, 175. [Google Scholar] [CrossRef]
- Zhang, J.; Liu, C.L. Riverine Composition and Estuarine Geochemistry of Particulate Metals in China—Weathering Features, Anthropogenic Impact and Chemical Fluxes. Estuar. Coast. Shelf Sci. 2002, 54, 1051–1070. [Google Scholar] [CrossRef]
- Andrews, S.; Sutherland, R.A. Cu, Pb and Zn Contamination in Nuuanu Watershed, Oahu, Hawaii. Sci. Total Environ. 2004, 324, 173–182. [Google Scholar] [CrossRef]
- Yang, Z.; Wang, Y.; Shen, Z.; Niu, J.; Tang, Z. Distribution and Speciation of Heavy Metals in Sediments from the Mainstream, Tributaries, and Lakes of the Yangtze River Catchment of Wuhan, China. J. Hazard. Mater. 2009, 166, 1186–1194. [Google Scholar] [CrossRef]
- Kang, Z.; Wang, S.; Qin, J.; Wu, R.; Li, H. Pollution Characteristics and Ecological Risk Assessment of Heavy Metals in Paddy Fields of Fujian Province, China. Sci. Rep. 2020, 10, 12244. [Google Scholar] [CrossRef]
- Duodu, G.O.; Goonetilleke, A.; Ayoko, G.A. Comparison of Pollution Indices for the Assessment of Heavy Metal in Brisbane River Sediment. Environ. Pollut. 2016, 219, 1077–1091. [Google Scholar] [CrossRef] [PubMed]
- Miranzadeh Mahabadi, H.; Ramroudi, M.; Asgharipour, M.R.; Rahmani, H.R.; Afyuni, M. Evaluation of the Ecological Risk Index (Er) of Heavy Metals (HMs) Pollution in Urban Field Soils. SN Appl. Sci. 2020, 2, 1420. [Google Scholar] [CrossRef]
- Chen, X.; Qadeer, A.; Liu, M.; Deng, L.; Zhou, P.; Mwizerwa, I.T.; Liu, S.; Ajmal, Z.; Xingru, Z.; Jiang, X. Chapter 13—Bioaccumulation of Emerging Contaminants in Aquatic Biota: PFAS as a Case Study. In Emerging Aquatic Contaminants; Kumar, M., Mohapatra, S., Weber, K., Eds.; Elsevier: Amsterdam, The Netherlands, 2023; pp. 347–374. ISBN 978-0-323-96002-1. [Google Scholar]
- Diaconu, L.; Butnariu, C.I.; Catrina, A.G.; Paraschiv, G. Water Depollution Using Typha Angustifolia. Ann. Fac. Eng. Hunedoara 2019, 17, 199–200. [Google Scholar]
- Ben Salem, Z.; Laffray, X.; Al-Ashoor, A.; Ayadi, H.; Aleya, L. Metals and Metalloid Bioconcentrations in the Tissues of Typha latifolia Grown in the Four Interconnected Ponds of a Domestic Landfill Site. J. Environ. Sci. 2017, 54, 56–68. [Google Scholar] [CrossRef] [PubMed]
- World Health Organization (WHO). Permissible Limits of Heavy Metals in Soil and Plants. Geneva, Switzerland.—References—Scientific Research Publishing. 1996. Available online: https://scirp.org/reference/referencespapers?referenceid=2696523 (accessed on 29 August 2024).
- Iyama, W.A.; Edori, O.S. Assessment of Levels and Safe Factor Index of Heavy Metals in Soils around Diobu, Port Harcourt, Nigeria. Int. J. Adv. Res. Chem. Sci. 2020, 7, 1–15. [Google Scholar] [CrossRef]
- Ferati, F.; Kerolli-Mustafa, M.; Kraja-Ylli, A. Assessment of Heavy Metal Contamination in Water and Sediments of Trepça and Sitnica Rivers, Kosovo, Using Pollution Indicators and Multivariate Cluster Analysis. Environ. Monit. Assess. 2015, 187, 338. [Google Scholar] [CrossRef]
- Shehu, I.A. Water and Sediment Quality Status of the Toplluha River in Kosovo. J. Ecol. Eng. 2019, 20, 266–275. [Google Scholar] [CrossRef] [PubMed]
- Tomlinson, D.L.; Wilson, J.G.; Harris, C.R.; Jeffrey, D.W. Problems in the Assessment of Heavy-Metal Levels in Estuaries and the Formation of a Pollution Index. Helgol. Meeresunters 1980, 33, 566–575. [Google Scholar] [CrossRef]
- Malsiu, A.; Shehu, I.; Stafilov, T.; Faiku, F. Assessment of Heavy Metal Concentrations with Fractionation Method in Sediments and Waters of the Badovci Lake (Kosovo). J. Environ. Public Health 2020, 2020, 3098594. [Google Scholar] [CrossRef]
- Allajbeu, S.; Qarri, F.; Marku, E.; Bekteshi, L.; Ibro, V.; Frontasyeva, M.V.; Stafilov, T.; Lazo, P. Contamination Scale of Atmospheric Deposition for Assessing Air Quality in Albania Evaluated from Most Toxic Heavy Metal and Moss Biomonitoring. Air Qual. Atmos. Health 2017, 10, 587–599. [Google Scholar] [CrossRef]
- Serafimovski, T.; Tasev, G.; Stafilov, T. The Content of Copper and Heavy Metals in the Multilayer Soil Mud from the Buchim Lake Under the Buchim Mine’s Waste Dump, Republic North Macedonia. Tehnika 2020, 71, 297–304. [Google Scholar] [CrossRef]
- Papadimou, S.G.; Kantzou, O.-D.; Chartodiplomenou, M.-A.; Golia, E.E. Urban Soil Pollution by Heavy Metals: Effect of the Lockdown during the Period of COVID-19 on Pollutant Levels over a Five-Year Study. Soil Syst. 2023, 7, 28. [Google Scholar] [CrossRef]
- Djordjević, L.; Živković, N.; Živković, L.; Djordjević, A. Assessment of Heavy Metals Pollution in Sediments of the Korbevačka River in Southeastern Serbia. Soil Sediment Contam. Int. J. 2012, 21, 889–900. [Google Scholar] [CrossRef]
- Kastratović, V.; Jaćimović, Ž.; Bigović, M.; Đurović, D.; Krivokapić, S. Environmental Status and Geochemical Assessment Sediments of Lake Skadar, Montenegro. Environ. Monit. Assess. 2016, 188, 449. [Google Scholar] [CrossRef] [PubMed]
- Decena, S.C.P.; Arguilles, M.S.; Robel, L.L. Assessing Heavy Metal Contamination in Surface Sediments in an Urban River in the Philippines. Pol. J. Environ. Stud. 2018, 27, 1983–1995. [Google Scholar] [CrossRef] [PubMed]
- Akarsu, T.; Kükrer, S.; Erginal, A.E. Trace Metal-Induced Ecological Risk Analysis of Sarıçay River Sediments, Çanakkale, NW Turkey. Int. J. Environ. Geoinform. 2022, 9, 45–53. [Google Scholar] [CrossRef]
- Yawo, O.; Inyang, E.; Akpan, I. Application of Pollution Indices in Estimating the Toxicity of Heavy Metals in Sediments of Okoro River in Eastern Obolo, Southeastern Nigeria. Res. J. Sci. Technol. 2022, 2, 1–17. [Google Scholar]
- Armiento, G.; Barsanti, M.; Caprioli, R.; Chiavarini, S.; Conte, F.; Crovato, C.; De Cassan, M.; Delbono, I.; Montereali, M.R.; Nardi, E.; et al. Heavy Metal Background Levels and Pollution Temporal Trend Assessment within the Marine Sediments Facing a Brownfield Area (Gulf of Pozzuoli, Southern Italy). Environ. Monit. Assess. 2022, 194, 814. [Google Scholar] [CrossRef]
- Delgado-Iniesta, M.J.; Marín-Sanleandro, P.; Díaz-Pereira, E.; Bautista, F.; Romero-Muñoz, M.; Sánchez-Navarro, A. Estimation of Ecological and Human Health Risks Posed by Heavy Metals in Street Dust of Madrid City (Spain). Int. J. Environ. Res. Public Health 2022, 19, 5263. [Google Scholar] [CrossRef]
- Liu, X.; Dadzie, A.A.; Yuan, L.; Xing, S.; Zhou, X.; Xiao, S. Analysis and Potential Ecological Risk Assessment of Heavy Metals in Surface Sediments of the Freshwater Ecosystem in Zhenjiang City, China. SN Appl. Sci. 2022, 4, 258. [Google Scholar] [CrossRef]
- Haxhibeqiri, B.; Alikaj, M.; Brahushi, F. Occurrence of Heavy Metals in Drini Bardhë River. Angl. J. Assoc.-Inst. Engl. Lang. Am. Stud. 2015, 4, 55–59. [Google Scholar]
- Miller, J.R.; Orbock Miller, S.M. The Channel Bed—Contaminant Transport and Storage. In Contaminated Rivers: A Geomorphological-Geochemical Approach to Site Assessment and Remediation; Miller, J.R., Orbock Miller, S.M., Eds.; Springer: Dordrecht, The Netherlands, 2007; pp. 127–176. ISBN 978-1-4020-5602-4. [Google Scholar]
- Ali, W.; Muhammad, S. Spatial Distribution, Eco-Environmental Risks, and Source Characterization of Heavy Metals Using Compositional Data Analysis in Riverine Sediments of a Himalayan River, Northern Pakistan. J. Soils Sediments 2023, 23, 2244–2257. [Google Scholar] [CrossRef]
- Bonanno, G.; Cirelli, G.L. Comparative Analysis of Element Concentrations and Translocation in Three Wetland Congener Plants: Typha domingensis, Typha latifolia and Typha angustifolia. Ecotoxicol. Environ. Saf. 2017, 143, 92–101. [Google Scholar] [CrossRef]
- Taylor, G.J.; Crowder, A.A. Uptake and Accumulation of Heavy Metals by Typha Latifolia in Wetlands of the Sudbury, Ontario Region. Can. J. Bot. 1983, 61, 63–73. [Google Scholar] [CrossRef]
- Rucińska-Sobkowiak, R. Water Relations in Plants Subjected to Heavy Metal Stresses. Acta Physiol. Plant 2016, 38, 257. [Google Scholar] [CrossRef]
- Eid, E.M.; Shaltout, K.H.; El-Sheikh, M.A.; Asaeda, T. Seasonal Courses of Nutrients and Heavy Metals in Water, Sediment and above- and below-Ground Typha domingensis Biomass in Lake Burullus (Egypt): Perspectives for Phytoremediation. Flora—Morphol. Distrib. Funct. Ecol. Plants 2012, 207, 783–794. [Google Scholar] [CrossRef]
- Klink, A.; Wisłocka, M.; Musiał, M.; Krawczyk, J. Macro- and Trace-Elements Accumulation in Typha angustifolia L. and Typha latifolia L. Organs and Their Use in Bioindication. Pol. J. Environ. Stud. 2013, 22, 183–190. [Google Scholar]
- Shala Abazi, A.; Sallaku, F.; Bytyqi, P.; Hyseni Spahiu, M.; Millaku, F. Heavy Metal Concentrations along the Banks of the Sitnica River and in Four Types of Herbaceous Plants. J. Ecol. Eng. 2018, 19, 1–9. [Google Scholar] [CrossRef]
- Quality Elements and Physico-Chemical Quality Standards for Assessment of Ecological Status of Surface Water in Romania (GD 161). 2006. Available online: https://pdf.usaid.gov/pdf_docs/PNADW055.pdf (accessed on 2 August 2024).
- [E/ECE/]CES/733; ECE (Economic Commission for Europe) Standard Statistical Classification of Surface Freshwater Quality for the Maintenance of Aquatic Life. Economic Commission for Europe: Geneva, Switzerland, 2006.
| Location | Heavy Metals | |||||
|---|---|---|---|---|---|---|
| Unit (mg/kg) | ||||||
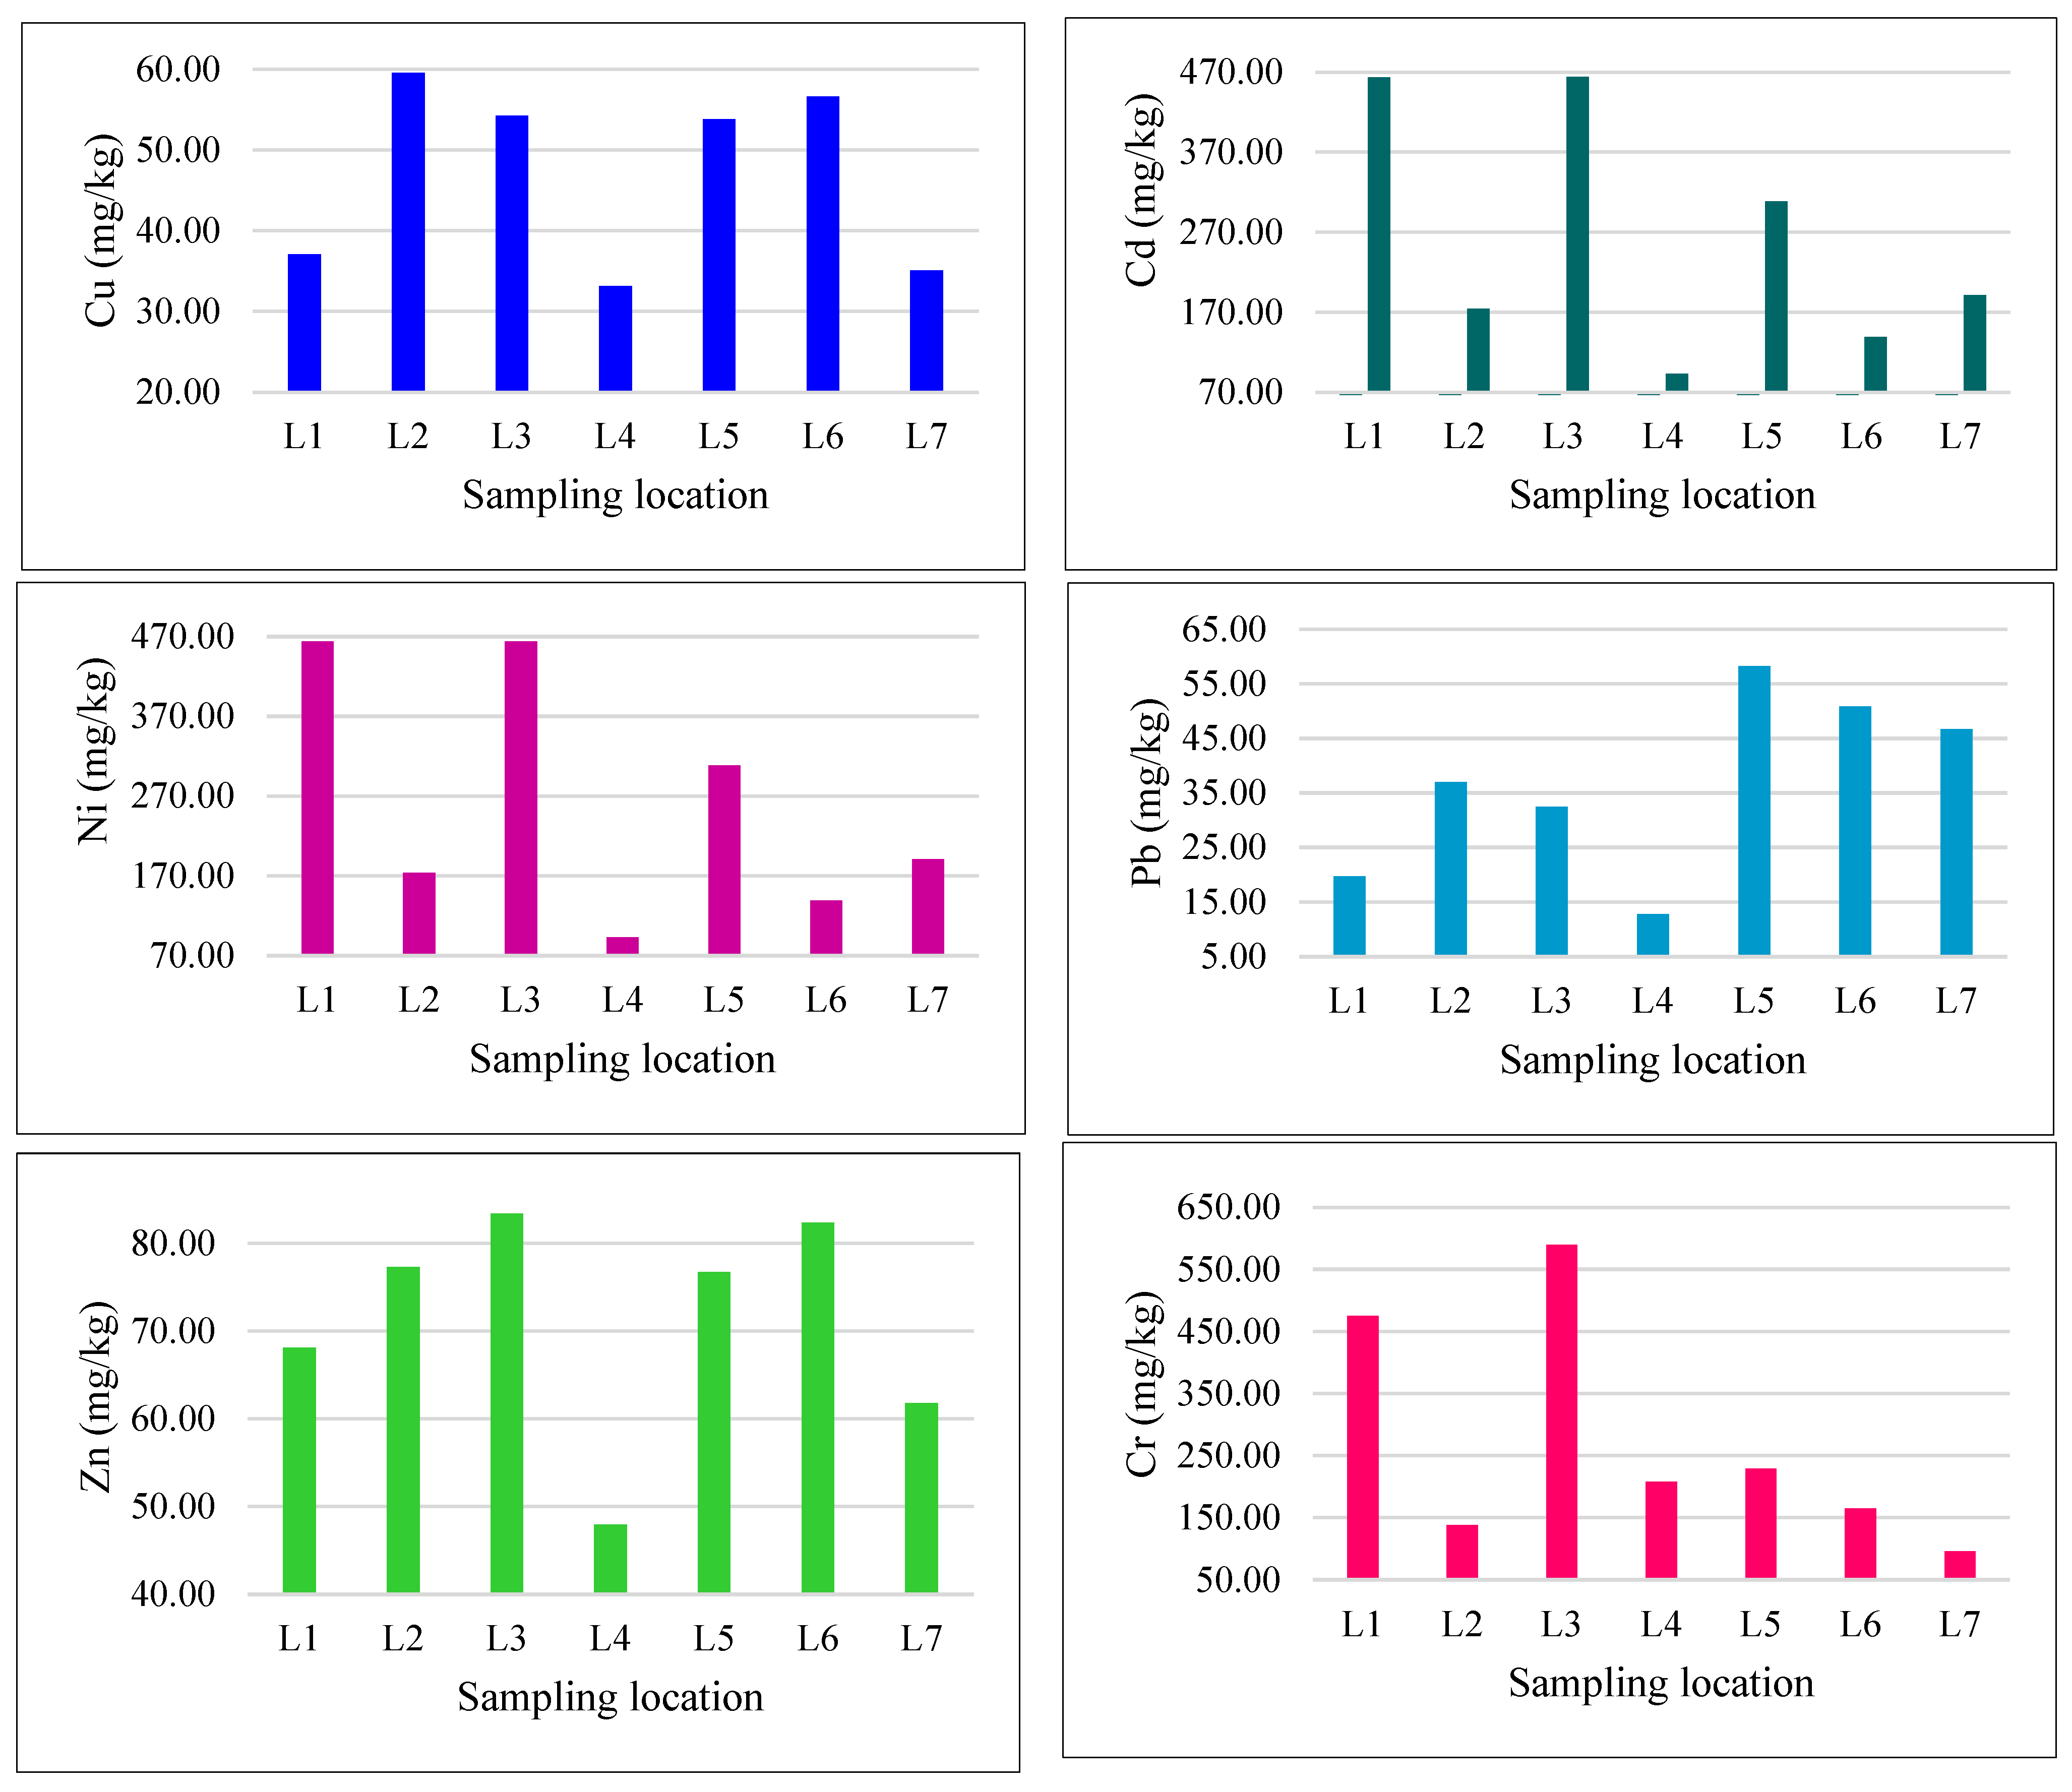
| Cu | Cd | Ni | Pb | Zn | Cr | |
| L1 | 37.07 | 0.15 | 463.33 | 19.70 | 68.09 | 474.85 |
| L2 | 59.55 | 0.33 | 173.96 | 36.97 | 77.30 | 138.18 |
| L3 | 54.24 | 0.46 | 463.87 | 32.48 | 83.34 | 590.13 |
| L4 | 33.14 | 0.21 | 92.81 | 12.72 | 47.96 | 207.71 |
| L5 | 53.78 | 0.31 | 308.42 | 58.24 | 76.71 | 229.33 |
| L6 | 56.58 | 0.27 | 138.78 | 50.83 | 82.35 | 165.17 |
| L7 | 35.06 | 0.17 | 190.97 | 46.70 | 61.79 | 95.90 |
| Mean ± Std | 47.06 ± 4.31 | 0.27 ± 0.4 | 261.7 ± 57.7 | 36.8 ± 6.2 | 71.07 ± 4.8 | 271.6 ± 70.4 |
| * Target value of soil (mg/kg) | 36 | 0.8 | 35 | 85 | 50 | 100 |
| Cu | Cd | Ni | Pb | Zn | Cr | |
|---|---|---|---|---|---|---|
| CF | 1.31 | 0.34 | 7.48 | 0.43 | 1.42 | 2.72 |
| Geoacumulation index (Igeo) | 0.34 | −1.58 | 2.56 | −1.17 | 0.49 | 1.43 |
| Potential Ecological Risk Factor (Eif) | Potential Ecological Risk Index (RI) | ||||||
|---|---|---|---|---|---|---|---|
| Cu | Cd | Ni | Pb | Zn | Cr | ||
| L1 | 1.060328 | 0.034225 | 175.2439 | 0.053715 | 1.854499 | 22.54825 | 200.7949 |
| L2 | 2.736267 | 0.172225 | 24.70232 | 0.189174 | 2.389992 | 1.909371 | 32.09935 |
| L3 | 2.270044 | 0.323477 | 175.6534 | 0.146014 | 2.778222 | 34.82534 | 215.9965 |
| L4 | 0.847423 | 0.068252 | 7.030983 | 0.022394 | 0.920103 | 4.314344 | 13.2035 |
| L5 | 2.231704 | 0.153077 | 77.65134 | 0.469467 | 2.353954 | 5.259225 | 88.11877 |
| L6 | 2.470136 | 0.112225 | 15.72145 | 0.357604 | 2.712609 | 2.728113 | 24.10214 |
| L7 | 0.94846 | 0.043056 | 29.7723 | 0.301853 | 1.527202 | 0.919681 | 33.51255 |
| Cu | Cd | Ni | Pb | Zn | Cr | |||
|---|---|---|---|---|---|---|---|---|
| Spearman’s rho | Cu | Correlation Coefficient | 1.000 | 0.679 | 0.107 | 0.429 | 0.857 * | −0.036 |
| Sig. (2-tailed) | . | 0.094 | 0.819 | 0.337 | 0.014 | 0.939 | ||
| N | 7 | 7 | 7 | 7 | 7 | 7 | ||
| Cd | Correlation Coefficient | 0.679 | 1.000 | 0.179 | 0.250 | 0.750 | 0.214 | |
| Sig. (2-tailed) | 0.094 | . | 0.702 | 0.589 | 0.052 | 0.645 | ||
| N | 7 | 7 | 7 | 7 | 7 | 7 | ||
| Ni | Correlation Coefficient | 0.107 | 0.179 | 1.000 | 0.036 | 0.393 | 0.643 | |
| Sig. (2-tailed) | 0.819 | 0.702 | . | 0.939 | 0.383 | 0.119 | ||
| N | 7 | 7 | 7 | 7 | 7 | 7 | ||
| Pb | Correlation Coefficient | 0.429 | 0.250 | 0.036 | 1.000 | 0.357 | −0.321 | |
| Sig. (2-tailed) | 0.337 | 0.589 | 0.939 | . | 0.432 | 0.482 | ||
| N | 7 | 7 | 7 | 7 | 7 | 7 | ||
| Zn | Correlation Coefficient | 0.857 * | 0.750 | 0.393 | 0.357 | 1.000 | 0.321 | |
| Sig. (2-tailed) | 0.014 | 0.052 | 0.383 | 0.432 | . | 0.482 | ||
| N | 7 | 7 | 7 | 7 | 7 | 7 | ||
| Cr | Correlation Coefficient | −0.036 | 0.214 | 0.643 | −0.321 | 0.321 | 1.000 | |
| Sig. (2-tailed) | 0.939 | 0.645 | 0.119 | 0.482 | 0.482 | . | ||
| N | 7 | 7 | 7 | 7 | 7 | 7 | ||
| Location | Heavy Metals | |||||
|---|---|---|---|---|---|---|
| Cu | Cd | Ni | Pb | Zn | Cr | |
| mg/kg | mg/kg | mg/kg | mg/kg | mg/kg | mg/kg | |
| L1 | 0.31 | 0.830 | n.d | 5.90 | 23.848 | n.d |
| L2 | 3.90 | 0.933 | n.d | 3.77 | 22.691 | n.d |
| L3 | 0.32 | 1.078 | n.d | 0.41 | 18.070 | n.d |
| L4 | 0.47 | 1.134 | n.d | 0.16 | 25.455 | n.d |
| L5 | 1.16 | 1.302 | n.d | 2.86 | 21.814 | n.d |
| L6 | 1.34 | 1.132 | n.d | 1.40 | 18.522 | n.d |
| L7 | 0.40 | 1.157 | n.d | 0.40 | 13.850 | n.d |
| Mean ± Std | 1.01 ± 0.93 | 1.08 ± 0.14 | - | 2.12 ± 1.99 | 20.6 ± 3.7 | - |
| ** Permissible value in plants (mg/kg) | 10 | 0.02 | 10 | 2 | 0.60 | 1.30 |
| Location | Heavy Metals | |||||
|---|---|---|---|---|---|---|
| Cu | Cd | Ni | Pb | Zn | Cr | |
| L1 | 0.008363 | 5.608108 | n.d | 0.299492 | 0.350242 | n.d |
| L2 | 0.051889 | 2.810241 | n.d | 0.101975 | 0.293552 | n.d |
| L3 | 0.0059 | 2.369231 | n.d | 0.012623 | 0.216823 | n.d |
| L4 | 0.014182 | 5.425837 | n.d | 0.012579 | 0.530744 | n.d |
| L5 | 0.021569 | 4.159744 | n.d | 0.049107 | 0.284359 | n.d |
| L6 | 0.023683 | 4.223881 | n.d | 0.027543 | 0.224918 | n.d |
| L7 | 0.011409 | 6.96988 | n.d | 0.008565 | 0.224146 | n.d |
| Location | Heavy Metals | |||||
|---|---|---|---|---|---|---|
| Cu | Cd | Ni | Pb | Zn | Cr | |
| µg/L | µg/L | µg/L | µg/L | µg/L | µg/L | |
| L1 | 0 | 0.044 | n.d | 1.631 | 0.358 | 1.928 |
| L2 | 0 | 0.181 | n.d | 1.482 | 0.232 | 0.475 |
| L3 | 7.409 | 0 | n.d | 1.828 | 1.875 | 1.297 |
| L4 | 1.257 | 0.061 | n.d | 2.075 | 1.454 | 0.986 |
| L5 | 10.208 | 0.017 | n.d | 2.589 | 0 | 1.292 |
| L6 | 5.621 | 1.167 | n.d | 1.167 | 1.465 | 8.605 |
| L7 | 10.188 | 0.095 | n.d | 1.899 | 4.826 | 1.373 |
| Mean ± Std | 4.95 ± 4.2 | 0.22 ± 0.38 | - | 1.81 ± 0.42 | 1.45 ± 1.52 | 2.27 ± 2.61 |
Disclaimer/Publisher’s Note: The statements, opinions and data contained in all publications are solely those of the individual author(s) and contributor(s) and not of MDPI and/or the editor(s). MDPI and/or the editor(s) disclaim responsibility for any injury to people or property resulting from any ideas, methods, instructions or products referred to in the content. |
© 2024 by the authors. Licensee MDPI, Basel, Switzerland. This article is an open access article distributed under the terms and conditions of the Creative Commons Attribution (CC BY) license (https://creativecommons.org/licenses/by/4.0/).
Share and Cite
Fetoshi, O.; Koto, R.; Sallaku, F.; Çadraku, H.; Rizani, S.; Bytyçi, P.; Nuha, D.; Đurin, B.; Durmishi, B.; Haziri, V.; et al. Assessments of Heavy Metal Contaminants in the Drenica River and Bioremediation by Typha angustifolia. Hydrology 2024, 11, 140. https://doi.org/10.3390/hydrology11090140
Fetoshi O, Koto R, Sallaku F, Çadraku H, Rizani S, Bytyçi P, Nuha D, Đurin B, Durmishi B, Haziri V, et al. Assessments of Heavy Metal Contaminants in the Drenica River and Bioremediation by Typha angustifolia. Hydrology. 2024; 11(9):140. https://doi.org/10.3390/hydrology11090140
Chicago/Turabian StyleFetoshi, Osman, Romina Koto, Fatbardh Sallaku, Hazir Çadraku, Smajl Rizani, Pajtim Bytyçi, Demokrat Nuha, Bojan Đurin, Berat Durmishi, Veton Haziri, and et al. 2024. "Assessments of Heavy Metal Contaminants in the Drenica River and Bioremediation by Typha angustifolia" Hydrology 11, no. 9: 140. https://doi.org/10.3390/hydrology11090140
APA StyleFetoshi, O., Koto, R., Sallaku, F., Çadraku, H., Rizani, S., Bytyçi, P., Nuha, D., Đurin, B., Durmishi, B., Haziri, V., Feka, F., Haziri, S. S., Rathnayake, U., & Dogančić, D. (2024). Assessments of Heavy Metal Contaminants in the Drenica River and Bioremediation by Typha angustifolia. Hydrology, 11(9), 140. https://doi.org/10.3390/hydrology11090140