
Improved Antioxidant Properties and Vitamin C and B12 Content from Enrichment of Kombucha with Jujube (Ziziphus jujuba Mill.) Powder


 ,
,  , , and
Abstract
1. Introduction
2. Materials and Methods
2.1. Chemicals and Reagents
2.2. Preparation of Jujube Powder
2.3. Preparation of Kombucha
2.4. pH
2.5. Protein Content
2.6. Sugars, Ethanol, and Acetic Acid Content by High-Performance Liquid Chromatography–Refractive Index Detectors (HPLC-RI)
2.7. Vitamin C and B12 Content by High Performance Liquid Chromatography–Diode Array Detector (HPLC-DAD)
2.8. Total Phenolic Content (TPC)
2.9. Total Flavonoid Content (TFC)
2.10. Identification and Quantification of Biocompounds by HPLC-DAD
2.11. Antioxidant Activity
2.11.1. ABTS Assay
2.11.2. DPPH Assay
2.11.3. FRAP Assay
2.12. Statistical Analysis
3. Results
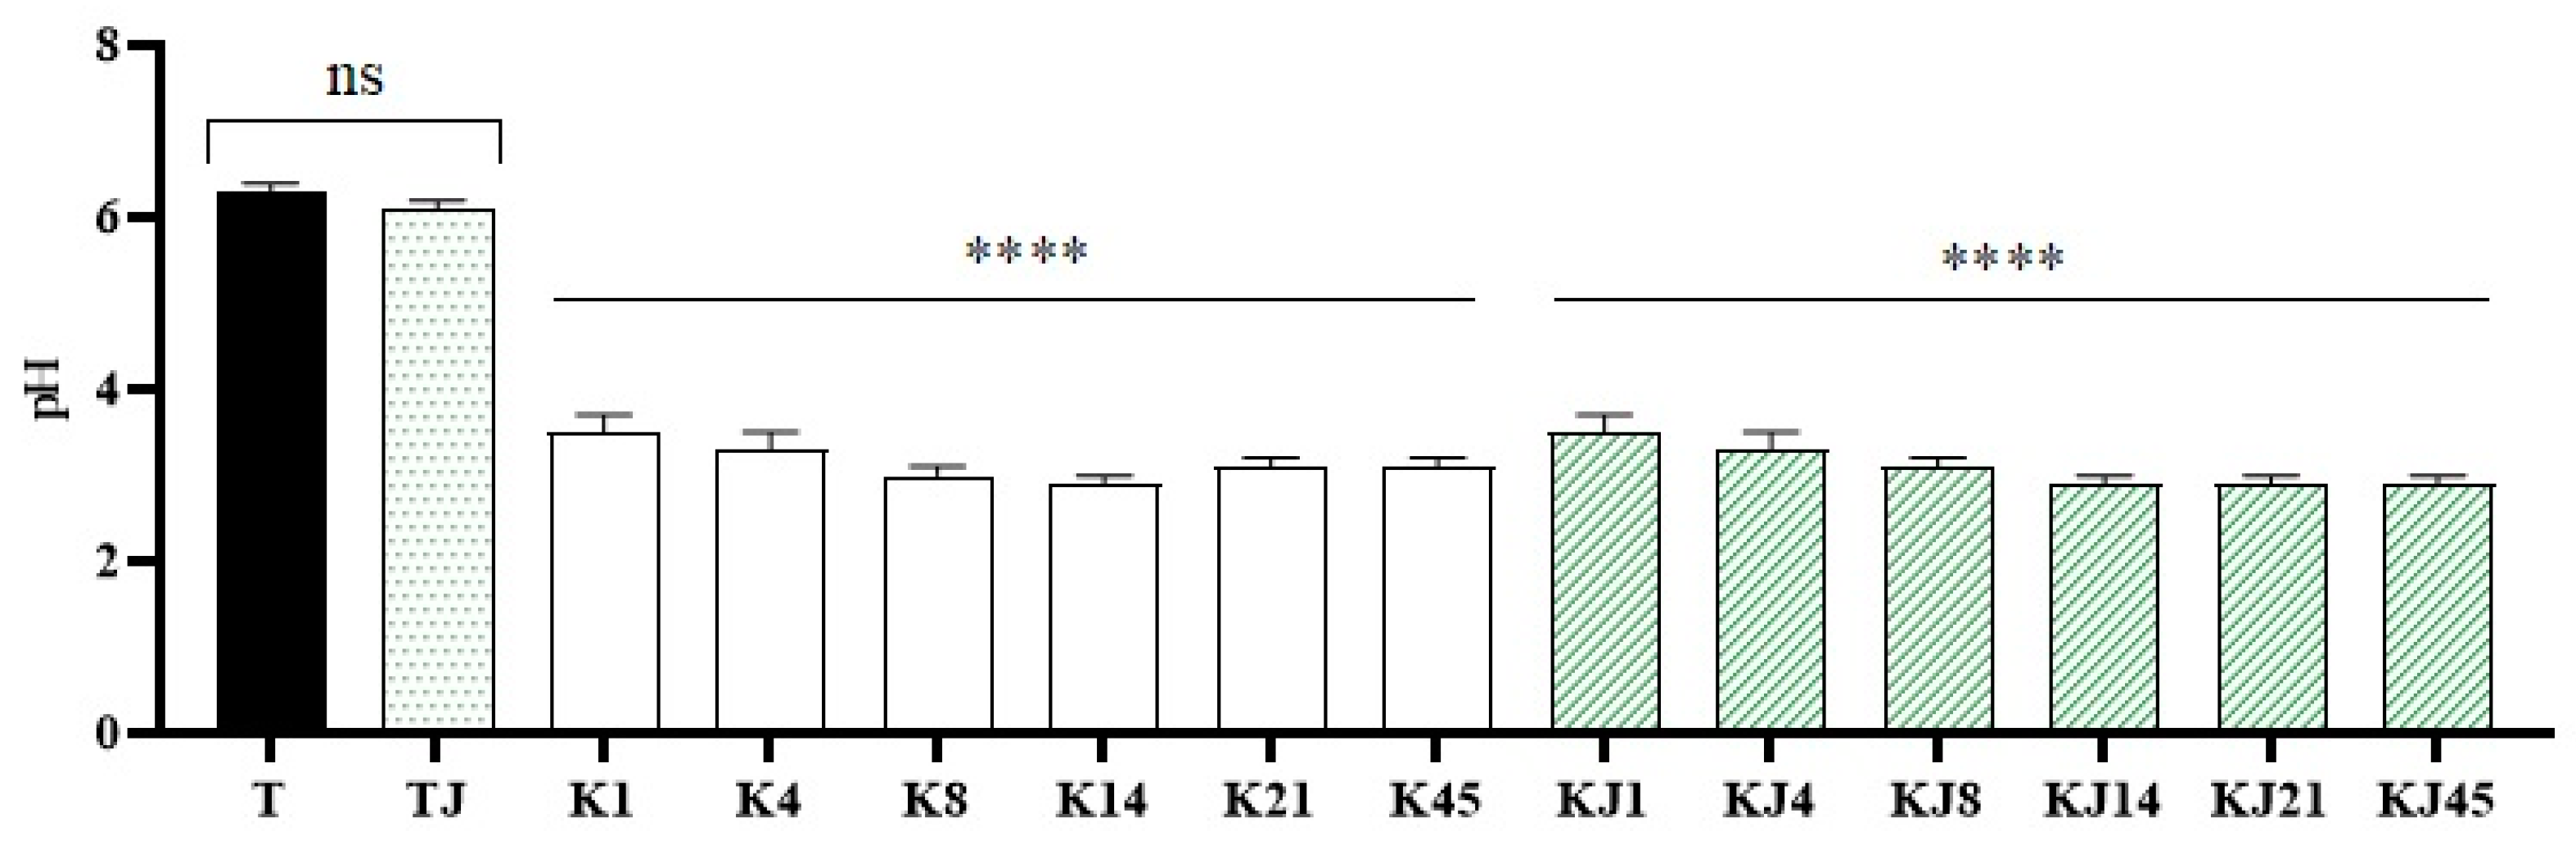
3.1. pH
3.2. Protein Content
3.3. Sugar, Ethanol, and Acetic Acid Content
3.4. Vitamin C and B12 Content by HPLC-DAD
3.5. Total Phenolic (TPC) and Flavonoid Content (TFC)
3.6. Identification and Quantification of Biocompounds by HPLC-DAD
3.7. Antioxidant Activity
3.7.1. ABTS Assay
3.7.2. DPPH Assay
3.7.3. FRAP Assay
4. Discussion
5. Conclusions
Author Contributions
Funding
Institutional Review Board Statement
Informed Consent Statement
Data Availability Statement
Conflicts of Interest
References
- Nyiew, K.-Y.; Kwong, P.; Yow, Y.-Y. An overview of antimicrobial properties of kombucha. Compr. Rev. Food Sci. Food Saf. 2022, 21, 1024–1053. [Google Scholar] [CrossRef] [PubMed]
- Dimidi, E.; Cox, S.R.; Rossi, M.; Whelan, K. Fermented Foods: Definitions and Characteristics, Impact on the Gut Microbiota and Effects on Gastrointestinal Health and Disease. Nutrients 2019, 11, 1806. [Google Scholar] [CrossRef] [PubMed]
- Wang, P.; Feng, Z.; Sang, X.; Chen, W.; Zhang, X.; Xiao, J.; Chen, Y.; Chen, Q.; Yang, M.; Su, J. Kombucha ameliorates LPS-induced sepsis in a mouse model. Food Funct. 2021, 12, 10263–10280. [Google Scholar] [CrossRef] [PubMed]
- Cardoso, R.; Neto, R.; D’Almeida, C.; Pimenta do Nascimento, T.; Pressete, C.; Azevedo, L.; Martino, H.; Cameron, L.C.; Ferreira, M.; Barros, F. Kombuchas from green and black teas have different phenolic profile, which impacts their antioxidant capacities, antibacterial and antiproliferative activities. Food Res. Int. 2019, 128, 108782. [Google Scholar] [CrossRef] [PubMed]
- de Campos Costa, M.; Vilela, D.; Fraiz, G.; Lopes, I.; Coelho, A.; Castro, L.; Prado Martin, J. Effect of kombucha intake on the gut microbiota and obesity-related comorbidities: A systematic review. Crit. Rev. Food Sci. Nutr. 2021, 63, 3851–3866. [Google Scholar] [CrossRef] [PubMed]
- Jayabalan, R.; Subathradevi, P.; Marimuthu, S.; Sathishkumar, M.; Swaminathan, K. Changes in free-radical scavenging ability of kombucha tea during fermentation. Food Chem. 2008, 109, 227–234. [Google Scholar] [CrossRef] [PubMed]
- Jayabalan, R.; Malbaša, R.; Lončar, E.; Vitas, J.; Sathishkumar, M. A Review on Kombucha Tea—Microbiology, Composition, Fermentation, Beneficial Effects, Toxicity, and Tea Fungus. Compr. Rev. Food Sci. Food Saf. 2014, 13, 538–550. [Google Scholar] [CrossRef] [PubMed]
- Li, R.; Xu, Y.-Q.; Chen, J.; Wang, F.; Zou, C.; Yin, J. Enhancing the proportion of gluconic acid with a microbial community reconstruction method to improve the taste quality of Kombucha. LWT 2021, 155, 112937. [Google Scholar] [CrossRef]
- La Torre, C.; Fazio, A.; Caputo, P.; Plastina, P.; Caroleo, M.C.; Cannataro, R.; Cione, E. Effects of Long-Term Storage on Radical Scavenging Properties and Phenolic Content of Kombucha from Black Tea. Molecules 2021, 26, 5474. [Google Scholar] [CrossRef]
- Li, Y.L.; Chen, N.; Li, W.T.; Lou, H.Q.; Li, Y.; Xiong, Q.; Bai, R.X.; Wang, J.T.; Hu, Y.D.; Ren, D.B.; et al. Chemical profiling of ancient bud black tea with a focus on the effects of shoot maturity and fermentation by UHPLC-HRMS. Eur. Food Res. Technol. 2022, 248, 1379–1393. [Google Scholar] [CrossRef]
- Francisco, Á.; José, d.l.R.M.; Hernández, I. Development of a no added sugar kombucha beverage based on germinated corn. Int. J. Gastron. Food Sci. 2021, 24, 100355. [Google Scholar] [CrossRef]
- Kluz, M.; Pietrzyk, K.; Pastuszczak, M.; Kacaniova, M.; Kita, A.; Kapusta, I.; Zaguła, G.; Zagrobelna, E.; Struś, K.; Marciniak-Lukasiak, K.; et al. Microbiological and Physicochemical Composition of Various Types of Homemade Kombucha Beverages Using Alternative Kinds of Sugars. Foods 2022, 11, 1523. [Google Scholar] [CrossRef]
- Silva, J.; Magnani, M.; Olegário, L.; Borges, G.; Dantas, A.; Lima, M.; Lima, L.; Brito, I.; Cordeiro, A. Traditional and flavored kombuchas with pitanga and umbu-cajá pulps: Chemical properties, antioxidants, and bioactive compounds. Food Biosci. 2021, 44, 101380. [Google Scholar] [CrossRef]
- Greenwalt, C.J.; Steinkraus, K.H.; Ledford, R.A. Kombucha, the fermented tea: Microbiology, composition, and claimed health effects. J. Food Prot. 2000, 63, 976–981. [Google Scholar] [CrossRef]
- Yavari, N.; Mazaheri Assadi, M.; Larijani, K.; Moghadam, M. Response Surface Methodology for Optimization of Glucuronic Acid Production Using Kombucha Layer on Sour Cherry Juice. Aust. J. Basic Appl. Sci. 2010, 4, 3250–3256. [Google Scholar]
- López Zazueta, A.C.; Gutierrez Zavala, P.; Zazueta Arguilez, C.G. una Estandarización química de una bebida fermentada de Kombucha a base de té verde, té de limón y e infusión hojas de guayaba. Rev. Investig. Académica Front. Div. Cienc. Económicas Soc. 2022, 38, 1–9. [Google Scholar] [CrossRef]
- Abuduaibifu, A.; Tamer, C. Evaluation of physicochemical and bioaccessibility properties of goji berry kombucha. J. Food Process. Preserv. 2019, 43, e14077. [Google Scholar] [CrossRef]
- Frolova, Y.; Vorobyeva, V.; Vorobyeva, I.; Sarkisyan, V.; Malinkin, A.; Isakov, V.; Kochetkova, A. Development of Fermented Kombucha Tea Beverage Enriched with Inulin and B Vitamins. Fermentation 2023, 9, 552. [Google Scholar] [CrossRef]
- Ulusoy, A.; Tamer, C. Determination of suitability of black carrot (Daucus carota L. spp. sativus var. atrorubens Alef.) juice concentrate, cherry laurel (Prunus laurocerasus), blackthorn (Prunus spinosa) and red raspberry (Rubus ideaus) for kombucha beverage production. Food Meas. 2019, 13, 1524–1536. [Google Scholar] [CrossRef]
- Tanticharakunsiri, W.; Mangmool, S.; Wongsariya, K.; Ochaikul, D. Characteristics and upregulation of antioxidant enzymes of kitchen mint and oolong tea kombucha beverages. J. Food Biochem. 2021, 45, e13574. [Google Scholar] [CrossRef]
- Kayisoglu, S.; Çoşkun, F. Determination of physical and chemical properties of kombucha teas prepared with different herbal teas. Ciência Tecnol. Aliment. 2020, 41, 393–397. [Google Scholar] [CrossRef]
- Shahbazi, H.; Hashemi Gahruie, H.; Eskandari, M.H.; Movahedi, M. Effect of medicinal plant type and concentration on physicochemical, antioxidant, antimicrobial, and sensorial properties of kombucha. Food Sci. Nutr. 2018, 6, 2568–2577. [Google Scholar] [CrossRef] [PubMed]
- Velićanski, A.; Dd, C.; Sinisa, M. Characteristics of kombucha fermentation on medicinal herbs from Lamiaceae family. Rom. Biotechnol. Lett. 2013, 18, 8034–8042. [Google Scholar]
- Wang, Z.Z.; Yang, Q.W.; Zhang, H.X.; He, Y.J.; Wang, R.F.; Lu, X.X. Isolation, Identification, and Antibacterial Activities of Flavonoids from Jujube (Zizipus jujuba Mill.) Fruit. Int. J. Fruit. Sci. 2023, 23, 51–61. [Google Scholar] [CrossRef]
- Fazio, A.; La Torre, C.; Caroleo, M.C.; Caputo, P.; Plastina, P.; Cione, E. Isolation and Purification of Glucans from an Italian Cultivar of Ziziphus jujuba Mill. and In Vitro Effect on Skin Repair. Molecules 2020, 25, 968. [Google Scholar] [CrossRef] [PubMed]
- Fazio, A.; La Torre, C.; Caroleo, M.C.; Caputo, P.; Cannataro, R.; Plastina, P.; Cione, E. Effect of Addition of Pectins from Jujubes (Ziziphus jujube Mill.) on Vitamin C Production during Heterolactic Fermentation. Molecules 2020, 25, 2706. [Google Scholar] [CrossRef] [PubMed]
- Kitwetcharoen, H.; Phung, L.T.; Klanrit, P.; Thanonkeo, S.; Tippayawat, P.; Yamada, M.; Thanonkeo, P. Kombucha Healthy Drink—Recent Advances in Production, Chemical Composition and Health Benefits. Fermentation 2023, 9, 48. [Google Scholar] [CrossRef]
- La Torre, C.; Fazio, A.; Caputo, P.; Tursi, A.; Formoso, P.; Cione, E. Influence of Three Extraction Methods on the Physicochemical Properties of Kefirans Isolated from Three Types of Animal Milk. Foods 2022, 11, 1098. [Google Scholar] [CrossRef] [PubMed]
- Jakubczyk, K.; Antoniewicz, J.; Kochman, J.; Janda-Milczarek, K. Chemical Profile and Antioxidant Activity of the Kombucha Beverage Derived from White, Green, Black and Red Tea. Antioxidants 2020, 9, 447. [Google Scholar] [CrossRef]
- Iacopetta, D.; Fazio, A.; La Torre, C.; Barbarossa, A.; Ceramella, J.; Francomano, F.; Saturnino, C.; El-Kashef, H.; Alcaro, S.; Sinicropi, M.S. Annona cherimola Mill. Leaf Extracts Affect Melanoma Cells Growth and Progression. Foods 2022, 11, 2420. [Google Scholar] [CrossRef]
- Ceramella, J.; La Torre, C.; De Luca, M.; Iacopetta, D.; Fazio, A.; Catalano, A.; Ragno, G.; Longo, P.; Sinicropi, M.S.; Rosano, C. Exploring the anticancer and antioxidant properties of Vicia faba L. pods extracts, a promising source of nutraceuticals. PeerJ 2022, 10, e13683. [Google Scholar] [CrossRef] [PubMed]
- Gabriele, B.; Fazio, A.; Carchedi, M.; Plastina, P. In vitro antioxidant activity of extracts of Sybaris liquorice roots from Southern Italy. Nat. Prod. Res. 2012, 26, 2176–2181. [Google Scholar] [CrossRef] [PubMed]
- Malacaria, L.; La Torre, C.; Furia, E.; Fazio, A.; Caroleo, M.C.; Cione, E.; Gallelli, L.; Marino, T.; Plastina, P. Aluminum(III), iron(III) and copper(II) complexes of luteolin: Stability, antioxidant, and anti-inflammatory properties. J. Mol. Liq. 2022, 345, 117895. [Google Scholar] [CrossRef]
- Nummer, B.A. Kombucha brewing under the Food and Drug Administration model Food Code: Risk analysis and processing guidance. J. Environ. Health 2013, 76, 8–11. [Google Scholar] [PubMed]
- Tejedor-Calvo, E.; Morales, D. Chemical and Aromatic Changes during Fermentation of Kombucha Beverages Produced Using Strawberry Tree (Arbutus unedo) Fruits. Fermentation 2023, 9, 326. [Google Scholar] [CrossRef]
- Rashwan, A.K.; Karim, N.; Shishir, M.R.I.; Bao, T.; Lu, Y.; Chen, W. Jujube fruit: A potential nutritious fruit for the development of functional food products. J. Funct. Foods 2020, 75, 104205. [Google Scholar] [CrossRef]
- Hooi, S.L.; Dwiyanto, J.; Toh, K.Y.; Tan, G.; Chong, C.W.; Lee, J.W.J.; Lim, J. The microbial composition and functional roles of different kombucha products in Singapore. CyTA—J. Food 2023, 21, 269–274. [Google Scholar] [CrossRef]
- Wang, X.; Wang, D.; Wang, H.; Jiao, S.; Wu, J.; Hou, Y.; Sun, J.; Yuan, J. Chemical Profile and Antioxidant Capacity of Kombucha Tea by the Pure Cultured Kombucha. LWT 2022, 168, 113931. [Google Scholar] [CrossRef]
- Kaashyap, M.; Cohen, M.; Mantri, N. Microbial Diversity and Characteristics of Kombucha as Revealed by Metagenomic and Physicochemical Analysis. Nutrients 2021, 13, 4446. [Google Scholar] [CrossRef]
- Rey, J.; Tran, T.; Aumeunier, A.; Rieu, A.; Verdier, F.; Martin, A.; Alexandre, H.; Tourdot-Maréchal, R.; Grandvalet, C. Exploring the role of production and release of proteins for microbial interactions in kombucha. LWT 2024, 198, 116016. [Google Scholar] [CrossRef]
- Reyes-Flores, S.; Pereira, T.S.; Ramírez-Rodrigues, M.M. Optimization of Hempseed-Added Kombucha for Increasing the Antioxidant Capacity, Protein Concentration, and Total Phenolic Content. Beverages 2023, 9, 50. [Google Scholar] [CrossRef]
- Sreeramulu, G.; Zhu, Y.; Knol, W. Characterization of Antimicrobial Activity in Kombucha Fermentation. Acta Biotechnol. 2001, 21, 49–56. [Google Scholar] [CrossRef]
- Villarreal-Soto, S.A.; Beaufort, S.; Bouajila, J.; Souchard, J.P.; Renard, T.; Rollan, S.; Taillandier, P. Impact of fermentation conditions on the production of bioactive compounds with anticancer, anti-inflammatory and antioxidant properties in kombucha tea extracts. Process Biochem. 2019, 83, 44–54. [Google Scholar] [CrossRef]
- Sulak, T.; Pimpan, A.; Sajeena, L.; Apinya, P.; Sunanta, R. Efficacy of Fermented Teas in Antibacterial Activity. Agric. Nat. Resour. 2006, 40, 925–933. [Google Scholar]
- Kartelias, I.; Karantonis, H.; Giaouris, E.; Panagiotakopoulos, I.; Nasopoulou, C. Kombucha Fermentation of Olympus Mountain Tea (Sideritis scardica) Sweetened with Thyme Honey: Physicochemical Analysis and Evaluation of Functional Properties. Foods 2023, 12, 3496. [Google Scholar] [CrossRef] [PubMed]
- Chen, C.; Liu, B. Changes in major component of tea fungus metabolites during prolonged fermentation. J. Appl. Microbiol. 2000, 89, 834–839. [Google Scholar] [CrossRef] [PubMed]
- Sknepnek, A.; Tomic, S.; Miletić, D.; Levic, S.; Čolić, M.; Nedovic, V.; Niksic, M. Fermentation characteristics of novel Coriolus versicolor and Lentinus edodes kombucha beverages and immunomodulatory potential of their polysaccharide extracts. Food Chem. 2020, 342, 128344. [Google Scholar] [CrossRef] [PubMed]
- Tran, T.; Grandvalet, C.; Verdier, F.; Martin, A.; Alexandre, H.; Tourdot-Maréchal, R. Microbiological and technological parameters impacting the chemical composition and sensory quality of kombucha. Compr. Rev. Food Sci. Food Saf. 2020, 19, 2050–2070. [Google Scholar] [CrossRef] [PubMed]
- Martínez-Leal, J.; Ponce-García, N.; Escalante-Aburto, A. Recent Evidence of the Beneficial Effects Associated with Glucuronic Acid Contained in Kombucha Beverages. Curr. Nutr. Rep. 2020, 9, 163–170. [Google Scholar] [CrossRef]
- Neffe-Skocińska, K.; Sionek, B.; Scibisz, I.; Kołożyn-Krajewska, D. Acid contents and the effect of fermentation condition of Kombucha tea beverages on physicochemical, microbiological and sensory properties. CyTA—J. Food 2017, 15, 601–607. [Google Scholar] [CrossRef]
- Akbarirad, H.; Mazaheri Assadi, M.; Pourahmad, R. Employing of the Different Fruit Juices Substrates in Vinegar Kombucha Preparation. Curr. Nutr. Food Sci. 2017, 13, 303–308. [Google Scholar] [CrossRef]
- Chan, M.; Sy, H.; Finley, J.; Robertson, J.; Brown, P. Determination of Ethanol Content in Kombucha Using Headspace Gas Chromatography with Mass Spectrometry Detection: Single-Laboratory Validation. J. AOAC Int. 2020, 104, 122–128. [Google Scholar] [CrossRef] [PubMed]
- Kapp, J.; Sumner, W. Kombucha: A Systematic Review of the Empirical Evidence of Human Health Benefit. Ann. Epidemiol. 2018, 30, 66–70. [Google Scholar] [CrossRef]
- Loncar, E.; Djuric, M.; Malbasa, R.; Kolarov, L.J.; Klasnja, M. Influence of working conditions upon Kombucha conducted fermentation of black tea. Food Bioprod. Process. 2006, 84, 186–192. [Google Scholar] [CrossRef]
- Malbaša, R.; Lončar, E.; Vitas, J.; Čanadanović-Brunet, J. Influence of starter cultures on the antioxidant activity of kombucha beverage. Food Chem. 2011, 127, 1727–1731. [Google Scholar] [CrossRef]
- Sievers, M.; Teuber, M. The Microbiology and Taxonomy of Acetobacter-Europaeus in Commercial Vinegar Production. J. Appl. Bacteriol. 1995, 79, S84–S95. [Google Scholar]
- Prust, C.; Hoffmeister, M.; Liesegang, H.; Wiezer, A.; Fricke, W.F.; Ehrenreich, A.; Gottschalk, G.; Deppenmeier, U. Complete genome sequence of the acetic acid bacterium Gluconobacter oxydans. Nat. Biotechnol. 2005, 23, 195–200. [Google Scholar] [CrossRef]
- Leonarski, E.; Cesca, K.; Zanella, E.; Stambuk, B.; Oliveira, D.; Poletto, P. Production of kombucha-like beverage and bacterial cellulose by acerola byproduct as raw material. LWT 2020, 135, 110075. [Google Scholar] [CrossRef]
- Radu, N.; Roman, V.; Tanasescu, C. Biomaterials obtained from probiotic consortia of microorganisms. Potential applications in regenerative medicine. Mol. Cryst. Liq. Cryst. 2016, 628, 115–123. [Google Scholar] [CrossRef]
- Zhao, Z.J.; Sui, Y.C.; Wu, H.-w.; Zhou, C.-b.; Hu, X.C.; Zhang, J. Flavour chemical dynamics during fermentation of kombucha tea. Emir. J. Food Agric. 2018, 30, 732–741. [Google Scholar] [CrossRef]
- Ivanišová, E.; Meňhartová, K.; Terentjeva, M.; Godočiková, L.; Árvay, J.; Kacaniova, M. Kombucha Tea Beverage: Microbiological Characteristic, Antioxidant Activity, and Phytochemical Composition. Acta Aliment. 2019, 48, 324–331. [Google Scholar] [CrossRef]
- Blanc, P. Characterization of the tea fungus metabolites. Biotechnol. Lett. 1996, 18, 139–142. [Google Scholar] [CrossRef]
- Amarasinghe, H.; Weerakkody, N.S.; Waisundara, V.A.-O. Evaluation of physicochemical properties and antioxidant activities of kombucha “Tea Fungus” during extended periods of fermentation. Food Sci. Nutr. 2018, 6, 659–665. [Google Scholar] [CrossRef] [PubMed]
- Wojdylo, A.; Carbonell-Barrachina, A.A.; Legua, P.; Hernandez, F. Phenolic composition, ascorbic acid content, and antioxidant capacity of Spanish jujube (Ziziphus jujube Mill.) fruits. Food Chem. 2016, 201, 307–314. [Google Scholar] [CrossRef] [PubMed]
- Plastina, P.; Bonofiglio, D.; Vizza, D.; Fazio, A.; Rovito, D.; Giordano, C.; Barone, I.; Catalano, S.; Gabriele, B. Identification of bioactive constituents of Ziziphus jujube fruit extracts exerting antiproliferative and apoptotic effects in human breast cancer cells. J. Ethnopharmacol. 2012, 140, 325–332. [Google Scholar] [CrossRef] [PubMed]
- Kou, X.; Chen, Q.; Li, X.; Li, M.; Kan, C.; Chen, B.; Zhang, Y.; Xue, Z. Quantitative assessment of bioactive compounds and the antioxidant activity of 15 jujube cultivars. J. Food Chem. 2015, 173, 1037–1044. [Google Scholar] [CrossRef] [PubMed]
- Velićanski, A.; Cvetković, D.; Tumbas Šaponjac, V.; Vulić, J. Antioxidant and Antibacterial Activity of the Beverage Obtained by Fermentation of Sweetened Lemon Balm (Melissa officinalis L.) Tea with Symbiotic Consortium of Bacteria and Yeasts. Food Technol. Biotechnol. 2014, 52, 420–429. [Google Scholar] [CrossRef] [PubMed]
- Gaggia, F.; Baffoni, L.; Galiano, M.; Nielsen, D.S.; Jakobsen, R.R.; Castro-Mejia, J.L.; Bosi, S.; Truzzi, F.; Musumeci, F.; Dinelli, G.; et al. Kombucha Beverage from Green, Black and Rooibos Teas: A Comparative Study Looking at Microbiology, Chemistry and Antioxidant Activity. Nutrients 2018, 11, 1. [Google Scholar] [CrossRef]
- Rechner, A.R.; Smith, M.A.; Kuhnle, G.; Gibson, G.R.; Debnam, E.S.; Srai, S.K.S.; Moore, K.P.; Rice-Evans, C.A. Colonic metabolism of dietary polyphenols: Influence of structure on microbial fermentation products. Free Radic. Biol. Med. 2004, 36, 212–225. [Google Scholar] [CrossRef]
- Chakravorty, S.; Bhattacharya, S.; Chatzinotas, A.; Chakraborty, W.; Bhattacharya, D.; Gachhui, R. Kombucha tea fermentation: Microbial and biochemical dynamics. Int. J. Food Microbiol. 2016, 220, 63–72. [Google Scholar] [CrossRef]
- Jayabalan, R.; Marimuthu, S.; Swaminathan, K. Changes in content of organic acids and tea polyphenols during kombucha tea fermentation. Food Chem. 2007, 102, 392–398. [Google Scholar] [CrossRef]
- Antolak, H.; Piechota, D.; Kucharska, A. Kombucha Tea—A Double Power of Bioactive Compounds from Tea and Symbiotic Culture of Bacteria and Yeasts (SCOBY). Antioxidants 2021, 10, 1541. [Google Scholar] [CrossRef] [PubMed]
- Santos Sánchez, N.; Salas-Coronado, R.; Villanueva, C.; Hernandez-Carlos, B. Antioxidant Compounds and Their Antioxidant Mechanism. In Antioxidant; Shalaby, E., Ed.; Huajuapan de León, IntechOpen: Oaxaca, Mexico, 2019; pp. 1–29. [Google Scholar] [CrossRef]
- Lemanska, K.; Szymusiak, H.; Tyrakowska, B.; Zielinski, R.; Soffers, A.; Rietjens, I. The influence of pH on antioxidant properties and the mechanism of antioxidant action of hydroxyflavones. Free Radic. Biol. Med. 2001, 31, 869–881. [Google Scholar] [CrossRef] [PubMed]
- Zubaidah, E.; Dewantari, F.; Novitasari, F.; Srianta, I.; Blanc, P. Potential of snake fruit (Salacca zalacca (Gaerth.) Voss) for the development of a beverage through fermentation with theKombucha consortium. Biocatal. Agric. Biotechnol. 2017, 13, 198–203. [Google Scholar] [CrossRef]
- Gamboa-Gómez, C.; González-Laredo, R.; Gallegos-Infante, J.; Larrosa, M.; Moreno Jimenez, M.; Flores-Rueda, A.; Rocha, N. Antioxidant and Angiotensin-Converting Enzyme Inhibitory Activity of Eucalyptus camaldulensis and Litsea glaucescens Infusions Fermented with Kombucha Consortium. Food Technol. Biotechnol. 2016, 54, 367–374. [Google Scholar] [CrossRef]


| Unsupplemented | Glucose (mg/mL) | Fructose (mg/mL) | Sucrose (mg/mL) | EtOH (%) | Acetic Acid (%) |
| T | 0 d,B | 0 d,B | 100.2 ± 1.7 a,A | 0 a,A | 0 a,A |
| K1 | 17.6 ± 0.2 b,A | 8.1 ± 0.5 b,A | 68.5 ± 4.5 b,A | 0 a,A | 0 a,A |
| K4 | 18.8 ± 0.8 b,A | 8.4 ± 0.3 b,A | 64.3 ± 3.6 b,A | 0.40 ± 0.01 a,A | 0.40 ± 0.01 a,A |
| K8 | 27.3 ± 0.3 a | 11.8 ± 0.4 a,B | 68.2 ± 2.8 b,A | 0.80 ± 0.03 a,A | 0.90 ± 0.03 a,A |
| K14 | 21.6 ± 0. 1 b | 6.8 ± 0.1 b,A | 66.2 ± 3.3 b,A | 1.00 ± 0.01 a,A | 1.8 ± 0.2 a,A |
| K21 | 14.1 ± 2.3 c | 2.6 ± 0.4 c,A | 37.3 ± 1.4 c,A | 1.00 ± 0.02 a,A | 3.0 ± 0.1 a,A |
| K45 | 1.9 ± 0.1 d | 0.40 ± 0.1 d,A | 2.9 ± 0.3 d,A | 0.30 ± 0.01 a,A | 1.0 ± 0.1 a,A |
| J-Supplemented | Glucose (mg/mL) | Fructose (mg/mL) | Sucrose (mg/mL) | EtOH (%) | Acetic Acid (%) |
| J | 2.3 ± 0.1 a,b | 1.5 ± 0.1 b,B | 2.2 ± 0.3 g | 0 a,A | 0 b |
| TJ | 2.7 ± 0.5 a,b,A | 1.4 ± 0.3 b,A | 102.5 ± 2.3 a,A | 0 a,A | 0 b,A |
| KJ1 | 15.5 ± 0.4 a,A | 7.3 ± 0.9 a,A | 62. 2 ± 2.6 b,B | 0 a,A | 0 b,A |
| KJ4 | 13.2 ± 0.1 a,B | 6.1 ± 0. 5 a,A | 56.9 ± 1.2 c,B | 0.40 ± 0.01 a,A | 0.30 ± 0.03 b,A |
| KJ8 | 13.2 ± 0.1 a | 6.6 ± 0.5 a,B | 55.8 ± 2.9 d,B | 0.50 ± 0.03 a,A | 0.80 ± 0.02 b,A |
| KJ14 | 13.8 ± 0.1 a | 6.3 ± 0.1 a,A | 54.2 ± 0.4 e,B | 1.10 ± 0.05 a,A | 1.9 ± 0.1 b,A |
| KJ21 | 12.6 ± 0.1 a | 2.9 ± 0. 1 b,A | 24.9 ± 0.3 f,B | 1.40 ± 0.03 a,A | 3.1 ± 0.1 a,A |
| KJ45 | 1.8 ± 0.2 b | 0.30 ± 0.1 b,A | 1.2 ± 0.3 h,B | 0.60 ± 0.04 a,A | 0.8 ± 0.1 b,A |
| mg/100 mL | ||
| Unsupplemented | Vitamin C | Vitamin B12 |
| T | 0.25 ± 0.07 b,B | 0 b,A |
| K1 | 1.32 ± 0.03 a,B | 0 b,A |
| K4 | 0.24 ± 0.01 b,B | 2.26 ± 0.02 a,A |
| K8 | 0.65 ± 0.11 a,b,B | 2.30 ± 0.05 a,A |
| K14 | 0.69 ± 0.19 a,b,B | 0 b,A |
| K21 | 1.22 ± 0.02 a,b,B | 0 b,A |
| K45 | 0.74 ± 0.32 a,b,B | 0 b,A |
| Supplemented | Vitamin C | Vitamin B12 |
| J | 2.9 ± 0.1 c | 0 b,A |
| TJ | 2.87 ± 0.35 c,A | 0 b,A |
| KJ1 | 2.04 ± 0.05 c,A | 2.35 ± 0.07 a,A |
| KJ4 | 4.15 ± 0.01 b,A | 2.40 ± 0.01 a,A |
| KJ8 | 4.38 ± 0.01 b,A | 2.27 ± 0.01 a,A |
| KJ14 | 6.72 ± 0.70 a,A | 2.30 ± 0.01 a,A |
| KJ21 | 6.51 ± 1.14 a,A | 2.36 ± 0.03 a,A |
| KJ45 | 7.12 ± 0.31 a,A | 2.29 ± 0.01 a,A |
| Unsupplemented | EGCG λ 280 nm | Chlorogenic Acid λ 327 nm | Caffeine λ 273 nm | Ferulic Acid λ 325 nm | Quercetin λ 365 nm |
| T | 1.89 ± 0.05 a,A | 2.89 ± 0.01 a,B | 280.18 ± 0.84 a,B | 1.12 ± 0.03 d,B | 2.31 ± 0.01 a,A |
| K1 | 1.88 ± 0.07 a,B | 2.89 ± 0.01 a,A | 160.20 ± 0.97 c,B | 0.22 ± 0.02 g,B | 2.73 ± 0.01 a,A |
| K4 | 1.80 ± 0.0 a,A | 2.88 ± 0.38 a,A | 178.10 ± 0.55 b,B | 0.97 ± 0.04 e,B | 2.30 ± 0.02 a,A |
| K8 | 1.98 ± 0.06 a,A | 2.89 ± 0.02 a,A | 97.30 ± 1.10 f,B | 0.60 ± 0.03 f,B | 2.35 ± 0.01 a,A |
| K14 | 2.17 ± 1.21 a,A | 2.88 ± 0.01 a,A | 127.48 ± 0.43 d,B | 1.87 ± 0.07 c,A | 2.46 ± 0.08 a,A |
| K21 | 2.56 ± 0.21 a,A | 2.87 ± 0.01 a,A | 146.14 ± 0.49 d,A | 2.18 ± 0.07 b,B | 2.37 ± 0.01 a,A |
| K45 | 2.17 ± 0.05 a,A | 2.89 ± 0.01 a,A | 66.94 ± 0.04 g,A | 2.64 ± 0.04 a,B | 2.32 ± 0.02 a,A |
| J-Supplemented | EGCG λ 280 nm | Chlorogenic Acid λ 327 nm | Caffeine λ 273 nm | Ferulic Acid λ 325 nm | Quercetin λ 365 nm |
| J | n.d. b | 2.90 ± 0.01 b | 270.97 ± 0.56 c | 0.22 ± 0.01 d | n.d. b |
| TJ | 2.36 ± 0.12 a,A | 4.94 ± 1.06 a,A | 338.27 ± 0.15 a,A | 1.26 ± 0.02 c,B | 2.31 ± 0.01 a,A |
| KJ1 | 3.12 ± 0.01 a,A | 5.89 ± 0.01 a,B | 300.02 ± 0.71 b,A | 3.75 ± 0.07 a,A | 2.74 ± 0.02 a,A |
| KJ4 | 2.26 ± 0.07 a,A | 2.91 ± 0.0 b,A | 171.92 ± 0.08 d,A | 1.23 ± 0.01 c,A | 2.04 ± 0.01 a,A |
| KJ8 | 2.87 ± 0.9 a,A | 2.90 ± 0.06 b,A | 139.43 ± 0.26 f,A | 2.26 ± 0.02 b,A | 2.02 ± 0.08 a,A |
| KJ14 | 2.82 ± 1.39 a,A | 2.90 ± 0.05 b,A | 140.60 ± 0.61 e,A | 1.52 ± 0.06 b,B | 2.59 ± 0.01 a,A |
| KJ21 | 2.97 ± 1.07 a,A | 3.01 ± 0.03 b,A | 101.97 ± 0.02 g,B | 3.91 ± 0.01 a,A | 2.39 ± 0.01 a,A |
| KJ45 | 2.67 ± 0.14 a,A | 2.91 ± 0.02 b,A | 29.3 ± 0.40 h,B | 3.81 ± 0.01 a,A | 2.09 ± 0.01 a,A |
| µg TE/mL | |||||||
| µg/mL | T | K1 | K4 | K8 | K14 | K21 | K45 |
| 30 | 36.02 ± 1.69 | 62.72 ± 3.88 | 43.15 ± 3.01 | 58.59 ± 0.53 | 61.75 ± 1.88 | 46.74 ± 1.41 | 54.40 ± 4.60 |
| 20 | 29.10 ± 4.05 | 47.10 ± 0.97 | 32.61 ± 2.96 | 48.72 ± 3.40 | 58.32 ± 1.21 | 38.15 ± 1.88 | 42.67 ± 1.40 |
| 10 | 20.14 ± 0.74 | 28.32 ± 0.62 | 15.25 ± 3.90 | 30.93 ± 0.70 | 39.88 ± 3.30 | 17.27 ± 2.33 | 26.67 ± 3.40 |
| 5 | 11.40 ± 2.40 | 17.50 ± 2.44 | 7.44 ± 1.84 | 12.75 ± 2.10 | 28.03 ± 0.69 | 19.26 ± 2.15 | 17.95 ± 0.76 |
| µg/mL | TJ | KJ1 | KJ4 | KJ8 | KJ14 | KJ21 | KJ45 |
| 30 | 62.69 ± 0.94 | 66.61 ± 1.08 | 61.16 ± 1.50 | 64.46 ± 2.89 | 66.32 ± 2.01 | 64.37 ± 1.30 | 56.02 ± 1.85 |
| 20 | 45.35 ± 5.14 | 45.72 ± 4.8 | 44.40 ± 0.18 | 54.43 ± 1.62 | 65.82 ± 1.50 | 59.51 ± 0.13 | 45.56 ± 0.28 |
| 10 | 25.82 ± 4.72 | 24.26 ± 4.30 | 25.14 ± 1.13 | 29.48 ± 0.74 | 41.73 ± 0.80 | 30.85 ± 0.27 | 33.22 ± 4.40 |
| 5 | 14.94 ± 1.11 | 7.44 ± 0.73 | 15.79 ± 0.27 | 10.34 ± 1.19 | 33.63 ± 0.05 | 16.99 ± 2.24 | 17.04 ± 3.00 |
| EC50 (µg/mL) | ||
|---|---|---|
| Samples | Unsupplemented | J-Supplemented |
| Trolox | 1.98 ± 0.25 | |
| T | 28.92 ± 1.45 e,B | 11.84 ± 1.06 d,A |
| K1 | 10.64 ± 1.03 b,A | 12.65 ± 1.10 d,B |
| K4 | 26.23 ± 1.42 e,B | 12.27 ± 1.09 e,d,A |
| K8 | 11.25 ± 1.04 b,B | 10.16 ± 1.01 c,A |
| K14 | 6.09 ± 0.77 a,B | 4.39 ± 0.63 a,A |
| K21 | 18.50 ± 1.27 d,B | 8.38 ± 0.91 b,A |
| K45 | 13.15 ± 1.12 c,B | 11.05 ± 1.03 d,A |
| µg TE/mL | |||||||
| µg/mL | T | K1 | K4 | K8 | K14 | K21 | K45 |
| 100 | 21.88 ± 1.47 | 30.78 ± 1.46 | 30.57 ± 1.17 | 32.58 ± 2.17 | 31.23 ± 3.07 | 31.73 ± 3.06 | 28.93 ± 3.16 |
| 50 | 20.43 ± 2.94 | 27.81 ± 3.33 | 29.43 ± 2.26 | 26.53 ± 0.30 | 22.11 ± 2.01 | 28.11 ± 6.09 | 23.18 ± 0.87 |
| 25 | 6.43 ± 0.07 | 12.91 ± 4.38 | 20.43 ± 3.11 | 16.48 ± 4.04 | 16.88 ± 1.93 | 14.41 ± 1.94 | 8.23 ± 1.94 |
| 10 | 0 | 0 | 6.14 ± 0.01 | 0.18 ± 0.01 | 5.01 ± 1.10 | 3.38 ± 1.04 | 0 |
| µg/mL | TJ | KJ1 | KJ4 | KJ8 | KJ14 | KJ21 | KJ45 |
| 100 | 25.81 ± 1.72 | 31.98 ± 1.25 | 31.31 ± 1.84 | 32.48 ± 0.76 | 35.68 ± 3.79 | 31.18 ± 1.90 | 30.23 ± 0.94 |
| 50 | 22.61 ± 2.96 | 28.28 ± 2.71 | 30.81 ± 3.02 | 30.88 ± 4.45 | 29.73 ± 3.33 | 31.17 ± 0.65 | 25.31 ± 3.96 |
| 25 | 14.43 ± 4.06 | 16.33 ± 1.90 | 22.01 ± 1.81 | 15.23 ± 2.02 | 27.73 ± 1.66 | 20.73 ± 1.66 | 13.18 ± 1.65 |
| 10 | 1.01 ± 0.10 | 0 | 0 | 0.04 ± 0.01 | 13.43 ± 1.71 | 5.61 ± 0.95 | 0.23 ± 0.01 |
| EC50 (µg/mL) | ||
|---|---|---|
| Samples | Unsupplemented | J-Supplemented |
| Trolox | 22.95 ± 1.36 | |
| T | 46.09 ± 1.66 g,B | 23.57 ± 1.36 e,A |
| K1 | 24.75 ± 1.39 e,B | 20.69 ± 1.32 d,A |
| K4 | 14.56 ± 1.15 a,A | 19.31 ± 1.29 d,B |
| K8 | 23.13 ± 1.35 d,B | 17.27 ± 1.24 c,A |
| K14 | 16.62 ± 1.21 b,B | 8.19 ± 0.90 a,A |
| K21 | 19.59 ± 1.28 c,B | 13.91 ± 1.13 b,A |
| K45 | 34.06 ± 1.52 f,B | 23.82 ± 1.38 e,A |
| FeSO4 (µmol/mL) | ||
|---|---|---|
| Samples | Unsupplemented | J-Supplemented |
| BHT | 145.81 ± 0.03 a,A | |
| T | 115.43 ± 3.74 f,C | 125.53 ± 0.93 f,B |
| K1 | 34.21 ± 1.47 d,C | 55.06 ± 0.01 d,B |
| K4 | 35.47 ± 0.47 d,C | 56.13 ± 0.32 d,B |
| K8 | 36.74 ± 0.52 d,C | 57.23 ± 0.67 d,B |
| K14 | 62.89 ± 0.67 b,C | 87.42 ± 0.67 b,B |
| K21 | 54.40 ± 0.40 c,C | 67.89 ± 0.27 c,B |
| K45 | 29.48 ± 0.92 e,C | 45.72 ± 0.40 e,B |
Disclaimer/Publisher’s Note: The statements, opinions and data contained in all publications are solely those of the individual author(s) and contributor(s) and not of MDPI and/or the editor(s). MDPI and/or the editor(s) disclaim responsibility for any injury to people or property resulting from any ideas, methods, instructions or products referred to in the content. |
© 2024 by the authors. Licensee MDPI, Basel, Switzerland. This article is an open access article distributed under the terms and conditions of the Creative Commons Attribution (CC BY) license (https://creativecommons.org/licenses/by/4.0/).
Share and Cite
La Torre, C.; Plastina, P.; Cione, E.; Bekatorou, A.; Petsi, T.; Fazio, A. Improved Antioxidant Properties and Vitamin C and B12 Content from Enrichment of Kombucha with Jujube (Ziziphus jujuba Mill.) Powder. Fermentation 2024, 10, 295. https://doi.org/10.3390/fermentation10060295
La Torre C, Plastina P, Cione E, Bekatorou A, Petsi T, Fazio A. Improved Antioxidant Properties and Vitamin C and B12 Content from Enrichment of Kombucha with Jujube (Ziziphus jujuba Mill.) Powder. Fermentation. 2024; 10(6):295. https://doi.org/10.3390/fermentation10060295
Chicago/Turabian StyleLa Torre, Chiara, Pierluigi Plastina, Erika Cione, Argyro Bekatorou, Theano Petsi, and Alessia Fazio. 2024. "Improved Antioxidant Properties and Vitamin C and B12 Content from Enrichment of Kombucha with Jujube (Ziziphus jujuba Mill.) Powder" Fermentation 10, no. 6: 295. https://doi.org/10.3390/fermentation10060295
APA StyleLa Torre, C., Plastina, P., Cione, E., Bekatorou, A., Petsi, T., & Fazio, A. (2024). Improved Antioxidant Properties and Vitamin C and B12 Content from Enrichment of Kombucha with Jujube (Ziziphus jujuba Mill.) Powder. Fermentation, 10(6), 295. https://doi.org/10.3390/fermentation10060295