Article

Enhancing Biohydrogen Production: The Role of Iron-Based Nanoparticles in Continuous Lactate-Driven Dark Fermentation of Powdered Cheese Whey

by
Deborah Leroy-Freitas
1,2,
Raúl Muñoz
1,2,*,
Leonardo J. Martínez-Mendoza
1,2,
Cristina Martínez-Fraile
1,2 and
Octavio García-Depraect
1,2,*
1
Institute of Sustainable Processes, Dr. Mergelina, s/n, 47011 Valladolid, Spain
2
Department of Chemical Engineering and Environmental Technology, School of Industrial Engineering, University of Valladolid, Dr. Mergelina, s/n, 47011 Valladolid, Spain
*
Authors to whom correspondence should be addressed.
Fermentation 2024, 10(6), 296; https://doi.org/10.3390/fermentation10060296
Submission received: 15 May 2024 / Revised: 29 May 2024 / Accepted: 29 May 2024 / Published: 3 June 2024
(This article belongs to the Special Issue Fermentative Biohydrogen Production)

Abstract

:
Here, a comprehensive investigation was conducted under various operational strategies aimed at enhancing biohydrogen production via dark fermentation, with a specific focus on the lactate metabolic pathway, using powdered cheese whey as a substrate. Initially, a batch configuration was tested to determine both the maximum hydrogen yield (100.2 ± 4.2 NmL H2/g CODfed) and the substrate (total carbohydrates) consumption efficiency (94.4 ± 0.8%). Subsequently, a transition to continuous operation was made by testing five different operational phases: control (I), incorporation of an inert support medium for biomass fixation (II), addition of carbon-coated, zero-valent iron nanoparticles (CC-nZVI NPs) at 100 mg/L (III), and supplementation of Fe2O3 nanoparticles at concentrations of 100 mg/L (IV) and 300 mg/L (V). The results emphasized the critical role of the support medium in stabilizing the continuous system. On the other hand, a remarkable increase of 10% in hydrogen productivity was observed with the addition of Fe2O3 NPs (300 mg/L). The analysis of the organic acids’ composition unveiled a positive correlation between high butyrate concentrations and improved volumetric hydrogen production rates (25 L H2/L-d). Moreover, the presence of iron-based NPs effectively regulated the lactate concentration, maintaining it at low levels. Further exploration of the bacterial community dynamics revealed a mutually beneficial interaction between lactic acid bacteria (LAB) and hydrogen-producing bacteria (HPB) throughout the experimental process, with Prevotella, Clostridium, and Lactobacillus emerging as the predominant genera. In conclusion, this study highlighted the promising potential of nanoparticle addition as a tool for boosting biohydrogen productivity via lactate-driven dark fermentation.

1. Introduction

The current global energy scenario is characterized by the decreasing availability of fossil fuel sources and the increasing need for carbon-neutral solutions in the energy sector to mitigate climate change. In this context, biohydrogen (bioH2) is emerging as a promising and environmentally friendly renewable fuel alternative [1]. Defined as H2 biologically produced from microbial metabolism using renewable organic substrates [2], bioH2 can potentially be obtained via dark fermentation (DF) due to its high H2 productivity, versatility, and high kinetic growth rates [3]. DF is currently regarded as one of the most promising biotechnological platforms for the development of organic-waste-based biorefineries, with the potential to convert a wide range of organic substrates, mainly from renewable sources (e.g., food waste, lignocellulosic and algal biomass, municipal organic waste, and industrial/agricultural wastewater [4]) into bioH2 and high-value organic acids. In the context of circular economy, DF can promote the biorecovery of waste by offering a diverse portfolio of bioproducts and subsequent valorization routes [5].
Sugar-rich agro-industrial wastes have been extensively investigated as feedstocks for bacterial fermentation, which can be converted into high-value-added products, such as H2 [6,7,8]. Lactose is the major sugar present in cheese whey (CW), the main byproduct of the dairy industry. Considering that approximately 160–200 billion L of CW wastewater is generated annually worldwide [9], this byproduct represents a major environmental concern for the dairy industry, being potentially 100 times more polluting than domestic wastewater [10]. Theoretically, lactose fermentation produces 8 mol of H2 per mol of lactose consumed and is considered as one of the most promising metabolic pathways for the production of bioH2 [11]. By stoichiometry, the potential production of H2 using CW wastewater as a source for fermentation could reach 0.4 million tons per year. The world demand for H2 is about 120 million tons (8.7 tons at the European level). CW is mainly composed of water, which represents 93–95% (w/w), while the dry matter fraction is mainly composed of lactose (66–77%, w/w), a variety of globular proteins (8–15% w/w), and mineral salts (7–15% w/w) [12]. Furthermore, the BOD/COD ratio of CW greater than 0.5 indicates the high biodegradability of this wastewater, making it an attractive substrate for bioconversion [11].
One of the major microbiological limitations challenging the DF of CW is the intrinsic presence of lactic acid bacteria (LAB), which are typically responsible for the inhibition of H2 production due to bacteriocin excretion, substrate competition, and broth acidification. However, there is recent evidence that lactate-driven dark fermentation (LD-DF) can be an effective strategy to overcome LAB-associated H2 production inhibition [13,14,15]. Indeed, bioH2 formation from lactate is strongly dependent on interactions between LAB and lactate-consuming H2-producing bacteria (LC-HPB) [15,16], which can potentially overcome the typical overgrowth of LAB and foster bioH2 production [13,15]. However, the mechanisms of action of LAB on the DF process have not been fully elucidated, with a controversial boosting/inhibitory effect, which limits the widespread implementation of LD-DF technologies for bioH2 production.
Therefore, despite its potential to produce renewable H2, DF still faces drawbacks that hinder its full-scale implementation. In this context, several operational strategies (e.g., inoculum development; substrate pretreatment, nutrient and additive supplementation; reactor configuration; and process conditions such as temperature, pH, organic loading rate (OLR), and hydraulic retention time (HRT)) have been explored to overcome the weaknesses in the volumetric bioH2 production rate (VHPR) and yield (YH2) of the DF process [17]. At this point, it is worth highlighting that the use of nanotechnology for the enhancement of bioH2 production has recently gained attention in the scientific community. The application of iron-based nanoparticles (NPs, i.e., manganese ferrite, nickel ferrite, and iron oxide) in the DF process has resulted in significant increases in VHPR and YH2 due to their high specificity, catalytic activity, and large available surface area [18,19,20,21]. By directly targeting the hydrogenase enzyme, iron-based NPs can increase the electron transfer efficiency in anaerobic microorganisms [22]. As a result, H2-producing bacteria improve the volumetric productivity [23]. Regarding the microbial dynamics in DF processes, it has been shown that bioH2 production is not only determined by core bacteria (e.g., Clostridium spp.) but also by sub-dominant microorganisms (e.g., Bacillus spp. and Lactobacillus spp.) [13,24], and NP supplementation in the fermentation broth has been shown to increase the abundance of HPB [18]. Therefore, a deeper understanding of the shifts in the bacterial community composition in response to operational variations would allow for a holistic understanding of the DF process with the aim of improving the efficiency of bioH2 production [13].
This study evaluated the effect of different operational conditions on the continuous production of bioH2 by DF, driven by the lactate metabolic pathway, using powdered CW (PCW) as a substrate. Batch experiments were carried out to determine the maximum YH2 and substrate consumption efficiency during the LD-DF of PCW. Then, a transition to a continuous configuration was performed to evaluate the general effects of different operational strategies (i.e., addition of an inert support media and different types of iron-based NPs at different concentrations) on H2 production, substrate consumption, and biomass growth. In addition, the temporal dynamics of the bacterial community structure was investigated by 16S rRNA amplicon sequencing.

2. Materials and Methods

2.1. Substrate and Inoculum

The PCW used here as a substrate in the fermentation assays was characterized by a chemical oxygen demand (COD) of 90.5% w/w and a content of 79.5% w/w carbohydrates, 0.9% w/w lipids, 0.5% w/w phosphorus, 5.8% w/w nitrogen, 7.3% w/w ash, and 97.4% w/w dry matter, according to standard methods [25]. The substrate was diluted in a mineral salt medium [26] consisting of NH4Cl (2.4 g/L), K2HPO4 (2.4 g/L), KH2PO4 (0.6 g/L), MgSO4∙7H2O (1.5 g/L), CaCl2∙2H2O (0.15 g/L), and FeSO4∙7H2O (0.1 g/L). A consortium enriched in LAB and LC-HPB, which derived from the digestate of a pilot-scale anaerobic digester treating food waste under mesophilic conditions was used as the inoculum source [27]. The retrieved digestate was pretreated by heat shock (90 °C for 20 min) to prevent the growth of methanogens and stored at 4 °C until further use. The bacterial inoculum was activated with a growth medium containing the following: lactose (10 g/L), inoculum source (0.1 L), and mineral solution (0.9 L). The activation was carried out for 24 h under continuous stirring (300 rpm) and mesophilic conditions (37 ± 1 °C), resulting in a volatile suspended solid (VSS) content of 0.55 g/L and a pH of 4.4. All reagents were analytical grade.

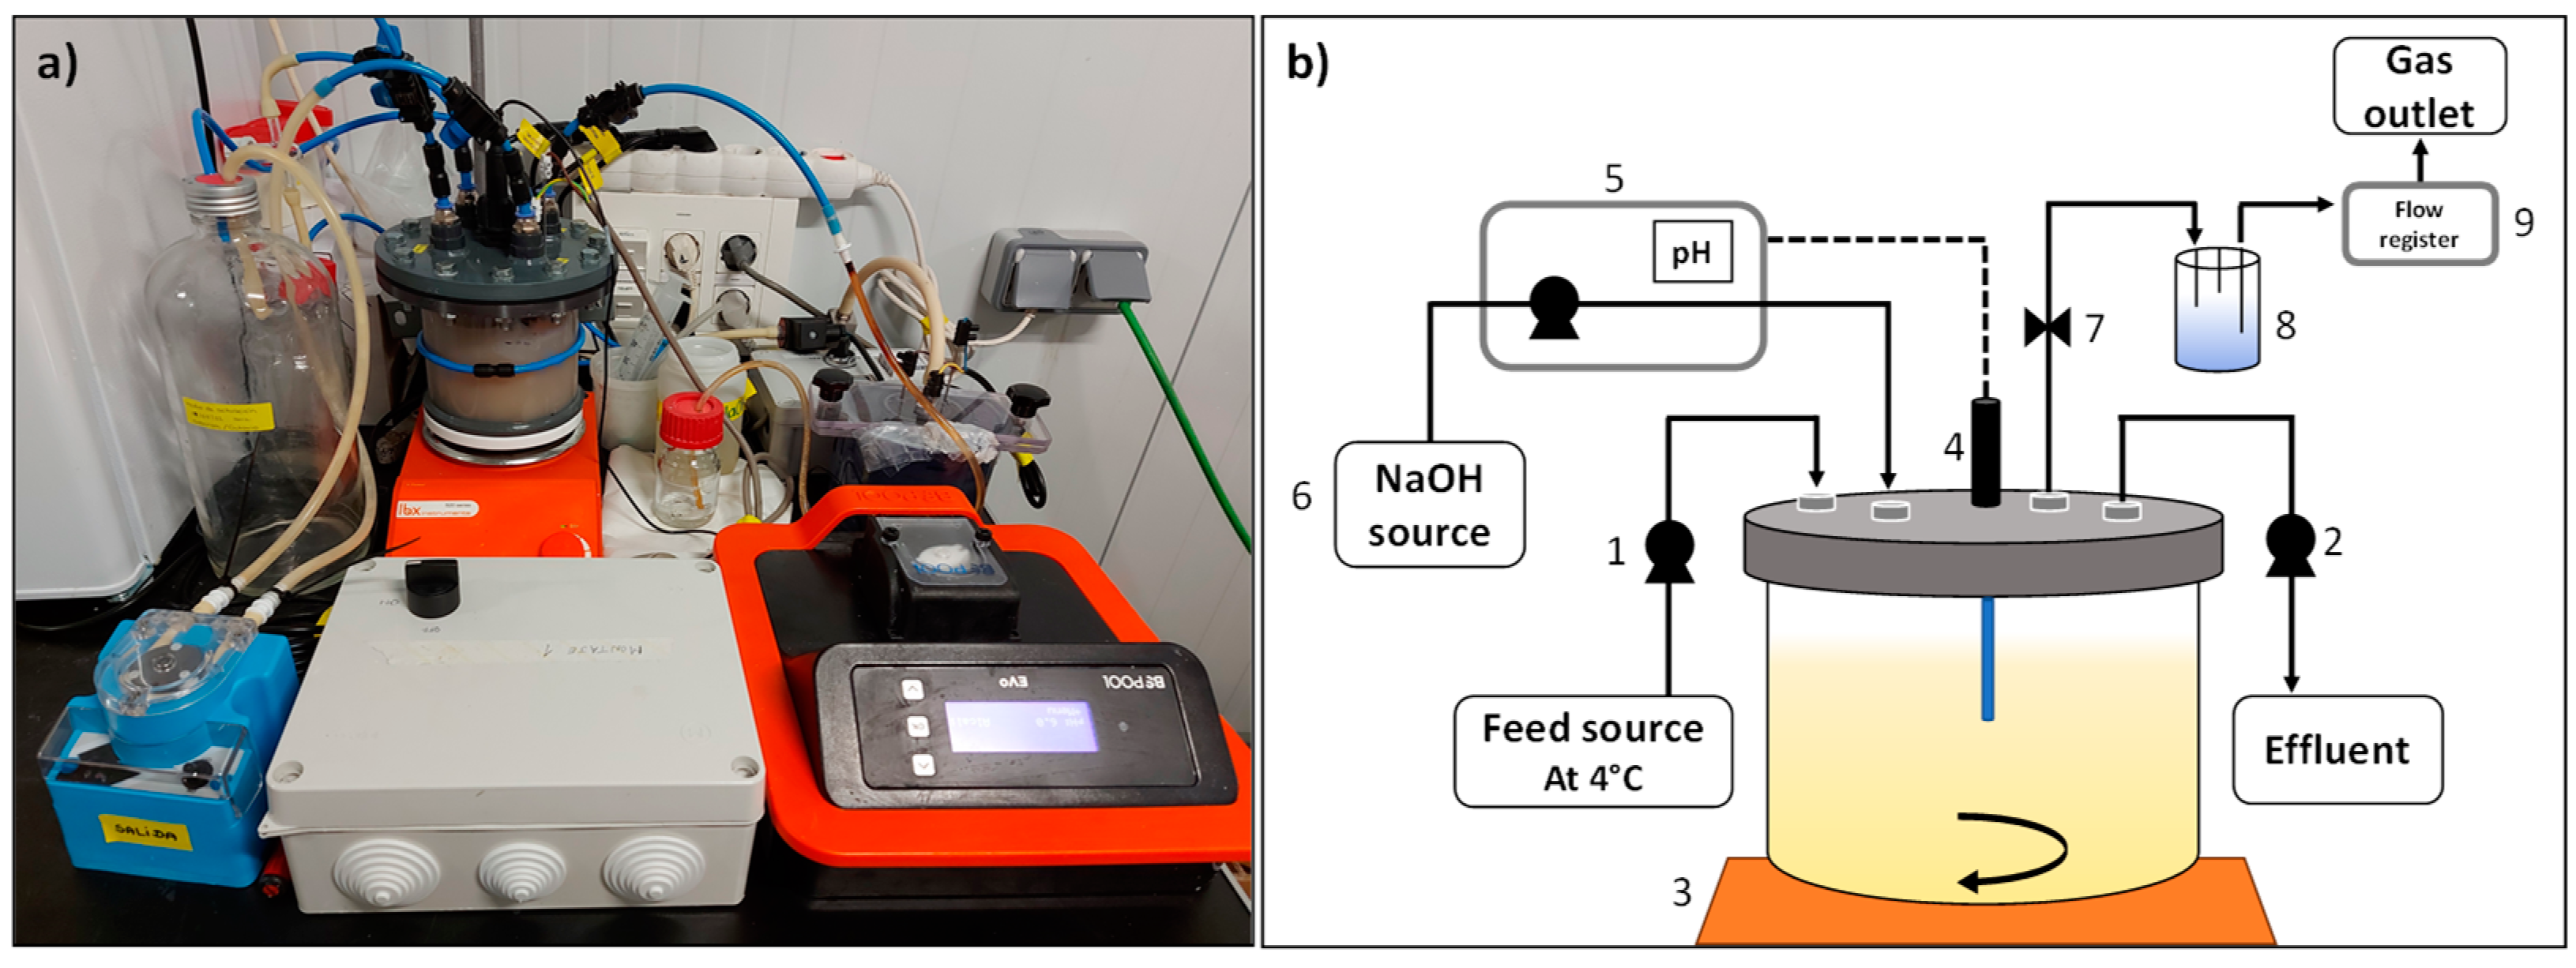
2.2. Experimental Setup and Operational Conditions

Batch and continuous hydrogenogenic fermentation assays were conducted in a custom-built, continuously stirred tank reactor (CSTR), with a total volume of 1.25 L and an operating volume of 0.8 L (Figure 1). The reactor was equipped with liquid and gas sampling ports and a pH controller (EvopH-P5, BSV Electronic, Barcelona, Spain) coupled with a pH electrode (BSV Electronic S. L., HO35-BSV01, Barcelona, Spain) to maintain a constant pH. Gas production was measured using a custom-made gas flow meter, which is based on the liquid displacement method.

2.2.1. Batch Configuration

Batch PCW DF fermentations were performed in triplicate at constant temperature (36 ± 1 °C) and agitation (~300 rpm). The process was started with a mixture containing 0.08 L of the activated inoculum solution (0.55 g VSS/L), 0.72 L of mineral salt medium, and PCW at a concentration of 20 g COD/L. The initial pH was 6.7, which was reduced to 6.0 by natural acidification and maintained at 6.0 ± 0.1 by the addition of alkali (NaOH 6 M). Liquid and gas samples were collected every 2–3 h and 1 h, respectively. Liquid samples were stored at −20 °C until further analysis.

2.2.2. Continuous Operation

The hydrogenogenic fermenter was operated in batch mode for 10 h prior to continuous operation. An HRT of 6 h was set under continuous feeding (3.2 L/d). The substrate concentration was estimated by setting the OLR to 180 g COD/L-d. The substrate solution was maintained under constant agitation and refrigerated conditions (4 °C). The effluent output was controlled by a liquid displacement device installed in the reactor, keeping the operating volume constant at 0.8 L. Liquid effluent and gas samples were collected every 12 h for the ~29 days of operation. Liquid samples were stored at −20 °C until further analysis. A mixture of organic polyether dispersions with antifoam effect (Antifoam 204, Sigma-Aldrich®, Dorset, UK) was added to the feed source (20 µL/L) to prevent foaming.
The process operation included five cultivation conditions: Control Phase I (7.54 days) was performed under the same operational conditions established during process start-up. In Phase II (7.46 days), a support media consisting of toothed plastic wheels (Kaldnes K1 Bio Filter Media, Kaldnes Moving Bed™, Wigan, UK) was introduced to promote bacterial biofilm formation and enhance biomass growth, occupying 12% of the operating volume. Phases III (5 days), IV (4.55 days), and V (4.13 days) explored the potential of nanotechnology by adding NPs (purchased ready to use) to the feed source: carbon-coated, zero-valent iron NPs (CC-nZVI) (Phase III, 100 mg/L; CE- nZVI, Calpech, S.L.) and Fe2O3 NPs (Phase IV, 100 mg/L; Phase V, 300 mg/L; Iron (III) oxide nanopowder < 50 nm, Sigma-Aldrich®). Anaerobic conditions were achieved by the action of facultative bacteria. In fact, there was no inert gas flushing of the fermentation broth or substrate at any time, and no reducing agent was introduced throughout the process.

2.3. Analytical Methods

The analytical methods used for process monitoring were performed according to García-Depraect et al. (2022) [27]. The concentration of organic acids (formic, acetic, lactic, propionic, isobutyric, butyric, isovaleric, valeric, isocaproic, hexanoic, and heptanoic acids) was measured on an Alliance HPLC system (Waters e2695, Milford, MA, USA) equipped with a UV–VIS detector (Alliance 2998 PDA, Waters, Milford, MA, USA) set at 214 nm and a Micro-Guard Cation H + Refill guard column 30 × 4.6 mm cartridge coupled to an Aminex HPX-87H chromatography column (Bio Rad, Hercules, CA, USA). The column temperature was maintained at 75 °C, while the flow rate of the 25 mM H2SO4 eluent was set at 0.7 mL/min. A standard mixture (Sigma-Aldrich part number CRM46975, St. Louis, MO, USA) and a sodium L-lactate (Sigma-Aldrich part number 71718, St. Louis, MO, USA) were used for the calibration curves. The total carbohydrates were analyzed by the phenol-sulfuric method, while the COD, TOC, and solids were measured according to standard methods [25].
The gas composition (i.e., H2, CH4, CO2) was determined using a Varian CP-3800 gas chromatograph (Varian, Palo Alto, CA, USA) equipped with a thermal conductivity detector and a Varian CP-Molsieve 5A capillary column (15 m × 0.53 mm × 15 µm) connected to a Varian CP-PoreBOND Q capillary column (25 m × 0.53 mm × 10 µm) and calibrated with certified standard gas mixtures of known composition (70.0% H2 and 30.0% CO2; 70.53% CH4, 24.0% CO2, 2.99% N2, 2.0% H2S, 0.49% O2). High-purity helium gas was used as the carrier gas at a flow rate of 13 mL/min.

2.4. Data Analysis

The cumulative H2 production (H, NmL) in the batch stage was estimated with a kinetic adjustment based on the modified Gompertz model (Equation (1)), considering the parameters lag phase (λ, h), ultimate H2 production potential (Pmax, NmL H2), and maximum H2 production rate (Rmax, NmL H2/h).
H = P m a x · e x p { exp R m a x · e P m a x λ t + 1 }
The performance of the process was evaluated based on the bioH2 yield (YH2, NmL H2/g CODfed), volumetric H2 production rate (VHPR, NmL H2/L-d), peak H2 content in the acidogenic off-gas (% v/v), total carbohydrate removal (%), and organic acid spectrum. Moreover, process stability during continuous operation was estimated by calculating the H2 production stability index (HPSI), which considers the variations in H2 productivity during a given phase of the operation. The HPSI was calculated as previously described by García-Depraect et al. (2020) [28]. The biogas data were reported at standard temperature and pressure conditions.
Statistical evaluations were based on non-parametric Kruskal–Wallis and Dunn’s post hoc tests to verify significant differences among all operating phases; non-parametric Wilcoxon paired-sample t test to verify significant differences between Phases III and IV; and non-parametric Mann–Whitney U test to verify differences between Phases IV and V, regarding H2 productivity (α = 0.05). Differences between the mean effluent concentrations of carbohydrates, soluble COD, and VSS in the different operational phases were investigated using the non-parametric Kruskal–Wallis and Dunn’s post hoc tests.

2.5. Microbial Community Composition

The influence of the operating conditions on the microbial community composition of PCW-LD-DF during continuous operation was also investigated. Five liquid samples were retrieved from each of the operational phases (I to V), stored in sterile vials, and kept at −20 °C until further analysis. DNA extraction and 16S rRNA sequencing were performed as described by García-Depraect et al. (2023) [29]. Briefly, DNA was isolated using the QIAsymphony PowerFecal Pro DNA Kit (Qiagen, Hilden, Germany) according to the manufacturer’s instructions. The V3–V4 region of the 16S rRNA gene was amplified using the primers 341F-805R, sequences CCTACGGGNGGCWGCAG-GACTACHVGGGTATCTAATCC [30], and amplicon libraries (300 bp paired-end reads) were prepared by ADM-Biopolis (Valencia, Spain) according to the 16S Metagenomic Sequencing Library Illumina 15,044,223 B protocol (Illumina 1.9). The raw sequences were merged and trimmed using the BBMerge package of the BBMap V. 38 software with “Cutadapt v 1.8.1” using default parameters. Quality-checked (Q20 threshold) reads were then processed using the DADA2 denoise-single command [31]. The error rates were learned from a set of subsampled reads using “learnErrors”, and the sample inference algorithm was applied using the “dada” function. The chimeric amplicon sequence variants (ASVs) were removed using “removeChimeraDenovo”. These clean ASVs were annotated against the NCBI 16S rRNA database version 2022 using blast version 2.2.29 with a 97% similarity threshold [32]. The taxonomy of the ASVs with a percentage identity lower than 97% was reassigned using the NBAYES algorithm [33]. The NBAYES classifier was trained on the V3-V4 of the 16S rRNA gene from the SILVA database (v. 138) [34]. Finally, the data were normalized using the rarefaction technique from Phyloseq R package to perform alpha diversity analysis [35].

3. Results and Discussion

3.1. Batch Configuration

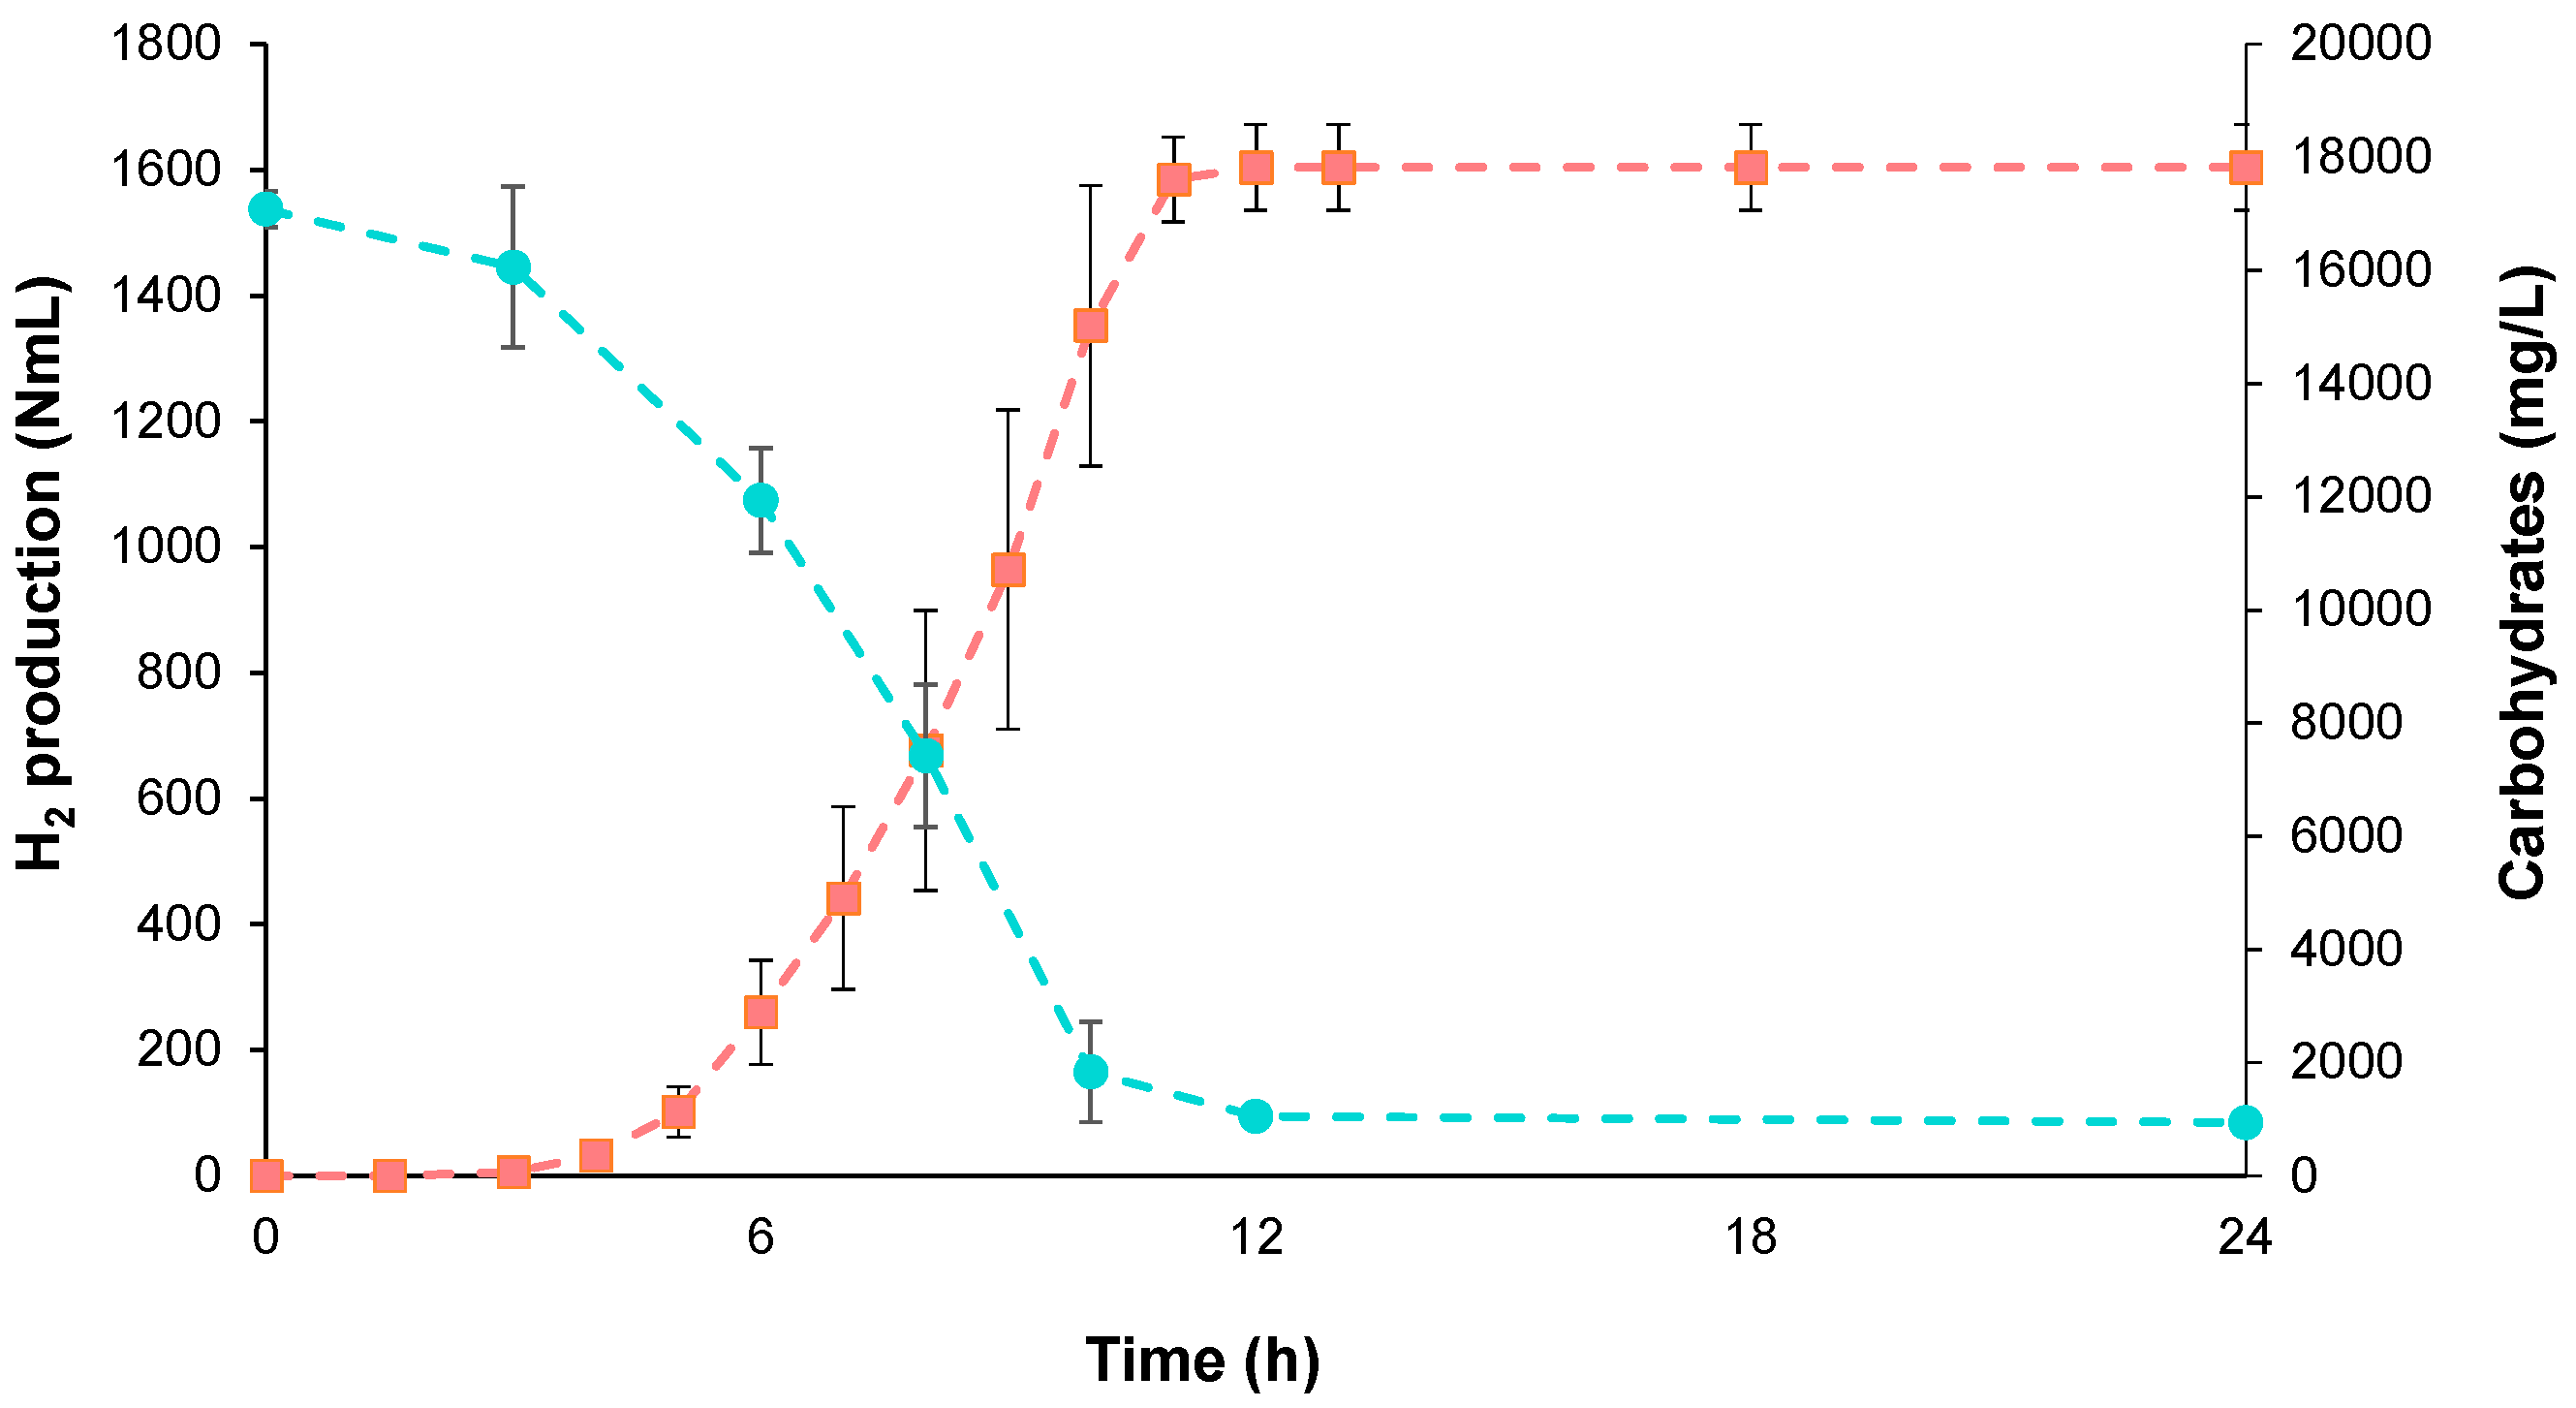
3.1.1. BioH2 Production and Substrate Consumption Efficiency

The fermentation assays in batch configuration were performed with initial concentrations of PCW and a biomass of 20 g COD/L and 0.55 ± 0.05 g VSS/L, respectively. BioH2 production occurred after a short period of initial biomass adaptation (approximately 4 h), resulting in a remarkable H2 production at the end of 12 h, amounting to 2004.5 ± 84.7 NmL H2/Lreactor and a YH2 of 100.2 ± 4.2 NmL H2/g CODfed. The time course of substrate consumption and gaseous H2 production was correlated with the gradual decrease in carbohydrate concentration (94.4 ± 0.8% consumption during the batch tests), in parallel with the steady increase in the accumulated H2 volume (Figure 2). In general, the modified Gompertz model described the experimental data with high accuracy (R2 > 0.99), as shown in Table S1. The maximum H2 production rate (Rmax) was estimated to be 342.3 NmL/h, corresponding to a maximum volumetric rate of 427.9 NmL H2/L-h. The fermentation process was also analyzed in terms of TOC and total and soluble COD removal (Table S2). The reduction in TOC concentration at the end of the experiments was, as expected, much less pronounced than the removal of carbohydrates, with approximately 70% of the original organic carbon remaining in the acidogenic effluent at the end of the experiment. Similar removals, between 17 and 20%, were previously observed in batch trials with pH conditions varying between 5.5 and 8.5 [36]. The COD removal efficiency was, on average, 11.4%.

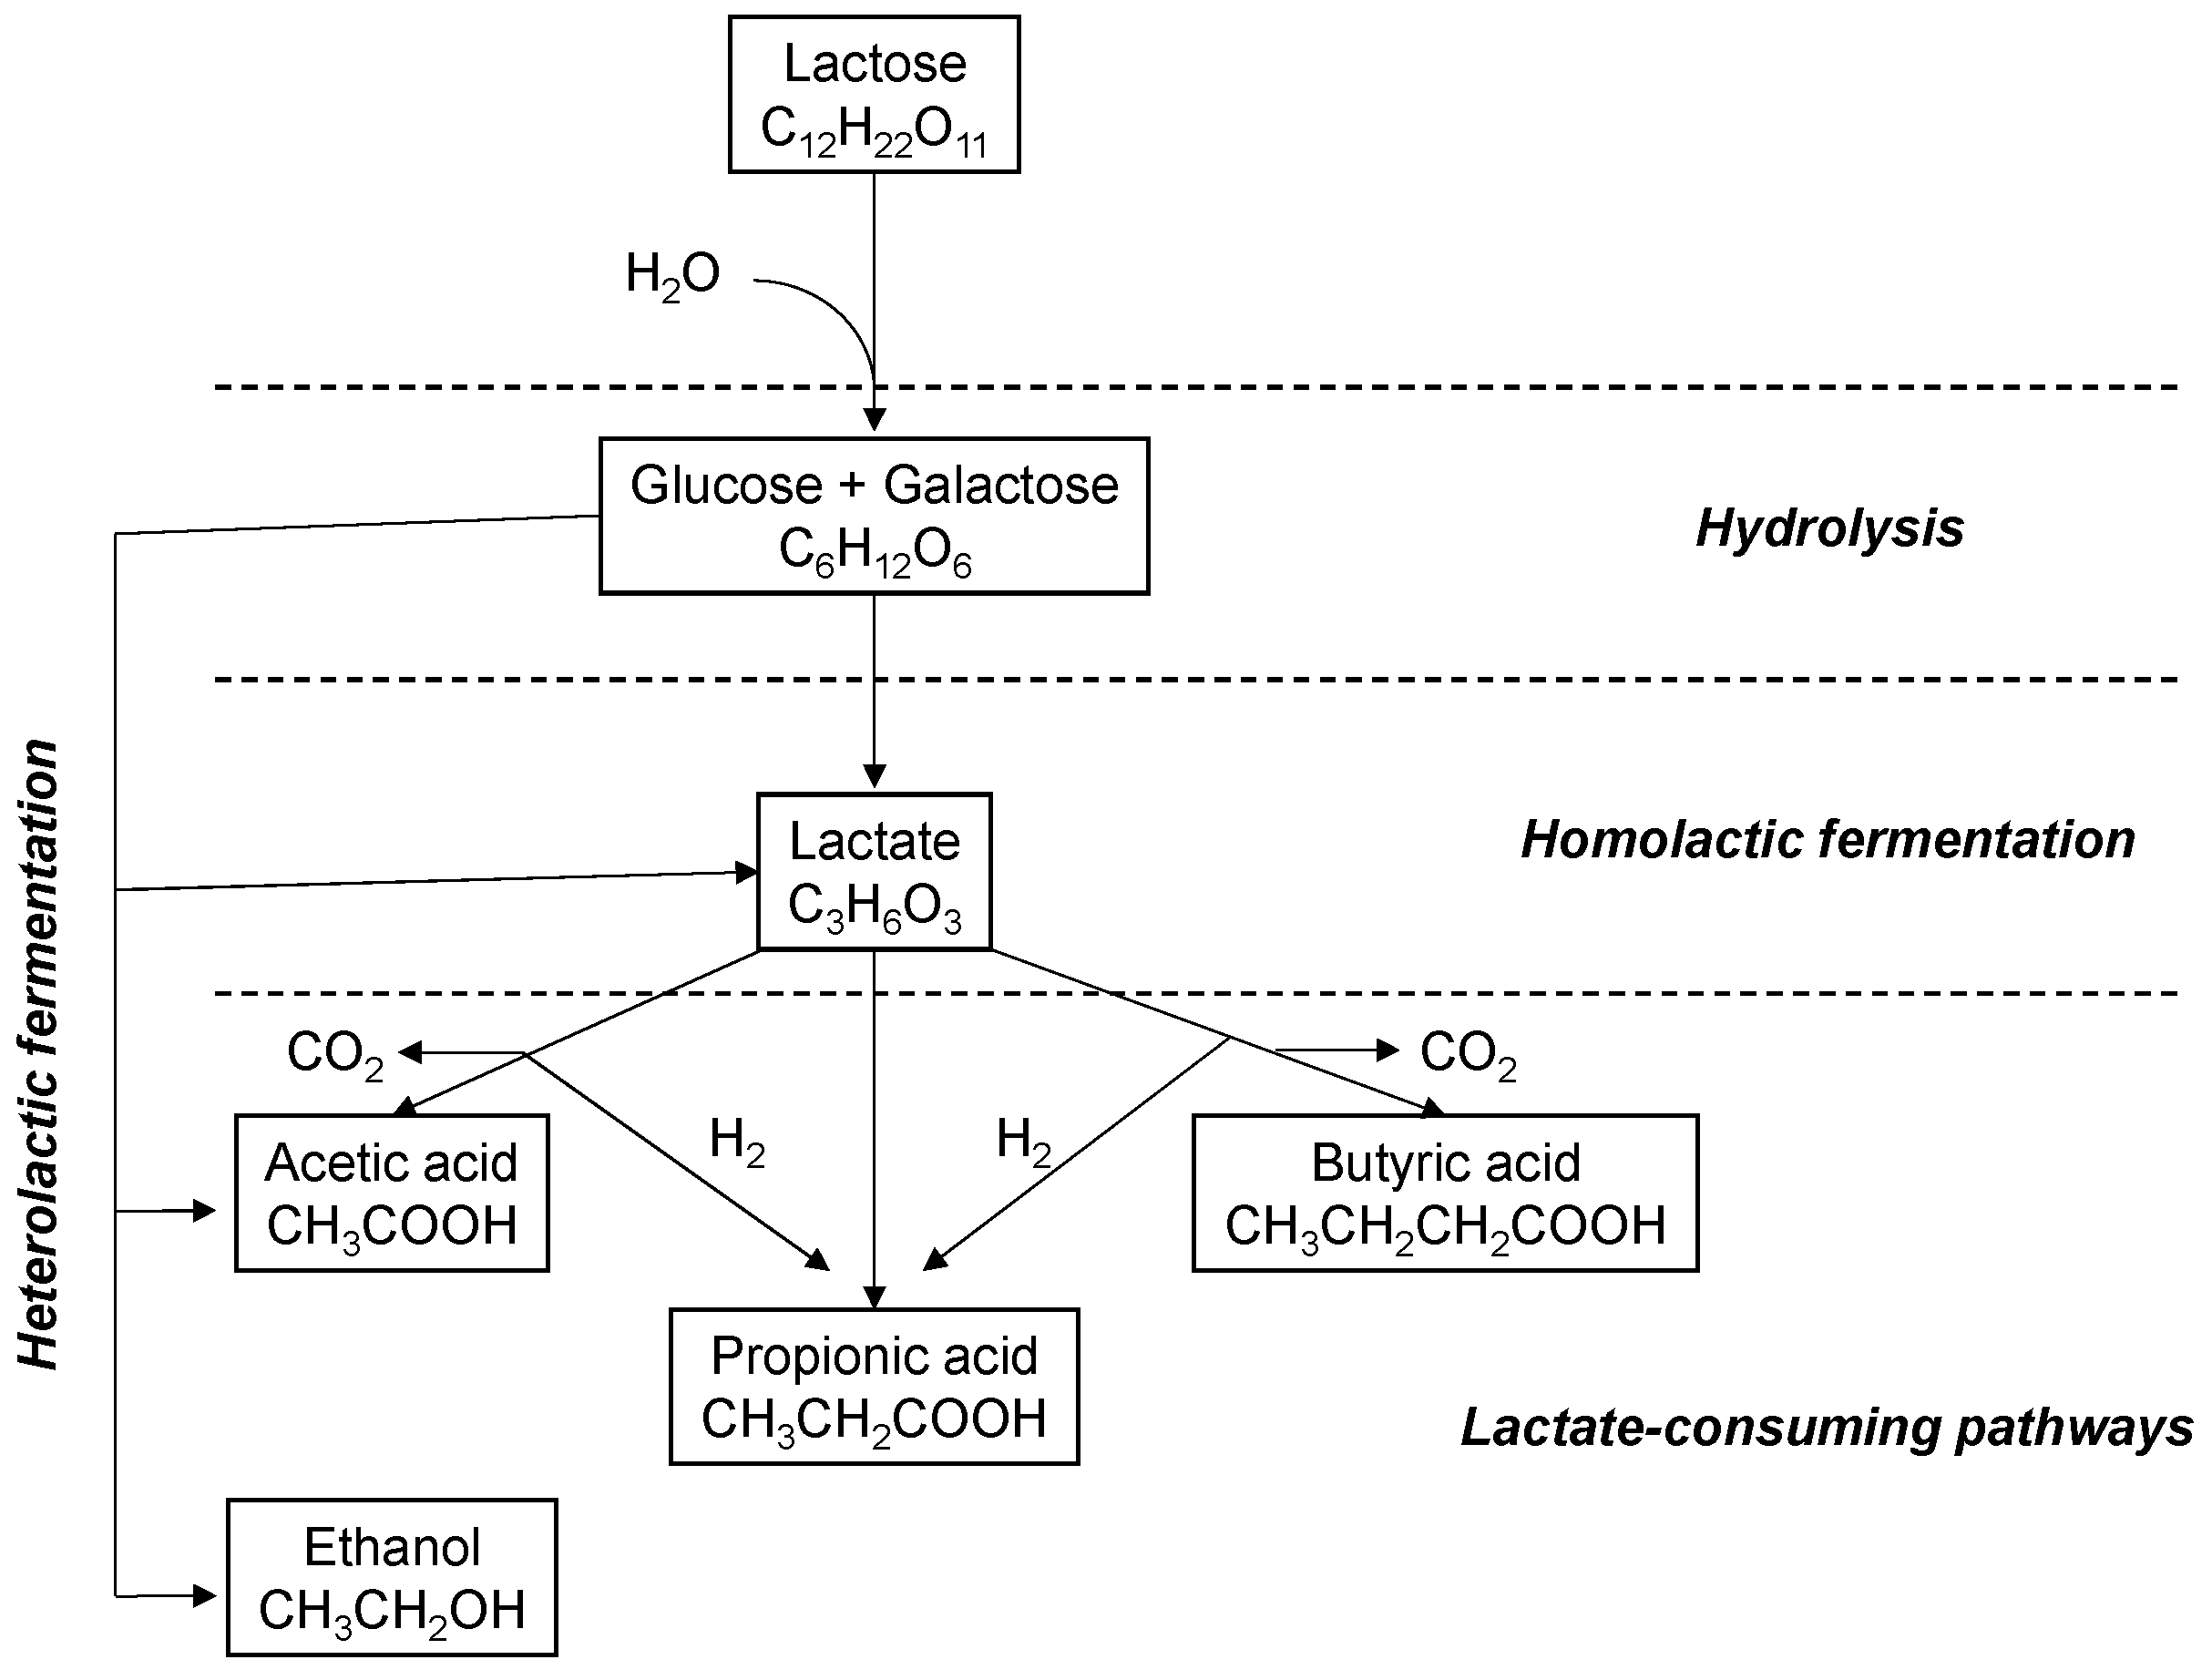
3.1.2. Production of Metabolites

BioH2 production is strongly related to the profile of metabolites produced and their concentration, according to their stoichiometries [37]. The evolution of the concentration of the main organic acids (i.e., acetic, butyric, formic, lactic, and propionic acids) produced during the batch fermentations is shown in Figure 3. The presence of lactate, formate, and propionate in low concentrations at the beginning of the fermentation is probably due to the occurrence of residual soluble metabolites from the activation of the inoculum, which contains fermentative acidogenic bacteria using lactose as a substrate [26].
A major metabolic pathway involved in this process is associated with the production and consumption of lactic acid, the lactate-driven DF pathway, which diverges toward different intermediate H2-producing metabolic routes. DF of lactose mainly involves three steps, including (i) hydrolysis of lactose to glucose and galactose; (ii) conversion of monomeric sugars to lactate by homolactic microorganisms, such as Lactobacillus; and (iii) conversion of lactate to H2 and organic acids (e.g., butyrate) by fermentative microorganisms, such as Clostridium butyricum [38]. A simplified scheme of the lactic acid pathways during lactose DF is shown in Figure 4.
A confluence was observed in the production of acetic and lactic acid (although to a much lesser extent for the latter), which converges with the exponential phase of H2 production, suggesting a possible interaction between the two pathways (Figure 3). Furthermore, considering the low concentrations of butyrate recorded during fermentation, the observed H2 production probably occurred, at least mostly, through the consumption of lactate and acetate (Equation (2)). The consumption of both lactic and acetic acids and their conversion to H2 has been reported for tequila vinasses [25]. In this metabolic pathway, lactate and acetate act as electron donors and acceptors, respectively [39]. Since the anaerobic catabolism of lactose involved the production of lactate and this metabolite did not accumulate in the fermentation broth, it can be inferred that lactate was metabolized to H2, with concomitant consumption of acetate and production of H2 (Equation (3)). Thus, it was suggested that LD-DF was able to cope with the high rate of conversion of lactose to lactate that occurs during the acidification of PCW.
C H 3 C H O H C O O H + 0.5 C H 3 C O O H 0.75 C H 3 C H 2 C H 2 C O O H + C O 2 + 0.5 H 2 + 0.5 H 2 O
C H 3 C H O H C O O H + H 2 O C H 3 C O O H + C O 2 + 2 H 2
Stoichiometry is a valuable tool for estimating the theoretical product formation during the fermentation of real substrates. However, due to the complexity of the metabolic pathways involved in the H2 production process by DF, the stoichiometry of the major substrates is often not sufficient to justify the total H2 production observed empirically. This is due to the presence of competing pathways that do not produce H2 (such as the lactic acid production pathway) or other metabolic pathways that directly consume H2 [40] and the complex and dynamic diversity of microorganisms [41].

3.2. Continuous Operation

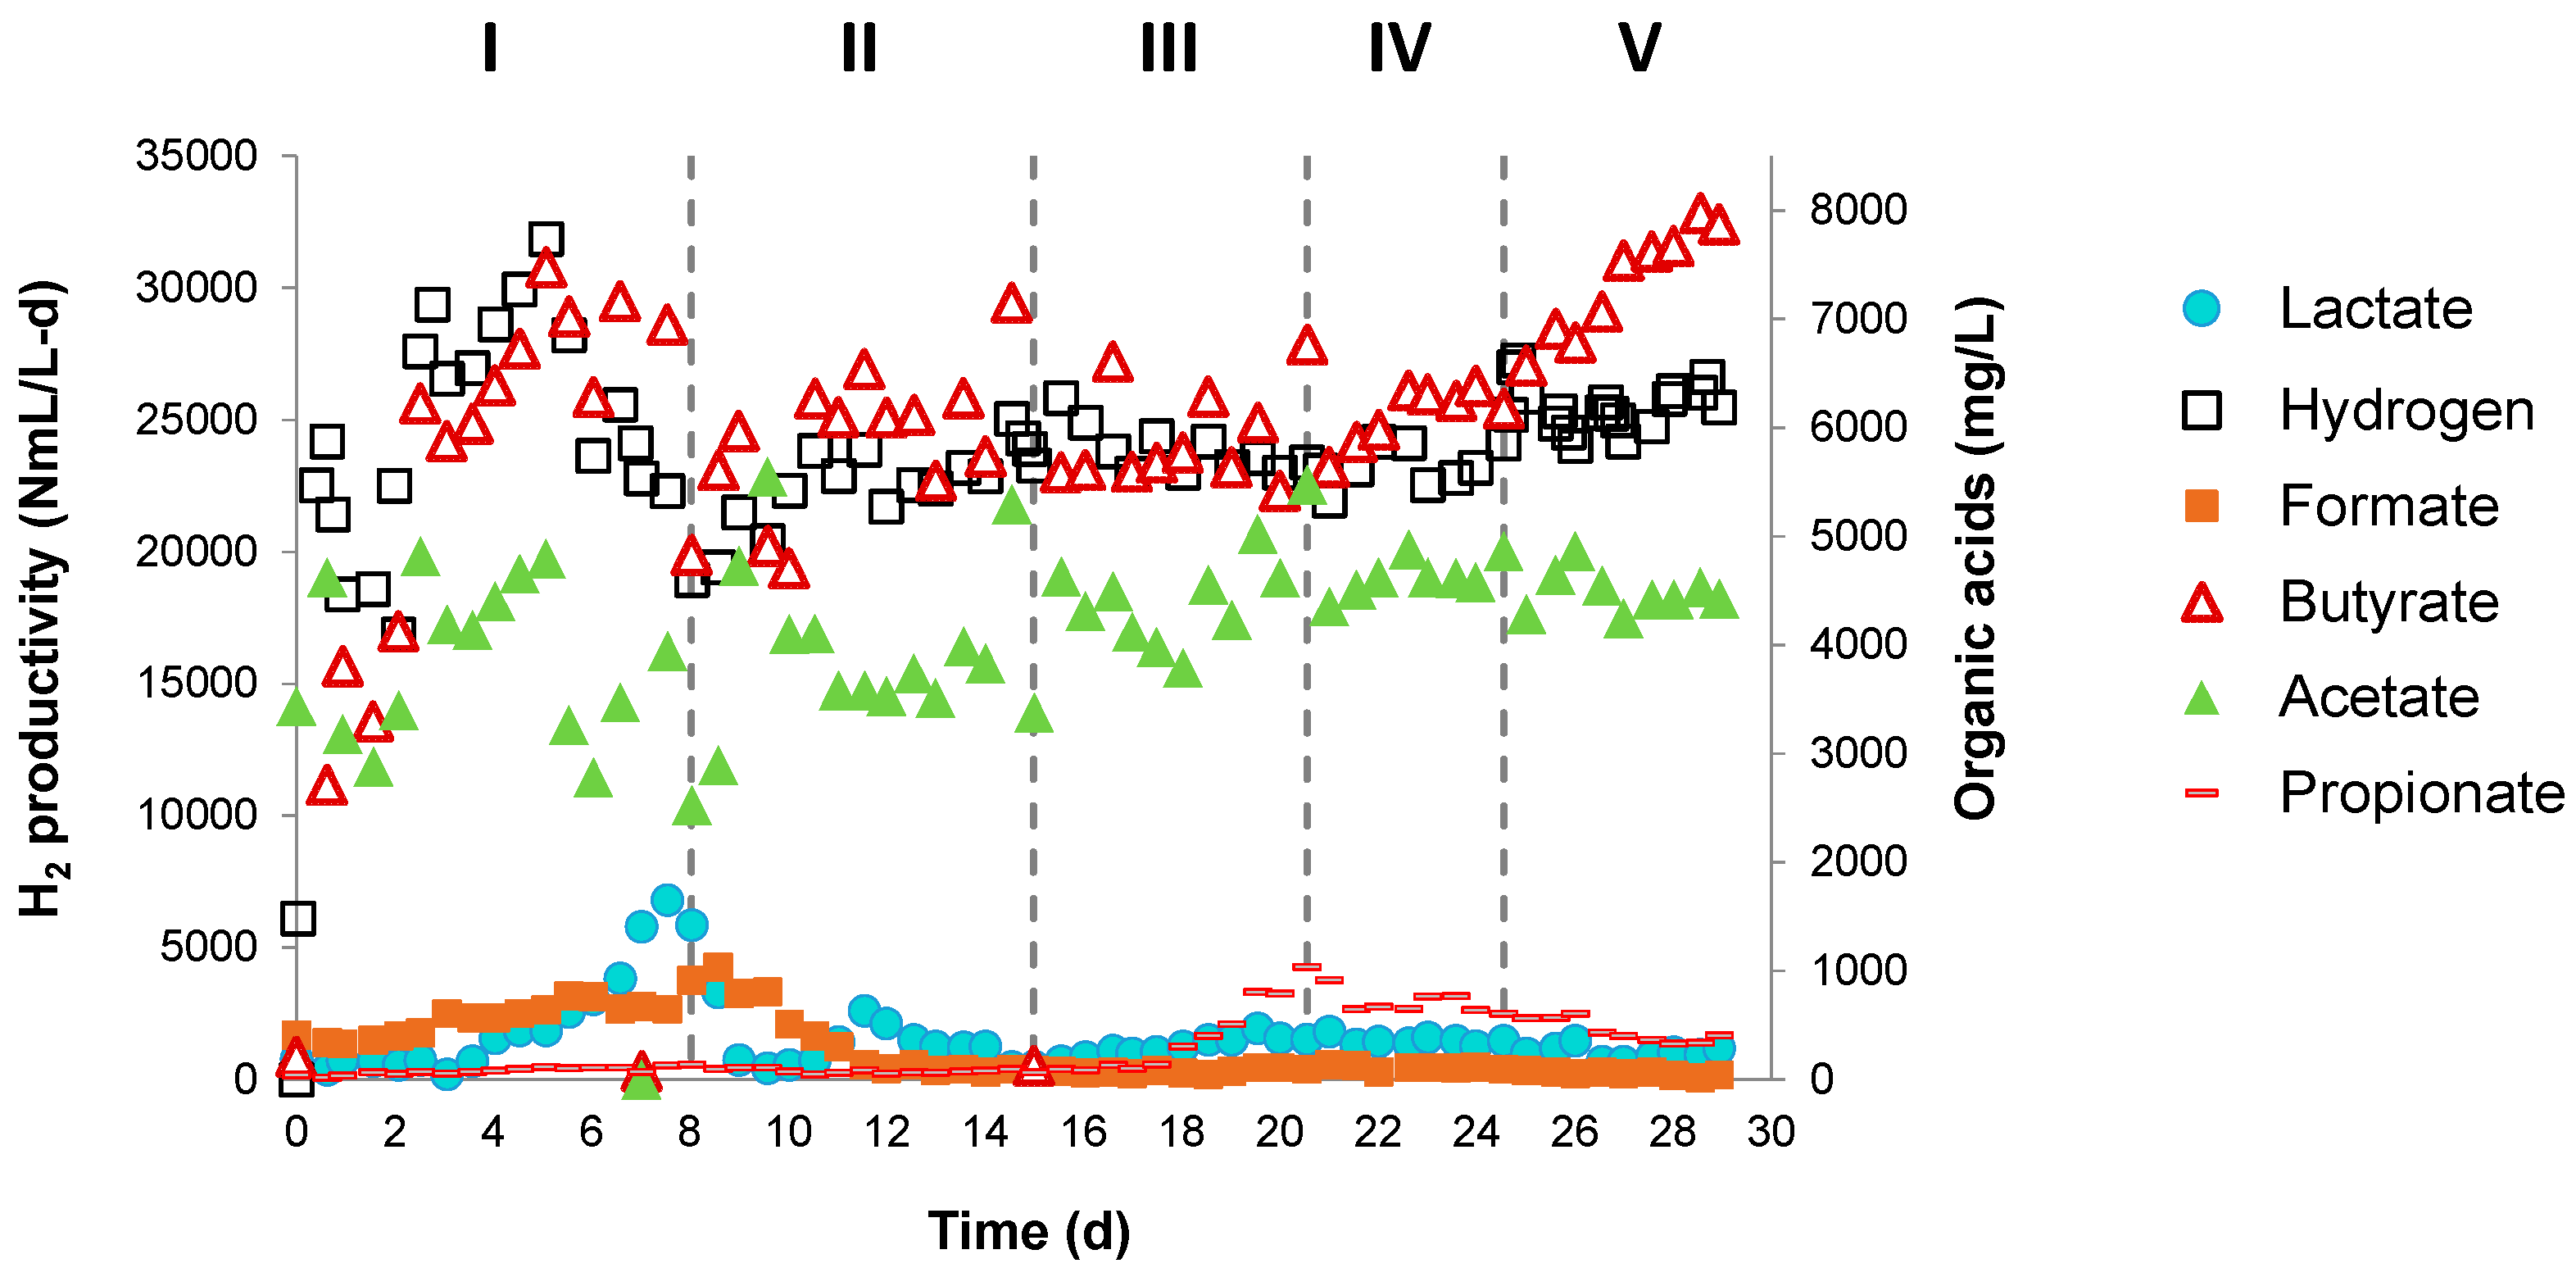
3.2.1. H2 Production and System Stability

After evaluating the DF of PCW in the batch assays, the CSTR was operated continuously for approximately 29 days under mesophilic conditions, with an HRT of 6 h and an OLR of 180 g COD/L-d. Figure 5 shows the evolution of the VHPR, as well as the H2 content in the acidogenic off-gas (%v/v). After the first 12 h of operation (initial adaptation), the H2 content in the gas phase remained constant in the range of 49–62%, and the VHPR varied between 16,873.2 and 31,879.7 NmL/L-d.
During Phase I, high variability in the H2 production was observed, with an average value of 23,859.8 ± 2525.3 NmL H2/L-d and a H2 content of 55.6 ± 1.9% (v/v). Phase I was the most unstable operating phase, with an HPSI index of 0.87. In Phase II, the support media consisting of plastic toothed wheels was introduced to promote biomass immobilization and reduce fluctuations in H2 production [42]. In this phase, an average VHPR of 22,507.5 ± 1623.7 NmL H2/L-d was observed along with a H2 content of 56.6 ± 1.3% (v/v). The addition of the support media for biofilm formation caused a rapid change in the stability of the system, characterized by an HPSI of 0.95. Phases III, IV, and V were characterized by the addition of iron-based NPs. The H2 productivity in Phase III, supported by the supplementation of 100 mg/L of carbon-coated, zero-valent iron NPs (CC-nZVI), was 23,903.4 ± 901.4 NmL H2/L-d with a H2 content of 57.0 ± 0.9%. This phase exhibited a high stability in H2 production compared to the previous ones (HPSI of 0.98), although no significant increase in H2 productivity was observed. In the following two phases, the effect of Fe2O3 NP supplementation was analyzed at different concentrations (100 mg/L and 300 mg/L in Phases IV and V, respectively). Both phases were equally stable (HPSI of 0.97), with H2 productivities and H2 contents of 23,261.5 ± 694.1 NmL H2/L-d and 56.2 ± 0.6% (v/v) (Phase IV), and 25,500.1 ± 854.5 NmL H2/L-d and 55.69 ± 0.6% (v/v) (Phase V). No statistical differences were observed between the VHPR in Phases III and IV when comparing the effect of the different types of NPs at the same concentration. However, when the concentration of Fe2O3 was increased from 100 mg/L (Phase IV) to 300 mg/L (Phase V), a significant increase in H2 production was evidenced. The results of the statistical analyses are shown in Tables S3–S6.
In a previous study, Fe2O3/C NP concentrations of 200 mg/L and 300 mg/L, enhanced the H2 production by up to 33.7% [43], demonstrating that iron-based NP administration at dosages higher than 100 mg/L could improve the activity of the hydrogenase enzyme and help accelerate the electron transfer chain in the DF process. The use of carbon nanotubes to optimize H2 production via DF, using glucose as a substrate, resulted in more efficient gas production and stimulated the formation of granular sludge in a continuously operated UASB reactor, providing greater robustness and stability to the system when compared to a control system without NP addition [44]. Therefore, the use of NPs can increase H2 production in DF processes, but further studies need to be conducted to evaluate the viability of the process on an industrial scale.

3.2.2. Substrate Removal and Biomass Growth

The concentrations and removal efficiencies of carbohydrates and soluble COD, as well as VSS concentrations (Figure 6 and Table S7), were monitored to evaluate the organic matter removal and biomass growth during continuous operation. The continuous DF achieved carbohydrate and COD removal efficiencies of 81.12 ± 5.1% and 37.1 ± 5.1%, respectively, due to substrate consumption and organic acid production mediated by the metabolism of acidogenic microorganisms, as expected in a fermentative H2 production system [40]. Furthermore, the use of Fe2O3 NPs in Phases IV and V supported significantly higher COD removal efficiencies (>42%) compared to those in Phases I, II, and III (Tables S8 and S9). An increase in VSS concentration to 3685.7 ± 2281.2 mg/L compared to the initial inoculum concentration (548.33 mg/L) was observed during Phase I. However, the biomass concentration remained constant when changing the operating conditions, as no significant differences in VSS effluent concentrations were detected among all operating phases (Table S10).
The supplementation of Fe2O3 NPs was undoubtedly beneficial for the improvement of the overall performance of the DF process, both in terms of H2 production (particularly in Phase V, with a concentration of 300 mg Fe2O3/L) and organic matter (COD) removal. Moreover, no significant changes in substrate conversion and biomass concentration were observed among the operating stages, indicating that the decrease in COD concentration may be related to the consumption of intermediate metabolites (organic acids).

3.2.3. Evolution of Intermediate Metabolites

The analysis of the concentration of organic acids (Figure 7) revealed a significant increase in the total concentration of soluble metabolites throughout the experimental period, varying from a minimum concentration of 15,144.7 ± 5028 mg/L (Phase I) to 20,687 ± 838 (Phase V). The most abundant metabolites identified in all operational phases were lactate, formate, acetate, propionate, and butyrate. Butyrate was the most abundant metabolite in all operational conditions. Indeed, butyrate reached a maximum concentration of 7338.3 ± 480.8 mg/L in Phase V, followed by acetate, lactate, propionate, and formate (with concentrations of 4487.8 ± 178.2, 1014.2 ± 242.8, 449.8 ± 100, and 58.6 ± 19.1 mg/L, respectively). From the middle of Phase I to the end of Phase I (days 4.5–8), a decrease in VHPR (from 30,000 NmL H2/L-d to 18,000 mL H2/L-d) and an increase in lactate concentration (from 1000 to 7500 mg/L) were observed. However, during Phase II, a period characterized by the introduction of the inert support medium and a rapid improvement in the stability of H2 productivity, a significant decrease in lactate production was observed, which dropped to 2314 ± 1896.4 mg/L (Tables S11 and S12). Interestingly, after increasing the concentration of Fe2O3 NPs from 100 mg/L to 300 mg/L, the lactate abundance decreased significantly, reaching minimum concentrations of 1014.2 ± 242.8 mg/L. Since no modifications of HRT and OLR conditions were applied in the hydrogenogenic fermenter, a suitable explanation for the observed profile of organic acids in Phase V is the catalytic effect of high doses of Fe2O3 NPs, resulting in the highest steady-state VHPR (as mentioned in Section 3.2.1).
Concomitant lactate consumption and butyrate accumulation has already been suggested to play a key role in the improvement of VHPR in LD-DF assays [9,45]. In a study performed in batch mode using real CW as a substrate, Aranda-Jaramillo et al. (2023) observed an accumulation of butyrate at the end of the fermentation, which was directly related to the associated VHPR and explained by a theoretical H2 production dictated by the conversion of lactate (1 mol) and acetate (0.4 mol) to butyrate (0.7 mol), CO2 (1 mol), and H2 (0.6 mol) [9]. The authors suggested that the H2 produced by LD-DF would account for 75% of the total H2 produced in the experiment. Similarly, a series of batch tests were conducted by Martínez-Mendoza et al. (2022) with the aim of producing bioH2 from fruit–vegetable waste via LD-DF [45]. The lactate remained at low levels as butyric and acetic concentrations increased concomitantly with H2 production, suggesting the simultaneous occurrence of lactate-utilizing/H2-producing pathways. Furthermore, as shown by Sivagurunathan et al. (2023), the supplementation of NiO and Fe2O3 NPs in different combinations stimulated H2 production by more than 18%, accompanied by a significant increase in butyrate and acetate concentration, while the lactate concentration decreased significantly [46]. In the present study, it was found that the higher the butyrate concentration, the higher the VHPR. In contrast, acetate did not correlate with H2 production The supplementation of NPs seems to boost bioH2 production via the LD-DF process by increasing the hydrogenase activity and, as a consequence, tends to converge toward the butyrate-mediated H2 production metabolism [46].

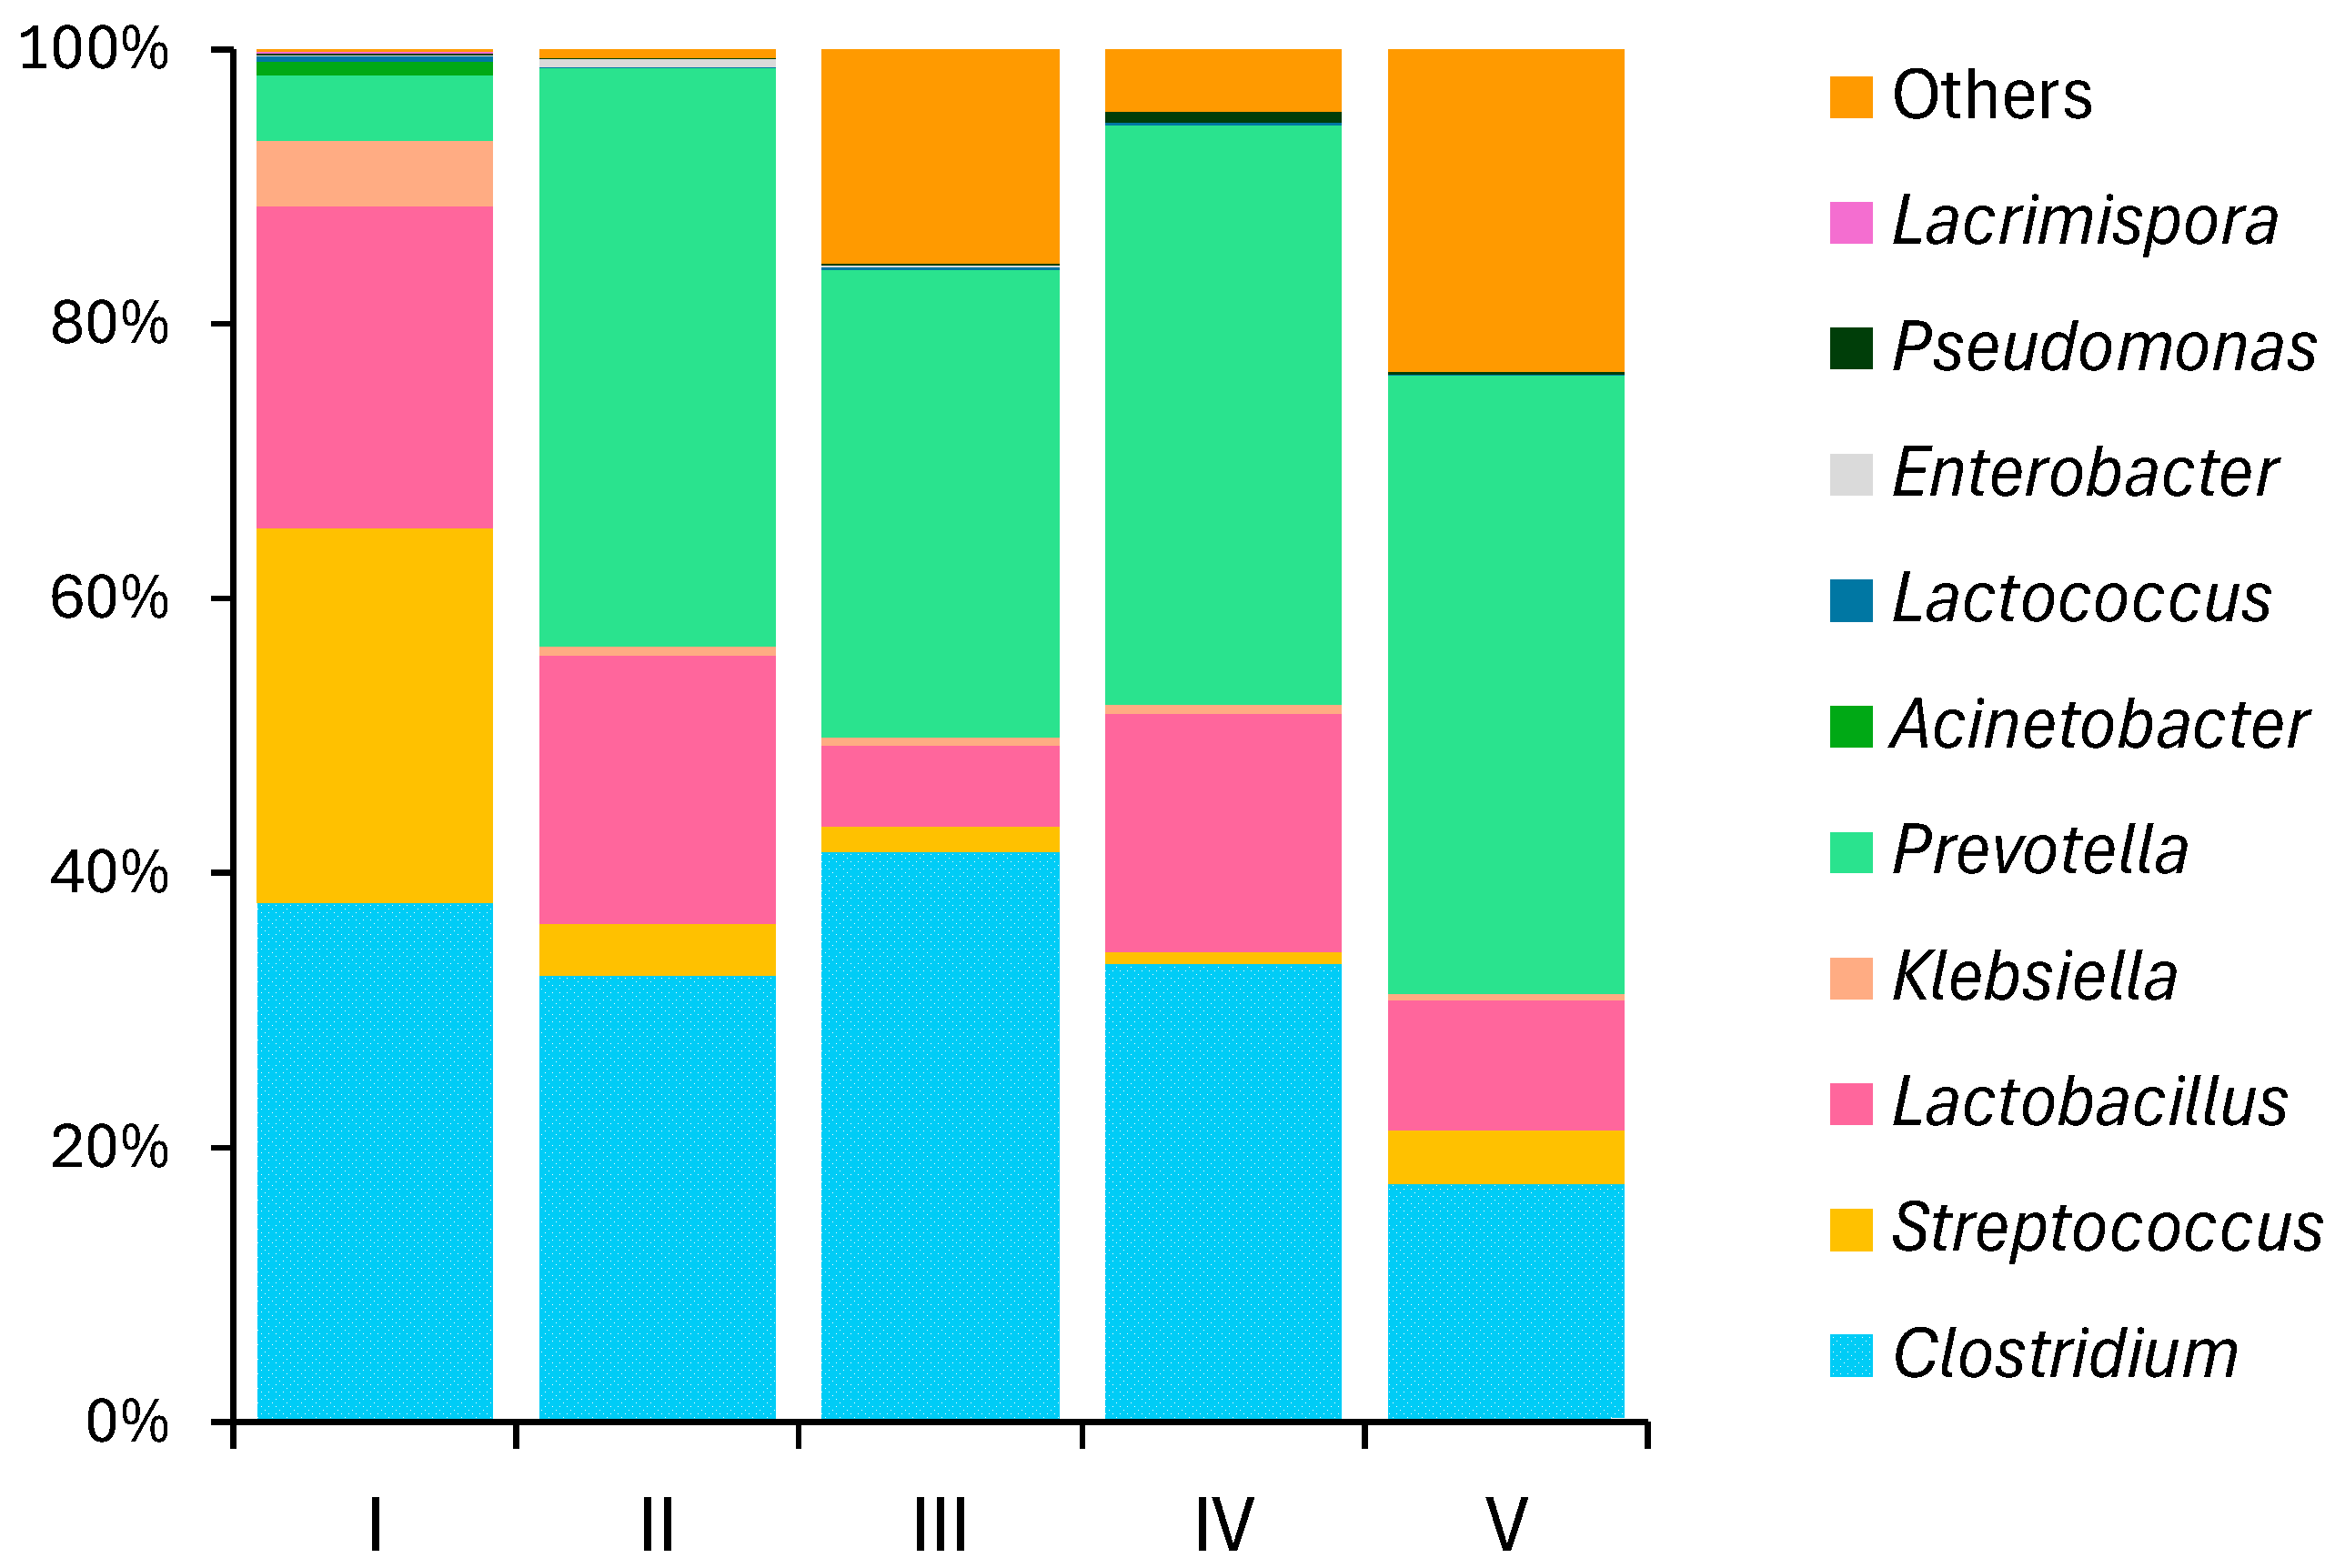
3.2.4. Microbial Community Structure

The bacterial community structure in the LD-DF reactor was characterized by means of the analysis of the V3–V4 region of the 16S rRNA gene. The taxonomic analysis revealed a total of 290,870 amplicon sequence variants (ASVs), which were classified into four phyla (Firmicutes, Bacteroidetes, Proteobacteria, and Bacteroidota). Alpha-diversity analysis was based on the rarefied data of the ASVs (rarefaction curves of all samples reached saturation), to compare samples without the associated bias from differences in sample size (Table 1). Overall, the alpha diversity metrics suggested an increase in the microbial diversity in the final operating condition, characterized by the highest concentrations of Fe2O3 NPs (Shannon and Simpson indices). Previous authors observed an increase in the Shannon index and, as a consequence, a higher level of biodiversity, by supplementing 300 mg/L of CoAl0.2Fe1.8O4 NPs and 300 mg/L of CoCu0.2Fe1.8O4 NPs in DF systems compared to the control (without NPs) [47]. This suggests that the administration of NPs at high doses may act as a microbial diversity enhancer in DF processes devoted to bioH2 production.
An analysis of the relative abundances of the most abundant genera (Figure 8) was performed to elucidate possible shifts in the microbial structure of the LD-DF system due to changes in the operating conditions. Thus, Clostridium, Lactobacillus, and Prevotella were dominant under most operating conditions, especially from Phases II to V, representing 85.1 ± 9.1% of the total microorganisms present in the reactor. Streptococcus represented 27.2% of the bacterial population in Phase I, which was strongly reduced to 3.7% after the introduction of support media in Phase II. Streptococcus is a genus of facultative fermentative bacteria that can metabolize carbohydrates to lactic acid as the main metabolic product [16]. The high abundance of Streptococcus in Phase I, coinciding with a peak in lactate production around day 4 of operation (1775.56 ± 138.95 mg/L), suggested that this was a preferential metabolic pathway at the beginning of the experiment, likely due to the characteristics of the inoculum.
As discussed in Section 1, a H2-producing microbial community may establish positive and negative interactions among them, traditionally associated with Clostridium members, affecting the productivity of the system [48]. LAB can play a controversial role in this context, acting as inhibitors (negative interaction) or collaborators (positive interaction). LAB are capable of producing lactic acid and bacteriocins, which may decrease the bioH2 productivity and process stability. On the other hand, some HPB such as C. butyricum and C. beijerinckii can use lactate as an alternative substrate for H2 production via the LD-DF metabolism [49]. High H2 productions associated with low lactate concentrations measured in the fermentation broth and the presence of LAB and HPB throughout the experimental period (Figure 7 and Figure 8) strongly suggested positive interactions between HPB and LAB. The relative abundances of Clostridium and Lactobacillus were 32.6 ± 8.2% and 15.1 ± 6.5%, respectively. In addition, Prevotella, a well-recognized HPB [50], dominated from Phases I to V, with a relative abundance of 40.8 ± 4.1%. Regarding LAB, the supplementation of CC-nZVI NPs in Phase III caused a significant decrease in the Lactobacillus population (relative frequencies from 19.5% to 5.8%), which rapidly recovered after changing to Phase IV, when Fe2O3 NPs were added (relative frequency increased to 17.4%). Interestingly, increasing the concentration of NPs up to 300 mg Fe2O3/L (phase V) induced an important selection in the LAB population characterized by a decrease in the abundance of Lactobacillus (from 17.4% to 9.4%) and an increase in the relative abundance of Lacticaseibacillus (from 1.7% to 13.2%). In the case of HPB, a gradual decrease in the relative abundance of Clostridium was observed in the presence of NPs (Phases III to V), more pronounced after increasing the Fe2O3 concentration to 300 mg/L (41.5%, 33.4%, and 17.4% in Phases III, IV, and V, respectively). Prevotella, on the other hand, underwent a progressive increase up to abundances of 34%, 42.18%, and 45% in Phases III, IV, and V, respectively.
Previous authors have shown that the increase in the relative abundance of Clostridium organisms is directly related to the higher dosage of NPs in various DF systems [21,51,52,53,54,55], becoming the dominant population in most cases. At high doses of NPs, the authors also observed an increase in bioH2 productivity. In the case of the LD-DF process, Laubitz et al. (2021) observed that a decrease in H2 production was associated with the dominance of one bacterial group over another, suggesting that an imbalance between the shares of HPB and LAB may disrupt the H2 production process [50]. Although shifts in the HPB–LAB populations were observed between the different operating conditions, the bioH2 productivity was not affected, as no significant reduction was recorded throughout the operating phases (Figure 5). Moreover, Prevotella may have played an important role in maintaining bioH2 productivity, benefiting from the increase in Fe2O3 NP dosage. This strongly suggests that the dynamics and fluctuations among HPB–LAB populations in the LD-DF process played an important role in bioH2 production and process stability under different operating conditions, especially under the selective pressure induced by Fe2O3 at 300 mg/L.

4. Conclusions

This study demonstrated the efficient production of fermentative H2 from PCW in batch and continuous systems. The supplementation of 300 mg/L Fe2O3 NPs boosted the bioH2 production via the LD-DF process, which tended to converge toward the butyrate-mediated H2 production metabolism, and also regulated the lactate concentration, which remained at low levels. The analysis of soluble metabolites, the behavior of H2 production and the bacterial community dynamics suggested a mutually beneficial interaction between HPB and LAB communities throughout the experimental process. Important switches between the relative abundances of Clostridium/Prevotella (HPB) and Lactobacillus/Lacticaseibacillus (LAB) were observed because of the selective pressure induced by the addition of 300 mg Fe2O3/L. Despite the apparently high conversion rate of lactose to lactate, an outstanding H2 production performance was achieved. In conclusion, this study highlights the promising potential of nanotechnology as a strategic tool for augmenting bioH2 productivity and process stability, especially through the LD-DF pathway.

Supplementary Materials

The following supporting information can be downloaded at https://www.mdpi.com/article/10.3390/fermentation10060296/s1. Table S1: Kinetic parameters obtained from the modified Gompertz model. Table S2: Removals of CODtotal, CODsoluble and TOC in the batch fermentation assays. Table S3: Comparison of H2 productivities among operational phases (Kruskal-Wallis test). Table S4. Comparison of H2 productivities among operational phases (matrix with p values resulting from Dunn’s post-hoc test). Table S5. Comparison of H2 productivities between operational phases III and IV (Wilcoxon t test for paired samples). Tabla S6. Comparison of H2 productivities between operational phases IV and V (Mann-Whitney U test for paired samples). Table S7. Carbohydrate and soluble COD removal efficiencies and biomass concentration (VSS) increase (%) along the different operational phases. Table S8. Comparison between the operation phases regarding effluent COD concentrations (Kruskal-Wallis test). Table S9. Comparison of effluent COD concentrations among operational phases (matrix with p values resulting from Dunn’s post-hoc test). Table S10. Comparison of effluent VSS concentrations among operational phases (Kruskal-Wallis test). Table S11. Comparison of lactate concentrations among operational phases (Kruskal-Wallis test). Table S12. Comparison of lactate concentrations among operational phases (matrix with p values resulting from Dunn’s post-hoc test).

Author Contributions

Conceptualization, O.G.-D.; methodology, D.L.-F.; validation, O.G.-D. and R.M.; formal analysis, D.L.-F. and O.G.-D.; investigation, D.L.-F., L.J.M.-M. and C.M.-F.; resources, O.G.-D. and R.M.; data curation, D.L.-F.; writing—original draft preparation, D.L.-F.; writing—review and editing, O.G.-D. and R.M.; visualization, D.L.-F.; supervision, O.G.-D. and L.J.M.-M.; project administration, O.G.-D.; funding acquisition, O.G.-D. All authors have read and agreed to the published version of the manuscript.

Funding

Grant PID2022-139110OA-I00 funded by MCIN/AEI/10.13039/501100011033 and by ERDF A way of making Europe and by the European Union. The work was also funded by the grant RYC2021-034559-I funded by MCIN/AEI/10.13039/501100011033 and by European Union NextGenerationEU/PRTR. L.J.M.-M. gratefully acknowledges his predoctoral contract through the UVa 2021 call, co-funded by Banco Santander. The regional government of Castilla y León and the European FEDER Program (CL-EI-2021-07 and UIC 315) are also acknowledged.

Institutional Review Board Statement

Not applicable.

Informed Consent Statement

Not applicable.

Data Availability Statement

The data are contained within the article or Supplementary Material. The dataset available on request from the authors.

Acknowledgments

Beatriz Estíbaliz Muñoz-González, Enrique José Marcos-Montero, and Araceli Crespo-Rodríguez are thanked for their valuable technical assistance.

Conflicts of Interest

The authors declare no conflicts of interest.

References

  1. Litti, Y.V.; Potekhina, M.A.; Zhuravleva, E.A.; Vishnyakova, A.V.; Gruzdev, D.S.; Kovalev, A.A.; Kovalev, D.A.; Katraeva, I.V.; Parshina, S.N. Dark fermentative hydrogen production from simple sugars and various wastewaters by a newly isolated Thermoanaerobacterium thermosaccharolyticum SP-H2. Int. J. Hydrogen Energy 2022, 47, 24310–24327. [Google Scholar] [CrossRef]
  2. Ahmad Sobri, M.Z.; Redhwan, A.; Ameen, F.; Lim, J.W.; Liew, C.S.; Mong, G.R.; Daud, H.; Sokkalingam, R.; Ho, C.-D.; Usman, A.; et al. A review unveiling various machine learning algorithms adopted for biohydrogen productions from microalgae. Fermentation 2023, 9, 243. [Google Scholar] [CrossRef]
  3. Cheng, D.; Ngo, H.H.; Guo, W.; Chang, S.W.; Nguyen, D.D.; Deng, L.; Chen, Z.; Ye, Y.; Bui, X.T.; Hoang, N.B. Advanced strategies for enhancing dark fermentative biohydrogen production from Biowaste towards sustainable environment. Bioresour. Technol. 2022, 351, 127045. [Google Scholar] [CrossRef] [PubMed]
  4. Wang, J.; Yin, Y. Clostridium species for fermentative hydrogen production: An overview. Int. J. Hydrogen Energy 2021, 46, 34599–34625. [Google Scholar] [CrossRef]
  5. Ribeiro, J.C.; Mota, V.T.; de Oliveira, V.M.; Zaiat, M. Hydrogen and organic acid production from dark fermentation of cheese whey without buffers under mesophilic condition. J. Environ. Manag. 2022, 304, 114253. [Google Scholar] [CrossRef] [PubMed]
  6. Chatterjee, S.; Mohan, S.V. Simultaneous production of green hydrogen and bioethanol from segregated sugarcane bagasse hydrolysate streams with circular biorefinery design. J. Chem. Eng. 2021, 425, 130386. [Google Scholar] [CrossRef]
  7. Hiloidhari, M.; Bhuyan, N.; Gogoi, N.; Seth, D.; Garg, A.; Singh, A.; Prasad, S.; Kataki, R. Agroindustry wastes: Biofuels and biomaterials feedstocks for Sustainable Rural Development. In Refining Biomass Residues for Sustainable Energy and Bioproducts; Academic Press: Cambridge, MA, USA, 2020; pp. 357–388. [Google Scholar]
  8. Pattanaik, L.; Pattnaik, F.; Saxena, D.K.; Naik, S.N. Biofuels from agricultural wastes. In Second and Third Generation of Feedstocks; Elsevier: Amsterdam, The Netherlands, 2019; pp. 103–142. [Google Scholar]
  9. Aranda-Jaramillo, B.; León-Becerril, E.; Aguilar-Juárez, O.; Castro-Muñoz, R.; García-Depraect, O. Feasibility study of biohydrogen production from acid cheese whey via lactate-driven dark fermentation. Fermentation 2023, 9, 644. [Google Scholar] [CrossRef]
  10. Lopes, A.C.A.; Eda, S.H.; Andrade, R.P.; Amorim, J.C.; Duarte, W.F. New alcoholic fermented beverages—Potentials and challenges. Fermented Beverages 2019, 5, 577–603. [Google Scholar]
  11. Prazeres, A.R.; Carvalho, F.; Rivas, J. Cheese whey management: A review. J. Environ. Manag. 2012, 110, 48–68. [Google Scholar] [CrossRef]
  12. Fernández-Gutiérrez, D.; Veillette, M.; Giroir-Fendler, A.; Ramirez, A.A.; Faucheux, N.; Heitz, M. Biovalorization of saccharides derived from industrial wastes such as whey: A review. Rev. Environ. Sci. Biotechnol. 2017, 16, 147–174. [Google Scholar] [CrossRef]
  13. García-Depraect, O.; Muñoz, R.; Rodríguez, E.; Rene, E.R.; Leon-Becerril, E. Microbial ecology of a lactate-driven dark fermentation process producing hydrogen under carbohydrate-limiting conditions. Int. J. Hydrogen Energy 2021, 46, 11284–11296. [Google Scholar] [CrossRef]
  14. Cabrol, L.; Marone, A.; Tapia-Venegas, E.; Steyer, J.P.; Ruiz-Filippi, G.; Trably, E. Microbial ecology of fermentative hydrogen producing bioprocesses: Useful insights for driving the ecosystem function. FEMS Microbiol. Rev. 2017, 41, 158–181. [Google Scholar] [CrossRef] [PubMed]
  15. Sikora, A.; Błaszczyk, M.; Jurkowski, M.; Zielenkiewicz, U. Lactic acid bacteria in hydrogen-producing consortia: On purpose or by coincidence? In Lactic Acid Bacteria—R & D for Food, Health and Livestock Purposes; InTechOpen: London, UK, 2013; pp. 488–514. [Google Scholar]
  16. García-Depraect, O.; Valdez-Vázquez, I.; Rene, E.R.; Gómez-Romero, J.; López-López, A.; León-Becerril, E. Lactate-and acetate-based biohydrogen production through dark co-fermentation of tequila vinasse and nixtamalization wastewater: Metabolic and microbial community dynamics. Bioresour. Technol. 2019, 282, 236–244. [Google Scholar] [CrossRef] [PubMed]
  17. Arimi, M.M.; Knodel, J.; Kiprop, A.; Namango, S.S.; Zhang, Y.; Geißen, S.U. Strategies for improvement of biohydrogen production from organic-rich wastewater: A review. Biomass Bioenergy 2015, 75, 101–118. [Google Scholar] [CrossRef]
  18. Ji, J.; Cai, Z.; Shen, L. Comparison analysis on biohydrogen production of mesophilic and thermophilic dark fermentation using nickel doped lanthanum-iron oxide nanoparticles as supplementation. Int. J. Hydrogen Energy 2024, 49, 90–106. [Google Scholar] [CrossRef]
  19. Yildirim, O.; Ozkaya, B. Effect of nanoparticles synthesized from green extracts on dark fermentative biohydrogen production. Biomass Bioenergy 2023, 170, 106707. [Google Scholar] [CrossRef]
  20. Sun, H.; Shen, J.; Hu, M.; Zhang, J.; Cai, Z.; Zang, L.; Zhang, F.; Ji, D. Manganese ferrite nanoparticles enhanced biohydrogen production from mesophilic and thermophilic dark fermentation. Energy Rep. 2021, 7, 6234–6245. [Google Scholar] [CrossRef]
  21. Zhang, J.; Zhao, W.; Yang, J.; Li, Z.; Zhang, J.; Zang, L. Comparison of mesophilic and thermophilic dark fermentation with nickel ferrite nanoparticles supplementation for biohydrogen production. Bioresour. Technol. 2021, 329, 124853. [Google Scholar] [CrossRef] [PubMed]
  22. Kumar, G.; Mathimani, T.; Rene, E.R.; Pugazhendhi, A. Application of nanotechnology in dark fermentation for enhanced biohydrogen production using inorganic nanoparticles. Int. J. Hydrogen Energy 2019, 44, 13106–13113. [Google Scholar] [CrossRef]
  23. Mullai, P.; Yogeswari, M.K.; Sridevi, K.J.B.T. Optimisation and enhancement of biohydrogen production using nickel nanoparticles—A novel approach. Bioresour. Technol. 2013, 141, 212–219. [Google Scholar] [CrossRef]
  24. Rafrafi, Y.; Trably, E.; Hamelin, J.; Latrille, E.; Meynial-Salles, I.; Benomar, S.; Giudici-Orticoni, M.-T.; Steyer, J.-P. Sub-dominant bacteria as Keystone Species in microbial communities producing bio-hydrogen. Int. J. Hydrogen Energy 2023, 38, 4975–4985. [Google Scholar] [CrossRef]
  25. APHA. Standard Methods for the Examination of Water and Wastewater; American Public Health Association (APHA): Washington, DC, USA, 2005; Volume 21. [Google Scholar]
  26. García-Depraect, O.; León-Becerril, E. Fermentative biohydrogen production from tequila vinasse via the lactate-acetate pathway: Operational performance, kinetic analysis and microbial ecology. Fuel 2018, 234, 151–160. [Google Scholar] [CrossRef]
  27. García-Depraect, O.; Martínez-Mendoza, L.J.; Diaz, I.; Muñoz, R. Two-stage anaerobic digestion of food waste: Enhanced bioenergy production rate by steering lactate-type fermentation during hydrolysis-acidogenesis. Bioresour. Technol. 2022, 358, 127358. [Google Scholar] [CrossRef]
  28. García-Depraect, O.; Muñoz, R.; van Lier, J.B.; Rene, E.R.; Diaz-Cruces, V.F.; León-Becerril, E. Three-stage process for tequila vinasse valorization through sequential lactate, biohydrogen and methane production. Bioresour. Technol. 2020, 307, 123160. [Google Scholar] [CrossRef]
  29. García-Depraect, O.; Mirzazada, I.; Martínez-Mendoza, L.J.; Regueira-Marcos, L.; Munoz, R. Biotic and abiotic insights into the storage of food waste and its effect on biohydrogen and methane production potential. J. Water Process Eng. 2023, 53, 103840. [Google Scholar] [CrossRef]
  30. Klindworth, A.; Pruesse, E.; Schweer, T.; Peplies, J.; Quast, C.; Horn, M.; Glöckner, F.O. Evaluation of general 16S ribosomal RNA gene PCR primers for classical and next-generation sequencing-based diversity studies. Nucleic Acids Res. 2013, 4, e1. [Google Scholar] [CrossRef] [PubMed]
  31. Callahan, B.J.; McMurdie, P.J.; Rosen, M.J.; Han, A.W.; Johnson, A.J.A.; Holmes, S.P. DADA2: High-resolution sample inference from Illumina amplicon data. Nat. Methods 2016, 13, 581–583. [Google Scholar] [CrossRef]
  32. Altschul, S.F.; Gish, W.; Miller, W.; Myers, E.W.; Lipman, D.J. Basic local alignment search tool. J. Mol. Biol. 1990, 215, 403–410. [Google Scholar] [CrossRef]
  33. Bokulich, N.A.; Kaehler, B.D.; Rideout, J.R.; Dillon, M.; Bolyen, E.; Knight, R.; Huttley, G.A.; Gregory Caporaso, J. Optimizing taxonomic classification of marker-gene amplicon sequences with QIIME 2’s Q2-feature-classifier plugin. Microbiome 2018, 6, 90. [Google Scholar] [CrossRef]
  34. Quast, C.; Pruesse, E.; Yilmaz, P.; Gerken, J.; Schweer, T.; Yarza, P.; Peplies, J.; Glöckner, F.O. The Silva ribosomal RNA gene database project: Improved Data Processing and web-based tools. Nucleic Acids Res. 2012, 41, D590–D596. [Google Scholar] [CrossRef]
  35. Weiss, S.; Xu, Z.Z.; Peddada, S.; Amir, A.; Bittinger, K.; Gonzalez, A.; Lozupone, C.; Zaneveld, J.R.; Vázquez-Baeza, Y.; Birmingham, A.; et al. Normalization and microbial differential abundance strategies depend upon data characteristics. Microbiome 2017, 5, 27. [Google Scholar] [CrossRef] [PubMed]
  36. De Gioannis, G.; Friargiu, M.; Massi, E.; Muntoni, A.; Polettini, A.; Pomi, R.; Spiga, D. Biohydrogen production from dark fermentation of cheese whey: Influence of pH. Int. J. Hydrogen Energy 2014, 39, 20930–20941. [Google Scholar] [CrossRef]
  37. Kargi, F.; Eren, N.S.; Ozmihci, S. Bio-hydrogen production from cheese whey powder (CWP) solution: Comparison of thermophilic and mesophilic dark fermentations. Int. J. Hydrogen Energy 2012, 37, 8338–8342. [Google Scholar] [CrossRef]
  38. Asunis, F.; De Gioannis, G.; Dessì, P.; Isipato, M.; Lens, P.N.L.; Muntoni, A.; Polettini, A.; Pomi, R.; Rossi, A.; Spiga, D. The dairy biorefinery: Integrating treatment processes for cheese whey valorisation. J. Environ. Manag. 2020, 276, 111240. [Google Scholar] [CrossRef] [PubMed]
  39. Tao, Y.; Hu, X.; Zhu, X.; Jin, H.; Xu, Z.; Tang, Q.; Li, X. Production of butyrate from lactate by a newly isolated Clostridium sp. BPY5. Appl. Biochem. Biotechnol. 2016, 179, 361–374. [Google Scholar] [CrossRef] [PubMed]
  40. Lovato, G.; Augusto, I.M.; Ferraz Júnior, A.D.; Albanez, R.; Ratusznei, S.M.; Etchebehere, C.; Zaiat, M.; Rodrigues, J.A. Reactor start-up strategy as key for high and stable hydrogen production from cheese whey thermophilic dark fermentation. Int. J. Hydrogen Energy 2021, 46, 27364–27379. [Google Scholar] [CrossRef]
  41. Turon, V.; Trably, E.; Fouilland, E.; Steyer, J.P. Potentialities of dark fermentation effluents as substrates for microalgae growth: A review. Process Biochem. 2016, 51, 1843–1854. [Google Scholar] [CrossRef]
  42. Barca, C.; Soric, A.; Ranava, D.; Giudici-Orticoni, M.T.; Ferrasse, J.H. Anaerobic biofilm reactors for dark fermentative hydrogen production from wastewater: A review. Bioresour. Technol. 2015, 185, 386–398. [Google Scholar] [CrossRef]
  43. Zhang, J.; Fan, C.; Zhang, H.; Wang, Z.; Zhang, J.; Song, M. Ferric oxide/carbon nanoparticles enhanced bio-hydrogen production from glucose. Int. J. Hydrogen Energy 2018, 43, 8729–8738. [Google Scholar] [CrossRef]
  44. Liu, Z.; Lv, F.; Zheng, H.; Zhang, C.; Wei, F.; Xing, X.H. Enhanced hydrogen production in a UASB reactor by retaining microbial consortium onto carbon nanotubes (CNTs). Int. J. Hydrogen Energy 2012, 37, 10619–10626. [Google Scholar] [CrossRef]
  45. Martínez-Mendoza, L.J.; Lebrero, R.; Muñoz, R.; García-Depraect, O. Influence of key operational parameters on biohydrogen production from fruit and vegetable waste via lactate-driven dark fermentation. Bioresour. Technol. 2022, 364, 128070. [Google Scholar] [CrossRef] [PubMed]
  46. Sivagurunathan, P.; Sahoo, P.C.; Kumar, M.; Gupta, R.P.; Bhattacharyya, D.; Ramakumar, S.S.V. Unrevealing the role of metal oxide nanoparticles on biohydrogen production by Lactobacillus delbrueckii. Bioresour. Technol. 2023, 367, 128260. [Google Scholar] [CrossRef] [PubMed]
  47. Li, W.; Zhang, J.; Yang, J.; Zhang, J.; Li, Z.; Yang, Y.; Zang, L. Comparison of copper and aluminum doped cobalt ferrate nanoparticles for improving biohydrogen production. Bioresour. Technol. 2022, 343, 126078. [Google Scholar] [CrossRef] [PubMed]
  48. Pérez-Rangel, M.; Barboza-Corona, J.E.; Navarro-Díaz, M.; Escalante, A.E.; Valdez-Vazquez, I. The duo Clostridium and Lactobacillus linked to hydrogen production from a lignocellulosic substrate. Water Sci. Technol. 2021, 83, 3033–3040. [Google Scholar] [CrossRef] [PubMed]
  49. García-Depraect, O.; Castro-Muñoz, R.; Muñoz, R.; Rene, E.R.; León-Becerril, E.; Valdez-Vazquez, I.; Kumar, G.; Reyes-Alvarado, L.C.; Martínez-Mendoza, L.J.; Carrillo-Reyes, J.; et al. A review on the factors influencing biohydrogen production from lactate: The key to unlocking enhanced dark fermentative processes. Bioresour. Technol. 2021, 324, 124595. [Google Scholar] [CrossRef] [PubMed]
  50. Detman, A.; Laubitz, D.; Chojnacka, A.; Wiktorowska-Sowa, E.; Piotrowski, J.; Salamon, A.; Kaźmierczak, W.; Błaszczyk, M.K.; Barberan, A.; Chen, Y.; et al. Dynamics and complexity of dark fermentation microbial communities producing hydrogen from sugar beet molasses in continuously operating packed bed reactors. Front. Microbiol. 2021, 11, 612344. [Google Scholar] [CrossRef] [PubMed]
  51. Wang, R.; Zhang, H.; Zhang, J.; Zhou, C.; Zhang, X.; Yan, X.; Yu, F.; Zhang, J. Comparison of calcium magnesium ferrite nanoparticles for boosting biohydrogen production. Bioresour. Technol. 2024, 395, 130410. [Google Scholar] [CrossRef] [PubMed]
  52. Yang, G.; Wang, J. Improving mechanisms of biohydrogen production from grass using zero-valent iron nanoparticles. Bioresour. Technol. 2018, 266, 413–420. [Google Scholar] [CrossRef] [PubMed]
  53. Sun, Y.; Ma, Y.; Zhang, B.; Sun, H.; Wang, N.; Wang, L.; Zhang, J.; Xue, R. Comparison of magnetite/reduced graphene oxide nanocomposites and magnetite nanoparticles on enhancing hydrogen production in dark fermentation. Int. J. Hydrogen Energy 2022, 47, 22359–22370. [Google Scholar] [CrossRef]
  54. Zhang, J.; Li, W.; Yang, J.; Li, Z.; Zhang, J.; Zhao, W.; Zang, L. Cobalt ferrate nanoparticles improved dark fermentation for hydrogen evolution. J. Clean. Prod. 2021, 316, 128275. [Google Scholar] [CrossRef]
  55. Zhang, J.; Zhang, H.; Zhang, J.; Zhou, C.; Pei, Y.; Zang, L. Improved biohydrogen evolution through calcium ferrite nanoparticles assisted dark fermentation. Bioresour. Technol. 2022, 361, 127676. [Google Scholar] [CrossRef] [PubMed]
Figure 1. Photograph (a) and scheme (b) of the CSTR setup. Peristaltic pumps (1 and 2), magnetic stirrer (3), pH probe (4), pH controller (5), 6 N NaOH 6 M solution (6), gas sampling port (7), water column (8), gas flow meter (9).
Fermentation 10 00296 g001
Figure 2. Time course of H2 production () and carbohydrate consumption (). The red dotted line represents the predicted trend in H2 production using the modified Gompertz model.
Fermentation 10 00296 g002
Figure 3. Time course of organic acids’ concentration (lactate, formate, acetate, propionate, and butyrate) over fermentation time.
Fermentation 10 00296 g003
Figure 4. Main metabolic pathways involved in the consumption of lactose during the dark fermentation process [38].
Fermentation 10 00296 g004
Figure 5. Time course of the volumetric hydrogen production rate () and H2 content () in the gas phase for each operation phase (I to V).
Fermentation 10 00296 g005
Figure 6. Effluent concentrations of carbohydrates, soluble COD, and VSS in each operational phase. Error bars represent standard deviation.
Fermentation 10 00296 g006
Figure 7. Time course of the concentration of organic acids (lactate, formate, acetate, propionate, and butyrate) during the different operating phases.
Fermentation 10 00296 g007
Figure 8. Relative abundances (%) of the most abundant genera (top 10) present in Phases I to V.
Fermentation 10 00296 g008
Table 1. Alpha diversity indices obtained for each operational phase (I to V).
PhaseReadsRichnessShannonSimpson
I59,951151.460.72
II61,220141.290.68
III62,705151.450.69
IV50,542141.330.68
V56,452131.560.73
Disclaimer/Publisher’s Note: The statements, opinions and data contained in all publications are solely those of the individual author(s) and contributor(s) and not of MDPI and/or the editor(s). MDPI and/or the editor(s) disclaim responsibility for any injury to people or property resulting from any ideas, methods, instructions or products referred to in the content.

