
Brewing with Sea Vegetable: The Effect of Spirulina (Arthrospira platensis) Supplementation on Brewing Fermentation Kinetics, Yeast Behavior, and the Physiochemical Properties of the Product

 , , , and
Abstract
:1. Introduction
2. Materials and Methods
2.1. Test Materials
2.2. Mashing
2.3. Yeast Rehydration, Propagation, and Pitching
2.4. Fermentation
2.5. Fermentation Measurements of Samples
2.6. Amino Acid Profile (FAN)
2.7. Yeast Morphology (Size)
2.8. Volatile and Semi-Volatile Compounds
2.8.1. Extraction of the Volatile and Semi-Volatile Compounds
2.8.2. Separation with Gas Chromatography (GC-MS)
2.8.3. Identification of Volatile Compounds
2.9. Statistical Analysis and Modeling
3. Results
3.1. Density
3.2. pH
3.3. Color
3.4. Yeast Size
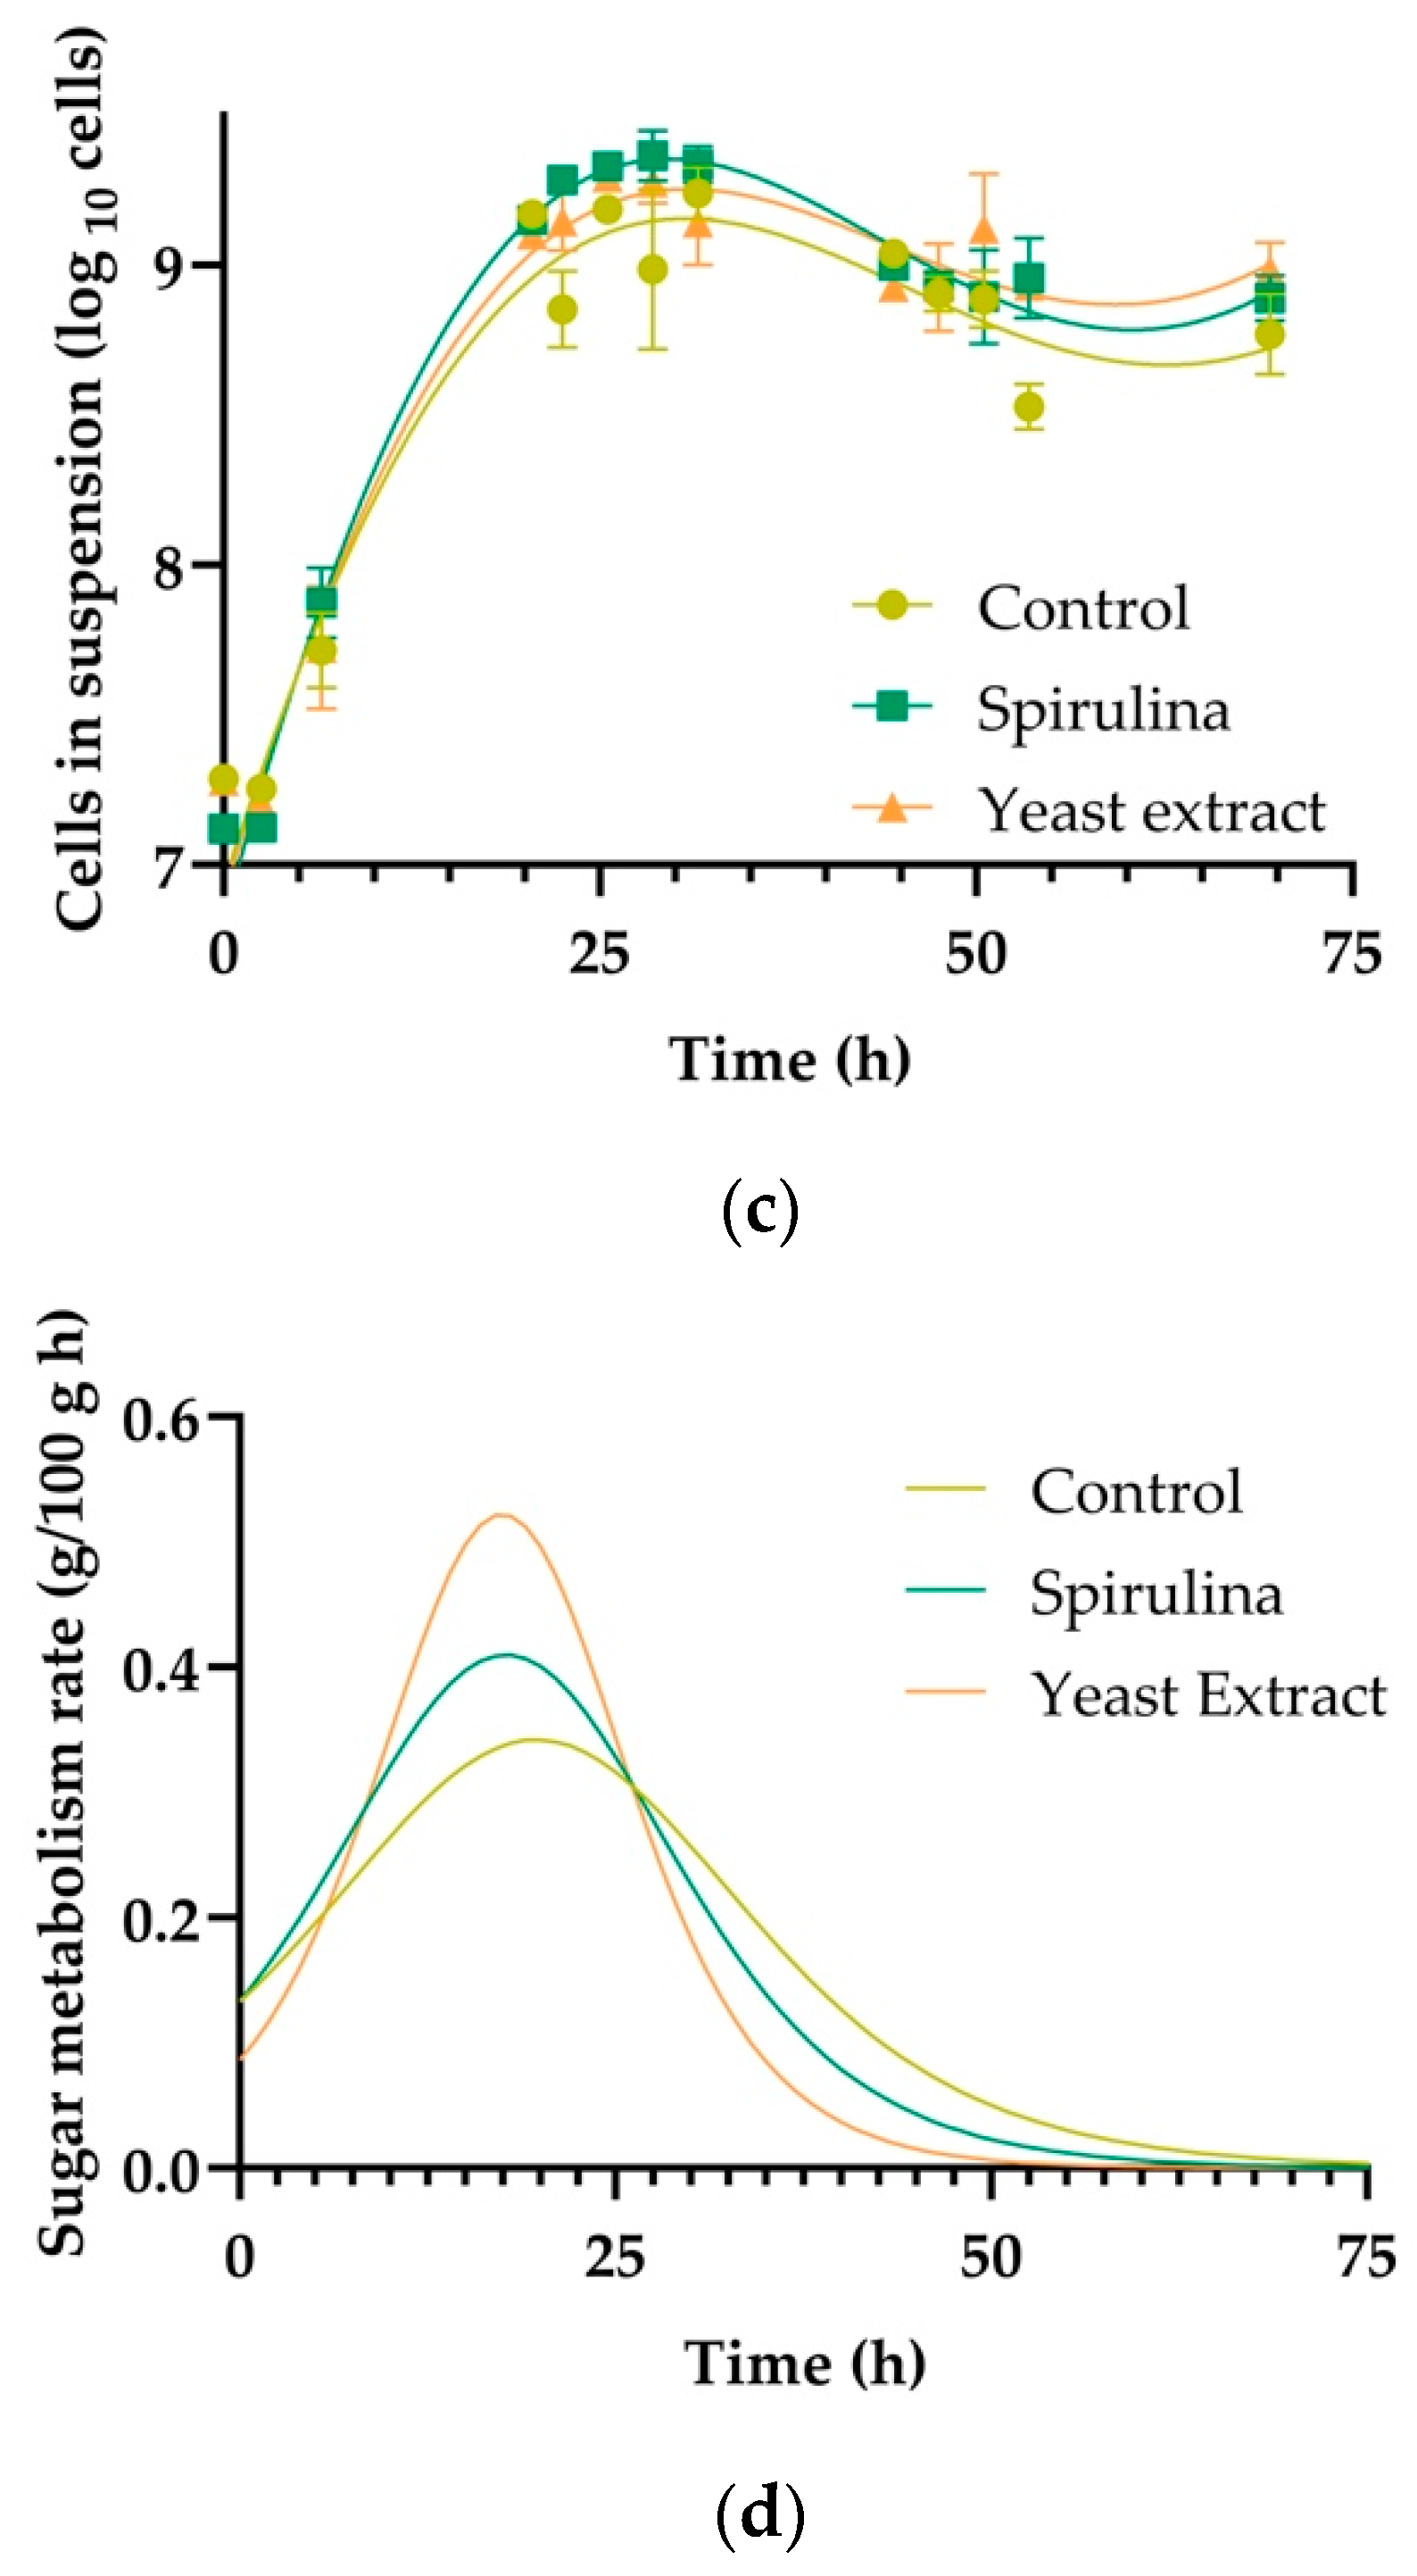
3.5. Cell Count
3.6. Amino Acid Profile and Consumption
3.7. Volatile Compounds
4. Conclusions
5. Future Work
Author Contributions
Funding
Institutional Review Board Statement
Informed Consent Statement
Data Availability Statement
Acknowledgments
Conflicts of Interest
References
- Soni, R.A.; Sudhakar, K.; Rana, R.S. Spirulina—From growth to nutritional product: A review. Trends Food Sci. Technol. 2017, 69, 157–171. [Google Scholar] [CrossRef]
- Careri, M.; Furlattini, L.; Mangia, A.; Musci, M.; Anklam, E.; Theobald, A.; von Holst, C. Supercritical fluid extraction for liquid chromatographic determination of carotenoids in Spirulina Pacifica algae: A chemometric approach. J. Chromatogr. A 2001, 912, 61–71. [Google Scholar] [CrossRef] [PubMed]
- Park, W.S.; Kim, H.J.; Li, M.; Lim, D.H.; Kim, J.; Kwak, S.S.; Kang, C.M.; Ferruzzi, M.G.; Ahn, M.J. Two Classes of Pigments, Carotenoids and C-Phycocyanin, in Spirulina Powder and Their Antioxidant Activities. Molecules 2018, 23, 2065. [Google Scholar] [CrossRef] [PubMed]
- Mathew, F.; Saral, M.A. Fucoidans: A marine antioxidant. In Marine Antioxidants: Preparations, Syntheses, and Applications; Kim, S.K., Shin, K.H., Venkatesan, J., Eds.; Academic Press: Cambridge, MA, USA, 2023; pp. 355–363. [Google Scholar]
- Santos, T.D.; Freitas, B.C.B.; de Moreira, J.B.; Zanfonato, K.; Costa, J.A.V. Development of powdered food with the addition of Spirulina for food supplementation of the elderly population. Innov. Food Sci. Emerg. Technol. 2016, 37, 216–220. [Google Scholar] [CrossRef]
- Habschied, K.; Živković, A.; Krstanović, V.; Mastanjević, K. Functional Beer—A Review on Possibilities. Beverages 2020, 6, 51. [Google Scholar] [CrossRef]
- Rodrigo, S.; Santamaria, O.; Chen, Y.; McGrath, S.P.; Poblaciones, M.J. Selenium speciation in malt, wort, and beer made from selenium-biofortified two-rowed barley grain. J. Agric. Food Chem. 2014, 62, 5948–5953. [Google Scholar] [CrossRef]
- Hill, A.E.; Stewart, G.G. Free Amino Nitrogen in Brewing. Fermentation 2019, 5, 22. [Google Scholar] [CrossRef]
- Ferreira, I.M.; Guido, L.F. Impact of Wort Amino Acids on Beer Flavour: A Review. Fermentation 2018, 4, 23. [Google Scholar] [CrossRef]
- Lekkas, C.; Stewart, G.; Hill, A.; Taidi, B.; Hodgson, J. The Importance of Free Amino Nitrogen in Wort and Beer. Tech. Q. Master Brew. Assoc. Am. 2005, 42, 113–116. [Google Scholar]
- He, Y.; Dong, J.; Yin, H.; Zhao, Y.; Chen, R.; Wan, X.; Chen, P.; Hou, X.; Liu, J.; Chen, L. Wort composition and its impact on the flavour-active higher alcohol and ester formation of beer—A review. J. Inst. Brew. 2014, 120, 157–163. [Google Scholar] [CrossRef]
- Lodolo, E.J.; Kock, J.L.F.; Axcell, B.C.; Brooks, M. The yeast Saccharomyces cerevisiae—The main character in beer brewing. FEMS Yeast Res. 2008, 8, 1018–1036. [Google Scholar] [CrossRef] [PubMed]
- Walker, G.M.; Stewart, G.G. Saccharomyces cerevisiae in the Production of Fermented Beverages. Beverages 2016, 2, 30. [Google Scholar] [CrossRef]
- Jones, M.; Pierce, J.S. Absorption of amino acids from wort by yeasts. J. Inst. Brew. 1964, 70, 307–315. [Google Scholar] [CrossRef]
- Jacob, F.F.; Michel, M.; Zarnkow, M.; Hutzler, M.; Methner, F.J. The complexity of yeast extracts and its consequences on the utility in brewing: A review. Brew. Sci. 2019, 72, 50. [Google Scholar]
- D’Amore, T.; Panchal, C.J.; Russeil, I.; Stewart, G.G. Osmotic pressure effects and intracellular accumulation of ethanol in yeast during fermentation. J. Ind. Microbiol. 1988, 2, 365–372. [Google Scholar] [CrossRef]
- O’Connor-Cox, E.S.C.; Paik, J.; Ingledew, W.M. Improved ethanol yields through supplementation with excess assimilable nitrogen. J. Ind. Microbiol. 1991, 8, 45–52. [Google Scholar] [CrossRef]
- Hashimoto, T.; Maruhashi, T.; Yamaguchi, Y.; Hida, Y.; Oka, K. The effect on fermentation by-products of the amino acids in wort. In Proceedings of the World Brewing Congress, Portland, OR, USA, 28 July–1 August 2012. [Google Scholar]
- Inoue, T.; Kashihara, T. The importance of indices related to nitrogen metabolism in fermentation control. Tech. Q. Master Brew. Assoc. Am. 1995, 32, 109–113. [Google Scholar]
- Rytka, J. Positive selection of general amino acid permease mutants in Saccharomyces cerevisiae. J. Bacteriol. 1975, 121, 562–570. [Google Scholar] [CrossRef]
- Dunlop, P.C.; Roon, R.J. L-Asparaginase of Saccharomyces cerevisiae: An extracellular Enzyme. J. Bacteriol. 1975, 12, 1017–1024. [Google Scholar] [CrossRef]
- Dunlop, P.C.; Roon, R.J.; Even, H.L. Utilization of D-asparagine by Saccharomyces cerevisiae. J. Bacteriol. 1976, 125, 999–1004. [Google Scholar] [CrossRef]
- Lei, H.; Feng, L.; Peng, F.; Xu, H. Amino Acid Supplementations Enhance the Stress Resistance and Fermentation Performance of Lager Yeast During High Gravity Fermentation. Appl. Biochem. Biotechnol. 2019, 187, 540–555. [Google Scholar] [CrossRef]
- Andreeva, A.; Budenkova, E.; Babich, O.; Sukhikh, S.; Ulrikh, E.; Ivanova, S.; Prosekov, A.; Dolganyuk, V. Production, Purification, and Study of the Amino Acid Composition of Microalgae Proteins. Molecules 2021, 26, 2767. [Google Scholar] [CrossRef]
- Marson, G.V.; de Castro, R.J.S.; Belleville, M.P.; Hubinger, M.D. Spent brewer’s yeast as a source of high added value molecules: A systematic review on its characteristics, processing and potential applications. World J. Microbiol. Biotechnol. 2020, 36, 95. [Google Scholar] [CrossRef] [PubMed]
- Tao, Z.; Yuan, H.; Liu, M.; Liu, Q.; Zhang, S.; Liu, H.; Jiang, Y.; Huang, D.; Wang, T. Yeast Extract: Characteristics, Production, Applications and Future Perspectives. J. Microbiol. Biotechnol. 2023, 33, 151–166. [Google Scholar] [CrossRef]
- Zhou, X.; Guo, T.; Lu, Y.; Hadiatullah, H.; Li, P.; Ding, K.; Zhao, G. Effects of amino acid composition of yeast extract on the microbiota and aroma quality of fermented soy sauce. Food Chem. 2022, 393, 133289. [Google Scholar] [CrossRef]
- Paraskevopoulou, A.; Kaloudis, T.; Hiskia, A.; Steinhaus, M.; Dimotikali, D.; Triantis, T.M. Volatile Profiling of Spirulina Food Supplements. Foods 2024, 13, 1257. [Google Scholar] [CrossRef] [PubMed]
- Beisler, N.; Sandmann, M. Integration of Arthrospira platensis (spirulina) into the brewing process to develop new beers with unique sensory properties. Front. Sustain. Food Syst. 2022, 6, 918772. [Google Scholar] [CrossRef]
- Moreno, S.R.; Curtis, S.J.; Sarkhosh, A.; Sarnoski, P.J.; Sims, C.A.; Dreyer, E.; Rudolph, A.B.; Thompson-Witrick, K.A.; MacIntosh, A.J. Considerations When Brewing with Fruit Juices: A Review and Case Study Using Peaches. Fermentation 2022, 8, 567. [Google Scholar] [CrossRef]
- Yang, Q.; Gong, X.; Chen, M.; Tu, J.; Zheng, X.; Yuan, Y. Comparative analysis of the aroma profile of pineapple beers brewed with juice added at different times. J. Inst. Brew. 2023, 129, 151–163. [Google Scholar] [CrossRef]
- ASBC. Yeast-14: Miniature fermentation assay. In Wort Methods; American Society of Brewing Chemists: St. Paul, MN, USA, 2011; pp. 1–3. [Google Scholar]
- ASBC. Yeast-4: Microscopic yeast cell counting. In Wort Methods; American Society of Brewing Chemists: St. Paul, MN, USA, 2004. [Google Scholar]
- MacIntosh, A.J.; Adler, J.; Eck, E.; Speers, R.A. Suitability of the Miniature Fermentability Method to Monitor Industrial Fermentations. J. Am. Soc. Brew. Chem. 2012, 70, 205–211. [Google Scholar] [CrossRef]
- ASBC. Beer-4: Alcohol (Instrumental). In Beer Methods; American Society of Brewing Chemists: St. Paul, MN, USA, 2011; pp. 1–3. [Google Scholar]
- Henderson, J.W.; Brooks, A. Improved Amino Acid Methods Using Agilent ZORBAX Eclipse Plus C18 Columns for a Variety of Agilent LC Instrumentation and Separation Goals; Agilent Technologies: Wilmington, DE, USA, 2010; pp. 1–16. [Google Scholar]
- Guadalupe-Daqui, M.; Chen, M.; Thompson-Witrick, K.A.; MacIntosh, A.J. Yeast Morphology Assessment through Automated Image Analysis during Fermentation. Fermentation 2021, 7, 44. [Google Scholar] [CrossRef]
- Luo, Y.; Wang, J.; Liu, B.; Wang, Z.; Yuan, Y.; Yue, T. Effect of yeast cell morphology, cell wall physical structure and chemical composition on patulin adsorption. PLoS ONE 2015, 10, e0136045. [Google Scholar] [CrossRef] [PubMed]
- Thompson-Witrick, K.A.; Rouseff, R.L.; Cadawallader, K.R.; Duncan, S.E.; Eigel, W.N.; Tanko, J.M.; O’Keefe, S.F. Comparison of Two Extraction Techniques, Solid-Phase Microextraction Versus Continuous Liquid–Liquid Extraction/Solvent-Assisted Flavor Evaporation, for the Analysis of Flavor Compounds in Gueuze Lambic Beer. J. Food Sci. 2015, 80, C571–C576. [Google Scholar] [CrossRef] [PubMed]
- Reid, S.J.; Josey, M.; MacIntosh, A.J.; Maskell, D.L.; Alex Speers, R. Predicting Fermentation Rates in Ale, Lager and Whisky. Fermentation 2021, 7, 13. [Google Scholar] [CrossRef]
- Armstrong, M.; MacIntosh, A.J.; Josey, M.; Speers, R.A. Examination of premature yeast flocculation in U.K. malts. Tech. Q. Master Brew. Assoc. Am. 2018, 55, 54–60. [Google Scholar]
- Guadalupe-Daqui, M.; Goodrich-Schneider, R.M.; Sarnoski, P.J.; Carriglio, J.C.; Sims, C.A.; Pearson, B.J.; MacIntosh, A.J. The effect of CO2 concentration on yeast fermentation: Rates, metabolic products, and yeast stress indicators. J. Ind. Microb. Biotechnol. 2023, 50, kuad001. [Google Scholar] [CrossRef]
- Hoche, S.; Hussein, M.A.; Becker, T. Critical process parameter of alcoholic yeast fermentation: Speed of sound and density in the temperature range 5–30 °C. Int. J. Food Sci. Technol. 2014, 49, 2441–2448. [Google Scholar] [CrossRef]
- Pires, E.J.; Teixeira, J.A.; Brányik, T.; Vicente, A.A. Yeast: The soul of beer’s aroma—A review of flavour-active esters and higher alcohols produced by the brewing yeast. Appl. Microbiol. Biotechnol. 2014, 98, 1937–1949. [Google Scholar] [CrossRef] [PubMed]
- Kucharczyk, K.; Tuszyński, T. The effect of temperature on fermentation and beer volatiles at an industrial scale. J. Inst. Brew. 2018, 124, 230–235. [Google Scholar] [CrossRef]
- Beheshtipour, H.; Mortazavian, A.M.; Haratian, P.; Khosravi-Darani, K. Effects of Chlorella vulgaris and Arthrospira platensis addition on viability of probiotic bacteria in yogurt and its biochemical properties. Eur. Food Res. Technol. 2012, 235, 719–728. [Google Scholar] [CrossRef]
- Salanță, L.C.; Coldea, T.E.; Ignat, M.V.; Pop, C.R.; Tofană, M.; Mudura, E.; Borșa, A.; Pasqualone, A.; Zhao, H. Non-Alcoholic and Craft Beer Production and Challenges. Processes 2020, 8, 1382. [Google Scholar] [CrossRef]
- Barkallah, M.; Dammak, M.; Louati, I.; Hentati, F.; Hadrich, B.; Mechichi, T.; Ayadi, M.A.; Fendri, I.; Attia, H.; Abdelkafi, S. Effect of Spirulina platensis fortification on physicochemical, textural, antioxidant and sensory properties of yogurt during fermentation and storage. LWT 2017, 84, 323–330. [Google Scholar] [CrossRef]
- Batista, A.P.; Niccolai, A.; Fradinho, P.; Fragoso, S.; Bursic, I.; Rodolfi, L.; Biondi, N.; Tredici, M.R.; Sousa, I.; Raymundo, A. Microalgae biomass as an alternative ingredient in cookies: Sensory, physical and chemical properties, antioxidant activity and in vitro digestibility. Algal Res. 2017, 26, 161–171. [Google Scholar] [CrossRef]
- de Marco Castro, E.; Shannon, E.; Abu-Ghannam, N. Effect of Fermentation on Enhancing the Nutraceutical Properties of Arthrospira platensis (Spirulina). Fermentation 2019, 5, 28. [Google Scholar] [CrossRef]
- Tolpeznikaite, E.; Bartkevics, V.; Skrastina, A.; Pavlenko, R.; Mockus, E.; Zokaityte, E.; Starkute, V.; Klupsaite, D.; Ruibys, R.; Rocha, J.M.; et al. Changes in Spirulina’s Physical and Chemical Properties during Submerged and Solid-State Lacto-Fermentation. Toxins 2023, 15, 75. [Google Scholar] [CrossRef] [PubMed]
- Gunasekaran, Y.K.; Lele, V.; Sakiene, V.; Zavistanaviciute, P.; Zokaityte, E.; Klupsaite, D.; Bartkevics, V.; Guiné, R.P.F.; Bartkiene, E. Plant-based proteinaceous snacks: Effect of fermentation and ultrasonication on end-product characteristics. Food Sci. Nutr. 2020, 8, 4746–4756. [Google Scholar] [CrossRef] [PubMed]
- Chaiklahan, R.; Chirasuwan, N.; Bunnag, B. Stability of phycocyanin extracted from Spirulina sp.: Influence of temperature, pH and preservatives. Process Biochem. 2012, 47, 659–664. [Google Scholar] [CrossRef]
- İlter, I.; Akyıl, S.; Demirel, Z.; Koç, M.; Conk-Dalay, M.; Kaymak-Ertekin, F. Optimization of phycocyanin extraction from Spirulina platensis using different techniques. J. Food Compos. Anal. 2018, 70, 78–88. [Google Scholar] [CrossRef]
- Gobbi, M.; Comitini, F.; Domizio, P.; Romani, C.; Lencioni, L.; Mannazzu, I.; Ciani, M. Lachancea thermotolerans and Saccharomyces cerevisiae in simultaneous and sequential co-fermentation: A strategy to enhance acidity and improve the overall quality of wine. Food Microbiol. 2013, 33, 271–281. [Google Scholar] [CrossRef]
- Henschke, P.A.; Jiranek, V. Yeasts-metabolism of nitrogen compounds. In Wine Microbiology and Biotechnology; Fleet, G.H., Ed.; Taylor & Francis: London, UK, 2002; pp. 77–164. [Google Scholar]
- Takagi, H. Proline as a stress protectant in yeast: Physiological functions, metabolic regulations, and biotechnological applications. Appl. Microbiol. Biotechnol. 2008, 81, 211–223. [Google Scholar] [CrossRef]
- Coral-Medina, A.; Morrissey, J.P.; Camarasa, C. The growth and metabolome of Saccharomyces uvarum in wine fermentations are strongly influenced by the route of nitrogen assimilation. J. Ind. Microbiol. Biotechnol. 2022, 49, kuac025. [Google Scholar]
- Viegas, C.A.; Rosa, M.F.; Sá-Correia, I.; Novais, J.M. Inhibition of Yeast Growth by Octanoic and Decanoic Acids Produced during Ethanolic Fermentation. Appl. Environ. Microbiol. 1989, 55, 21–28. [Google Scholar] [PubMed]
- Dragone, G.; Mussatto, S.I.; Almeida e Silva, J.B. Influence of temperature on continuous high gravity brewing with yeasts immobilized on spent grains. Eur. Food Res. Technol. 2008, 228, 257–264. [Google Scholar] [CrossRef]


| Concentration in Spirulina (mg/100 g Protein) [24] | Concentration in Yeast Extract (mg/100 g Protein) [25,26,27] | |
|---|---|---|
| Group A (fast absorption) | ||
| Glutamic acid | 10,280 ± 300 | 500–17,500 |
| Aspartic acid | 8540 ± 250 | 1370–11,600 |
| Asparagine | 430–750 | |
| Glutamine | 1237–2694 | |
| Serine | 4340 ± 130 | 1360–6100 |
| Threonine | 5460 ± 160 | 200–6200 |
| Lysine | 5350 ± 160 | 1660–9000 |
| Arginine | 7330 ± 210 | 1680–12,400 |
| Group B (Intermediate absorption) | ||
| Valine | 6890 ± 200 | 600–9100 |
| Methionine | 2520 ± 70 | 500–2500 |
| Leucine | 8410 ± 250 | 3030–9000 |
| Isoleucine | 3360 ± 100 | 1750–5600 |
| Histidine | 1520 ± 40 | 500–7300 |
| Group C (Slow absorption) | ||
| Glycine | 7140 ± 210 | 930–4900 |
| Phenylalanine | 6179 ± 180 | 2640–5300 |
| Tyrosine | 4340 ± 130 | 400–5300 |
| Tryptophan | 210 ± 10 | 70–140 |
| Alanine | 11,480 ± 320 | 3700–26,600 |
| Group D (minimum or no absorption) | ||
| Proline | 5080 ± 150 | 1850–4500 |
| Not categorized | ||
| Cysteine | 1470 ± 40 | 0–700 |
| WORT (SRM) | BEER (SRM) | ||||
|---|---|---|---|---|---|
| Control | Spirulina | Yeast Extract | Control | Spirulina | Yeast Extract |
| 6.39 ± 0.19 c | 10.46 ± 0.09 b | 17.07 ± 0.09 a | 3.6 ± 0.11 C | 7.07 ± 0.13 B | 8.46 ± 0.13 A |
 |  | ||||
| Control | Yeast Extract | Spirulina | |
|---|---|---|---|
 |  | 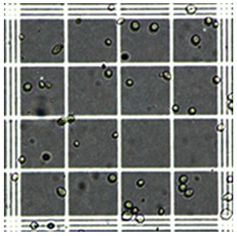 | |
| Area (µm2) | 294.4 ± 92.1 b | 385.6 ± 111.8 a | 390.5 ± 156.2 a |
| Initial Amino Acid Concentration (mg/L) | Amino Acid Consumption (%) | |||||
|---|---|---|---|---|---|---|
| Control | Yeast Extract | Spirulina | Control | Yeast Extract | Spirulina | |
| Group A (Fast absorption) | 351.86 ± 2.16 c | 451.84 ± 2.01 b | 736.8 ± 18.10 a | 91.6 | 68.1 | 90.6 |
| Group B (Intermediate absorption) | 156.13 ± 1.54 c | 191.17 ± 0.93 a | 183.53 ± 0.38 b | 90.8 | 79.4 | 90.3 |
| Group C (Slow absorption) | 263.8 ± 7.62 c | 386.17 ± 1.43 a | 357.81 ± 5.44 b | 97.8 | 74.1 | 93.3 |
| Group D (Minimum or no absorption) | 95.11 ± 4.17 a | 114.4 ± 5.32 a | 97.69 ± 5.09 a | −9.5 | 12.2 | −1.6 |
| Total Amino Acids | 866.9 ± 8.08 c | 1143.58 ± 9.69 b | 1375.9 ± 29 a | 82.2 | 66.5 | 84.7 |
| Approximate Concentrations (mg/L) | |||||||
|---|---|---|---|---|---|---|---|
| WORT | BEER | ||||||
| Compound | LRI | Control | Yeast Extract | Spirulina | Control | Yeast Extract | Spirulina |
| Acids | |||||||
| 3-Methylbutanoic acid | 935 | 0.04 ± 0.01 | 0.08 ± 0.01 | 0.05 ± 0.02 | 0.05 ± 0.01 | 0.09 ± 0.03 | 0.09 ± 0.03 |
| 2-Methylbutanoic acid | 944 | nd | 0.02 ± 0.01 | 0.04 ± 0.01 | 0.02 ± 0.00 | 0.05 ± 0.00 | 0.05 ± 0.00 |
| Hexanoic acid | 964 | nd | nd | nd | 0.93 ± 0.17 | 0.98 ± 0.17 | 1.70 ± 0.33 |
| Heptanoic acid | 1088 | 0.10 ± 0.05 | 0.03 ± 0.01 | 0.07 ± 0.02 | 0.11 ± 0.04 | 0.09 ± 0.00 | 0.09 ± 0.01 |
| 2-Ethyl hexanoic acid | 1126 | 0.05 ± 0.02 | 0.09 ± 0.01 | nd | nd | nd | nd |
| Octanoic acid | 1176 | 1.03 ± 0.49 | 0.54 ± 0.18 | 0.54 ± 0.39 | 16.52 ± 2.47 | 10.87 ± 2.86 | 22.33 ± 3.69 |
| Nonanoic acid | 1280 | 1.00 ± 0.27 | 0.27 ± 0.04 | 0.35 ± 0.20 | 1.16 ± 0.25 | 0.99 ± 0.29 | 1.23 ± 0.28 |
| Decanoic acid | 1259 | 0.17 ± 0.02 | 0.07 ± 0.03 | 0.14 ± 0.05 | 1.44 ± 1.05 | 0.73 ± 0.24 | 1.46 ± 1.40 |
| Subtotal | - | 2.39 ± 0.7 a | 1.1 ± 0.29 a | 1.19 ± 0.69 a | 20.23 ± 3.99 A,B | 13.8 ± 3.59 B | 26.95 ± 5.74 A |
| Aldehydes | |||||||
| Benzeneacetaldehyde | 1050 | nd | nd | nd | 0.06 ± 0.00 | 0.08 ± 0.01 | 0.08 ± 0.01 |
| Nonanal | 1103 | nd | 0.03 ± 0.01 | nd | nd | nd | 0.14 ± 0.06 |
| Decanal | 1207 | 0.05 ± 0.02 | 0.02 ± 0.01 | 0.02 ± 0.02 | nd | 0.90 ± 0.06 | 0.59 ± 0.03 |
| 2,4-Dimethylbenzaldehyde | 1217 | 0.06 ± 0.01 | 0.04 ± 0.01 | 0.04 ± 0.04 | nd | 4.50 ± 0.37 | nd |
| Subtotal | - | 0.11 ± 0.03 a | 0.09 ± 0.03 a | 0.06 ± 0.06 a | 0.06 ± 0.00 B | 5.48 ± 0.44 A | 0.81 ± 0.10 B |
| Alcohols | |||||||
| 3-Methylbutanol (Isoamyl alcohol) | 773 | 0.90 ± 0.04 | 0.88 ± 0.33 | 1.92 ± 0.44 | 22.55 ± 1.03 | 17.51 ± 2.11 | 22.93 ± 1.67 |
| 2-Ethylhexanol | 1040 | 0.39 ± 0.07 | 0.26 ± 0.10 | 0.31 ± 0.09 | 0.08 ± 0.00 | 0.09 ± 0.02 | nd |
| 1-Octanol | 1074 | 0.38 ± 0.07 | 0.18 ± 0.02 | 0.21 ± 0.01 | 0.21 ± 0.02 | 0.21 ± 0.01 | 0.27 ± 0.02 |
| 2-Nonanol | 1100 | 0.13 ± 0.01 | 0.07 ± 0.03 | 0.13 ± 0.02 | 0.16 ± 0.00 | 0.14 ± 0.04 | 0.14 ± 0.06 |
| Phenylethyl alcohol | 1112 | 0.25 ± 0.05 | 0.03 ± 0.01 | 0.42 ± 0.16 | 22.59 ± 1.44 | 20.07 ± 2.94 | 23.05 ± 0.75 |
| 1-Nonanol | 1172 | 0.23 ± 0.05 | 0.12 ± 0.01 | 0.13 ± 0.02 | 0.18 ± 0.01 | 0.14 ± 0.04 | 0.17 ± 0.06 |
| 2-Decanol | 1203 | 0.04 ± 0.00 | 0.03 ± 0.01 | 0.03 ± 0.01 | nd | 0.67 ± 0.12 | nd |
| 2-Hexyldecanol | 1296 | 0.01 ± 0.01 | 0.01 ± 0.01 | nd | 0.03 ± 0.01 | 0.03 ± 0.01 | nd |
| Dodecanol | 1469 | 0.02 ± 0.00 | nd | nd | 0.05 ± 0.01 | 0.07 ± 0.02 | 0.06 ± 0.02 |
| Subtotal | - | 2.35 ± 0.3 b | 1.58 ± 0.52 b | 3.15 ± 0.75 a | 45.85 ± 2.52 A,B | 38.93 ± 5.31 B | 46.62 ± 2.58 A |
| Benzene | |||||||
| m-Di-tert-butylbenzene | 1217 | 0.02 ± 0.00 a | 0.02 ± 0.00 a | 0.04 ± 0.04 b | 0.08 ± 0.03 A | 0.07 ± 0.04 A | 0.09 ± 0.05 A |
| Diols | |||||||
| 2,3-Butandiol | 814 | 0.65 ± 0.20 a | 0.01 ± 0.01 A | 0.08 ± 0.10 A | |||
| Esters | |||||||
| Isoamyl acetate (3-methylbutanoate) | 883 | 5.42 ± 1.93 | 6.45 ± 0.32 | 6.32 ± 1.45 | |||
| Ethyl hexanoate | 1002 | 0.13 ± 0.09 | 0.52 ± 0.28 | 0.65 ± 0.17 | 0.66 ± 0.19 | ||
| Ethyl heptanoate | 1095 | 0.04 ± 0.01 | 0.04 ± 0.01 | ||||
| Ethyl octanoate | 1197 | 0.13 ± 0.07 | 0.31 ± 0.16 | 0.40 ± 0.25 | 2.63 ± 1.14 | 3.39 ± 0.38 | 3.62 ± 0.69 |
| Phenethyl acetate | 1249 | 0.01 ± 0.01 | 9.76 ± 0.74 | 7.60 ± 0.71 | 11.56 ± 0.68 | ||
| Ethyl nonanaote | 1284 | 0.06 ± 0.02 | 0.06 ± 0.02 | 0.06 ± 0.02 | 0.10 ± 0.03 | 0.10 ± 0.02 | |
| 3-Hydroxy-2,2,4-trimethylpentyl isobutyrate | 1351 | 0.27 ± 0.24 | 0.40 ± 0.20 | 0.20 ± 0.11 | 1.41 ± 0.08 | 1.34 ± 0.22 | 1.48 ± 0.21 |
| Ethyl 9-decanoate | 1375 | 0.43 ± 0.07 | 1.55 ± 0.92 | 0.49 ± 0.1 | |||
| Ethyl decanoate | 1382 | 0.03 ± 0.01 | 0.09 ± 0.03 | 0.04 ± 0.03 | 0.37 ± 0.09 | 0.56 ± 0.03 | 0.52 ± 0.08 |
| Subtotal | - | 0.49 ± 0.34 a | 0.8 ± 0.39 a | 0.84 ± 0.51 a | 20.64 ± 4.36 A | 21.64 ± 2.78 A | 24.79 ± 3.43 A |
| Ketones | |||||||
| γ-Nonalactone | 1340 | 0.04 ± 0.01 | 0.01 ± 0.01 | 0.02 ± 0.01 | 0.15 ± 0.02 | 0.12 ± 0.03 | 0.17 ± 0.03 |
| Nerylacetone | 1445 | 0.07 ± 0.01 | 0.17 ± 0.03 | 0.15 ± 0.03 | |||
| Subtotal | - | 0.04 ± 0.01 a | 0.01 ± 0.01 b | 0.02 ± 0.01 a,b | 0.22 ± 0.03 A | 0.29 ± 0.06 A | 0.32 ± 0.06 A |
| Phenols | |||||||
| 4-Vinylguaiacol (4-VG) | 1299 | 0.08 ± 0.04 | 0.03 ± 0.04 | 0.02 ± 0.02 | 0.02 ± 0.00 | 0.02 ± 0.00 | |
| 2,4-Di-tert-butylphenol | 1505 | 0.13 ± 0.02 | 0.03 ± 0.06 | 0.10 ± 0.03 | 0.17 ± 0.02 | 0.16 ± 0.04 | 0.15 ± 0.04 |
| Subtotal | - | 0.21 ± 0.06 a | 0.06 ± 0.0510 b | 0.12 ± 0.05 a,b | 0.19 ± 0.02 A | 0.18 ± 0.04 A | 0.15 ± 0.04 A |
| Overall Total | - | 6.26 ± 1.8 a | 3.6 ± 1.24 b | 5.42 ± 2.11 a,b | 87.28 ± 10.96 A,B | 80.47 ± 12.36 B | 99.73 ± 12.00 A |
Disclaimer/Publisher’s Note: The statements, opinions and data contained in all publications are solely those of the individual author(s) and contributor(s) and not of MDPI and/or the editor(s). MDPI and/or the editor(s) disclaim responsibility for any injury to people or property resulting from any ideas, methods, instructions or products referred to in the content. |
© 2024 by the authors. Licensee MDPI, Basel, Switzerland. This article is an open access article distributed under the terms and conditions of the Creative Commons Attribution (CC BY) license (https://creativecommons.org/licenses/by/4.0/).
Share and Cite
Pérez-Alva, A.; Guadalupe-Daqui, M.; Cárdenas-Pinto, S.; Moreno, S.R.; Thompson-Witrick, K.A.; Ramírez-Rodrigues, M.A.; Ramírez-Rodrigues, M.M.; MacIntosh, A.J. Brewing with Sea Vegetable: The Effect of Spirulina (Arthrospira platensis) Supplementation on Brewing Fermentation Kinetics, Yeast Behavior, and the Physiochemical Properties of the Product. Fermentation 2024, 10, 415. https://doi.org/10.3390/fermentation10080415
Pérez-Alva A, Guadalupe-Daqui M, Cárdenas-Pinto S, Moreno SR, Thompson-Witrick KA, Ramírez-Rodrigues MA, Ramírez-Rodrigues MM, MacIntosh AJ. Brewing with Sea Vegetable: The Effect of Spirulina (Arthrospira platensis) Supplementation on Brewing Fermentation Kinetics, Yeast Behavior, and the Physiochemical Properties of the Product. Fermentation. 2024; 10(8):415. https://doi.org/10.3390/fermentation10080415
Chicago/Turabian StylePérez-Alva, Alexa, Mario Guadalupe-Daqui, Santiago Cárdenas-Pinto, Skylar R. Moreno, Katherine A. Thompson-Witrick, Melissa A. Ramírez-Rodrigues, Milena M. Ramírez-Rodrigues, and Andrew J. MacIntosh. 2024. "Brewing with Sea Vegetable: The Effect of Spirulina (Arthrospira platensis) Supplementation on Brewing Fermentation Kinetics, Yeast Behavior, and the Physiochemical Properties of the Product" Fermentation 10, no. 8: 415. https://doi.org/10.3390/fermentation10080415
APA StylePérez-Alva, A., Guadalupe-Daqui, M., Cárdenas-Pinto, S., Moreno, S. R., Thompson-Witrick, K. A., Ramírez-Rodrigues, M. A., Ramírez-Rodrigues, M. M., & MacIntosh, A. J. (2024). Brewing with Sea Vegetable: The Effect of Spirulina (Arthrospira platensis) Supplementation on Brewing Fermentation Kinetics, Yeast Behavior, and the Physiochemical Properties of the Product. Fermentation, 10(8), 415. https://doi.org/10.3390/fermentation10080415